1. Introduction
Recently, direct current (DC) grids have gained increasing attention due to the growing integration of renewable energy sources (RESs), rising DC load demands, and advancements in voltage–source converters (VSCs). Medium-voltage direct current (MVDC) distribution networks have emerged as a promising solution for efficient integration [
1]. Compared to alternating current (AC) distribution networks, MVDC distribution networks provide greater power transfer capability by eliminating frequency-dependent phenomena such as reactive power flow and the skin effect [
2]. In addition, the use of VSCs enables improved controllability and flexibility in the management of the power system. As RESs and DC loads continue to increase, the MVDC distribution networks are expected to expand; however, this expansion introduces new challenges in the protection of MVDC distribution networks [
3].
The protection strategies for AC distribution networks are well-established and widely implemented; however, protection strategies for MVDC distribution networks remain limited due to technical constraints and the absence of standardization. Due to the low line impedance and the absence of zero-crossing, the DC fault currents rise rapidly and reach high magnitudes. Due to these characteristics, fast, sensitive, selective, and dependable protection strategies are required [
4,
5].
Several studies have investigated the adaptation of protection strategies designed for high voltage direct current (HVDC) systems to MVDC distribution networks. These strategies include traveling wave-based, derivative-based, differential-based, undervoltage- and overcurrent-based, impedance-based, and artificial intelligence-based protection schemes [
6,
7,
8,
9,
10,
11]. For instance, traveling wave-based protection schemes have been successfully applied in HVDC systems for fault detection and location. However, their applicability is limited in MVDC distribution networks due to the relatively short length of distribution lines [
12]. Among derivative-based protection schemes, the rate of change in current (ROCOC)-based schemes shows limitations in detection performance due to its low sensitivity to high-impedance faults. Additionally, the rate of change in voltage (ROCOV)-based scheme has the problem of high possibility of maloperation due to lack of selectivity under various fault conditions [
13,
14]. And since these studies did not consider network reconfiguration, they have limitations in practical application.
This paper proposes a protection strategy for MVDC distribution networks considering network reconfigurations. The protection strategy consists of a fault detection scheme and a fault identification scheme. The fault detection scheme adopted the ROCOC × ROCOV-based protection scheme. The ROCOC × ROCOV-based protection scheme enables fast and sensitive fault detection by simultaneously capturing the transient characteristics of both voltage and current. The sign of ROCOC × ROCOV provides selectivity between internal and external faults in the radial MVDC distribution network. Communication between protective relays with the same protection zone is incorporated to ensure selectivity in multi-terminal MVDC distribution networks under network reconfiguration. The fault identification scheme remains blocked until fault detection is verified through communication between relays responding to the ROCOC × ROCOV-based protection scheme. The scheme for determining the fault type adopts a ratio of the magnitude for the positive and negative pole voltage (|Vp/Vn|)-based protection scheme. The scheme determines the fault type using the voltage characteristics of the healthy line. The thresholds of ROCOC and ROCOV were determined based on a predefined time window and physical quantities reflecting the operating conditions of the distribution network. The ROCOC × ROCOV threshold was set as the product of the individual thresholds, without large-scale simulations. The protection strategy based on the operating sequence of the digital relay was implemented in PSCAD/EMTDC. A 37.4 kV MVDC distribution network connected to the 22.9 kV AC distribution network in Korea was modeled to evaluate the protection strategy.
The protection strategy was evaluated for different fault locations, fault resistances, and fault types in both radial and multi-terminal MVDC distribution networks. In the radial MVDC distribution network, the proposed strategy achieved a minimum fault detection time of 202 us. The sign of ROCOC × ROCOV provided selectivity and successfully determined the fault locations. In radial topology without relays sharing the same protection zone, fault types were determined without verification through communication. In the multi-terminal MVDC distribution network, the proposed strategy achieved a fault detection time of 202 us. In this topology, external faults can present characteristics of transient voltages and currents similar to internal faults. To ensure selectivity, protective relays in the same protection zone communicated their response to the ROCOC × ROCOV-based protection scheme for internal faults. The fault type was determined after mutual verification. These results suggest that the proposed strategy can contribute to the stable operation of MVDC distribution networks under various operating and fault conditions.
In summary, the advantages of the proposed protection strategy are as follows:
Fault detection scheme that compensates for the limitations of ROCOC- and ROCOV-based protection schemes.
Threshold setting based on quantified values without large-scale simulation.
Enhanced selectivity through communication between protective relays sharing the same protection zone in multi-terminal MVDC distribution networks under network reconfiguration.
2. Modeling of an MVDC Distribution Network
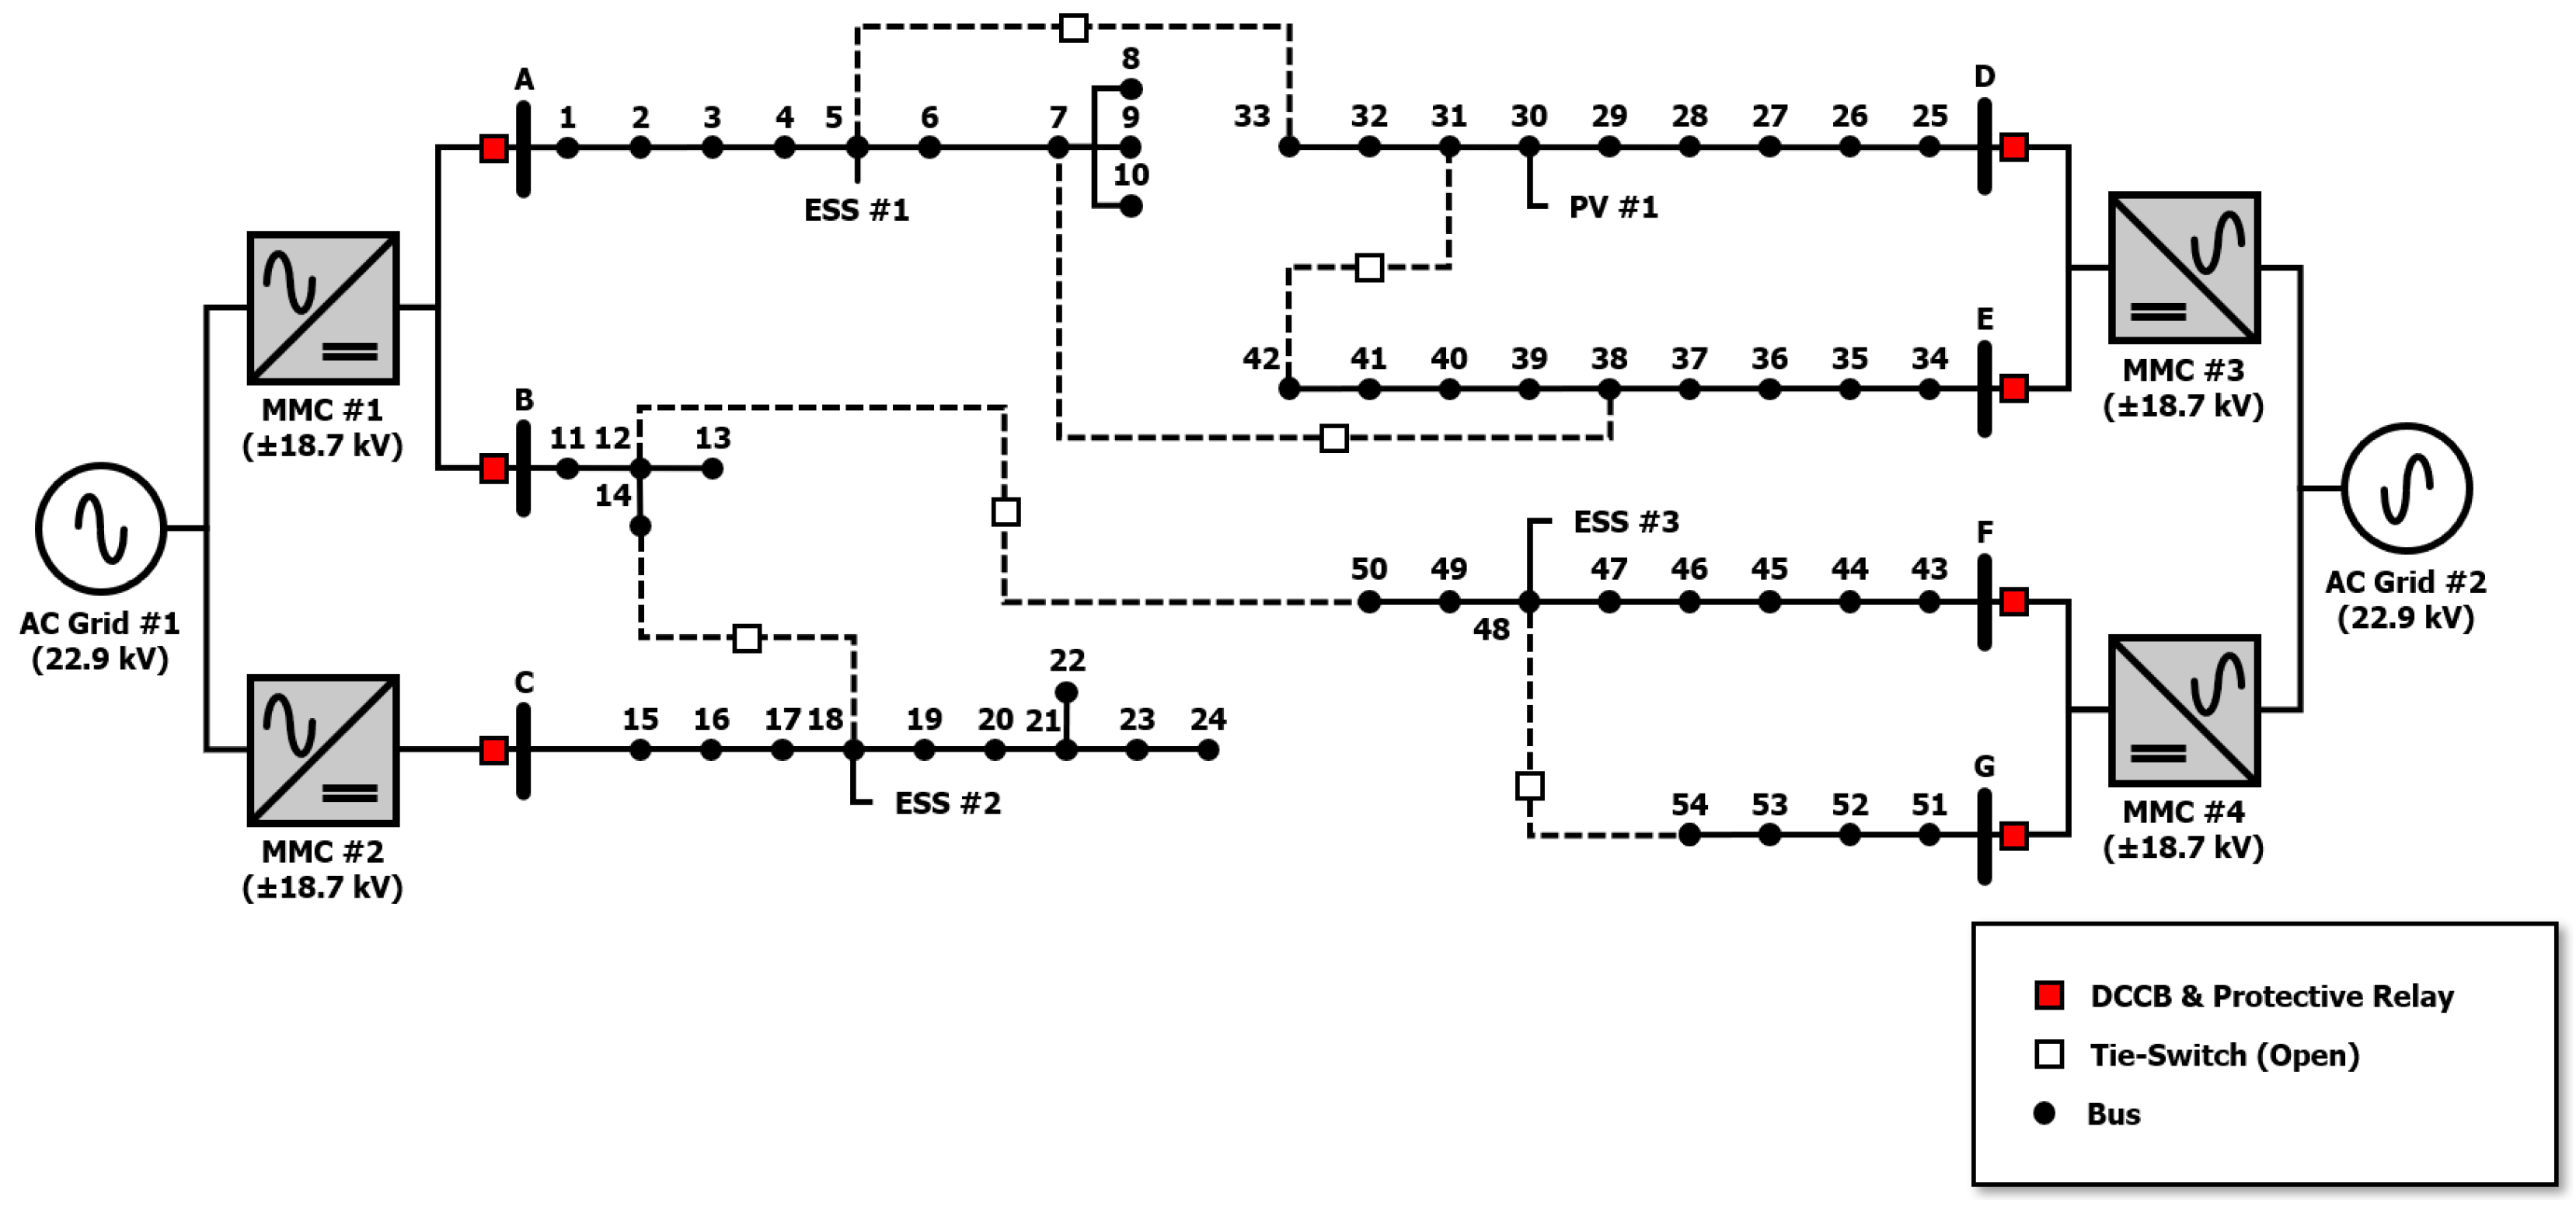
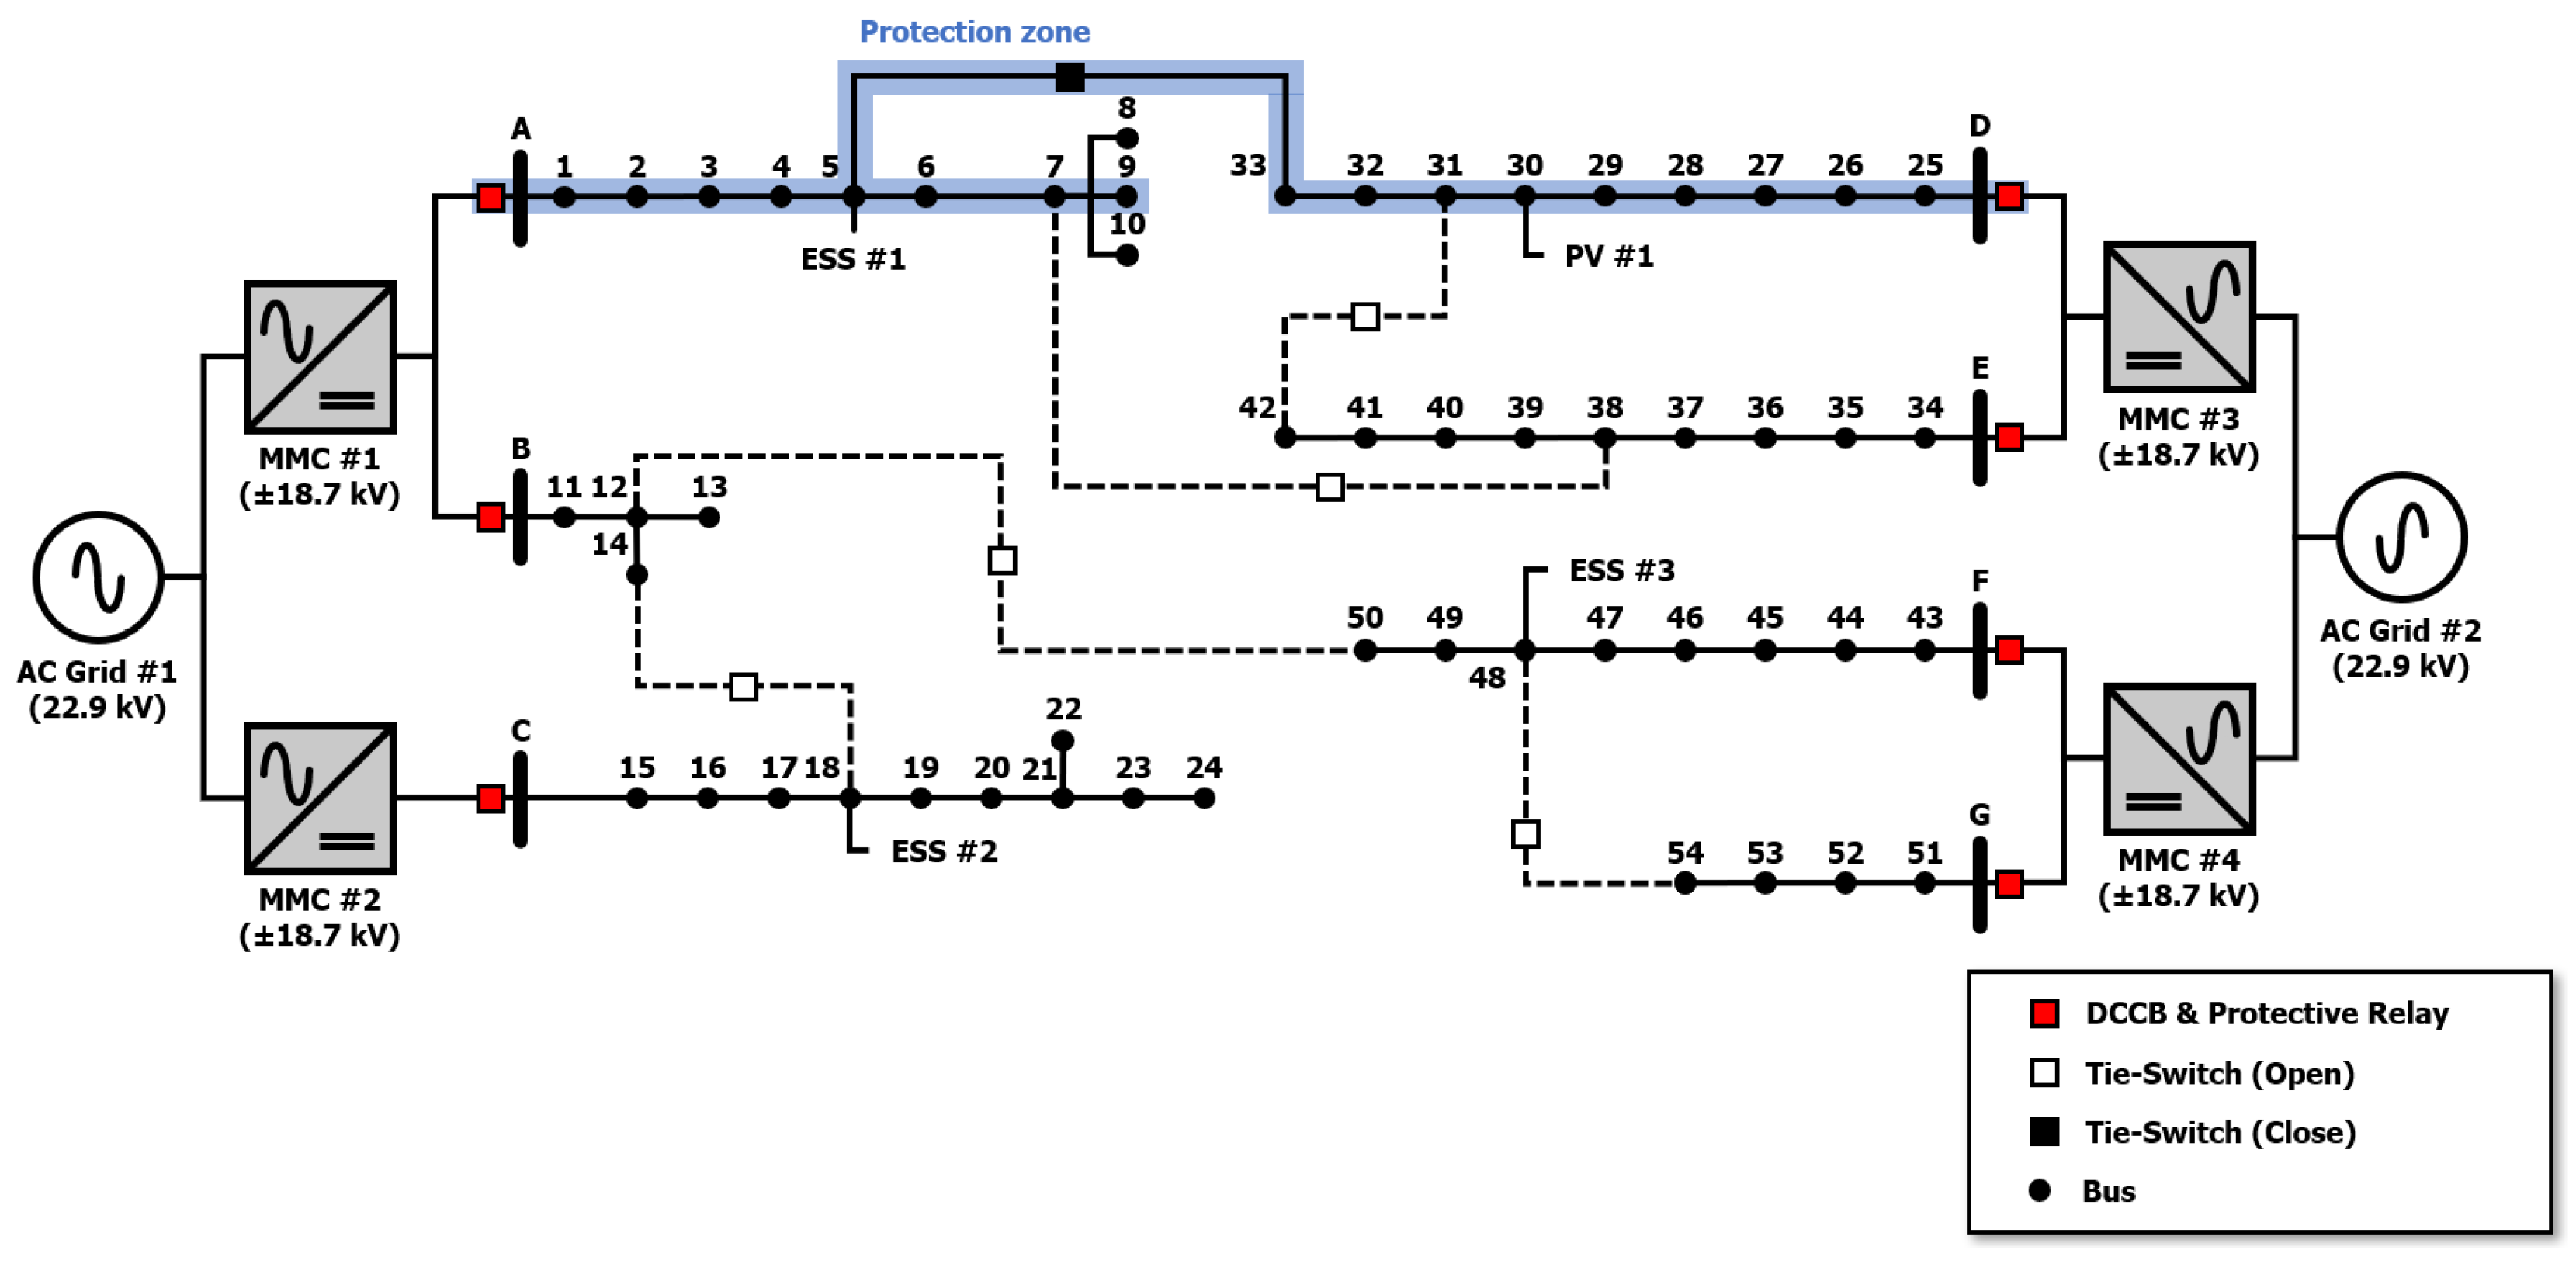
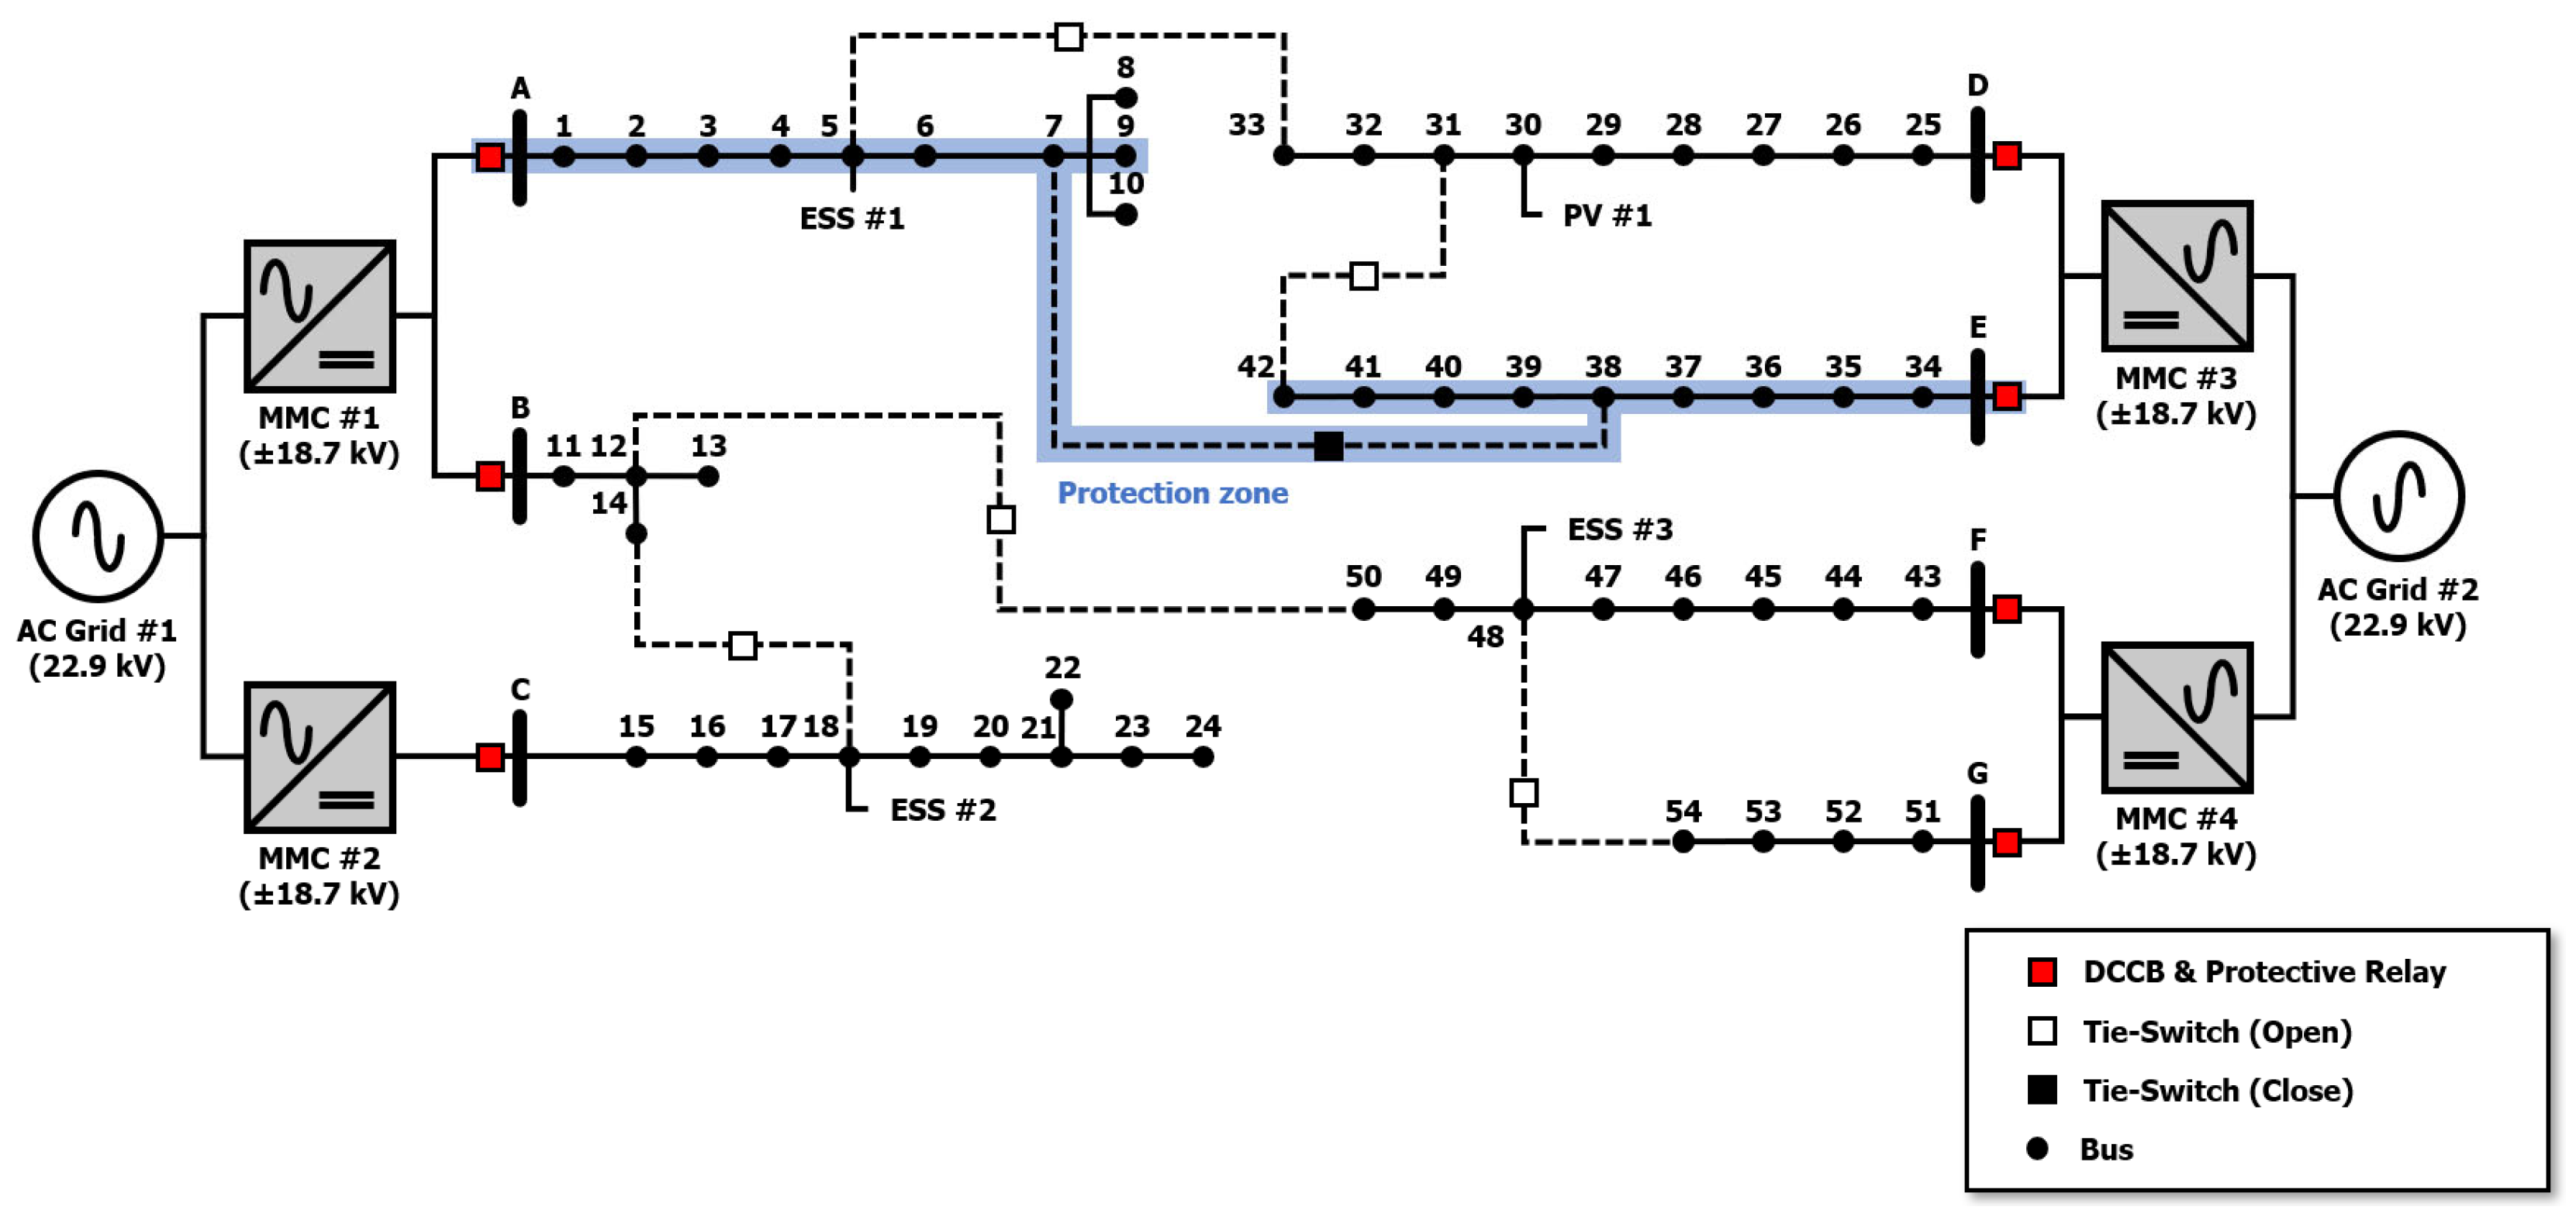
The MVDC distribution network was modeled based on an actual configuration under preliminary development in Korea, as shown in
Figure 1. The voltage level of the MVDC distribution network was set to 37.4 kV using Equation (1), considering the integration with the 22.9 kV AC distribution network in Korea.
Half-bridge modular multilevel converters (HB-MMCs) with droop control integrate the AC and MVDC distribution networks. The MVDC distribution network consists of a PV power plant, ESSs, and DC loads.
The tie switch plays a crucial role in enhancing the reliability and flexibility of the distribution network by enabling load transfer, isolating fault sections, and facilitating power restoration [
15]. It is normally open under normal operating conditions, and the MVDC distribution network is operated in a radial topology.
Table 1 presents the parameters of the MVDC distribution network.
2.1. Modeling of the Half-Bridge MMC
HB-MMCs are widely adopted in DC grids above 10 kV due to cost-effectiveness and efficiency [
16]. A typical MMC topology consists of three phase legs, each composed of an upper and a lower arm. Each arm is composed of
N series connected submodules, and an arm inductor. This configuration enables the required voltage level and capacity by increasing the number of series connected submodules. Considering the rated voltage of submodule capacitors from 1.6 kV to 2.8 kV, 20 submodules with a rated voltage of 1.87 kV were configured in each arm to achieve a voltage level of 37.4 kV [
17]. The submodule capacitance was determined based on the energy-to-power ratio, which is typically in the range of 30–40 kJ/MVA for the MMC. The arm inductance was determined by considering the second harmonic response excited inside the MMC.
Table 2 presents the parameters of the 21-level HB-MMC.
The grounding modes based on the MMC significantly affect reliability of power supply, insulation, protection, and stability in the MVDC distribution networks. In this study, the AC side grounding mode adopted the converter–transformer valve side star connected grounding, and the DC side grounding mode adopted midpoint grounding resistor on the DC side to provide a reference potential for the MMC. When a positive pole-to-ground fault occurs, the voltage of the positive pole drops to zero and the voltage of the negative pole rises. Although the pole voltages change due to the resistance on the DC side, the pole-to-pole voltage remains stable, enabling fast fault recovery [
18]. However, the voltage rise in the healthy pole can cause overvoltage, leading to insulation stress and malfunction of the protective devices. To suppress overvoltage, arresters were installed on the DC poles.
2.2. Modeling of the Distributed Energy Resoures
The 1 MW PV power plant consists of four 250 kW arrays connected in parallel. Each PV array is composed of PV modules connected in series and parallel to achieve the required capacity.
Table 3 presents the parameters of the PV module under standard test conditions, where the irradiance is 1000 W/m
2 and the operating temperature is 25 °C. Each 250 kW PV array consists of 130 strings connected in parallel, with 35 modules connected in series. The maximum power is extracted using the perturb and observe algorithm, one of the most widely adopted maximum power point tracking techniques [
19].
The 1.5 MWh/1.5 MW ESS utilizes lithium-ion battery cells, and each cell has a nominal voltage of 3.7 V and a maximum voltage of 4.2 V. A nominal rack voltage of 1110 V is achieved by connecting 300 lithium-ion cells in series.
Table 4 presents the parameters of the 1.5 MWh/1.5 MW ESS.
3. Protection Strategy for the MVDC Distribution Networks
3.1. Fault Detection Scheme for the MVDC Distribution Networks
DC fault currents can reach peak values within milliseconds, so the fault detection schemes widely adopted in AC grids are limited. Conventional schemes for DC grids can be classified into non-unit and unit protection schemes, similar to AC grids [
20]. Non-unit protection schemes provide simplicity and fast implementation based on local measurements. However, these schemes use predefined thresholds and lack clearly defined protection zones, which raises concerns about their selectivity [
21]. Unit protection schemes detect faults based on measurements from both ends of the protection zone. The schemes operate only when a fault occurs within the zone, ensuring high selectivity [
22,
23].
The protection strategy consists of the fault detection scheme and the fault identification scheme. The fault detection scheme of the proposed protection strategy adopted the ROCOC × ROCOV-based protection scheme, classified as a non-unit protection scheme. The ROCOC-based protection scheme provides fast detection and selectivity for internal faults, particularly under low-resistance fault conditions. However, its sensitivity is significantly reduced under high-resistance fault conditions. The ROCOV-based protection scheme provides fast for both low- and high-resistance faults. In DC grids, similar voltage transients between internal and external faults limit the selectivity of the ROCOV-based protection scheme compared to the ROCOC-based protection scheme. Therefore, the ROCOC × ROCOV-based protection scheme improves the reduced sensitivity of ROCOC-based protection scheme for high-resistance faults while solving the selectivity issues of the ROCOV-based protection scheme. The sign of ROCOC × ROCOV provides the selectivity between internal and external faults. When an internal fault occurs in the DC grid, the pole voltage drops while the current rises, resulting in a negative sign of ROCOC × ROCOV. In contrast, when an external fault occurs, both the pole voltage drops and the current decreases, resulting in a positive sign of ROCOC × ROCOV.
Table 5 presents the sign of ROCOC × ROCOV between internal and external faults.
3.1.1. Threshold Setting of the ROCOC × ROCOV-Based Protection Scheme
The ROCOC × ROCOV-based protection scheme, classified as a non-unit protection scheme, operates based on predefined thresholds without a clearly defined protection zone. Some approaches depend on large-scale simulations or complex calculations to determine appropriate thresholds in the MVDC distribution networks. However, this approach is challenging in reconfigurable MVDC distribution networks, where fault scenarios can differ depending on the network topology. Practical threshold setting of non-unit protection schemes for expansion of the MVDC distribution networks is required.
The threshold of the ROCOC × ROCOV-based protection scheme was determined as the product of the thresholds of the ROCOC- and ROCOV-based protection schemes. To determine the thresholds of the ROCOC- and ROCOV-based protection schemes, the time and quantities were defined. The time is set based on the target protection time, defined as the maximum fault detection time that protection engineers can allow when a fault occurs in MVDC distribution networks. The target protection time depends on the network topologies, converter stations, grounding modes, and DC circuit breakers. Thus, protection engineers must select the appropriate target protection time for each network. The quantities of ROCOC and ROCOV are the magnitudes of current and voltage, respectively.
The threshold of an overcurrent-based protection scheme in VSC-based DC grids is generally set between 2 and 3 PU of the rated current. This threshold is determined based on the withstand capability of the insulated gate bipolar transistors in MMCs. The devices can withstand 2–3 times the rated current for a few milliseconds before thermal runaway occurs [
24,
25]. In this study, the quantity of the current was determined as 2 PU, meaning the ROCOC-based protection scheme detects a fault current rise of 1 PU within the target protection time. The threshold of ROCOC-based protection scheme is calculated using Equation (2), as follows:
The threshold of the undervoltage-based protection scheme in DC grids is commonly set at 0.8 PU of the rated voltage. This threshold is typically determined based on the minimum required level for stable operation of VSCs under fault conditions [
26]. In this study, the quantity of voltage was determined as 0.2 PU, meaning that the ROCOV-based protection scheme responds if the pole voltage reaches 0.8 PU within the target protection time. The threshold of the ROCOV-based protection scheme is calculated using Equation (3), as follows:
Based on the thresholds of ROCOC- and ROCOV-based protection scheme, the threshold of ROCOC × ROCOV-based protection scheme is calculated using Equation (4), as follows:
These thresholds are selected based on the rated current and voltage under normal operating conditions in a radial topology. Fixed thresholds can also be applied in multi-terminal topologies under network reconfiguration.
3.1.2. Communication Between Protective Relays in the Multi-Terminal MVDC Distribution Network Under Network Reconfiguration
The ROCOC × ROCOV-based protection scheme can achieve the requirements for speed, sensitivity, and selectivity when faults occur in radial MVDC distribution networks. However, non-unit protection schemes can misoperate under external fault conditions in multi-terminal MVDC distribution networks under network reconfiguration. Non-unit protection schemes can misoperate under external fault conditions in multi-terminal MVDC distribution networks under network reconfiguration. The protective relays can measure similar characteristics for both external and internal faults, which requires accurate threshold settings. However, it is difficult to determine the fault locations in the case of critical external faults. To enhance selectivity, communication between protective relays that share the same protection zone is introduced under multi-terminal MVDC distribution network.
If Bus 5 and Bus 33 are connected by a tie-switch, the protection zone of the relay located at Bus A is extended from Bus A to Bus D. The protection zone of the relay located at Bus D is extended from Bus D to Bus A. Consequently, the relays located at Bus A and Bus D share the same protection zone. When a fault occurs during this scenario, the relays located at Bus A and Bus D communicate the response of ROCOC × ROCOV-based protection scheme and operate only if faults occur within the protection zone, as shown in
Table 6.
3.2. Fault Identification Scheme for the MVDC Distribution Networks
After fault detection, the |V
p/V
n|-based protection scheme was adopted to determine the fault type. This approach is based on the principle that a pole-to-ground fault causes a voltage drop on the faulty pole and an overvoltage on the healthy pole. In the absence of measurement noise, the magnitudes of the positive and negative pole voltages are equal, and |V
p/V
n| remains 1 under normal operating conditions. If a pole-to-pole fault occurs, both voltages drop simultaneously and |V
p/V
n| remains 1. Although |V
p/V
n| presents similar characteristics under both normal operating conditions and pole-to-pole faults, the fault identification scheme remains blocked until a fault is detected, preventing malfunction. If a pole-to-ground fault occurs on the positive pole, the positive pole voltage drops while the negative pole voltage rises, resulting in |V
p/V
n| < 1. If a pole-to-ground fault occurs on the negative pole, the negative pole voltage drops and the positive pole voltage rises, leading to |V
p/V
n| > 1.
Table 7 presents |V
p/V
n| for different fault types in the absence of measurement noise.
To prevent malfunctions caused by measurement noise, a reliability coefficient
was introduced.
Table 8 presents the thresholds of the |V
p/V
n|-based protection scheme.
3.3. Implementation of the Protection Strategy for the MVDC Distribution Networks
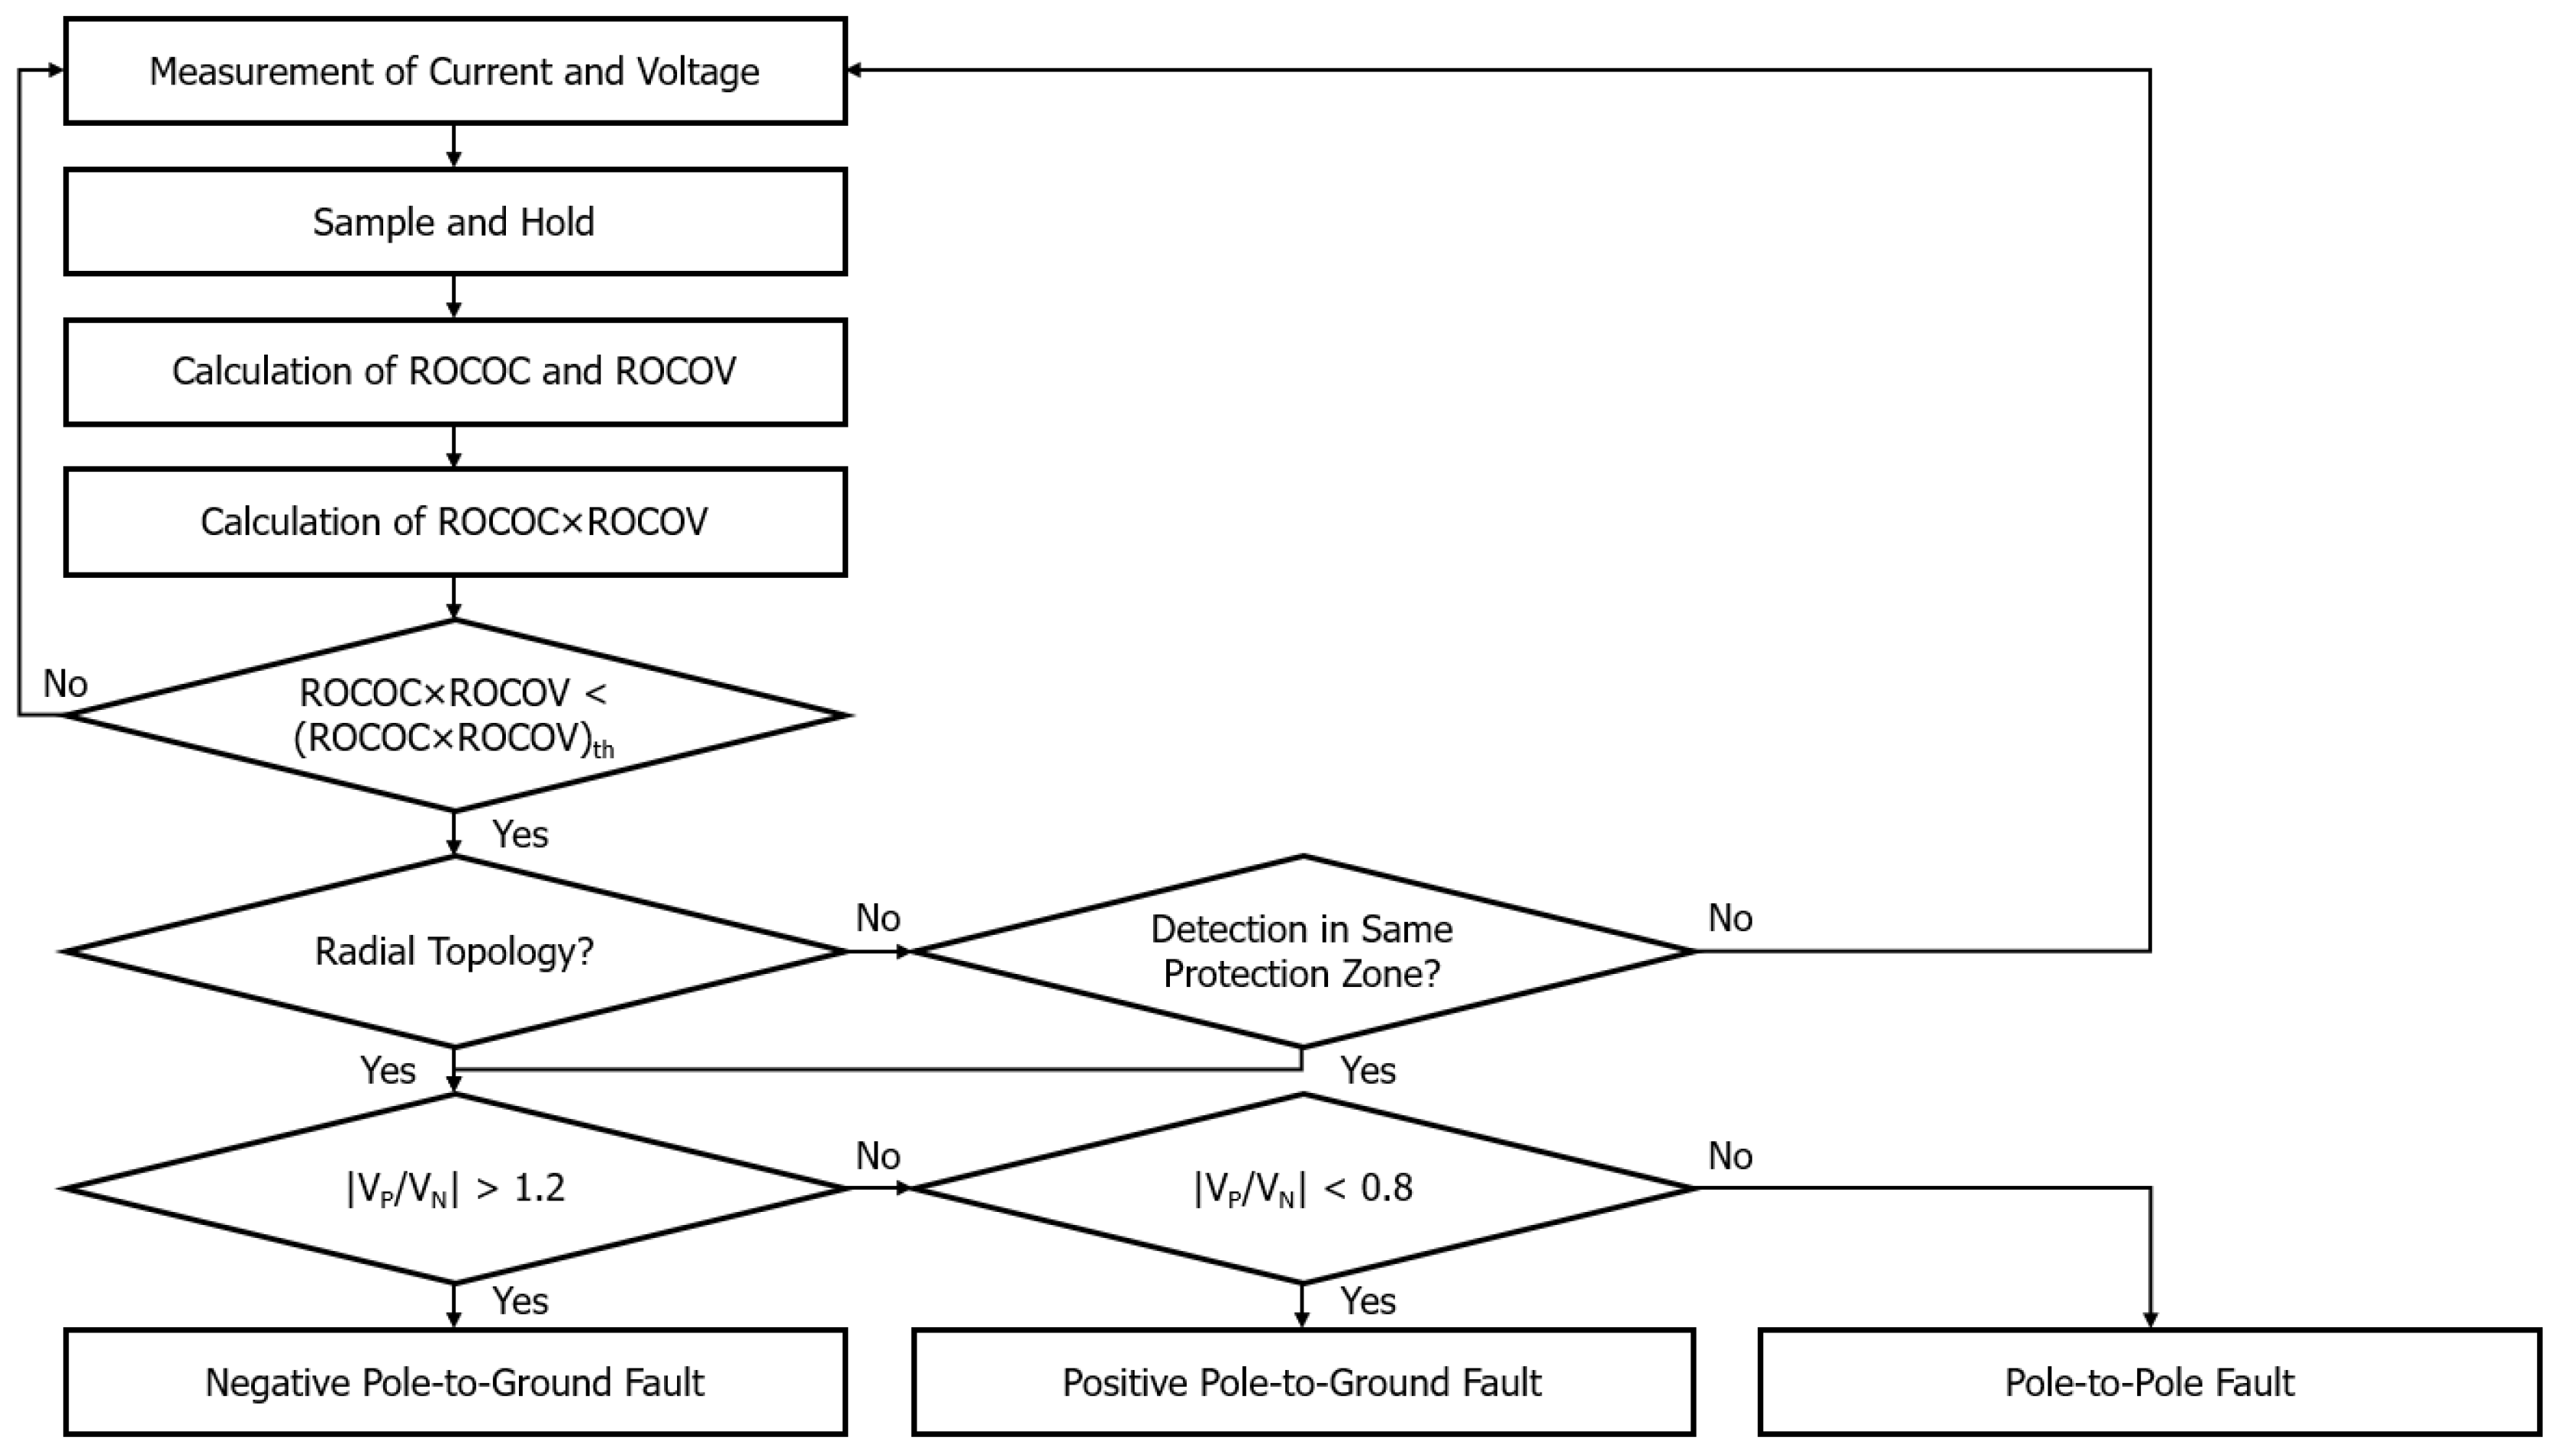
Figure 2 illustrates the protection strategy. The proposed strategy was implemented in PSCAD/EMTDC, a widely used electromagnetic transient simulation tool for modeling and analyzing power systems.
The voltage and current from both the positive and negative poles were sampled every 200 us using sample-and-hold. The rate of change is calculated by subtracting the sampled value 200 us earlier from the current sampled value and dividing the result by 200 us. The ROCOC × ROCOV was calculated as the product of ROCOC and ROCOV and compared to the predefined threshold. In a radial topology, relays do not share the same protection zones, the fault identification scheme is unblocked immediately after fault detection and determines the fault type. In a multi-terminal topology, the responses of a ROCOC × ROCOV-based protection scheme are communicated between protective relays that share the same protection zone. In the absence of a response from the ROCOC × ROCOV-based protection scheme in other relays, the fault is classified as an external fault, and the relays withhold operation. The fault location is determined and the fault identification scheme is unblocked.
4. Evaluation of the Performance for Protection Strategy
4.1. The Threshold Settings of the Protection Strategy
4.1.1. The Threshold Settings of the Fault Detection Scheme
This paper focuses on relays located at Bus A in the MVDC distribution network. The target protection time was set to 1 ms, aiming to detect faults within this duration. When the target protection time is relatively long, the resulting threshold becomes lower, which can cause misoperation for noise. Conversely, a shorter protection time leads to a higher threshold, reducing sensitivity. Therefore, protection engineers must determine an appropriate protection time considering these trade-offs. Under normal operating conditions in the radial MVDC distribution network, the rated current of 0.179 kA was measured at Bus A. The positive and negative pole voltages were measured to be + 18.7 kV and −18.7 kV, respectively. The threshold of the ROCOC-based protection scheme was calculated as 0.179 kA/ms, based on the rated current of 0.179 kA and the target protection time of 1 ms. The voltage of 14.96 kV represents 0.8 PU under nominal operating conditions, and the threshold of ROCOV-based protection scheme was calculated as −3.74 kV/ms. Consequently, the threshold of ROCOC × ROCOV-based protection scheme was calculated as −0.6695 kA∙kV/ms2. The threshold for the ROCOC × ROCOV-based fault detection scheme was set as follows:
ROCOC = (0.358 kA − 0.179 kA)/1 ms = 0.179 kA/ms;
ROCOV = (14.96 kV − 18.7 kV)/1 ms = −3.74 kV/ms;
ROCOC × ROCOV = (0.179 kA/ms) × (−3.74 kV/ms) = −0.6695 kA kV/ms2.
Table 9 presents the threshold of the relays located at Bus A, Bus B, Bus D, and Bus E, which were set to verify the performance in the multi-terminal MVDC distribution network.
4.1.2. The Threshold Settings of the Fault Identification Scheme
The parameter
k was defined as a value less than 1 to prevent malfunctions caused by measurement noise. The determination of the fault type becomes more difficult for high-resistance faults as
k increases. In this study,
k was set to 0.2.
Table 10 presents the threshold settings of the |V
p/V
n|-based fault identification scheme.
4.2. The Performance of the Protection Strategy for the MVDC Distribution Network
4.2.1. The Performance of the Protection Strategy in the Radial Topology
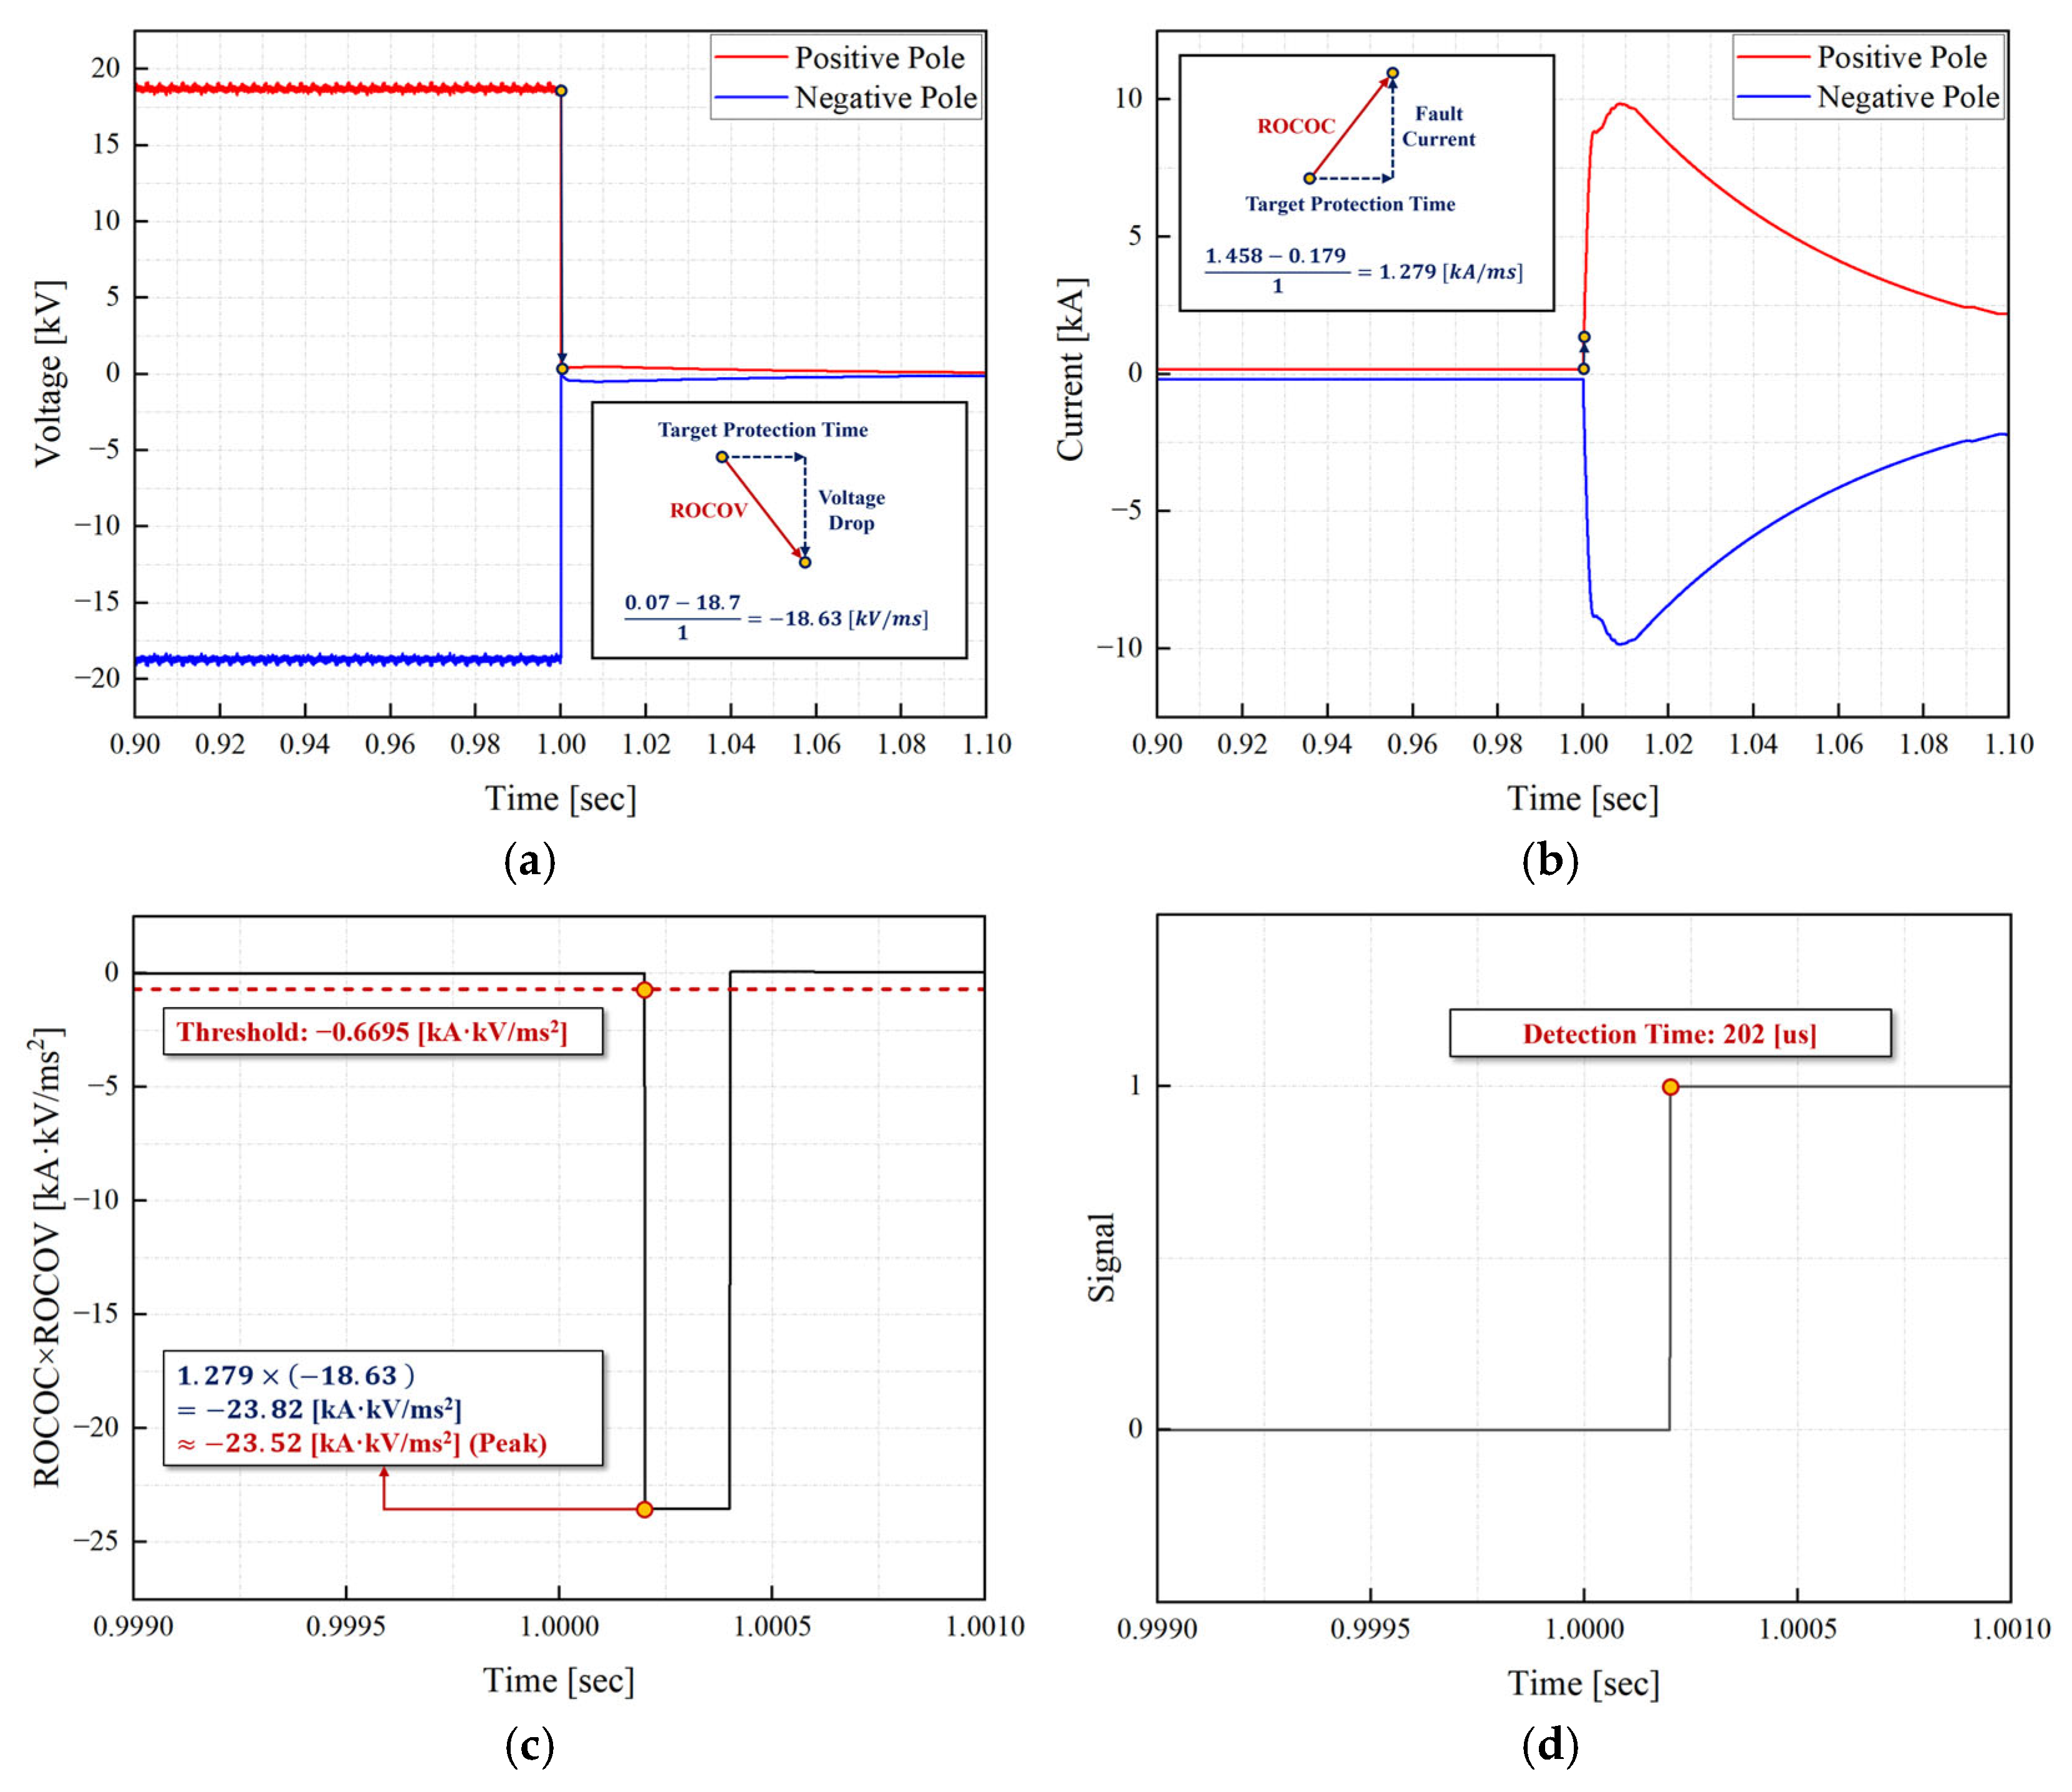
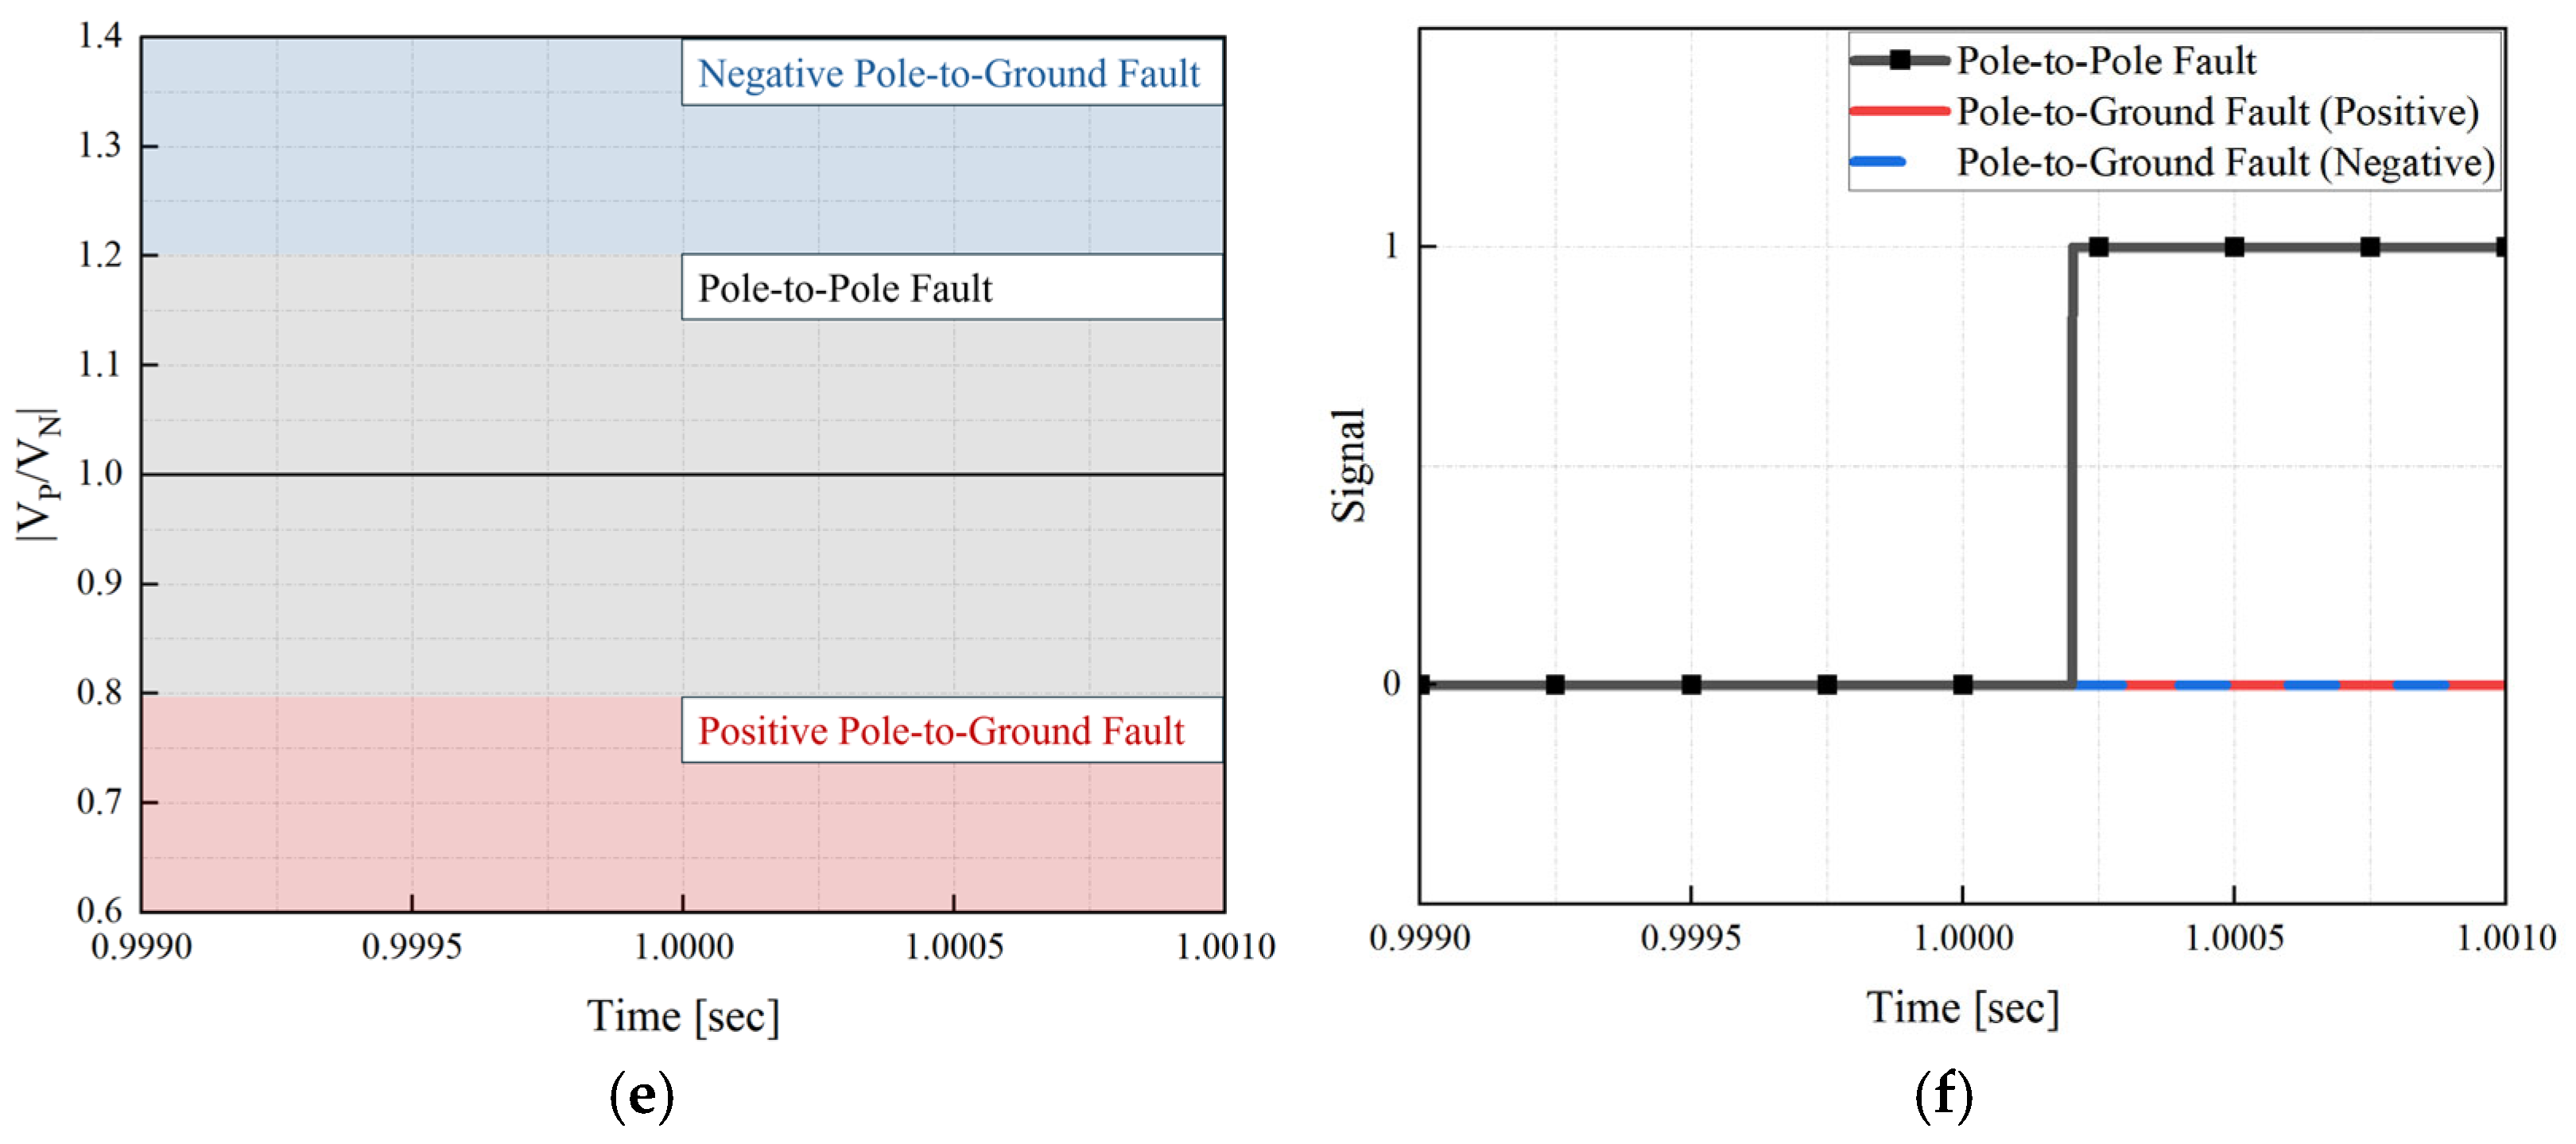
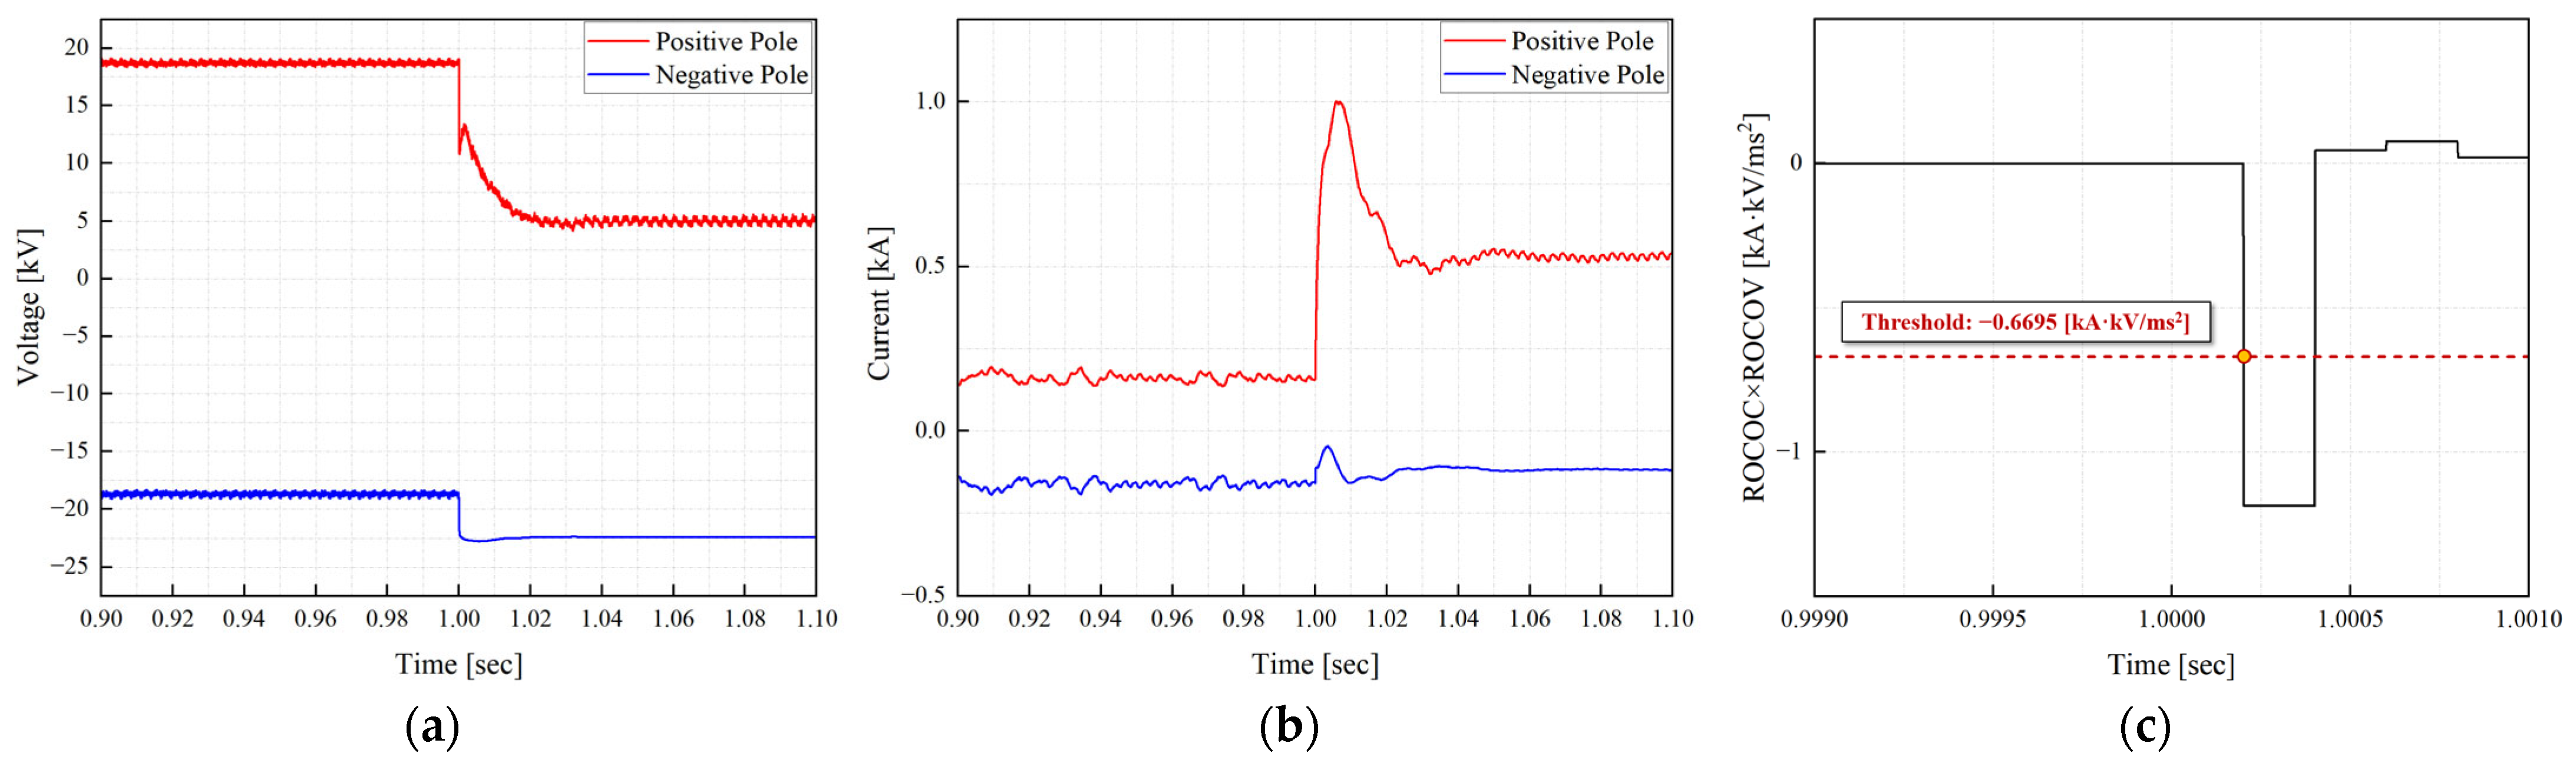
Figure 3 illustrates the performance of the protection strategy for a pole-to-pole fault near Bus A in the radial MVDC distribution network. This fault scenario corresponds to the most critical internal fault for the relay located at Bus A. The permanent fault with a resistance of 0.1 Ω occurred at 1 s.
The positive and negative pole voltages dropped simultaneously to 0, while the currents rapidly rose to 9.85 kA. As a result, the ROCOC × ROCOV reached −23.52 kA·kV/ms2 at 202 us and exceeded the threshold of −0.6695 kA·kV/ms2 at 202 us, thereby successfully detecting the fault within the target protection time. In the radial topology, the fault identification scheme was unblocked without communication. The remained at 1 and the fault was successfully classified as a pole-to-pole fault.
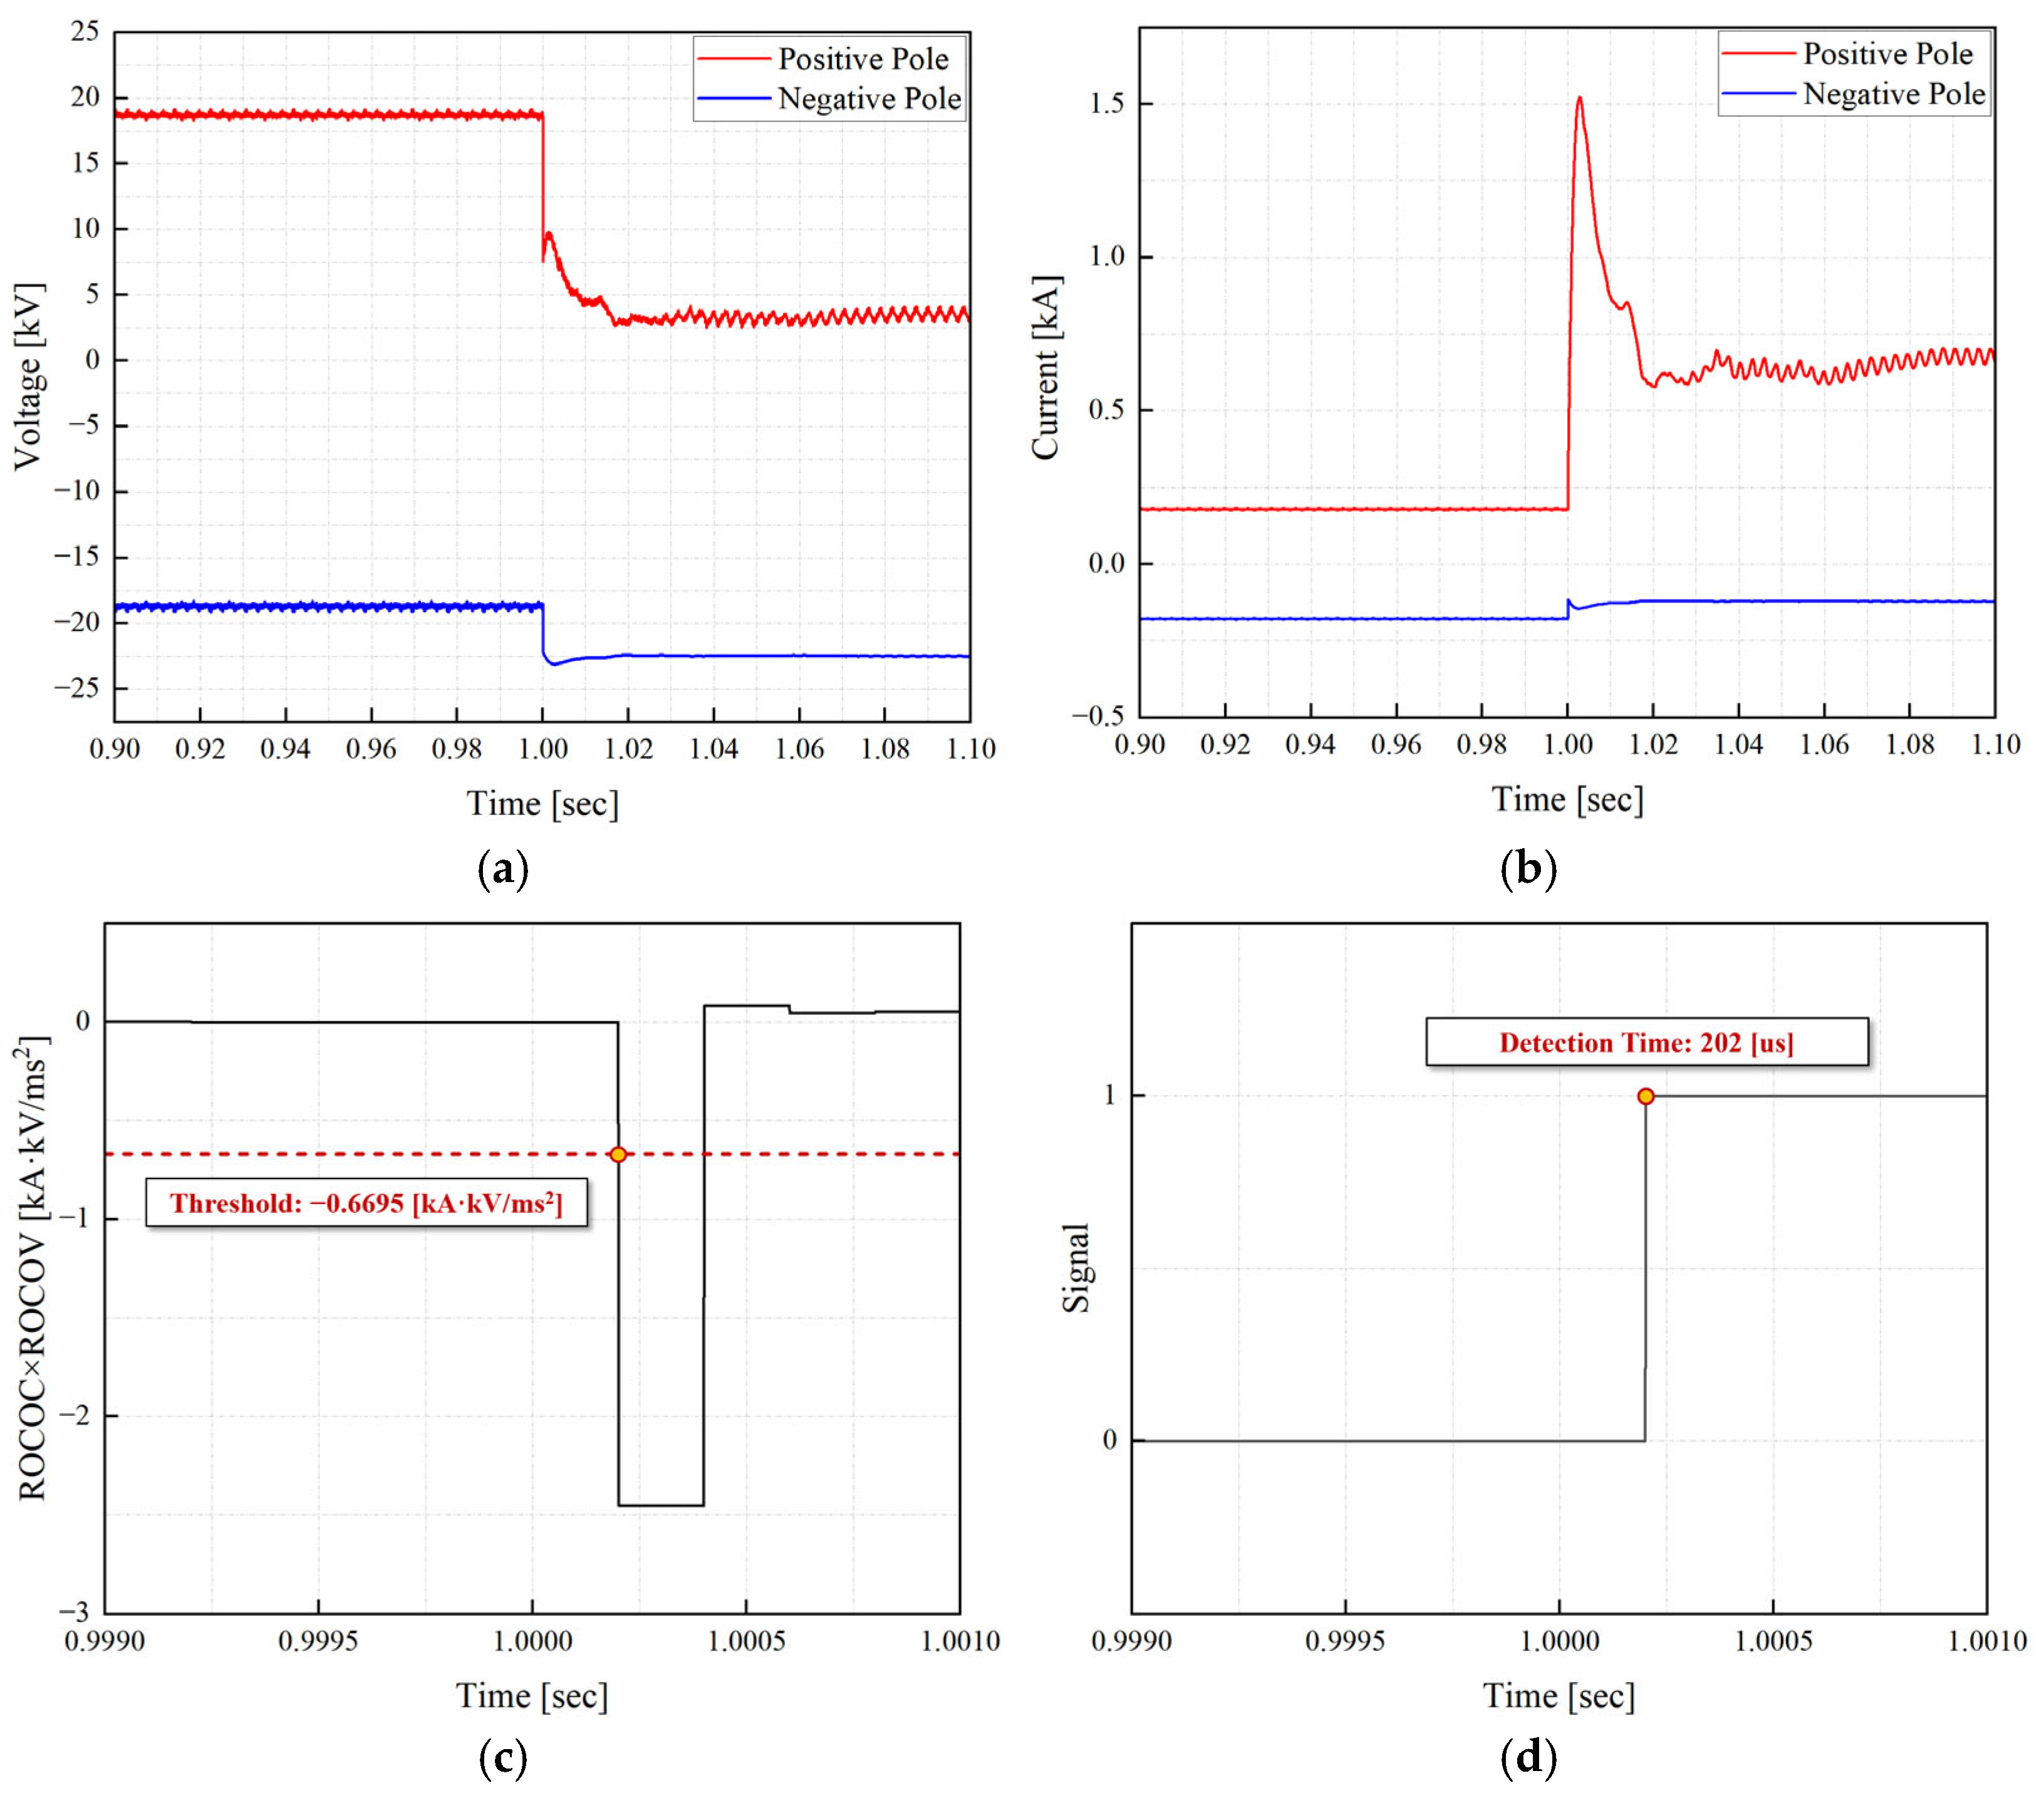
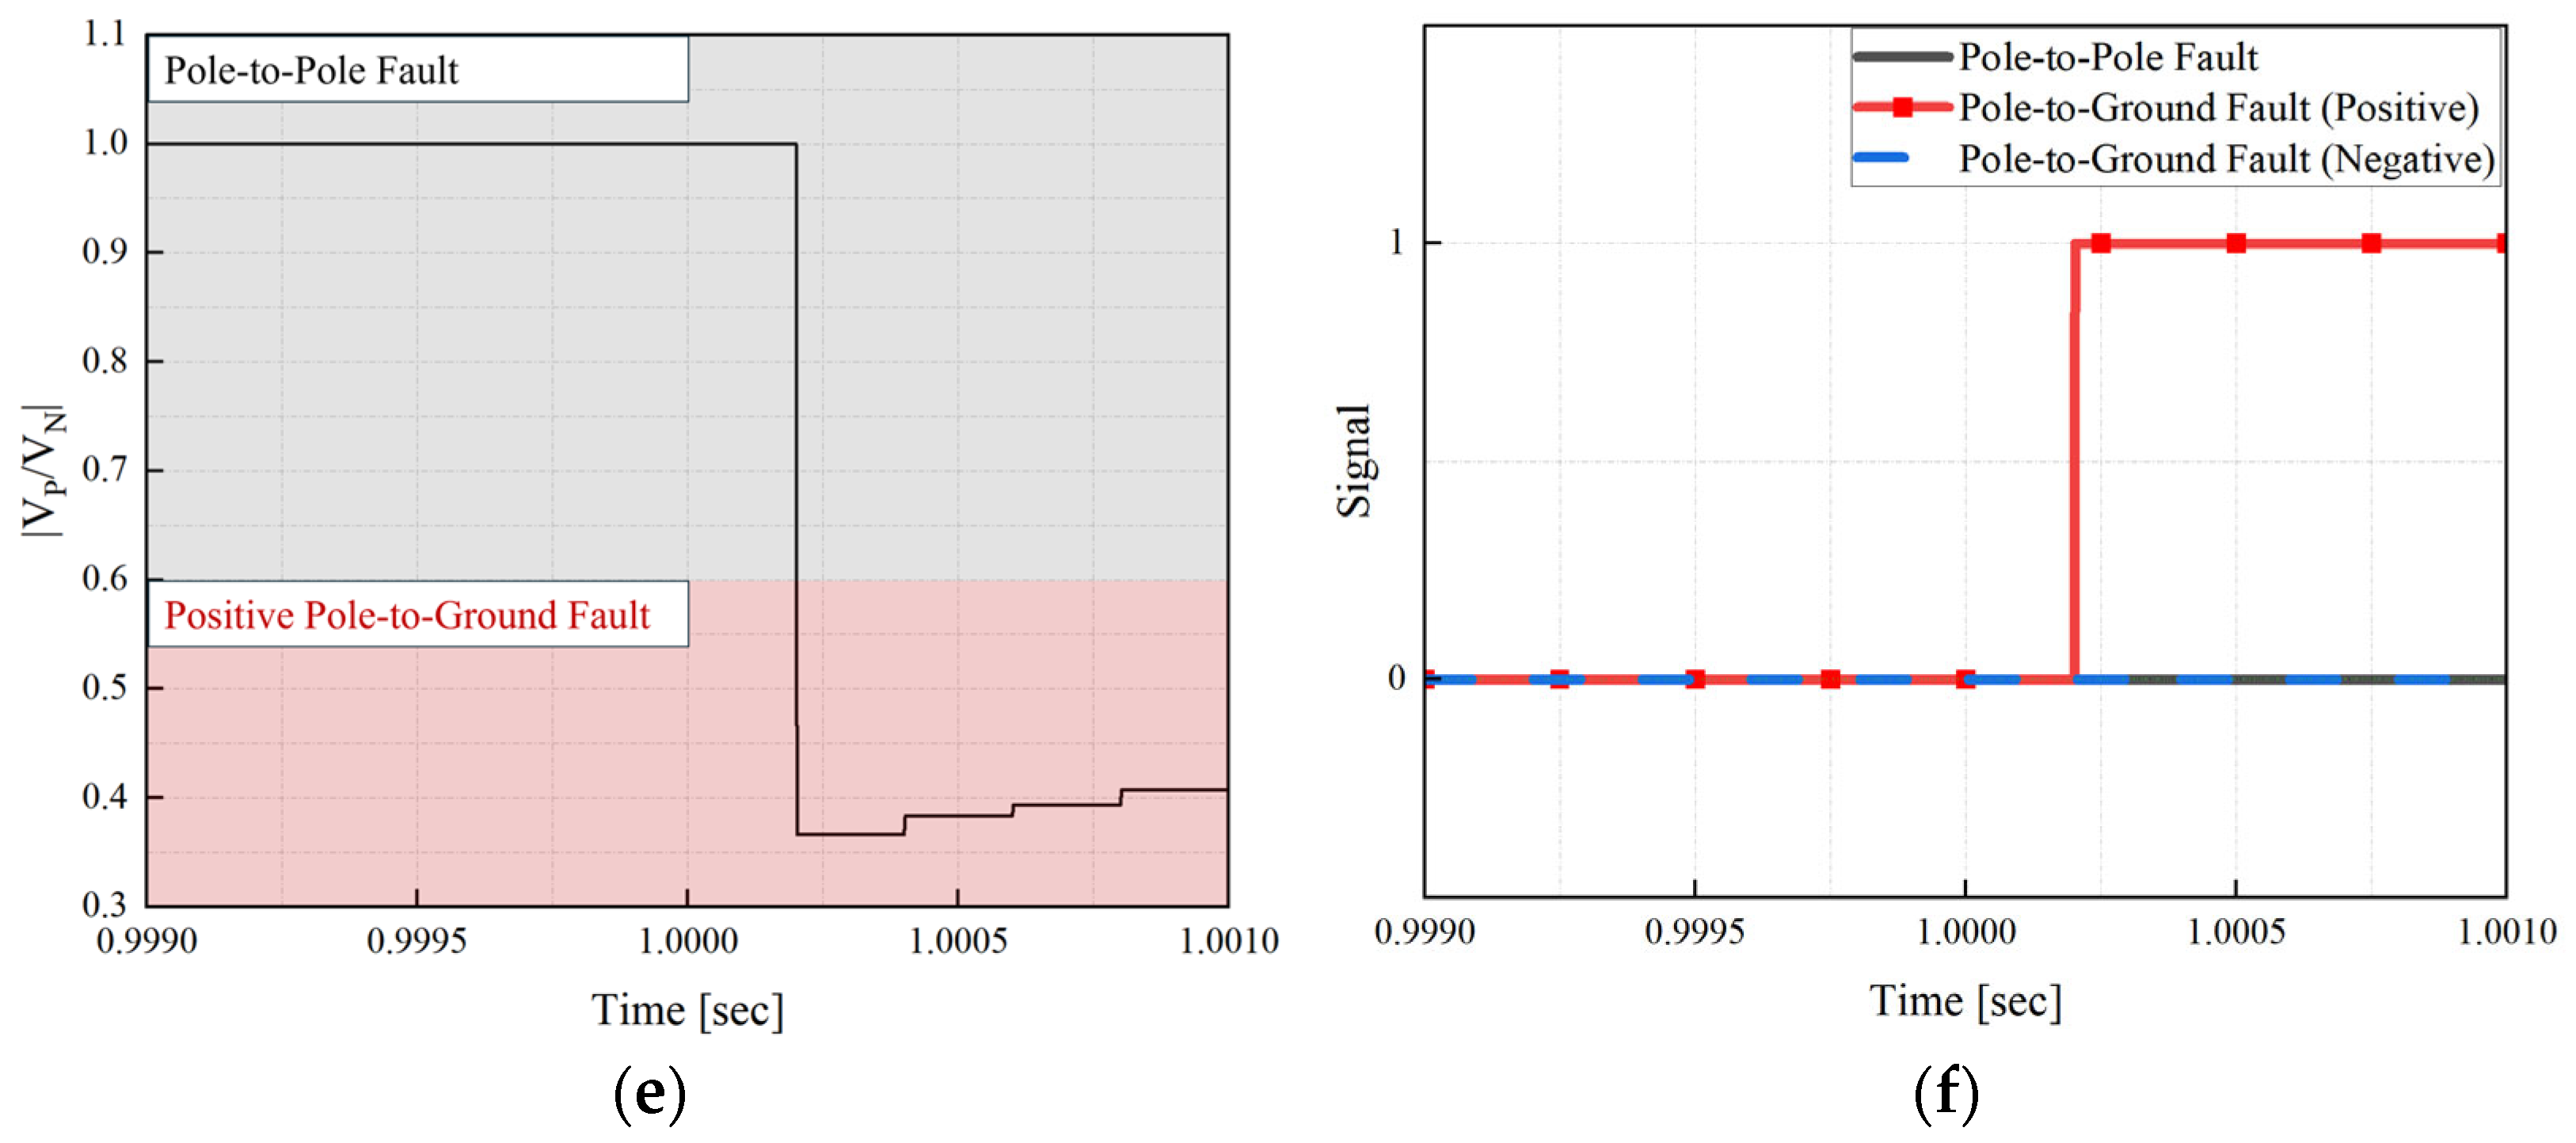
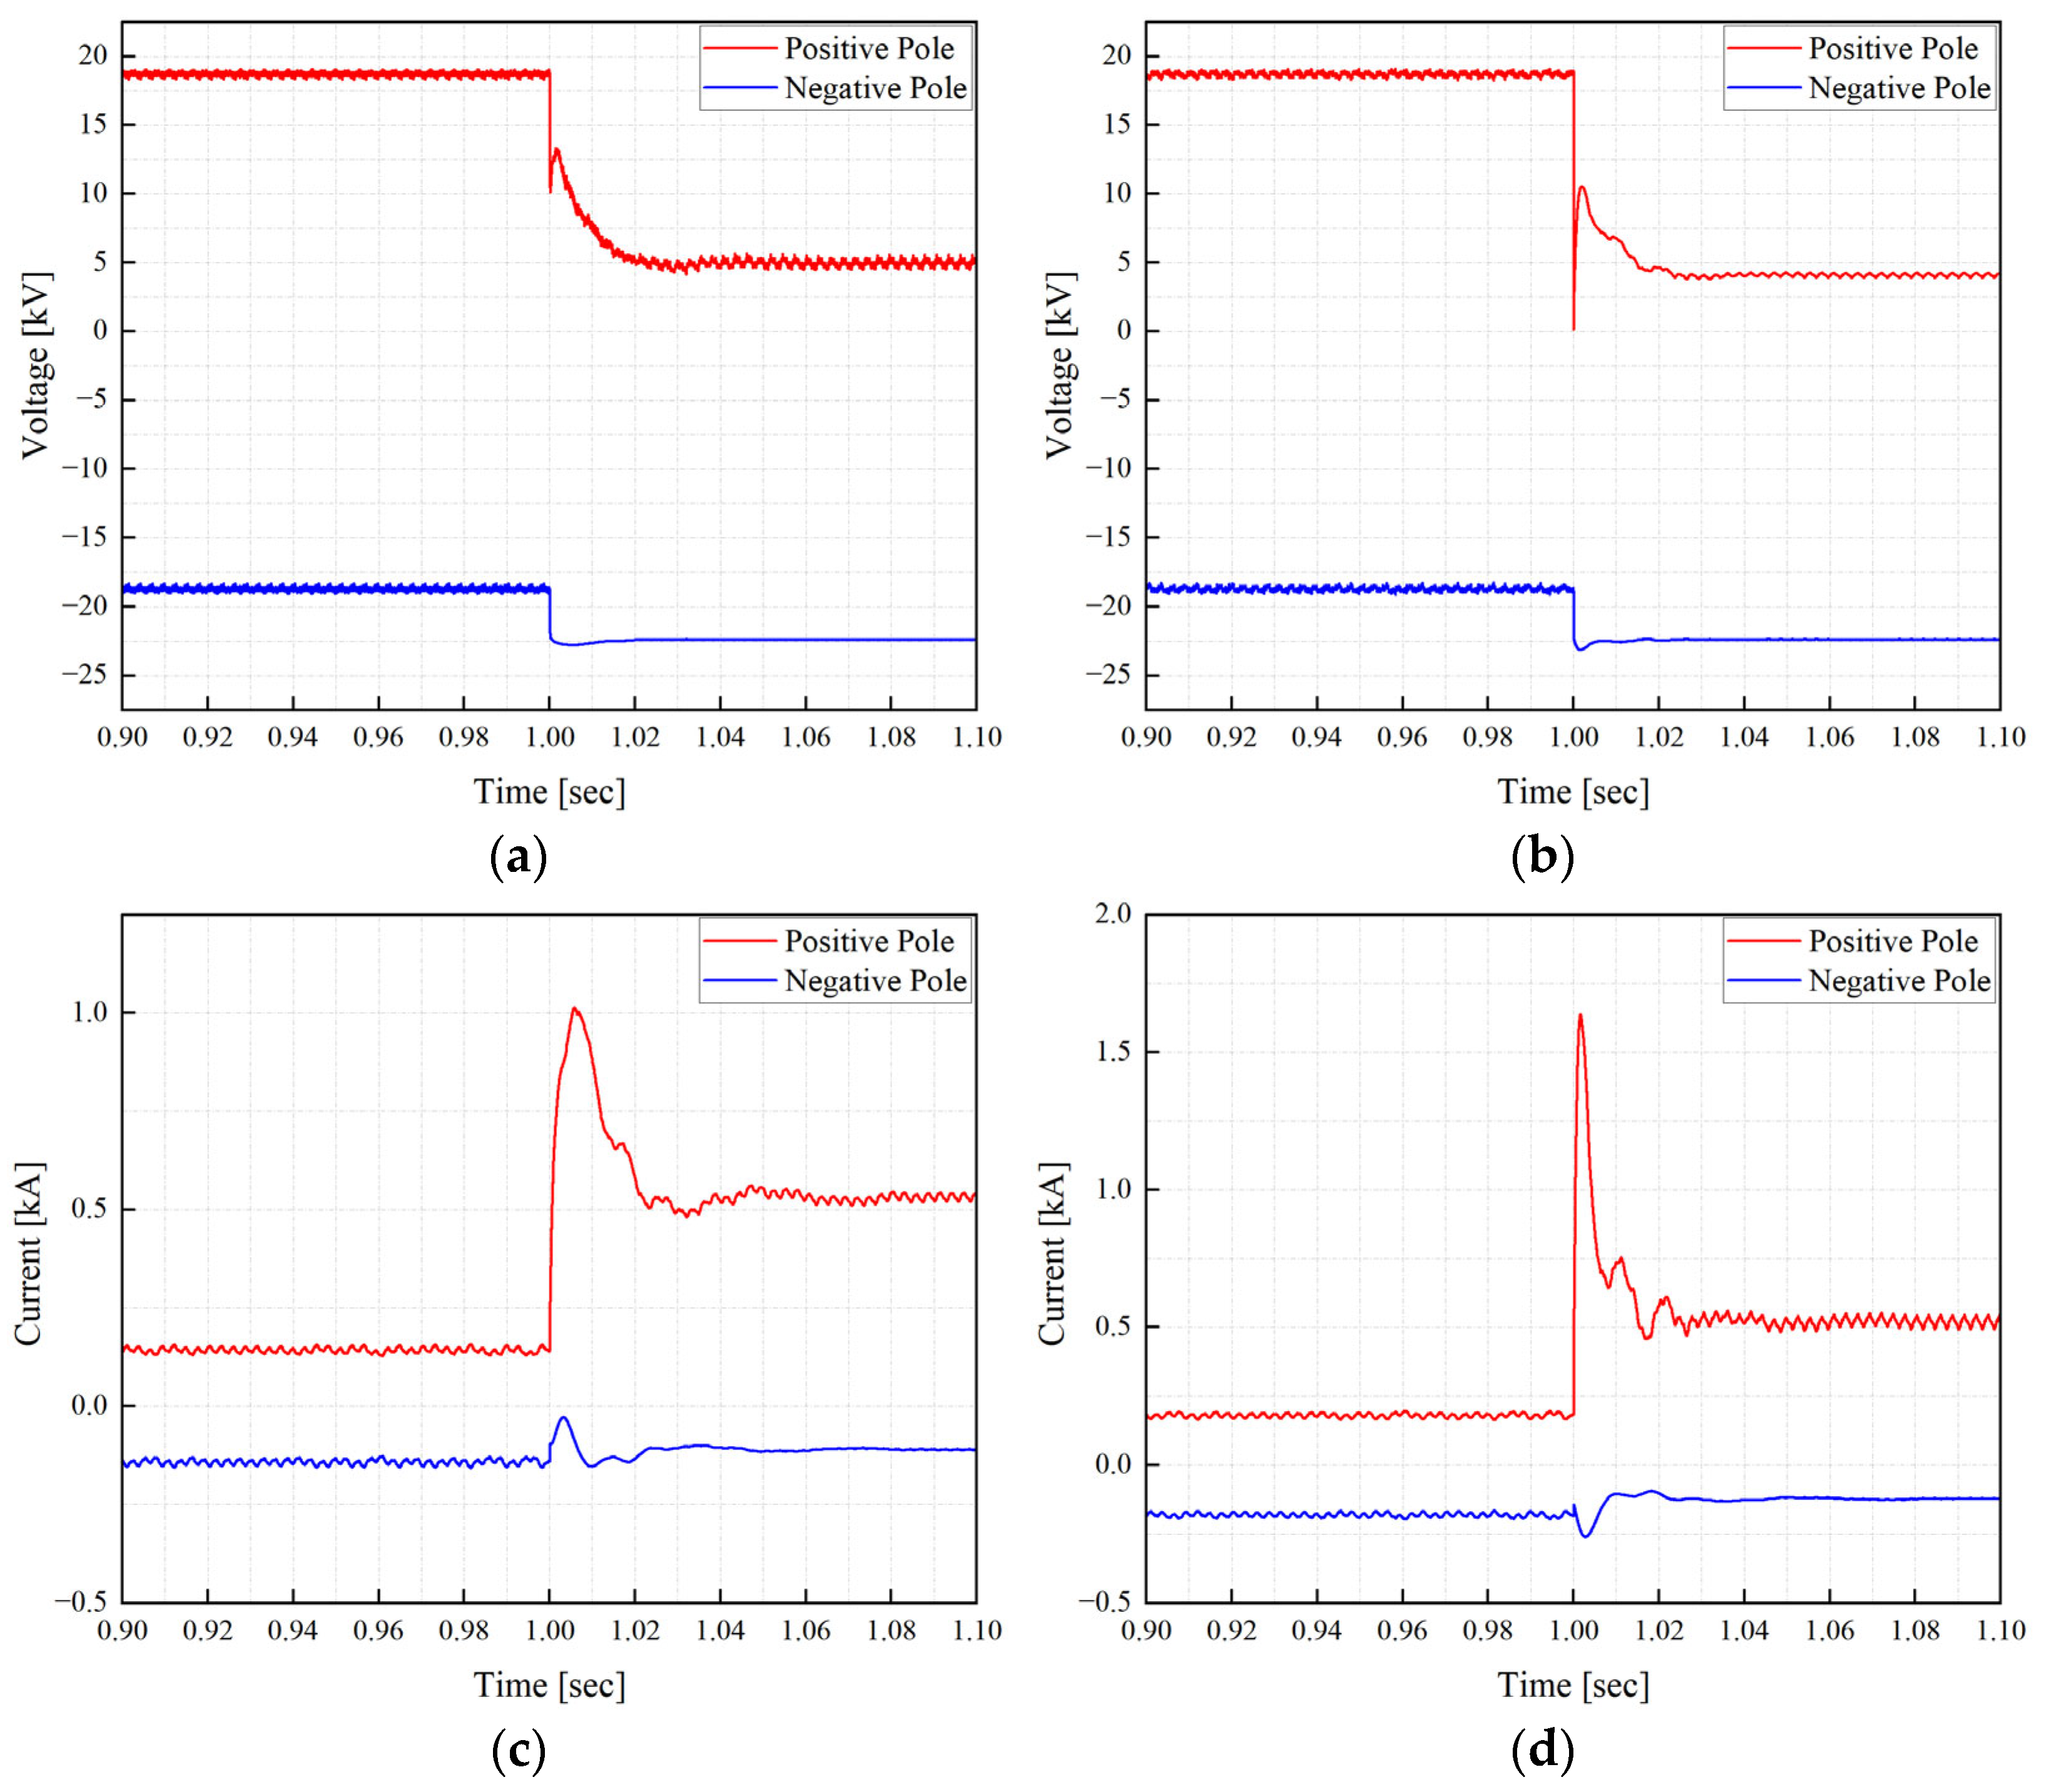
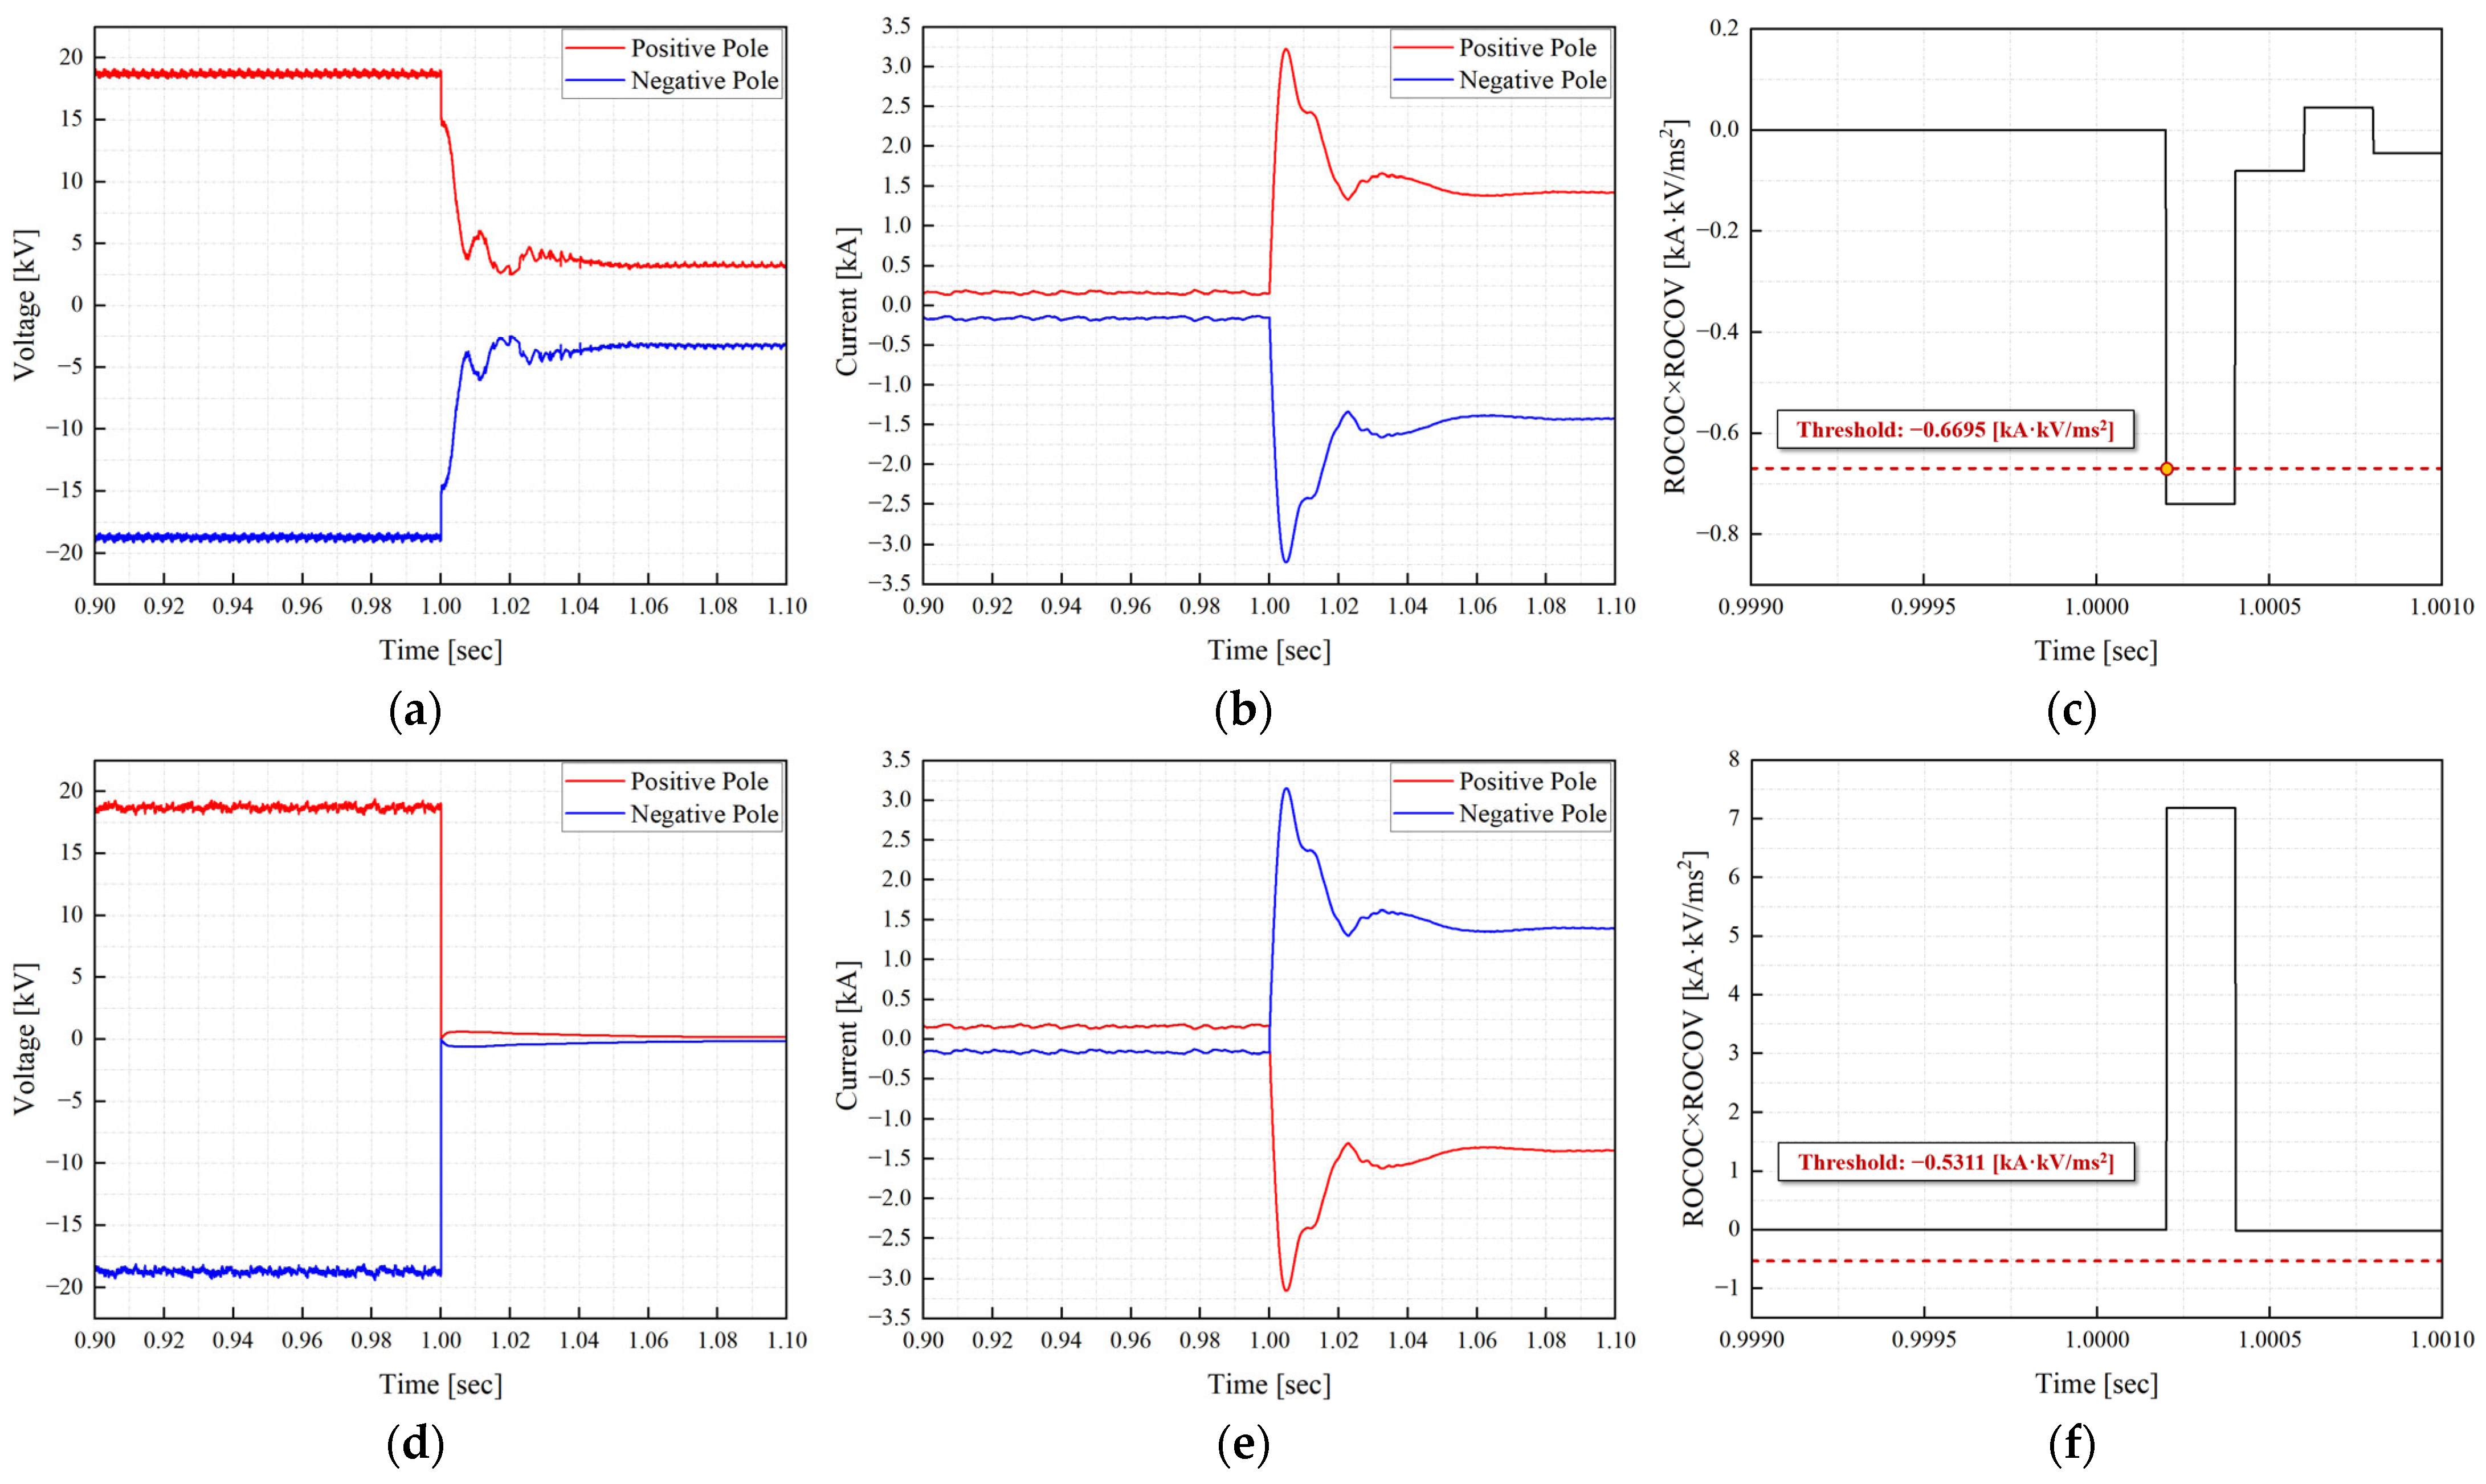
Figure 4 illustrates the performance of the protection strategy for a positive pole-to-ground fault near Bus 8. The fault location was located 6.66 km from the protective relay located at Bus A. The fault scenario corresponds to the fault with the highest fault resistance in the radial topology, as measured by the relay located at Bus A. The permanent fault with a resistance of 5 Ω occurred at 1 s.
The positive pole voltage dropped to 0 while the current rapidly rose to 1.52 kA. The ROCOC × ROCOV reached −2.454 kA·kV/ms2 at 202 us and exceeded the threshold of −0.6695 kA·kV/ms2 at 202 us, thereby successfully detecting the fault within the target protection time. Although the overvoltage of 1.2 PU on the negative pole was suppressed by the arrester, the voltage drop on the positive pole caused the to fall below the threshold of 0.8. The fault identification scheme successfully classified the fault as a positive pole-to-ground fault. These results demonstrate that the proposed protection strategy can successfully detect internal faults, achieving speed and sensitivity in the radial MVDC distribution network.
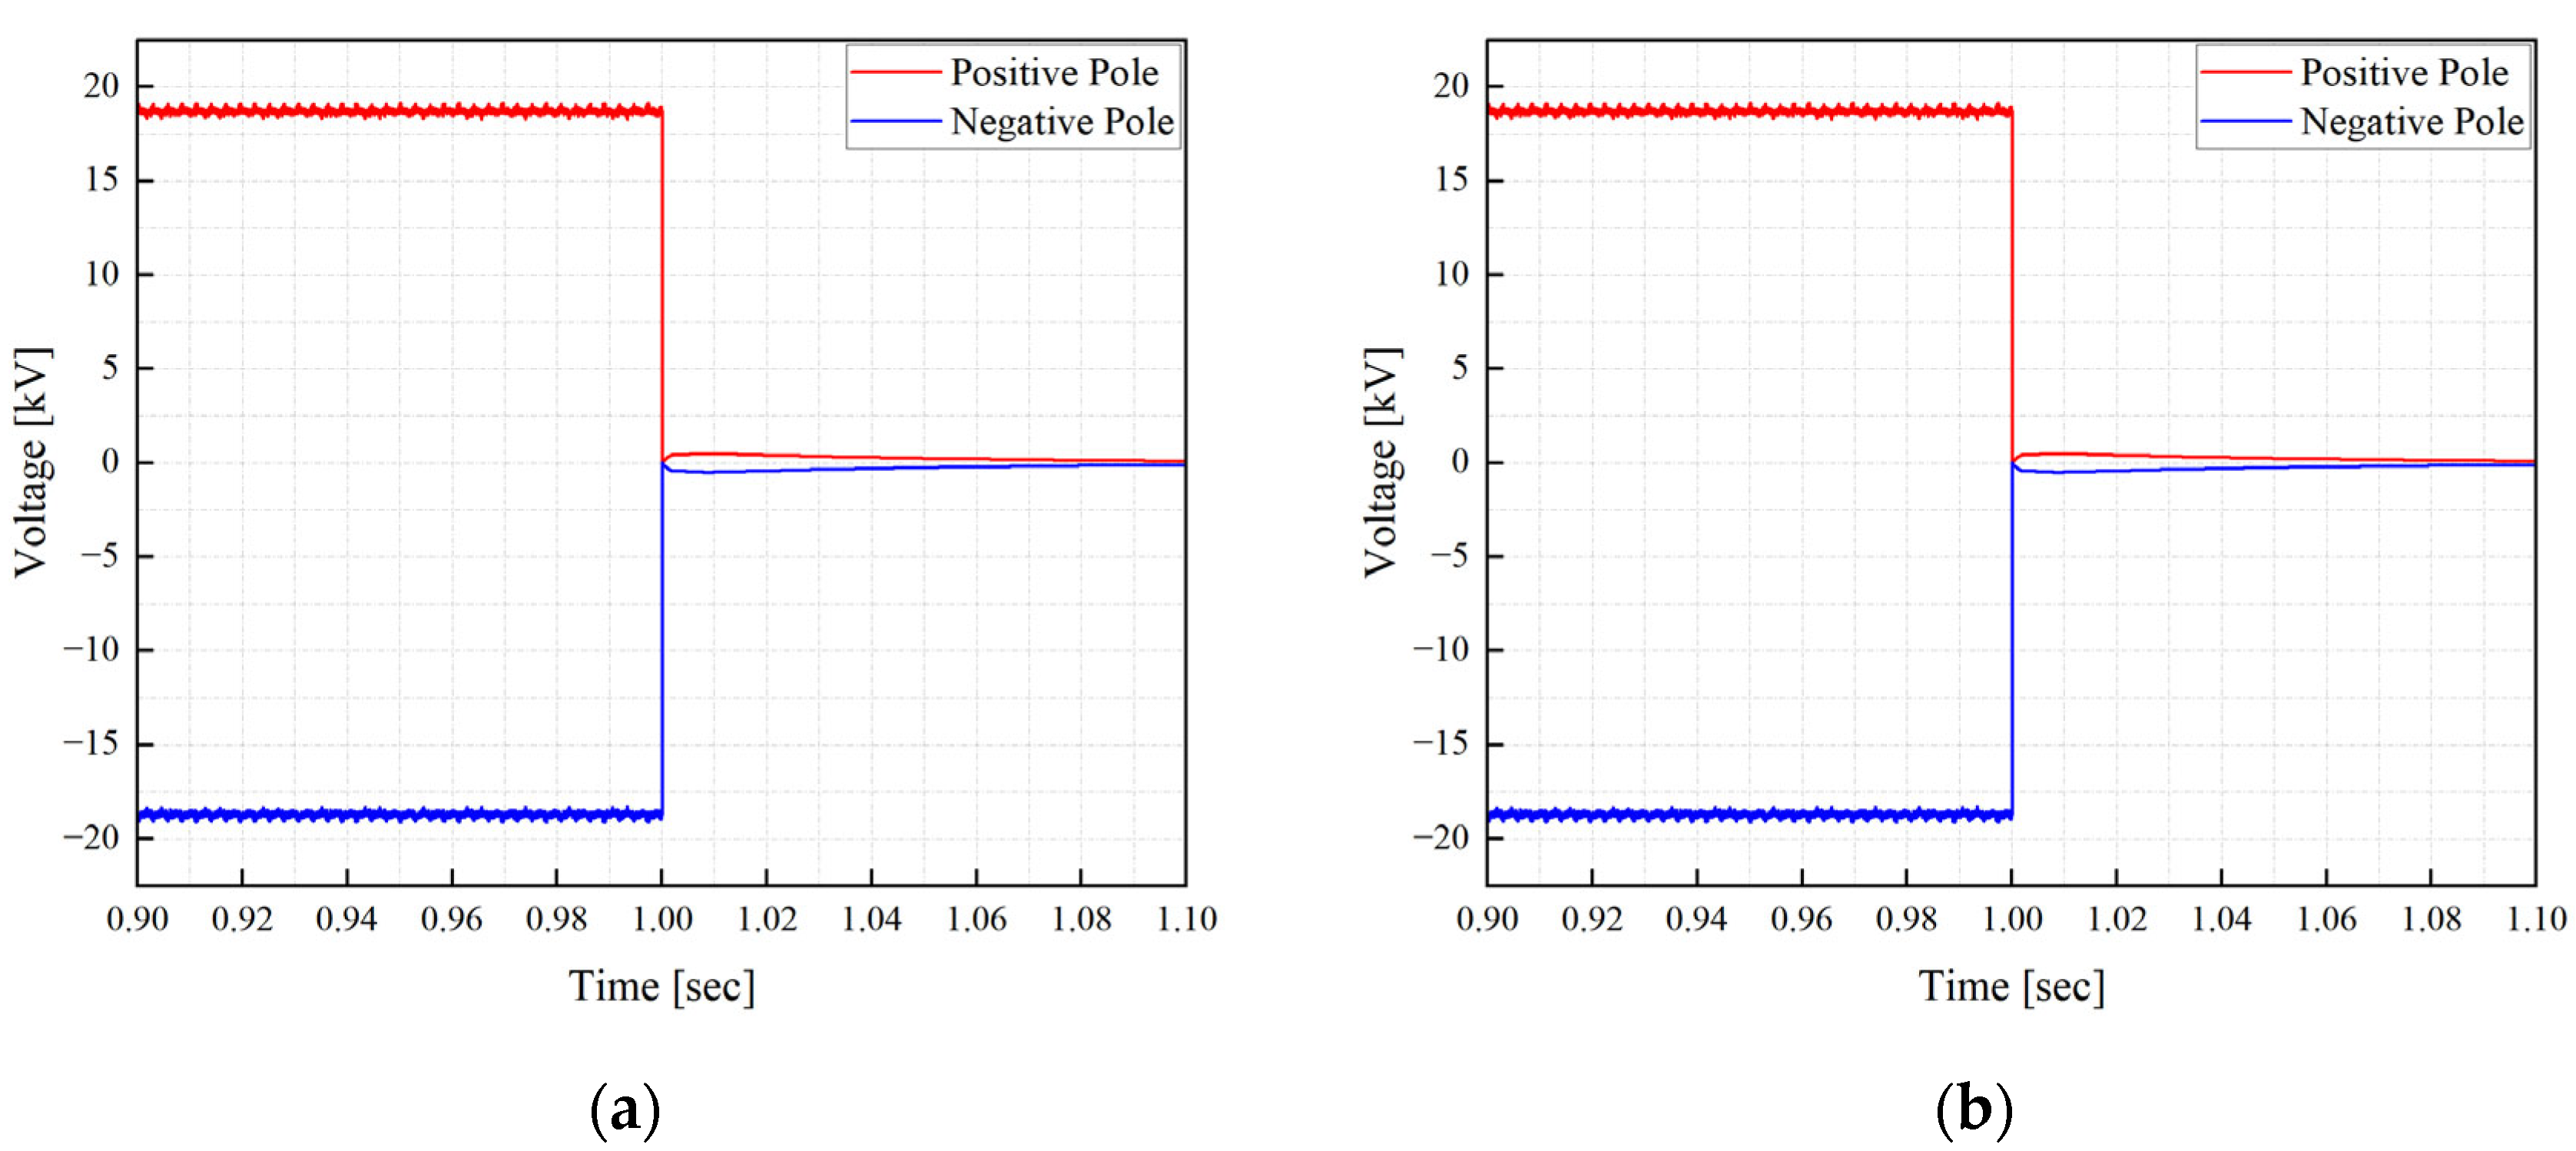
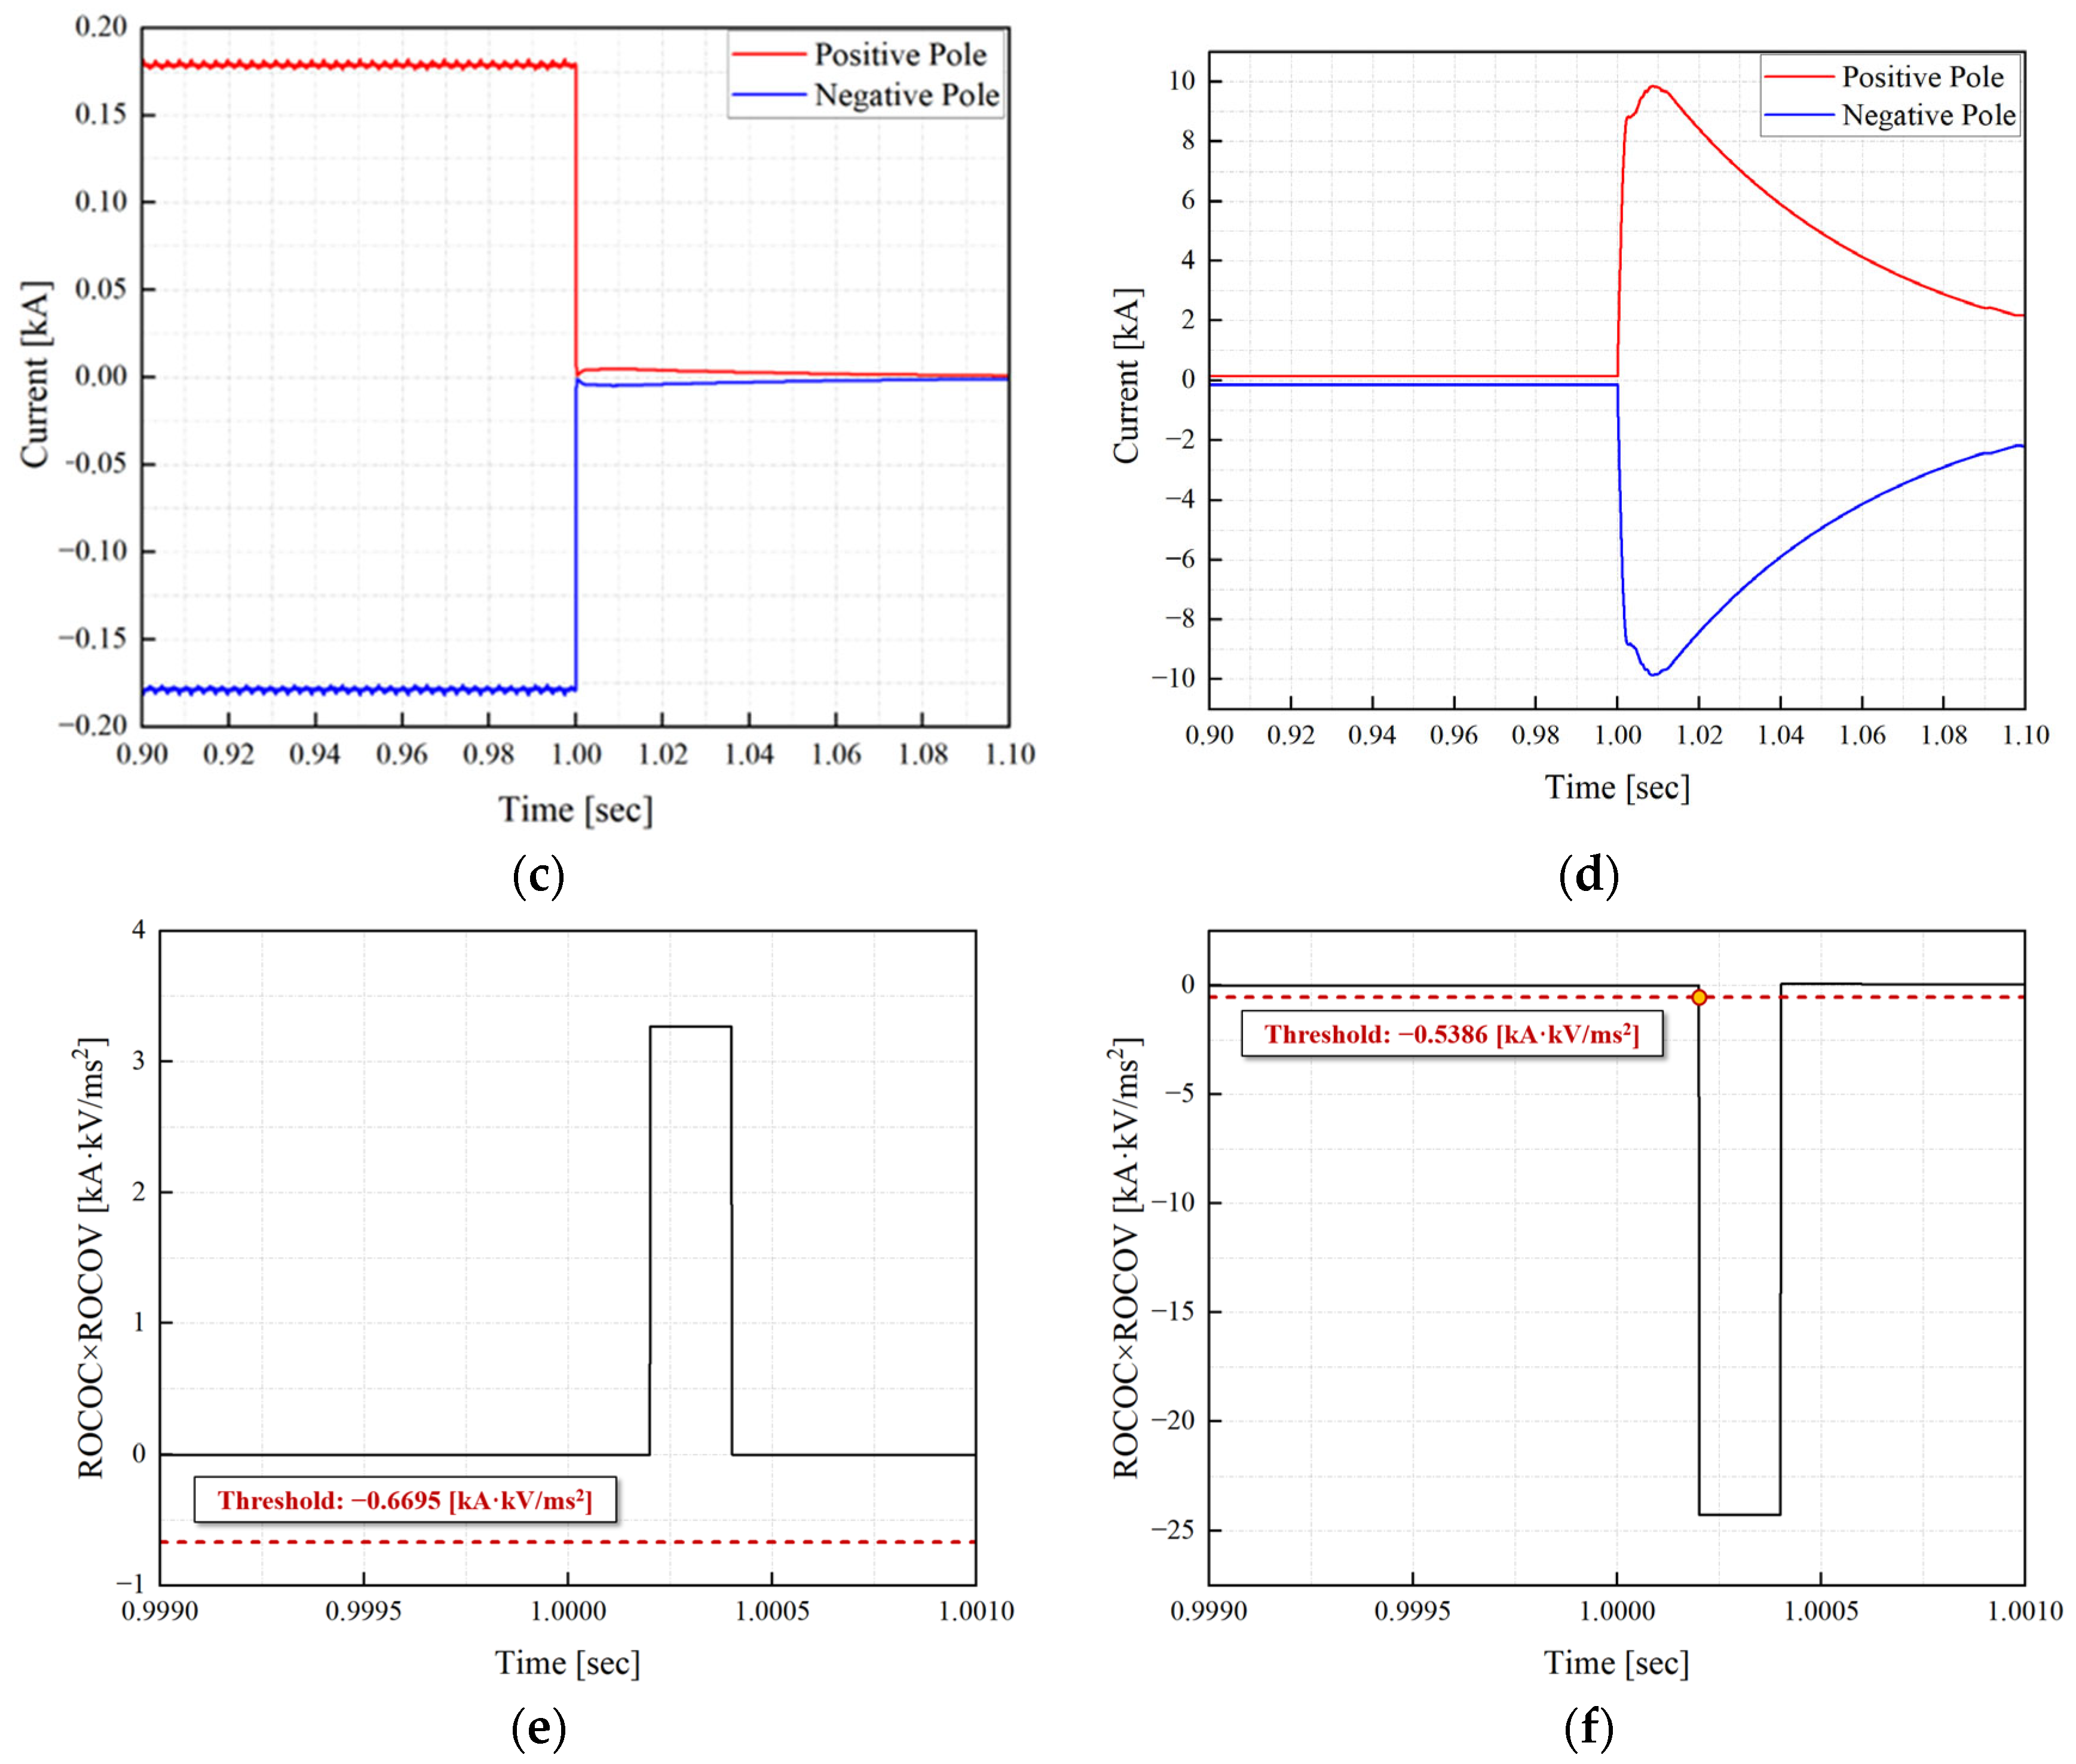
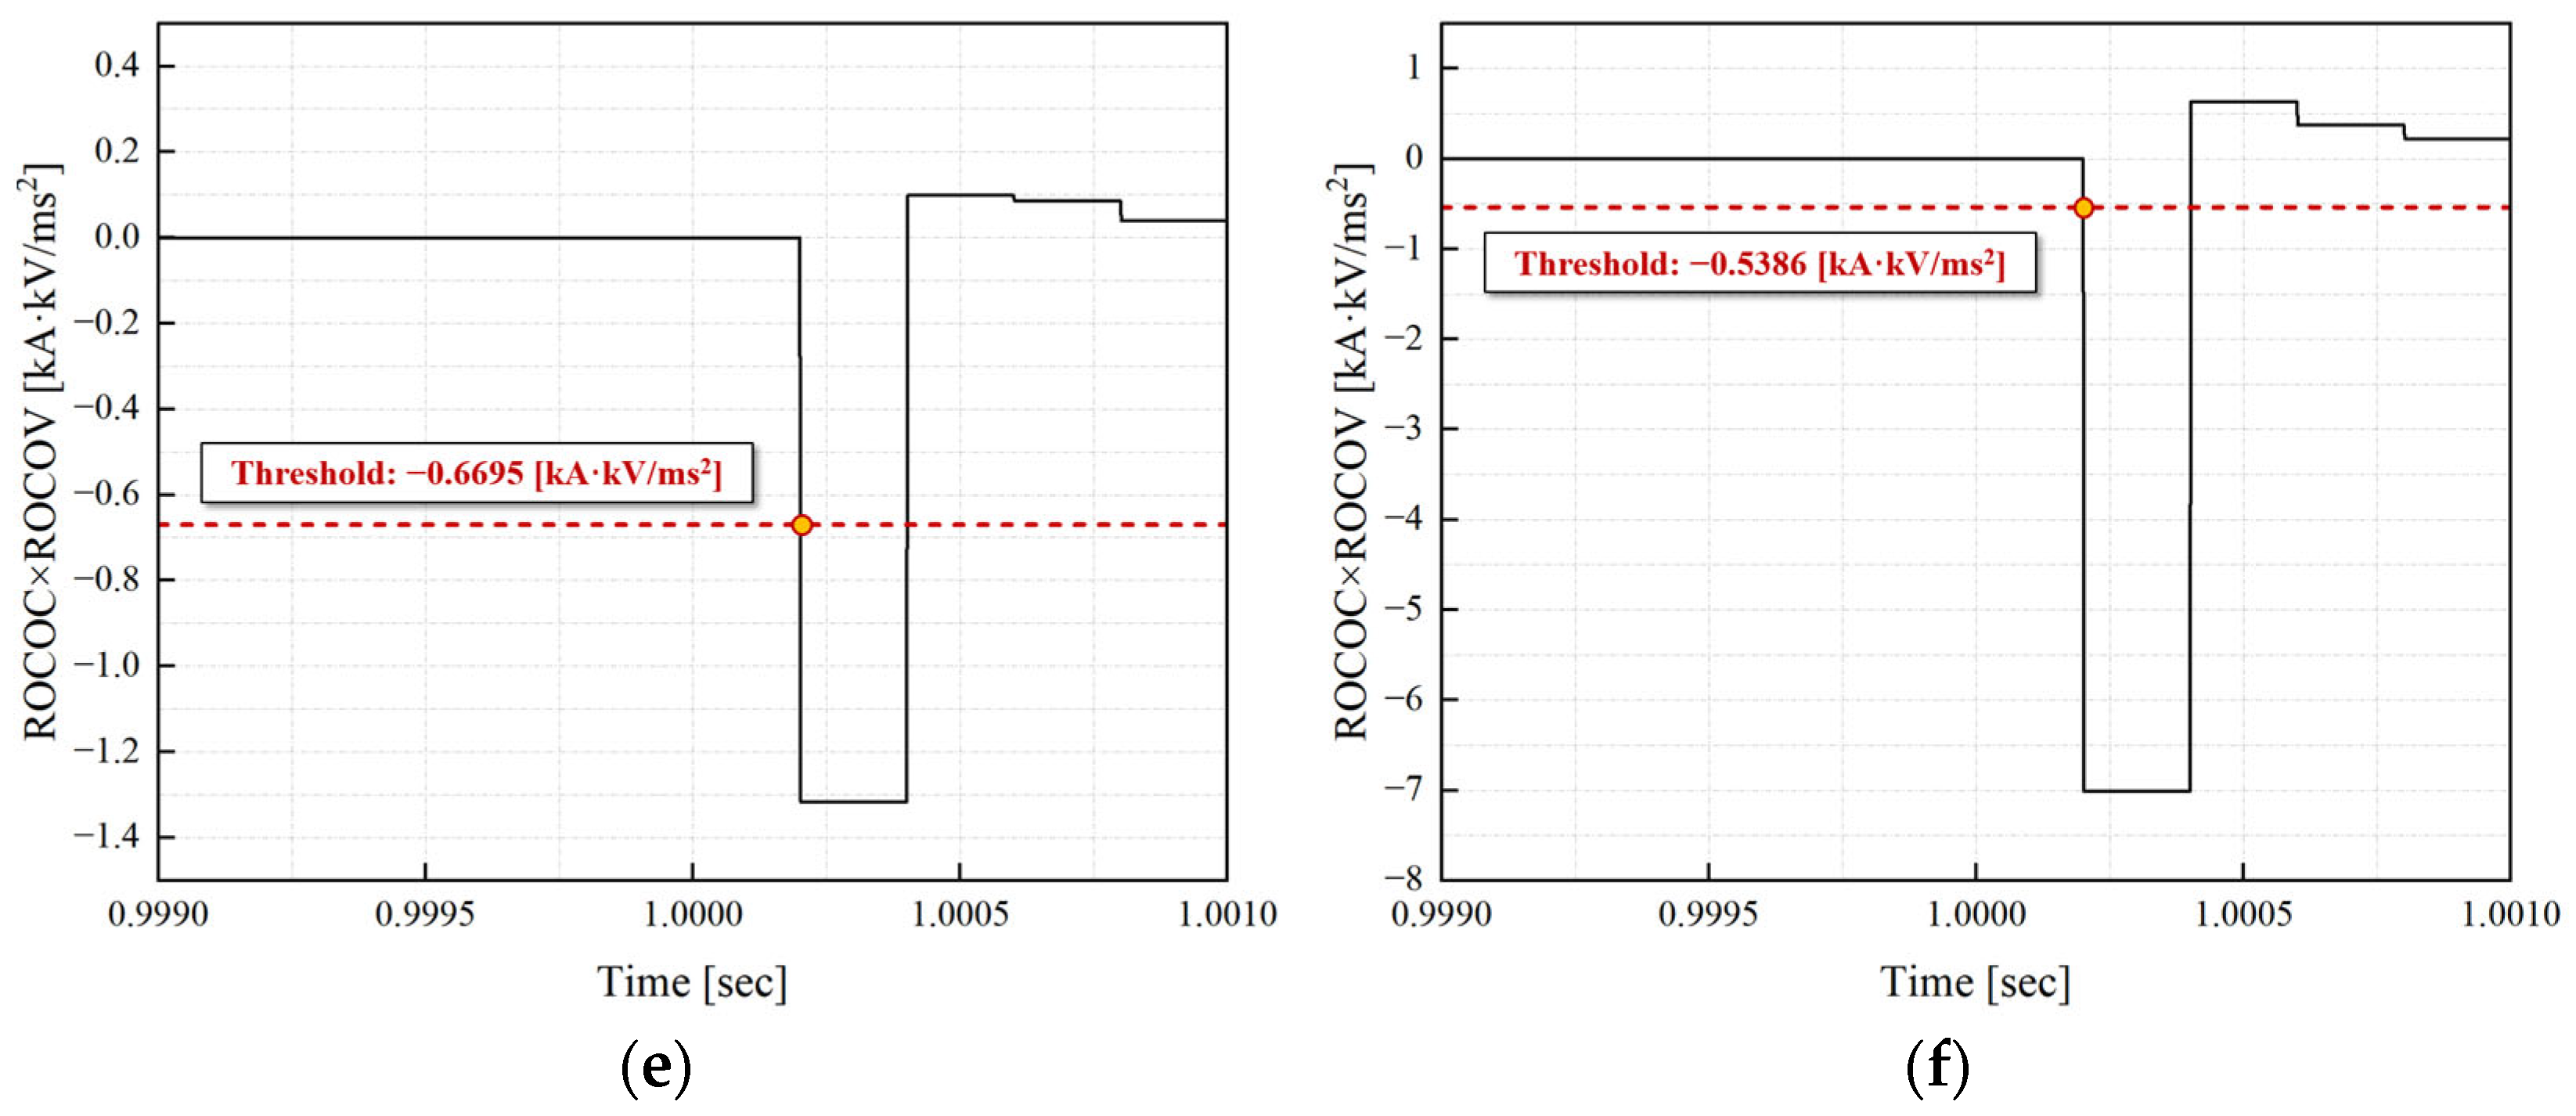
Figure 5 illustrates the performance of the protection strategy for a pole-to-pole fault near Bus 13. This fault scenario corresponds to the most critical external fault for the relay located at Bus A. Therefore, the relay located at Bus A should withhold operation, while the relay at Bus B should operate in response to the fault.
The positive and negative pole voltages dropped simultaneously at Bus A and Bus B. The relay located at Bus A measured a current drop, resulting in a positive sign of the ROCOC × ROCOV. Therefore, the relay located at Bus A did not operate for the external fault, achieving selectivity. The threshold of fault detection scheme for the protective relay located at Bus B was set to −0.5386 kA·kV/ms2, and ROCOC × ROCOV reached at 202 us, exceeding the threshold.
4.2.2. The Performance of the Protection Strategy in the Multi-Terminal Topology
Figure 6 illustrates the protection zone of the relay at Bus A for the scenario where Bus 5 and Bus 33 are connected by the tie-switch. The protection zone of the relay at Bus A extends from Bus A to Bus D, sharing the same protection zone with the relay located at Bus D. Therefore, under this scenario, the relays located at Bus A and Bus D communicate their respective responses and operate only for internal faults.
Figure 7 illustrates the performance of the protection strategy for a positive pole-to-ground fault near Bus D in the multi-terminal MVDC distribution network. The fault location was located 8.691 km from the protective relay located at Bus A. The permanent fault with a resistance of 5 Ω occurred at 1 s.
If a positive pole-to-ground fault occurs near Bus D, the relays located at Bus A and Bus D measure similar transient currents and voltages. The relay located at Bus D, which is closer to the fault location, detects the fault within 202 us, while the relay located at Bus A detects it within 202 us. At 202 us, after mutual verification, both relays located at Bus A and Bus D operated. These results demonstrate that the proposed protection strategy can successfully detect internal faults, achieving speed and sensitivity in the multi-terminal MVDC distribution networks.
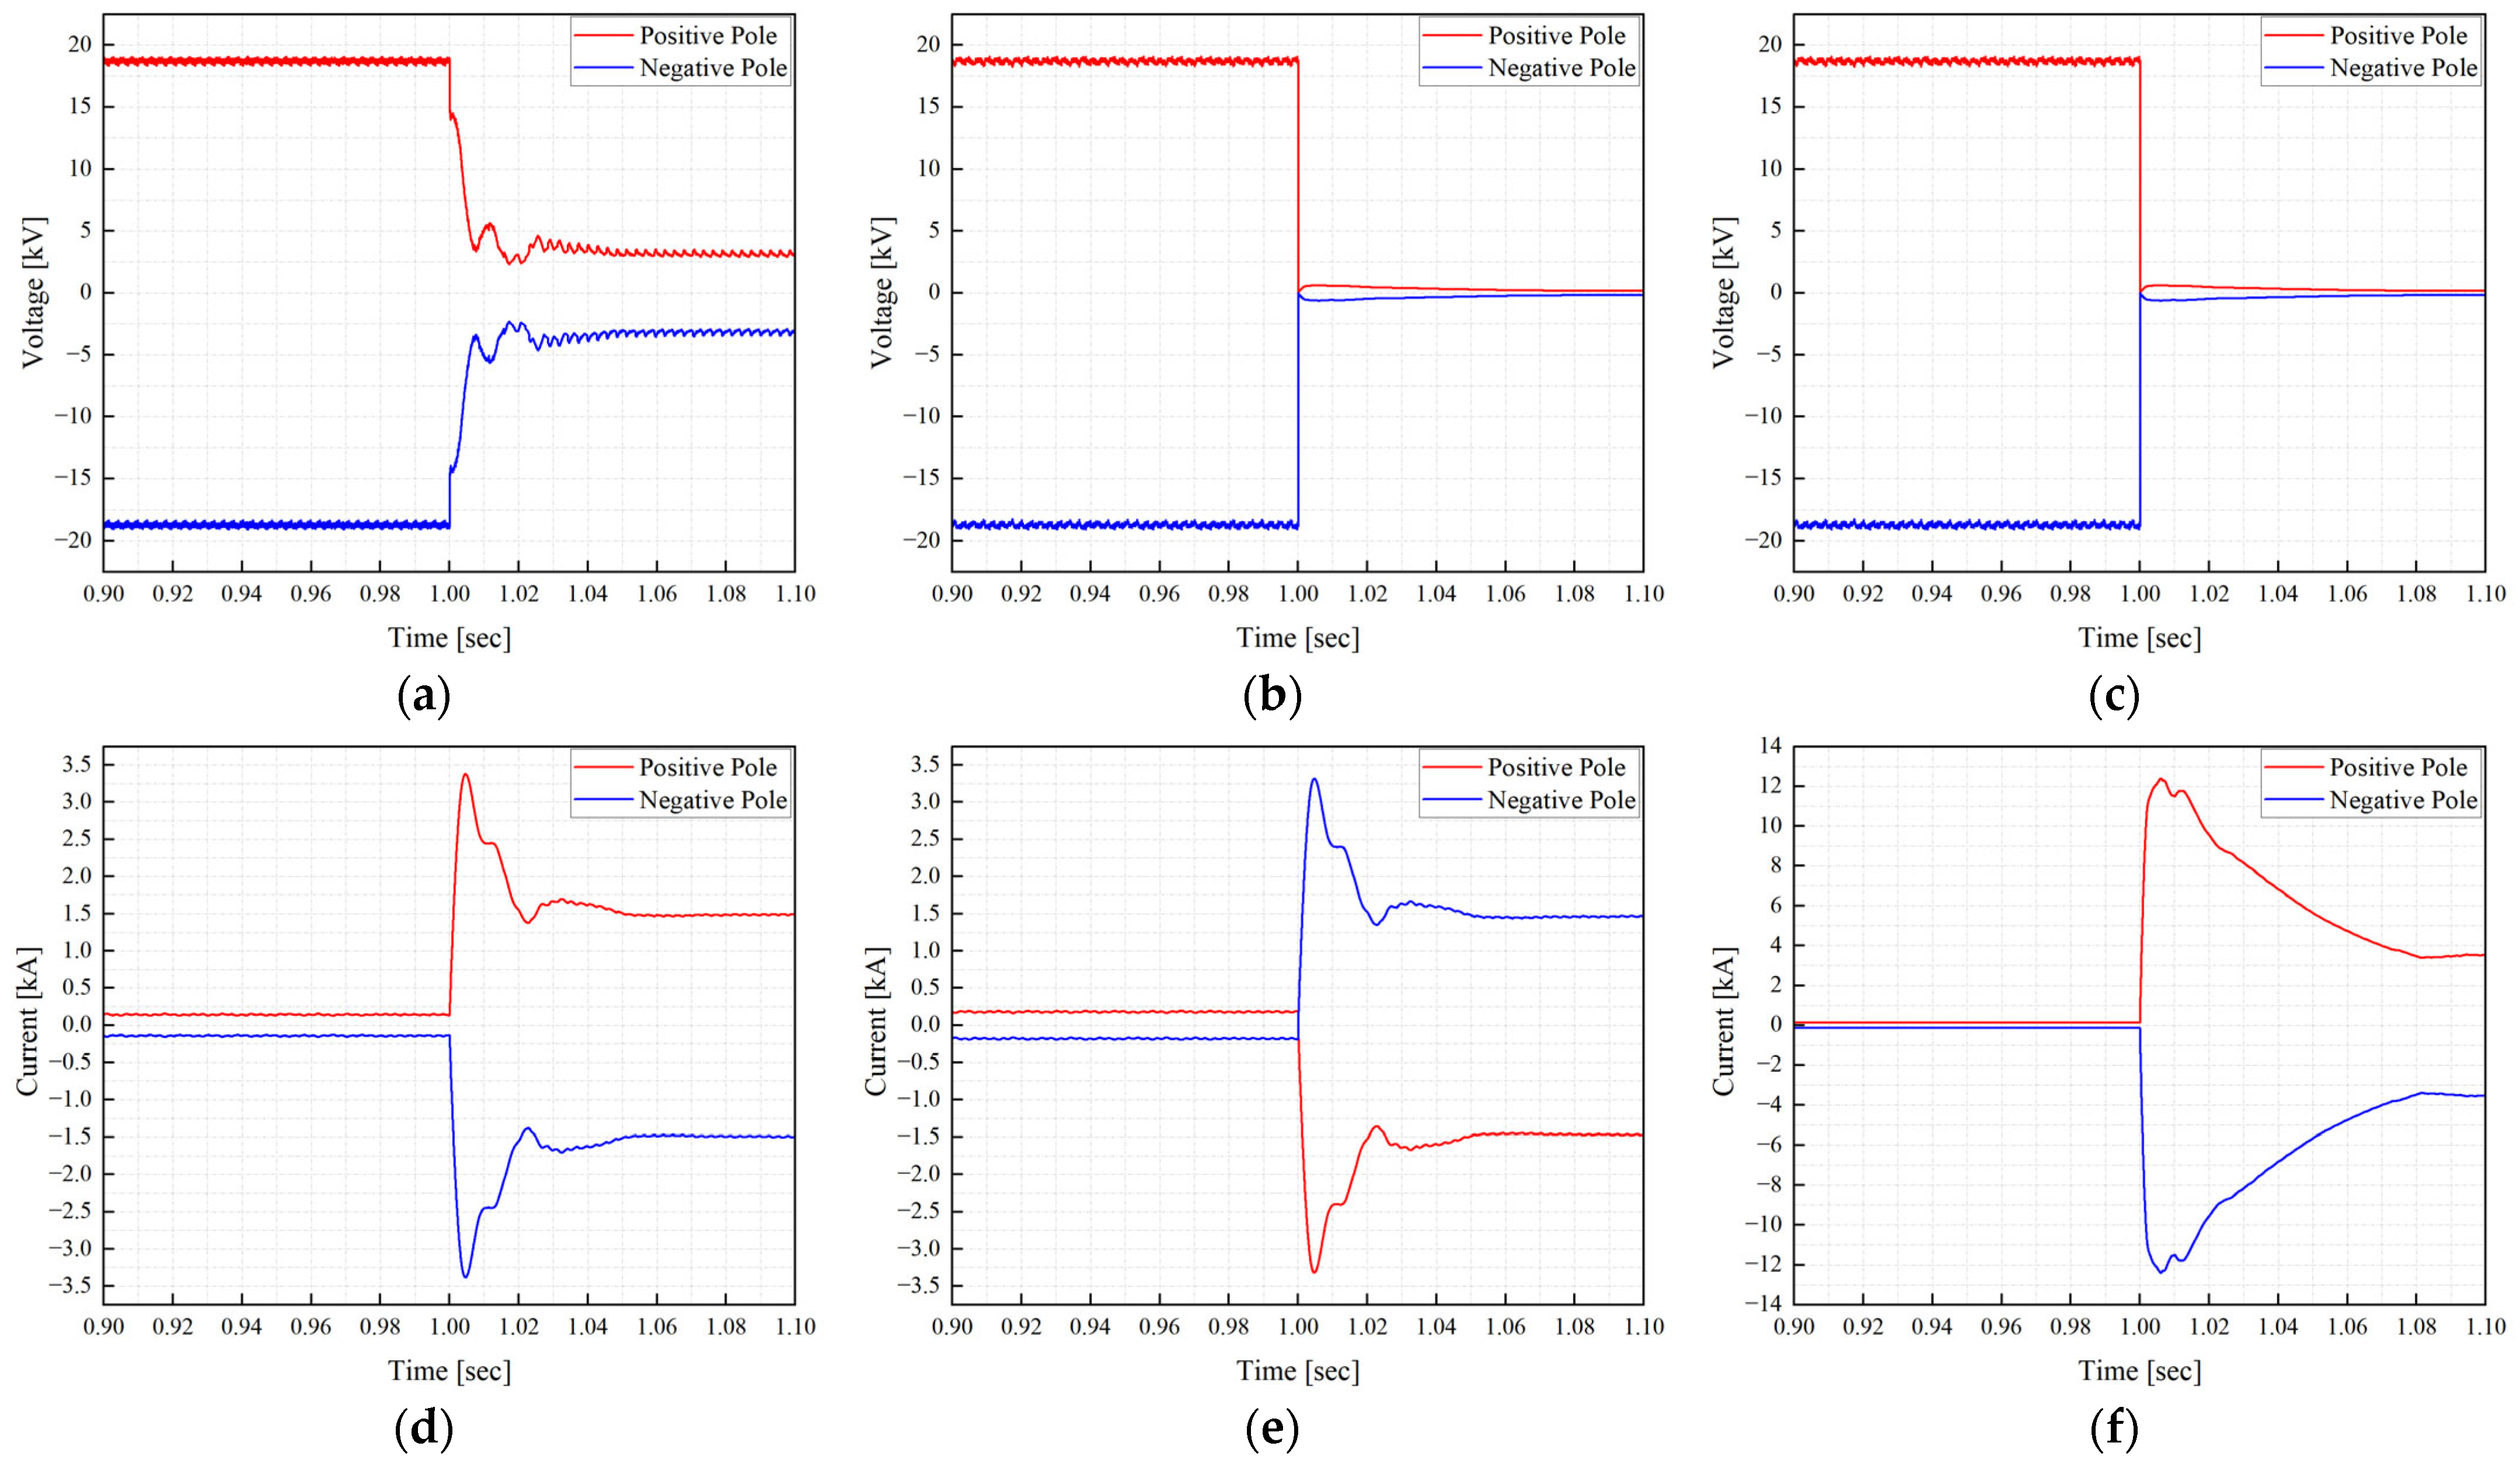
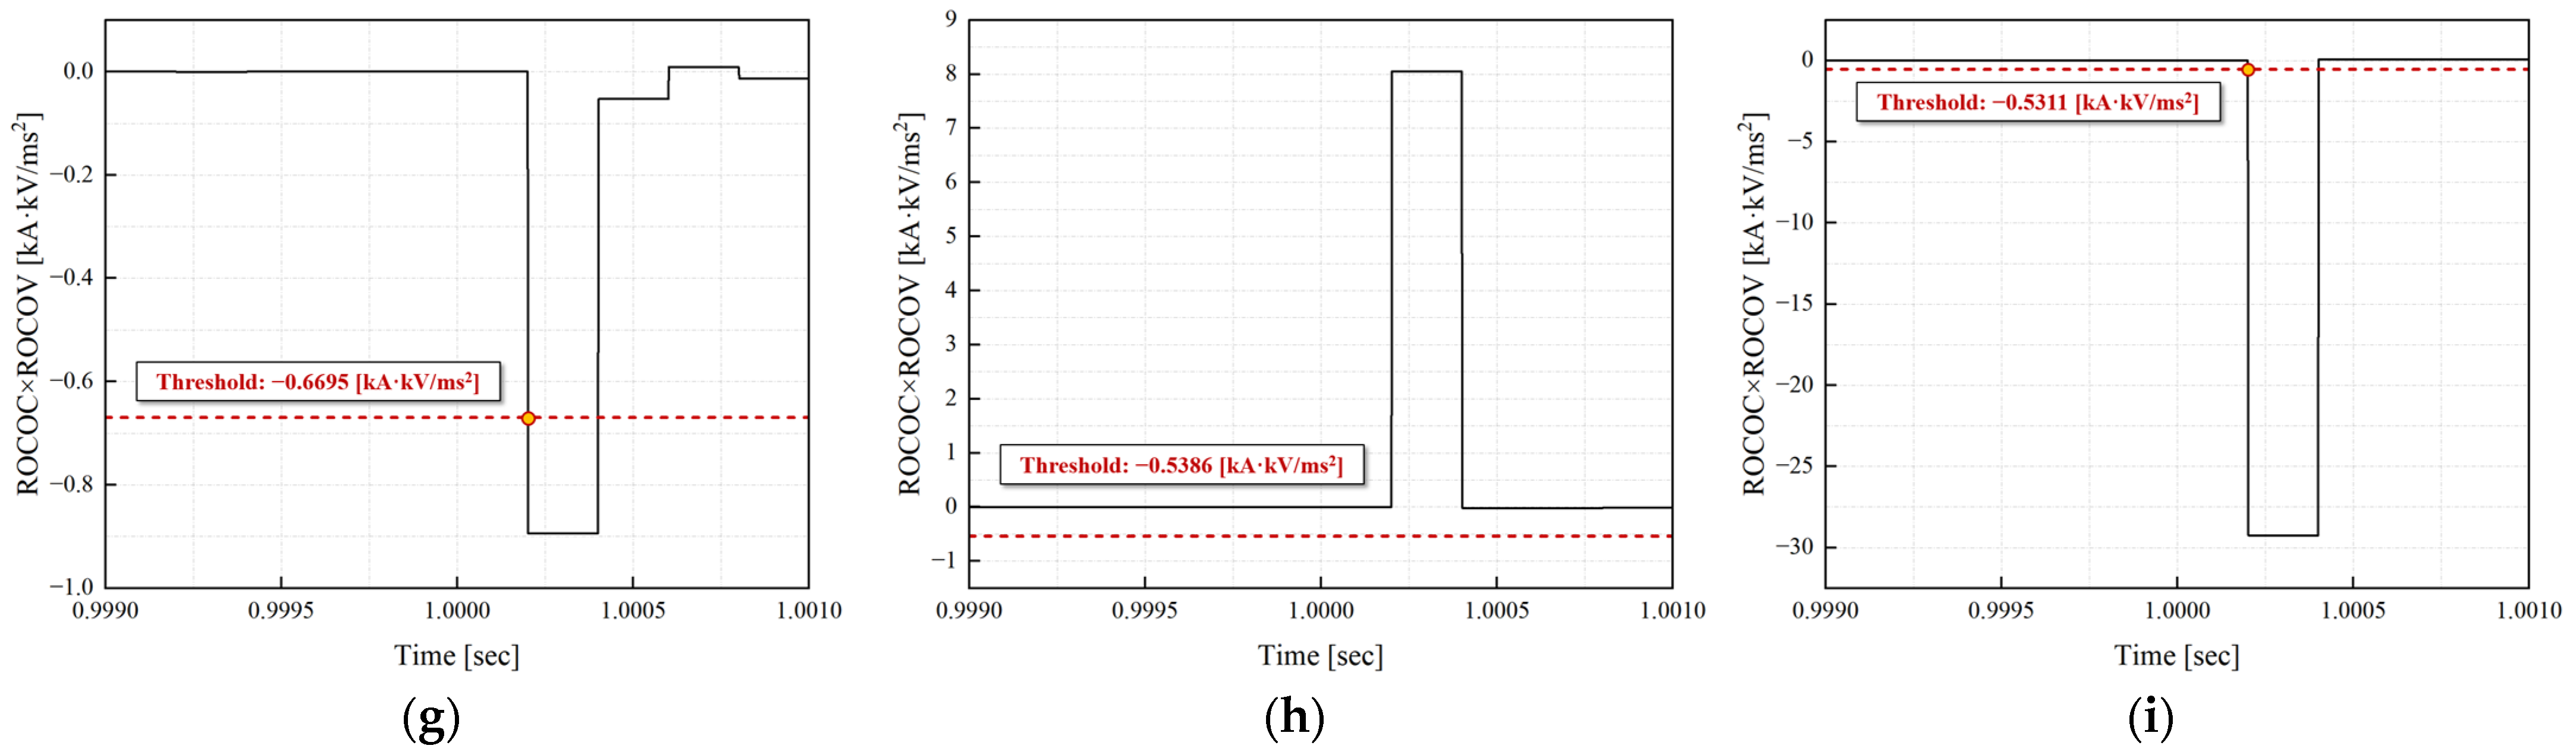
Figure 8 illustrates the performance of the protection strategy for an external pole-to-pole fault near Bus E in the multi-terminal MVDC distribution network. This fault scenario corresponds to the most critical external fault for the relay located at Bus A, as it presents transient currents and voltages similar to an internal fault. The permanent fault with a resistance of 0.1 Ω occurred at 1 s.
If a positive pole-to-pole fault occurs near Bus D, the relays located at Bus A measured transient current and voltage characteristics similar to those of internal faults and, and the ROCOC × ROCOV-based protection scheme exceeded the predefined threshold. In multi-terminal MVDC distribution networks, these results demonstrate the limited selectivity of non-unit protection schemes. To enhance selectivity under such scenarios, communication was introduced. For a fault at Bus E, the relay located at Bus D determined it as an external fault. Consequently, the relay located at Bus A received this response from the relay at Bus D, which shares the same protection zone, and withheld its operation.
Figure 9 illustrates the protection zone of the relay at Bus A for the scenario where Bus 7 and Bus 38 are connected by the tie-switch. The protection zone of the relay at Bus A extends from Bus A to Bus E.
Figure 10 illustrates the performance of the protection strategy for an internal positive pole-to-ground fault near Bus E in the multi-terminal MVDC distribution network. The fault location was located 9.467 km from the protective relay located Bus A. The fault scenario corresponds to the fault with the highest fault resistance in the MVDC distribution network, as measured by the relay located at Bus A.
The relay located at Bus A detected the fault within 202 us under the highest fault resistance fault conditions in the multi-terminal MVDC distribution networks. These results demonstrate that the proposed protection strategy can successfully detect internal faults, achieving speed and sensitivity in the multi-terminal MVDC distribution networks. In addition, these results demonstrated the reliability of threshold setting without the need for large-scale simulations.
Figure 11 illustrates the performance of the protection strategy for an external pole-to-pole fault near Bus D.
For an external fault at Bus D, the relay located at Bus A measured transient current and voltage characteristics similar to those of internal faults. However, the relay located at Bus E determined the fault as external, thereby preventing misoperation. These results demonstrate that the proposed protection strategy can successfully determine internal faults through communication, achieving selectivity in the multi-terminal MVDC distribution networks.
5. Discussion and Future Plan
The proposed protection strategy has demonstrated performance in both radial and multi-terminal MVDC distribution networks. By integrating the ROCOC × ROCOV-based fault detection scheme and the |Vp/Vn|-based fault identification scheme, the strategy ensures fast, sensitivity, and selectivity protection. The ROCOC × ROCOV-based protection scheme addresses the respective limitations of the widely used ROCOC- and ROCOV-based protection schemes in DC grids. Furthermore, the limited selectivity of non-unit protection schemes in multi-terminal topologies was addressed through communication. Without such communication, large-scale simulations are required to analyze every network reconfiguration. As MVDC distribution networks expand, such large-scale simulations become increasingly impractical. Therefore, this study proposed a threshold-setting using quantified values without large-scale simulations. However, the proposed strategy still faces some limitations. While communication enhances selectivity in multi-terminal topologies, it can introduce delays and require high communication reliability. Moreover, this study focused on single fault events to evaluate the performance of the proposed protection strategy. Future research will focus to address simultaneous faults occurring at multiple locations.
6. Conclusions
This paper proposed a protection strategy for MVDC distribution networks considering network reconfiguration. The strategy consists of a fault detection scheme and a fault identification scheme. The ROCOC × ROCOV-based fault detection scheme ensures fast and sensitive detection by capturing transient behaviors of both voltage and current. Its sign provides selectivity between internal and external faults in radial topologies. In multi-terminal MVDC distribution networks, communication between relays sharing the same protection zone was introduced to enhance selectivity, allowing only relays responding to internal faults to operate. The fault identification scheme based on |Vp/Vn| accurately determined the fault type using the behavior of the healthy line. All thresholds were set using quantified values within a predefined time, without relying on large-scale simulations. The protection strategy was modeled and evaluated in a 37.4 kV MVDC distribution network connected to the 22.9 kV AC distribution network in Korea. Simulation results confirmed effective performance under various fault types, locations, and resistances. In both radial and multi-terminal topologies, the strategy achieved a fault detection time of 202 us and maintained selectivity through ROCOC × ROCOV response and relay coordination. These results demonstrate that the proposed strategy can contribute to the stable operation of MVDC distribution networks under a wide range of operating conditions.
Author Contributions
Conceptualization and methodology, N.-G.P.; Software, N.-G.P. and J.-I.L.; Validation, J.-I.L., B.-S.G., S.-J.L., C.K. and M.-C.D.; Investigation, N.-G.P.; Writing—original draft, N.-G.P.; Writing—review and editing, N.-G.P., C.K. and M.-C.D.; Project administration, J.-I.L. and M.-C.D.; Supervision, C.K. and M.-C.D. All authors have read and agreed to the published version of the manuscript.
Funding
This work was supported by the Korea Institute of Energy Technology Evaluation and Planning (KETEP) grant funded by the Korea government (MOTIE) (20225500000060, Operation System for AC/DC Hybrid Distribution Network).
Data Availability Statement
The original contributions presented in the study are included in the article, further inquiries can be directed to the corresponding author.
Conflicts of Interest
The authors declare no conflicts of interest.
References
- Hassan, S.J.U.; Mehdi, A.; Haider, Z.; Song, J.-S.; Abraham, A.D.; Shin, G.-S.; Kim, C.-H. Towards medium voltage hybrid AC/DC distribution Systems: Architectural Topologies, planning and operation. Electr. Power Energy Syst. 2024, 159, 110003. [Google Scholar] [CrossRef]
- Bathurst, G.; Hwang, G.; Tejwani, L. MVDC—The New Technology for Distribution Networks. In Proceedings of the 11th IET International Conference on AC and DC Power Transmission, Birmingham, UK, 10–12 February 2015; pp. 1–6. [Google Scholar]
- Mesas, J.J.; Monjo, L.; Sainz, L.; Pedra, J. Study of MVDC system benchmark networks. IEEE Trans. Power Deliv. 2015, 30, 235–240. [Google Scholar]
- Monadi, M.; Zamani, M.A.; Candela, J.I.; Luna, Á.; Rodriguez, P. Protection of AC and DC distribution systems Embedding distributed energy resources: A comparative review and analysis. Renew. Sustain. Energy Rev. 2015, 51, 1578–1593. [Google Scholar] [CrossRef]
- Alsaidan, A.M.; Abusara, M.A.; Sharkh, S.M. MVDC Distribution Grids and Potential Applications: Future Trends and Protection Challenges. In Proceedings of the 2018 IEEE International Conference on Smart Energy Grid Engineering (SEGE), Oshawa, ON, Canada, 12–15 August 2018; pp. 1–6. [Google Scholar]
- Shi, W.; Shuai, Y.; Yue, Z.; Dong, Z.; Lin, J. Implementation of the differential protection for MVDC distribution systems using real-time simulation and hardware-in-the-loop. IEEE Trans. Power Deliv. 2015, 30, 1234–1242. [Google Scholar]
- Li, M.; Luo, Y.; Jia, K.; Bi, T.; Yang, Q. Frequency-based current differential protection for VSC-MVDC distribution lines. Int. J. Electr. Power Energy Syst. 2020, 117, 105626. [Google Scholar] [CrossRef]
- Hunter, L.C.; Booth, C.D.; Egea-Alvarez, A.; Dyśko, A.; Finney, S.J.; Junyent-Ferré, A. A New Fast-Acting Backup Protection Strategy for Embedded MVDC Links in Future Distribution Networks. IEEE Trans. Power Deliv. 2021, 36, 861–869. [Google Scholar] [CrossRef]
- Pérez-Molina, M.J.; Larruskain, D.M.; Eguía, P.; Valverde, V. Local Derivativebased Fault Detection for HVDC Grids. IEEE Trans. Ind. Appl. 2022, 58, 1521–1528. [Google Scholar] [CrossRef]
- Zeng, Y.; Zou, G.; Wei, X.; Sun, C.; Jiang, L. A Novel Protection and Location Scheme for Pole-to-Pole Fault in MMC-MVDC Distribution Grid. Energies 2018, 11, 2076. [Google Scholar] [CrossRef]
- Meghwani, A.; Srivastava, S.C.; Chakrabarti, S. A Non-unit Protection Scheme for DC Microgrid Based on Local Measurements. IEEE Trans. Power Deliv. 2017, 32, 172–181. [Google Scholar] [CrossRef]
- Coffey, S.; Timmers, V.; Li, R.; Wu, G.; Egea-Àlvarez, A. Review of MVDC Applications, Technologies, and Future Prospects. Energies 2021, 14, 8294. [Google Scholar] [CrossRef]
- Blázquez, A.; Pérez-Molina, M.J.; Larruskain, D.M.; Iturregi, A.; Eguia, P. Fault Detection Algorithms in Medium-Voltage Direct-Current (MVDC) Grids. Appl. Sci. 2024, 14, 11052. [Google Scholar] [CrossRef]
- Pérez Molina, M.J.; Larruskain Escobal, D.M.; Eguia Lopez, P.; Valverde Santiago, V. Fault detection based on ROCOV and ROCOC for multi-terminal HVDC systems. In Proceedings of the 2020 IEEE Power & Energy Society General Meeting (PESGM), Montreal, QC, Canada, 2–6 August 2020; pp. 506–511. [Google Scholar]
- Chen, M.; Luo, L.; Wu, R.; Wang, H.; Gao, H.; Liu, J. Research on Grouping Strategy of Feeders in Distribution Network Considering the Importance Degree of Tie Switches. In Proceedings of the 2024 3rd International Conference on Power Systems and Electrical Technology (PSET), Tokyo, Japan, 5–8 August 2024; pp. 254–259. [Google Scholar]
- Huang, X.; Qi, L.; Pan, J. A New Protection Scheme for MMCbased MVdc Distribution Systems With Complete Converter Fault Current Handling Capability. IEEE Trans. Ind. Appl. 2019, 55, 3601–3610. [Google Scholar] [CrossRef]
- Vozikis, D.; Alsokhiry, F.; Adam, G.P.; Al-Turki, Y. Novel Enhanced Modular Multilevel Converter for High-Voltage Direct Current Transmission Systems. Energies 2020, 13, 2257. [Google Scholar] [CrossRef]
- Fan, N.; Shen, B.; Zhang, J. Simulation Research on Grounding Mode of Modular Multilevel Converter Based Medium Voltage DC Distribution System. In Proceedings of the 2021 3rd Asia Energy and Electrical Engineering Symposium (AEEES), Chengdu, China, 26–28 March 2021; pp. 123–128. [Google Scholar]
- Sera, D.; Mathe, L.; Kerekes, T.; Spataru, S.V.; Teodorescu, R. An Enhanced P&O MPPT Algorithm for PV Systems with Fast Dynamic and Steady-State Response under Real Irradiance and Temperature Conditions. IEEE J. Photovolt. 2013, 3, 1070–1078. [Google Scholar]
- Perez-Molina, M.J.; Larruskain, D.M.; Lopez, P.E.; Abarrategi, O.; Santos-Mugica, M. A Comparison of Non-Unit and Unit Protection Algorithms for HVDC Grids. In Proceedings of the 2019 IEEE Milan PowerTech, Milan, Italy, 23–27 June 2019; pp. 1–6. [Google Scholar]
- Ma, R.; Li, W.; Ren, X. Non-unit Protection Method for Long Transmission Lines in MTDC Grids. IET Gener. Transm. Distrib. 2020, 14, 1060–1068. [Google Scholar]
- Nasr, A.; Osman, A.H.; El-Saadany, E.F. Protection of Multi-Terminal HVDC Grids: A Comprehensive Review. Energies 2022, 15, 2612. [Google Scholar] [CrossRef]
- Gopal, G.; Swarup, K.S. A Pilotbased Unit Protection Scheme for Meshed Microgrids Using Communication Infrastructure. Int. J. Electr. Power Energy Syst. 2021, 127, 106646. [Google Scholar]
- Muniappan, M. A comprehensive review of DC fault protection methods in HVDC transmission systems. Prot. Control Mod. Power Syst. 2021, 6, 1. [Google Scholar] [CrossRef]
- Xiang, W.; Yang, S.; Adam, G.P.; Zhang, H.; Zuo, W.; Wen, J. DC Fault Protection Algorithms of MMC-HVDC Grids: Fault Analysis, Methodologies, Experimental Validations, and Future Trends. IEEE Trans. Power Electron. 2021, 36, 11245–11261. [Google Scholar] [CrossRef]
- CIGRÉ Working Group B4.60. Designing HVDC Grids for Optimal Reliability and Availability Performance; CIGRÉ Technical Brochure No. 713; CIGRÉ: Paris, France, 2017. [Google Scholar]
Figure 1.
Configuration of the MVDC distribution network.
Figure 1.
Configuration of the MVDC distribution network.
Figure 2.
Protection strategy for the MVDC distribution networks.
Figure 2.
Protection strategy for the MVDC distribution networks.
Figure 3.
Performance of the protection strategy for a pole-to-pole fault (a) voltage; (b) current; (c) ROCOC × ROCOV; (d) fault detection; (e) ; (f) fault identification.
Figure 3.
Performance of the protection strategy for a pole-to-pole fault (a) voltage; (b) current; (c) ROCOC × ROCOV; (d) fault detection; (e) ; (f) fault identification.
Figure 4.
Performance of the protection strategy for a positive pole-to-ground fault (a) voltage; (b) current; (c) ROCOC × ROCOV; (d) fault detection; (e) ; (f) fault identification.
Figure 4.
Performance of the protection strategy for a positive pole-to-ground fault (a) voltage; (b) current; (c) ROCOC × ROCOV; (d) fault detection; (e) ; (f) fault identification.
Figure 5.
Performance of the protection strategy for an external pole-to-pole fault near Bus B (a) voltage at Bus A; (b) voltage at Bus B; (c) current at Bus A; (d) current at Bus B; (e) ROCOC × ROCOV at Bus A; (f) ROCOC × ROCOV at Bus B.
Figure 5.
Performance of the protection strategy for an external pole-to-pole fault near Bus B (a) voltage at Bus A; (b) voltage at Bus B; (c) current at Bus A; (d) current at Bus B; (e) ROCOC × ROCOV at Bus A; (f) ROCOC × ROCOV at Bus B.
Figure 6.
The scenario where Bus 5 and Bus 33 are connected by the tie-switch.
Figure 6.
The scenario where Bus 5 and Bus 33 are connected by the tie-switch.
Figure 7.
Performance of the protection strategy for a positive pole-to-ground fault (a) voltage at Bus A; (b) voltage at Bus D; (c) current at Bus A; (d) current at Bus D; (e) ROCOC × ROCOV at Bus A; (f) ROCOC × ROCOV at Bus D.
Figure 7.
Performance of the protection strategy for a positive pole-to-ground fault (a) voltage at Bus A; (b) voltage at Bus D; (c) current at Bus A; (d) current at Bus D; (e) ROCOC × ROCOV at Bus A; (f) ROCOC × ROCOV at Bus D.
Figure 8.
Performance of the protection strategy for an external pole-to-pole fault near Bus E (a) voltage at Bus A; (b) voltage at Bus D; (c) voltage at Bus E; (d) current at Bus A; (e) current at Bus D; (f) current at Bus E; (g) ROCOC × ROCOV at Bus A; (h) ROCOC × ROCOV at Bus D; (i) ROCOC × ROCOV at Bus E.
Figure 9.
The scenario where Bus 7 and Bus 38 are connected by the tie-switch.
Figure 9.
The scenario where Bus 7 and Bus 38 are connected by the tie-switch.
Figure 10.
Performance of the protection strategy for an positive pole-to-ground fault near Bus E (a) voltage at Bus A; (b) current at Bus A; (c) ROCOC × ROCOV at Bus A.
Figure 10.
Performance of the protection strategy for an positive pole-to-ground fault near Bus E (a) voltage at Bus A; (b) current at Bus A; (c) ROCOC × ROCOV at Bus A.
Figure 11.
Performance of the protection strategy for an external pole-to-pole fault near Bus D (a) voltage at Bus A; (b) current at Bus A; (c) ROCOC × ROCOV at Bus A; (d) voltage at Bus E; (e) current at Bus E; (f) ROCOC × ROCOV at Bus E.
Figure 11.
Performance of the protection strategy for an external pole-to-pole fault near Bus D (a) voltage at Bus A; (b) current at Bus A; (c) ROCOC × ROCOV at Bus A; (d) voltage at Bus E; (e) current at Bus E; (f) ROCOC × ROCOV at Bus E.
Table 1.
Parameters of the MVDC distribution network.
Table 1.
Parameters of the MVDC distribution network.
| Parameters | Specifications |
|---|
| Topology of VSC | Half-bridge MMC |
| System configuration | Symmetric monopole |
| Rated DC voltage | 37.4 kV (±18.7 kV) |
| Rated AC voltage | 22.9 kV (L-L RMS) |
| Frequency | 60 Hz |
| Short circuit ratio | 5 |
| Rated capacity of PV power plant | 1 MW |
| Rated capacity of ESS | 1.5 MW/1.5 MWh |
| Maximum DC loads | 35.9 MW |
| Distribution line | ACSR 160 mm2 |
Table 2.
Parameters of the 21-level HB-MMC.
Table 2.
Parameters of the 21-level HB-MMC.
| Parameter | Specification |
|---|
| Topology of submodule | Half-bridge |
| Apparent power | 20 MVA |
| Rated DC voltage | 37.4 kV (±18.7 kV) |
| Rated AC voltage | 22.9 kV (L-L RMS) |
| Frequency | 60 Hz |
| Number of submodules per arm | 20 EA |
| Rated voltage of submodule capacitor | 1.87 kV |
| Submodule capacitance | 2000 uF |
| Arm inductance | 10 mH |
Table 3.
Parameters of the PV module under standard test conditions.
Table 3.
Parameters of the PV module under standard test conditions.
| Parameter | Value |
|---|
| Current at the maximum power point | 2.2 A |
| Voltage at the maximum power point | 24 V |
| Maximum power | 52.8 W |
| Short-circuit current | 2.5 A |
| Open-circuit voltage | 29 V |
Table 4.
Parameters of the 1.5 MWh/1.5 MW ESS.
Table 4.
Parameters of the 1.5 MWh/1.5 MW ESS.
| Parameter | Value |
|---|
| Type | Lithium-ion battery |
| Total energy capacity | 1.5 MWh |
| Rated power capacity | 1.5 MW (1 C rate) |
| Nominal cell voltage | 3.7 V |
| Nominal rack voltage | 1110 V |
| Rated current | 1351 A |
Table 5.
The sign of ROCOC × ROCOV between internal and external faults.
Table 5.
The sign of ROCOC × ROCOV between internal and external faults.
| Fault Location | Sign of ROCOC × ROCOV |
|---|
| Internal fault | (−) |
| External fault | (+) |
Table 6.
Verification of the internal fault through communication.
Table 6.
Verification of the internal fault through communication.
| Bus A | Bus D | Detection |
|---|
| 1 | 0 | 0 |
| 0 | 1 | 0 |
| 1 | 1 | 1 |
Table 7.
|Vp/Vn| for different fault types in the absence of measurement noise.
Table 7.
|Vp/Vn| for different fault types in the absence of measurement noise.
| Fault Type | |Vp/Vn| |
|---|
| Pole-to-pole fault | =1 |
| Pole-to-ground fault (positive pole) | >1 |
| Pole-to-ground fault (negative pole) | <1 |
Table 8.
Thresholds of the |Vp/Vn|-based protection scheme.
Table 8.
Thresholds of the |Vp/Vn|-based protection scheme.
| Fault Type | |Vp/Vn| |
|---|
| Pole-to-pole fault | (1 − k) < |Vp/Vn| < (1 + k) |
| Pole-to-ground fault (positive pole) | |Vp/Vn| < (1 − k) |
| Pole-to-ground fault (negative pole) | (1 + k) < |Vp/Vn| |
Table 9.
Threshold settings of the relays located at Bus A, Bus B, Bus D, and Bus E.
Table 9.
Threshold settings of the relays located at Bus A, Bus B, Bus D, and Bus E.
| Bus | Rated Current | ROCOC | ROCOV | ROCOC × ROCOV |
|---|
| A | 0.179 kA | 0.179 kA/ms | −3.74 kV/ms | kV/ms2 |
| B | 0.144 kA | 0.144 kA/ms | −3.74 kV/ms | kV/ms2 |
| D | 0.144 kA | 0.144 kA/ms | −3.74 kV/ms | kV/ms2 |
| E | 0.142 kA | 0.142 kA/ms | −3.74 kV/ms | kV/ms2 |
Table 10.
Threshold settings of |Vp/Vn|-based fault identification scheme.
Table 10.
Threshold settings of |Vp/Vn|-based fault identification scheme.
| Fault Type | |Vp/Vn| |
|---|
| Pole-to-pole fault | 0.8 < |Vp/Vn| < 1.2 |
| Pole-to-ground fault (positive pole) | |Vp/Vn| < 0.8 |
| Pole-to-ground fault (negative pole) | 1.2 < |Vp/Vn| |
| Disclaimer/Publisher’s Note: The statements, opinions and data contained in all publications are solely those of the individual author(s) and contributor(s) and not of MDPI and/or the editor(s). MDPI and/or the editor(s) disclaim responsibility for any injury to people or property resulting from any ideas, methods, instructions or products referred to in the content. |
© 2025 by the authors. Licensee MDPI, Basel, Switzerland. This article is an open access article distributed under the terms and conditions of the Creative Commons Attribution (CC BY) license (https://creativecommons.org/licenses/by/4.0/).

 ,
, 

