Article

Can New Quality Productivity Drive the Low-Carbon Transformation of Carbon-Intensive Industries? Macro and Micro Evidence from China

by
Hui Wang
1,2,
Jie Zhou
1,
Kuiying Gu
3,4 and
Feng Dong
5,*
1
School of Economics and Management, Leshan Normal University, Leshan 614000, China
2
Western Experimental Research Base of Development Economics of China, Leshan 614000, China
3
School of Public Health, Soochow University, Suzhou 215021, China
4
Institute for Healthy China, Tsinghua University, Beijing 100084, China
5
School of Economics and Management, Yanshan University, Qinhuangdao 066000, China
*
Author to whom correspondence should be addressed.
Energies 2025, 18(13), 3278; https://doi.org/10.3390/en18133278
Submission received: 8 May 2025 / Revised: 7 June 2025 / Accepted: 17 June 2025 / Published: 23 June 2025
(This article belongs to the Section C: Energy Economics and Policy)

Abstract

Reducing carbon dioxide emissions within carbon-intensive industries is a critical strategy to effectively combat global warming. The accelerated cultivation and enhancement of new quality productivity has created new momentum directed towards industrial low-carbon transformation. Using data from a sample of Chinese provinces and enterprises between 2011 and 2022, this study quantifies, evaluates, and explores the influence and mechanisms of new quality productivity on the low-carbon transformation of carbon-intensive industries. The research findings show that: (1) Fostering new quality productivity effectively promotes the low-carbon transformation of carbon-intensive industries and plays a positive, empowering role. Industrial innovation, digital stimulation, technological innovation, and green empowerment all support the low-carbon transformation of carbon-intensive industries, with their respective impacts gradually decreasing in turn. (2) Mechanism analysis confirms a chain transmission mechanism of “new quality productivity—environmental protection investment—green innovation—the transformation of carbon-intensive industries” at the macro-provincial level. In micro-level carbon-intensive enterprises, a positive U-shaped relationship between new quality productivity and low-carbon transformation of carbon-intensive industries is evident, and the main pathways include increasing low-carbon, energy-saving investment and improving the ESG performance of high-carbon emission enterprises. (3) Advancing transformation is more pronounced in central and western areas, high-carbon areas, non-carbon trading pilot areas, and non-energy-rich ecologically fragile areas. The government and enterprises should take advantage of the development opportunities of new quality productivity and adopt low-carbon behaviors to promote transformational development.

1. Introduction

Increasing carbon emissions is one of the key drivers of climate change [1]. It is a priority issue and challenge for all countries to address in global climate and environmental governance [2], as it may exacerbate external governance risks and uncertainties [3]. The synergy between carbon market policies and macro policies, as well as digital development, is conducive to promoting economic and environmental compatibility [4,5]. Since China became the country with the largest carbon emissions in 2007, it has faced the daunting task of controlling carbon emissions [6]. Carbon emission reduction initiatives and their effectiveness in China have also attracted increasing global attention [7]. China quickly put into practice the Paris Agreement and introduced carbon governance policies such as low-carbon city pilot projects, carbon emissions trading, and carbon reduction targets, achieving positive effects in curbing carbon emissions [8,9,10]. In September 2020, China proposed the 3060 carbon target of carbon peak and carbon neutrality. This not only highlights China’s active commitment to international emission reduction responsibilities but also triggers deep changes in economic and social development. Carbon-intensive industries (CIIs) exhibit the “four high” attributes of energy consumption, pollution, and carbon emissions, as well as industrial connection. They are pillar industries and important entities for the growth of the national economy and the deepening of the industrial chain. However, in the process of comprehensive transformation to “dual-control of carbon emissions”, as the largest contributors to carbon emissions and the main industries of non-renewable resource utilization in China [11,12], CIIs continue to face the “triple resistance” of limited core technologies for energy saving and carbon reduction, viscous dependence on traditional energy sources, and insufficient willingness and capacity for transformation. Calculated according to relevant data in the China Emission Accounts and Datasets (CEADs), from 2011 to 2022, the share of carbon emissions from 11 CIIs in the country grew from 81.90 percent to 85.13 percent, with an upward trend in the scale of carbon emissions. Carbon-emission intensity (According to the latter screening of carbon-intensive industries, a total of 11 sub-sectors are included, and their carbon intensity is weighted by summing the carbon emissions of each sub-sector with the main business revenues of each sub-sector and adjusting them to 2010 prices.) fell from 2.26 tons per million yuan to 1.79 per million yuan, a decrease of 20.75 percent, showing overall positive signs of CIIs moving towards low-carbon and sustainable development. However, during the 13th Five-Year Plan period, rather than decreasing, the carbon intensity of CIIs increased by 9.11 percent, thus failing to achieve the binding target of 18 percent. Under the severe situation of global warming, deep low-carbon transformation (LCT) and sustainable green development within CIIs remain imminent.
In the context of synergizing global economic growth with environmentally and ecologically sustainable development, traditional productivity has also undergone a profound transformation [13], and new quality productivity (NQP) has emerged. The term “NQP” was first proposed by Chinese President Xi Jinping during inspections and research in Heilongjiang in September 2023. NQP provides strong impetus and support for high-quality economic and social development in China and the rest of the world. It represents an advanced form of productivity characterized by innovative allocation of production factors, a focus on revolutionary and disruptive technological breakthroughs, and the promotion of deep-seated industrial transformation and upgrading. NQP is distinguished by its focus on advanced technology, quality, and efficiency. Unlike traditional productivity, which primarily relies on capital and labor as driving forces, it breaks away from traditional economic and industrial development models, taking a coherent path to exploring new technologies and driving forces from an innovative perspective, thereby promoting high-end, low-carbon, and sustainable industry growth [14,15]. Embedding innovation as the core driving force, NQP adopts a “technology addition and carbon emission reduction” approach. Through advanced digital technologies, NQP empowers the continuous upgrading, efficient development, and rapid cultivation of traditional, strategically emerging, and future industries, promoting ecological protection and green growth [16,17]. NQP not only embodies the principles of green productivity but also emphasizes new driving forces such as technology and digitalization. The accelerated cultivation of NQP can stimulate greener industry and LCT, thereby striking the “optimal solution” for carbon reduction. This is highly consistent with the dual carbon strategy and provides new ideas for the development and optimization of CIIs.
Part of this research focuses on analyzing the scientific meaning of NQP. Firstly, productivity composition theory emphasizes the optimal combination of labor, labor materials, labor objects, aiming to improve total factor productivity [14]. NQP aims to convert momentum and technology away from a focus on rapid growth and towards the quality of development, while also highlighting the principles of green productivity [15]. Secondly, regarding the formation mechanism of NQP, technical innovation plays a key driving role, fundamentally transforming traditional industrial models and promoting industrial optimization and an energy-level upgrade [18]. Some scholars have constructed a model of the relationship between digital and green productivity to quantify and analyze their impact on NQP [17]. Digital technology injects new production factors into the real economy and drives industrial innovation through factor reallocation and technological breakthroughs. Driven by technological and financial development, the digital economy can contribute to industrial structure upgrading in specific regions [19] and enhance the efficiency of digital reforms, becoming a driver of high-quality, innovation-led economic development [20]. In essence, NQP is consistent with green productivity [15]. The above research focuses on an in-depth exploration of the meaning and mechanism of NQP. However, the analysis of the influencing mechanisms has mainly addressed the endogenous factors of NQP, with limited empirical discussions.
NQP integrates the key driver of technological innovation, the main force of digital innovation, the leverage of industrial innovation, and the emerging momentum of green innovation. It plays an incentive role in upgrading, extending, and building chains for traditional, strategic, and future industries. However, with the aim of advancing quality macroeconomic growth, can NQP stimulate the LCT of CIIs? Through what mechanisms does it promote this transformation? Clarifying these mechanisms is crucial for assessing its effectiveness in specific industries, aligning with development strategies, and supporting climate change mitigation.
The study focuses on data from 30 Chinese provinces and 199 carbon-intensive listed companies from 2011 to 2022. A vertical and horizontal slotting method is used to evaluate NQP at the provincial level. Based on carbon emission scale and intensity, 11 CIIs are identified. We then examine the effects and driving mechanisms of NQP on industrial LCT at both macro and micro scales.
Compared with the existing research, the main contribution of our study lies in the following: (1) By integrating formation mechanism analysis and innovative measurement, we explore the empowering impact of NQP on the transformation of CIIs, confirming its role in promoting the greening and decarbonization of more granular industrial segments. This expands and enriches the theoretical and practical understanding of transformation pathways for specific industries. (2) At both macro-provincial and micro-enterprise levels, we identify the differentiated mechanisms through which NQP promotes the transformation of CIIs, broadening the pathways for industrial transformation across multiple scales. Our findings support more targeted policy implementation by stakeholders and reinforce the amplifying effect of NQP on sector-specific transformation. (3) Based on differences in location, carbon attributes, and energy resources, we identify the screening effect of NQP on the transformation of CIIs is identified. This deepens the understanding of industrial transformation from the perspective of regional heterogeneity. It also supports more accurate assessments of transformation speed and effectiveness of specific industries across different regions, allowing the enabling effect of NQP to be adjusted according to time, place, and context.
Section 2 presents the literature and theoretical analysis. Section 3 explains the methods and data. Section 4 discusses the results. Section 5 provides further analysis. Section 6 summarizes the conclusions and proposes research implications.

2. Literature and Theoretical Analysis

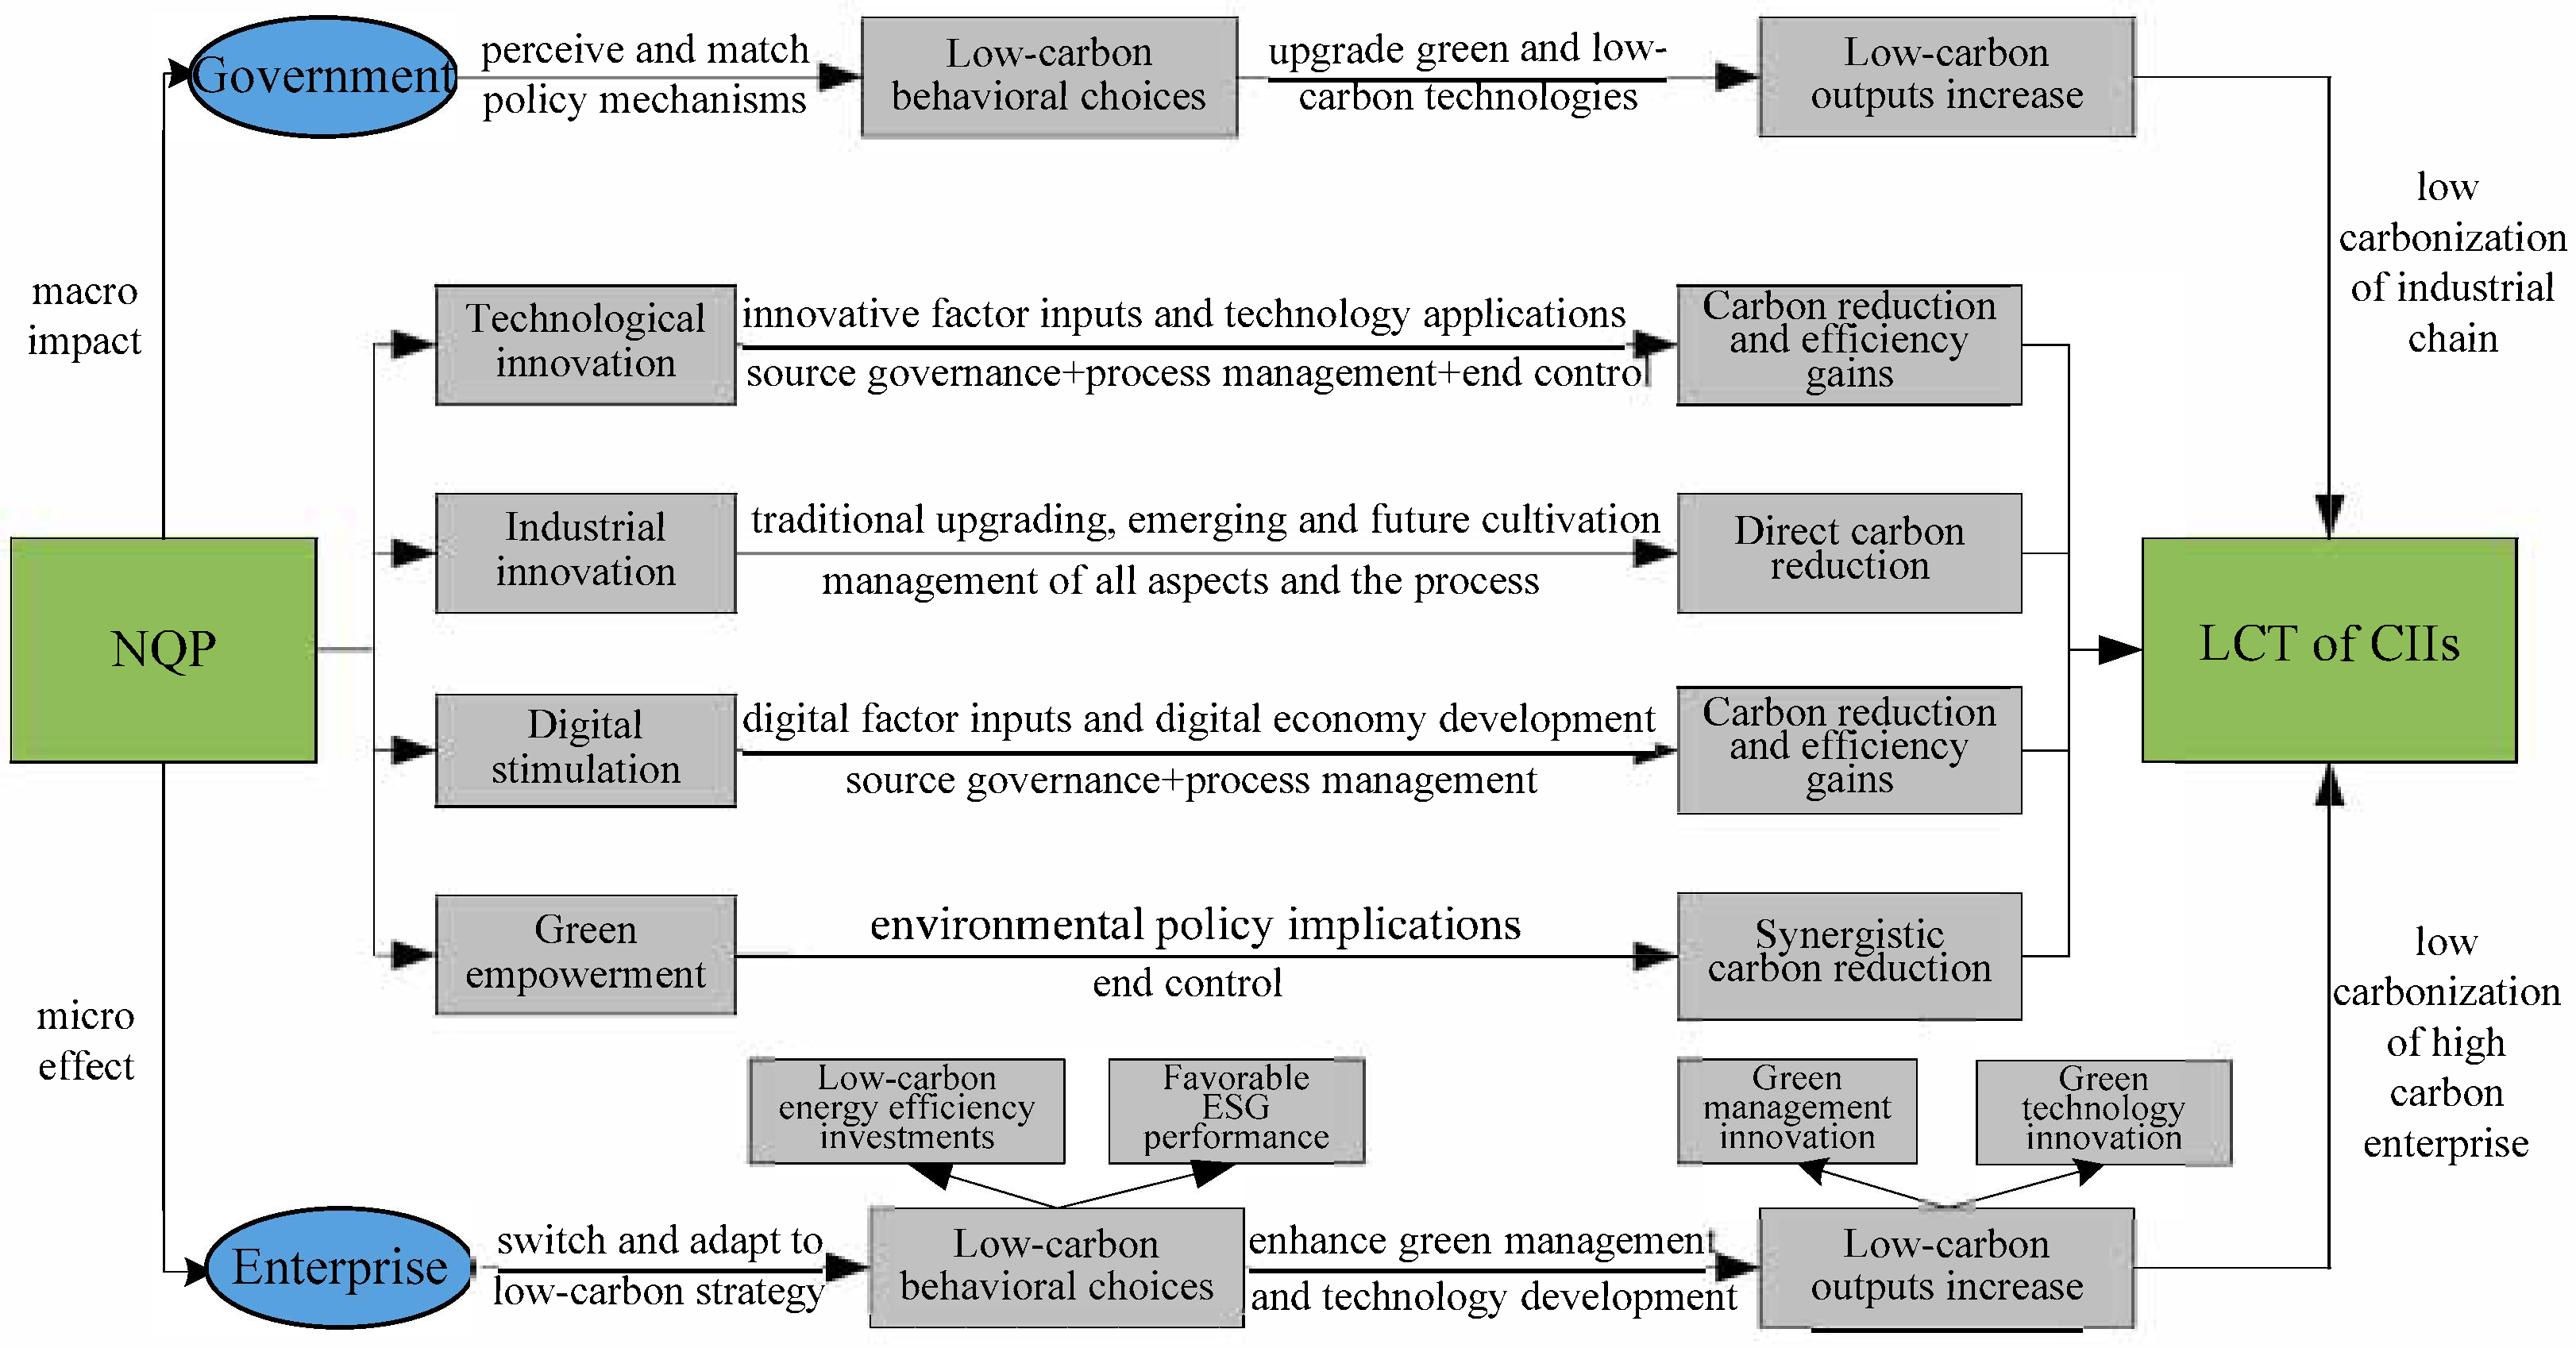
2.1. The Impact of NQP on Industrial Transformation

Industrial transformation is the reallocation of factors of production among industrial sectors. It is the process of transferring traditional factors, such as capital and labor, to new types of factors and high value-added industries [21,22]. Existing studies have mostly explored LCT in terms of industrial transformation. In environmental input-output, carbon emissions are considered an undesired output that accompanies industrial production [23]. Industrial LCT emphasizes the control of total carbon emissions and intensity while maintaining total economic output growth, achieving both emissions reduction and economic development [24]. Industrial LCT depends largely on the production and treatment of carbon emissions, and industrial optimization and adjustment can decrease the level of carbon emissions associated with economic development [25]. Technological innovation, on the other hand, can improve carbon emission efficiency and has a significant impact on the industrial LCT [26].
In contrast to traditional productivity’s focus on driving economic growth, NQP emphasizes the fundamental nature of breakthrough innovation, embodies new digital and other innovative elements, and incorporates the new notion of digital economy [27]. It advocates technological innovation and intelligent digital development, promotes energy restructuring and optimization through clean energy substitution and efficient energy use [28,29], reduces fossil energy waste at the input stage and carbon emissions at the output stage, and rationally innovates the allocation mix of traditional and new factors, such as labor, energy, data, and digital factors, which helps to curb the scale and intensity of carbon emissions from the source, thereby promoting LCT and efficient industrial development.
Technological innovation, as the core feature and key driver of NQP [27], is applied to the renewal of resource-saving and consumption-reducing equipment throughout the production, processing, and distribution processes of CIIs, thereby effectively controlling carbon emissions. Green technological progress can support the ”technological dividend” of carbon emission reduction, and effectively promote LCT while suppressing carbon emissions [30,31]. Moreover, advanced digital technologies in the form of artificial intelligence, 5G, and the digital economy, etc., are also important embodiments of the connotation of NQP [17]. The digital economy has shown an active impact in curbing carbon emissions across the entire management process [32,33]. Technological innovation can create new value and fundamentally improve NQP. Breakthrough and disruptive carbon sequestration technologies effectively absorb carbon emissions and promote carbon neutrality, which are key to end-to-end control of carbon emissions [34]. By creating desired outputs and controlling undesired outputs, industrial LCT is promoted.
Focusing on the internal formation path of NQP and building on the above analysis, NQP comprises four subsystems: technological innovation, industrial innovation, digital stimulation, and green innovation. From Figure 1, firstly, technological progress has a positive effect on decreasing regional carbon emissions [35], promoting low-carbon environmental performance [36], and addressing climate change. Green technology innovation improves the structure of energy use, which is conducive to energy optimization and transformation [37]. It stimulates rationalization and advanced adjustment within and across industries, thereby promoting green and low-carbon transformation [38]. Meanwhile, non-polluting and high-tech industries tend to undergo LCT at a faster pace [39]. Secondly, in the dimension of industrial innovation, developing cutting-edge emerging industries such as advanced manufacturing, high-end equipment, and biotechnology, and cultivating high-tech and digital future industries are important ways to enhance NQP. This helps reshape and cluster new green industry chains, and in turn, positively promotes green industrial transformation. Thirdly, by integrating various new and advanced digital technologies, digital stimulation significantly reduces energy resource waste and improves energy efficiency in product manufacturing and use [40,41]. At the same time, it optimizes the structure of energy usage and allows for increased substitution of alternative energies to achieve carbon reduction [42]; prompts new energy-saving and carbon-reducing industries; and therefore accelerates continuous industrial transformation [43]. Digitization can also innovate the allocation and flow of elements, accelerate the updating of technology and capital, and stimulate industrial LCT [44]. Finally, green productivity is aligned with NQP, and environmental governance policies aimed at reducing polluting emissions can also exert synergistic carbon-reducing effects [45,46,47]. Green empowerment can further promote industrial LCT.
From the above analysis, we propose the following hypothesis:
H1a. 
NQP promotes the LCT of CIIs.
H1b. 
NQP’s four dimensions of technological innovation, industrial innovation, digital stimulation, and green empowerment are all conducive to promoting the transformation of CIIs.

2.2. Intrinsic Impact Mechanism

Carbon emissions governance is a systematic project. It requires multi-party participation and synergistic governance at multiple levels, such as government, enterprises, the public, and society, to jointly address the issue of high-carbon emissions and to each play an active role [48,49,50]. As shown in Figure 1, the government, as the primary implementer of carbon regulation, and enterprises, as the primary responsible parties for carbon emissions, quickly respond to perceived external economic and social changes, productivity, and production mode innovations with policy support and strategic decisions. They stimulate green and low-carbon outputs by adopting low-carbon behavioral choices, which then translate to industrial LCT. By formulating and implementing targeted policy initiatives, the government imposes strong top-down constraints on carbon emissions, thereby promoting structural adjustments in energy and industry [51,52]. This kind of effective implementation of environmental and innovation policies has led to significant reductions in regional carbon emissions. For example, the Low Carbon City Pilot [9], Carbon Market Construction [6], New Energy Demonstration City Project [51], and the National Comprehensive Pilot Zone for Big Data [53] have all shown carbon emission suppression effects. Government-set environmental regulations are adopted by micro-enterprises and have an impact on their production and sales activities [52]. This increases technological innovation and promotes more efficient energy use [54]. Participating in international trade and learning advanced low-carbon technologies [55] accelerates the deep digital transformation, optimizes factor resource allocation, and coordinates upstream and downstream industry chain linkages, thus positively impacting the performance of environmental governance and LCT [56].
At the macro level, NQP––introduced by the government as a policy initiative to promote high-quality economic growth and modernization––is consistent with green productivity. They both emphasize an efficient, environmentally friendly, low-carbon economic development model. Furthermore, the cultivation and enhancement of NQP has an impact on the government’s decision-making regarding low-carbon behaviors. Against the background of increasing pressure for carbon emission reduction, the government tends to adjust quickly, aligning macro-environmental policies, introducing a combination of carbon regulation policies [6,51], and increasing government expenditures such as eco-environmental investments [57]. This helps to motivate carbon-intensive enterprises to actively invest in low-carbon technology development and adopt carbon-reducing practices [58], thereby increasing the energy efficiency and low-carbon integration of products and services at the provincial level. Furthermore, digital productivity reflects the core concept of NQP [17], and its rapid growth can adjust the energy consumption structure, promote green technological innovation, and effectively reduce regional carbon intensity [42]. Digitization significantly increases environmental protection investment, stimulates green innovation, reduces carbon emissions from the industrial sector [59], and thereby improves the transformation efficiency of high-carbon industries.
At the micro level, macro-environmental target constraints aimed at improving environmental performance have intensified the “crowding-out effect” on micro polluting firms [60], forcing them to shift pollution activities or pursue green transformations, thereby contributing to industrial transformation. When the macro environment changes, enterprises need to adjust their mode of development, update environmental protection technologies, and reduce energy and resource consumption to promote circular industrial development [61]. The participation and collaboration of enterprise organizations and other institutions can help improve resource efficiency and promote sustainable development [62]. As the smallest economic entity with high-carbon emissions, changes in macro NQP will eventually be reflected in carbon-intensive enterprises by prompting them to actively explore clean and low-carbon strategic decisions, seize the opportunity of NQP development, and adopt energy-saving and low-carbon practices with the help of artificial intelligence, blockchain, and other computing power technologies. As can be seen in Figure 1, in the process of accelerating the development of macro-level NQP, micro-enterprises quickly update their strategies, adopt green and low-carbon behaviors, strengthen low-carbon output efficiency, and thus contribute to the transformation of CIIs. On the one hand, carbon-intensive enterprises can take the initiative to increase their own investment in renewable energy substitution, energy efficiency, environmental protection, and carbon reduction, and strengthen advanced green low-carbon technology research [63]. In addition, NQP promotes the long-term sustainable development of enterprises, forcing high-carbon emission enterprises to assume environmental and social responsibility, improve environmental production processes, and reinforce the effects of multi-dimensional governance of the environment, society, and enterprises, thereby enhancing ESG performance [64]. With increased low-carbon investment and strong ESG performance, enterprises can strengthen green process management and low-carbon output, further promoting the transformation of CIIs by enhancing the impact of green innovation.
From the above analysis, we propose the following hypothesis:
H2a. 
At the macro-scale, NQP increases regional environmental investment, stimulates green innovation, and thus contributes to the LCT of CIIs.
H2b. 
At the micro-scale, NQP increases the low-carbon investment and ESG performance of carbon-intensive enterprises, enhances green innovation output, and thus contributes to the LCT of CIIs.
Accelerating NQP is key to advancing the comprehensive green transformation of the economy and society. However, its impact on industrial transformation has often been examined from a single theoretical dimension––such as technological innovation [65], digitization [44], ecological governance [47]––rather than through an integrative perspective. Based on a comprehensive evaluation of NQP, our study analyzes its effect on LCT in CIIs, including relevant sub-dimensions, which differs from existing research. To address the impact mechanism between NQP and industrial transformation, this study establishes a chain transmission mechanism––covering source governance, process management, and end control––within a whole-process framework involving both government and enterprises. It expands research on the transformation of specific high-carbon industries by integrating macro- and micro-level perspectives.

3. Methodology and Data

3.1. Data Information and Sources

This study takes the 12th Five-Year Plan as a starting point, sets 2011–2022 as the study, and selects a sample of 30 Chinese provinces (Due to data acquisition limitations, the research sample does not include Tibet, Hong Kong, Macao, and Taiwan.). The study focuses on the macro and micro mechanisms of NQP and its effect on LCT in CIIs. For the discussion of the micro-enterprise mechanism, listed carbon-intensive companies are taken as samples and screened as follows: (1) Identify CIIs based on the CPI level, initially identifying 448 carbon-intensive enterprises according to industry distribution. (2) Exclude companies listed after 2011 and those designated as ST during the sample period, leaving 201 enterprises. (3) Exclude companies listed in Tibet, resulting in 199 carbon-intensive enterprises from 2011 to 2022, which are used as the micro-mechanism sample.
The macro-regional and industrial data are mainly obtained from the China Statistical Yearbook, China Industrial Statistical Yearbook (CISY), China Environmental Statistical Yearbook, statistical yearbooks and statistical bulletins of regions, EPS database, CEADs, the Natural Resources Department, and other channels. The data for micro-enterprises are mainly obtained through Wind Information, the CSMAR database, annual reports of enterprises, Oriental Wealth Net, etc. Data on industry segments are supplemented by regional Wind Information, CISY, and statistical yearbooks. A fraction of missing values is supplied by the average trend and linear interpolation methods.

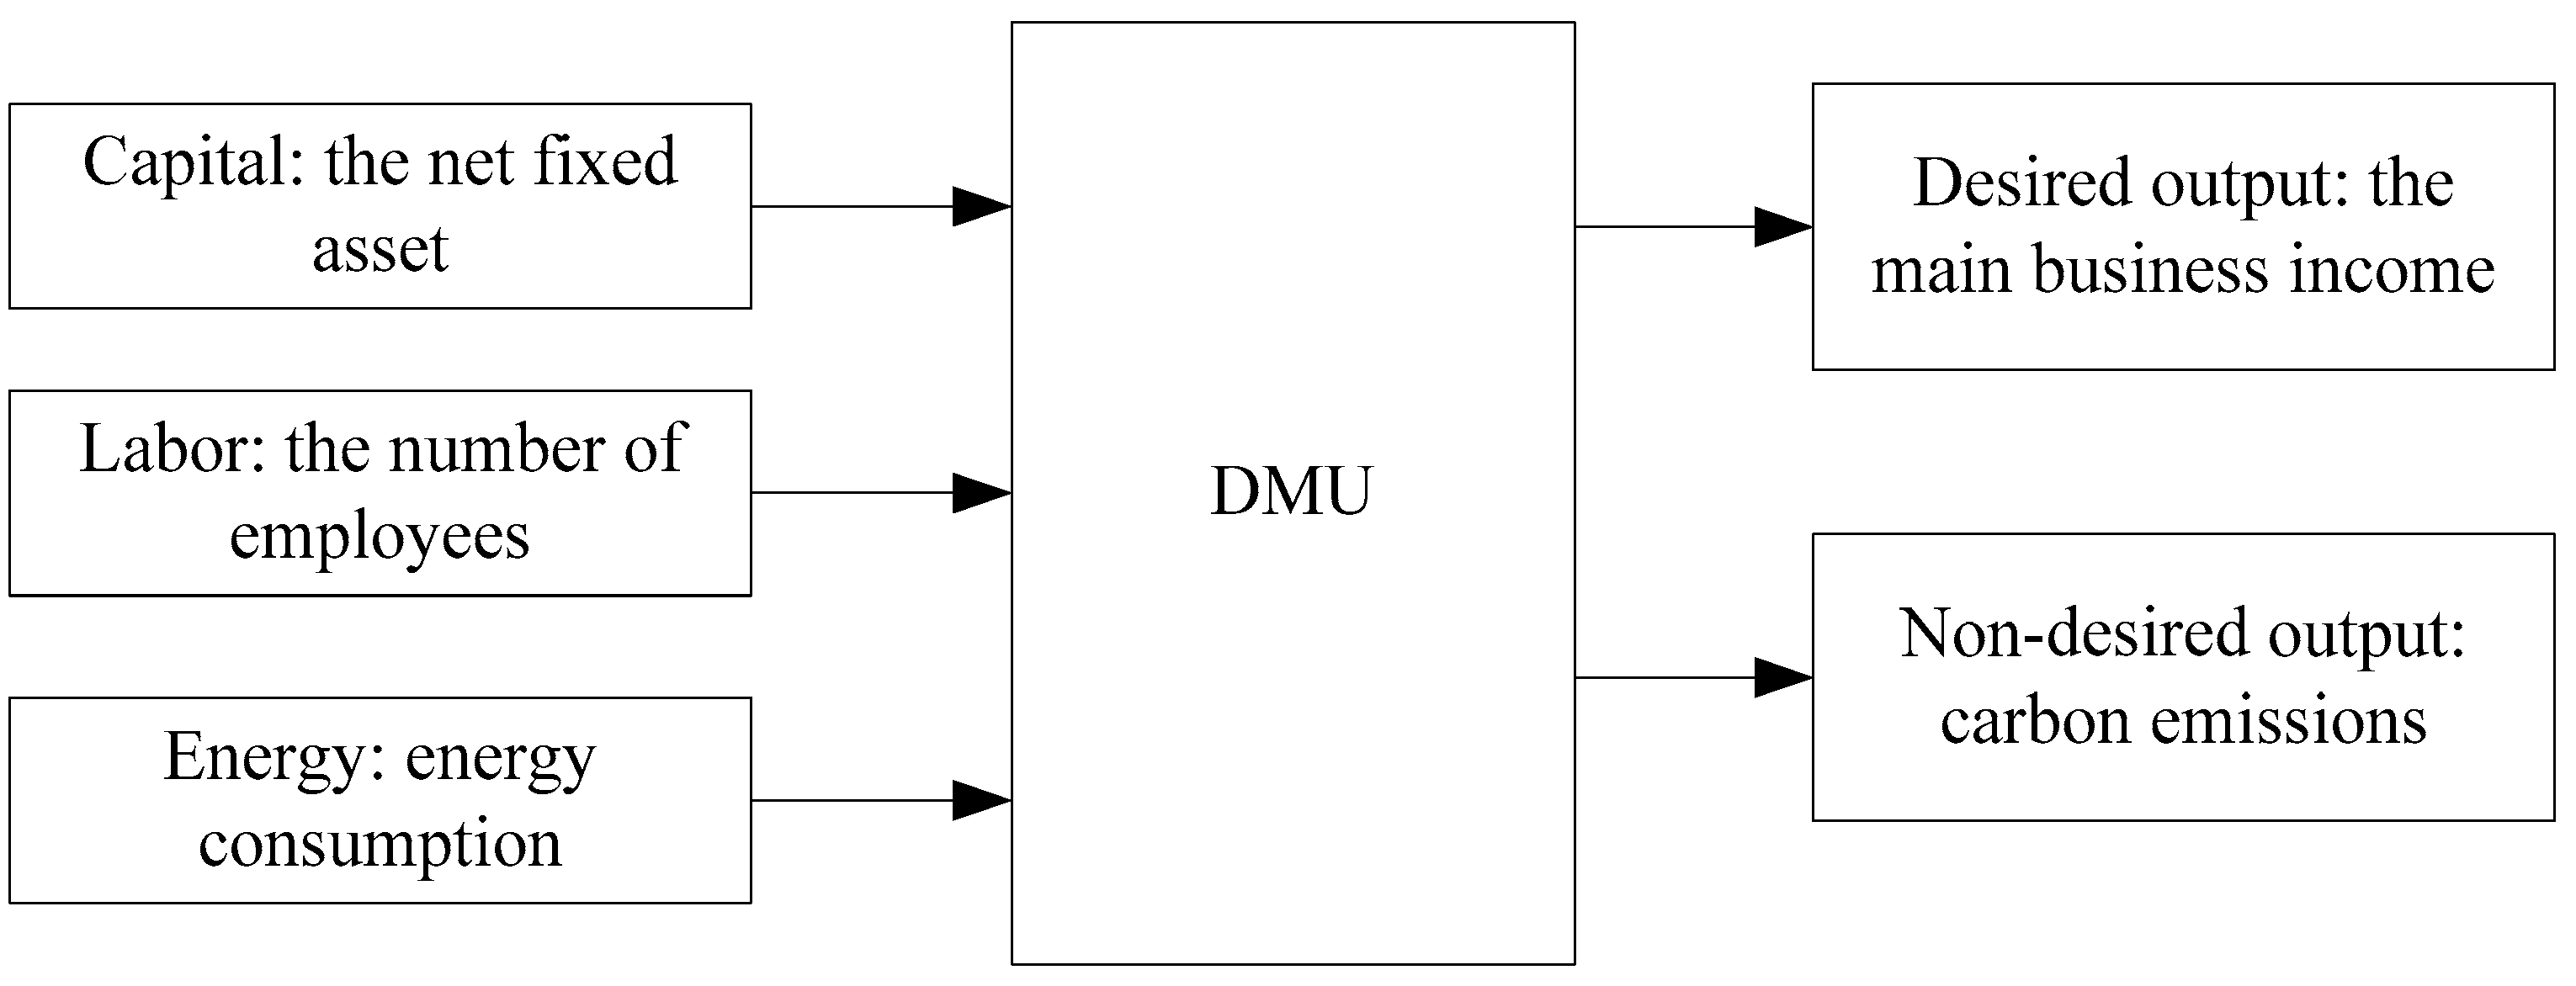
3.2. Variable Measurement

(1) LCT. The global Malmquist–Luenberger (GML) index method, based on the Slack-Based Measure directional distance function (SBM), has been widely used to assess green development efficiency and track the low-carbon transition process [66,67]. By constructing a “three inputs and two outputs” variable combination that includes undesired outputs, this study combines the super-efficient SBM function with the ML productivity model to estimate the LCT level of CIIs. Firstly, considering both the scale and intensity of carbon emission [68], the carbon-intensive index (CPI) for each industry in China is calculated by Equation (1), and the CIIs are effectively identified.
C P I m = E m A V I n × E m E n 0.5
In Equation (1), E m   and E n are the carbon emissions of major industry m and sectoral industry n, respectively; A V I n is the industry-added value of sectoral industry n; and C P I m is the carbon-intensive index of the industry. There have been many studies analyzing carbon emissions using CEADs [69,70]. We use CEAD carbon emission data from various industries in China to calculate a CPI for each industry. Based on CPI stability and the change in its average ranking by industry from 2011 to 2022, 11 industries are set as CIIs. Table 1 outlines the selected CIIs.
Secondly, Figure 2 shows the input–output model of the super-efficient SBM function for LCT of CIIs. The input indicators for LCT include capital, labor, and energy. The capital investment indicator uses the net fixed asset value of each sub-industry, adjusted to 2010 price levels. Employees of industrial enterprises above large scale are used as the labor input, and converted energy consumption of sub-sectors is used as energy input––obtained from the provincial energy list of CEADs and expressed as total discounted standard coal. The desired output is the main business revenues of the industries, adjusted to 2010 price levels. The non-desired output is the carbon emissions of the industries, taken from the provincial emissions inventories of CEADs (Referring to the accounting method of CEADs and combining the China Energy Statistical Yearbook (2023), the energy balance sheets of each province, and the relevant data from the statistical yearbook of each province (2023), the 2022 energy inputs and carbon emissions of each industry in the 30 provinces are calculated.).
Finally, the Super-SBM model combined with the ML index is constructed and measured by MATLAB 2017b to calculate the LCT efficiency of CIIs.
(2) NQP. Its scientific concept emphasizes the optimized combination and energy-level upgrade of the three elements “Green” is not only the foundation of high-quality development but also the core of NQP in the process of building a beautiful China. Breakthrough innovations, efficient transformation of technologies, factors, and industries, the feedback effects of technological innovation on industrial layout optimization, and the targeted responsiveness of digitalization are key drivers of NQP improvement. Adopting a result-oriented analysis paradigm, combining theoretical connotations, core features, and implementation methods, and drawing comprehensively on the scientific basis of existing studies [17] and available data, this study establishes a comprehensive and integrated evaluation system for China’s provincial NQP––featuring 24 indexes across four dimensions and 10 layers––which covers technological innovation, industrial innovation, digital stimulation, and green empowerment. Technological innovation is the key power driving its formation, industrial innovation is the key grip for development, digital stimulation is the inherent force for acceleration, and green empowerment is the essential requirement for sustainability.
To ensure the scientific and objective assignment of indicator weights and reflect temporal changes across multiple regions, a vertical and horizontal slotting method is used to estimate NQP in 30 provinces of China [71]. The evaluation model for NQP is shown in Equation (2):
N Q P i t = w T x i t
In Equation (2), w T is the vector of weight coefficients and x i t is the vector of each evaluation index. After dimensionless processing of each indicator through range standardization, the weight coefficients of the comprehensive evaluation function of NQP are calculated using the sum of squares of total deviations, then the NQP level of each region is calculated.
(3) Mechanism variables. As mentioned in the above theoretical discussion, NQP may enhance low-carbon behavior and stimulate the green output at a macro-regional scale and for micro-high-carbon emission enterprises, and ultimately translate to the LCT of CIIs. On the macro-scale, environmental governance investment and green innovation are selected as mechanism variables. On the micro-scale, taking listed carbon-intensive companies as samples, low-carbon behaviors are measured on two dimensions: energy-saving, low-carbon investment and ESG performance. Green outputs include green management innovation and green technological innovation. Macro-environmental governance investment is estimated by the ratio of industrial pollution control investment to the added value of the secondary sector. Enterprise energy-saving and low-carbon investments of enterprises are obtained by manually collecting detailed changes in construction-in-progress items related to energy conservation, consumption reduction, low-carbon and zero-carbon initiatives, energy substitution, and other related investments, as reported in the annual notes of 2388 carbon-intensive enterprises [72]. Enterprises’ ESG performance is derived by assigning scores to Huazheng Securities’ C-AAA rating results [73]. Based on the CSMAR environmental database, green management innovation is measured using the total score from five categories: namely, certification of ISO14001 and ISO9001, implementation of scheme construction, environmental education and training, and participation in environment-related activities [74,75]. Both macro-level green innovation and micro-level green technological innovation are characterized by the patents filed for green inventions [44,76].
(4) Control variables. Based on existing research [47,50,65], economic development, foreign trade, financial development, market competition, and energy-saving efforts are included and used as control variables to reduce omitted variable bias.
As shown in Table 2, the overall level of LCT of CIIs in each province is high. Regional heterogeneity in NQP is evident. The mean level of energy-saving and low-carbon investment in carbon-intensive enterprises is lower than the ESG performance, and the differences are prominent among different enterprises. The VIF test values between variables confirm the absence of covariance and cointegration problems.

3.3. Model Specification

In alignment with the above theoretical discussion, our study pays close attention to the impact effects of NQP on the LCT of CIIs. The basic model setting is:
L T C P i t = α 0 + α 1 N Q P i t + γ C o n t r o l s i t + μ i + v t + ε i t  
where L T C P i t denotes the LCT process of high-carbon industries in province i, year t. N Q P i t represents the NQP level. α 1 is the key coefficient, indicating the impact intensity of NQP’s transformation on CIIs. C o n t r o l s i t denotes the combination of control variables, μ i , v t , and ε i t are the regional, time-fixed effect and random perturbation term.
To examine the transmission mechanism of NQP on the LCT of CIIs, the mechanism model is established from the macro and micro perspectives:
M V i t = β 0 + β 1 N Q P i t + γ C o n t r o l s i t + μ i + v t + ε i t  
L T C P i t = θ 0 + θ 1 N Q P i t + θ 2 M V i t + γ C o n t r o l s i t + μ i + v t + ε i t  
where M V i t is the mechanism variable that represents the effect of NQP on the LCT of CIIs in province i, year t. β 1 , θ 2 are the key coefficients.

4. Analysis and Results

4.1. Baseline Regression Analysis

By controlling for individual and time effects separately, a baseline regression is conducted, with results shown in Table 3. The findings indicate that the positive relationship between NQP and LCT of CIIs remains stable, with increasing intensity and significance. The results confirm that NQP effectively promotes the LCT of CIIs, supporting H1a. The innovation and digital technology embedded in the NQP can optimize the structure of energy utilization, significantly reduce carbon emissions, and improve carbon emission efficiency [28,29]. Furthermore, NQP can reshape the optimal allocation of factors, enhance resource-saving capacity, and support cleaner and low-carbon production chains, thereby accelerating the efficient development of CIIs.
Taking column (3) as an example, the control variables have different impacts on the transformation of CIIs. Economic development and financial level both have significant positive effects, indicating that the probability of CIIs obtaining green investment and financing is higher, enabling cleaner technological transformation and improved carbon emission performance [28]. To a certain extent, foreign trade, market competition, and energy-saving efforts have curbed the LCT process of CIIs. This may be related to energy-intensive enterprises avoiding carbon regulation pressure through carbon transfer, and to insufficient investment in ecological governance and low-carbon environmental initiatives. Increasing competition in the market and a continued rise in the number of industrial enterprises may result in a vicious cycle of “bad money driving out good money”, causing adverse effects on healthy competition, orderly development, and efficient transformation of enterprises in the market.
To further clarify the strength and internal mechanism of NQP’s influence on the transformation of CIIs, the impacts are analyzed by dimension across NQP’s four subsystems. As shown in columns (4)–(7) of Table 3, industrial innovation, digital stimulation, technological innovation, and green empowerment all contribute positively to the transformation of CIIs, though the effect size gradually decreases. The empirical results support H1b. Industrial innovation has a direct facilitating effect on industrial optimization and adjustment. It helps optimize traditional high–energy-consuming industries, supports the growth of strategic emerging industries, and advances the low-carbon transformation of CIIs. Digital stimulation effectively generates new elements, technologies, and kinetic energy, thereby innovating the allocation of multiple factors [44], efficiently reducing energy consumption, and effectively substituting clean energy for carbon-based energy in CIIs [42]. Breakthrough technological innovation promotes the emergence and use of efficient, green, and low-carbon technologies in CIIs. Green innovation has played a positive role in promoting low-carbon energy transformation while also reducing carbon emissions [31,37], thereby driving the LCT process. Moreover, considering the symbiotic relationship between carbon emissions and air pollution, green empowerment can synergistically promote the green development of CIIs [45,47].

4.2. Robustness Test

This study adopts a variety of methods for robustness testing to ensure the stability and accuracy of the relationship between NQP and LCT in high-carbon industries. The results are detailed in Table 4. Firstly, to replace the explanatory variables, the SBM–ML model is calculated using 2011 as the base period, and the LCT level of CIIs is obtained by cumulatively multiplying the ML index. We can see that NQP still positively stimulates the transformation of CIIs at a significant level of 10% in column (1), highlighting the carbon-reducing and energy-saving effect of CIIs. Secondly, to circumvent the immediate impact on CIIs of the dual-carbon target proposed in September 2020, the data for 2021–2022 are excluded. Column (2) shows that NQP still positively promotes the CIIs’ transformation. Thirdly, the system GMM model is used to address the endogeneity problem among variables and avoid serious bias. Column (3) also confirms the LCT effect of NQP. Finally, given the spatial mobility of carbon emissions, we re-estimate the model using the spatial Durbin approach. NQP in the local area still makes a significant contribution to the transformation of high-carbon industries. The above analysis confirms that the industrial LCT effect of NQP is reliable.

4.3. Heterogeneity Results

4.3.1. Regional Distribution

There are differences in the impact of regional economic development on carbon emissions [77]. The 30 provinces are divided into two groups: eastern and central–western provinces, and the group regression results are detailed in Table 5. Compared with the eastern regions, NQP has a more prominent impact on the LCT of high-carbon industries in the central and western regions. This is because the eastern regions, through carbon and pollution transfer, began earlier to shift high-carbon-emission and energy-intensive industries to areas with lower environmental thresholds and less developed economies [78,79]. The eastern regions have experienced the LCT process earlier and more rapidly, while the central and western regions––having taken over CIIs––now face greater pressure to coordinate carbon and pollution reduction. Overall, the analysis shows that the empowerment effect of NQP is gradually emerging.

4.3.2. Carbon Intensity

The CPI of each region is calculated over the study period, and the sample is divided into high-carbon and non-high-carbon groups using an average carbon emission intensity of 1 as the threshold. The results in columns (3) and (4) show that, compared with non-high-carbon regions, high-carbon regions face more severe challenges in energy consumption and carbon emissions [80]. The pressure to reduce carbon emissions and achieve industrial low-carbon transformation is both increasing and urgent. The incentivizing role of NQP in promoting LCT is more evident in high-carbon regions. This further confirms that the development and promotion of NQP accelerate the transformation and optimization of CIIs.

4.3.3. Carbon Emissions Trading Pilot

Studies have supported the positive influence of carbon market policies in decreasing carbon emissions [6]. The group regression of five regions (The five regions include Beijing, Shanghai, Tianjin, Chongqing, Hubei, and Guangdong.) included in the carbon trading pilot in 2011 shows that NQP positively incentivizes the transformation of CIIs in both types of regions, but the intensity of the effect is greater in non-pilot areas, indicating that the carbon transformation is not balanced across provinces,––with provinces that have not carried out carbon trading pilots lagging in the process of dual-carbon targeting––and that there is more room for LCT driven by NQP in high-carbon industries.

4.3.4. Energy-Rich and Ecologically Fragile

Taking into account the definitions of energy resource bases and ecologically fragile areas in relevant policy documents (Our study has comprehensively defined energy rich ecologically fragile areas referring to the Approval of the State Council on the National Mineral Resources Plan (2016–2020) (Guo Han [2016] No. 178 and the Circular of the Ministry of Environmental Protection on the Issuance of the Outline of the National Ecologically Fragile Areas Protection Plan (Huan Fa [2008] No. 92).), the 18 provinces of Xinjiang, Inner Mongolia, and Shanxi––excluding Tibet,––are defined as energy-rich and ecologically fragile areas (EREFAs), and the results are displayed in columns (7) and (8). The promotion effect of NQP on the LCT of CIIs in EREFAs is significantly lower than that in other regions because EREFAs have a higher dependence on energy, accompanied by sensitive ecological conditions. The process of replacing and optimizing clean energy is lagging behind, and the green, low-carbon transition remains slow and difficult [42].

5. Further Analysis and Discussion

Benchmark regression confirms that NQP can significantly stimulate the LCT process of CIIs. Technological innovation, industrial innovation, digital stimulation, and green empowerment also have a significant promotional effect, offering empirical support for the positive impact of technological innovation, digitalization, and environmental protection initiatives on carbon emission reduction [37,46,81]. According to the discussion of the internal impact mechanism mentioned earlier, this section establishes the “N-B-O-P” research paradigm of “NQP—low-carbon behavior—green output—transformation performance” at the macro-provincial and micro-enterprise levels and explores the mechanisms of NQP that empower the transformation of carbon-intensive enterprises.

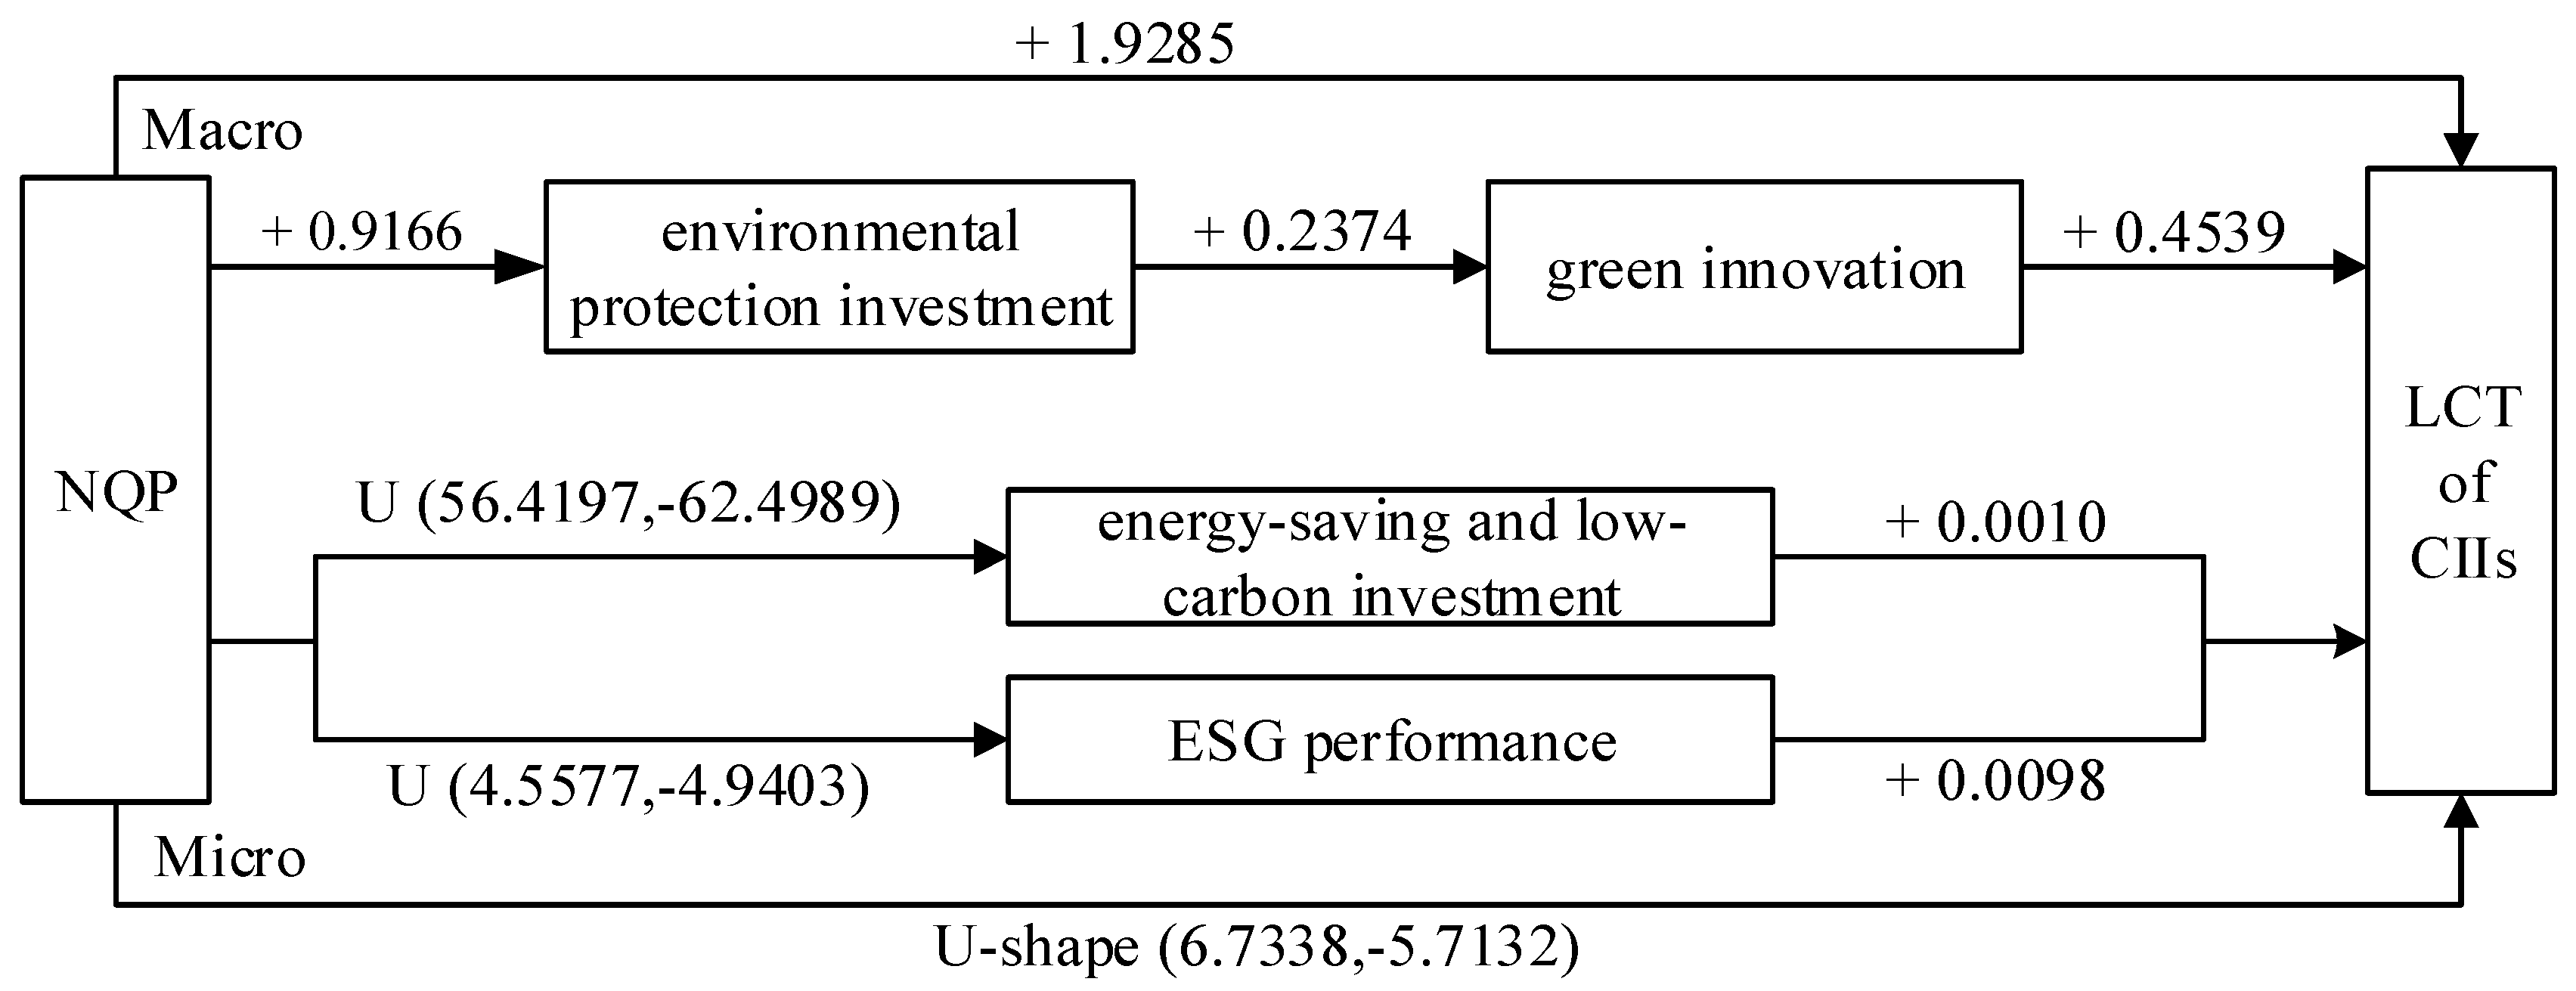
5.1. Macro-Mechanism Analysis

At the macro-scale, environmental governance investment and green innovation are introduced to verify the macro-transmission mechanism of the transformation of CIIs empowered by NQP. Column (1) of Table 6 shows a significant positive correlation between NQP and investment in environmental governance, indicating that NQP encourages regions to adopt low-carbon environmental practices and increase environmental pollution control to reduce both pollution and carbon emissions [57]. Column (2) tests the impact of environmental protection governance investment on green innovation [82]. An increase in environmental investment suggests that government regulation has strengthened, supporting the “Porter effect” and stimulating ongoing green innovation. Moreover, green innovation plays an obvious role in promoting the transformation of CIIs. The application of green and energy-saving innovative technologies in the production, processing, and use of CIIs effectively reduces carbon emissions both during and at the end of production [58]. Column (4) includes both NQP and the mechanism variables in the regression and shows that the LCT effect of green innovation remains significant and increases in intensity, confirming the chain transmission mechanism of “NQP—environmental protection investment—green innovation—the transformation of CIIs”. The empirical results support H2a and indicate the cultivation of regional NQP levels can stimulate the generation of low-carbon environmental protection behaviors and tends to increase environmental protection investment to effectively control pollution and carbon emissions. Furthermore, NQP can induce low-carbon innovation practices that facilitate the transformation of CIIs. This indicates that the government’s top-down carbon regulation policy significantly suppresses carbon emissions and promotes the low-carbon transformation of high-carbon emission industries [6,51].

5.2. Micro-Mechanism Analysis

This section examines 199 carbon-intensive enterprises, controlling for size, debt service, profitability, and growth capacity at the enterprise level in a high-dimensional fixed-effects regression [83]. This approach effectively tests the mechanism through which NQP influences the low-carbon behavior and green output of carbon-intensive enterprises at the micro scale, and how this contributes to the LCT of CIIs.
Columns (1)–(6) of Table 7 examine the transmission mechanism of “NQP—low-carbon investment—green innovation—LCT”. As can be seen from column (1), the promotional effect on the transformation of CIIs is no longer significant at the micro scale. This may be because, in the process of transmitting macro-level NQP to micro-level carbon-intensive enterprises, external uncertainties make these enterprises prone to information distortion due to asymmetric information [84]. The resulting transmission failure problem makes it difficult to incentivize enterprises to conduct LCT when the NQP level is relatively low. Therefore, the quadratic term of NQP is included in the regression to test for a potential nonlinear relationship. Column (2) confirms that at the micro scale, the relationship is U-shaped. When NQP is at a relatively low level, below 0.4242, it hinders the transformation efficiency of high-carbon emission industries. This turning point is lower than the overall average level of NQP, which is 0.4822. On the one hand, information distortion in the transmission of signals from low NQP levels prevents managers from accurately adjust strategies or effectively identifying low-carbon development opportunities [84]. On the other hand, the LCT process in carbon-intensive enterprises remains viscous. When multiple elements––such as technological innovation and green productivity––embedded in the NQP are synergized, enterprises are more effectively compelled to take initiative in decarbonizing their development. However, beyond this turning point, NQP continues to exert a strong facilitating effect. Column (3) shows a U-shaped relationship between NQP and energy-saving, low-carbon investment, indicating that after the inflection point of 0.5539, NQP can stimulate carbon-intensive enterprises to increase low-carbon and environmental investment and strengthen low-carbon behavior. However, energy-saving, low-carbon investment does not show an obvious positive effect on either green management or technological innovation. The results indicate that the transmission mechanism of “NQP—energy-saving and low-carbon investment—green innovation—LCT” has not been achieved, and H2b is not supported. When energy-saving and low-carbon investment and NQP are further incorporated into the same regression model, column (6) shows that energy-saving and low-carbon investment significantly promote the transformation process of CIIs, reflecting a significant decline in carbon intensity [85]. It also advances the inflection point of NQP’s low-carbon enabling effect to 0.4231, confirming the transmission path of “NQP—energy-saving and low-carbon investment—the transformation of CIIs”.
Columns (7)–(11) examine the transmission effect of “NQP—ESG performance—green innovation—LCT”. Column (7) confirms NQP of carbon-intensive enterprises has a U-shaped impact on ESG performance. This result also reflects the distortion of information transmission caused by macro uncertainty. Lower NQP cannot induce low-carbon environmental protection behavior in carbon-intensive enterprises but instead inhibits the improvement of ESG. As stated in Column (8), carbon-intensive enterprises’ good ESG performance is related to their attention to green production and operation activities, proactive disclosure of environmental protection-related information, and promotion of innovative green management [54]. However, its incentive effect on green technology innovation is not significant, and the positive effect of green management innovation has not been confirmed, which indicates that the mechanism of “NQP—ESG performance—green innovation—LCT” has not yet been achieved. The empirical results also do not support H2a. Column (11) shows that ESG improvement in carbon-intensive enterprises contributes to the transformation of CIIs, and advances the inflection point of NQP’s enabling effect to 0.4234, which supports the carbon suppression effect of ESG ratings [86], and confirms the mechanism of “NQP—ESG performance—LCT”.
Figure 3 summarizes the bidirectional mechanism between NQP and the LCT of CIIs. Through macro and micro mechanism testing, we find that at the macro level, NQP promotes the transformation of CIIs by increasing environmental investment, enhancing green innovation output, and driving a reinforcing chain reaction between the two. At the micro level, there has been a deviation in the process of transferring regional NQP to carbon-intensive enterprises, which has played a U-shaped role in the LCT of CIIs, with a decrease followed by an increase. The green output of carbon-intensive enterprises does not act as the end “transmitter”. NQP’s influence on CII transformation is mainly transmitted through two kinds of energy-saving and low-carbon behaviors, namely, low-carbon investment and ESG ratings of carbon-intensive enterprises.

6. Conclusions and Implications

6.1. Conclusions

Under the rigid constraints of multiple ecological, environmental, and economic goals, the path of carbon reduction transformation for CIIs, which are major emitters of carbon, is urgent. NQP is the inherent requirement of practicing high-quality development, highly unified with environmentally friendly sustainable green productivity, emphasizing green, low-carbon, high-quality, and high-efficiency development, which is the crucial driver to stimulate the collaborative reduction of pollution and carbon, and also a core pathway to help CIIs in their green transformation. Combining data from 30 macro-provinces and 199 micro-carbon-intensive firms in China during 2011–2022, this study theoretically analyzes and empirically explores the influence of NQP on the LCT of CIIs and its driving mechanisms. The conclusions indicate that provincial NQP has a significant promoting effect on the transformation of CIIs. This positive effect remains robust after replacing variable measurement methods, testing for endogeneity, and excluding the influence of dual-carbon policies and spatial variation factors. Based on its subdimensions, industrial innovation, digital stimulation, technological innovation, and green empowerment all significantly promote the LCT of CIIs, with the driving force decreasing in that order. Heterogeneity analysis shows that NQP strongly promotes industrial LCT in the central and western regions, high-carbon areas, and non-carbon trading pilot zones, where the pressure and difficulty of carbon transformation are greater. The positive effect of NQP on the transformation of CIIs is also more pronounced in non-energy-rich and ecologically fragile areas. Mechanism testing confirms that the macro mechanism of this facilitation is in the form of a chain transmission, which is manifested as “enhancing NQP—increasing investment in environmental protection and governance—forcing green innovation output to improve—promoting the LCT”. In the micro-transmission mechanism, NQP mainly stimulates the energy-saving and low-carbon investment of carbon-intensive enterprises and improves ESG performance to positively empower the transformation of CIIs.

6.2. Implications

This study reveals the empowering effect of NQP on LCT in CIIs and explores the differentiation implementation mechanism. It has important implications for China to accelerate the cultivation of NQP, accurately align macro policy measures with micro-enterprise strategies, and achieve highly consistent dual carbon goals. Not only that, it provides reference value for the green and low-carbon development of other emerging developing countries. In developing countries where carbon emissions have not yet decoupled from economic growth, the traditional mode of productivity development can be transformed by integrating new technologies, resources, data, policies, and other factors to promote the efficient transformation of high-carbon industries. Meanwhile, by sharing the experience of LCT in China’s CIIs, this study also benefits global decarbonization and sustainable development.
The policy implications for this study lie in the following. Firstly, the government needs to accelerate the cultivation and development of NQP, strengthen the development and application of low-carbon and clean core technologies, and promote the upgrading of high-carbon industries and the rise of green industries. It also needs to enhance the development of digital productivity and use big data and artificial intelligence to promote industrial LCT. When introducing environmental policies, the government should take into account the effectiveness and coordination of policies and highlight the coordinated carbon reduction effects of green productivity. Secondly, the government needs to take appropriate differentiated measures based on local conditions and regions to promote low-carbon industrial development. Regions with a high proportion of energy-intensive industries and slow transformation processes should use digital technology to empower clean production, thereby strengthening process control and end-of-pipe treatment of carbon emissions. Regions with abundant energy resources and fragile ecosystems should gradually replace energy sources with clean energy to reduce carbon emissions at the source and strengthen the compatibility of industrial LCT and ecological stability. Thirdly, it is necessary to increase support for environmental investment in the region, stimulate the output of green innovation, and facilitate the channel for promoting the transformation of CIIs through NQP.
The management inspiration for this study lies in the following. On the one hand, carbon-intensive enterprises need to closely monitor changes in macro policies and quickly adjust their internal strategies. Enterprises should seize the opportunities brought about by the development of NQP at the macro level, accelerate the adoption of new digital elements and advanced digital technologies, avoid information distortion caused by the transmission of new productive forces, and continuously advance their LCT. On the other hand, high-carbon enterprises should actively adopt low-carbon strategic decisions, moderately increase investment in energy conservation and low-carbon technologies, and target pollution and carbon emission control areas with precision. They should also foster a consistent low-carbon and environmental protection mindset within the enterprise, proactively fulfill environmental governance responsibilities, and enhance ESG performance. Through comprehensive carbon management initiatives across the entire enterprise lifecycle, they can effectively drive industrial LCT.

6.3. Limitations and Prospects

This study adopts a multi-dimensional perspective integrating macro and micro data to investigate the impact effects and transmission channels of NQP on the LCT of CIIs. However, due to the unavailability of data from carbon-intensive enterprises, we only selected listed companies as the research subjects, which may result in an incomplete analysis of the impact of NQP at the micro-enterprise level. Additionally, the evaluation and measurement model designed based on the implementation pathways of NQP may not fully capture all relevant indicators. In the future, we will attempt to collect first-hand enterprise data through surveys and enhance the interpretability of results by case analyses of representative high-carbon enterprises. Meanwhile, we will emphasize the core driving role of disruptive and original innovation in the development of NQP and delve deeper into the differing impacts on industrial LCT.

Author Contributions

Conceptualization, H.W. and J.Z.; Data collection, H.W.; Methodology, H.W.; Software, H.W. and J.Z.; Formal analysis, H.W.; Paper writing, H.W. and F.D.; Investigation and proof, K.G.; Writing-Review & Editing, K.G. and F.D.; Supervision, K.G. and F.D.; funding acquisition, H.W. All authors have read and agreed to the published version of the manuscript.

Funding

This research was made possible as a result of the National Social Science Foundation of China 23CGL042).

Data Availability Statement

The data in this paper are all obtained from the China Statistical Yearbook, CISY, China Environmental Statistical Yearbook, regional statistical yearbooks and bulletins, Wind Information, CSMAR database, annual reports of enterprises, and other public sources and databases. Original contributions have been presented in the study. Further inquiries will be made available on request.

Conflicts of Interest

The authors declare no conflicts of interest.

Abbreviations

The following abbreviations are used in this manuscript:
CIIscarbon-intensive industries
CEADsChina Emission Accounts and Datasets
LCTlow-carbon transformation
NQPnew quality productivity
CISYChina Industrial Statistical Yearbook
GMLglobal Malmquist–Luenberger
SBMSlack-Based Measure directional distance function
CPIcarbon-intensive index
EREFAsenergy-rich and ecologically fragile areas

References

  1. Ding, Q.; Khattak, S.I.; Ahmad, M. Towards Sustainable Production and Consumption: Assessing the Impact of Energy Productivity and Eco-Innovation on Consumption-Based Carbon Dioxide Emissions (CCO2) in G-7 Nations. Sustain. Prod. Consum. 2021, 27, 254–268. [Google Scholar] [CrossRef]
  2. Sun, J.; Cui, J.; Dong, F.; Liu, Y. Regional Decomposition and Attribution Analysis of Carbon-Emission Intensity Using an Extended Approach Combined with a Meta-Frontier Non-Radial Malmquist-Luenberger Productivity Index. Environ. Impact Assess. Rev. 2024, 106, 107473. [Google Scholar] [CrossRef]
  3. Dong, F.; Li, Z.; Huang, Z.; Liu, Y. Extreme Weather, Policy Uncertainty, and Risk Spillovers between Energy, Financial, and Carbon Markets. Energy Econ. 2024, 137, 107761. [Google Scholar] [CrossRef]
  4. Ding, X.; Ma, G.; Cao, J. The Emission-Reduction Effect of Green Demand Preference in Carbon Market and Macro-Environmental Policy: A DSGE Approach. Sustainability 2024, 16, 6741. [Google Scholar] [CrossRef]
  5. Kilinc-Ata, N.; Rahman, M.P. Digitalization and Financial Development Contribution to the Green Energy Transition in Malaysia: Findings from the BARDL Approach. Nat. Resour. Forum, 2024; early view. [Google Scholar] [CrossRef]
  6. Wang, B.; Duan, M. Have China’s Emissions Trading Systems Reduced Carbon Emissions? Firm-Level Evidence from the Power Sector. Appl. Energy 2025, 378, 124802. [Google Scholar] [CrossRef]
  7. Duan, H.; Mo, J.; Fan, Y.; Wang, S. Achieving China’s Energy and Climate Policy Targets in 2030 under Multiple Uncertainties. Energy Econ. 2018, 70, 45–60. [Google Scholar] [CrossRef]
  8. Chen, Y.; Xu, Z.; Zhang, Z.; Ye, W.; Yang, Y.; Gong, Z. Does the Carbon Emission Trading Scheme Boost Corporate Environmental and Financial Performance in China? J. Clean. Prod. 2022, 368, 133151. [Google Scholar] [CrossRef]
  9. Huo, W.; Qi, J.; Yang, T.; Liu, J.; Liu, M.; Zhou, Z. Effects of China’s Pilot Low-Carbon City Policy on Carbon Emission Reduction: A Quasi-Natural Experiment Based on Satellite Data. Technol. Forecast. Soc. Change 2022, 175, 121422. [Google Scholar] [CrossRef]
  10. Yu, L.; Miao, O.; Tang, X. Smart City Construction and Quality Upgrading of Export Products: Evidence from China. J. Asian Econ. 2024, 95, 101813. [Google Scholar] [CrossRef]
  11. Liu, J.; Wei, D.; Wu, L.; Yang, H.; Song, X. Synergy and Heterogeneity of Driving Factors of Carbon Emissions in China’s Energy-Intensive Industries. Ecol. Indic. 2022, 142, 109161. [Google Scholar] [CrossRef]
  12. Xu, B. A Spatial Analysis of an Effective Path for Low-Carbon Development of Energy-Intensive Industries. Sustain. Prod. Consum. 2023, 37, 227–241. [Google Scholar] [CrossRef]
  13. Yue, S.; Bajuri, N.H.; Khatib, S.F.A.; Lee, Y. New Quality Productivity and Environmental Innovation: The Hostile Moderating Roles of Managerial Empowerment and Board Centralization. J. Environ. Manag. 2024, 370, 122423. [Google Scholar] [CrossRef] [PubMed]
  14. Fu, Q.; Zhao, S. Influence of Green Finance on New-Quality Productivity of Enterprises: Evidence from Chinese A-Share Listed Companies. Int. Rev. Financ. Anal. 2025, 105, 104356. [Google Scholar] [CrossRef]
  15. Wang, J.; Qiao, L.; Zhu, G.; Di, K.; Zhang, X. Research on the Driving Factors and Impact Mechanisms of Green New Quality Productive Forces in High-Tech Retail Enterprises under China’s Dual Carbon Goals. J. Retail. Consum. Serv. 2025, 82, 104092. [Google Scholar] [CrossRef]
  16. Xu, T.; Yang, G.; Chen, T. The Role of Green Finance and Digital Inclusive Finance in Promoting Economic Sustainable Development: A Perspective from New Quality Productivity. J. Environ. Manag. 2024, 370, 122892. [Google Scholar] [CrossRef] [PubMed]
  17. Yu, L.; Zhang, Q. Measurement of New Qualitative Productivity Kinetic Energy from the Perspective of Digital and Green Collaboration—Comparative Study Based on European Countries. J. Clean. Prod. 2024, 476, 143787. [Google Scholar] [CrossRef]
  18. Liu, X.; Liu, D. How Green Finance Drives New-Quality Productivity from the Perspective of Chinese Modernization. Financ. Res. Lett. 2025, 82, 107496. [Google Scholar] [CrossRef]
  19. Zhang, Q.; Zhao, X. Can the Digital Economy Facilitate the Optimization of Industrial Structure in Resource-Based Cities? Struct. Change Econ. Dyn. 2024, 71, 405–416. [Google Scholar] [CrossRef]
  20. Pan, W.; Xie, T.; Wang, Z.; Ma, L. Digital Economy: An Innovation Driver for Total Factor Productivity. J. Bus. Res. 2022, 139, 303–311. [Google Scholar] [CrossRef]
  21. Gereffi, G. International Trade and Industrial Upgrading in the Apparel Commodity Chain. J. Int. Econ. 1999, 48, 37–70. [Google Scholar] [CrossRef]
  22. Cui, J.; Du, D. New Quality Productive Forces, Urban-Rural Integration and Industrial Chain Resilience. Int. Rev. Econ. Financ. 2025, 102, 104245. [Google Scholar] [CrossRef]
  23. Chung, Y.H.; Färe, R.; Grosskopf, S. Productivity and Undesirable Outputs: A Directional Distance Function Approach. J. Environ. Manag. 1997, 51, 229–240. [Google Scholar] [CrossRef]
  24. Mao, W.; Sun, H.; Wang, W.; Luo, D. Factor Reallocation Path for Low-Carbon Transformation: A Perspective of Manufacturing Industry Ecosystem. Energy Econ. 2024, 134, 107620. [Google Scholar] [CrossRef]
  25. Chen, L.; Xu, L.; Yang, Z. Accounting Carbon Emission Changes under Regional Industrial Transfer in an Urban Agglomeration in China’s Pearl River Delta. J. Clean. Prod. 2017, 167, 110–119. [Google Scholar] [CrossRef]
  26. Zhang, W.; Li, B. Energy-Use Rights Trading, Technological Innovation, and Green Transformation of Energy-Intensive Manufacturing Enterprises. Econ. Anal. Policy 2025, 86, 528–544. [Google Scholar] [CrossRef]
  27. Liu, Y.; He, Z. Synergistic Industrial Agglomeration, New Quality Productive Forces and High-Quality Development of the Manufacturing Industry. Int. Rev. Econ. Financ. 2024, 94, 103373. [Google Scholar] [CrossRef]
  28. He, A.; Xue, Q.; Zhao, R.; Wang, D. Renewable Energy Technological Innovation, Market Forces, and Carbon Emission Efficiency. Sci. Total Environ. 2021, 796, 148908. [Google Scholar] [CrossRef]
  29. Li, Z.; Wang, J. The Dynamic Impact of Digital Economy on Carbon Emission Reduction: Evidence City-Level Empirical Data in China. J. Clean. Prod. 2022, 351, 131570. [Google Scholar] [CrossRef]
  30. You, J.; Zhang, W. How Heterogeneous Technological Progress Promotes Industrial Structure Upgrading and Industrial Carbon Efficiency? Evidence from China’s Industries. Energy 2022, 247, 123386. [Google Scholar] [CrossRef]
  31. Zeng, S.; Li, T.; Wu, S.; Gao, W.; Li, G. Does Green Technology Progress Have a Significant Impact on Carbon Dioxide Emissions? Energy Econ. 2024, 133, 107524. [Google Scholar] [CrossRef]
  32. Wang, L.; Chen, L. Impacts of Digital Economy Agglomeration on Carbon Emission: A Two-Tier Stochastic Frontier and Spatial Decomposition Analysis of China. Sustain. Cities Soc. 2023, 95, 104624. [Google Scholar] [CrossRef]
  33. Chang, H.; Ding, Q.; Zhao, W.; Hou, N.; Liu, W. The Digital Economy, Industrial Structure Upgrading, and Carbon Emission Intensity——Empirical Evidence from China’s Provinces. Energy Strateg. Rev. 2023, 50, 101218. [Google Scholar] [CrossRef]
  34. Feng, J.-C.; Sun, L.; Yan, J. Carbon Sequestration via Shellfish Farming: A Potential Negative Emissions Technology. Renew. Sustain. Energy Rev. 2023, 171, 113018. [Google Scholar] [CrossRef]
  35. Leitão, J.; Ferreira, J.; Santibanez-González, E. New Insights into Decoupling Economic Growth, Technological Progress and Carbon Dioxide Emissions: Evidence from 40 Countries. Technol. Forecast. Soc. Change 2022, 174, 121250. [Google Scholar] [CrossRef]
  36. Zhou, P.; Ang, B.W.; Han, J.Y. Total Factor Carbon Emission Performance: A Malmquist Index Analysis. Energy Econ. 2010, 32, 194–201. [Google Scholar] [CrossRef]
  37. Guo, L.; Tan, W. Analyzing the Synergistic Influence of Green Credit and Green Technology Innovation in Driving the Low-Carbon Transition of the Energy Consumption Structure. Sustain. Energy Technol. Assess. 2024, 63, 103633. [Google Scholar] [CrossRef]
  38. Liu, H.; Cai, X.; Zhang, Z.; Wang, D. Can Green Technology Innovations Achieve the Collaborative Management of Pollution Reduction and Carbon Emissions Reduction? Evidence from the Chinese Industrial Sector. Environ. Res. 2025, 264, 120400. [Google Scholar] [CrossRef]
  39. Zhou, X.; Song, L. Low-Carbon Transformation of China’s Industry: Realistic Analysis and Policy Thinking. Quant. Tech. Econ. Res. 2022, 39, 22. [Google Scholar] [CrossRef]
  40. Ma, Q.; Tariq, M.; Mahmood, H.; Khan, Z. The Nexus between Digital Economy and Carbon Dioxide Emissions in China: The Moderating Role of Investments in Research and Development. Technol. Soc. 2022, 68, 101910. [Google Scholar] [CrossRef]
  41. Ozturk, I.; Ullah, S. Does Digital Financial Inclusion Matter for Economic Growth and Environmental Sustainability in OBRI Economies? An Empirical Analysis. Resour. Conserv. Recycl. 2022, 185, 106489. [Google Scholar] [CrossRef]
  42. Wang, J.; Dong, K.; Dong, X.; Taghizadeh-Hesary, F. Assessing the Digital Economy and Its Carbon-Mitigation Effects: The Case of China. Energy Econ. 2022, 113, 106198. [Google Scholar] [CrossRef]
  43. Yang, X.; Hunjra, A.I.; Grebinevych, O.; Roubaud, D.; Zhao, S. Roads to Sustainable Development: Pioneering Industrial Green Transformation through Digital Economy Policy. J. Environ. Manag. 2025, 387, 125721. [Google Scholar] [CrossRef]
  44. Ai, M.; Zhang, W.; Du, S.; Yu, X.; Bu, Y. The Impact of Digitalization on the Green Transformation of China’s Industrial Sectors: The Mediating Role of Green Technology Innovation and Technological Transformation. Int. Rev. Econ. Financ. 2024, 96, 103736. [Google Scholar] [CrossRef]
  45. Peng, W.; Yang, J.; Lu, X.; Mauzerall, D.L. Potential Co-Benefits of Electrification for Air Quality, Health, and CO2 Mitigation in 2030 China. Appl. Energy 2018, 218, 511–519. [Google Scholar] [CrossRef]
  46. Xu, M.; Qin, Z.; Zhang, S. Carbon Dioxide Mitigation Co-Effect Analysis of Clean Air Policies: Lessons and Perspectives in China’s Beijing–Tianjin–Hebei Region. Environ. Res. Lett. 2021, 16, 015006. [Google Scholar] [CrossRef]
  47. Ren, Z.; Zheng, J.; Jiao, L.; He, M.; Hou, X.; Coffman, D.; Wang, S. The Synergic Impacts of Air Pollution Control Policies on Pollutants and Carbon Emissions. J. Environ. Manag. 2024, 370, 122730. [Google Scholar] [CrossRef]
  48. Zhao, T.; Liu, Z. A Novel Analysis of Carbon Capture and Storage (CCS) Technology Adoption: An Evolutionary Game Model between Stakeholders. Energy 2019, 189, 116352. [Google Scholar] [CrossRef]
  49. Pingkuo, L.; Jiahao, W. Study on the Diffusion of CCUS Technology under Carbon Trading Mechanism: Based on the Perspective of Tripartite Evolutionary Game among Thermal Power Enterprises, Government and Public. J. Clean. Prod. 2024, 438, 140730. [Google Scholar] [CrossRef]
  50. Wang, S.; Liu, C.; Zhou, Z. Government-Enterprise Green Collaborative Governance and Urban Carbon Emission Reduction: Empirical Evidence from Green PPP Programs. Environ. Res. 2024, 257, 119335. [Google Scholar] [CrossRef]
  51. Che, S.; Wang, J.; Chen, H. Can China’s Decentralized Energy Governance Reduce Carbon Emissions? Evidence from New Energy Demonstration Cities. Energy 2023, 284, 128665. [Google Scholar] [CrossRef]
  52. Luo, J.; Jin, X.; Hu, Y. Top-down or Bottom-up? Government Policies, Public Awareness and Carbon Reduction. Econ. Anal. Policy 2024, 83, 118–129. [Google Scholar] [CrossRef]
  53. Ai, H.; Mangla, S.K.; Song, M.; Tan, X.; Zhang, S. Technology-Enabled Business Model Innovation and Carbon Emission Reduction: Evidence from a Place-Based Policy in China. Technovation 2024, 134, 103052. [Google Scholar] [CrossRef]
  54. Zhang, L.; Chen, X.; Xu, Z. Can Development Zones Reduce Energy Consumption and Carbon Emissions of Enterprises? Evidence from China. J. Asian Econ. 2024, 95, 101845. [Google Scholar] [CrossRef]
  55. Li, Z.; Wang, Y.; Bai, T. International Digital Trade and Synergetic Control of Pollution and Carbon Emissions: Theory and Evidence Based on a Nonlinear Framework. J. Environ. Manag. 2025, 376, 124450. [Google Scholar] [CrossRef]
  56. Liu, H.; Han, P.; Wang, D.; Wang, S.; Bao, H. Decoding Enterprise Digital Transformation: External Oversight and Carbon Emission Reduction Performance. J. Environ. Manag. 2024, 359, 121039. [Google Scholar] [CrossRef]
  57. Caglar, A.E.; Yavuz, E. The Role of Environmental Protection Expenditures and Renewable Energy Consumption in the Context of Ecological Challenges: Insights from the European Union with the Novel Panel Econometric Approach. J. Environ. Manag. 2023, 331, 117317. [Google Scholar] [CrossRef]
  58. Ma, Q.; Murshed, M.; Khan, Z. The Nexuses between Energy Investments, Technological Innovations, Emission Taxes, and Carbon Emissions in China. Energy Policy 2021, 155, 112345. [Google Scholar] [CrossRef]
  59. Yang, J.; Wang, Y.; Tang, C.; Zhang, Z. Can Digitalization Reduce Industrial Pollution? Roles of Environmental Investment and Green Innovation. Environ. Res. 2024, 240, 117442. [Google Scholar] [CrossRef]
  60. Zhong, Z.; Peng, B. Can Environmental Regulation Promote Green Innovation in Heavily Polluting Enterprises? Empirical Evidence from a Quasi-Natural Experiment in China. Sustain. Prod. Consum. 2022, 30, 815–828. [Google Scholar] [CrossRef]
  61. Tolstykh, T.; Shmeleva, N.; Gamidullaeva, L.; Krasnobaeva, V. The Role of Collaboration in the Development of Industrial Enterprises Integration. Sustainability 2023, 15, 7180. [Google Scholar] [CrossRef]
  62. Gamidullaeva, L.; Shmeleva, N.; Tolstykh, T.; Shmatko, A. An Assessment Approach to Circular Business Models within an Industrial Ecosystem for Sustainable Territorial Development. Sustainability 2022, 14, 704. [Google Scholar] [CrossRef]
  63. Yang, B.; Zhao, Q. The Effects of Environmental Regulation and Environmental Protection Investment on Green Technology Innovation of Enterprises in Heavily Polluting Industries—Based on Threshold and Mediation Effect Models. Front. Environ. Sci. 2023, 11, 1167581. [Google Scholar] [CrossRef]
  64. Wang, S.; Li, J. How Do Energy Input and Carbon Emission Constraints Affect the ESG Performance of Manufacturing Enterprises? Evidence from China. Sustain. Futures 2024, 8, 100318. [Google Scholar] [CrossRef]
  65. Xu, B. Environmental Regulations, Technological Innovation, and Low Carbon Transformation: A Case of the Logistics Industry in China. J. Clean. Prod. 2024, 439, 140710. [Google Scholar] [CrossRef]
  66. Oh, D. A Global Malmquist-Luenberger Productivity Index. J. Product. Anal. 2010, 34, 183–197. [Google Scholar] [CrossRef]
  67. Wang, Q.; Li, L.; Li, R. The Asymmetric Impact of Renewable and Non-Renewable Energy on Total Factor Carbon Productivity in 114 Countries: Do Urbanization and Income Inequality Matter? Energy Strateg. Rev. 2022, 44, 100942. [Google Scholar] [CrossRef]
  68. Zhao, X.; Liu, C.; Yang, M. The Effects of Environmental Regulation on China’s Total Factor Productivity: An Empirical Study of Carbon-Intensive Industries. J. Clean. Prod. 2018, 179, 325–334. [Google Scholar] [CrossRef]
  69. Bian, Z.; Liu, J.; Zhang, Y.; Peng, B.; Jiao, J. A Green Path towards Sustainable Development: The Impact of Carbon Emissions Trading System on Urban Green Transformation Development. J. Clean. Prod. 2024, 442, 140943. [Google Scholar] [CrossRef]
  70. Chen, J.; Meng, W.; Dong, Y.; Zhou, W. Geographic Matching Analysis between Green Finance Development and Carbon Emissions in China’s New Era of Environmental Transition. Res. Int. Bus. Financ. 2025, 73, 102581. [Google Scholar] [CrossRef]
  71. Ye, M.; Zeng, W. Government Innovation Preferences, Institutional Fragility, and Digital Economic Development. Econ. Anal. Policy 2024, 81, 541–555. [Google Scholar] [CrossRef]
  72. Cui, G. How Do Environmental Taxes Affect the Environmental Investment of High-Emission Enterprises: Evidence from China. J. Environ. Manag. 2024, 370, 122629. [Google Scholar] [CrossRef]
  73. Yang, F.; Chen, T.; Zhang, Z. Can Environmental, Social, and Governance Performance Drive Two-Way Foreign Direct Investment Behavior? Evidence from Chinese Listed Companies. J. Clean. Prod. 2023, 430, 139761. [Google Scholar] [CrossRef]
  74. Zhao, X.; Zhao, Y.; Zeng, S.; Zhang, S. Corporate Behavior and Competitiveness: Impact of Environmental Regulation on Chinese Firms. J. Clean. Prod. 2015, 86, 311–322. [Google Scholar] [CrossRef]
  75. Wang, C.; Qiu, J.; Chen, B.; Deng, X. Green Finance, Green Culture and Corporate Green Management Innovation: Evidence from Chinese Listed Companies. Financ. Res. Lett. 2024, 67, 105774. [Google Scholar] [CrossRef]
  76. Lindman, Å.; Söderholm, P. Wind Energy and Green Economy in Europe: Measuring Policy-Induced Innovation Using Patent Data. Appl. Energy 2016, 179, 1351–1359. [Google Scholar] [CrossRef]
  77. Nie, Y.; Li, Q.; Wang, E.; Zhang, T. Study of the Nonlinear Relations between Economic Growth and Carbon Dioxide Emissions in the Eastern, Central and Western Regions of China. J. Clean. Prod. 2019, 219, 713–722. [Google Scholar] [CrossRef]
  78. Tian, X.; Dai, H.; Geng, Y.; Huang, Z.; Masui, T.; Fujita, T. The Effects of Carbon Reduction on Sectoral Competitiveness in China: A Case of Shanghai. Appl. Energy 2017, 197, 270–278. [Google Scholar] [CrossRef]
  79. Zhao, H.; Liu, Y.; Lindley, S.; Meng, F.; Niu, M. Change, Mechanism, and Response of Pollutant Discharge Pattern Resulting from Manufacturing Industrial Transfer: A Case Study of the Pan-Yangtze River Delta, China. J. Clean. Prod. 2020, 244, 118587. [Google Scholar] [CrossRef]
  80. Huang, C.; Lin, Z.; Wu, J.; Li, P.; Zhang, C.; Liu, Y.; Chen, W.; Xu, X.; Deng, J. AI-Based Carbon Peak Prediction and Energy Transition Optimization for Thermal Power Industry in Energy-Intensive Regions of China. Energy Convers. Manag. X 2025, 25, 100884. [Google Scholar] [CrossRef]
  81. Zhang, Q.-Y.; Cai, B.-F.; Wang, M.-D.; Wang, J.-X.; Xing, Y.-K.; Dong, G.-X.; Zhang, Z.; Mao, X.-Q. City Level CO2 and Local Air Pollutants Co-Control Performance Evaluation: A Case Study of 113 Key Environmental Protection Cities in China. Adv. Clim. Chang. Res. 2022, 13, 118–130. [Google Scholar] [CrossRef]
  82. Zhao, M.; Fu, X.; Du, J.; Cui, L. Optimal Environmental Investment Strategies for Enterprise Green Technology Innovation: An Empirical Study Based on Multiple Drive Models. J. Environ. Manag. 2024, 370, 122624. [Google Scholar] [CrossRef] [PubMed]
  83. Zhu, X.; Zuo, X.; Li, H. The Dual Effects of Heterogeneous Environmental Regulation on the Technological Innovation of Chinese Steel Enterprises—Based on a High-Dimensional Fixed Effects Model. Ecol. Econ. 2021, 188, 107113. [Google Scholar] [CrossRef]
  84. Lin, B.; Li, M. Emerging Industry Development and Information Transmission in Financial Markets: Evidence from China’s Renewable Energy. Energy Econ. 2023, 128, 107192. [Google Scholar] [CrossRef]
  85. Boulanouar, Z.; Essid, L.; Omri, A. Achieving Carbon Neutrality in Emerging Markets: The Dual Impact of Energy Transition Investments on Economic Growth and Carbon Emissions. Int. Rev. Econ. Financ. 2024, 96, 103709. [Google Scholar] [CrossRef]
  86. Li, J.; Xu, X. Can ESG Rating Reduce Corporate Carbon Emissions?–An Empirical Study from Chinese Listed Companies. J. Clean. Prod. 2024, 434, 140226. [Google Scholar] [CrossRef]
Figure 1. The impact mechanism of the current research.
Energies 18 03278 g001
Figure 2. The input-output diagram of the super-efficient SBM Model.
Energies 18 03278 g002
Figure 3. Macro and micro mechanism diagram of the impact between NQP and the LCT of CIIs.
Energies 18 03278 g003
Table 1. Identification of CIIs.
NumberCIIsMean CPINumberCIIsMean CPI
1Electricity and heat production and supply5.35367Ferrous metal mining0.0609
2Ferrous metal smelting and rolling processing industry0.64148Petroleum processing, coking, and nuclear fuel processing0.0579
3Non-metallic Mineral Products0.43739Non-metallic mining0.0503
4Coal Mining and Washing0.324710Non-ferrous metal smelting and rolling processing0.0234
5Oil and Gas Mining0.189611Non-ferrous metal mining0.0162
6Chemical raw materials and chemical products manufacturing0.0751
Note: The top 12 CPIs and their mean values for each industry remain stable in each year from 2011 to 2022. Because other mining industries are not included in 2011 and there are serious data gaps, the top 11 industries with stable rankings are selected as the CIIs.
Table 2. Descriptive statistics and correlation analysis.
VariablesSymbolMeasurementMeanStd. Dev.VIF
Explained VariablesLCT of CIIsLTCPLow-carbon total factor productivity0.73950.7755/
Explanatory VariablesNew quality productivityNQPMeasured by the evaluation system (Due to space limitations, further inquiries will be made available on request.)0.48220.10813.37
Macro mechanism variablesEnvironmental governance investmentsEGIThe ratio of investment in industrial governance to value-added of secondary production with 2010 as the base period0.20810.20891.36
Green innovationGINumber of green invention patents applied0.33550.48922.52
Micro mechanism variablesEnergy-saving and low-carbon investmentsESLIDetails of ESLI in the Annual Report3.048414.69071.07
ESG performanceESGESG Rating Score in the CSI database4.09130.99561.15
Green management innovationGMIEnterprise environmental regulation and disclosure 5-category summed scores1.42551.48861.20
Green technology innovationGTITotal green invention patents applied by enterprise6.001752.24601.14
Control variablesEconomic developmentPCGDPGDP per capita for the 2010 base period10.82890.45462.14
Foreign tradeOPENThe proportion of import and export volume to GDP0.27350.27991.86
Financial developmentFIDThe proportion of various loan balances to GDP1.58610.53442.90
Market competitionMACNumber of industrial enterprises above designated size8.86371.19423.12
Energy saving effortsEPEExpenditures on energy conservation and environmental protection0.80440.51072.41
Table 3. Results of the Baseline regression analysis.
Variables(1)(2)(3)(4)(5)(6)(7)
NQP0.9222 **0.9587 **1.9285 ***
(0.4148)(0.4431)(0.5131)
PCGDP−0.4345 **−0.5160 ***0.8756 **0.7548 *0.6715 *0.9230 **1.0973 ***
(0.1697)(0.1883)(0.3989)(0.4182)(0.4061)(0.4034)(0.4037)
OPEN0.0048−0.2019−0.5860 **−0.5037 **−0.4349 *−0.5892 **−0.6908 ***
(0.1911)(0.2062)(0.2271)(0.2366)(0.2320)(0.2301)(0.2315)
FID0.1439 *0.1596 *0.1672 *0.10540.12580.15590.1843 *
(0.0804)(0.0876)(0.0946)(0.0982)(0.0947)(0.0957)(0.0971)
MAC−0.0663−0.0088−0.1634 *−0.2112 **−0.1746 **−0.1889 **−0.1684 *
(0.0615)(0.0730)(0.0842)(0.0854)(0.0838)(0.0849)(0.0861)
EPE−0.1472 ***−0.1522 ***−0.1058 *−0.0998−0.0863−0.1049 *−0.0944
(0.0565)(0.0571)(0.0603)(0.0610)(0.0600)(0.0610)(0.0612)
TEI 5.4156 **
(2.1750)
INI 9.4687 ***
(2.3577)
DGI 3.9585 ***
(1.4894)
GRI 1.3284 *
(0.7219)
Constant5.4769 ***5.8682 ***−7.5612 **−5.3024−5.2106−7.2435 *−9.4733 **
(1.5326)(1.7139)(3.8005)(4.0431)(3.8668)(3.8617)(3.8965)
IndividualNYYYYYY
YearNNYYYYY
R-squared0.03780.04280.10840.08630.11390.08880.0782
Obs360360360360360360360
Note: ***, **, and * refer to the significance levels at 1%, 5%, and 10%, with standard errors in parentheses.
Table 4. Results of robustness test.
Variables(1)(2)(3)(4)
MLLTCPLTCPLTCP
NQP1.3373 *1.3021 ***4.3790 **1.6507 ***
(0.7160)(0.4207)(2.1988)(0.4846)
L.LTCP −0.4556
(0.3669)
Constant−10.7287 **−6.6483 *16.2339 **
(5.3033)(3.4259)(7.1227)
ControlsYESYESYESYES
IndividualYESYESYESYES
YearYESYESYESYES
Spatial rho −37.9122 ***
(5.7625)
σ2 0.0271 ***
(0.0021)
AR(1) 0.75
[0.454]
AR(2) 0.42
[0.674]
Sargan test 4.54
[0.337]
R-squared/Wald chi20.33120.101927.33 ***0.0075
Obs360300330360
Note: ***, **, and * refer to the significance levels at 1%, 5%, and 10%, the p values are in square brackets.
Table 5. Results of heterogeneity analysis.
VariablesRegional DistributionCarbon IntensityCarbon Trading PilotEREFAs
EasternCentral and WesternHighLowYesNoYesNo
(1)(2)(3)(4)(5)(6)(7)(8)
NQP2.8072 **0.6820 ***2.0358 ***3.9334 *4.4631 **1.8682 ***0.4629 **3.5840 ***
(1.1184)(0.2167)(0.5225)(2.1380)(2.1417)(0.5083)(0.1927)(1.0989)
Constant−31.8885 ***−1.5458−6.1865 *−35.8864 **−12.1306−8.3741 **−2.5508 **−16.6629
(10.9186)(1.2523)(3.4445)(17.5282)(17.6677)(3.4940)(1.0753)(11.9817)
ControlsYYYYYYYY
IndividualYYYYYYYY
YearYYYYYYYY
Obs1322282887272288216144
R-squared0.28960.35200.18120.38500.34540.15360.48030.2889
Note: ***, **, and * refer to the significance levels at 1%, 5%, and 10%.
Table 6. Results of macro-mechanism test.
Variables(1)(2)(3)(4)
EGIGILTCPLTCP
NQP0.9166 *** −0.0564
(0.3528) (0.5601)
EGI 0.2374 *** −0.0237
(0.0757) (0.0773)
GI 0.4475 ***0.4539 ***
(0.0556)(0.0656)
Constant0.2791−2.8400−7.1677 **−7.1788 **
(2.6130)(3.5306)(3.5338)(3.5484)
ControlsYYYY
IndividualYYYY
YearYYYY
Obs360360360360
R-squared0.39650.55850.22770.2280
Note: ***, ** refer to the significance levels at 1%, 5%.
Table 7. Results of micro-mechanism.
Variables(1)(2)(3)(4)(5)(6)(7)(8)(9)(10)(11)
LTCPLTCPESLIGMIGTILTCPESGGMILTCPGTILTCP
NQP—Low-Carbon Investment—Green Innovation—LCTNQP—ESG—Green Innovation—LCT
NQP2 6.7338 ***56.4197 *** 6.6799 ***4.5577 *** 6.6891 ***
(0.3338)(15.5780) (0.3348)(1.2383) (0.3347)
NQP0.2170−5.7132 ***−62.4989 *** −5.6529 ***−4.9403 *** −5.6648 ***
(0.2169)(0.3550)(16.5693) (0.3562)(1.3170) (0.3560)
ESLI 0.0006−0.04500.0010 **
(0.0022)(0.0326)(0.0005)
ESG 0.1484 *** −0.11910.0098 *
(0.0275) (0.4101)(0.0058)
GMI 0.0051
(0.0049)
Constant−0.01854.0994 **−14.0497−11.0002−1.20214.1118 **−16.6300 ***−8.24050.0819−0.74444.2623 **
(1.7882)(1.6538)(77.1814)(7.8824)(116.6345)(1.6536)(6.1348)(7.8468)(1.7884)(116.8798)(1.6559)
ControlsYYYYYYYYYYY
IndividualYYYYYYYYYYY
YearYYYYYYYYYYY
IndustryYYYYYYYYYYY
R-squared0.89060.90790.63660.62420.93340.90810.49990.62980.89060.93330.9080
Obs23882388238623862386238623882388238823882388
Note: ***, **, and * refer to the significance levels at 1%, 5%, and 10%.
Disclaimer/Publisher’s Note: The statements, opinions and data contained in all publications are solely those of the individual author(s) and contributor(s) and not of MDPI and/or the editor(s). MDPI and/or the editor(s) disclaim responsibility for any injury to people or property resulting from any ideas, methods, instructions or products referred to in the content.

