Article

Planning Scheme for Optimal PMU Location Considering Power System Expansion

1
Master’s Program in Electricity, Salesian Polytechnic University, Quito EC170702, Ecuador
2
Smart Grid Research Group—GIREI (Spanish Acronym), Electrical Engineering Department, Salesian Polytechnic University, Quito EC170702, Ecuador
*
Author to whom correspondence should be addressed.
Energies 2025, 18(13), 3283; https://doi.org/10.3390/en18133283 (registering DOI)
Submission received: 24 April 2025 / Revised: 7 June 2025 / Accepted: 17 June 2025 / Published: 23 June 2025

Abstract

In the present research, a methodology was developed for the deployment and optimal location of PMUs with redundancy and system observability constraints at 100%, considering the topological changes generated by transmission expansion planning (TEP). To determine the expansion scenarios and topology changes of the power system, the original IEEE test systems of 14, 30, and 118 buses were used as a starting point, in which a 20-year horizon was considered and an increase in load nodes was proposed, with which the new lines needed were determined by applying TEP. Under these temporal and expansion scenarios, the optimal location of PMUs was determined based on mixed-integer linear optimization, with which the order of location of PMUs was determined. The results of the methodology allow defining the order of PMU implementation in power systems that expand over time.

1. Introduction

In recent years, the development of measurement systems has evolved, resulting in improved performance in obtaining and recording system parameters in real time [1]. These systems have an advanced monitoring and control infrastructure called WAMS (Wide-Area Measurement System) [2], which is based on the implementation of Phasor Measurement Units (PMUs) and fast communication systems [3,4].
PMUs are devices composed of microprocessors; the current and voltage signals coming from the measurement equipment are collected and sent in the form of pulses per second (PPS) via global positioning system (GPS) satellites and recorded in the control center. The quality of the information sent by these synchrophasors enables the real-time estimation of the electric power system (EPS). It makes direct and accurate measurements of the phase angles possible [5]. These attributes make PMUs currently the most effective option for obtaining state estimations based on complete topological observations of the system.
One of the main drawbacks to the deployment of PMUs is the limited storage capacity of communication systems [2], which does not allow the sending and storage of the large number of records generated by PMUs. These records are used to derive the optimal PMU placement (OPP) problem. Based on the OPP problem, several strategies have been developed to minimize the number of PMUs, considering various constraints and operating conditions, including total observability [6], N-1 contingencies [7,8], N-2 contingencies, measurement redundancy [9], existing conventional meters [10], PMU channel capacity [10,11,12], and the PMU loss [12], among others [13]. Some researchers have investigated transmission system expansion [2,8,14].
The OPP problem is an NP-complete binary optimization problem with 2 n possible solutions in an n-bus electric power system (EPS). To solve the optimization problem, several numerical techniques [15] and heuristic models [10] have been developed, which can be categorized into conventional, modern, and miscellaneous techniques [4]. In recent years, several modern methods using heuristics [16] and metaheuristics [12,17,18,19,20] have been developed. However, conventional methods are the most widely used, with mixed-integer linear programming (MILP) standing out among them [2,7,9].
On the other hand, the growth of demand in electric power systems poses a challenge for those in charge of planning the optimal expansion of electric transmission systems [21], considering factors and restrictions such as reliability, maximum loadability, angular deviation, voltage profile, resolution method, contingencies, and system loss [22]. In many cases, optimal TEP seeks to strengthen the network to make it stable, safe, and reliable [23], thus supplying demand when a single element fails based on the criterion (N-1) established by the regulations [24].
To address optimal TEP, mathematical [22] and heuristic optimization models can be found, as well as metaheuristic models that result from their combination. Mathematical models provide practical results; however, by not considering all factors or restrictions, an optimal TEP is obtained that omits important technical, environmental, and financial  details.
From the perspective of mathematical modeling, TEP is a mixed-integer nonlinear optimization problem [22,25], and the flexibility of the TEP problem allows evaluating it considering different objective functions and constraints that take into account, for example, the cost of a new line, reliability cost, congestion cost, electricity market cost [26], etc. The model constraints can be categorized as either mandatory or optional. Mandatory constraints include generator output power limits, voltage level limits, and transmission power limits on lines. Optional constraints, on the other hand, include investment limits, reliability and safety limits, and environmental impact limits. Taking these into account, the TEP problem is analyzed as a minimization objective function that must consider the mandatory constraints and, depending on the object of study, it can also consider the optional constraints [24].
There are two methods and mathematical models used to solve the TEP problem. The AC model is comprehensive and practical; it considers reactive power and power losses, allows for the inclusion of other devices such as FACTS, and facilitates the analysis of other studies, including voltage stability. However, its resolution becomes lengthy and complex [25,27,28]. In contrast, the DC model is simpler but involves simplifying the constraints; reactive power is not considered, and losses cannot be estimated [29]. However, the agility of its resolution allows for obtaining a good solution to the TEP problem, optimizing time and resources [22].
Heuristic models (HMs) allow the development of skills, procedures, and processes to obtain a reasonable possibility for a specific problem [30]. The results obtained from MHs, due to the lack of a solid foundation, do not offer reliable results for complex networks, which has motivated researchers to use metaheuristic models (MHMs). These models, by using common sense rules, enable an intelligent search for the optimum [31]. Based on the research conducted, MHMs are divided into three categories: evolutionary algorithms, swarm intelligence algorithms, and a combination that merges the principles of the first two. These methods search for an optimum under certain considerations and assumptions; they do not seek to approach the global optimum, so their efficiency is determined by the conditions initially considered by the researcher [24,32].
Considering the studies carried out on the solution to the optimal PMU location and transmission expansion, the present research proposes an optimization model to reduce PMU deployment in the EPS, taking into account the redundancy and observability restrictions, based on mixed-integer programming, within a scheme of optimal planning of the transmission system by stages using the mathematical model from the DC power flow. For this, it is considered that the communications network operates perfectly and is correctly deployed. To test the efficiency of the model, the IEEE 14-, 30-, and 118-bus test systems are utilized to verify the algorithm’s functionality by comparing the number and location of PMUs in two scenarios. The first scenario considers the optimal location of PMUs, disregarding investment costs. In contrast, the second scenario considers a limited number of PMUs and their staged deployment, taking into account implementation costs, to evaluate the levels of observability achieved and thus determine the order of PMU deployment.
The main scientific contribution of this work is the integration of optimal PMU placement with dynamic transmission expansion planning over a multi-year horizon. Unlike previous studies, which typically consider static topologies or fixed planning windows, the proposed methodology adapts PMU deployment to topological changes, thereby avoiding relocation and supporting observability throughout the expansion process. This approach reflects the evolving nature of real power systems, offering planners a scalable and cost-conscious framework for developing long-term measurement infrastructure.
The article is organized as follows. Section 2 describes the optimal PMU location and optimal transmission expansion planning. Section 3 describes the problem formulation. Section 4 analyzes the proposed algorithm’s performance. Conclusions are shown in Section 5.

2. Power System Expansion Planning

The characteristics of the EPS must be considered when analyzing the optimal location of the PMU. Establishing the connectivity matrix (CM) is the first step. The CM is a binary matrix of dimensions n x n , where n is the number of buses in the system. The topology of the SEP is presented with the CM and is determined by (1) [7].
C M n x n = 1 I f b u s i a n d b u s j a r e c o n n e c t e d 0 o t h e r w i s e
Taking the topological conditions and characteristics of the SEP, the following rules can be applied to quantify observability:
1.
If the voltage and current on one side of the branch are known, the values on the other can be determined by applying Ohm’s Law.
2.
ZIB and its repercussions: If only one bus is not observable, applying Kirchhoff’s Law of Currents makes the bus observable.
3.
If the voltage phasors on both sides of a branch are known, the corresponding current phasors can be obtained.

2.1. Optimal PMU Placement Considering Redundancy and Observability Restrictions

To reduce the number of PMUs that must be deployed in the SEP, considering observability and redundancy, (2) is applied; restricted by (3), which assigns at least one PMU to the system, redundancy is maximized with (4), and observability at 100% with (5).
O.F.:
min # P M U = i = 1 n w i X i
s.t.:  
f ( X ) 1
max R = ( N P M U , X i )
X i + j = 1 j b u s e s n X j α i
Consider:
X i = 1 i f P M U i s r e q u i r e d a t n o d e i 0 o t h e r w i s e
While the individual cost of a PMU may appear relatively low, especially when weighed against the benefits it offers in terms of system observability and control, the reality of deploying these devices is more complex. Beyond the hardware, there are significant associated costs such as communication infrastructure, system integration, security protections, and ongoing maintenance that can quickly add up, particularly in large or evolving power systems. For this reason, minimizing the number of PMUs remains a practical and meaningful objective. Rather than undermining system performance, this approach helps ensure a cost-effective deployment strategy, allowing planners to implement PMUs in the most critical locations first and gradually expand coverage as needed. This is especially valuable in scenarios where budgets are limited or where phased implementation aligns better with long-term expansion plans.

2.2. Location of the Minimum Number of PMUs to Maximize Observability

Considering that the cost of implementing PMUs is usually a limiting factor, the question arises of how many PMUs should be implemented and where they should be located to maximize the system’s observability when there is a limited number of PMUs available.
This problem can be solved through the following expression:
Objective function:
max X i , α i O F = i Ω B α i
Subject to:
i Ω B X i N P M U
X i + j Ω i j l X j α i ; i Ω B
1 α i

2.3. Transmission Expansion Planning

The planning of a power system must be implemented before the design and construction activities. It must consider defined processes in the short, medium, and long term, taking into account that short-term planning is related to limitations in the system’s operation, which must be addressed to avoid inconveniences with meeting demand. In contrast, medium-term planning is related to the repowering of the WSS while maintaining a backup or redundancy criterion that ensures system reliability. Long-term planning is oriented towards the construction of new facilities based on projected demand growth [33,34].
The objective function for the TEP is defined in Equation (11), subject to the restrictions expressed in Equations (12) and (13), which relate to operating costs and initial investment.
In addition, the criteria of maximum loadability of transmission lines expressed in (14)–(17) are applied, the power limits of the generators in (18) are also considered and the balance between demand and generation expressed in (19).
F.O:
min O F = T × O C + I C
s.t.:
O C = i = 1 n b u s ( C g × P g ) ; g n g
I C = ( η i , j 0 + β i , j k ) × C L i , j
P i , j k B i , j ( δ i δ j ) ( 1 β i , j k ) × M
M = m a x B i , j × ( δ i δ j )
P i , j m a x × β i , j k P i , j k P i , j m a x × β i , j k ; i , j n L
P g i m i n P g i P g i m a x ; g i n g
P i , j = P g + L S i L i ; i , j n b u s
To provide a broader perspective on existing approaches to PMU placement and transmission expansion planning, we have included a comparative summary of representative studies in Table 1. This table highlights the main characteristics, advantages, and limitations of each methodology, with an emphasis on their optimization techniques, observability criteria, and treatment of system growth or contingencies. By reviewing these contributions side by side, the distinctiveness of our proposed method, particularly its integration of stepwise transmission expansion and observability-aware PMU deployment, becomes more evident. This contextual analysis also helps underline the practical need for a planning framework that adapts dynamically as the power system evolves.

3. Problem Formulation and Methodology

The optimal location of PMUs has been studied extensively. Various methods exist for determining the optimal number of devices to be deployed; similarly, the TEP problem can be analyzed from multiple perspectives to inform the expansion planning model of the EPS.
The present research seeks to establish a methodology to determine the minimum number of PMUs that should be deployed in each stage of a transmission expansion model to obtain 100% observability of the new system topology considering the location of existing PMUs and then evaluate the levels of observability obtained by having limited numbers of PMUs for deployment; in this way, the order and number of PMUs to be deployed is obtained under the observability criterion, Algorithm 1.
Algorithm 1 describes the location of PMUs considering TEP, for which in step 1 the EPS to be studied is initialized, in step two the PMU location is carried out considering observability and redundancy restrictions, starting from a previous location from a previous year, and of course for year 1 there will be no PMUs in the EPS. In step 3, the planning of the EPS expansion is carried out every T years. For each analysis, it returns to step 2 to identify if a new PMU location is required. Finally, in step 4, the results of the expansion and the PMU location are shown for each year T.
Figure 1 illustrates the overall workflow of the proposed methodology, combining PMU placement with transmission expansion planning (TEP) across multiple stages. The iterative nature of the algorithm allows the system to adapt its measurement infrastructure as the network grows over time.
Algorithm 1: Optimal PMU location considering TEP
Step: 1
Input data
EPS Parameterization
Gen_data, line_data, load_data
C M n x n , W i , y e a r t
Step: 2
PMU Minimization
Only consider nodes with X i = 0
O.F.:
  Equation (2)
s.t.:
  Equations (3), (4), (5), (8) and (9)
  Save X i _ n e w
for i=1 to n
  If   X i _ n e w = 1
    X i = 1
    Save X i
  Else
    X i = 0
    Save X i
endfor
Step: 3
TEP
for   y e a r t = 1 to T
  O.F.:
    Equation (11)
  s.t.:
    Equations (12) to (19)
  S a v e r e s u l t s i n D a t a n e w ( : , y e a r t )
  G o t o S t e p 2
endfor
Step: 4
Show results for each year
X i , N S W , υ i , j , α i , j k , P i , j k , δ i

4. Results Analysis

The IEEE 14-bus model is used to explain the results obtained; two transmission expansion scenarios are proposed to demonstrate the effectiveness and benefits of the proposed model. In the first scenario, previous stages of expansion are proposed, starting from systems of 10 buses, 12 buses, and 14 buses. It is proposed that the system expansion be carried out every 5 years; the topology changes are generated by incorporating the lines that connect the new buses. In each stage, algorithms 1 and 3 are applied to determine the order of location of the minimum number of PMUs; in the first system, the minimum number of PMUs is obtained that guarantees observability equal to or greater than 85%, and after this it is proposed that the investment can be made to install a PMU every two years.
Figure 2 shows how the location of PMUs in the EPS is planned, taking into account the expansion works in the power system. In year 0 an initial location is planned, which is the basis for future PMU locations; from there, in year 5, where two new nodes are implemented, the proposed methodology suggests the location of a new PMU, and finally, in year 10, where two nodes are added, a new PMU is required, giving a total of six PMUs in the EPS.
Table 2 shows the results obtained, and a chronological analysis is conducted of the number of PMUs and the observability achieved considering the PMU expansion and deployment scenarios; at the end of the expansion and deployment stages, six PMUs are needed on buses 2, 5, 6, 8, 10 and 14 to guarantee 100% observability of the system (Figure 2); when applying traditional PMU optimal location algorithms to the IEEE model of 14 buses, it is obtained that four PMUs are required on buses 2, 6, 7 and 9, contrasting the results obtained; the number of PMUs under an expansion scheme without considering relocation is greater to guarantee total observability of the system, which implies a greater investment of resources.
To provide a clearer perspective on the effectiveness of our approach, we compared it with a conventional PMU placement strategy that assumes a static system topology. For the IEEE 14-bus test case, traditional models generally identify four PMUs (e.g., at buses 2, 6, 7, and 9) as sufficient to achieve full observability. In contrast, our methodology, designed to accommodate system expansion, proposes a total of six PMUs, placed progressively at buses 2, 5, 6, 8, 10, and 14. While the number may seem higher at first glance, it is essential to note that these PMUs are deployed incrementally, and none require relocation as the network expands. This characteristic is particularly valuable in real-world settings, where infrastructure changes are implemented over time and budgets are typically allocated in stages. By ensuring observability at every step without redundancy losses or reinstallation costs, the proposed model offers a practical and forward-looking alternative to static placement strategies.
Figure 3 shows the evolution of PMU deployment and observability for the IEEE 14-bus system over six expansion stages. The left axis indicates the number of PMUs installed, while the right axis reflects the percentage of observability achieved.
Initially, four PMUs yield 90% observability, and full coverage is reached by year 2 without additional devices. As new buses are added in years 6 and 10, the method adds only the necessary PMUs to maintain 100% observability, demonstrating a deployment strategy that adapts efficiently to system growth.
By anticipating future expansions, the method minimizes reconfiguration and ensures long-term monitoring continuity with minimal investment.
Figure 4 shows the observability coverage of the EPS nodes for each stage considered. In year 0, there is 100% coverage with redundancy in nodes 1 and 5 in only four zones. in year 5, there are five zones to achieve 100% observability and redundancy in nodes 1, 5, and 6; finally, in year 10, there is 100% observability with six zones and redundancy in nodes 1, 5, 6, and 9.
The second scenario considers future stages of transmission expansion based on assumptions, and the minimum number of PMUs is deployed considering redundancy and observability restrictions; taking into consideration the locations found in the first scenario, the proposed algorithm is then applied to determine the order of implementation; similarly, it is considered that the system is expanded every 5 years and that the implementation of a new PMUs can be carried out within a period of two years; the results are shown in Table 3.
The results presented in Table 2 and Table 3 show the PMU placement order obtained to maximize observability with a restricted number of PMUs per expansion stage, which depends on the system topology. The generation of deployment scenarios provides the planner with a clearer perspective on the levels of observability achieved after a stage of transmission system expansion and the levels that can be attained by installing new PMUs.
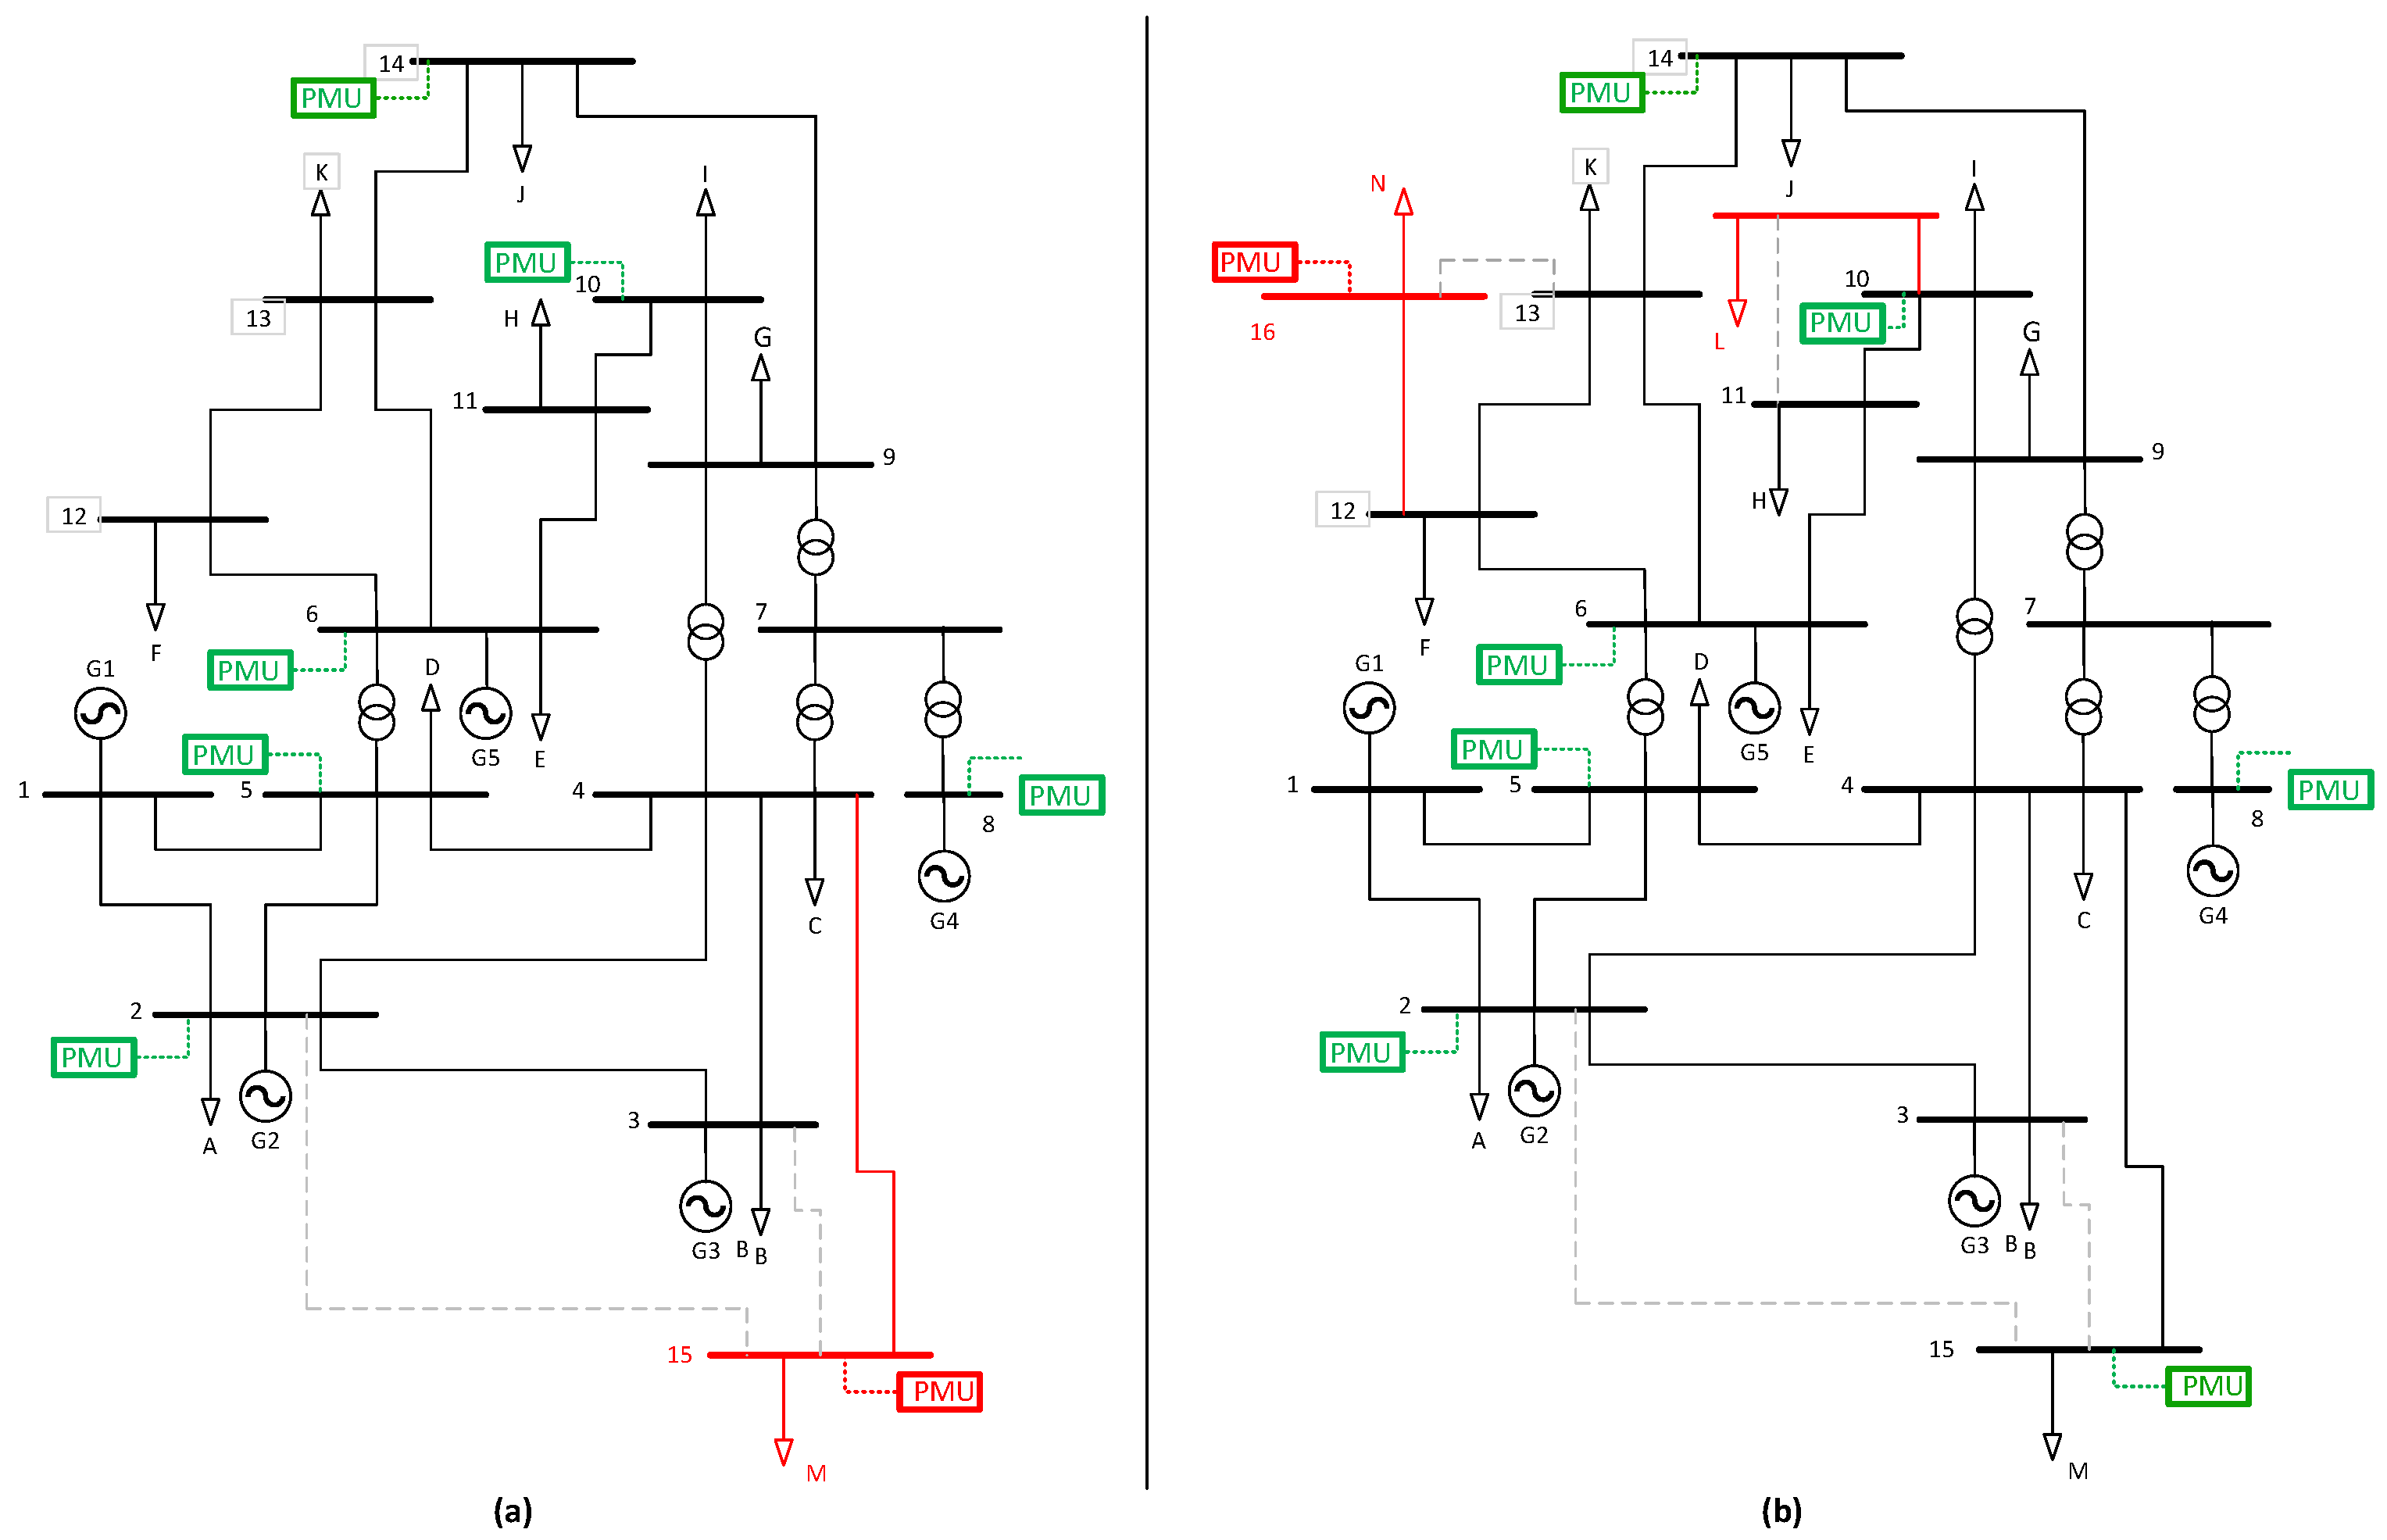
Table 4 presents three possible assumptions for increasing the number of load nodes in the IEEE 14-bus model, specifying their power requirements and the potential transmission lines that must be constructed to meet these new demands. It is expected that the new node 15 will come into operation by 2015, and nodes 16 and 17 by 2020. Figure 5 shows the increases in lines due to the expansion of the system and the increase in PMUs while maintaining what was already planned in the original system.
To reflect real-world planning conditions, the cost of PMU implementation is addressed indirectly in our methodology, not through a direct monetary value in the objective function, but by limiting the number of devices installed at each stage. This staged approach helps keep the model computationally efficient while still accounting for typical investment constraints. In practice, utilities rarely install all PMUs at once; budgets, logistics, and system growth often require a gradual rollout. Our model captures that reality by ensuring observability improves with each expansion step, without the need to relocate already installed units. While no explicit financial figures are provided, the strategy aligns with how deployment decisions are made in the field, helping to minimize unnecessary costs and support long-term, resource-conscious implementation, particularly in systems with limited budgets or in developing regions.
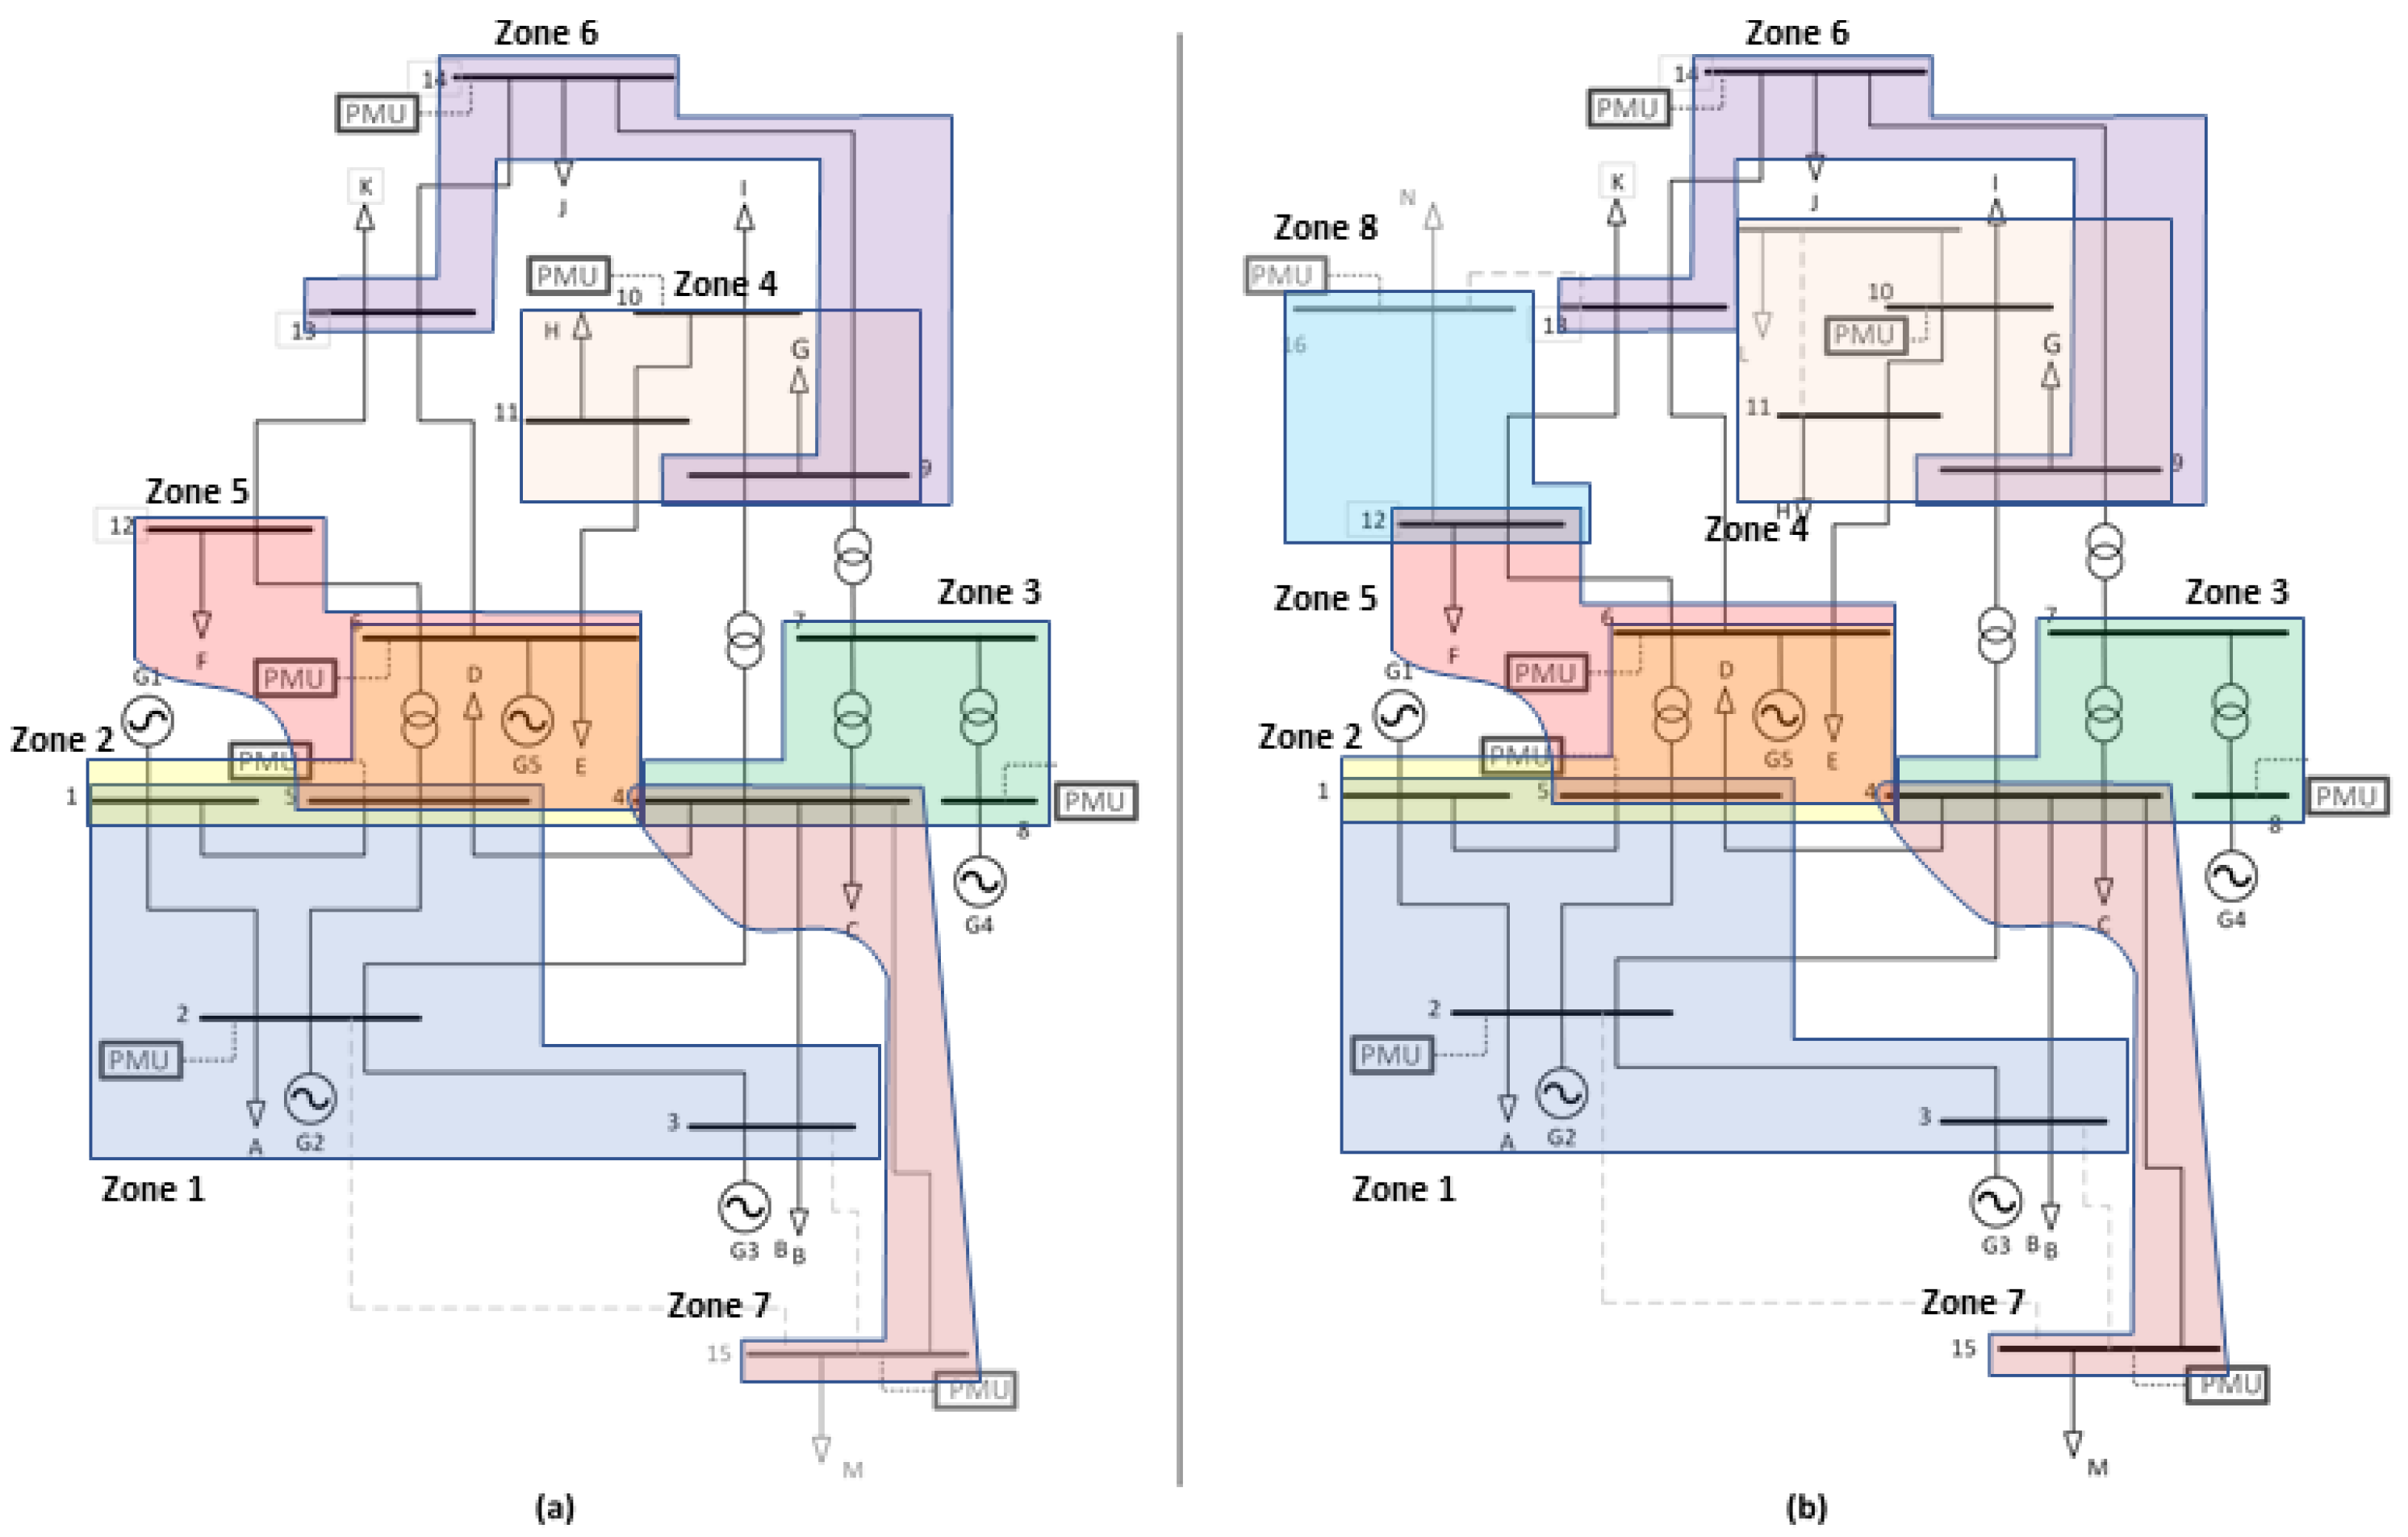
Figure 6 shows the results of the modified IEEE 14-bar system coverage, based on what was planned in year 10 and considering the new nodes and lines. In year 15, the system has 100% observability with seven zones and redundancy in nodes 1, 4, 5, 6, and 9. On the other hand, in year 20, the observability coverage zone 4 grows, with direct visualization of nodes 9, 10, and 11, plus the new node 17, for a total of eight zones to achieve 100% observability with redundancy in nodes 1, 4, 5, 6, 9, and 12.
The chronology of system expansion and PMU deployment for the 30 and 118 busbar systems is shown in Table 5 and Table 6; for the 30-bus system, a system expansion is considered every five years and a PMU is deployed every two years; for the 118-bus system, a system expansion is regarded as every five years and two PMUs are deployed every year.
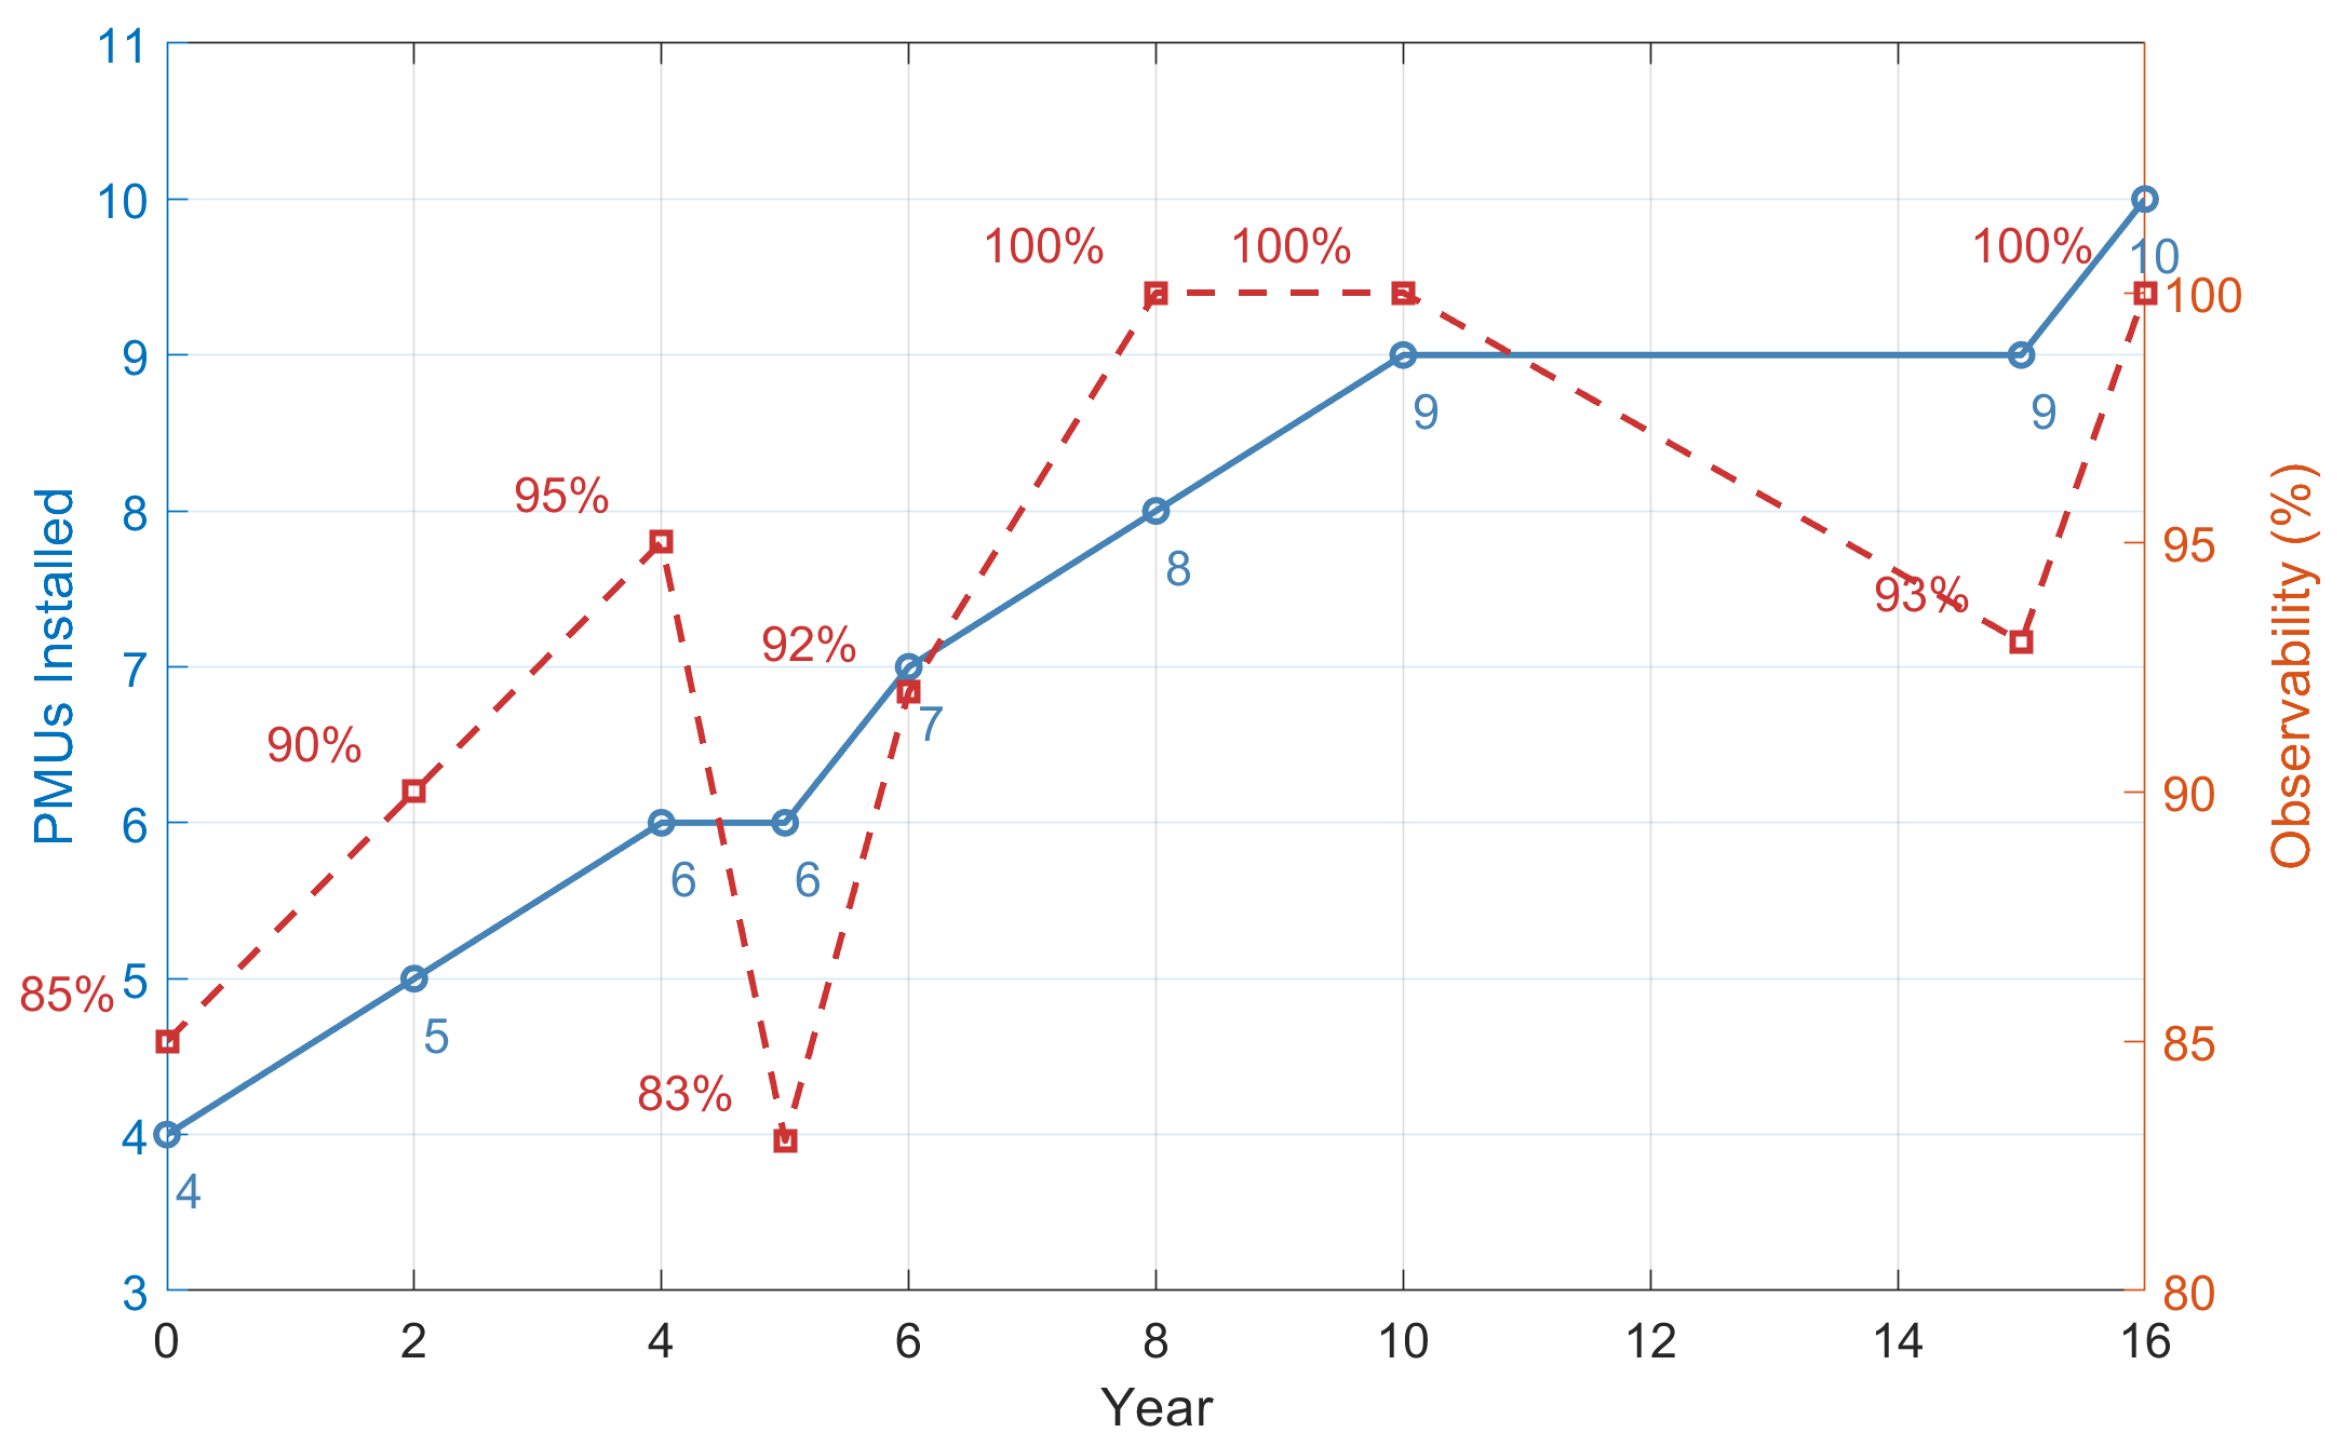
Figure 7 presents the staged deployment of PMUs and the evolution of system observability for the IEEE 30-bus network. The left axis shows the number of PMUs installed over time, while the right axis reflects the percentage of observed buses at each expansion stage.
Initially, four PMUs provide 85% coverage. As the network grows and more nodes are integrated, observability improves gradually through targeted additions of PMUs. Notably, observability briefly drops in year 5 due to system expansion outpacing measurement capacity, but is quickly recovered and optimized by year 8. From that point on, full observability is maintained, even as the system expands to 30 buses.
This progression highlights the methodology’s ability to anticipate structural changes and adjust placements accordingly, minimizing redundancy while ensuring consistent monitoring. The result is a robust and forward-looking deployment strategy that aligns closely with real-world system growth patterns.
Figure 8 shows the progression of PMU deployment and system observability for the IEEE 118-bus network. The left axis represents the number of PMUs installed over time, while the right axis displays the percentage of observability achieved at each stage.
Starting with 19 PMUs in year 0, the system achieves 86% observability. As the method adds PMUs in anticipation of future expansion, observability improves gradually, reaching 99% by year 4. Full observability (100%) is attained by year 6 with 29 devices and remains stable even as the network continues to evolve.
This behavior demonstrates how the method strategically distributes PMUs to adapt to a large-scale system while minimizing unnecessary relocations. Each device contributes to both present and future coverage, ensuring scalability and measurement continuity as the system grows in complexity.
Although emergency operation scenarios were not the primary focus of this study, the proposed methodology can support emergency management by ensuring full observability throughout the system at every stage of expansion. With PMUs strategically deployed over time, system operators gain access to real-time, synchronized data across the grid, which enhances situational awareness, accelerates fault detection, and improves decision making during abnormal operating conditions. In this way, the planning approach contributes not only to the efficient deployment of infrastructure but also to strengthening the system’s readiness to respond to critical events.
In all test cases, the expansion of the power system directly influences the number and positioning of new PMUs. The proposed algorithm integrates topological forecasts to ensure that each PMU installed during earlier stages remains effective throughout the entire expansion process. It is important to note that none of the PMUs deployed in early stages required relocation, demonstrating the model’s robustness in anticipating long-term observability needs.

5. Conclusions

In contrast to traditional static approaches, this method ensures full observability at every step of network growth while maintaining deployment continuity, which is essential for utility planning under evolving grid topologies and constrained investment cycles. The dual-axis visualizations introduced in this work (Figure 3, Figure 7 and Figure 8) effectively illustrate the temporal evolution of PMU deployment alongside system observability, allowing intuitive evaluation of coverage efficiency across staged expansions.
The developed research presents a methodology to determine the minimum number of PMUs to be deployed in power systems, considering the topology changes determined by the transmission expansion, where the main contribution is focused on determining the timing of implementation of the measurement devices to maximize the observability of the EPS during the time interval considered in the EPS expansion.
Expansion planning typically focuses on the implementation or reinforcement of transmission lines, power plants, substations, and other key elements of the power system. However, it must also consider aspects that involve monitoring, such as PMUs. The location of PMUs in power systems depends on the SEP topology, and if this changes in the future, the present location may become unnecessary. This consideration was taken into account in the proposed methodology.
Planning for PMU expansion, considering the optimal location, maximizing observability, and minimizing the number of PMUs can be regarded as a multi-objective problem. Still, to avoid this in the proposed methodology, the optimization problem is relaxed by converting the observability maximization into a constraint, which gives reliable results and allows planning the PMU implementation time in the candidate nodes.
This is because the methodology considers the planning period, which for this study was 10 years. Therefore, not having the EPS in its final state does not achieve full observability of the system. Still, as the years pass and the topology changes, PMUs are placed in such a way that it is not necessary to remove the existing ones; instead, they serve as the basis for the new PMUs.
From a practical standpoint, the proposed methodology offers a flexible and cost-aware approach to PMU deployment. Instead of assuming full installation from the outset, it reflects the way many utilities operate, implementing gradually as budgets and network expansions progress. By limiting the number of PMUs per stage and avoiding device relocation, the model helps reduce unnecessary expenditures and aligns with the realities of long-term planning. This makes it especially valuable for developing systems or scenarios where financial and logistical constraints are key decision factors. While the model does not include explicit monetary terms, its structure effectively supports economically sustainable implementation.
While the present study focuses on transmission systems, the proposed methodology is flexible and can be adapted to distribution networks. By redefining the connectivity matrix and adjusting observability constraints to match the characteristics of radial or weakly meshed systems, the same optimization framework can support staged PMU deployment in distribution environments. This opens the possibility of extending the model to a broader range of practical applications.
The current version of the model does not explicitly incorporate N-1 or N-2 contingency scenarios. However, the optimization framework can be extended to include such reliability constraints by adding additional observability conditions under failure modes. This represents a promising direction for future work, particularly in applications related to critical infrastructure planning.

Author Contributions

Conceptualization, D.C.; Methodology, G.C.; Formal analysis, G.C.; Data curation, M.J.; Writing original draft, G.C.; Writing review & editing, D.C. and M.J.; Supervision, D.C.; Project administration, D.C.; Funding acquisition, D.C. All authors have read and agreed to the published version of the manuscript.

Funding

This work was supported by Salesian Polytechnic University and GIREI-Smart Grid Research Group under the project “Integration of Artificial Intelligence in the Planning, Operation, and Protection of Electrical Power Systems”, Resolution No.: 083-02-2024-04-12.

Data Availability Statement

The original contributions presented in this study are included in the article. Further inquiries can be directed to the corresponding author.

Conflicts of Interest

The authors declare no conflicts of interest.

Abbreviations

The abbreviations used in this article are as follows:
C M n x n EPS connectivity matrix
w i PMU implementation cost at node i
X i PMU location binary variable at node i
α i EPS observability percentage
N P M U PMU quantity
TPlanning period
O C Operation costs
I C Investment costs
n g generators set
n b u s Nodes set
C g Generation production costs
P g Generator real power
η i , j 0 Initial state of the line between nodes i , j
β i , j k Binary variable representing the status of the line
C L i , j Cost of the candidate line between nodes i , j
P i , j Power flow limit per line
P i , j m a x Maximum power flow limit per line
B i , j Susceptance of the line between nodes i j
δ i Voltage angle at node i
Mmaximum line load capacity
P g i Real power generated by the generator i
P g i m a x Maximum active power limit of generators
P g i m i n Minimum active power limit for generator
L S i Load shedding at node i
L i Load at node i

References

  1. Manousakis, N.M.; Korres, G.N.; Georgilakis, P.S. Taxonomy of PMU placement methodologies. IEEE Trans. Power Syst. 2012, 27, 1070–1077. [Google Scholar] [CrossRef]
  2. Ghamsari-Yazdel, M.; Esmaili, M.; Amjady, N. Optimal substation-based joint allocation of PMUs and measuring channels considering network expansion planning. Int. J. Electr. Power Energy Syst. 2019, 106, 274–287. [Google Scholar] [CrossRef]
  3. Aminifar, F.; Fotuhi-Firuzabad, M.; Safdarian, A.; Davoudi, A.; Shahidehpour, M. Synchrophasor Measurement Technology in Power Systems: Panorama and State-of-the-Art. IEEE Access 2014, 2, 1607–1628. [Google Scholar] [CrossRef]
  4. Mohanta, D.K.; Murthy, C.; Sinha Roy, D. A Brief Review of Phasor Measurement Units as Sensors for Smart Grid. Electr. Power Compon. Syst. 2016, 44, 411–425. [Google Scholar] [CrossRef]
  5. Johnson, T.; Moger, T. A critical review of methods for optimal placement of phasor measurement units. Int. Trans. Electr. Energy Syst. 2021, 31, 1–25. [Google Scholar] [CrossRef]
  6. Babu, R.; Raj, S.; Bhattacharyya, B. Weak bus-constrained PMU placement for complete observability of a connected power network considering voltage stability indices. Prot. Control Mod. Power Syst. 2020, 5, 28. [Google Scholar] [CrossRef]
  7. Carrión Galarza, D.F.; González Sánchez, J.W. Ubicación óptima de PMU considerando restricciones de contingencias N-1 en sistemas eléctricos de potencia. Enfoque UTE 2019, 10, 1–12. [Google Scholar] [CrossRef]
  8. Asgari, A.; Firouzjah, K.G. Optimal PMU placement for power system observability considering network expansion and N-1 contingencies. IET Gener. Transm. Distrib. 2018, 12, 4216–4224. [Google Scholar] [CrossRef]
  9. Aghaei, J.; Baharvandi, A.; Rabiee, A.; Akbari, M.A. Probabilistic PMU Placement in Electric Power Networks: An MILP-Based Multiobjective Model. IEEE Trans. Ind. Inform. 2015, 11, 332–341. [Google Scholar] [CrossRef]
  10. Manousakis, N.M.; Korres, G.N. Optimal PMU arrangement considering limited channel capacity and transformer tap settings. IET Gener. Transm. Distrib. 2020, 14, 5816–5822. [Google Scholar] [CrossRef]
  11. Manousakis, N.M.; Korres, G.N. Optimal PMU Placement for Numerical Observability Considering Fixed Channel Capacity-A Semidefinite Programming Approach. IEEE Trans. Power Syst. 2016, 31, 3328–3329. [Google Scholar] [CrossRef]
  12. Hanis, N.; Rahman, A.; Zobaa, A.F. Binary PSO Algorithm for Optimal PMUs Placement. IEEE Trans. Ind. Inform. 2017, 13, 3124–3133. [Google Scholar]
  13. Bae, J. Cost-Effective placement of phasor measurement units to defend against false data injection attacks on power grid. Energies 2020, 13, 3862. [Google Scholar] [CrossRef]
  14. Ali, Z.M.; Razavi, S.E.; Javadi, M.S.; Gandoman, F.H.; Abdel Aleem, S.H. Dual enhancement of power system monitoring: Improved probabilistic multi-stage PMU placement with an increased search space & mathematical linear expansion to consider zero-injection bus. Energies 2018, 11, 1429. [Google Scholar] [CrossRef]
  15. Bečejac, V.; Stefanov, P. Groebner bases algorithm for optimal PMU placement. Int. J. Electr. Power Energy Syst. 2020, 115, 105427. [Google Scholar] [CrossRef]
  16. Abd el Ghany, H.A. Optimal PMU allocation for high-sensitivity wide-area backup protection scheme of transmission lines. Electr. Power Syst. Res. 2020, 187, 106485. [Google Scholar] [CrossRef]
  17. Mohammadi, P.; Mehraeen, S.; Nazaripouya, H. Sensitivity analysis-based optimal PMU placement for fault observability. IET Gener. Transm. Distrib. 2021, 15, 737–750. [Google Scholar] [CrossRef]
  18. Ghosh, P.K.; Chatterjee, S.; Roy, B.K.S. Optimal PMU placement solution: Graph theory and MCDM-based approach. IET Gener. Transm. Distrib. 2017, 11, 3371–3380. [Google Scholar] [CrossRef]
  19. Razavi, S.E.; Falaghi, H.; Esmaeel Nezhad, A.; Hadidian Moghaddam, M.J.; Gandoman, F.H. An Effective Approach for the Probabilistic and Deterministic Multistage PMU Placement Using Cuckoo Search: Iran’s National Power System. Iran. J. Sci. Technol.-Trans. Electr. Eng. 2020, 44, 237–252. [Google Scholar] [CrossRef]
  20. Saleh, A.A.; Adail, A.S.; Wadoud, A.A. Optimal phasor measurement units placement for full observability of power system using improved particle swarm optimisation. IET Gener. Transm. Distrib. 2017, 11, 1794–1800. [Google Scholar] [CrossRef]
  21. Gacitua, L.; Gallegos, P.; Henriquez-Auba, R.; Lorca, Á.; Negrete-Pincetic, M.; Olivares, D.; Valenzuela, A.; Wenzel, G. A comprehensive review on expansion planning: Models and tools for energy policy analysis. Renew. Sustain. Energy Rev. 2018, 98, 346–360. [Google Scholar] [CrossRef]
  22. Giral Ramírez, D.A.; Montoya Giraldo, O.D.; Vargas Robayo, C.Y.; Blanco Valbuena, D.F. Evaluación de modelos de programación lineal y no lineal para la planeación de sistemas de transmisión en el software GAMS. Tecnura 2021, 25, 16–50. [Google Scholar] [CrossRef]
  23. Bolaños Ocampo, R.A.; Correa Flórez, C.A. Planeamiento de la transmisión considerando seguridad e incertidumbre en la demanda empleando programación no lineal y técnicas evolutivas. Rev. Tecnura 2013, 18, 62. [Google Scholar] [CrossRef]
  24. Palacios, J. Estado del arte de la planeación de expansión de sistemas de transmisión. I+D Tecnol. 2020, 16, 78–85. [Google Scholar] [CrossRef]
  25. Hamidpour, H.; Aghaei, J.; Pirouzi, S.; Niknam, T.; Nikoobakht, A.; Lehtonen, M.; Shafie-khah, M.; Catalão, J.P. Coordinated expansion planning problem considering wind farms, energy storage systems and demand response. Energy 2022, 239, 122321. [Google Scholar] [CrossRef]
  26. Zhao, J.H.; Dong, Z.Y.; Lindsay, P.; Wong, K.P. Flexible transmission expansion planning with uncertainties in an electricity market. IEEE Trans. Power Syst. 2009, 24, 479–488. [Google Scholar] [CrossRef]
  27. Vilaça, P.; Street, A.; Colmenar, J.M. A MILP-based heuristic algorithm for transmission expansion planning problems. Electr. Power Syst. Res. 2022, 208, 107882. [Google Scholar] [CrossRef]
  28. Escudero, P.; Carrión, D. Expansión de un sistema de transmisión mediante LOPF-AC Expansion of a transmission system using LOPF-AC. INGE CUC 2018, 14, 116–125. [Google Scholar] [CrossRef]
  29. Tejada-Arango, D.; López-Lezama, J.M.; Rider, M.J. Planeamiento de la expansión de la red de transmisión en sistemas eléctricos de potencia considerando reconfiguraciones de red. Inf. Tecnol. 2014, 25, 85–96. [Google Scholar] [CrossRef]
  30. Li, C.; Conejo, A.J.; Liu, P.; Omell, B.P.; Siirola, J.D.; Grossmann, I.E. Mixed-integer linear programming models and algorithms for generation and transmission expansion planning of power systems. Eur. J. Oper. Res. 2022, 297, 1071–1082. [Google Scholar] [CrossRef]
  31. Esmaili, M.; Ghamsari-Yazdel, M.; Amjady, N.; Chung, C.Y.; Conejo, A.J. Transmission Expansion Planning including TCSCs and SFCLs: A MINLP Approach. IEEE Trans. Power Syst. 2020, 35, 4396–4407. [Google Scholar] [CrossRef]
  32. Hemmati, R.; Hooshmand, R.A.; Khodabakhshian, A. State-of-the-art of transmission expansion planning: Comprehensive review. Renew. Sustain. Energy Rev. 2013, 23, 312–319. [Google Scholar] [CrossRef]
  33. Alhamrouni, I.; Khairuddin, A.; Ferdavani, A.; Salem, M. Transmission expansion planning using AC-based differential evolution algorithm. IET Gener. Transm. Distrib. 2014, 8, 1637–1644. [Google Scholar] [CrossRef]
  34. Carrión, D.; Francisco, J.; Paul, M. Revisión para la restauración optima de la operación del sistema eléctrico basado en criterios de calidad de energía y estabilidad. Rev. I+D Tecnol. 2021, 17, 9. [Google Scholar] [CrossRef]
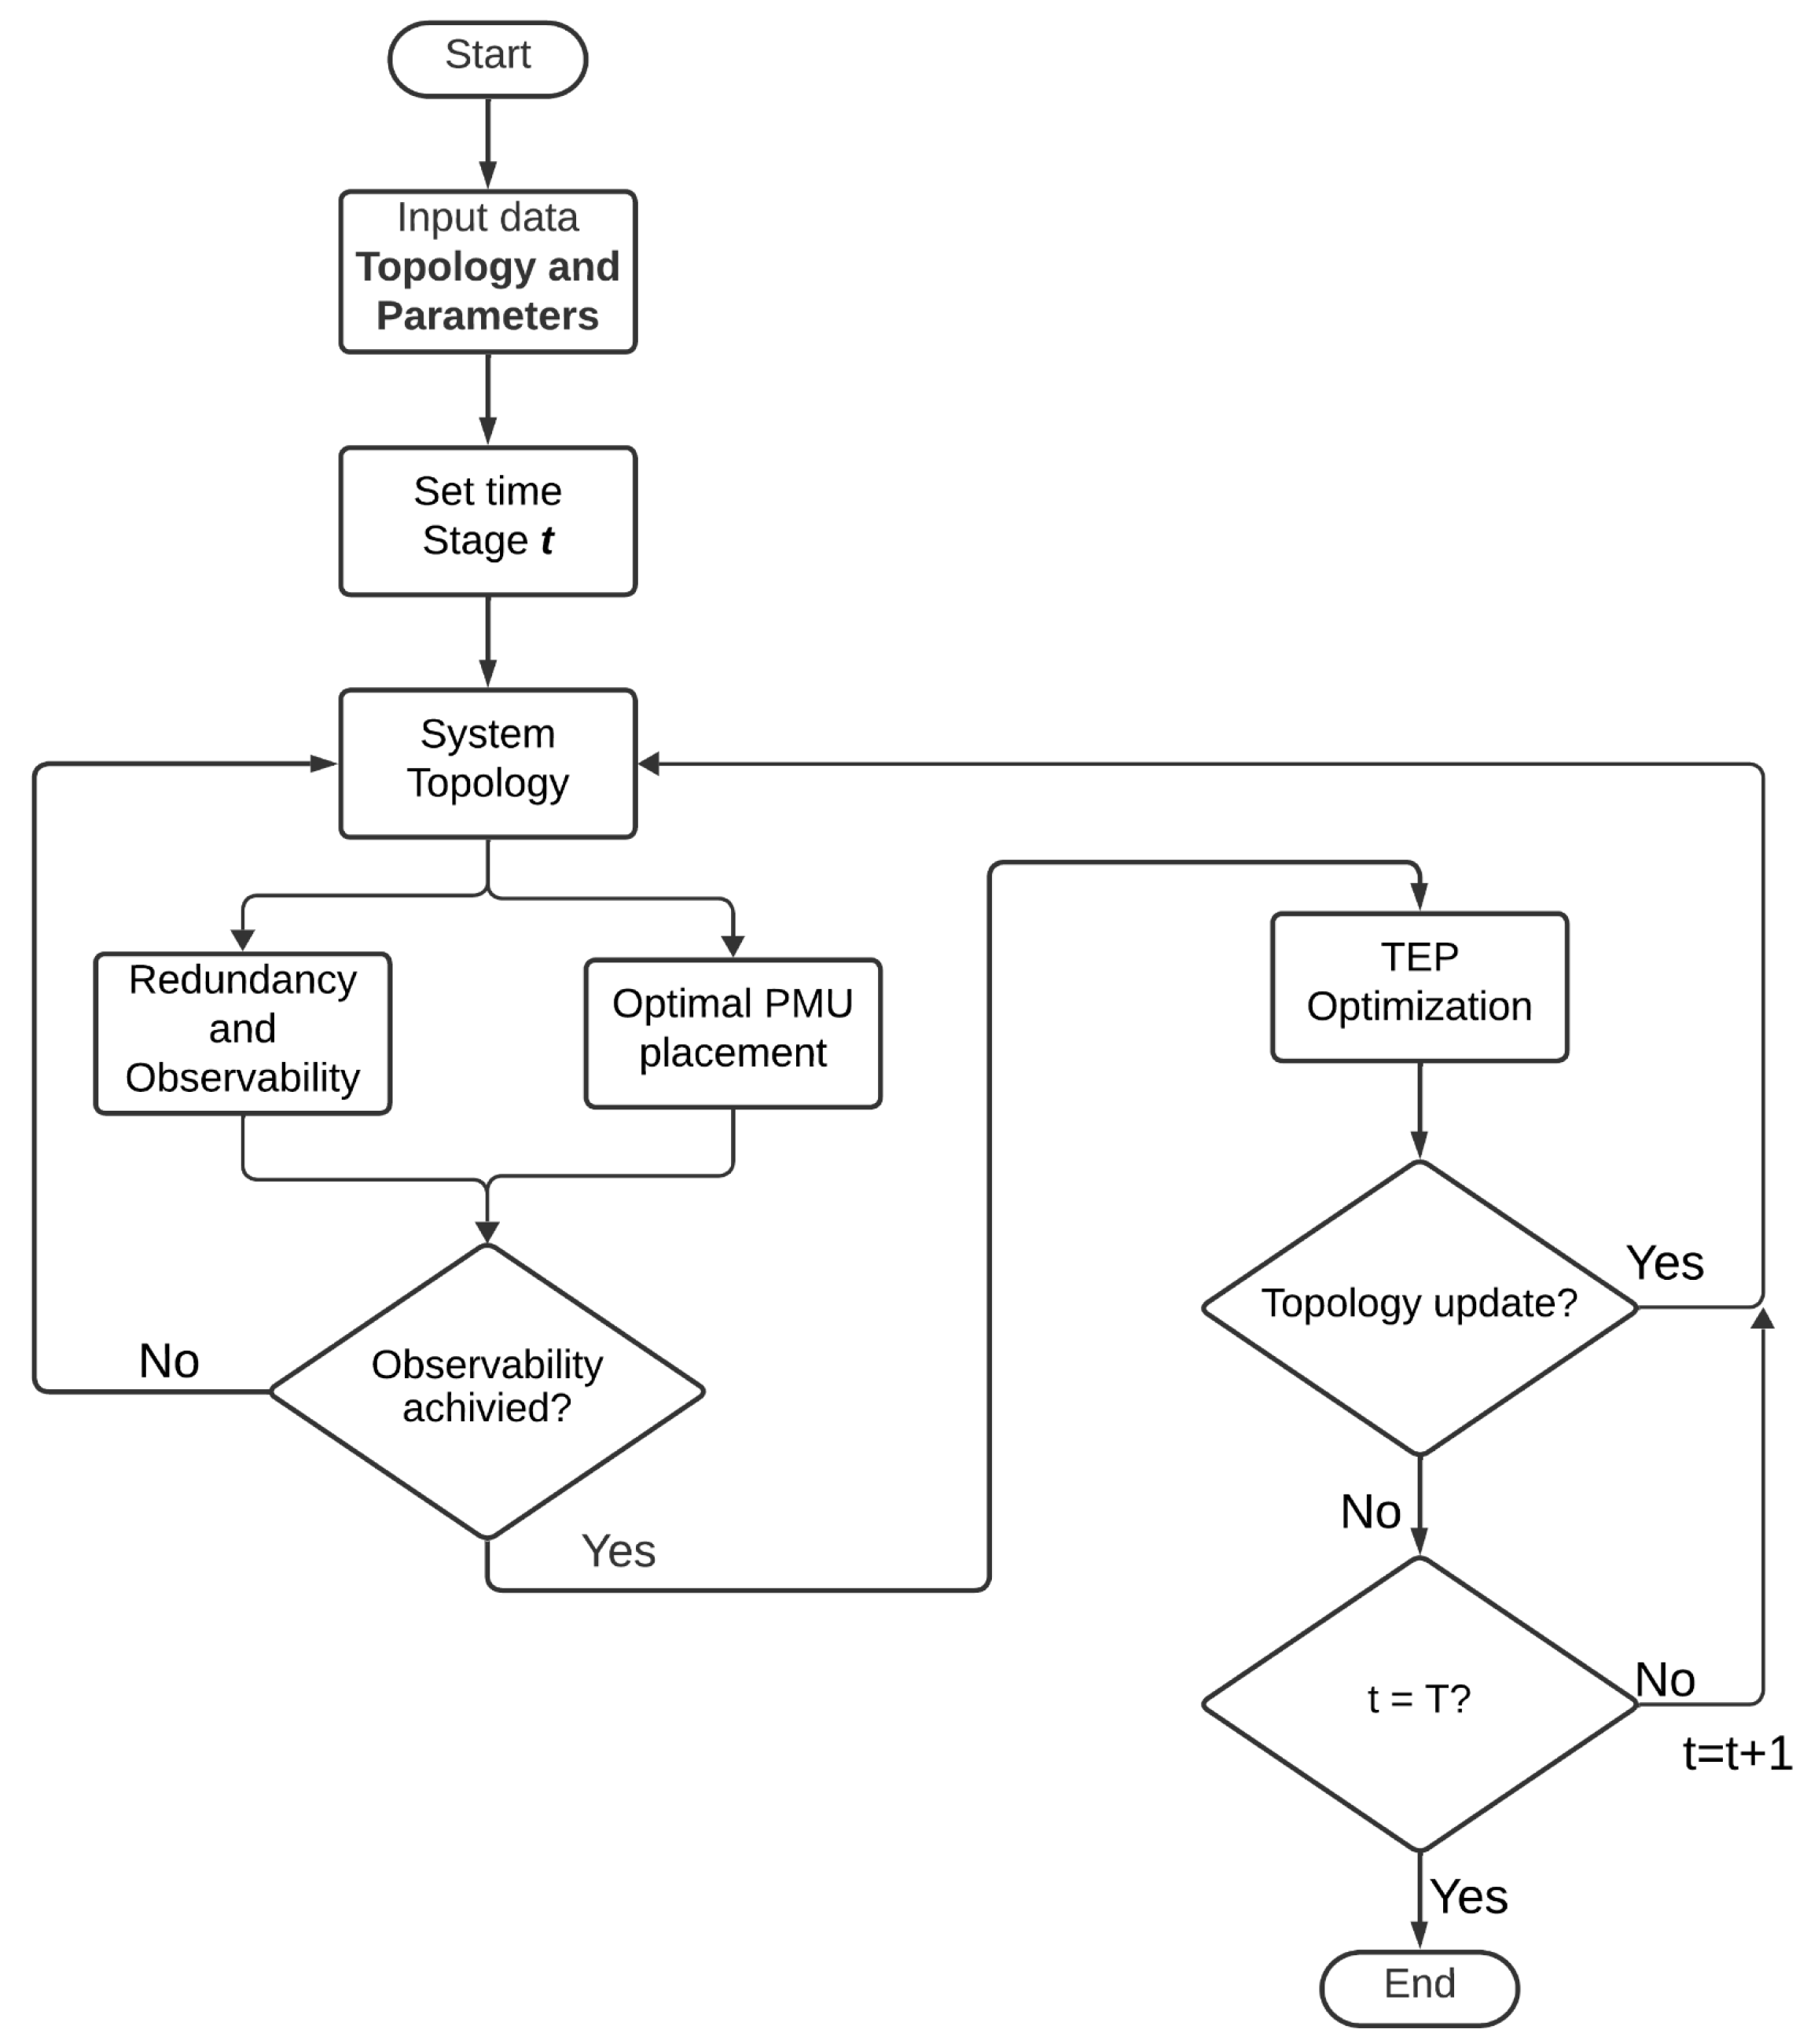
Figure 1. Flowchart of the proposed methodology.
Energies 18 03283 g001
Figure 2. PMU optimal location: (a) year 0, (b) year 5, (c) year 10.
Energies 18 03283 g002
Figure 3. Evolution of PMUs installed (left axis) and system observability (right axis) under the proposed deployment strategy for the IEEE 14-bus system.
Energies 18 03283 g003
Figure 4. IEEE 14 bus observability coverage: (a) year 0, (b) year 5, (c) year 10.
Energies 18 03283 g004
Figure 5. PMU optimal location: (a) year 15, (b) year 20.
Energies 18 03283 g005
Figure 6. IEEE 14 modified bus observability coverage: (a) year 15, (b) year 20.
Energies 18 03283 g006
Figure 7. Evolution of PMUs installed (left axis) and system observability (right axis) under the proposed deployment strategy for the IEEE 30-bus system.
Energies 18 03283 g007
Figure 8. Evolution of PMUs installed (left axis) and system observability (right axis) under the proposed deployment strategy for the IEEE 118-bus system.
Energies 18 03283 g008
Table 1. Comparative summary of representative PMU placement and expansion planning methodologies.
ReferenceMethodologyOptimization ApproachKey FeaturesAdvantagesLimitations
[1]PMU placement taxonomyVarious (ILP, metaheuristics)Comprehensive classification of methodsBroad overview, useful for method selectionDoes not propose a new optimization model
[7]PMU placement with N-1 contingenciesMILPBased on Ecuadorian EPSRealistic case constraintsNo cost or staged planning
[8]PMU placement with N-1 contingenciesMILPIntegrates reliability constraintsPractical for contingency analysisNo temporal expansion modeled
[9]Probabilistic PMU placementMILP (multi-objective)Considers uncertainty in observabilityRobust under system variabilityFocused on static systems
[14]Multi-stage PMU placement with expansionHybrid (mathematical + heuristic)Accounts for network expansionIntroduces stagingComplexity increases with scale
[This paper]PMU placement with expansion over timeMILP (stepwise planning)Observability + redundancy + expansionAdaptable, cost-aware, supports schedulingCurrently excludes contingencies and cyber-resilience
Table 2. IEEE 14-bus PMU location, every 2 years.
Year# Nodes# PMUsNodes with PMU        # Buses Observed
01042, 5, 8, 109 (90%)
21042, 5, 8, 1010 (100%)
41042, 5, 8, 1010 (100%)
61252, 5, 6, 8, 1012 (100%)
81252, 5, 6, 8, 1012 (100%)
101462, 5, 6, 8, 10, 1414 (100%)
Table 3. PMU location IEEE 14 buses, future stages.
Year# Nodes# PMUsNodes with PMU        # Buses Observed
121462, 5, 6, 8, 10, 1414 (100%)
141462, 5, 6, 8, 10, 1414 (100%)
161572, 5, 6, 8, 10, 14, 1515 (100%)
181572, 5, 6, 8, 10, 14, 1515 (100%)
201782, 5, 6, 8, 10, 14, 15, 1616 (100%)
Table 4. Expansion scenarios.
Total NodesNew LoadsCandidates LinesNew Lines
14bus 15 45 kW2–15, 3–15, 4–154–15
15bus 16 8 kW12–16, 13–1612–16
16bus 17 5 kW10–17, 11–1710–17
Table 5. PMU location IEEE 30 busbars, without PMU relocation.
Year# Nodes# PMUsNodes with PMU# Buses Observed
02041, 6, 12, 1917 (85%)
22051, 2, 6, 9, 12, 1918 (90%)
42061, 2, 6, 9, 12, 1919 (95%)
52461, 2, 6, 9, 12, 1920 (83%)
62471, 2, 6, 9, 10, 12, 1922 (92%)
82481, 2, 6, 9, 10, 12, 19, 2324 (100%)
102891, 2, 6, 9, 10, 12, 19, 23, 2528 (100%)
153091, 2, 6, 9, 10, 12, 19, 23, 2528 (93%)
1630101, 2, 6, 9, 10, 12, 19, 23, 25, 2730 (100%)
Table 6. PMU location IEEE 118 busbars, without PMU relocation.
Year# Nodes# PMUsNodes with PMU# Buses Observed
0100191, 7, 9, 11, 17, 21, 25, 28, 34, 37, 49
56, 59, 65, 70, 77, 80, 85, 94
86 (86%)
1100211, 7, 9, 11, 17, 21, 25, 28, 34, 37, 49, 52
56, 59, 62, 65, 70, 71, 77, 80, 85, 94
90 (90%)
2100231, 7, 9, 11, 17, 21, 25, 28, 34, 37, 45, 49
52, 56, 59, 62, 65, 70, 71, 77, 80, 85, 94
94 (94%)
3100251, 7, 9, 11, 15, 17, 21, 25, 28, 34, 37, 45, 49
52, 56, 59, 62, 65, 70, 71, 77, 80, 85, 91, 94
97 (97%)
4100271, 7, 9, 11, 15, 17, 21, 25, 28, 31, 34, 37, 40, 45
49, 52, 56, 59, 62, 65, 70, 71, 77, 80, 85, 91, 94
99 (99%)
6100291, 7, 9, 11, 15, 17, 21, 25, 28, 31, 34, 37, 40, 45, 49, 52
56, 59, 62, 65, 70, 71, 77, 80, 85, 91, 94, 100, 101
101 (100%)
8100301, 7, 9, 11, 15, 17, 21, 25, 28, 31, 34, 37, 40, 45, 49, 52
56, 59, 62, 65, 70, 71, 77, 80, 85, 87, 91, 94, 100, 101
105 (97%)
8100311, 7, 9, 11, 15, 17, 21, 25, 28, 31, 34, 37, 40, 45, 49, 52, 56
59, 62, 65, 70, 71, 77, 80, 85, 87, 91, 94, 100, 101, 105
118 (100%)
Disclaimer/Publisher’s Note: The statements, opinions and data contained in all publications are solely those of the individual author(s) and contributor(s) and not of MDPI and/or the editor(s). MDPI and/or the editor(s) disclaim responsibility for any injury to people or property resulting from any ideas, methods, instructions or products referred to in the content.