Article

Balancing Cam Mechanism for Instantaneous Torque and Velocity Stabilization in Internal Combustion Engines: Simulation and Experimental Validation

by
Daniel Silva Cardoso
1,
Paulo Oliveira Fael
1,
Pedro Dinis Gaspar
1,* and
António Espírito-Santo
2
1
C-MAST—Center for Mechanical and Aerospace Science and Technologies, Calçada Fonte do Lameiro, 6201-001 Covilhã, Portugal
2
IT-Institute of Telecommunications, Calçada Fonte do Lameiro, 6201-001 Covilhã, Portugal
*
Author to whom correspondence should be addressed.
Energies 2025, 18(13), 3256; https://doi.org/10.3390/en18133256 (registering DOI)
Submission received: 20 May 2025 / Revised: 19 June 2025 / Accepted: 20 June 2025 / Published: 21 June 2025
(This article belongs to the Special Issue Internal Combustion Engines: Research and Applications—3rd Edition)

Abstract

:
Torque and velocity fluctuations in internal combustion engines (ICEs), particularly during idle and low-speed operation, can reduce efficiency, increase vibration, and impose mechanical stress on coupled systems. This work presents the design, simulation, and experimental validation of a passive balancing cam mechanism developed to mitigate fluctuations in single-cylinder internal combustion engines (ICEs). The system consists of a cam and a spring-loaded follower that synchronizes with the engine cycle to store and release energy, generating a compensatory torque that stabilizes rotational speed. The mechanism was implemented on a single-cylinder Honda® engine and evaluated through simulations and laboratory tests under idle conditions. Results demonstrate a reduction in torque ripple amplitude of approximately 54% and standard deviation of 50%, as well as a decrease in angular speed fluctuation amplitude of about 43% and standard deviation of 42%, resulting in significantly smoother engine behavior. These improvements also address longstanding limitations in traditional powertrains, which often rely on heavy flywheels or electronically controlled dampers to manage rotational irregularities. Such solutions increase system complexity, weight, and energy losses. In contrast, the proposed passive mechanism offers a simpler, more efficient alternative, requiring no external control or energy input. Its effectiveness in stabilizing engine output makes it especially suited for integration into hybrid electric systems, where consistent generator performance and low mechanical noise are critical for efficient battery charging and protection of sensitive electronic components.

1. Introduction

1.1. Background

Due to the discrete nature of combustion events, ICEs inherently produce torque fluctuations throughout their operating cycle. Each power stroke generates an impulse of torque, resulting in an irregular and discontinuous torque profile. These fluctuations are particularly evident at low engine speeds, where inertial smoothing is minimal, and they negatively impact the stability, efficiency, and durability of coupled systems such as generators or drivetrains [1,2,3,4,5].
Traditionally, passive mechanical components such as conventional and dual mass flywheels have been employed to reduce rotational speed variation. While effective to a certain extent, these solutions increase system mass and are not responsive to real-time dynamic engine load or speed changes [6,7]. Their integration into compact or lightweight systems, such as hybrid powertrains or portable generators, presents packaging and efficiency challenges and expensive maintenance [8,9,10]. Alternative approaches based on active control or torque cancellation have also been explored [11,12,13], but they often require complex electronic systems or sensors.
In response to these limitations, several mechanical alternatives have emerged. Dual mass flywheels remain widely used to isolate torsional vibrations, particularly at idle; however, their performance is limited to narrow frequency bands, and they contribute a substantial amount of weight [6,10,14]. Centrifugal pendulum vibration absorbers have been introduced as add-ons to flywheels or clutches to absorb low-order torsional oscillations passively. However, they are effective only around their tuned frequency and often require complex packaging [15,16].
Another category of passive solutions involves kinematically driven systems, such as the one developed by Pfabe and Woernle [17], which employs a secondary flywheel connected via a non-uniform gear mechanism. This allows the flywheel to generate counteracting inertial torque synchronized with the engine’s dominant harmonic order. Although effective in reducing crankshaft speed fluctuations, this system introduces mechanical complexity and lacks adaptability across varying engine speeds.
Recent developments also include variable inertia flywheels, such as the design by Zhang et al. [18], where sliding masses respond to angular acceleration by altering the flywheel’s effective inertia. This design enhances stability during load transients without requiring external control, although it introduces mechanical complexities that may compromise long-term durability.
Among these purely mechanical alternatives, cam spring-based energy-balancing mechanisms have gained attention due to their compactness and efficiency. Arakelian and Briot proposed a method for simultaneously compensating inertia force and torque in slider–crank mechanisms [19], which inspired further applications. Lin et al. later extended this principle specifically to engine valve trains, using a cam and rocker mechanism to offset torque fluctuations due to valve spring forces [20]. Their design achieved significant torque flattening at the camshaft level through static compensation tuned to a known torque profile. However, these systems were not directly applied to the crankshaft or validated under full-cycle torque decomposition.
This work presents a passive balancing cam mechanism—composed of a specifically designed cam and spring-loaded follower—designed to mitigate torque and speed fluctuations without requiring complex control systems or significant engine modifications. The mechanism adapts to each engine cycle by storing and releasing energy in phase with the crankshaft rotation, providing a compact and efficient alternative to conventional torque-smoothing methods [19,20].
In contrast to previous cam-based systems that focus on subsystems like valve trains [20] or slider–crank balancing [19], the proposed mechanism integrates directly with crankshaft timing. It is synthesized from experimentally acquired torque data, enabling real-time compensation of torque deficits across all four strokes of a single-cylinder engine—particularly during idle, where fluctuation is most severe. Unlike pendulum-based [15] or variable inertia systems [18], this solution requires no added rotating mass or actuation logic. It offers a lightweight and entirely passive alternative for enhancing engine smoothness with minimal design overhead [21].
Building on previous modelling work, the system was implemented on a single-cylinder Honda® engine and evaluated through dynamic simulation and experimental testing. The study focuses on low engine speeds, a regime where internal combustion engines exhibit the most significant torque and speed fluctuation challenges. Results demonstrate improved rotational stability and smoother torque delivery [3,21].

1.2. Problem Statement

Despite ongoing efforts to improve engine refinement, current mechanical solutions for mitigating torque fluctuations often fall short when applied to modern, compact engine platforms [22,23]. The growing shift toward lightweight, high-efficiency designs—especially in systems intended for hybrid powertrains, range extenders, and portable generation—exposes the limitations of traditional vibration-damping components, which tend to increase mass and complexity [14,18,24].
Furthermore, emerging trends such as engine downsizing, unconventional cylinder configurations, and operation under steady-state loads in hybrid systems demand targeted solutions to manage torque irregularities without needing active control or extensive redesign of the engine architecture [25,26,27]. These evolving requirements highlight a critical gap in the availability of compact, adaptive, and passive mechanisms that can be integrated into existing platforms.
The challenge lies in delivering a solution that addresses idle and low-speed instability and aligns with constraints on packaging, responsiveness, and energy efficiency [28,29,30]. The work presented in this paper responds to this challenge through the simulation and experimental validation of a passive balancing mechanism designed specifically to meet these modern demands.

1.3. Objectives

The main objective of this work is to design, implement, and validate a passive mechanical system capable of stabilizing the torque and rotational speed of an internal combustion engine, particularly during idle operation. The proposed mechanism is a lightweight and energy-efficient alternative to traditional vibration mitigation methods used in hybrid and compact engine applications. All stages of the study are applied to a specific engine—a single-cylinder Honda® GX 120—enabling practical validation of the concept. The specific objectives are as follows:
Characterization of the stock engine behavior: To experimentally measure the engine’s torque and angular velocity variations in its original configuration, establishing a baseline fluctuation profile during idle operation. This profile serves as a reference for performance evaluation and as input for the design of the compensating cam mechanism.
Design and optimization of the balancing cam mechanism: To develop a cam-based system tailored to the dynamic behavior of the selected engine, capable of passively compensating for torque fluctuations by storing and releasing energy in synchrony with the crankshaft rotation.
Simulation-based performance evaluation: This involves simulating the behavior of the proposed mechanism, predicting its influence on torque and velocity stabilization before physical implementation.
Prototype development and experimental validation: To fabricate and implement the proposed mechanism on the actual Honda® engine, followed by experimental testing to validate the predicted improvements and quantify the reduction in torque ripple and rotational speed variation.

2. Materials and Methods

2.1. Engine Characterization, Simulation, Test, and Validation

2.1.1. Engine Modelling and Simulation Approach

A custom simulation based on the Otto cycle was developed to analyze the engine’s dynamic behavior and torque fluctuations. The model calculates in-cylinder pressure and derives instantaneous torque across the entire engine cycle, enabling detailed analysis of torque irregularities at each crank angle.
Cylinder pressure—the primary source of piston force and crankshaft torque—is modeled using the five main engine phases: intake, compression, combustion, expansion, and exhaust. Heat transfer effects between the working fluid and the cylinder wall are also included to account for energy losses that influence combustion efficiency and torque output [3,21,31].
The model replicates a single-cylinder, 113 cm3 four-stroke engine, specifically the Honda® GX 120. It initializes the engine’s geometry and simulates a complete cycle in 1° increments from 0° to 720°. The engine phase and the corresponding instantaneous torque and angular velocity variation are determined at each step.
The Honda® GX 120 was selected for its widespread application, mechanical simplicity, and ease of modification. The engine was disassembled to measure its internal geometry accurately and determine its internal inertia.
The simulation also decomposes the total torque into its constituent components, highlighting the dominant role of the driving torque while illustrating the influence of various resistive torques—such as frictional, valve, and inertia torque—that act against the engine’s output and shape the final torque profile. This decomposition significantly contributes to understanding the variable and non-uniform nature of torque production in alternative engines [3,21,31].
Figure 1 presents the simulated instantaneous torque and corresponding angular velocity variation for the Honda® GX 120 engine over a complete operating cycle. The simulation was performed assuming a constant engine speed of 1500 rpm to match the experimental test conditions. The torque profile reflects the combined effects of different torque contributions, including driving torque, internal component inertia, valve resistance, dipper torque, and frictional losses.
The variations in the torque profile are most pronounced during the compression and ignition phases, followed by the expansion stroke. However, although less prominent, a noticeable dip near 90°, where negative torque is generated due to pumping losses, is also possible to observe. The amplitude of the profile is 50 Nm.
Due to these torque variations and the combined rotational inertia of the engine (1.254 × 10⁻³ kg m2) and flywheel (1.349 × 10⁻³ kg m2), the angular velocity exhibits significant fluctuation. The minimum speed of approximately 145 rad/s occurs just before 360°, aligning with peak compression resistance. Following expansion, the crankshaft accelerates rapidly, reaching about 155 rad/s during the expansion phase.
This combined analysis confirms the inherent cyclic instability of single-cylinder engines and demonstrates how instantaneous torque directly influences rotational speed—reinforcing the motivation for implementing a torque-balancing mechanism.
The simulation results obtained in this study agree with the findings reported in the literature, reinforcing the validity of the modelling approach. In addition to confirming theoretical expectations, the simulation provides valuable insight into torque variation throughout the engine cycle, contributing to a deeper understanding of the dynamic behavior of single-cylinder engines [2,3]. These results form a solid foundation for the next phase of the work, in which experimental tests will be carried out to validate numerical predictions and the experimental mounted setup. Moreover, the torque profile generated by the simulation served as the initial basis for developing the engine’s torque-balancing mechanism, which was previously published and played a key role in guiding its design and defining the parameters of the compensating system [20].

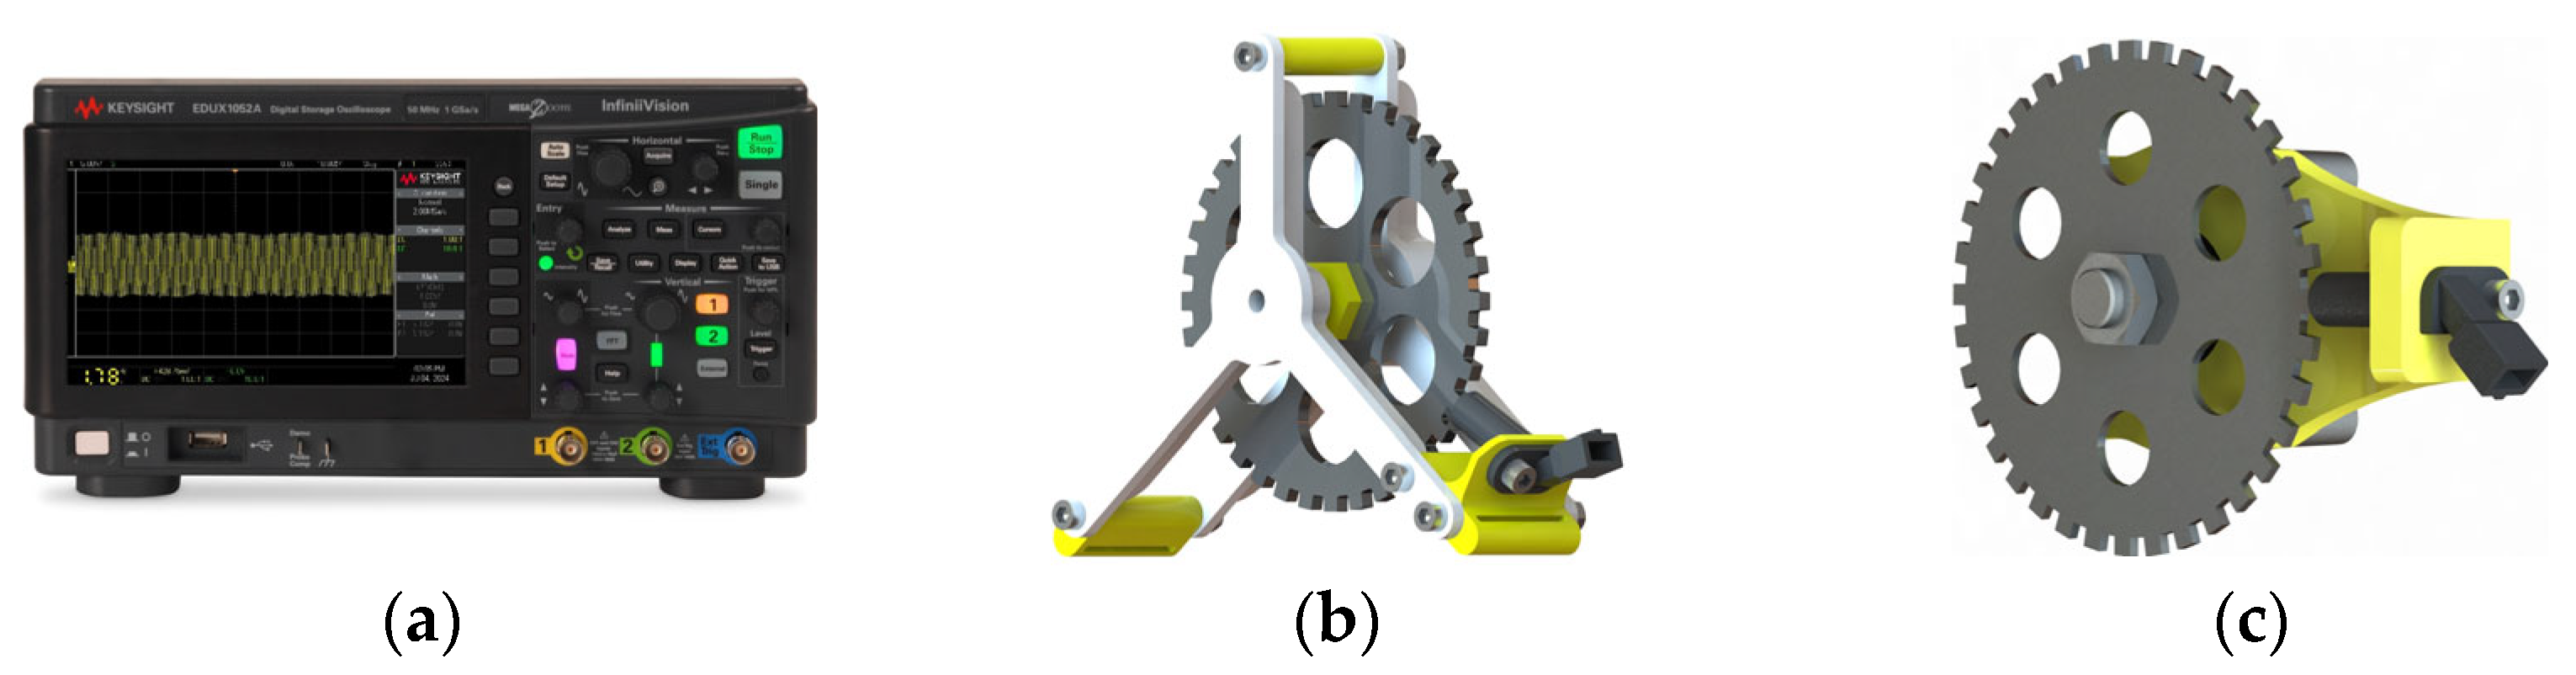
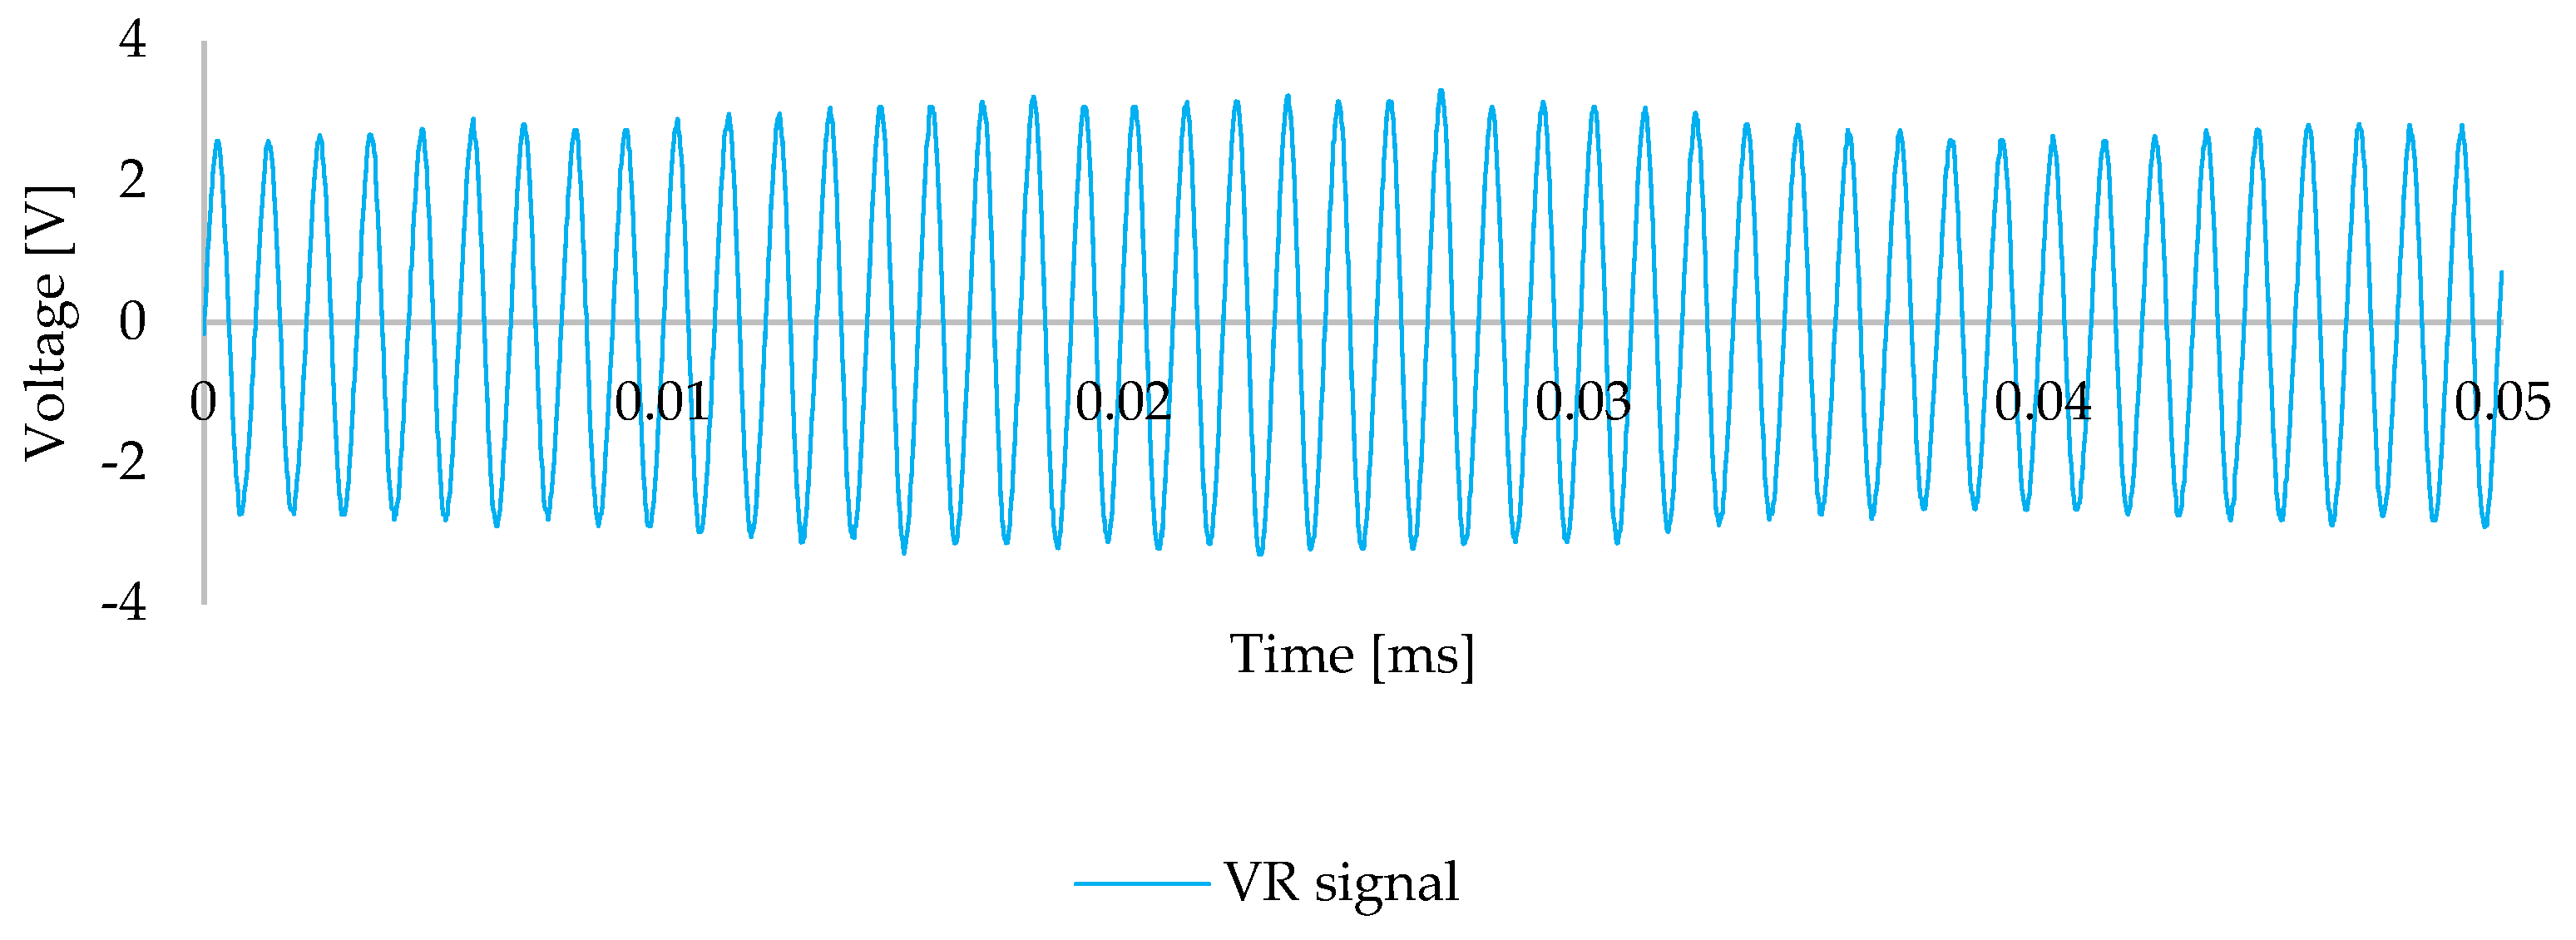
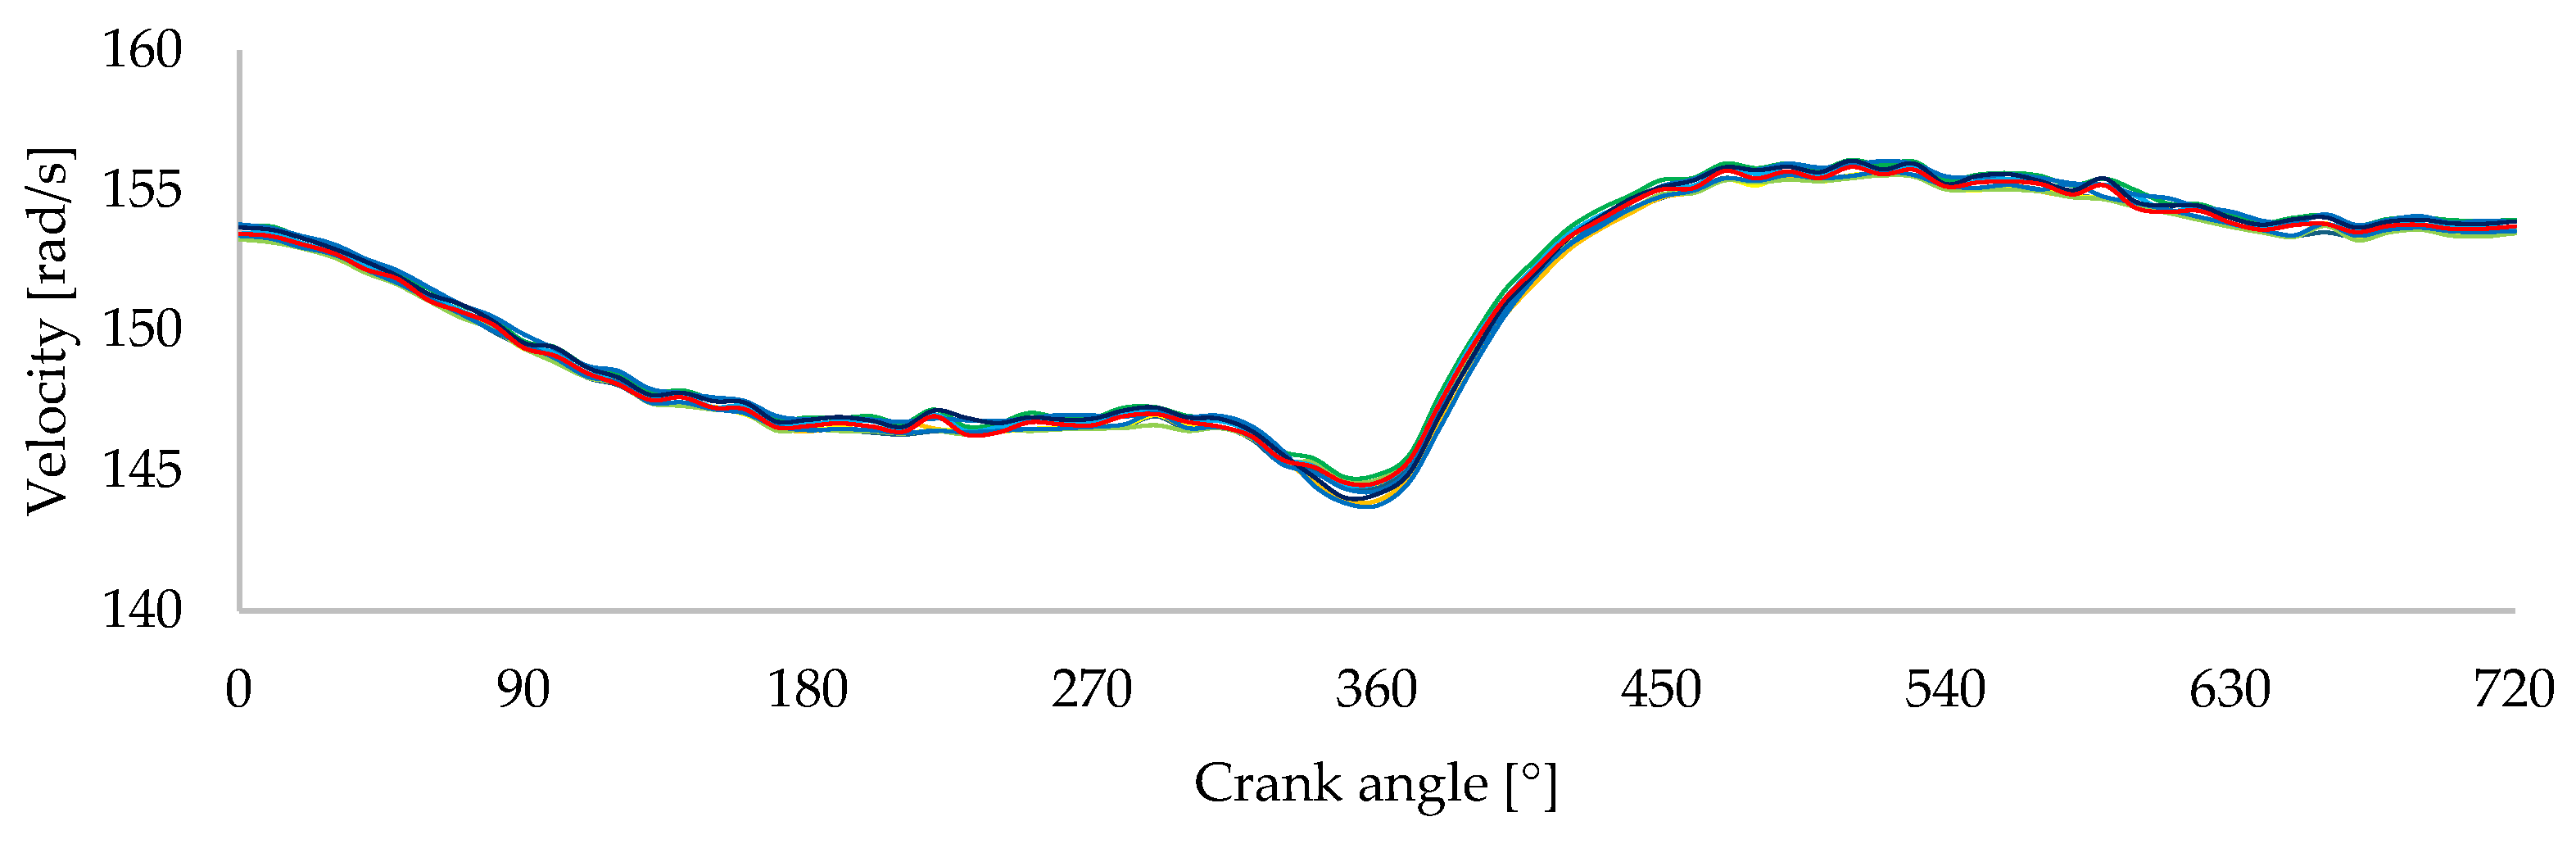
2.1.2. Experimental Setup and Data Acquisition

A variable reluctance (VR) sensor was employed to measure crankshaft angular velocity during engine operation due to its proven reliability and widespread use in internal combustion engines [32]. The VR sensor detects variations in magnetic flux generated by a 36-tooth trigger wheel fixed to the crankshaft, producing a sinusoidal voltage signal as the teeth pass by the sensor. This signal is then used to determine rotational speed based on zero-crossing detection.
Comparative tests were carried out using a light-dependent resistor (LDR) sensor to validate the VR sensor’s performance. In this setup, the 36-tooth wheel was positioned between a light source and the LDR. As the teeth rotated, they periodically blocked the light path, creating a square wave signal due to the alternating presence and absence of light on the sensor. The time interval between signal edges was used to calculate angular velocity, similarly to the VR sensor.
Both sensors provided consistent and comparable results under controlled conditions. However, the VR sensor was chosen for the whole experimental campaign due to its greater robustness and immunity to vibrations, making it more suitable for the dynamic environment of the internal combustion engine.
Velocity was calculated based on the time interval between two consecutive teeth, determined from the zero-crossing points of the signal (both rising and falling edges) to enhance timing accuracy and reduce sensitivity to waveform asymmetry [32,33].
The data acquisition system included a Keysight® EDUX1052A digital oscilloscope, configured with a 20 ms/div time window and a voltage scale of 2 V/div. Although the oscilloscope has a memory depth of up to 50.000 points, acquisition was limited to 10.000 points per test, as higher resolution provided negligible improvements while increasing data-handling time.
The components of the experimental setup used for data acquisition and preliminary testing are shown in Figure 2. Part (a) illustrates the Keysight® EDUX1052A digital oscilloscope used to record the voltage signals generated by the VR sensor. Part (b) shows the test rig developed for preliminary validation, consisting of an electric motor and support frame that allowed controlled rotation of the toothed wheel. This setup was used to assess the repeatability of the measurements. Part (c) presents the custom fixture designed to mount the VR sensor and the 36-tooth trigger wheel on the engine crankshaft during later combustion engine tests.
A controlled experimental setup was assembled using an electric motor to validate the measurement system before applying it to the combustion engine. The VR sensor and 36-tooth trigger wheel were mounted on a custom rig, allowing for precise control of rotational speed and enabling repeatability analysis under steady conditions. During these tests, the motor was set to operate at a constant speed, matching the conditions later used in the engine tests to ensure consistency in the data acquisition process [33].
Figure 3 shows the measured speed across 10 repeated tests using the electric motor rig. The results demonstrate consistent behavior across all tests, with minimal deviations between tests.
Figure 4 presents a comparison between the average velocity profile obtained from the experimental tests and the reference signal corresponding to continuous velocity from the disc driven by the electric motor. Despite the minimal variation observed between tests, the calculated standard deviation of 0.22 rad/s and amplitude of 1.13 rad/s confirm the reliability of the VR sensor and help define the expected range of oscillation inherent to the measurement system.
Figure 5 shows the typical sinusoidal voltage signal the VR sensor generates during rotation. The amplitude oscillates between approximately −3.0 V and +3.0 V, reflecting the consistent passage of teeth through the magnetic field. Slight variations in amplitude were observed due to imperfections in the wheel geometry, magnetic artifacts, or surface finish, but the signal remained stable and periodic [34].
After confirming the sensor’s ability to capture stable and continuous signals, the measurement system was implemented on the Honda® GX 120 engine under idle operating conditions. A custom fixture with a 36-tooth trigger wheel was developed for this purpose, and the same method validated on the electric motor rig was applied to ensure consistency in data acquisition.
Figure 6 shows the crankshaft velocity profiles recorded across 10 repeated tests on the combustion engine, which was set to operate at a constant speed of 1500 rpm. Before data acquisition, the engine was allowed to reach its ideal working temperature, after which both engine and room temperature were carefully maintained to ensure consistent testing conditions. A consistent pattern along all conducted tests is observed throughout the engine cycle, with a pronounced dip near the 360° crank angle, corresponding to the end of the compression stroke, and a recovery during the power stroke. Slight deviations appear near 360° and 450°, which are attributed to real variations in combustion pressure and torque output, influenced by the engine’s dynamic operating conditions [35].
Figure 7 presents the average crankshaft angular velocity profile computed from the 10 repeated tests shown previously. This curve filters minor cycle-to-cycle variations and highlights the consistent underlying behavior of the engine under idle conditions. The average data clearly shows a gradual deceleration from approximately 155 rad/s at the beginning of the cycle to a minimum of 145 rad/s just before the 360° crank angle, corresponding to the end of the compression stroke. This is followed by a sharp acceleration during the power stroke, where the velocity rises rapidly, peaking at around 155 rad/s around 450°. After this point, the velocity gradually stabilizes approximately at 153 rad/s as the engine completes the exhaust. The smoothness of the curve and the consistency across tests confirm the profile’s reliability and support its use as a reference for the design and simulation of the torque-balancing cam mechanism.
The use of a VR sensor for rotational speed measurement is well established in controlling and monitoring internal combustion engines, mainly due to its robustness and reliability. Although this method provides a resolution limited to 10° per tooth, it demonstrates effectiveness for capturing dynamic behavior. In the preliminary validation tests conducted using the electric motor rig, it was observed that magnetic artifacts or slight dimensional irregularities in the toothed wheel could influence the magnetization and demagnetization process of the VR sensor, potentially affecting signal uniformity. Nevertheless, these effects were minimal and did not compromise the method’s repeatability. The results presented in Figure 7 clearly illustrate the characteristic speed variation pattern of the engine, confirming the sensor’s capability to capture meaningful and consistent data under operating conditions [32,33,36].

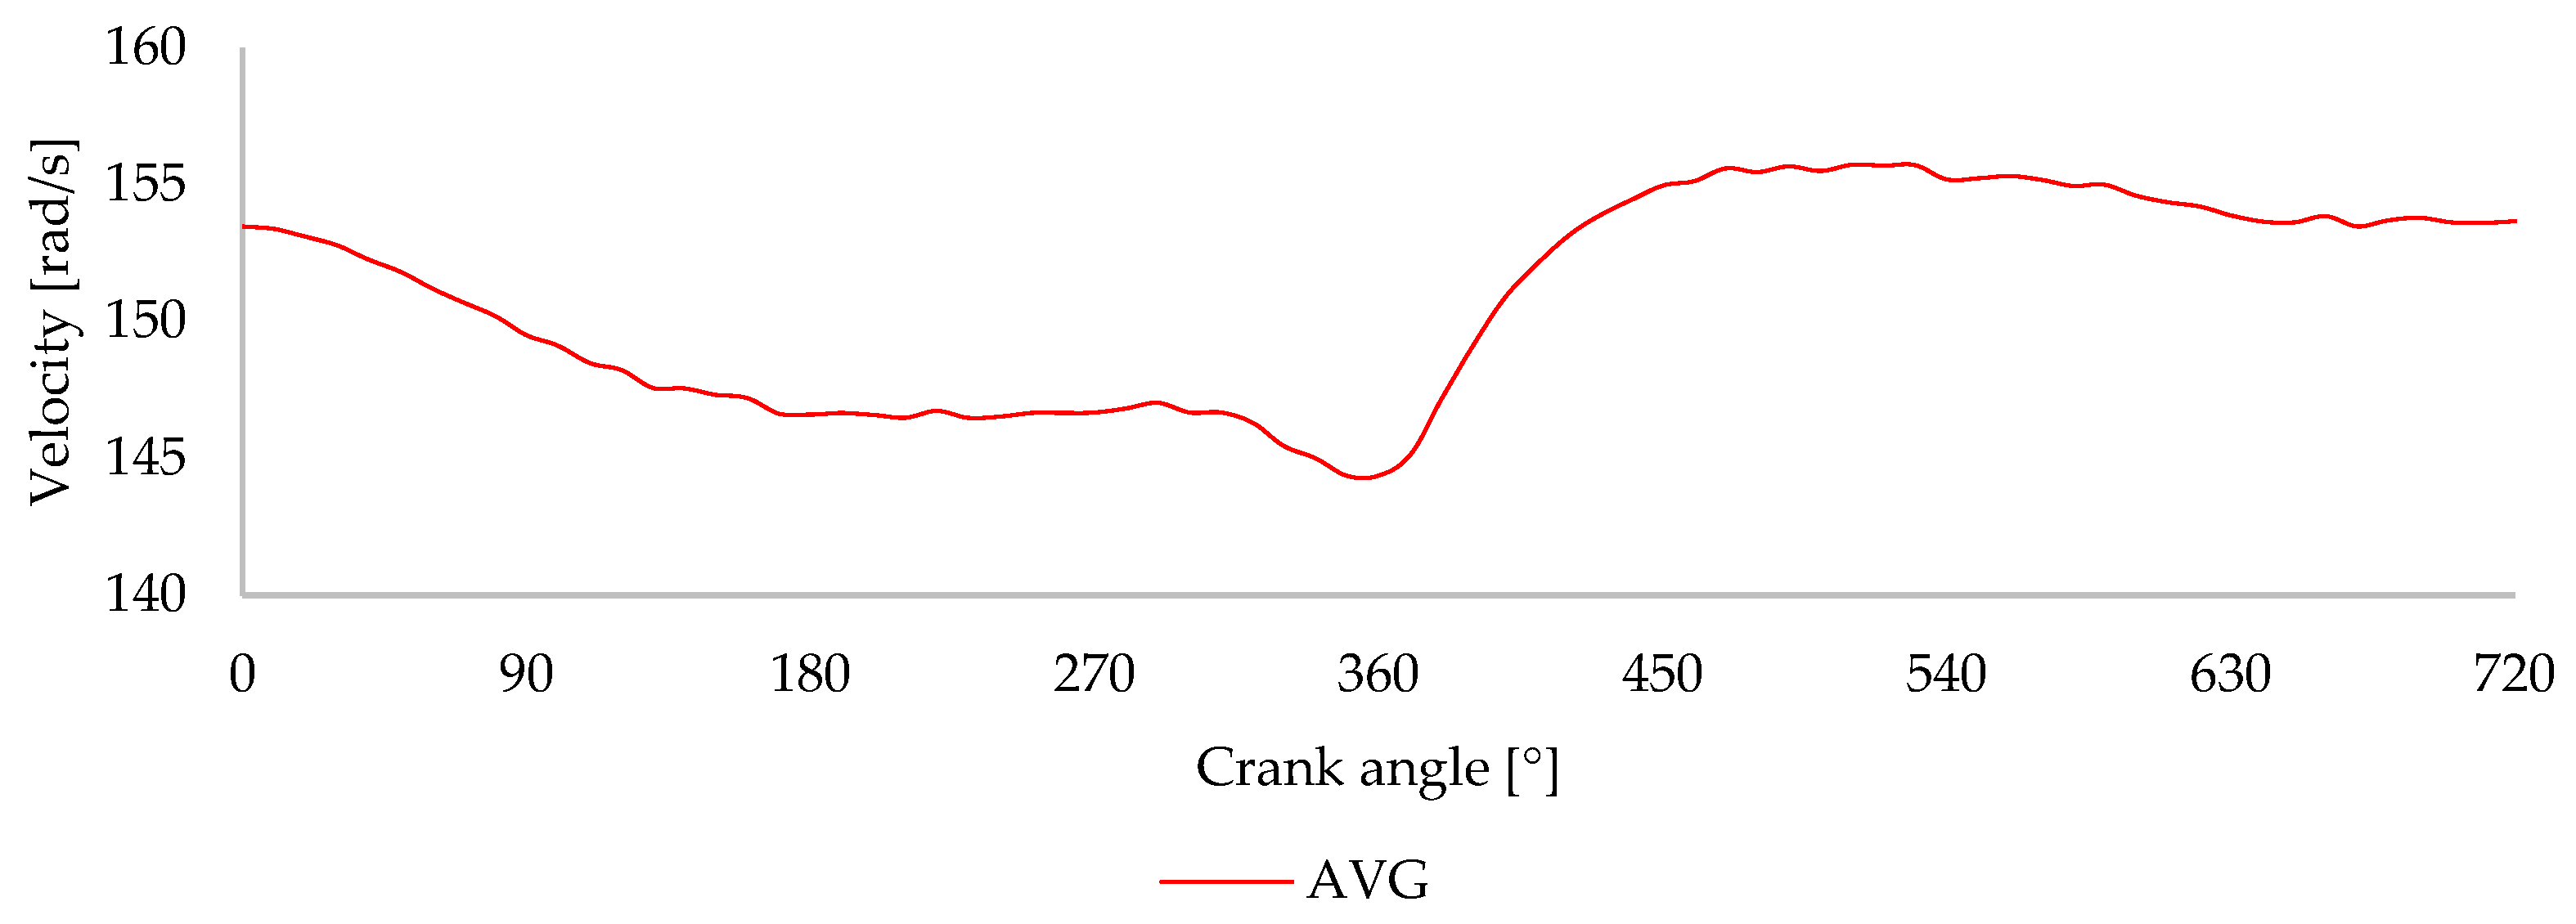
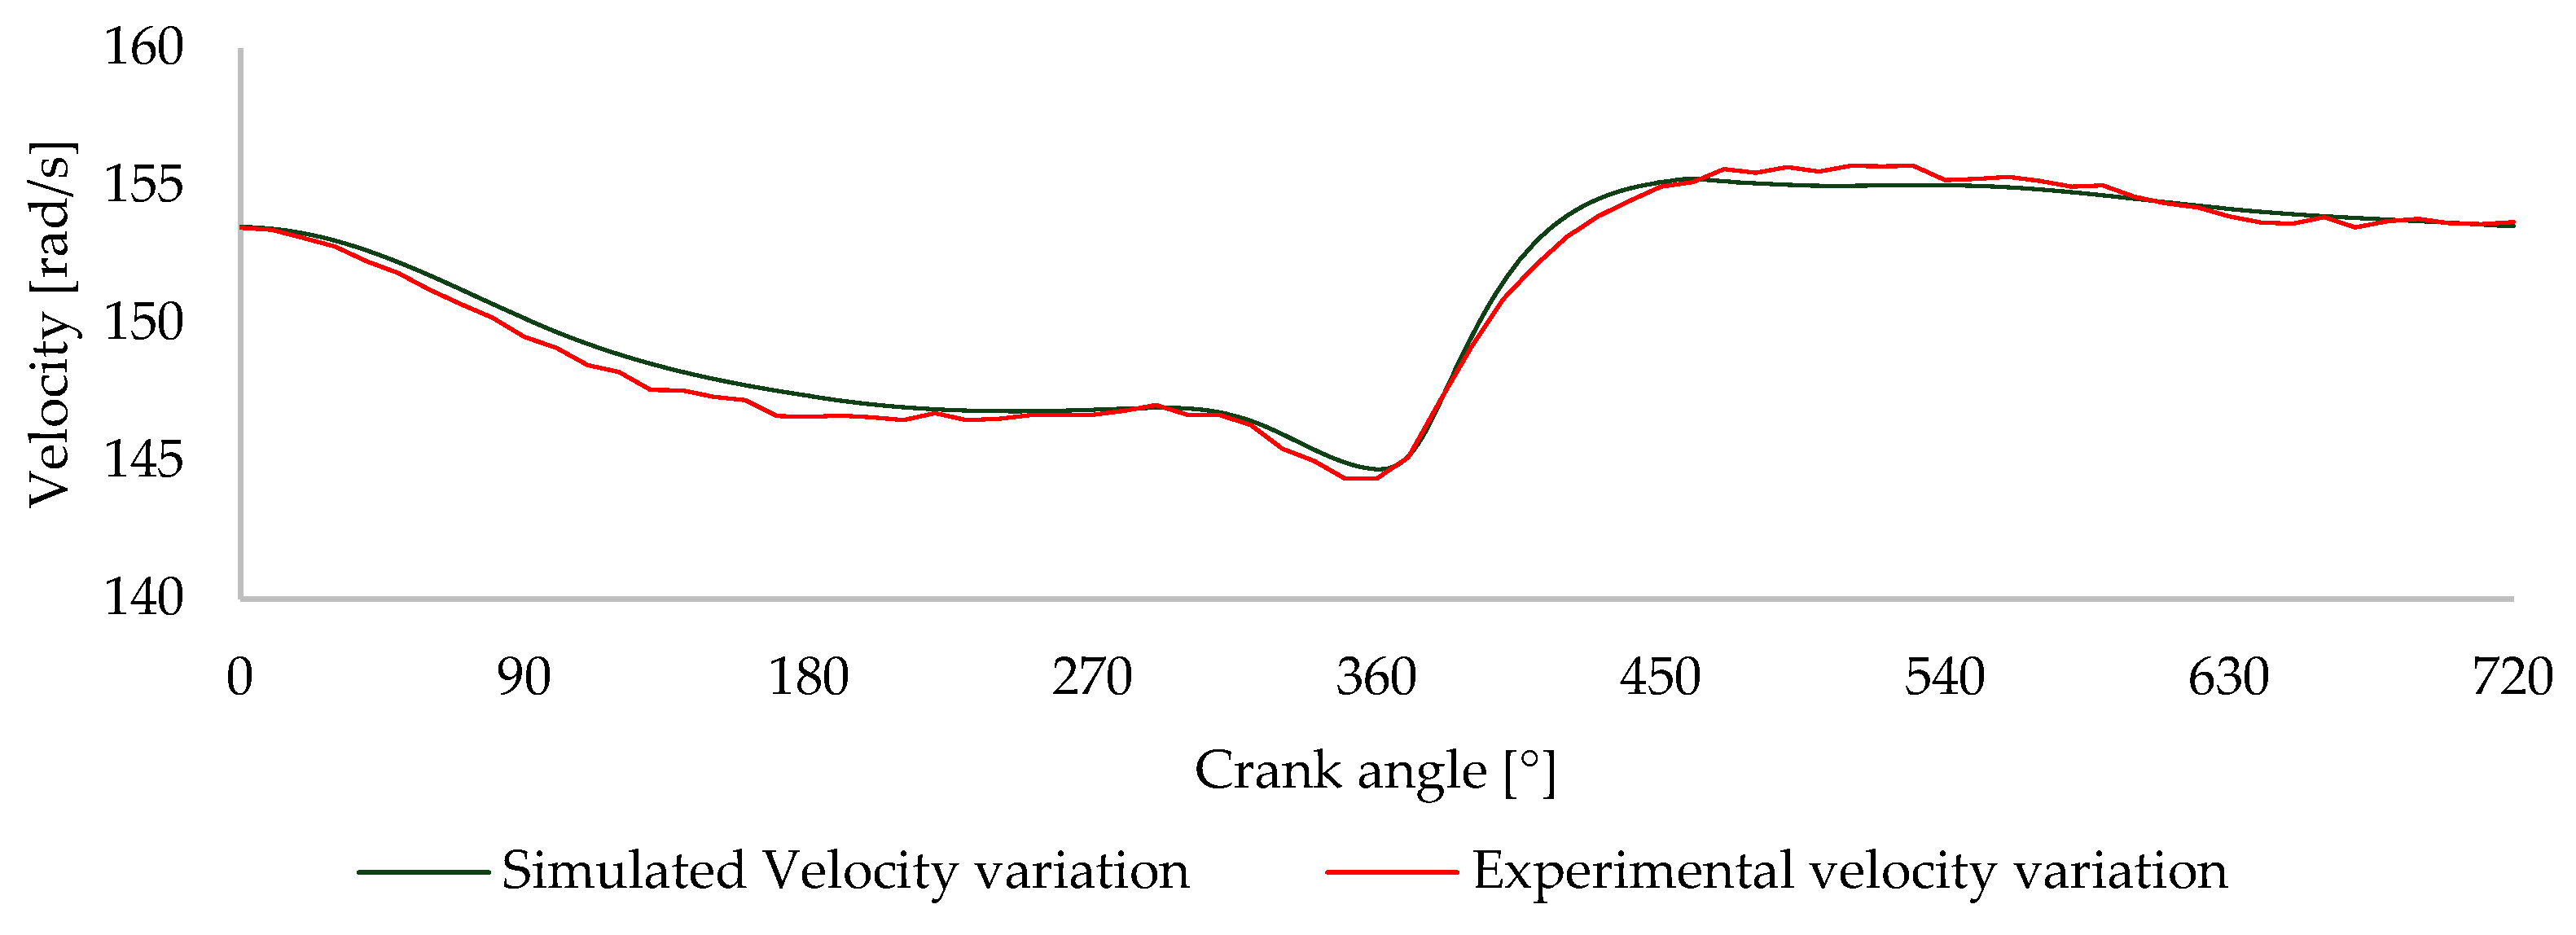
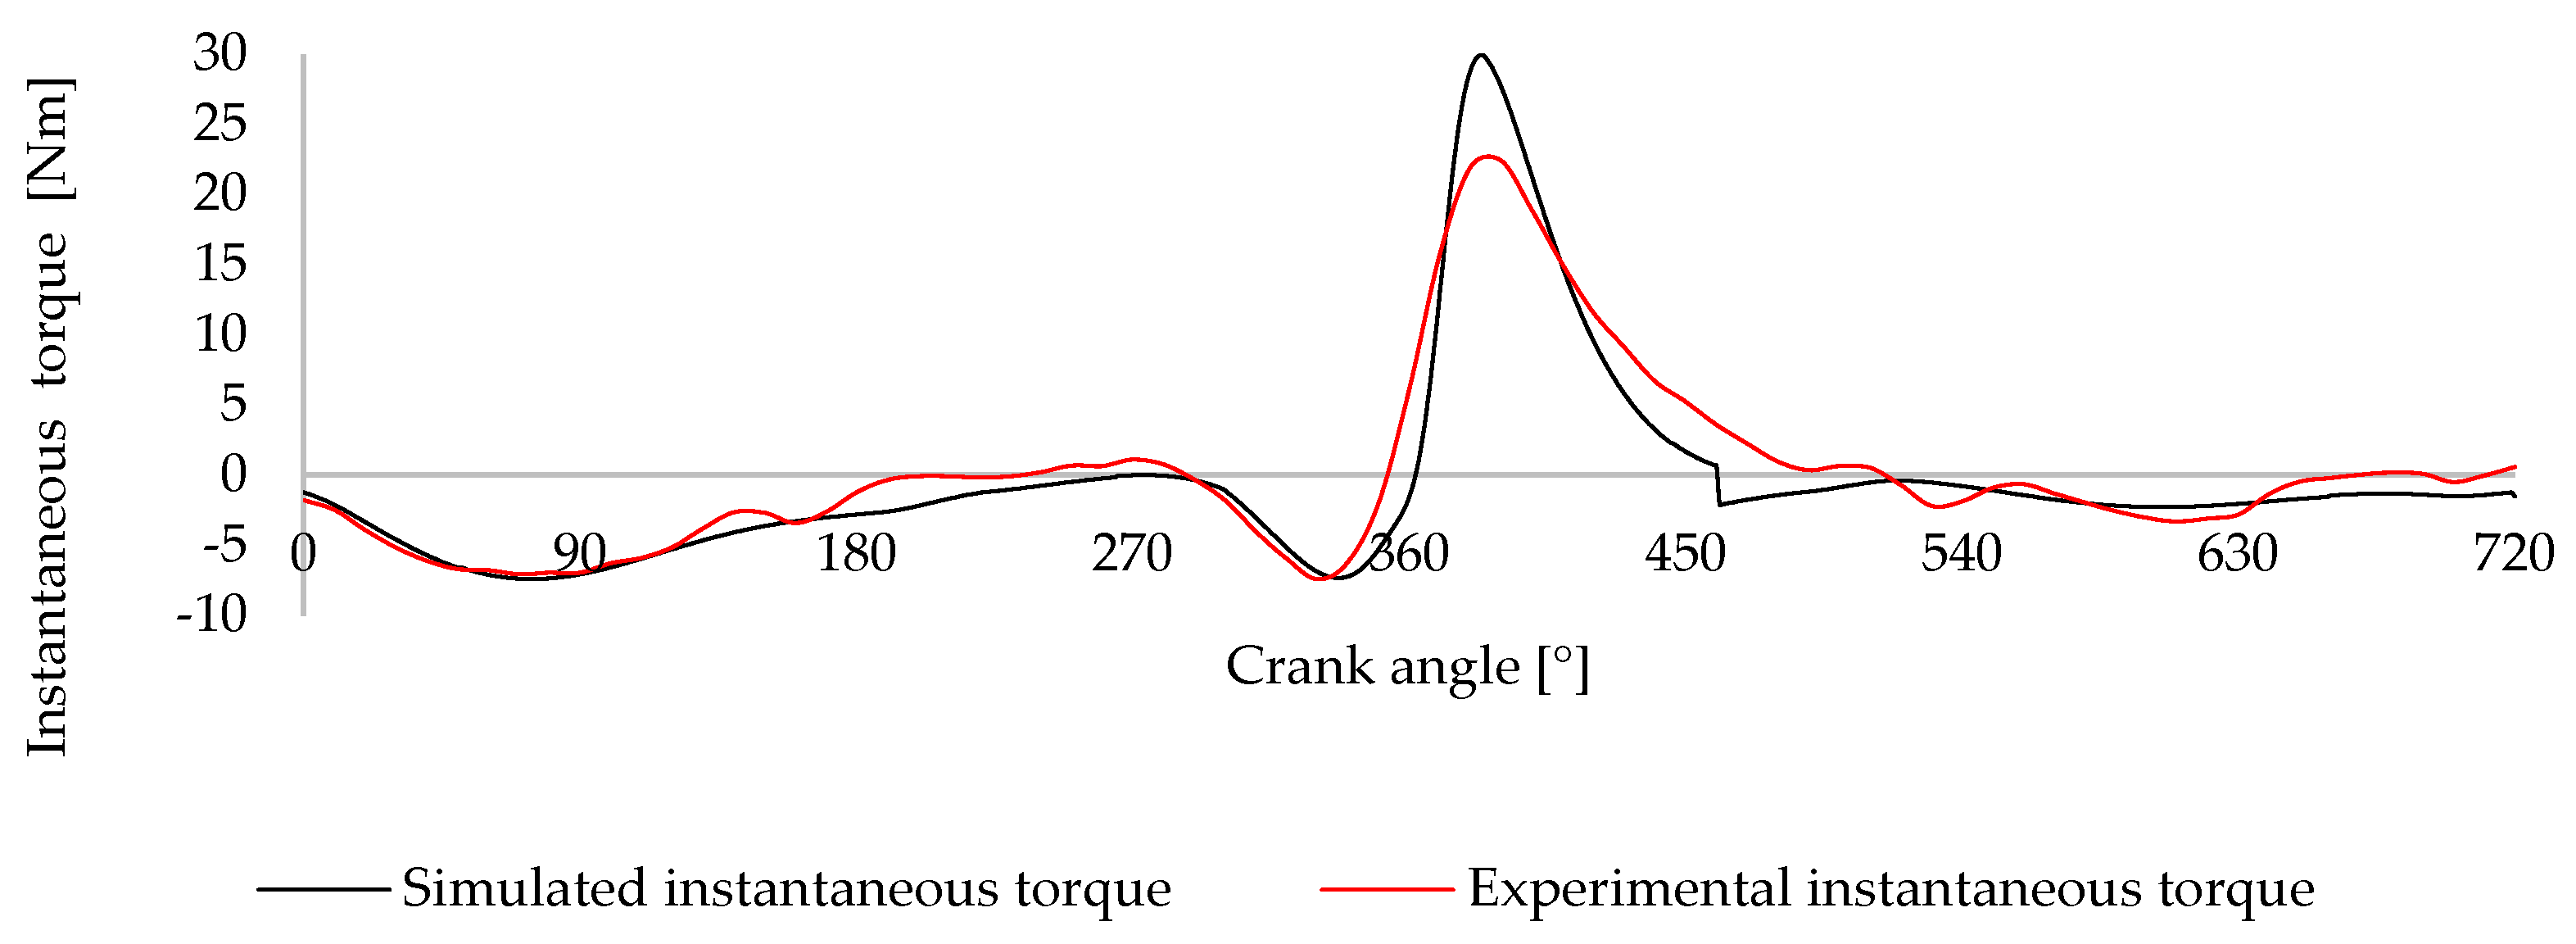
2.1.3. Comparison and Validation of Engine Torque and Velocity Profiles

This section compares the simulated and experimentally measured velocity and torque variations of the Honda® GX 120 engine operating at 1500 RPM. The comparison validates the simulation model by evaluating how accurately it reproduces the engine’s real-world dynamic behavior. At the same time, it confirms the effectiveness of the experimental setup in capturing the characteristic variation profile of crankshaft speed and torque [37,38,39].
The graph in Figure 8 compares the simulated and experimentally measured velocity variations over a complete engine cycle, providing a clear picture of the engine’s dynamic performance. Both curves follow a similar trend, indicating that the simulation closely matches the real-world measurements, albeit with minor discrepancies in specific regions.
At the beginning of the cycle, from 0° to around 180°, both the simulated and measured curves show a steady decline in velocity, starting at approximately 153 rad/s and gradually decreasing to around 147 rad/s by the time the crank angle reaches 180°. This gradual decrease in velocity corresponds to the intake and compression strokes, where the engine experiences increasing resistance due to compression forces.
The most significant divergence between the simulated and measured values occurs between 180° and 390°. In this region, the measured velocity dips to a minimum of about 145 rad/s just before 360°, whereas the simulated velocity drops to approximately 142 rad/s. This discrepancy could be attributed to factors such as frictional losses or slight mechanical irregularities in the engine, which are more difficult to simulate accurately. It may also result from minor inaccuracies, information loss during the experimental procedure, or limitations within the experimental setup.
Following this point, both curves display a sharp increase in velocity between 360° and 450°, coinciding with the power stroke, where the expanding gases accelerate the piston. The measured velocity peaks at around 155 rad/s just after 360°, while the simulated curve reaches a slightly higher peak at approximately 156.5 rad/s.
From 450° to 720°, both curves gradually return to a more stable velocity, stabilizing approximately at 153 rad/s as the engine completes the exhaust. The close alignment of the curves in this region suggests that the simulation accurately captures the engine cycle, where torque variations are smaller and more consistent. It may also indicate that the experimental results in these regions are less affected by pronounced accelerations and associated transient effects [39].
Figure 9 compares the simulated and experimentally measured instantaneous torque profiles for the Honda® GX 120 engine at 1500 RPM, allowing an assessment of the model’s ability to replicate real engine torque behavior. The experimental torque profile was derived from the measured angular velocity variation and the known inertia of the engine system. It represents the torque required to maintain engine operation under idle conditions, where the engine produces just enough torque to overcome internal losses and sustain rotation [40,41].
Both curves in Figure 9 demonstrate a clear correlation in the overall torque trend but exhibit differences in magnitude, particularly around the peak torque values.
In the experimental torque curve, the red line shows a more gradual rise in torque leading up to the 360° mark, corresponding to the engine’s power stroke. The peak torque experimentally measured reaches around 25 Nm, whereas the simulated torque black line reaches significantly higher, at approximately 45 Nm, during the same crank angle. This discrepancy suggests that the simulation may overestimate the combustion forces acting on the piston, potentially due to assumptions in the model related to combustion efficiency. Although the combustion efficiency factor used in the simulation aligns with values reported in the literature, further exploration of additional influencing parameters may lead to results that are more closely aligned with experimental data. Moreover, part of the deviation could also be attributed to limitations in the experimental setup, particularly in accurately capturing high-frequency accelerations and transient effects [40,42].
After 360°, the experimental and simulated curves decrease, with the torque gradually dropping as the expansion stroke concludes. The experimental curve smooths out more gradually, showing more dampened fluctuations, whereas the simulated curve exhibits sharper declines and variations between 360° and 450°.
Despite the magnitude differences, the phase alignment between the simulated and experimental torque profiles is quite close. Both show a dip in torque before the power stroke and similar behavior through the compression and intake strokes, suggesting that while the magnitude discrepancies are notable, the overall shape and timing of the torque generation align well between the two data sets.
The comparison between the simulated and experimental results highlights that the simulation model reasonably accurately represents the engine’s dynamic behavior, particularly regarding the timing and general shape of the torque and velocity variation curves. While some differences in magnitude were observed—especially during the combustion phase—these are expected due to the simplified assumptions in the model and the limitations of the experimental setup in capturing rapid transients. Nonetheless, the agreement in trend and phase supports the model’s validity as a tool for studying torque fluctuations. Additionally, based on VR sensor readings and velocity-derived torque estimation, the experimental methodology proved to be sufficiently reliable for capturing the main features of the engine’s cyclic behavior [40,41,42].

2.2. Balancing Cam Mechanism Development

2.2.1. Integrated Design and Simulation

Following the analysis of the internal combustion engine’s instantaneous torque and velocity variation and a deeper understanding of the effects caused by interrupted and irregular torque delivery, a passive balancing mechanism was developed to mitigate these fluctuations. The goal was to reduce the cyclic instability inherent in single-cylinder engines and improve the overall smoothness of operation. The solution focused on a cam-based system capable of compensating for the periodic torque imbalance observed during the engine cycle.
The cam is at the core of the balancing cam mechanism’s operation, which is critical in controlling the actuator in response to the engine’s dynamic behavior. The cam profile is designed based on the torque acting upon it, which is subsequently transformed and stored as potential energy in the spring. To define this profile, it is necessary to determine the cam radius as a function of the crankshaft rotation angle θ c r a n k , using a predefined torque profile as input. Figure 10 illustrates the diagram of the forces acting on the cam during operation [20,43,44].
The torque on the mechanism camshaft T c a m is the product of the tangential force F t by the cam radius:
T c a m = F t r c a m
  • T c a m t o r q u e   o n   t h e   m e c h a n i s m   c a m s h a f t   [ N m ]
  • F t t a n g e n t i a l   f o r c e   [ N ]
  • r c a m c a m   r a d i u s   [ m ]
From Figure 10, F t is the product from F s by tan   φ , as presented in Equation (2), and F t can be directly substituted into Equation (1), which gives the torque as a function of F s , as presented in Equation (1). F s depends on the spring conditions and the displacement induced by the cam on the spring, as shown by Equation (3).
r c a m c a m   r a d i u s   [ m ]
T c a m = F s tan   φ   r c a m
F s = k ( r c a m r b a s e ) + P
  • F s s p r i n g   f o r e   [ N ]
  • r b a s e c a m   b a s e   r a d i u s   [ m ]
  • k s p r i n g   s t i f n e s s   [ N / m ]
  • P p r e l o a d   o f   t h e   s p r i n g   [ N ]
Based on the defined torque for the cam T c a m , tan φ can be determined using Equation (7). Then, following Equation (8), which arises from the analysis of the diagram in Figure 10, the radius of the cam can be calculated as a function of the crankshaft angle.
tan φ = T c a m r c a m i ( k ( r c a m i r b a s e ) + P )
r c a m i = r c a m i 1 + Δ θ c r a n k 2 ( r c a m i 1 tan φ )
To convert the previously obtained polar coordinates into cartesian coordinates for better visualization and plotting of the cam, Equations (7) and (8) are used.
x = r c a m cos Δ θ c r a n k 2
y = r c a m sin Δ θ c r a n k 2
Finally, when integrating a roller follower, including the roller’s radius in the cam profile calculation is necessary. This is completed using Equations (9) and (10), ensuring the cam profile meets all specified conditions for the roller follower. This crucial step guarantees that the cam design is effectively customized for the specific follower type in the engine mechanism.
x r = x r r o l l e r cos ( φ 2 θ )
y r = y r r o l l e r sin ( φ 2 θ )
  • r r o l l e r r o l l e r   r a d i u s   [ m ]
The determination of the cam profile relies on the application of kinematic inversion principles in combination with an analysis of the torque profile that the mechanism aims to counteract. By treating the working surface of the cam as fixed and considering the follower’s movement relative to this fixed reference, the cam profile can be effectively designed to generate the desired compensatory torque. The design begins with a detailed examination of the torque profile, focusing on fluctuations requiring mitigation.
The characteristics of the spring, particularly its capacity to store or release energy per unit of displacement, are fundamental in determining the required displacement induced by the cam. This displacement is calculated to ensure that the spring effectively stores energy during compression and releases energy during decompression, thereby providing compensatory torque in synchronization with the engine’s operational cycle. Using the kinematic inversion approach, the cam’s movement is analyzed to ensure that the spring is compressed or allowed to decompress in a controlled manner, thus counteracting torque fluctuations and contributing to a more uniform torque output throughout the cycle.
The final cam profile is generated by integrating these displacement requirements with kinematic considerations, ensuring that the resulting cam geometry accurately produces the necessary force interactions between the spring and the cam follower.
A torque profile established from the experimental process described earlier is used, aiming to correct the torque profile illustrated in Figure 9, for defining the cam profile in addition to the torque profile. The input parameters are the spring’s stiffness k , spring preload P , initial cam radius r b a s e , and, as this mechanism uses a roller follower, the radius of the roller r r o l l e r . In practice, for easy implementation, the cam will be positioned outside the engine with a reduction ratio of 2:1. Although this solution is characterized by increased friction, it offers a more straightforward approach to creating a functional and robust prototype for practical testing. The prototype was constructed using the torque obtained during the experimental phase of computational validation. This torque profile required a smoothing process due to irregularities caused by the acquisition method. This resulted in segments with extreme accelerations and decelerations, which are artifacts of the acquisition process, making the raw cam profile impractical.
After selecting the torque profile, a spring was designed with characteristics allowing it to produce the desired torque through the mechanism. Once the spring was characterized, it was necessary to identify a commercially available spring that most closely matched the designed specifications. A suitable spring was tested using a force-versus-displacement test to determine this stiffness constant, resulting in a spring with a stiffness constant of 24.2 kN/m, and the preload was set at 0.01 m, resulting in a preload force of 241.9 N for the spring. Some prerequisites were also established for the cam’s dimensions to ensure it would not interfere with other components of the mechanism and to avoid abrupt changes in the cam profile that could lead to mechanical failures. After these considerations, an initial radius of 0.05 m and a follower roller radius of 0.008 m were defined, taking into consideration some design constraints of the mechanism. The initial parameters defined for the Cam are summarized in Table 1.
The cam was constructed based on the torque profile shown in Figure 9. However, the experimentally obtained torque curve could not be used directly, as it contained high-frequency variations introduced by the acquisition method. These fluctuations would result in an irregular and mechanically unfeasible cam geometry. A moving average filter using 12 values was applied to smooth the torque profile, as shown in Figure 11. While this smoothing was necessary to enable the physical construction of the cam, it also attenuated the sharp transitions and peak amplitudes of the original torque curve. Consequently, the resulting cam profile and the torque the mechanism delivers cannot fully reproduce the engine’s torque demand throughout the cycle—particularly in the most dynamic regions. This represents a trade-off between mechanical feasibility and the effectiveness of the balancing mechanism in compensating for torque fluctuations.
As observed in Figure 11, the smoothed torque curve effectively reduces local fluctuations while preserving the overall shape of the torque distribution throughout the engine cycle. This adjusted profile served as the basis for defining the cam geometry used in the balancing mechanism. Figure 12 presents the final cam profile obtained from this process. The plot shows the cam geometry in Cartesian coordinates, illustrating its physical shape with and without a roller follower. This profile reflects the direct translation of the smoothed torque curve into a mechanically feasible cam design ready for integration with the experimental setup.
While the cam mechanism was designed to compensate for the engine’s torque fluctuations, the torque delivered by the system exhibits slight deviations from the reference engine torque profile. These differences are primarily due to the smoothing applied to the target torque curve, a necessary step to ensure the resulting cam geometry was mechanically feasible and reliable. Additionally, dynamic effects such as follower inertia and internal friction influence the system’s response, especially during rapid torque transitions, leading to partial compensation during certain phases of the engine cycle.
Figure 12 illustrates the resulting cam profile generated from the smoothed torque data. The cam geometry is shown in Cartesian coordinates, with and without considering a roller follower.
These limitations due to friction are evaluated in the support reactions. This is illustrated in Figure 13, which schematically represents the tangential force and the resulting load paths through the spring and bushing supports.
The mechanism consists of a follower supported at two points, A and B, which are spaced by a fixed distance b equal to 0.08 m. Support A includes a nylon bushing to reduce friction, while the follower slides directly against a machined steel surface in support B. Support B features a specific geometry to keep the follower aligned with the cam throughout its motion. The reactions at supports A and B depend on the cam geometry, which causes variations in the distance a, measured from support A to the follower’s center. The system is subjected to a tangential force Ft applied by the cam, and its effect on the support reactions results in frictional forces that reduce the mechanism’s effectiveness.
Using moment equilibrium around each support, the vertical reaction forces at points A and B are determined by Equations (11) and (12):
A y = F t a + b b
B y = F t a b
  • A y v e r t i c a l   r e a c t i o n   a t   s u p p o r t   A   [ N ]
  • F t t a n g e n t i a l   f o r c e   [ N ]
  • a d i s t a n c e   f r o m   s u p p o r t   A   t o   t h e   r o l l e r   c e n t e r ,   w h i c h   v a r i e s   w i t h   t h e   c a m   r a d i u s   m
  • b d i s t a n c e   f r o m   s u p p o r t   A   t o   B   [ m ]
  • B y v e r t i c a l   r e a c t i o n   a t   s u p p o r t   B   [ N ]
The corresponding frictional forces at each support are proportional to the reaction forces and the materials in contact, as defined by Equations (13) and (14):
F friction   A = μ A A y
F friction   B = μ B B y
  • F friction   A f r i c t i o n   f o r c e   a t   s u p p o r t   A   [ N ]
  • μ A c o e f f i c i e n t   o f   f r i c t i o n   b e t w e e n   t h e   s t e e l   f o l l o w e r   a n d   t h e   n y l o n   b u s h i n g
  • F friction   B f r i c t i o n   f o r c e   a t   s u p p o r t   A   [ N ]
  • μ B c o e f f i c i e n t   o f   f r i c t i o n   b e t w e e n   t h e   s t e e l   f o l l o w e r   a n d   t h e   s t e e l   s u p p o r t
The materials in contact and their respective friction coefficients influence the frictional forces at supports A and B. At support A, where the steel follower contacts the nylon bushing, the interface is characterized by a coefficient of friction of μ A = 0.04 . At support B, where the steel follower slides directly against a steel surface, a coefficient of friction of μ B = 0.2 is similarly assumed.
Figure 14 illustrates the combined impact of friction and follower inertia on the torque the mechanism delivers. The graph presents four curves: the theoretical torque produced by the mechanism without considering friction and inertia, the torque loss caused solely by friction, the torque loss associated with the follower’s inertia, and the final torque output after accounting for both effects.
The follower assembly, which includes the bearing, preload adjustment system, and half the spring mass, has an effective mass of approximately 175 g. As the cam rotates, this mass must be accelerated and decelerated throughout the engine cycle, particularly around the power stroke and compression phases, where accelerations are highest. These inertial forces oppose motion and absorb part of the available compensating torque. Consequently, the adequate torque delivered by the mechanism is reduced in critical regions, as shown in the combined torque curve.
Figure 15 presents the resulting torque profiles after implementing the balancing cam mechanism. The original torque profile of the Honda® GX 120 engine at 1500 rpm is green, highlighting the significant fluctuations observed in the crankshaft, particularly around the power stroke at 360°. The compensatory torque provided by the balancing mechanism, illustrated by the purple line, was designed to counter these fluctuations by generating an inverse torque pattern to mitigate the peaks and valleys in the original profile.
The graph in Figure 15 shows the theoretical torque provided by the cam mechanism in the absence of friction, alongside the actual torque delivered when frictional effects at the supports are considered. Additionally, the friction torque component is plotted independently to highlight its influence on system performance. As expected, friction reduces the effective torque delivered by the mechanism, particularly during the power stroke, where follower acceleration and contact forces are highest.
To assess the overall compensation effectiveness, Figure 15 also compares the original torque profile of the engine with the resulting torque after applying the balancing mechanism. The resulting torque curve, represented in red, is obtained by subtracting the mechanism’s contribution from the engine torque. A clear reduction in fluctuations is observed, especially during the high-load phases of the cycle.
This improvement can be quantitatively supported by analyzing the standard deviation of the torque profile over a complete engine cycle. Standard deviation is a statistical measure that indicates the magnitude of fluctuations around the mean value. In this context, a lower standard deviation reflects a more stable and uniform torque output, which is desirable for smoother engine operation. The standard deviation of the uncorrected engine torque is 6.25 Nm, while the compensated torque exhibits a significantly lower value of 2.05 Nm. This substantial reduction confirms the mechanism’s effectiveness in attenuating torque peaks and balancing the engine’s dynamic behavior.

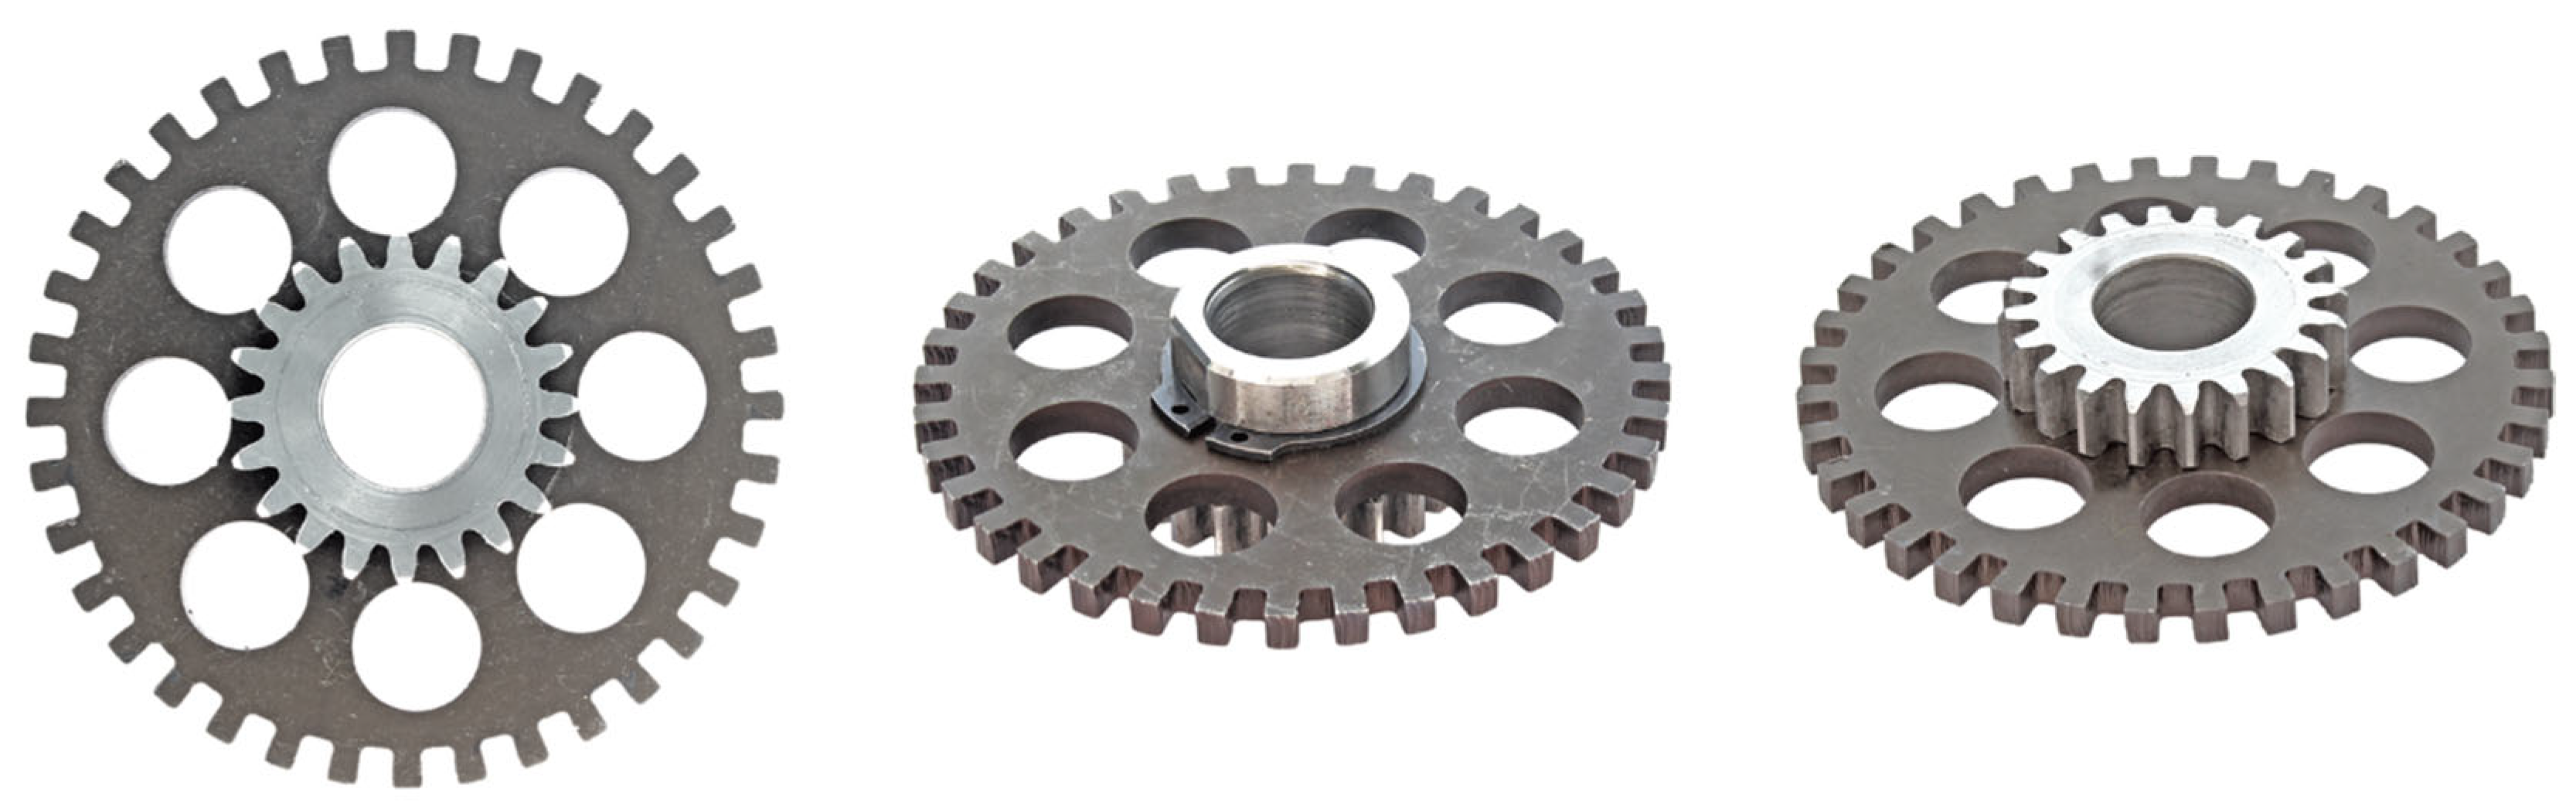
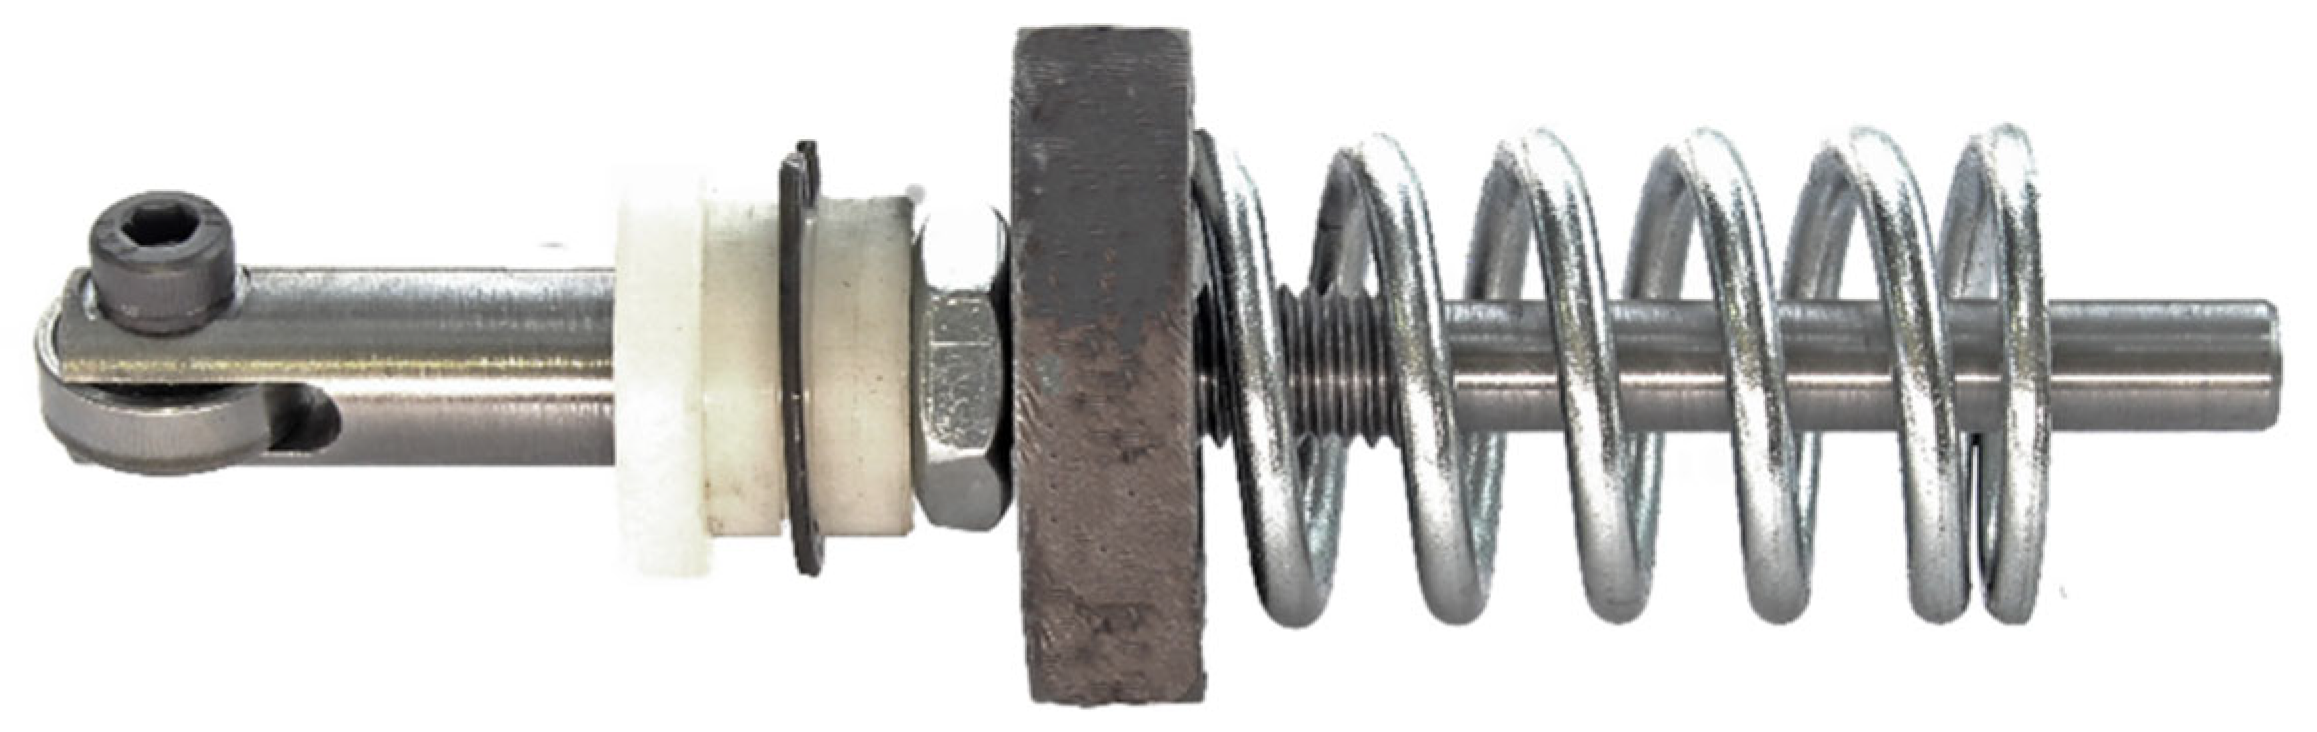
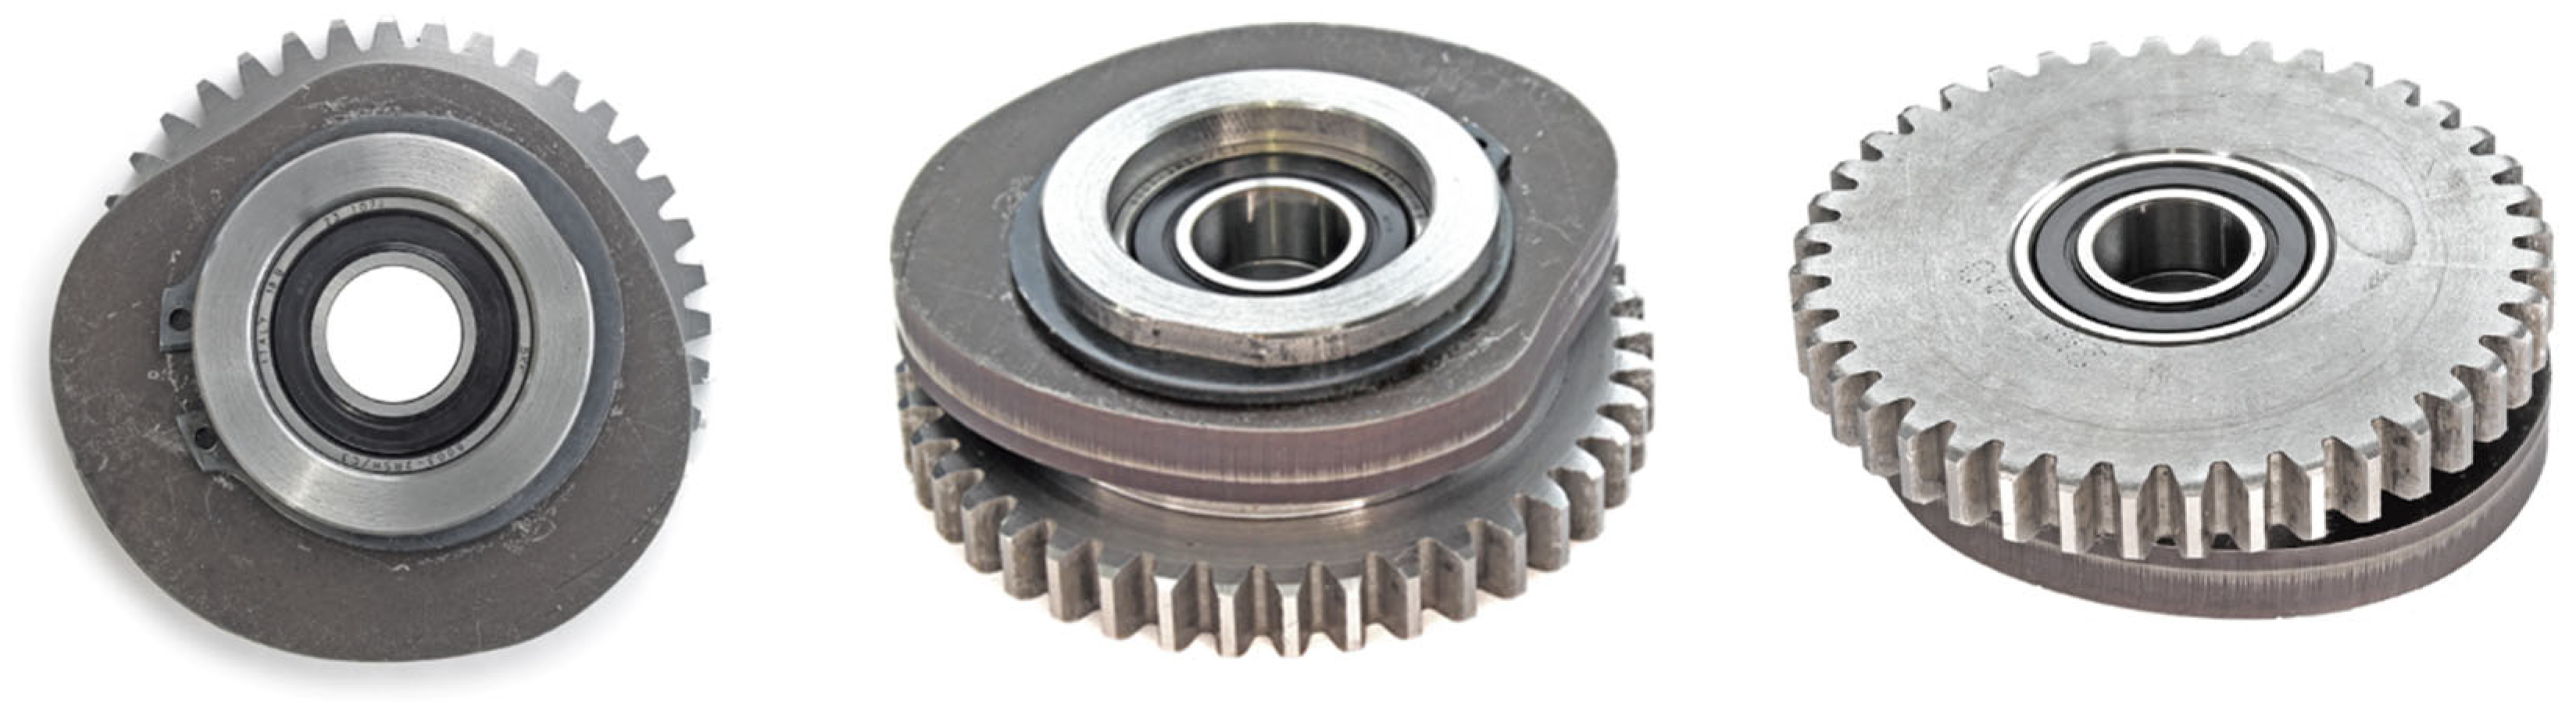
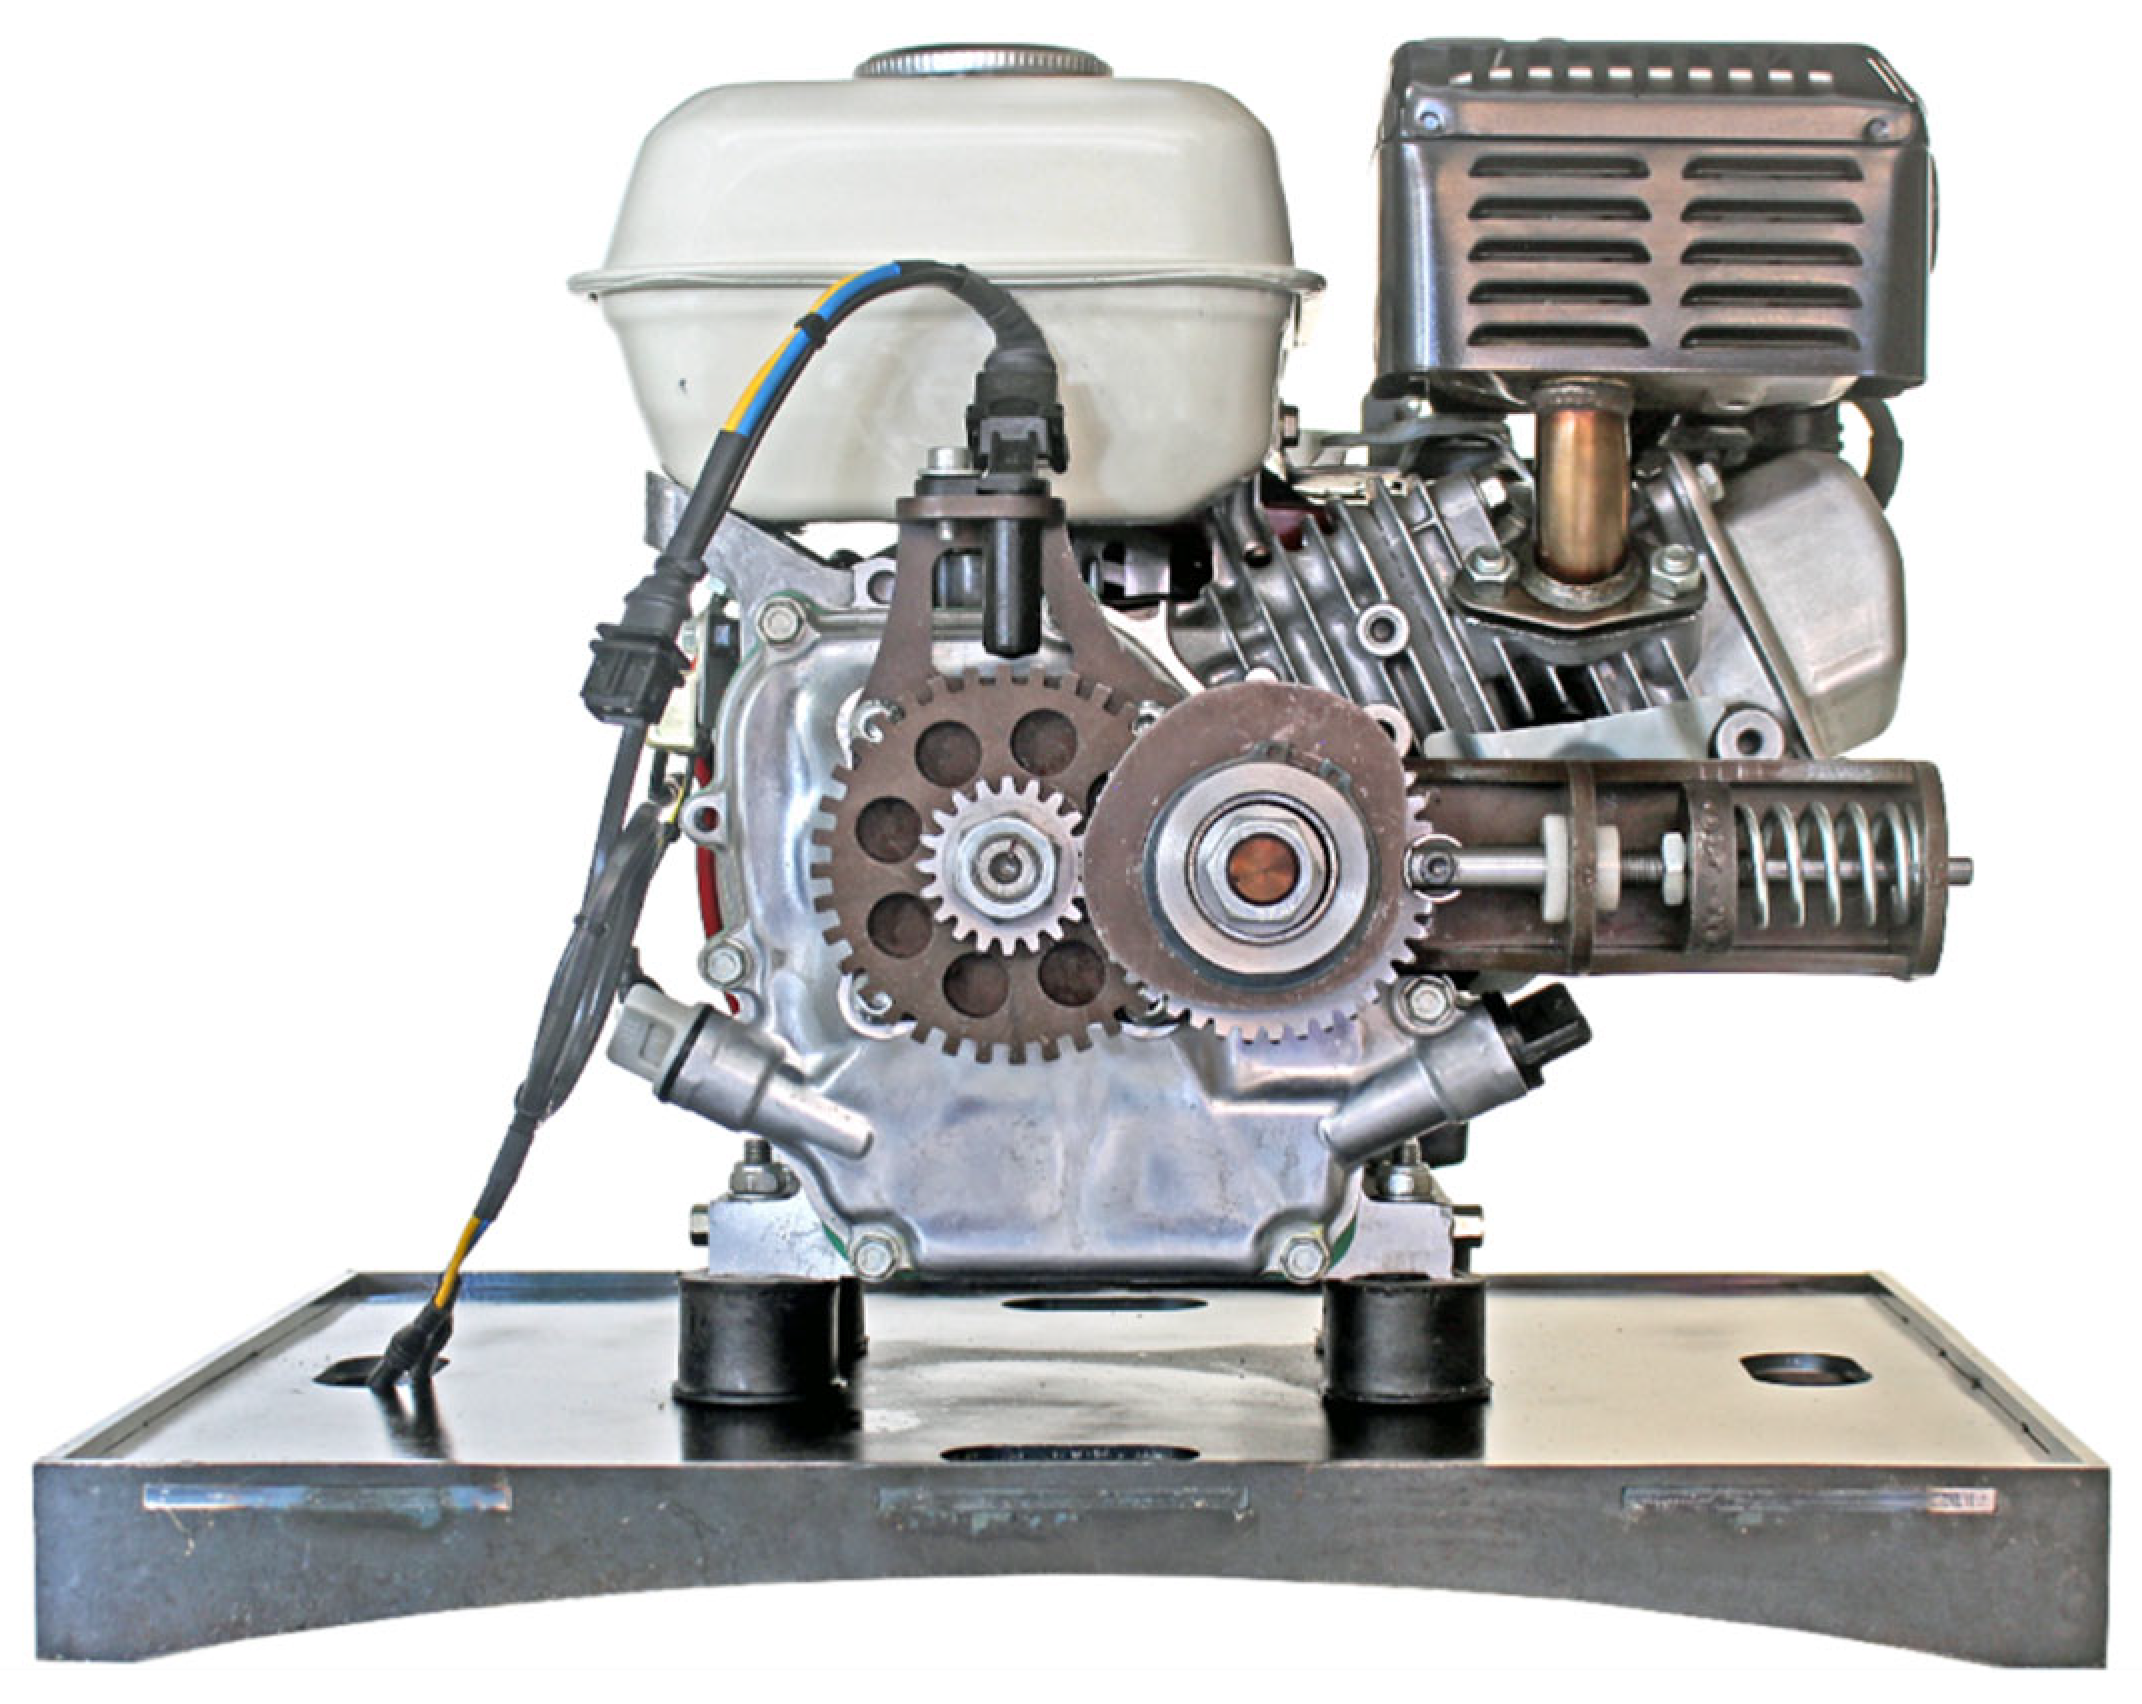
2.2.2. Mechanism Construction and Implementation

To implement the balancing cam mechanism on the Honda® GX 120 engine, a compact, modular support structure was designed for direct mounting at the crankshaft output. The layout was optimized to fit the characterized cam and spring system, ensuring easy installation and adjustment during testing. All parts were fabricated using laser-cut steel, except for the milled follower and commercially sourced spur gears.
To transmit motion from the crankshaft to the mechanism, two steel spur gears were used, creating a 2:1 transmission ratio. The gear mounted on the crankshaft output transmits motion to a larger gear carrying the cam. A custom-machined shaft was fabricated to support this gear, enabling rotation while allowing for independent preload adjustments on the spring-actuated follower.
To acquire real-time rotational data for synchronization and validation purposes, a 20-tooth gear that is mounted in the crankshaft was coupled with a trigger wheel to replicate the same acquisition method validated before. As shown in Figure 16, the trigger wheel is attached to the gear via a machined keyway and secured using a retaining ring.
One of the critical components in this assembly is the follower, presented in Figure 17. It is constructed around a 625-2RS bearing to ensure rolling contact with the cam profile. A threaded section allows the preload of the spring to be finely adjusted by rotating the follower shaft. This preload adjustment is essential for tuning the compensating force during operation. A nylon friction bushing, developed to reduce structural contact and wear, is mounted between the follower and the frame and held in place with a retaining ring.
The 40-tooth gear shown in Figure 18 houses the cam. Like the trigger wheel, the cam is mounted using a keyway and retained with a ring, allowing removal for testing alternative profiles. Two internal 6003-2RS bearings are embedded in the gear to allow smooth rotation along the support shaft, enabling reliable motion transmission between the engine and the balancing mechanism.
The full assembly is shown in Figure 19, which includes the 40-tooth gear with the cam, the 20-tooth gear with the trigger wheel, the spring-loaded follower, the VR sensor, and the supporting structure mounted to the Honda® GX 120 engine. The mechanism was assembled in a specific sequence: first, the mechanism mounting support, after the crankshaft gear and trigger wheel, then the cam gear and cam, followed by the follower and spring system. This order is necessary to avoid mechanical interference between components during installation.
To ensure proper synchronization with the engine cycle, the cam was positioned at its minimum radius—corresponding to the lowest torque phase of the engine—and the engine was rotated to the top dead center, at the end of the compression stroke. The gear on the crankshaft was then tightened, securing the tapered fit and aligning the entire mechanism with the engine’s phase. Finally, spring preload was applied by tightening the follower’s adjuster, and a locking nut was secured to prevent loosening during operation.

3. Results

The experimental tests were conducted with the same procedure as the initial tests, which were performed to validate the simulation and obtain the velocity variation profile that served as the basis for the cam design. The validation tests for assessing the mechanism’s effectiveness followed the same procedure used in the initial tests. Specifically, 10 measurements were taken for each experiment, and the average of these measurements was calculated to minimize laboratory errors and account for possible operational variations in the engine.
Four distinct groups of tests were performed to evaluate the engine’s behavior when operating with the balancing mechanism. The first group of tests was conducted without the followers in contact with the cam. The second group of tests involved the follower acting on the cam, with the spring preload adjusted to the value for which the cam was designed. Subsequently, additional groups of tests were performed with an increment and a decrement in preload variations to assess the mechanism’s response to changes in spring preload and try to understand if a higher preload resulted in compensation for the torque delivered by the mechanism.

3.1. Mechanism Inertia Determination

To evaluate the influence of the mechanism’s inertia on the velocity variation of the engine, experimental tests were conducted with the mechanism mounted on the engine. However, to ensure no external forces were exerted on the system, the follower was positioned such that it did not come into contact with the cam during these tests.
Figure 20 illustrates the results obtained from tests performed under these specific conditions.
Due to the mechanism’s added rotational inertia, there is a small improvement in velocity variation, as seen in Figure 21. Although this improvement is minimal, to isolate only the results associated with the mechanism’s operation and not the inertia it generates, all results from this point forward will be compared against the velocity obtained when the mechanism’s inertia is considered, rather than the initially measured velocity variation.
In an analytical analysis of the results presented in Figure 21, the standard deviation from the stock velocity profile is 3.74 rad/s, and the added rotational inertia torque profile has a standard deviation of 3.58 rad/s.

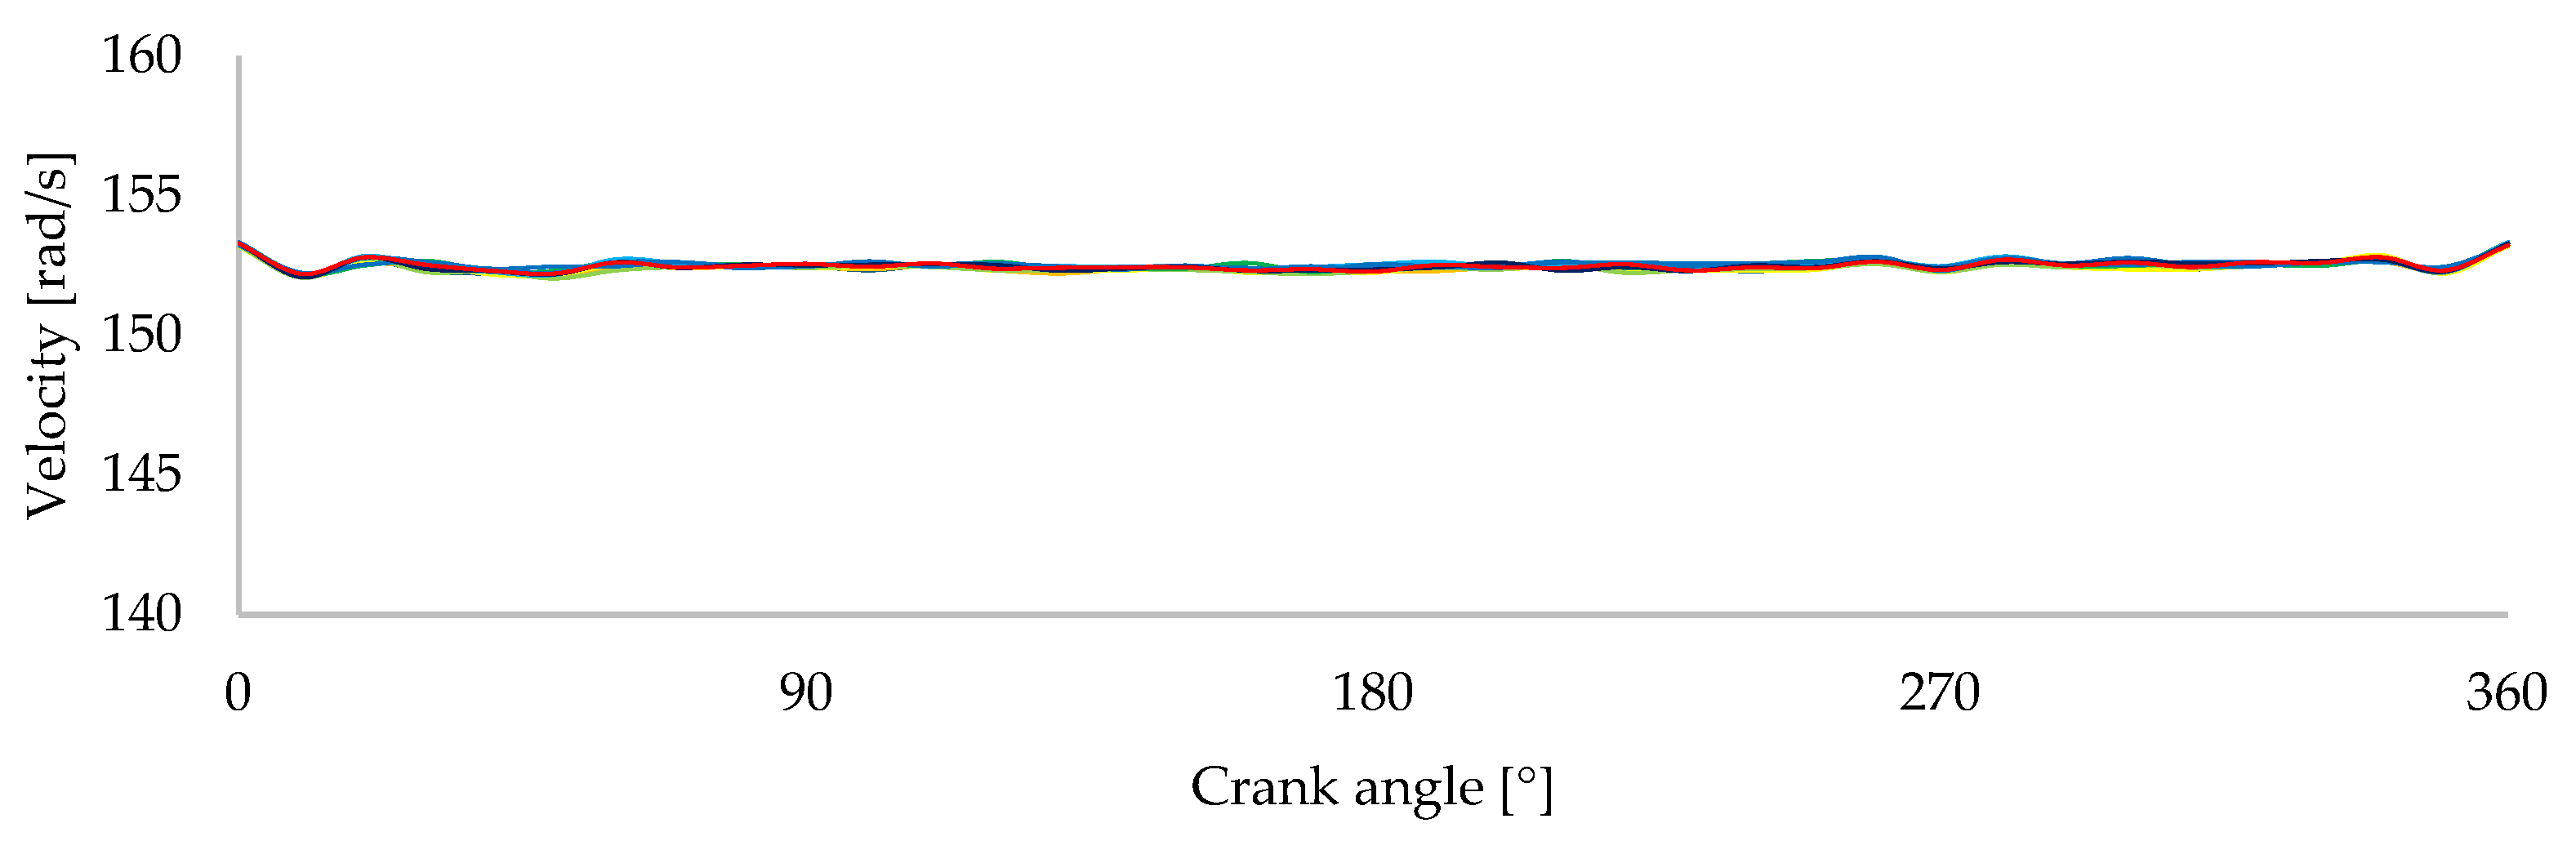
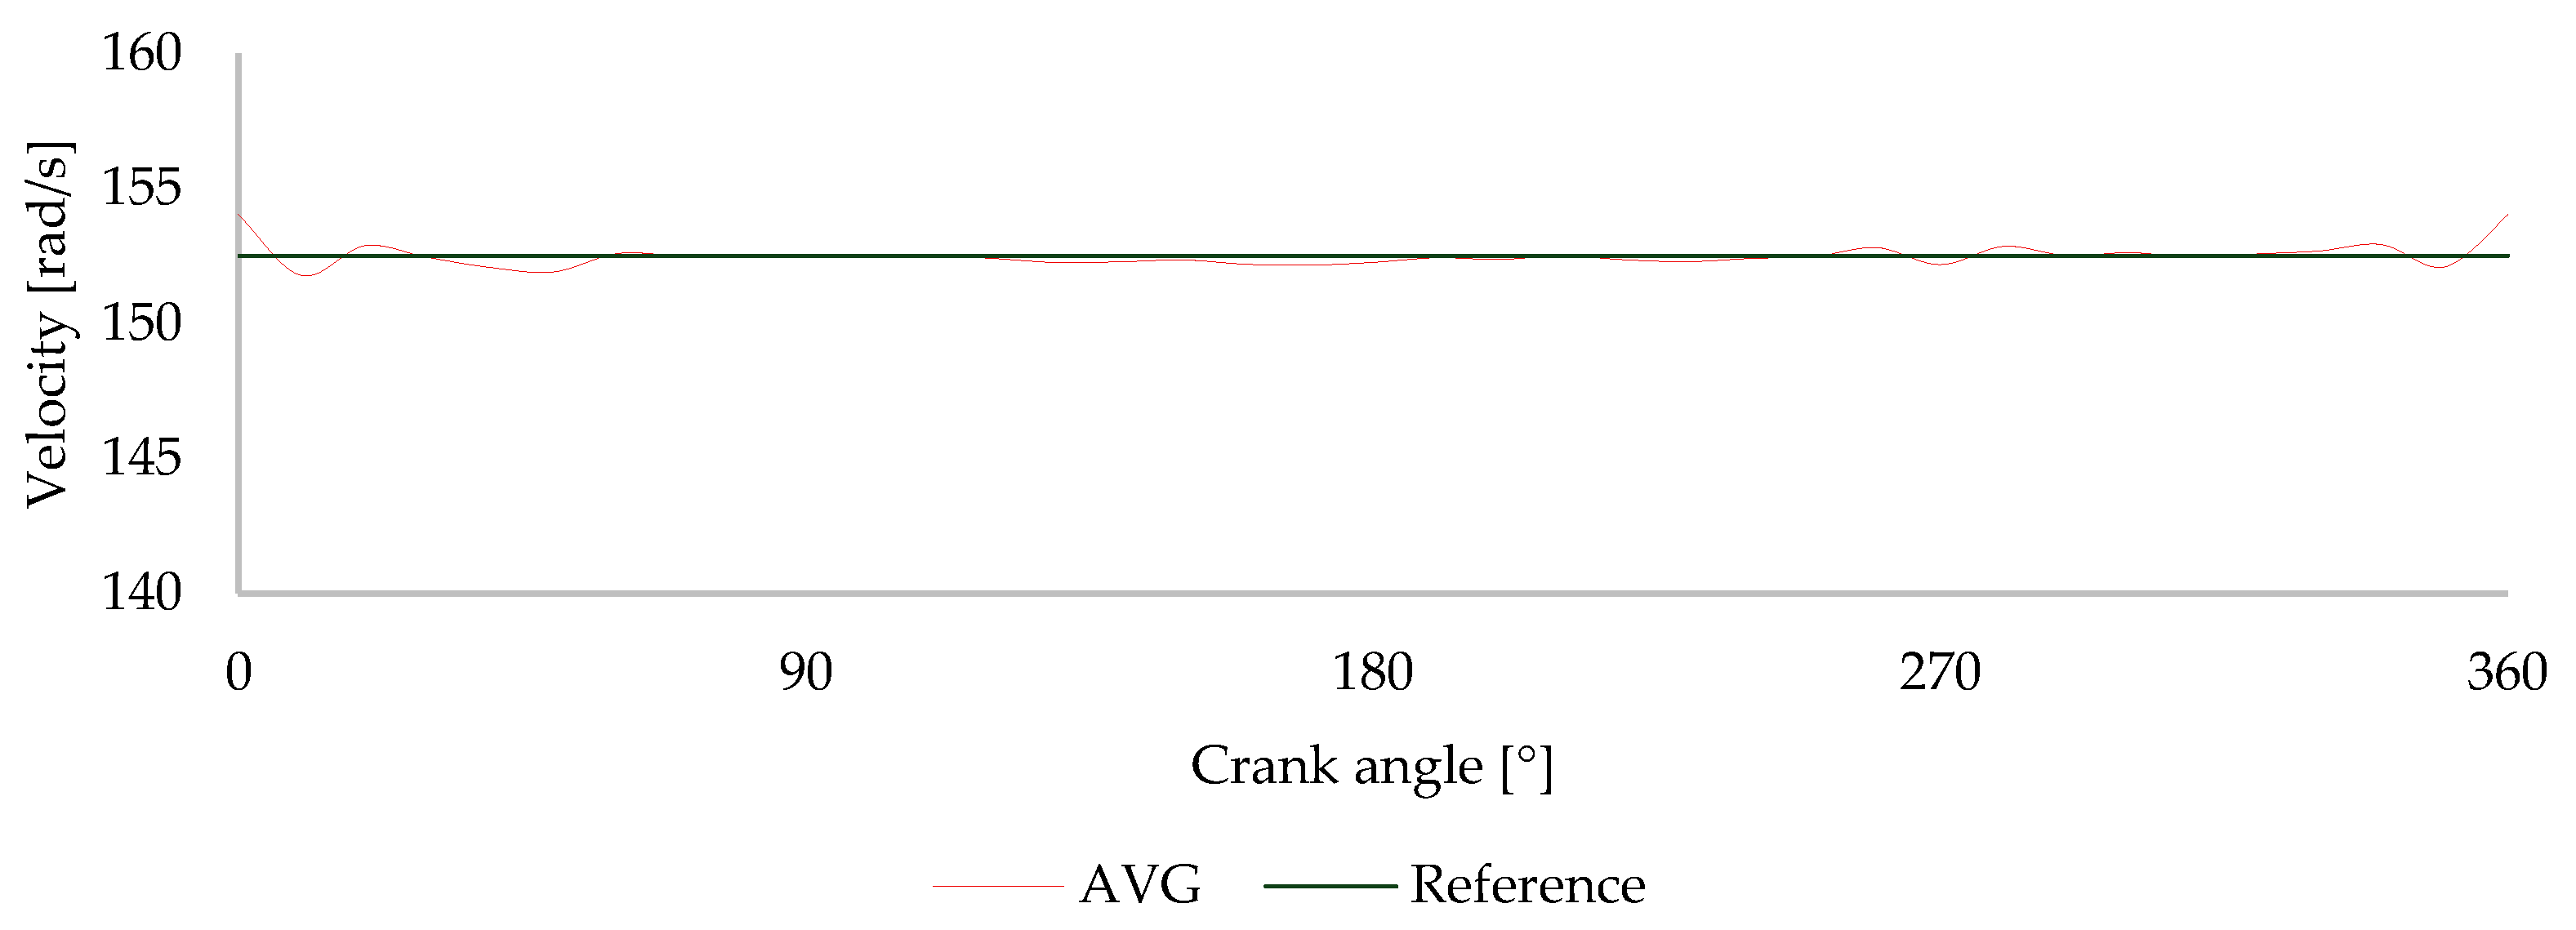
3.2. Mechanism Experimental Results

After evaluating the influence of the mechanism’s inertia on engine behavior, tests were conducted to assess how its actuation affects the engine’s angular velocity variation. In this stage, the mechanism was operated under standard conditions, with the spring preload set to 242 N, the value originally defined during the cam profile design process to ensure optimal energy storage and release. This test aimed to verify whether the torque delivered by the mechanism effectively compensates for the fluctuations observed in the stock engine configuration. As in earlier procedures, 10 repeated measurements were performed to ensure repeatability and reliability of the results. The recorded velocity profiles obtained under these conditions are presented in Figure 22.
The repeated profiles demonstrate consistency between tests, confirming the reproducibility of the system’s dynamic behavior under these conditions. This repeatability indicates that the mechanism operates reliably without introducing uncontrolled variability into the engine’s response. To better interpret the impact of the mechanism’s actuation, the average velocity profile obtained from these tests is compared in Figure 23 with the profile presented in Figure 21, when the mechanism was installed but not actively engaged. This comparison allows for isolating the torque compensation effect from the influence of the mechanism’s inertia.
The graph in Figure 23 shows that introducing the mechanism significantly reduces the amplitude of velocity fluctuations throughout the engine cycle. From 0° to 360°, the velocity profile with the cam mechanism exhibits a smoother decrease compared to the profile without active mechanism actuation, particularly during the intake and compression strokes, due to the torque the mechanism delivers to the crankshaft. At 360°, corresponding to the power stroke, the velocity peak is less pronounced when the cam is engaged, indicating a damping effect introduced by the mechanism. Between 360° and 720°, the profile with the mechanism maintains a more stable pattern, whereas the profile without cam action exhibits greater fluctuations during the exhaust and subsequent intake strokes.
These results demonstrate that the mechanism effectively induces torque on the crankshaft and stabilizes velocity variation not due to the small additional inertia it introduces but through the torque actively produced by storing and releasing energy via the spring–cam system. The velocity variation profiles’ standard deviation and amplitude were calculated to support this analysis quantitatively. The amplitude represents the difference between the minimum velocity, typically registered at the end of the compression stroke, and the maximum velocity, which occurs near the end of the combustion. The stock configuration, without any compensation, exhibits a standard deviation of 3.58 rad/s and an amplitude of 11.08 rad/s. When the mechanism is engaged, these values are reduced to 2.07 rad/s and 6.30 rad/s.
To explore the influence of preload adjustment, additional tests were conducted with the spring set to 121 N and 363 N values below and above the designed initial preload of 242 N. These tests assessed how deviations from the optimal preload affect the mechanism’s ability to stabilize crankshaft velocity.
Figure 24 compares the velocity variation profiles for the three preload conditions against the stock engine configuration, in which the balancing mechanism was not engaged.
The results clearly show that introducing the mechanism reduces velocity fluctuations, though the spring preload directly influences the degree of improvement. The 121 N and 242 N conditions yield substantial improvements over the uncorrected case, particularly during the intake and compression strokes. Although 242 N was the preload used for cam design, its advantage over 121 N is slight, becoming more noticeable during the compression stroke and in the recovery following the combustion phase.
Conversely, applying a preload of 363 N degrades the performance. The excessive spring force introduces greater mechanical resistance, limiting the mechanism’s responsiveness and leading to increased velocity fluctuations compared to the 121 N and 242 N cases. These results indicate that deviations from the designed 242 N preload, whether lower or higher, result in suboptimal stabilization. At 121 N, the reduced energy stored in the spring limits the torque available for compensation. At 363 N, the preload becomes excessive, introducing unwanted resistance and friction that disrupts the force delivery intended by the cam design.
The standard deviation and amplitude of the velocity variation profiles were calculated to support this analysis. The stock engine presents a standard deviation of 3.58 rad/s and an amplitude of 11.08 rad/s. When the mechanism is engaged, these values drop to 2.08 rad/s and 6.72 rad/s at 121 N, 2.07 rad/s and 6.30 rad/s at 242 N, and 2.35 rad/s and 7.45 rad/s at 363 N. The 242 N preload achieves the lowest values in both metrics, validating it as the most effective setting for minimizing velocity fluctuations.
The influence of preload P on the torque output of the mechanism is explained by its effect on the spring force F s , as shown in Equation (4). When the cam radius variation ( r c a m r b a s e ) is slight, such as in the intake and compression strokes, F s is mainly determined by the preload P . In these phases, preload has a dominant role in generating the torque. In contrast, during high-torque phases like the expansion stroke, the spring stiffness term k ( r c a m r b a s e ) becomes more influential, and the impact of preload becomes secondary. This explains why excessive preload can cause overcompensation or increased resistance in already dynamic regions, while lower preload may limit correction in flatter cam profile segments.
Figure 25 illustrates that friction torque increases significantly with higher preload, especially at 363 N, where follower displacement and contact forces are most pronounced during the expansion phase. This frictional loss is directly tied to the increase in tangential force F t , which grows with the total spring force F s . According to Equations (11)–(14), this leads to higher support reaction forces and increased friction at points A and B from the mechanism, dissipating part of the energy stored in the spring. As a result, the torque delivered by the mechanism is reduced, particularly in regions where precise compensation is needed. This limits the effectiveness of the correction and directly affects the velocity variation from the engine.
While the 242 N preload shows moderate friction with good torque delivery, confirming it as the best balance between compensation and losses, the 121 N preload benefits from reduced internal friction despite its lower energy storage. This helps explain the relatively strong performance of the 121 N configuration.

3.3. Mechanism Performance Evaluation and Results Discussion

To evaluate the balancing mechanism’s effectiveness, Figure 26 compares the velocity variation simulated for the engine with the mechanism with the corresponding experimentally measured profile. This analysis aims to verify how closely experimental behavior replicates the predicted engine dynamics under the same operating conditions.
The curves show that both profiles follow a similar overall trend throughout the engine cycle. In the intake and compression strokes and during the expansion and exhaust phases, the simulated and experimental velocity variations exhibit consistent phase alignment. However, the experimental profile presents slightly more pronounced fluctuations in specific regions, which can be attributed to minor mechanical imperfections, sensor resolution limits, and assembly tolerances not accounted for in the simulation.
Quantitatively, the standard deviation of the simulated velocity variation is 1.56 rad/s, while the experimental result is slightly higher at 2.07 rad/s. Regarding amplitude, the simulated value reaches 5.54 rad/s, compared to the 6.30 rad/s obtained experimentally. Nevertheless, the overall consistency in the trend and magnitude of the profiles confirms that the simulation provides a reliable prediction of the engine’s dynamic behavior when the mechanism is engaged.
Figure 27 compares the experimental torque corrected with the simulated torque profile. Although the experimental curve shows slightly higher peaks and minor discrepancies in certain phases, the general shape remains consistent. The experimental standard deviation is 3.12 Nm, while the simulated profile shows a slightly lower value of 2.75 Nm. Similarly, the amplitude is 13.66 Nm for the experimental data and 12.68 Nm for the simulated result. These differences from the simulated to the experimental results may be attributed to factors such as assembly misalignments, slight variations in spring characteristics, or non-ideal contact behavior between components, effects that, although the model includes friction and inertia, are difficult to characterize precisely in simulation. Associated errors from data acquisition, manufacturing tolerances, and dynamic variability in real engine operation also contribute to slight divergence between predicted and measured performance.
Figure 28 presents and summarizes a direct comparison between the average velocity variation profile obtained with the balancing mechanism engaged and the profile recorded with the mechanism disengaged. This visualization complements the quantitative analysis provided earlier and offers a clearer understanding of the system’s behavior throughout the engine cycle.
The graph shows that the mechanism effectively reduces velocity fluctuations across all 720° of the cycle. The corrected velocity profile consistently remains closer to the average, except around 90° during the intake phase, where deviations are less pronounced. This is likely because, at that point, the velocity is already near the average and requires minimal correction. In contrast, a more significant correction is observed during the compression phase, and the peak during the expansion stroke is notably reduced. These regions coincide with phases where the mechanism delivers more torque, aligning with the engine’s greater need for compensation.
Figure 29 presents the torque profiles with and without mechanism actuation and the average torque.
The graph shows a significant reduction in amplitude compared to the uncorrected profile, especially during the expansion stroke, where the peak torque is notably dampened. Quantitatively, the standard deviation decreases from 6.25 Nm to 3.12 Nm, and the amplitude is reduced from 29.79 Nm to 13.66 Nm, indicating improved regularity and smoother torque delivery.

4. Conclusions

Benefits, Performance Insights, and Future Developments

The experimental and simulation results confirm that the proposed passive balancing cam mechanism effectively reduces torque and speed fluctuations in a single-cylinder engine, particularly under idle conditions. Operating without electronic control or additional system complexity, the mechanism passively compensates for cyclic torque variations by storing and releasing energy through a spring-loaded follower synchronized with the crankshaft rotation.
When engaged, the mechanism achieved the lowest standard deviations and amplitudes in velocity and torque profiles, indicating improved rotational smoothness. These results highlight the importance of properly tuning the spring preload to match the cam geometry.
Beyond performance improvements, the system also offers practical advantages. Its compact and mechanically simple design requires no structural modification to the engine, making it well suited for small-scale power units such as those used in hybrid powertrains or portable generators. The modular construction facilitates integration into various platforms with minimal adaptation, supporting applications in environments where weight, space, and efficiency are critical.
While the results confirm the mechanism’s effectiveness in reducing rotational instability, they also highlight its sensitivity to preload selection and the importance of matching mechanical behavior to the engine’s operating characteristics. The preload directly influences the magnitude and timing of the compensatory torque, and, as observed, deviations from the design value result in suboptimal performance.
This work also contributes to developing new technologies by addressing some of the challenges associated with engine downsizing, new architectures, skip-cycle strategies, cylinder deactivation, and emerging cycles such as the eight-stroke engine—all of which present difficulties related to instantaneous torque variation.
Furthermore, although the mechanism is passive and does not rely on external control, its performance is inherently limited by the mechanical constraints imposed during design. The smoothing process applied to the torque profile, necessary for cam feasibility, reduces the system’s responsiveness to rapid transitions. Additionally, friction and follower inertia, particularly under high preload conditions, introduce losses that affect compensation efficiency.
Future work may focus on improving the cam design through higher-resolution torque data and selective filtering techniques that preserve critical features while avoiding mechanical infeasibility. Exploring materials and bearing systems that reduce friction at support points could mitigate energy losses. Another potential direction involves introducing limited adjustability, allowing minor preload corrections during operation or between engine cycles to better accommodate varying operating conditions.
Finally, integrating this mechanism into other engine architectures or multi-cylinder configurations remains to be explored. While the current study focuses on a single-cylinder platform due to its high torque irregularity, the concept could be adapted for broader applications where passive torque smoothing is desirable.

5. Patents

This and subsequent works resulted in a patent application submitted to the Portuguese Institute of Industrial Property (INPI) under application number 119346, with the title “Método Implementado por Computador para a Conceção de um Atuador de Equilíbrio para um Motor, Atuador de Equilíbrio, Programa de Computador e Meio de Leitura Associados.”

Author Contributions

Conceptualization, D.S.C. and P.O.F.; methodology, D.S.C. and P.O.F.; software, D.S.C. and P.O.F.; validation, P.O.F., P.D.G. and A.E.-S.; formal analysis, P.O.F., P.D.G. and A.E.-S.; investigation, D.S.C. and P.O.F.; data curation, P.O.F.; writing—original draft preparation, D.S.C., P.O.F. and P.D.G.; writing—review and editing, D.S.C., P.O.F. and P.D.G.; supervision, P.O.F., P.D.G. and A.E.-S. All authors have read and agreed to the published version of the manuscript.

Funding

This research was funded in part by the Fundação para a Ciência e Tecnologia (FCT) and C-MAST (Centre for Mechanical and Aerospace Science and Technologies) for their support in the form of funding, under the project UIDB/00151/2020 (https://doi.org/10.54499/UIDB/00151/2020, accessed on 2 April 2025).

Data Availability Statement

The original contributions presented in the study are included in the article, further inquiries can be directed to the corresponding author.

Conflicts of Interest

The authors declare no conflicts of interest.

References

  1. Solmaz, H.; Karabulut, H. A mathematical model to investigate the effects of misfire and cyclic variations on crankshaft speed fluctuations in internal combustion engines. J. Mech. Sci. Technol. 2015, 29, 1493–1500. [Google Scholar] [CrossRef]
  2. Babagiray, M.; Solmaz, H.; İpci, D.; Aksoy, F. Modeling and validation of crankshaft speed fluctuations of a single-cylinder four-stroke diesel engine. Proc. Inst. Mech. Eng. Part D J. Automob. Eng. 2022, 236, 553–568. [Google Scholar] [CrossRef]
  3. Cardoso, D.S.; Fael, P.O.; Espírito-Santo, A. Instantaneous angular velocity and torque on Otto single-cylinder engine: A theoretical and experimental analysis. Energy Rep. 2020, 6, 43–48. [Google Scholar] [CrossRef]
  4. Filipi, Z.S.; Assanis, D.N. A nonlinear, transient, single-cylinder diesel engine simulation for predictions of instantaneous engine speed and torque. J. Eng. Gas Turbines Power 2001, 123, 951–959. [Google Scholar] [CrossRef]
  5. Antonopoulos, A.K.; Hountalas, D.T. Effect of instantaneous rotational speed on the analysis of measured diesel engine cylinder pressure data. Energy Convers. Manag. 2012, 60, 87–95. [Google Scholar] [CrossRef]
  6. Munde, K.H.; Mehtre, V.K.; Ware, D.S.; Kamble, D.P. Review on performance of dual mass flywheel over conventional flywheel. Math. Stat. Eng. Appl. 2022, 71, 496–505. [Google Scholar] [CrossRef]
  7. Dawange, S.V.; Kadlag, V.L. A review paper on vibration analysis of DI engine. Int. J. Sci. Res. 2015, 4, 759–761. [Google Scholar]
  8. Cardoso, D.S.; Nunes, D.; Faria, J.; Fael, P.O.; Gaspar, P.D. Intelligent micro-cogeneration systems for residential grids: A sustainable solution for efficient energy management. Energies 2023, 16, 5215. [Google Scholar] [CrossRef]
  9. Mittal, V.; Shah, R.; Przyborowski, A. Analyzing the usage of Wankel engine technology in future automotive powertrains. SAE Int. J. Sustain. Transp. 2023, 5, 115–127. [Google Scholar] [CrossRef]
  10. Schaper, U.; Sawodny, O.; Mahl, T.; Blessing, U. Modeling and torque estimation of an automotive dual mass flywheel. In Proceedings of the 2009 American Control Conference, St. Louis, MO, USA, 10–12 June 2009; pp. 1207–1212. [Google Scholar] [CrossRef]
  11. Ayana, E.; Plahn, P.; Wejrzanowski, K.; Mohan, N. Active torque cancellation for transmitted vibration reduction. IEEE Trans. Veh. Technol. 2011, 60, 2971–2977. [Google Scholar] [CrossRef]
  12. Anjum, R.; Yar, A.; Ahmed, Q.; Bhatti, A. Model-based unified framework for detection and mitigation of cyclic torque imbalance. J. Eng. Gas Turbines Power 2021, 143, 051010. [Google Scholar] [CrossRef]
  13. Zhang, X.; Liu, H.; Zhan, Z.; Wu, Y.; Zhang, W.; Taha, M.; Yan, P. Modelling and active damping of engine torque ripple. Control Eng. Pract. 2020, 104, 104634. [Google Scholar] [CrossRef]
  14. Galvagno, E.; Velardocchia, M.; Vigliani, A.; Tota, A. Experimental Analysis and Model Validation of a Dual Mass Flywheel; SAE Technical Paper; SAE International: Warrendale, PA, USA, 2015. [Google Scholar] [CrossRef]
  15. Hässler, M.; Fieback, T.; Rabe, M.; Ryll, M. Clutch Disc with Centrifugal Pendulum Absorber. ATZ Worldw. 2016, 118, 42–47. [Google Scholar] [CrossRef]
  16. Li, Q.; Zhang, T. Study on Vibration Damping Characteristics of Centrifugal Pendulum Double Mass Flywheel. DEStech Trans. Comput. Sci. Eng. 2018. [Google Scholar] [CrossRef]
  17. Pfabe, M.; Woernle, C. Reducing torsional vibrations by means of a kinematically driven flywheel—Theory and experiment. Mech. Mach. Theory 2016, 102, 217–228. [Google Scholar] [CrossRef]
  18. Zhang, Y.; Zhang, X.; Qian, T.; Hu, R. Modeling and simulation of a passive variable inertia flywheel. Energy Rep. 2020, 6, 58–68. [Google Scholar] [CrossRef]
  19. Arakelian, V.V.; Briot, S. Simultaneous inertia force/moment balancing and torque compensation. Mech. Res. Commun. 2010, 37, 265–269. [Google Scholar] [CrossRef]
  20. Lin, D.Y.; Hou, B.J.; Lan, C.C. A balancing cam mechanism for minimizing the torque fluctuation of engine camshafts. Mech. Mach. Theory 2017, 108, 160–175. [Google Scholar] [CrossRef]
  21. Cardoso, D.S.; Fael, P.O.; Gaspar, P.D.; Espírito-Santo, A. An innovative mechanical approach to mitigating torque fluctuations in IC engines during idle operation. Designs 2024, 8, 47. [Google Scholar] [CrossRef]
  22. Kim, G.W.; Shin, S.C. Torque transmissibility of the passive torsional vibration isolator. Proc. Inst. Mech. Eng. Part D J. Automob. Eng. 2015, 229, 1840–1847. [Google Scholar] [CrossRef]
  23. Society, I.E.E.V.T. Active torque ripple damping in direct drive range extender applications. In Proceedings of the 2015 IEEE Vehicle Power and Propulsion Conference (VPPC), Montreal, QC, Canada, 19–22 October 2015. [Google Scholar] [CrossRef]
  24. Jianguo, B.; Xudong, L.; Ming, Z.; Kaixiong, L. Design and optimization of flywheel motor based on torque density. In Proceedings of the 2018 IEEE 3rd Advanced Information Technology, Electronic and Automation Control Conference (IAEAC), Chongqing, China, 12–14 October 2018; pp. 2156–2162. [Google Scholar] [CrossRef]
  25. Fraser, N.; Blaxill, H.; Lumsden, G.; Bassett, M. Challenges for increased efficiency through gasoline engine downsizing. SAE Int. J. Engines 2009, 2, 991–1008. [Google Scholar] [CrossRef]
  26. Hannan, M.A.; Azidin, F.A.; Mohamed, A. Hybrid electric vehicles and their challenges: A review. Renew. Sustain. Energy Rev. 2014, 29, 135–150. [Google Scholar] [CrossRef]
  27. Cardoso, D.S.; Fael, P.O.; Espírito-Santo, A. A review of micro and mild hybrid systems. Energy Rep. 2020, 6, 385–390. [Google Scholar] [CrossRef]
  28. Mastrangelo, G.; Micelli, D.; Sacco, D. Extreme downsizing by the two-cylinder gasoline engine from Fiat. ATZautotechnology 2011, 11, 18–25. [Google Scholar] [CrossRef]
  29. Omanovic, A.; Zsiga, N.; Soltic, P.; Onder, C. Increased ICE efficiency with optimized valve timings. Energies 2021, 14, 2750. [Google Scholar] [CrossRef]
  30. Bech, A.; Shayler, P.J.; McGhee, M. Effects of cylinder deactivation on three cylinder engines. SAE Int. J. Engines 2016, 9, 1999–2009. [Google Scholar] [CrossRef]
  31. Blair, J.G. Design and Simulation of Four-Stroke Engines; SAE International: Warrendale, PA, USA, 1999; ISBN 978-0-7680-0440-3. [Google Scholar]
  32. Porumb, I.; Marian, R.; Doğançay, K.; Chahl, J.S. Robust instant angle speed measurement for internal combustion engines—A novel sensing suite and methodology. Sensors 2022, 22, 754. [Google Scholar] [CrossRef]
  33. Addabbo, T.; Di Marco, M.; Fort, A.; Landi, E.; Mugnaini, M.; Vignoli, V.; Ferretti, G. Instantaneous rotation speed measurement system based on variable reluctance sensors for torsional vibration monitoring. IEEE Trans. Instrum. Meas. 2019, 68, 2363–2373. [Google Scholar] [CrossRef]
  34. Costello, J.J.; Pickard, A.C. A novel speed measurement system for turbomachinery. IEEE Sens. Lett. 2018, 2, 1–4. [Google Scholar] [CrossRef]
  35. Zhang, P.; Gao, W.; Song, Q.; Li, Y.; Wei, L.; Wei, Z. Real-time angular velocity-based misfire detection using artificial neural networks. J. Eng. Gas Turbines Power 2019, 141, 061008. [Google Scholar] [CrossRef]
  36. Wang, X.; Zhang, P.; Gao, W.; Li, Y.; Wang, Y.; Pang, H. Misfire detection using crank speed and long short-term memory recurrent neural network. Energies 2022, 15, 300. [Google Scholar] [CrossRef]
  37. Savaripour, H.; Rosen, M.A. Comparison of simulation and experimental test results of the turbocharger temperature for two gasoline direct injection engines. Proc. Inst. Mech. Eng. Part E J. Process Mech. Eng. 2022, 237, 1–11. [Google Scholar] [CrossRef]
  38. Akbarian, E.; Najafi, B.; Jafari, M.; Ardabili, S.F.; Shamshirband, S.; Chau, K.W. Experimental and computational fluid dynamics-based numerical simulation of using natural gas in a dual-fueled diesel engine. Eng. Appl. Comput. Fluid Mech. 2018, 12, 517–534. [Google Scholar] [CrossRef]
  39. Kiss, A.; Szabó, B.; Kun, K.; Weltsch, Z. Prediction of efficiency, performance, and emissions based on a validated simulation model in hydrogen–gasoline dual-fuel internal combustion engines. Energies 2024, 17, 5680. [Google Scholar] [CrossRef]
  40. Ali, S.A.; Saraswati, S. Cycle-by-cycle estimation of cylinder pressure and indicated torque waveform using crankshaft speed fluctuations. Trans. Inst. Meas. Control 2015, 37, 813–825. [Google Scholar] [CrossRef]
  41. Li, Z.; Guo, Z.; Hu, C.; Li, A. On-line indicated torque estimation for internal combustion engines using discrete observer. Comput. Electr. Eng. 2017, 60, 100–115. [Google Scholar] [CrossRef]
  42. Tong, Q.; Xie, H.; Song, K.; Zou, D. A control-oriented engine torque online estimation approach for gasoline engines based on in-cycle crankshaft speed dynamics. Energies 2019, 12, 4683. [Google Scholar] [CrossRef]
  43. Uicker, J.J., Jr.; Pennock, G.R.; Shigley, J.E. Theory of Machines and Mechanisms, 5th ed.; Oxford University Press: New York, NY, USA, 2016. [Google Scholar]
  44. Budynas, R.G.; Nisbett, J.K. Shigley’s Mechanical Engineering Design, 9th ed.; McGraw-Hill: New York, NY, USA, 2010. [Google Scholar]
Figure 1. Simulated instantaneous torque and angular velocity variation of the Honda® GX 120 engine over one full cycle.
Energies 18 03256 g001
Figure 2. Components of the data acquisition and validation system. (a) The Keysight® EDUX1052A digital oscilloscope is used to capture the VR sensor signal. (b) Electric motor-driven test rig used for preliminary validation of the measurement system. (c) Custom fixture with a 36-tooth trigger wheel and variable reluctance sensor mounted for crankshaft speed measurement in the engine.
Energies 18 03256 g002
Figure 3. Velocity variation recorded by the VR sensor across 10 repeated tests using the electric motor validation setup.
Energies 18 03256 g003
Figure 4. Comparison between the average from 10 experimental tests (red) and the reference constant speed (black).
Energies 18 03256 g004
Figure 5. Sinusoidal voltage signal recorded during rotation of the toothed wheel on the validation rig.
Energies 18 03256 g005
Figure 6. Velocity variation profiles across 10 tests conducted in the Honda® GX 120 engine.
Energies 18 03256 g006
Figure 7. Average from velocity profiles across 10 tests conducted in the Honda® GX 120 engine.
Energies 18 03256 g007
Figure 8. Comparison between simulated and measured velocity variation in the Honda® GX 120 engine at 1500 RPM. The green line represents the simulated velocity variation, while the black line shows the experimentally measured velocity variation.
Energies 18 03256 g008
Figure 9. Comparison between the simulated and experimental instantaneous torque profiles for the Honda® GX 120 engine at 1500 RPM.
Energies 18 03256 g009
Figure 10. Diagram of the mechanism used to derive the equations necessary to design the balancing cam that mimics the desired torque profile.
Energies 18 03256 g010
Figure 11. Comparison between experimental instantaneous torque profiles for the Honda® GX 120 engine at 1500 RPM and the same torque profile smoothed by applying a moving average of 12 values. The orange line represents the original torque curve, while the purple line shows the smoothed curve.
Energies 18 03256 g011
Figure 12. Cam profiles for the balancing mechanism with flat and roller followers.
Energies 18 03256 g012
Figure 13. Mechanical model used to analyze support reactions and friction caused by the tangential force Ft.
Energies 18 03256 g013
Figure 14. Torque delivered by the balancing mechanism, including the mechanism’s devolved torque without friction and inertia from the follower, the torque considering support friction, the torque from inertia, the isolated friction torque, and the inertia torque.
Energies 18 03256 g014
Figure 15. Torque delivered by the balancing mechanism and resulting compensated torque compared to the measured torque profile of the Honda® GX 120.
Energies 18 03256 g015
Figure 16. Gear with 20 teeth and the attached trigger wheel.
Energies 18 03256 g016
Figure 17. Roller follower with adjustable preload spring, featuring a 625 RS bearing and a nylon friction bushing.
Energies 18 03256 g017
Figure 18. Gear with 40 teeth with the mounted cam, featuring a keyway and retaining ring, along with two internal bearings to mount on the mechanism structure shaft.
Energies 18 03256 g018
Figure 19. Fully assembled mechanism mounted on the Honda® GX 120 engine, including the 40-tooth gear with mounted cam, 20-tooth gear with trigger wheel, follower, and VR sensor.
Energies 18 03256 g019
Figure 20. Velocity variation profiles from 10 tests recorded with a VR sensor on a Honda® GX 120 engine. The mechanism was mounted on the engine, and the follower was disengaged from the cam to isolate the system’s inherent inertia.
Energies 18 03256 g020
Figure 21. Velocity variation as a function of the crank angle, comparing results obtained with and without the mechanism’s inertia.
Energies 18 03256 g021
Figure 22. Velocity variation as a function of the crank angle for 10 tests performed with the mechanism operating.
Energies 18 03256 g022
Figure 23. Comparison between the average velocity variation obtained with a 242 N preload and the profile recorded without the mechanism in operation, and the average velocity.
Energies 18 03256 g023
Figure 24. Comparison of velocity variation for different spring preloads (121 N, 242 N, and 363 N) with the stock velocity variation.
Energies 18 03256 g024
Figure 25. Friction torque generated by the mechanism under preload values of 121 N, 242 N, and 363 N.
Energies 18 03256 g025
Figure 26. Comparison between the simulated velocity variation for the engine with mechanism actuation and the experimental results obtained.
Energies 18 03256 g026
Figure 27. Comparison between the simulated engine torque for the engine with mechanism actuation and the experimental results obtained.
Energies 18 03256 g027
Figure 28. Comparison between average velocity, the velocity variation with the balancing mechanism engaged, and the velocity without mechanism actuation.
Energies 18 03256 g028
Figure 29. Comparison between average torque, the torque with the balancing mechanism engaged, and the torque without mechanism actuation.
Energies 18 03256 g029
Table 1. Balancing mechanism design parameters.
CamSpring
r b a s e = 0.05   m k = 24.2   k N / m
r r o l l e r = 0.008   m P = 242   N
Disclaimer/Publisher’s Note: The statements, opinions and data contained in all publications are solely those of the individual author(s) and contributor(s) and not of MDPI and/or the editor(s). MDPI and/or the editor(s) disclaim responsibility for any injury to people or property resulting from any ideas, methods, instructions or products referred to in the content.

