Abstract
This study explored the adsorption of carboxylic acids, especially free fatty acids (FFAs), present in biofuel (distilled fractions of bio-oil such as gasoline-like hydrocarbons, kerosene-like hydrocarbons, and diesel-like hydrocarbons) using red-mud-based adsorbents. The red mud was thermally activated at 40 °C and 600 °C and chemically activated with 0.25M, 1M, and 2M HCl. Analytical techniques were used to characterize the adsorbents’ properties. At the same time, the study examined factors like feed type, adsorbents, FFA contents, adsorbent percentage, activation temperature, acid solution concentration, and contact time to assess adsorption efficiency. The characterization results indicated that chemical activation with 0.25M HCl significantly increased the surface area to 84.3290 m2/g, surpassing that of the thermally activated samples (35.2450 m2/g at 400 °C). Adsorption experiments demonstrated that all chemically activated samples, with 5% adsorbent, adsorbed over 2000 mg of FFAs per gram of adsorbent, with CARM-1M HCl achieving 100% removal of acids from gasoline-like hydrocarbons. Kinetic modeling showed that the pseudo-second-order model best represented the adsorption data, as evidenced by high R2 values and close agreement between the experimental and calculated qe values. Therefore, adsorption with chemically activated red mud efficiently deacidifies biofuels, providing a cost-effective and promising approach for their upgrading.
1. Introduction
In a global scenario of growing concern about climate change, many of the strategic energy and climate objectives in emerging and developing economies focus on decarbonization, organized around three main axes: The first is clean electrification, with a focus on expanding the share of electric vehicles and other forms of electrification supported by renewable energy sources. The second axis covers improvements in energy efficiency, emphasizing reducing CO2 emissions per unit of industrial production and per kilometer traveled in transport. The third axis highlights the transition to low- or zero-carbon fuels, such as biofuels and other renewable energies, promoting the progressive replacement of fossil fuels and accelerating the mitigation of greenhouse gas emissions [1].
Pyrolysis, also known as thermal cracking, is one of the technologies capable of converting biomass, whether it is based on lignocellulose or triglycerides, into biofuels and other chemicals [2]. This process occurs at temperatures between 350 and 650 °C in the absence of oxygen and, in some cases, in the presence of a catalyst, characterizing catalytic cracking [2,3,4]. The liquid fraction resulting from pyrolysis is known as bio-oil. However, bio-oil’s physical properties and chemical composition vary according to the type of biomass used [2]. Compared to methods such as transesterification and sugar fermentation, which have feedstock constraints and produce more limited products (e.g., biodiesel or bioalcohols), pyrolysis is more comprehensive and adaptable. Pyrolysis operates at a relatively low temperature of around 450 °C, which helps reduce energy costs and allows for more precise control over the distribution of end products. Furthermore, the process does not require complex pretreatment of the feedstock, making it more straightforward and efficient. Although there are challenges, such as controlling the formation of byproducts, pyrolysis remains an advantageous choice due to its flexibility in converting different biomasses and its ability to generate multiple biofuel fractions, meeting diverse market needs [4].
Given this diversity, this study focuses on bio-oils and their distillate fractions derived from triacylglycerol-based biomass pyrolysis, due to their unique characteristics and potential to produce biofuels.
Bio-oil is a complex mixture of oxygenated compounds (aldehydes, ketones, carboxylic acids) and hydrocarbons (linear paraffin, naphthenes, and olefins) [4,5,6,7], which correspond to the boiling point range of many petroleum products, including the following fuels: gasoline, kerosene (jet fuel), and diesel [6,7]. Generally, bio-oil is dark, varying between almost black, reddish brown, and dark green [8]. However, its direct use as a substitute for fossil fuels faces significant barriers due to its low calorific value and high oxygen content, which result in instability, high corrosivity [3,9,10], and high acid value (82.03 mg KOH/g on average) due to the presence of carboxylic acids formed by the breakdown of triglycerides [2]. To be used as a fuel or in the production of value-added chemicals, bio-oil needs to be processed, refined, or upgraded [3,9,10,11,12,13,14,15], aiming to improve its properties and meet established standards, especially in terms of olefin content and acidity [2]. Although the complex composition of bio-oil presents significant challenges for consolidating such procedures [2,12], its refining/upgrading is feasible due to the development and application of specific separation technologies and processes [9].
Several studies have reviewed technologies for improving bio-oil, including catalytic cracking, hydrotreatment, esterification, and stabilizing its physicochemical properties [16,17,18]. However, there is a gap in the use of separation techniques for the fractionation/extraction of bio-oil, such as supercritical fluid extraction, adsorption, membrane techniques, electrosorption, and ionic liquid extraction [9], as well as methods such as column chromatography, distillation, and solvent extraction [9,10,19], which can provide efficient separation and contribute to the improvement of the quality of bio-oil and its distillate fractions [10].
Distillation has stood out as a separation process that generates fractions based on oxygenated compounds and hydrocarbons (which correspond to the boiling point range of gasoline, aviation kerosene, and diesel), with significantly higher quality than crude bio-oil. These distilled fractions have lower water content, higher calorific value, and reduced oxygenated compounds [10]. This last aspect contributes to obtaining fractions with lower acidity than the original bio-oil [20,21]. In this way, distillation results in biofuels with improved physical, chemical, and compositional properties [21,22].
However, even showing a significant improvement, the distilled fractions—and therefore, the biofuels—still have considerable contents of oxygenated compounds, reflected in their acid values [21]. Thus, oxygenated compounds, especially carboxylic acids in the form of free fatty acids (FFAs), must be removed or reduced from the distilled fractions to avoid or reduce the abovementioned problems. In this way, an upgrade aimed at deacidifying distilled fractions of bio-oil becomes of great importance.
As previously reported, separation techniques can provide efficient separation and contribute to upgrading bio-oil and its distillate fractions [9,10]. Thus, adsorption is one of the separation techniques with the potential to deacidify bio-oil and its distillate fractions [23,24,25,26,27,28]. Although it is possible to find studies on the upgrading of bio-oil through adsorption, which have targeted different adsorbates [9] such as water [9,29] and organic compounds [9,23,30,31], among others [9,27], the truth is that few studies, such as those carried out by Li et al. [32] and Church et al. [25], have realized the potential and possibility of such applications. In addition to the application of adsorption as a technique for separating carboxylic acids in bio-oils and their distillate fractions, it is important to highlight that it has been applied to deacidify petroleum fractions [33,34], fats [35], vegetable oils [36], and other types of biofuels, such as biodiesel [37], using different adsorbents, such as commercial adsorbents (clay and activated alumina) [34], diatomaceous earth, activated carbon and silica [37], or ion-exchange resins [35,36], to name a few.
Li et al. [32] investigated the adsorptive capacity, selectivity, and mechanism of three adsorbents (Cu-zeolite Y, silica gel, and activated carbon) for the removal of nitrogen-containing compounds from bio-oils derived from microalgae pyrolysis. This study found that the adsorption capacity and selectivity of activated carbon for nitrogenous and acid compounds (hexadecanoic acid) are high. Therefore, activated carbon is a promising adsorbent for removing nitrogenous and oxygenated compounds from microalgae bio-oil. Church et al. [25] developed a new adsorption separation process to selectively remove molecules from real bio-oils using zeolitic molecular sieves and polymeric resins as adsorbents. The two adsorbents proved effective in reducing the carbonyl content and the number of carboxylic acids, increasing the stability of the bio-oil and protecting the catalyst in subsequent processing steps. Therefore, these two studies demonstrate that adsorption efficiently removes oxygenated compounds, especially acids, from bio-oil.
In this context, the main objective of this study is to investigate the efficiency of using red-mud-based adsorbents in the removal of oxygenated compounds—such as carboxylic acids, and especially FFAs—present in distilled fractions of bio-oils (biofuels). By applying adsorption as a deacidification method, this study aims to improve the quality of biofuels similar to gasoline, kerosene, and diesel. The results of this study could significantly contribute to the development of more efficient and sustainable methods in the production of biofuels, offering the scientific community valuable insights into the use of industrial waste, such as red mud, in the purification and improvement of the stability of these alternative fuels.
2. Materials and Methods
2.1. Characterization of the Feedstock
All distilled fractions employed in this study were obtained from the fractional distillation of bio-oils produced from the catalytic thermal cracking of crude palm oil, as described by Mancio et al. [21]. In addition, the contents of free fatty acids present in the distilled bio-oil fractions were associated with the total acid number (TAN), which was determined according to the ASTM D974 standard method [38].
2.2. Preparation of the Adsorbent
Fresh red mud, a residue from the Bayer process, was supplied by Hydro Alunorte S.A., located in Barcarena, Pará, Brazil, and used as the starting material to synthesize the adsorbents evaluated in this study. These adsorbents include thermally activated red mud at 400 °C, thermally activated red mud at 600 °C, chemically activated red mud with 0.25M HCl (Êxodo Cientifica, Sumaré-Brazil), chemically activated red mud with 1M HCl, and chemically activated red mud with 2M HCl. For the synthesis of these five adsorbents, the fresh red mud was initially dried at 110 °C for 24 h. After drying, approximately 2 kg of red mud was disaggregated in a ball mill (CIMAQ S.A. IND. E COM., Sumaré, Brazil) for 30 min. The dried and disaggregated red mud was then subjected to the thermal and chemical activation steps detailed in the following subsections.
2.2.1. Thermal Activation of Red Mud
A total of 750 g of dry and disaggregated red mud was subjected to thermal activation in an electric furnace at 400 °C for 4 h and a heating rate of 5 °C/min, obtaining the red mud thermally activated at 400 °C at the end of this stage. The same procedure was performed to obtain the red mud thermally activated at 600 °C.
2.2.2. Chemical Activation of Red Mud
For the chemical activation of red mud by hydrochloric acid (HCl), portions containing 50 g of dry red mud were separated. Each portion was mixed with a solution of HCl at concentrations of 0.25, 1, and 2M at a ratio of 1:20 (g of red mud/mL of HCl solution) in 2 L beakers. The mixtures of red mud with HCl solution were subjected to constant stirring for 2 h, followed by a centrifugation step at 3000 rpm for 20 min in an electronic centrifuge (Sigma Laboratory Centrifuges, Model: 6-15H, Osterode am Harz, Germany) with a digital display. The supernatant was removed, and the remaining red mud was filtered with a vacuum pump and then washed with distilled water, repeating the process more than once. The remaining red mud was then dried in an oven at 105 °C for 12 h.
2.3. Characterization of Adsorbents
This study presents the detailed characterization of the adsorbents developed for removing oxygenated compounds from different sections of distilled fractions of real bio-oils. The characterization was carried out using a series of analytical techniques, as detailed further below, to determine their physical, chemical, and thermal properties, including surface morphology, elemental composition, functional groups, crystalline structure, surface area, thermal stability, and decomposition behavior.
2.3.1. Scanning Electron Microscopy (SEM)–Energy-Dispersive X-Ray (EDX) Analysis
Scanning electron microscopy (SEM) was used to observe the surface morphology of the adsorbents at various magnification ranges. The morphology of the adsorbents was analyzed using a scanning electron microscope (Hitachi TM3000, Hitachi, Tokio, Japan) coupled with an EDX spectrometer (Oxford Instruments, Model: SwiftED 3000, Oxford, UK), with a resolution of 30 nm, magnification from 15× to 30,000, and a tungsten source. A small powder sample was mounted on a 10 mm diameter aluminum bracket using carbon tape and analyzed at 15 kV, 1750 mA, 30 s reading, and under controlled vacuum.
2.3.2. Fourier-Transform Infrared Spectroscopy (FTIR)
Fourier-transform infrared spectroscopy (FTIR) was used to identify the functional groups present on the surface of the adsorbents. The absorption spectra in the infrared region of the adsorbents were obtained through a spectrometer (Shimadzu Corporation, Model: Prestige 21, Kyoto, Japan) in the region of 4000 to 400 cm−1. In order to perform the analysis, approximately 0.03 g of adsorbent was macerated with approximately 0.1 g of KBr (spectroscopic grade). After maceration and homogenization, the adsorbent samples were compressed with the aid of pastilles. Then, the formed pellets were analyzed.
2.3.3. X-Ray Diffraction
X-ray diffraction (XRD) was used to determine the crystal structure of the adsorbents. The X-ray diffractograms were obtained in the range of 2θ from 10° to 90°, with a step of 0.05° and a time per step of 4 s, using the PANalytical X’Pert PRO equipment (PANalytical, Almelo, The Netherlands). The instrument was equipped with a copper tube (Cu), Kα1 = 1.54056 Å, voltage of 40 kV, current of 40 mA, incident and divergent slit of 1°, and programmable slit of 3 mm.
2.3.4. Surface and Textural Characterization
The specific surface area, pore volume, and pore diameter of all adsorbents were determined with the aid of a device (Micromeritics, Model: ASAP 2420, Norcross, GA, USA) for the analysis of adsorption–desorption isotherms of a known volume of liquid nitrogen at a temperature of –196 °C, under conditions of equilibrium pressure. Before the analysis, a pretreatment stage was carried out, in which approximately 0.3 g of sample was degassed at 150 °C under vacuum for 12 h. The specific surface area was determined by the BET (Brunauer–Emmett–Teller) technique. The mean pore size distribution and total pore volume were determined by the BJH (Barrett–Joyner–Halenda) and t-plot methods, respectively.
2.3.5. Thermal Analysis
The thermal degradation of the adsorbents was analyzed through thermogravimetric analysis (TGA) and differential thermal analysis (DTA), using thermogravimetric equipment coupled with a simultaneous thermal analyzer, as detailed by Mota et al. [22]. The experiment was conducted in a vertical cylindrical furnace with a thermal microbalance and a proportional–integral–derivative (PID) temperature control, allowing for the measurement of sample weight as a function of temperature within the range of 20–1000 °C and heat flux between 5 and 200 °C/min. Then, 10 mg of each sample was weighed using an analytical balance and placed in alumina crucibles. The temperature program was set between 30 and 1000 °C, with a heat flux of 10 °C/min.
2.4. Experimental Procedure for the Adsorption of Carboxylic Acids
The experimental procedure of the deacidification process of distilled fractions of bio-oil by adsorption was carried out evaluating the following variables: feedstock type, adsorbents, contents of free fatty acids in the feedstock, adsorbent percentage, activation temperature, concentration of the chemical activation solution, and contact time, as described in more detail in the sections below.
The concentrations, quantities, and ranges used in the experiments of this study were carefully selected based on a comprehensive review of the literature on the adsorption of carboxylic acids on various adsorbents, including those based on red mud. The choice of these variables was based on previous studies that demonstrated the effectiveness of different concentrations of adsorbents and adsorbates in analogous systems. This approach ensured that the experimental parameters were relevant and aligned with the best practices in the area, contributing to the validity and reproducibility of the results obtained.
2.4.1. Effect of Feedstock Type
To assess the influence of feedstock type on the deacidification process by adsorption, three different distillate fractions were selected. These fractions were chosen based on their boiling point ranges, corresponding to common petroleum cuts, and with similar TAN values to standardize the acidity levels across samples. The TAN values, measured in mg KOH/g, served as the response variable in this evaluation, reflecting the degree of deacidification achieved. The tested fractions included the following:
- Gasoline-like hydrocarbons (boiling range: 90–160 °C; TAN = 1.56 mg KOH/g);
- Kerosene-like hydrocarbons (boiling range: 160–245 °C; TAN = 1.59 mg KOH/g);
- Diesel-like hydrocarbons (boiling range: 245–340 °C; TAN = 1.55 mg KOH/g).
2.4.2. Effect of the Adsorbent
To evaluate the effects of different adsorbents on the adsorption deacidification process, five red-mud-based adsorbents were synthesized as described in Section 2.2. The effectiveness of each adsorbent was measured by analyzing the reduction in the TAN values of the treated bio-oil fractions, providing a quantitative indicator of the deacidification efficiency. In addition, the adsorption capacity for acidic compounds was determined and analyzed to offer a more comprehensive assessment of each adsorbent’s effectiveness in reducing acidity. The deacidification efficiency and adsorption capacity are detailed in Section 2.4.7.
2.4.3. Effects of Free Fatty Acid Contents on Feedstock
To assess the effects of free fatty acid contents on the deacidification process by adsorption, three distilled fractions were selected within the temperature range of 160 to 245 °C, each with a distinct TAN value, reflecting different levels of free fatty acids. These fractions included kerosene-like hydrocarbons with a TAN of 1.59 mg KOH/g, kerosene-like hydrocarbons with a TAN of 33.67 mg KOH/g, and kerosene-like hydrocarbons with a TAN of 84.40 mg KOH/g. Following this selection, the assessment of free fatty acid contents adhered to a methodology akin to that outlined in Section 2.4.2, where the deacidification efficiency and adsorption capacity were determined. This involved measuring the TAN values before and after treating the bio-oil fractions, enabling a correlation between the initial free fatty acid levels and the adsorbents’ performance in the deacidification process.
2.4.4. Effect of Adsorbent Amount
In order to evaluate the effect of the amount of adsorbent on the adsorption deacidification process, four percentages of adsorbents were tested: 0.5%, 1%, 1.5%, and 2%, with respect to the feedstock mass. The distillate fraction corresponding to the cut-off temperature range between 90 and 160 °C, equivalent to gasoline-like hydrocarbons with a TAN of 4 mg KOH/g, was used as feed for the experiment.
2.4.5. Effect of Activation Temperature
The red mud was subjected to a thermal activation process at two controlled temperatures, 400 °C and 600 °C, to evaluate the effect of the activation temperature on the efficiency in the deacidification of the distilled fractions. The activated material in each thermal condition was then used as an adsorbent in the deacidification process, being carefully analyzed for its ability to remove carboxylic acids from the distilled fractions, thereby allowing a comparative evaluation of the performance of the adsorbents as a function of the activation temperature.
2.4.6. Effect of Acid Solution Concentration
The red mud was subjected to chemical activation using HCl solutions at three concentrations: 0.25M, 1M, and 2M. The objective was to investigate the effect of the concentration of the activating agent on the efficiency of the deacidification process of the distilled fractions. After activation, the material was washed, dried, and characterized before being applied as an adsorbent. The deacidification capacity of the fractions was evaluated comparatively for each HCl concentration. Then, it was possible to identify the influence of acid concentration on the adsorbent’s performance.
2.4.7. Adsorption Kinetics
The kinetics of free fatty acid adsorption is represented by the relative amount of free fatty acids adsorbed over time. From the kinetics data, determining the contact time necessary to achieve the adsorption equilibrium of the free fatty acids is possible.
The adsorption kinetics of free fatty acids present in distilled fractions with different TAN values was determined in agitated tanks as follows: in closed 250 mL Erlenmeyer flasks at the controlled and predetermined temperature, containing around 10 g of feed (distilled fractions), we added the amount of adsorbent required and pre-established for each run of experiments. Then, the flasks were subjected to constant orbital agitation (160 rpm) on a shaker table at room temperature (27 ± 0.5 °C) for 60 min. Subsequently, the vials were removed from the shaker table at predetermined times, and their contents were immediately filtered through Whatman No. 1 filter paper. The liquid phase (filtrate) was analyzed, and the TAN was determined by titration according to the ASTM D974 standard method.
The adsorption deacidification efficiency and adsorption capacity of the adsorbents were evaluated using Equations (1) and (2), respectively:
where η is the deacidification efficiency of fractions distilled by adsorption, and are the total acid number of the fraction distilled before and after adsorption, respectively, is the adsorption capacity at any time (t), i.e., the mass of free fatty acids adsorbed per gram of adsorbent at any time (t), is the mass of the distilled fraction used, is the adsorbent mass used in each run of the experiments, and is the average molecular weight of the free fatty acids present in the distilled fractions.
In order to quantify the mass of adsorbed fatty acids per gram of adsorbent used, it was considered that all distillate fractions used in the present work were constituted by the following mixture of fatty acids: capric acid, myristic acid, palmitic acid, stearic acid, and oleic acid. This acid mixture was considered to be a function of the results obtained by GC-MS for several distillate fractions of bio-oil, as reported by Mancio et al. [21]. According to these results, these acids were the carboxylic acids present in all distillate fractions analyzed, and in relatively large quantities compared to other acids.
2.5. Kinetics Modeling
This study applied pseudo-first-order and pseudo-second-order kinetics models to evaluate the kinetics of free fatty acid (FFA) adsorption in five red-mud-based adsorbents. The linear kinetic equations used were as follows:
- 1.
- Pseudo-first-order:
- 2.
- Pseudo-second-order:
The pseudo-first-order model describes adsorption as a process controlled by the transfer of mass to the surface sites of the adsorbent, with a rapid initial rate that decreases to equilibrium [39]. The pseudo-second-order model, on the other hand, indicates that adsorption is controlled by chemical reactions at the active sites of the adsorbent, and this model is applied when there are significant chemical interactions between the solute and the adsorbent [40]. The parameters and for the pseudo-first-order model were obtained from the versus (min) graph, while the parameters and for the pseudo-second-order model were derived from the graph of as a function of .
3. Results
3.1. Characterization of Adsorbents
3.1.1. Scanning Electron Microscopy (SEM)–Energy-Dispersive X-Ray (EDX) Analysis
Figure 1 presents the micrographs obtained by scanning electron microscopy (SEM) for the different samples of red-mud-based adsorbents: red mud (without activation) (Figure 1a), TARM at 400 °C (Figure 1b), TARM at 600 °C (Figure 1c), CARM-0.25M HCl (Figure 1d), and CARM-2M HCl (Figure 1e). The analysis of these images reveals particle clusters in all samples, suggesting a heterogeneous particulate structure characteristic of red-mud-based materials, as reported by Antunes et al. [41]. It was observed that, for the magnification used, both thermal and chemical activations did not result in visible morphological changes in the treated samples (Figure 1b–e) compared to the original red mud (Figure 1a), corroborating the findings of Antunes et al. [41] for thermal activation. The results from thermal activation suggest that the effectiveness of carboxylic acid adsorption is not necessarily dependent on evident morphological changes; rather, it appears to be more closely related to properties such as increased surface area, particularly for the thermal activation at 400 °C, as detailed in Section 3.1.4. However, Figure 1d,e, which show the HCl-activated samples, suggest features such as spherical particle formation and greater connectivity between the pores, consistent with the observations of Fang et al. [42]. According to Fang et al. [42], these modifications provide a larger specific surface area, with more reactive sites, which contributes to the improvement in the adsorption efficiency of the material.

Figure 1.
SEM images of red-mud-based adsorbents: (a) red mud, (b) TARM at 400 °C, (c) TARM at 600 °C, (d) CARM-0.25M HCl, and (e) CARM-2M HCl.
3.1.2. Fourier-Transform Infrared Spectroscopy (FTIR)
Figure 2 shows the FTIR spectra of the red-mud-based adsorbents (Red Mud, TARM at 400 °C, TARM at 600 °C, CARM-0.25M HCl, CARM-1M HCl, and CARM-2M HCl), revealing the presence of different metal oxides, such as Fe2O3, Al2O3, SiO2, CaO, Na2O, and TiO2. The peak detected around 3440 cm−1 can be attributed to the stretching vibrations of the hydroxyl groups in adsorbed water and the OH metal groups present in all samples, in agreement with the results of Fang et al. [42]. Additionally, the band around 1630 cm−1 confirms the presence of H2O molecules bound to the aluminosilicate structure in the non-activated red mud and its modified forms, in line with findings reported in the literature on the common association of water in adsorbent structures based on or not based on red mud.
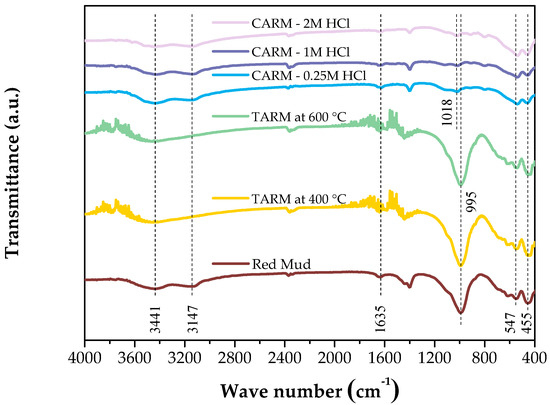
Figure 2.
FTIR spectrum of red-mud-based adsorbents.
The analysis of the FTIR spectra shows that the red mud’s thermal activation at 400 °C and 600 °C did not cause significant changes in the functional groups. The prominent bands—such as the one at 3440 cm−1, corresponding to the vibrations of the hydroxyl groups, and the one at 995 cm−1, associated with the Si(Al)-O vibrations—remained unchanged. These results suggest that mineral phases such as sodalite and silica [43] did not undergo structural modifications with heat treatment. Therefore, under the conditions evaluated, thermal activation did not substantially alter the chemical composition of the red mud, preserving the characteristics of the aluminosilicates and iron oxides in the original sample.
The main band at 995 cm−1, corresponding to the Si(Al)-O stretching vibrations, and characteristic of sodalite [43], showed a significant reduction after activation with HCl, indicating the partial dissolution of this aluminosilicate phase, as also observed by Fang et al. [42]. This decrease was accompanied by a new peak at 1018 cm−1, attributed to dissolved silicates, suggesting the formation of new silica structures [44]. Small bands at 617 and 455 cm−1 suggest that, despite the partial dissolution, there is still a residual preservation of the Si-O-Al bonds, pointing to the remaining presence of sodalite in the modified structure [45]. Finally, the relative increase in the band at 547 cm−1 in HCl-activated materials indicates a greater contribution of Fe-O vibrations [42]. These results indicate that chemical activation with HCl alters the adsorbents’ chemical composition and pore structure, enhancing their functionality for adsorption applications. These results corroborate the data obtained by X-ray diffraction analysis, which indicated changes in the mineral and oxide phases after the chemical activation of the adsorbents.
3.1.3. X-Ray Diffraction (XRD)
Figure 3 presents the X-ray diffractograms of the red-mud-based adsorbent samples (red mud, TARM at 400 °C, TARM at 600 °C, CARM-0.25M HCl, CARM-1M HCl and CARM-2M HCl), allowing for a detailed analysis of the structural changes in the crystalline phases of the red mud after thermal and chemical activations. Red mud has several crystalline phases, such as hematite (Fe2O3), goethite FeO(OH), gibbsite (Al(OH)3), quartz (SiO2), calcite (CaCO3), and sodalite Na7.88(Al6Si6O24)(CO3)0.93, consistent with the results obtained by Antunes et al. [41], Fang et al. [42], and Almeida et al. [46]. These phases are identifiable by characteristic peaks; for example, hematite exhibits dominant peaks at 2θ = 33°, 35.7°, and 54° (PDF 01-079-0007), indicating its abundance in the original red mud. Observation of these key peaks is essential, as it not only confirms the initial crystal structure of each phase but also serves as a reference for identifying structural transformations after activation that may impact the adsorbent’s performance.

Figure 3.
XRD patterns of red-mud-based adsorbents.
The thermal activation of the red mud at 400 °C and 600 °C (TARM at 400 °C and TARM at 600 °C, respectively) promoted the decomposition of some less stable phases, such as gibbsite (PDF 01-074-1775) and goethite (PDF 01-081-0464), as indicated by the disappearance of the peaks at 2θ = 18.3° and 2θ = 21.34°. These results suggest that thermal activation at these temperatures was sufficient to cause relaxation or interatomic distancing in the crystal structure of the gibbsite. On the other hand, the more stable phases, such as hematite (PDF 01-079-0007) and quartz (PDF 00-051-1377), remained unchanged, confirming these phases’ high stability at elevated temperatures. The absence of significant new phases in the X-ray diffractograms (XRDs) after thermal activation suggests that, under the conditions studied (400 °C and 600 °C), the changes were limited to the loss of phases with low thermal stability. In contrast, the main mineral phases remained preserved. These results are consistent with those obtained by Antunes et al. [41].
The chemical activation of red mud with different concentrations of HCl (0.25M, 1M, and 2M, designated as CARM-0.25M HCl, CARM-1M HCl, and CARM-2M HCl, respectively) promoted significant changes in the crystalline phases, as evidenced by the X-ray diffractograms presented in Figure 3. The main alteration was the partial dissolution of unstable mineralogical phases in the acidic medium, such as sodalite (PDF 01-089-9098) and calcite (PDF 00-001-0837), as indicated by the sharp reduction in the intensity of the peaks around 2θ = 13.89° and 2θ = 24.20°, which correspond to their structural vibrations. These changes were more pronounced in samples treated with higher concentrations of HCl (1M and 2M), suggesting that increasing the acid concentration intensified the removal of these phases. According to Almeida et al. [46], this behavior can be attributed to the acid digestion process, which confirms the dissolution of these phases.
On the other hand, HCl treatment did not affect the hematite structure, as shown by the preservation of the characteristic peaks at 2θ = 33°, 35.7°, and 54° in all activated samples. This result indicates that hematite resists acid attack and remains the dominant phase after chemical treatment. In addition, a slight increase in the intensity of the gibbsite peak was observed, which may have been related to the partial dissolution of sodalite and subsequent formation of aluminum hydroxides, as suggested by Almeida et al. [46] and Kurtoğlu et al. [47].
Therefore, the results presented in Figure 3 suggest that chemical activation was more efficient in modifying the crystalline phases of the red mud for adsorption applications. This process increased the material’s porosity, as confirmed in Section 3.1.4, which addresses the surface and textural characterization of the adsorbents, making the red mud more suitable for use as an adsorbent.
3.1.4. Surface and Textural Characterization
The nitrogen adsorption and desorption isotherms and pore volume distribution curves in red mud plus five red-mud-based adsorbents (red mud, TARM at 400 °C, TARM at 600 °C, CARM-0.25M HCl, CARM-1M HCl, and CARM-2M HCl) are shown in Figure 4. Figure 4a shows that all samples of red-mud-based adsorbents presented type IV isotherms, according to the IUPAC classification, which are characteristic of mesoporous materials (20–500 Å). This type of isotherm corresponds to the complete formation of monolayers and the beginning of multilayer formation, with subsequent capillary condensation and hysteresis loops [48]. The interfacial geometry during desorption differs from that during adsorption due to pressure variations during meniscus evaporation and vapor saturation pressure. This difference results in distinct curves for desorption and adsorption [49]. In addition, the hysteresis loops observed for the original red mud and the activated red mud are of the H3 type, suggesting crevice-shaped pores, as occur in materials with plate-like particle aggregates, as reported by Almeida et al. [46] and Thommes et al. [48].

Figure 4.
(a) N2 adsorption–desorption isotherms of red-mud-based adsorbents; (b) pore size distribution curves of red-mud-based adsorbents.
According to Figure 4a, in thermal activation (TARM at 400 °C and 600 °C), the hysteresis loops reveal the presence of mesopores, although less markedly compared to the chemically activated samples. In the chemically activated HCl samples (CARM-0.25M HCl, CARM-1M HCl, and CARM-2M HCl), the most prominent hysteresis loop was observed for the CARM-0.25M HCl sample, indicating a higher amount of mesopores. This result is consistent with what was reported by Fang et al. [42] for red mud activated with HCl, compared to the original red mud.
From Figure 4b, it can be observed that all samples have pores in the mesopore range, with diameters ranging from 20 to 500 Å. The samples chemically activated with acid and thermally activated stand out for presenting a significant increase in the volume of mesopores compared to the original red mud. More specifically, the mesopores are densely distributed in the 20–90 Å range, reflecting on the mean pore diameter shown in Table 1. As highlighted by Suzuki [50], mesopores with diameters between 20 and 500 Å are crucial for the adsorption of larger molecules, such as organic acids, since the efficiency of the adsorbent is related to the correspondence between the size of the pores and the adsorbed molecules. These characteristics suggest an improvement in the adsorptive performance of red-mud-based adsorbents subjected to activation, making them potentially more effective in capturing molecules such as fatty acids (the object of study in this work).

Table 1.
Textural properties of adsorbents.
Table 1 presents the results of the textural analysis of the adsorbents used in the present study. The surface area of the red mud without any activation was 29.7024 m2/g. Sushil and Batra [51] reported that the BET area of red mud usually varies between 20 and 30 m2/g, confirming the consistency of our results with the literature. Table 1 also shows the evolution of the specific surface area with the increase in the activation temperature of the red mud. Activation at 400 °C resulted in an increase in specific surface area compared to red mud. However, activation at 600 °C reduced the surface area to a lower value than that of red mud, which is consistent with the observations of Liu et al. [52], who identified the maximum value of the surface area at 400 °C and a decrease with activation at 1000 °C, attributed to pore collapse. The increase in the surface area of the red mud can be attributed to the evaporation of water from the zeolitic structure according to Garcia [53], who indicated that this process starts at 200 °C and is completed at 400 °C. However, temperatures above 400 °C can result in particle growth and a consequent reduction in surface area. Thus, the data from this study, in line with the findings of Garcia [53] and Liu et al. [52], suggest that thermal activation above 400 °C can cause partial pore collapse. At this point, minerals such as hydroxides and aluminous compounds can dehydrate or undergo structural transformations, closing pores. This phenomenon, associated with sintering, reduces the surface area of the adsorbents and reduces the number of adsorption sites, impacting the efficiency of the process, as described in Section 3.2.1.
As for chemical activation, there was a significant increase in the specific area (BET) of the sample chemically activated with HCl at 0.25M (CARM-0.25M), which reached the highest value (84.33 m2/g), suggesting that this concentration is efficient in removing mineral impurities and unclogging pores, as reported by Almeida et al. [46]. However, higher concentrations of HCl (1M and 2M) decreased the surface area, showing that an excessively acidic activation can promote the collapse of the pore structure. In terms of mesopore volume, the CARM-0.25M sample also stood out with the highest value (0.1203 cm3/g), reinforcing the efficiency of this concentration in creating mesopores.
From the analysis of the evolution of the specific surface area of the adsorbents after thermal and chemical activations, it was concluded that chemical activation with 0.25M HCl was the most effective way to improve this property in red mud. This treatment resulted in a surface area of 84.3290 m2/g, within the range of commercial adsorbents such as polymeric adsorbents (80–700 m2/g). This result highlights the potential of red mud activated with 0.25M HCl, specifically CARM-0.25M HCl, as a promising material for the adsorption of free fatty acids due to its optimized textural properties.
3.1.5. Thermal Analysis
The TGA and DTA curves of the red mud sample and red-mud-based adsorbents are illustrated in Figure 5a,b, respectively. As shown in Figure 5a, the original red mud exhibited a mass loss of 7.5% between 80 °C and 400 °C, with most of this loss related to the evaporation of chemically bound water. In comparison, the samples thermally activated at 400 °C and 600 °C showed a lower mass loss than the original red mud, at 4.5% and 3.5%, respectively, indicating greater thermal stability. The DTA analysis (Figure 5b) confirmed this surface and crystalline water removal phenomenon, showing the exothermic reaction in the range of 200 °C to 400 °C. Furthermore, due to physically adsorbed water, the mass loss between 80 °C and 100 °C was minimal, at approximately 1.0% of the total weight. Still analyzing the first stage of mass loss for the chemically activated samples, a similar behavior to the original red mud was observed, with mass losses equal to 8.0% and 10% for the CARM-0.25M HCl and CARM-2M HCl samples, respectively.

Figure 5.
Thermal analysis curves of red-mud-based adsorbents. (a) Thermogravimetric analysis (TGA) curve. (b) Differential thermal analysis (DTA) curve.
In the second stage of sample decomposition, corresponding to the range of 400 °C to 600 °C, a tendency for mass loss was observed on a larger scale for the chemically activated samples, with the lowest mass reached for the CARM-0.25M HCl sample, at an approximately 11% loss, and 9.0% for the CARM-2M HCl sample. In contrast, the thermally activated red mud samples maintained a lower mass loss, reaching 6.5% and 5% for the TARM samples at 400 °C and 600 °C, respectively.
In the third stage of sample decomposition, corresponding to the range of 600 °C to 1000 °C, the mass loss trends were maintained, with one change, which corresponded to the change in gradient between the original red mud and the CARM-2M HCl, indicating that, when chemically activating the red mud, it becomes more vulnerable to thermal degradation, reaching approximately 12% mass loss for the CARM-0.25M HCl sample.
3.2. Adsorption Kinetics and Kinetic Modeling
3.2.1. Thermally Activated Red Mud
Figure 6 shows the results of the adsorption kinetics experiments in red mud thermally activated at 400 °C (TARM at 400 °C) and 600 °C (TARM at 600 °C). Such experiments were performed for three initial concentrations of carboxylic acids in kerosene-like hydrocarbons, indicated by the following values of TAN: 1.59 mg KOH/g, 33.67 mg KOH/g, and 84.40 mg KOH/g.
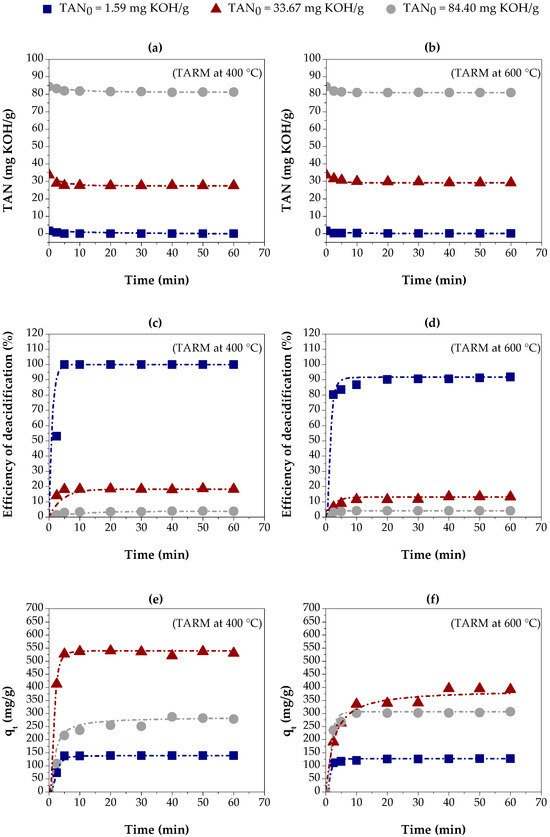
Figure 6.
Adsorption kinetics of carboxylic acids on three kerosene-like hydrocarbon fractions using thermally activated red mud: (a,b) TAN values, using TARM at 400 °C and 600 °C, respectively; (c,d) percentage of carboxylic acids removed, using TARM at 400 °C and 600 °C, respectively; (e,f) adsorption capacity, using TARM at 400 °C and 600 °C, respectively.
Figure 6a,b show the decrease in TAN over time with TARM at 400 °C and TARM at 600 °C, respectively. The reduction in TAN was similar for both adsorbents, except for the fraction with TAN = 33.67 mg KOH/g, where TARM at 400 °C showed a slightly more significant reduction, resulting in a lower final TAN.
Figure 6c,d show the percentage of carboxylic acid removal over time using TARM at 400 °C and TARM at 600 °C, respectively. The removal efficiency was higher for the fraction with TAN = 1.59 mg KOH/g, achieving 100% removal in 20 min with TARM at 400 °C. For the fractions with TAN = 33.67 mg KOH/g and TAN = 84.40 mg KOH/g, the removal was significantly lower, not exceeding 20% and 5%, respectively, suggesting that higher initial concentrations hinder the adsorption process, especially for TARM at 600 °C.
Figure 6e,f illustrate the adsorption capacity for TARM at 400 °C and TARM at 600 °C, respectively. The results reveal that the time required to reach equilibrium, approximately 20 min, was similar in both cases, regardless of the TAN value of the kerosene-like hydrocarbon fractions. This result indicates that the thermal activation temperature did not significantly influence the time required to reach adsorbent saturation. In addition, the adsorption capacity at equilibrium was influenced by the initial concentration of carboxylic acids. The increase in TAN from 1.59 mg KOH/g to 33.67 mg KOH/g resulted in a higher adsorption capacity for both adsorbents. However, a further increase to 84.40 mg KOH/g reduced the adsorption capacity, suggesting that higher initial concentrations negatively affect the adsorption process. Asheh et al. [54] suggested that higher concentrations of adsorbate increase the driving force, facilitating mass transfer—a behavior also reported by Li et al. [24], Silva et al. [33], Jean Baptiste et al. [55], and López-Velandia et al. [56].
The experimental adsorption capacity with TARM at 400 °C was approximately 138 mg/g, 539 mg/g, and 286 mg/g for the fractions with TAN = 1.59 mg KOH/g, 33.67 mg KOH/g, and 84.40 mg KOH/g, respectively. The values for TARM at 600 °C were 127 mg/g, 395 mg/g, and 307 mg/g, respectively. The adsorption capacity for the fractions with TAN = 1.59 mg KOH/g and 33.67 mg KOH/g was higher with TARM at 400 °C, indicating its better properties as an adsorbent, due to the larger surface area of this material, as described in Section 3.1.4.
Therefore, Figure 6a–f reveal that the initial acid concentration and the activation temperature of the mud strongly influence the carboxylic acid removal and adsorption capacity in thermally activated red mud. TARM at 400 °C had slightly higher performance than TARM at 600 °C, particularly for the fraction with TAN = 33.67 mg KOH/g, reinforcing the importance of optimizing the thermal activation of adsorbents to maximize the acid removal efficiency.
The experimental results in Figure 6e,f were adjusted using linear regression for the pseudo-first-order and pseudo-second-order kinetics models, as described in Section 2.5. Figure 7 illustrates these adjustments for the activated red mud samples at 400 °C and 600 °C, comparing the kinetics behavior in different fractions of kerosene-like hydrocarbons with TAN values of 1.59, 33.67, and 84.40 mg KOH/g. In addition, Table 2 presents the parameters calculated for both kinetics models based on these adjustments, offering a more detailed view of the adequacy of each model for the experimental conditions.
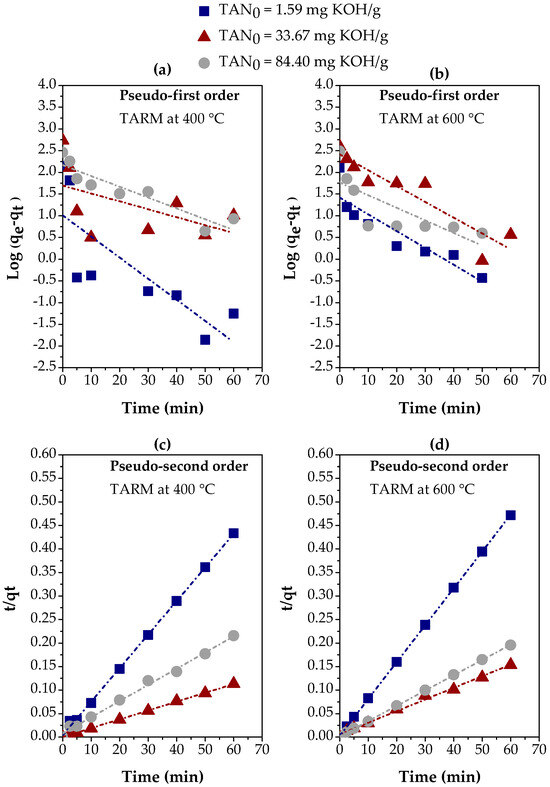
Figure 7.
Evaluation of kinetics models for the adsorption of carboxylic acids on three kerosene-like hydrocarbon fractions using thermally activated red mud: (a,b) pseudo-first-order, using TARM at 400 °C and 600 °C, respectively; (c,d) pseudo-second-order, using TARM at 400 °C and 600 °C, respectively.
Table 2.
Kinetic parameters of pseudo-first- and pseudo-second-order models for the adsorption of carboxylic acids in three kerosene-like hydrocarbon fractions using thermally activated red mud.
The adjustments in Figure 7 reveal a clear contrast between the two models. The pseudo-first-order model (Figure 7a,b) presents an unsatisfactory correlation with the experimental data, especially for the fractions with TAN = 1.59 mg KOH/g and TAN = 33.67 mg KOH/g. The R2 values confirm this behavior in Table 2, as they were consistently lower than 0.900 for all fractions and both thermal activation temperatures. These results indicate that the pseudo-first-order model is inadequate to describe the carboxylic acid adsorption process in kerosene-like hydrocarbon fractions. On the other hand, the pseudo-second-order model (Figure 7c,d) showed a significantly better performance, with R2 values higher than 0.900, reaching up to 0.9999, as shown in Table 2. These results suggest that the pseudo-second-order model provides a much more accurate representation of adsorption kinetics. The excellent agreement between the values of qe(exp.) and qe(calc.) observed in this model reinforces its adequacy, suggesting that chemisorptive interactions mainly govern the adsorption process [57,58].
Overall, the results indicate that the pseudo-second-order model best describes the adsorption kinetics for all kerosene-like hydrocarbon fractions, regardless of the TAN value or the adsorbent activation temperature. This result suggests that the adsorption mechanism is controlled by chemical interactions, being influenced by both the nature of the adsorbent (TARM) and the initial concentration of carboxylic acids (TAN). In addition, thermal activation at 400 °C proved to be more efficient in terms of the agreement of qe values, high R2 values, and the higher initial adsorption rate (hi), which can be explained by the structural modification of the adsorbent, increasing accessibility to active sites.
3.2.2. Chemically Activated Red Mud
Figure 8 presents the results of the adsorption kinetics of carboxylic acids in gasoline-like hydrocarbon fractions (TAN = 4 mg KOH/g), using red mud chemically activated with different concentrations of HCl (0.25M, 1M, and 2M), resulting in three distinct adsorbents (CARM-0.25M HCl, CARM-1M HCl, and CARM-2M HCl). These adsorbents were applied in different proportions (0.5%, 1.0%, 1.5%, and 2%), allowing for the analysis of the effects of both HCl concentration and the amount of adsorbent on acid removal efficiency.

Figure 8.
Adsorption kinetics of carboxylic acids in gasoline-like hydrocarbon fractions using different percentages of chemically activated red mud (CARM-0.25M HCl, CARM-1M HCl, and CARM-2M HCl): (a–c) TAN values; (d–f) percentage of carboxylic acids removed; (g–i) adsorption capacity.
Figure 8a–c illustrates the variation in TAN values over time in different adsorbent percentages. The reduction in TAN values varies significantly according to the concentration of the solution used in the chemical activation process of the red mud and the amount of adsorbent applied. This behavior reflects the efficiency of the deacidification process by adsorption, as shown in Figure 8d–f. The lowest values of TAN obtained were 0.300, 0.000, and 0.73 when using 2% CARM-0.25M HCl, CARM-1M HCl, and CARM-2M HCl, respectively, showing that the concentration of HCl directly influences the acid removal.
Figure 8d–f show the efficiency of carboxylic acid removal in percentage terms, varying according to the amount of adsorbent. The most effective condition was observed with 2.0% CARM-1M HCl, reaching a removal of more than 90%, and even up to 100% in some cases. For the fractions deacidified with CARM-0.25M HCl and CARM-1M HCl, the percentage removal increased significantly when the percentage of adsorbent was increased from 0.5% to 2%. In the case of CARM-2M HCl, the increase was less significant between 0.5% and 1.5% but more pronounced when it reached 2%. Overall, the highest removal performance was achieved with 2% adsorbent for the three chemically activated red mud conditions, reinforcing the importance of the amount of adsorbent in the deacidification process.
In Figure 8d–f, the efficiency of carboxylic acid removal is expressed in percentage terms. It can be observed that the removal was more efficient with the increase in the percentage of adsorbent, highlighting the condition of 2.0% for CARM-1M HCl, which achieved a removal of more than 90%. For the deacidified fractions with CARM-0.25M HCl and CARM-1M HCl, the percentage removal increased significantly as the adsorbent percentage increased from 0.5% to 2%, while for CARM-2M HCl this removal was almost equal when there was an increase from 0.5% to 1.5% and increased a little more significantly from 1.5% to 2%. When the adsorbent percentage reached 2.0%, all three adsorbents demonstrated the highest removal efficiency for the gasoline-like hydrocarbons fraction with TAN = 4 mg KOH/g, evidencing the importance of the amount of adsorbent in the efficiency of the deacidification process.
The adsorbent concentration influences the adsorption capacity, as shown in Figure 8g–i. The analysis of Figure 8g,h reveals that the time required to reach equilibrium in CARM-0.25M HCl and CARM-1M HCl, respectively, was similar for the adsorbent loads of 1%, 1.5%, and 2%, with an average of 20 min to reach equilibrium. However, for the 0.5% adsorbent concentration, an equilibrium time within 60 min was not observed, indicating a gradual increase in qt values and suggesting the need for a kinetics study with a longer timeframe. For CARM-2M HCl (Figure 8i), the time required to reach equilibrium was approximately 20 min for all adsorbent loads tested (0.5%, 1%, 1.5%, and 2%).
Figure 8g–i also indicate that the investigated adsorbent loads influenced the adsorption capacity. It was observed that, when increasing the percentage of adsorbent, there was a reduction in the values of adsorption capacity at equilibrium. This result suggests that the percentage of adsorbent is a crucial factor in the adsorption mechanism. Li et al. [59] explained that although more active sites become available with the increase in the percentage of adsorbent relative to the feedstock mass, the specific area (area per unit mass) does not change. Therefore, the best adsorption capacity was achieved with 0.5% CARM-2M HCl. Li et al. also reported a similar behavior concerning the effect of the adsorbent percentage on the adsorption process [59].
The experimental FFA adsorption capacity of CARM-0.25M HCl was approximately 2611 mg/g for 0.5% adsorbent, 1303 mg/g for 1% adsorbent, 1021 mg/g for 1.5% adsorbent, and 767 mg/g for 2% adsorbent. In CARM-1M HCl, the values were approximately 2483 mg/g for 0.5% adsorbent, 1415 mg/g for 1% adsorbent, 1018 mg/g for 1.5% adsorbent, and 828 mg/g for 2% adsorbent. For CARM-2M HCl, the values observed were approximately 2605 mg/g for 0.5% adsorbent, 1298 mg/g for 1% adsorbent, 887 mg/g for 1.5% adsorbent, and 715 mg/g for 2% adsorbent. Therefore, the results presented in Figure 8g–i indicate that there were no significant differences in the values of FFA adsorption capacity in gasoline-like hydrocarbon fractions using CARM-0.25M HCl, CARM-1M HCl, and CARM-2M HCl as adsorbents. In addition, all of the adsorption capacities obtained with the three chemically activated red mud types were higher than the values found for the red mud thermally activated at 400 and 600 °C. This result indicates that the chemical activation of red mud was an efficient method to increase the adsorptive capacity of the material for use as an adsorbent. The results of the textural analysis (Section 3.1.4) showed that the surface area of chemically activated red sludge, particularly CARM-0.25M, was higher than the surface area of thermally activated red sludge.
In general, although the condition of 2% adsorbent had a lower adsorption capacity than the other conditions tested, this concentration provided the greatest efficiency in removing carboxylic acids. Thus, based on the results in Figure 8, the use of 2.0% CARM-1M HCl stands out as the best option for effectively removing carboxylic acids from gasoline-like hydrocarbon fractions.
The experimental data presented in Figure 8g–i were fitted to the pseudo-first-order and pseudo-second-order kinetics models, as previously described in Section 2.5, using linear regression. Figure 9a–c illustrates the fit for the pseudo-first-order model, while Figure 9d–f correspond to the pseudo-second-order model, using different concentrations of chemically activated red mud (CARM-0.25M HCl, CARM-1M HCl, and CARM-2M HCl). Table 3 summarizes the kinetics parameters calculated for both models, providing a clear comparison of the suitability of each model to the experimental conditions for the adsorption of carboxylic acids in gasoline-like hydrocarbon fractions.
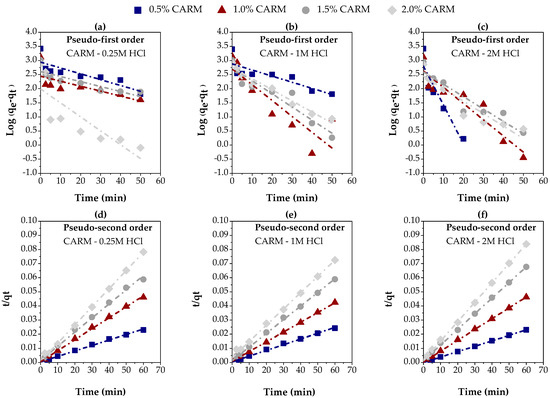
Figure 9.
Evaluation of kinetics models for the adsorption of carboxylic acids in gasoline-like hydrocarbon fractions using different percentages of chemically activated red mud: (a–c) pseudo-first-order, using CARM-0.25M, CARM-1M, and CARM-2M, respectively; (d–f) pseudo-second-order, using CARM-0.25M, CARM-1M, and CARM-2M, respectively.
Table 3.
Kinetics parameters of pseudo-first- and pseudo-second-order models for the adsorption of carboxylic acids in gasoline-like hydrocarbon fractions using different percentages of chemically activated red mud.
Table 3 highlights a significant difference between the two kinetics models. The pseudo-first-order model (Figure 9a–c) showed an unsatisfactory correlation with the experimental data, especially for the samples treated with CARM-0.25M HCl and CARM-1M HCl. This behavior was confirmed by the R2 values, which were consistently lower than 0.900 for most of the adsorbent concentrations tested. These results indicate that the pseudo-first-order model is not adequate to describe the adsorption process of carboxylic acids in gasoline-like hydrocarbon fractions, possibly due to its inability to capture the complexity of the interactions between adsorbent and adsorbate. On the other hand, the pseudo-second-order model (Figure 9d–f) showed significantly better performance, with R2 values higher than 0.900, reaching up to 0.9999. These results suggest that the pseudo-second-order model provides a much more accurate representation of adsorption kinetics. The good agreement between the values of qe (exp.) and qe (calc.) observed in this model reinforces its adequacy, suggesting that the adsorption process is mainly governed by chemisorptive interactions [57,58], as frequently reported in the literature.
The initial adsorption rate (hi), as presented in Table 4, was significantly higher for the lowest percentages of adsorbent (0.5 and 1.0%), regardless of the type of adsorbent used in this study. This result underscores the high efficiency of these adsorbents in the early stages of the process, with more than 76% of the experimental adsorption capacity being achieved in the first five minutes, as evidenced in Figure 8g–i. This rapid initial adsorption is decisive, especially for industrial applications that demand fast and effective processes. The high adsorption rate in the early stages suggests that most of the active sites of the adsorbent are readily accessible, contributing to the high efficiency of the process (Figure 8g–i).
Table 4.
Kinetics parameters of pseudo-first- and pseudo-second-order models for the adsorption of carboxylic acids in different distillate fractions using chemically activated red mud (CARM-1M).
The pseudo-second-order model demonstrated an excellent ability to describe the adsorption kinetics under the tested conditions, as evidenced by the high values of R2 and the excellent agreement between the experimental and calculated qe values. The CARM-1M HCl adsorbent proved to be exceptionally efficient, reaching the highest values of qe and hi, highlighting its efficacy in deacidifying gasoline-like hydrocarbon fractions. This performance can be explained by optimized chemical activation with 1M HCl, resulting in a more suitable structure for interactions with carboxylic acids. The greater accessibility to the active sites of this adsorbent makes it the most promising among those tested, as corroborated by the characterization results presented above.
3.2.3. Effect of the Type of Feed
Figure 10 illustrates the adsorption kinetics of carboxylic acids in various distillate fractions, including gasoline-like hydrocarbons, kerosene-like hydrocarbons, and diesel-like hydrocarbons, all of which have similar TAN values. The analysis was performed using chemically activated red mud (CARM-1M HCl), allowing for a direct comparison between the different fractions and highlighting the effectiveness of the adsorbent in varied hydrocarbon contexts.
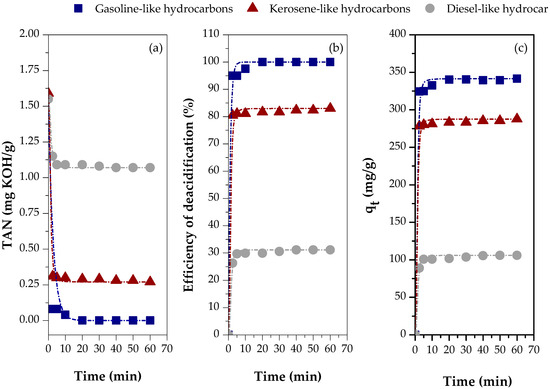
Figure 10.
Adsorption kinetics of carboxylic acids in different distillate fractions using chemically activated red mud (CARM-1M): (a) TAN values, (b) percentage of carboxylic acids removed, and (c) adsorption capacity.
Figure 10a shows the TAN values of the different fractions distilled using CARM-1M HCl as an adsorbent, demonstrating the significant influence of the fraction type on the TAN values. The lowest value of TAN, 0.00 mg KOH/g, was observed for the gasoline-like hydrocarbon fraction, followed by the kerosene-like hydrocarbon fraction, with 0.27 mg KOH/g, and the diesel-like hydrocarbon fraction, with 1.07 mg KOH/g. These results indicate that the differentiated composition of hydrocarbons and oxygenated compounds in each fraction directly affects the acid removal efficiency. Figure 10b reinforces this behavior inversely, showing that the highest deacidification efficiency (100%) was achieved in the gasoline-like hydrocarbon fraction. In comparison, the kerosene-like and diesel-like hydrocarbon fractions showed efficiencies of 82.97% and 31.18%, respectively. Therefore, the results presented in Figure 10a,b show that CARM-1M HCl tends to promote more efficient deacidification for the lighter fractions with smaller hydrocarbon chains, probably due to the lower molecular complexity and better accessibility to the active sites of the adsorbent.
From the chromatographic analysis performed for the distilled fractions of bio-oil reported in the work of Mancio et al. [21], it is known that the diesel-like hydrocarbon fraction has free fatty acids with a higher carbon chain than the kerosene-like hydrocarbon fraction. Therefore, the FFA adsorption capacity is influenced by the distilled fraction type, since each fraction is characterized by hydrocarbons and oxygenated compounds (mainly carboxylic acids) that increase in carbon chain size as the temperature range increases [60]. This behavior was observed by Silva et al. [33], who found that model samples of distillate petroleum fractions containing simpler and lighter carboxylic acids had higher adsorption capacities for commercial clay, resulting in higher mass transfer coefficient values. Poling et al. [61] reported that diffusion tends to be slower for larger molecules. Therefore, the behavior observed in the present study follows what has been reported in the literature.
Figure 11 and Table 4 provide a clear view of the kinetics behavior of carboxylic acid adsorption in distillate fractions (gasoline-like, kerosene-like, and diesel-like hydrocarbons) using chemically activated red sludge (CARM-1M HCl). Based on Table 4, it is evident that the pseudo-second-order model is the one that best describes the experimental data, as indicated by the high values of R2, all above 0.998 for the three fractions. This result suggests a good agreement between the experimental values of qe (exp.) and the calculated values of qe (calc.), reinforcing this kinetics model’s adequacy in predicting adsorption.
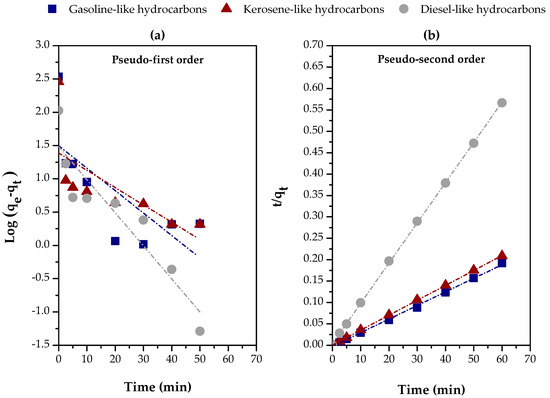
Figure 11.
Evaluation of kinetics models for the adsorption of carboxylic acids in different distillate fractions using chemically activated red mud (CARM-1M): (a) pseudo-first-order and (b) pseudo-second-order.
In terms of efficiency, the gasoline-like hydrocarbon fraction presented the highest hi value (initial adsorption rate), with 1806.7011 mg/g·min, while the diesel-like hydrocarbon fraction obtained the lowest, with 236.4066 mg/g.min, reflecting a lower initial adsorption capacity, possibly due to the greater molecular complexity of this fraction [21] and the lower accessibility of the adsorbent’s active sites [62]. In parallel, in the first 2.5 min, about 95%, 97%, and 84% of the equilibrium adsorption capacity were achieved for gasoline-like, kerosene-like, and diesel-like hydrocarbons, respectively, corroborating the initial adsorption rate values presented in Table 4.
4. Conclusions
The results of the characterization of the six red-mud-based adsorbents (red mud, TARM at 400 °C, TARM at 600 °C, CARM-0.25M HCl, CARM-1M HCl, and CARM-2M HCl) show that the activation method and its conditions have a significant impact on the specific surface area of the adsorbents. Thermal activation at 400 °C was the most effective method to increase surface area compared to non-activated sludge, reaching 35.2450 m2/g. For chemical activation, the best condition was the use of a 0.25M HCl solution, resulting in an area of 84.3290 m2/g, surpassing thermal activation.
The analysis of the results of the different activation methods revealed that chemical activation was the most efficient, achieving a BET area of 84.3290 m2/g. This value is comparable to that of commercial adsorbents, such as polymeric adsorbents, which generally present BET areas ranging from 80 to 700 m2/g. These results highlight the effectiveness of chemical activation in improving the textural properties of red mud.
In the deacidification experiments by adsorption of fractions of gasoline-like hydrocarbons, the red mud chemically activated with HCl (0.25M, 1M, and 2M) showed great potential, with qt higher than 2000 mg/g for the lowest percentage of adsorbent (0.5%). Red mud is an abundant and low-cost industrial byproduct, making it even more attractive as an adsorbent.
The pseudo-second-order kinetics model was the most appropriate to describe the adsorption kinetics, showing high R2 values and an excellent correspondence between the experimental and calculated qe values. The high efficiency of CARM-1M HCl, evidenced by the high values of both qe and hi, reinforces its capacity in deacidification processes of distilled fractions of bio-oil (biofuels), such as gasoline-like hydrocarbons, kerosene-like hydrocarbons, and diesel-like hydrocarbons. Notably, the gasoline-like hydrocarbon fraction achieved the best results, achieving 100% carboxylic acid removal, proving the effectiveness of CARM-1M HCl as an adsorbent in such purification processes.
Therefore, adsorption proved to be efficient as a method of deacidifying biofuels, especially with chemically activated red mud, representing a promising alternative for upgrading biofuels, directly contributing to the catalytic thermal cracking process.
Author Contributions
The individual contributions of all co-authors are provided as follows: N.T.M. contributed with supervision and conceptualization; K.M.B.d.C. contributed with investigation; S.A.P.d.M. contributed with investigation and writing—review and editing; L.E.P.B. contributed to the methodology; A.d.A.M.d.M. contributed with conceptualization, methodology, formal analysis, investigation, writing—original draft preparation, and writing—review and editing. All authors have read and agreed to the published version of the manuscript.
Funding
This work was carried out with the support of the Coordination for the Improvement of Higher Education Personnel-Brazil (CAPES)-Financing Code 001.
Data Availability Statement
The original contributions presented in the study are included in the article, further inquiries can be directed to the corresponding author.
Conflicts of Interest
The authors declare no conflicts of interest.
References
- International Energy Agency (IEA). World Energy Outlook 2023; International Energy Agency (IEA): Paris, France, 2023. [Google Scholar]
- Stedile, T.; Ender, L.; Meier, H.F.; Simionatto, E.L.; Wiggers, V.R. Comparison between Physical Properties and Chemical Composition of Bio-Oils Derived from Lignocellulose and Triglyceride Sources. Renew. Sustain. Energy Rev. 2015, 50, 92–108. [Google Scholar] [CrossRef]
- Wei, Y.; Lei, H.; Wang, L.; Zhu, L.; Zhang, X.; Liu, Y.; Chen, S.; Ahring, B. Liquid–Liquid Extraction of Biomass Pyrolysis Bio-Oil. Energy Fuels 2014, 28, 1207–1212. [Google Scholar] [CrossRef]
- Naji, S.Z.; Tye, C.T.; Abd, A.A. State of the Art of Vegetable Oil Transformation into Biofuels Using Catalytic Cracking Technology: Recent Trends and Future Perspectives. Process Biochem. 2021, 109, 148–168. [Google Scholar] [CrossRef]
- Lima, D.G.; Soares, V.C.D.; Ribeiro, E.B.; Carvalho, D.A.; Cardoso, É.C.V.; Rassi, F.C.; Mundim, K.C.; Rubim, J.C.; Suarez, P.A.Z. Diesel-like Fuel Obtained by Pyrolysis of Vegetable Oils. J. Anal. Appl. Pyrolysis 2004, 71, 987–996. [Google Scholar] [CrossRef]
- Wang, S.; Guo, Z.; Cai, Q.; Guo, L. Catalytic Conversion of Carboxylic Acids in Bio-Oil for Liquid Hydrocarbons Production. Biomass Bioenergy 2012, 45, 138–143. [Google Scholar] [CrossRef]
- Yan, S.; DiMaggio, C.; Wang, H.; Mohan, S.; Kim, M.; Yang, L.; Salley, S.O.; Simon Ng, K.Y. Catalytic Conversion of Triglycerides to Liquid Biofuels Through Transesterification, Cracking, and Hydrotreatment Processes. Curr. Catal. 2012, 1, 41–51. [Google Scholar] [CrossRef]
- Bridgwater, A.V. Review of Fast Pyrolysis of Biomass and Product Upgrading. Biomass Bioenergy 2012, 38, 68–94. [Google Scholar] [CrossRef]
- Chan, Y.H.; Loh, S.K.; Chin, B.L.F.; Yiin, C.L.; How, B.S.; Cheah, K.W.; Wong, M.K.; Loy, A.C.M.; Gwee, Y.L.; Lo, S.L.Y.; et al. Fractionation and Extraction of Bio-Oil for Production of Greener Fuel and Value-Added Chemicals: Recent Advances and Future Prospects. Chem. Eng. J. 2020, 397, 125406. [Google Scholar] [CrossRef]
- Wang, S. High-Efficiency Separation of Bio-Oil. In Biomass Now—Sustainable Growth and Use; Matovic, M.D., Ed.; InTech: London, UK, 2013; pp. 401–418. [Google Scholar]
- Huber, G.W.; Iborra, S.; Corma, A. Synthesis of Transportation Fuels from Biomass: Chemistry, Catalysts, and Engineering. Chem. Rev. 2006, 106, 4044–4098. [Google Scholar] [CrossRef]
- Zhang, L.; Liu, R.H.; Yin, R.Z.; Mei, Y.F. Upgrading of Bio-Oil from Biomass Fast Pyrolysis in China: A Review. Renew. Sustain. Energy Rev. 2013, 24, 66–72. [Google Scholar] [CrossRef]
- Xiu, S.N.; Shahbazi, A. Bio-Oil Production and Upgrading Research: A Review. Renew. Sustain. Energy Rev. 2012, 16, 4406–4414. [Google Scholar] [CrossRef]
- Shamsul, N.S.; Kamarudin, S.K.; Rahman, N.A. Conversion of Bio-Oil to Bio Gasoline via Pyrolysis and Hydrothermal: A Review. Renew. Sustain. Energy Rev. 2017, 80, 538–549. [Google Scholar] [CrossRef]
- Baloch, H.A.; Nizamuddin, S.; Siddiqui, M.T.H.; Riaz, S.; Jatoi, A.S.; Dumbre, D.K.; Mubarak, N.M.; Srinivasan, M.P.; Griffin, G.J. Recent Advances in Production and Upgrading of Bio-Oil from Biomass: A Critical Overview. J. Environ. Chem. Eng. 2018, 6, 5101–5118. [Google Scholar] [CrossRef]
- Jacobson, K.; Maheria, K.C.; Dalai, A.K. Bio-Oil Valorization: A Review. Renew. Sustain. Energy Rev. 2013, 23, 91–106. [Google Scholar] [CrossRef]
- Hu, X.; Gunawan, R.; Mourant, D.; Hasan, M.D.M.; Wu, L.; Song, Y.; Lievens, C.; Li, C.-Z. Upgrading of Bio-Oil via Acid-Catalyzed Reactions in Alcohols—A Mini Review. Fuel Process. Technol. 2017, 155, 2–19. [Google Scholar] [CrossRef]
- Leng, L.; Li, H.; Yuan, X.; Zhou, W.; Huang, H. Bio-Oil Upgrading by Emulsification/Microemulsification: A Review. Energy 2018, 161, 214–232. [Google Scholar] [CrossRef]
- Gharib, J.; Pang, S.; Holland, D. Synthesis and Characterisation of Polyurethane Made from Pyrolysis Bio-Oil of Pine Wood. Eur. Polym. J. 2020, 133, 109725. [Google Scholar] [CrossRef]
- Prado, C.M.R.; Antoniosi Filho, N.R. Production and Characterization of the Biofuels Obtained by Thermal Cracking and Thermal Catalytic Cracking of Vegetable Oils. J. Anal. Appl. Pyrolysis 2009, 86, 338–347. [Google Scholar] [CrossRef]
- Mancio, A.A.; da Mota, S.A.P.; Ferreira, C.C.; Carvalho, T.U.S.; Neto, O.S.; Zamian, J.R.; Araújo, M.E.; Borges, L.E.P.; Machado, N.T. Separation and Characterization of Biofuels in the Jet Fuel and Diesel Fuel Ranges by Fractional Distillation of Organic Liquid Products. Fuel 2018, 215, 212–225. [Google Scholar] [CrossRef]
- Da Mota, S.A.P.; Mancio, A.A.; Lhamas, D.E.L.; de Abreu, D.H.; da Silva, M.S.; dos Santos, W.G.; de Castro, D.A.R.; de Oliveira, R.M.; Araújo, M.E.; Borges, L.E.P.; et al. Production of Green Diesel by Thermal Catalytic Cracking of Crude Palm Oil (Elaeis guineensis Jacq) in a Pilot Plant. J. Anal. Appl. Pyrolysis 2013, 110, 1–11. [Google Scholar] [CrossRef]
- Stanford, J.P.; Hall, P.H.; Rover, M.R.; Smith, R.G.; Brown, R.C. Separation of Sugars and Phenolics from the Heavy Fraction of Bio-Oil Using Polymeric Resin Adsorbents. Sep. Purif. Technol. 2018, 194, 170–180. [Google Scholar] [CrossRef]
- Li, Y.; Shao, J.; Wang, X.; Yang, H.; Chen, Y.; Deng, Y.; Zhang, S.; Chen, H. Upgrading of Bio-Oil: Removal of the Fermentation Inhibitor (Furfural) from the Model Compounds of Bio-Oil Using Pyrolytic Char. Energy Fuels 2013, 27, 5975–5981. [Google Scholar] [CrossRef]
- Church, A.L.; Hu, M.Z.; Lee, S.J.; Wang, H.; Liu, J. Selective Adsorption Removal of Carbonyl Molecular Foulants from Real Fast Pyrolysis Bio-Oils. Biomass Bioenergy 2020, 136, 105522. [Google Scholar] [CrossRef]
- Li, C.; Jiang, D.; Yang, X.; Babadi, A.A.; Wang, S.; Gong, X. Selective Adsorption of Carbonyl Compounds from Bio-Oil by Seaweed-Derived Carbon: A Theoretical Study. J. Anal. Appl. Pyrolysis 2023, 173, 106092. [Google Scholar] [CrossRef]
- Zhang, M.; Shen, Q.; Wu, H. Adsorption Characteristics of Bio-Oil on Biochar in Bioslurry Fuels. Energy Fuels 2017, 31, 9619–9626. [Google Scholar] [CrossRef]
- Yan, S.; Chen, H.; Zhu, H.; Lin, Z.; Wu, G.; Gao, W.; Zhang, H.; Hu, X.; Zhang, J.; Zhang, S.; et al. Enhanced Adsorption of Bio-Oil on Activated Biochar in Slurry Fuels and the Adsorption Selectivity. Fuel 2023, 338, 127224. [Google Scholar] [CrossRef]
- Widjaja, C.; Djojorahardjo, Y.; Kurniawan, A.; Soetaredjo, F.E. Biorefinery concept on jackfruit peel waste: Bio-oil upgrading. ARPN J. Eng. Appl. Sci. 2018, 13, 2202–2207. [Google Scholar]
- Sedai, B.; Zhou, J.L.; Fakhri, N.; Sayari, A.; Baker, R.T. Solid Phase Extraction of Bio-Oil Model Compounds and Lignin-Derived Bio-Oil Using Amine-Functionalized Mesoporous Silicas. ACS Sustain. Chem. Eng. 2018, 6, 9716–9724. [Google Scholar] [CrossRef]
- Nam, H.; Choi, W.; Genuino, D.A.; Capareda, S.C. Development of Rice Straw Activated Carbon and Its Utilizations. J. Environ. Chem. Eng. 2018, 6, 5221–5229. [Google Scholar] [CrossRef]
- Li, F.; Katz, L.; Qiu, S. Adsorptive Selectivity and Mechanism of Three Different Adsorbents for Nitrogenous Compounds Removal from Microalgae Bio-Oil. Ind. Eng. Chem. Res. 2019, 58, 3959–3968. [Google Scholar] [CrossRef]
- Silva, J.P.; Costa, A.L.H.; Chiaro, S.S.X.; Delgado, B.E.P.C.; de Figueiredo, M.A.G.; Senna, L.F. Carboxylic Acid Removal from Model Petroleum Fractions by a Commercial Clay Adsorbent. Fuel Process. Technol. 2013, 112, 57–63. [Google Scholar] [CrossRef]
- Silva, J.P.; de Senna, L.F.; do Lago, D.C.B.; da Silva, P.F., Jr.; Dias, E.G.; de Figueiredo, M.A.G.; Chiaro, S.S.X. Characterization of Commercial Ceramic Adsorbents and Its Application on Naphthenic Acids Removal of Petroleum Distillates. Mater. Res. 2007, 10, 219–225. [Google Scholar] [CrossRef]
- Wu, W.-L.; Tan, Z.-Q.; Wu, G.-J.; Yuan, L.; Zhu, W.-L.; Bao, Y.-L.; Pan, L.-Y.; Yang, Y.-J.; Zheng, J.-X. Deacidification of Crude Low-Calorie Cocoa Butter with Liquid–Liquid Extraction and Strong-Base Anion Exchange Resin. Sep. Purif. Technol. 2013, 102, 163–172. [Google Scholar] [CrossRef]
- Deboni, T.M.; Batista, E.A.C.; Meirelles, A.J.A. Equilibrium, Kinetics, and Thermodynamics of Soybean Oil Deacidification Using a Strong Anion Exchange Resin. Ind. Eng. Chem. Res. 2015, 54, 11167–11179. [Google Scholar] [CrossRef]
- Manuale, D.L.; Torres, G.C.; Badano, J.M.; Vera, C.R.; Yori, J.C. Adjustment of the Biodiesel Free Fatty Acids Content by Means of Adsorption. Energy Fuels 2013, 27, 6763–6772. [Google Scholar] [CrossRef]
- ASTM D974; Standard Test Method for Acid and Base Number by Color-Indicator Titration. ASTM International: West Conshohocken, PA, USA, 2022.
- Lagergren, S. About the Theory of So-Called Adsorption of Soluble Substances. K. Sven. Vetenskapsakademiens Handl. 1898, 24, 1–39. [Google Scholar]
- Ho, Y.-S.; McKay, G. Kinetic Models for the Sorption of Dye from Aqueous Solution by Wood. Process Saf. Environ. Prot. 1998, 76, 183–191. [Google Scholar] [CrossRef]
- Antunes, M.L.P.; Conceição, F.T.; Navarro, G.R.B.; Fernandes, A.M.; Durrant, S.F. Use of Red Mud Activated at Different Temperatures as a Low Cost Adsorbent of Reactive Dye. Eng. Sanit. Ambient. 2021, 26, 805–811. [Google Scholar] [CrossRef]
- Fang, H.; Liang, W.; Ma, L.; Ma, C. Properties and Characterization of Red Mud Modified by Hydrochloric, Sulfuric, and Nitric Acid for the Catalytic Oxidation of Toluene. J. Environ. Chem. Eng. 2023, 11, 110943. [Google Scholar] [CrossRef]
- Castaldi, P.; Silvetti, M.; Enzo, S.; Melis, P. Study of Sorption Processes and FT-IR Analysis of Arsenate Sorbed onto Red Muds (a Bauxite Ore Processing Waste). J. Hazard. Mater. 2010, 175, 172–178. [Google Scholar] [CrossRef]
- Wang, P.; Liu, D.-Y. Physical and Chemical Properties of Sintering Red Mud and Bayer Red Mud and the Implications for Beneficial Utilization. Materials 2012, 5, 1800–1810. [Google Scholar] [CrossRef]
- Castaldi, P.; Silvetti, M.; Santona, L.; Enzo, S.; Melis, P. XRD, FTIR, and Thermal Analysis of Bauxite Ore-Processing Waste (Red Mud) Exchanged with Heavy Metals. Clays Clay Miner. 2008, 56, 461–469. [Google Scholar] [CrossRef]
- Almeida, A.C.M.; do Nascimento, R.A.; Amador, I.C.B.; de Sousa Santos, T.C.; Martelli, M.C.; de Faria, L.J.G.; Ribeiro, N.F.d.P. Chemically Activated Red Mud: Assessing Structural Modifications and Optimizing Adsorption Properties for Hexavalent Chromium. Colloids Surf. A Physicochem. Eng. Asp. 2021, 628, 127325. [Google Scholar] [CrossRef]
- Kurtoğlu, S.F.; Soyer-Uzun, S.; Uzun, A. Tuning Structural Characteristics of Red Mud by Simple Treatments. Ceram. Int. 2016, 42, 17581–17593. [Google Scholar] [CrossRef]
- Thommes, M.; Kaneko, K.; Neimark, A.V.; Olivier, J.P.; Rodriguez-Reinoso, F.; Rouquerol, J.; Sing, K.S.W. Physisorption of Gases, with Special Reference to the Evaluation of Surface Area and Pore Size Distribution (IUPAC Technical Report). Pure Appl. Chem. 2015, 87, 1051–1069. [Google Scholar] [CrossRef]
- Brunauer, S.; Deming, L.S.; Deming, W.E.; Teller, E. On a Theory of the van der Waals Adsorption of Gases. J. Am. Chem. Soc 1940, 62, 1723–1732. [Google Scholar] [CrossRef]
- Suzuki, M. Adsorption Engineering; Elsevier: Amsterdam, The Netherlands, 1989; ISBN 0444988025. [Google Scholar]
- Sushil, S.; Batra, V.S. Catalytic Applications of Red Mud, an Aluminium Industry Waste: A Review. Appl. Catal. B 2008, 81, 64–77. [Google Scholar] [CrossRef]
- Liu, Q.; Xin, R.; Li, C.; Xu, C.; Yang, J. Application of Red Mud as a Basic Catalyst for Biodiesel Production. J. Environ. Sci 2013, 25, 823–829. [Google Scholar] [CrossRef]
- Garcia, M.C.S. Modificação do Resíduo de Bauxita Gerado no Processo Bayer por Tratamento Térmico. Ph.D. Thesis, Universidade de São Paulo, São Paulo, Brazil, 2012. [Google Scholar]
- Al-Asheh, S.; Banat, F.; Abu-Aitah, L. Adsorption of Phenol Using Different Types of Activated Bentonites. Sep. Purif. Technol. 2003, 33, 1–10. [Google Scholar] [CrossRef]
- Jean Baptiste, B.M.; Daniele, B.K.; Marie Charlène, E.; Larrissa Canuala, T.T.; Antoine, E.; Richard, K. Adsorption Mechanisms of Pigments and Free Fatty Acids in the Discoloration of Shea Butter and Palm Oil by an Acid-Activated Cameroonian Smectite. Sci. Afr. 2020, 9, e00498. [Google Scholar] [CrossRef]
- López-Velandia, C.; Moreno-Barbosa, J.; Sierra-Ramirez, R.; Giraldo, L.; Moreno-Piraján, J. Adsorption of Volatile Carboxylic Acids on Activated Carbon Synthesized from Watermelon Shells. Adsorpt. Sci. Technol. 2014, 32, 227–242. [Google Scholar] [CrossRef]
- Zhang, H.; Peng, B.; Liu, Q.; Wu, C.; Li, Z. Preparation of Porous Biochar from Heavy Bio-Oil for Adsorption of Methylene Blue in Wastewater. Fuel Process. Technol. 2022, 238, 107485. [Google Scholar] [CrossRef]
- Rafiq, S.; Wongrod, S.; Vinitnantharat, S. Adsorption Kinetics of Cadmium and Lead by Biochars in Single- and Bisolute Brackish Water Systems. ACS Omega 2023, 8, 45262–45276. [Google Scholar] [CrossRef]
- Li, J.; Dong, X.; Liu, X.; Xu, X.; Duan, W.; Park, J.; Gao, L.; Lu, Y. Comparative Study on the Adsorption Characteristics of Heavy Metal Ions by Activated Carbon and Selected Natural Adsorbents. Sustainability 2022, 14, 15579. [Google Scholar] [CrossRef]
- Machado, N.T.; Mota, A.d.A.M.d.; Santanna, J.d.S.; Gama, V.d.J.P.d.; Zamian, J.R.; Borges, L.E.P.; Mota, S.A.P.d. Catalytic Cracking of Palm Oil: Effect of Catalyst Reuse and Reaction Time of the Quality of Biofuels-like Fractions. Energies 2023, 16, 7063. [Google Scholar] [CrossRef]
- Poling, B.E.; Prausnitz, J.M.; O’connell, J.P. The Properties of Gases and Liquids; Mcgraw-hill: New York, NY, USA, 2001; Volume 5. [Google Scholar]
- Shou, J.; Qiu, M. Adsorption Kinetics of Phenol in Aqueous Solution onto Activated Carbon from Wheat Straw Lignin. Desalination Water Treat. 2016, 57, 3119–3124. [Google Scholar] [CrossRef]
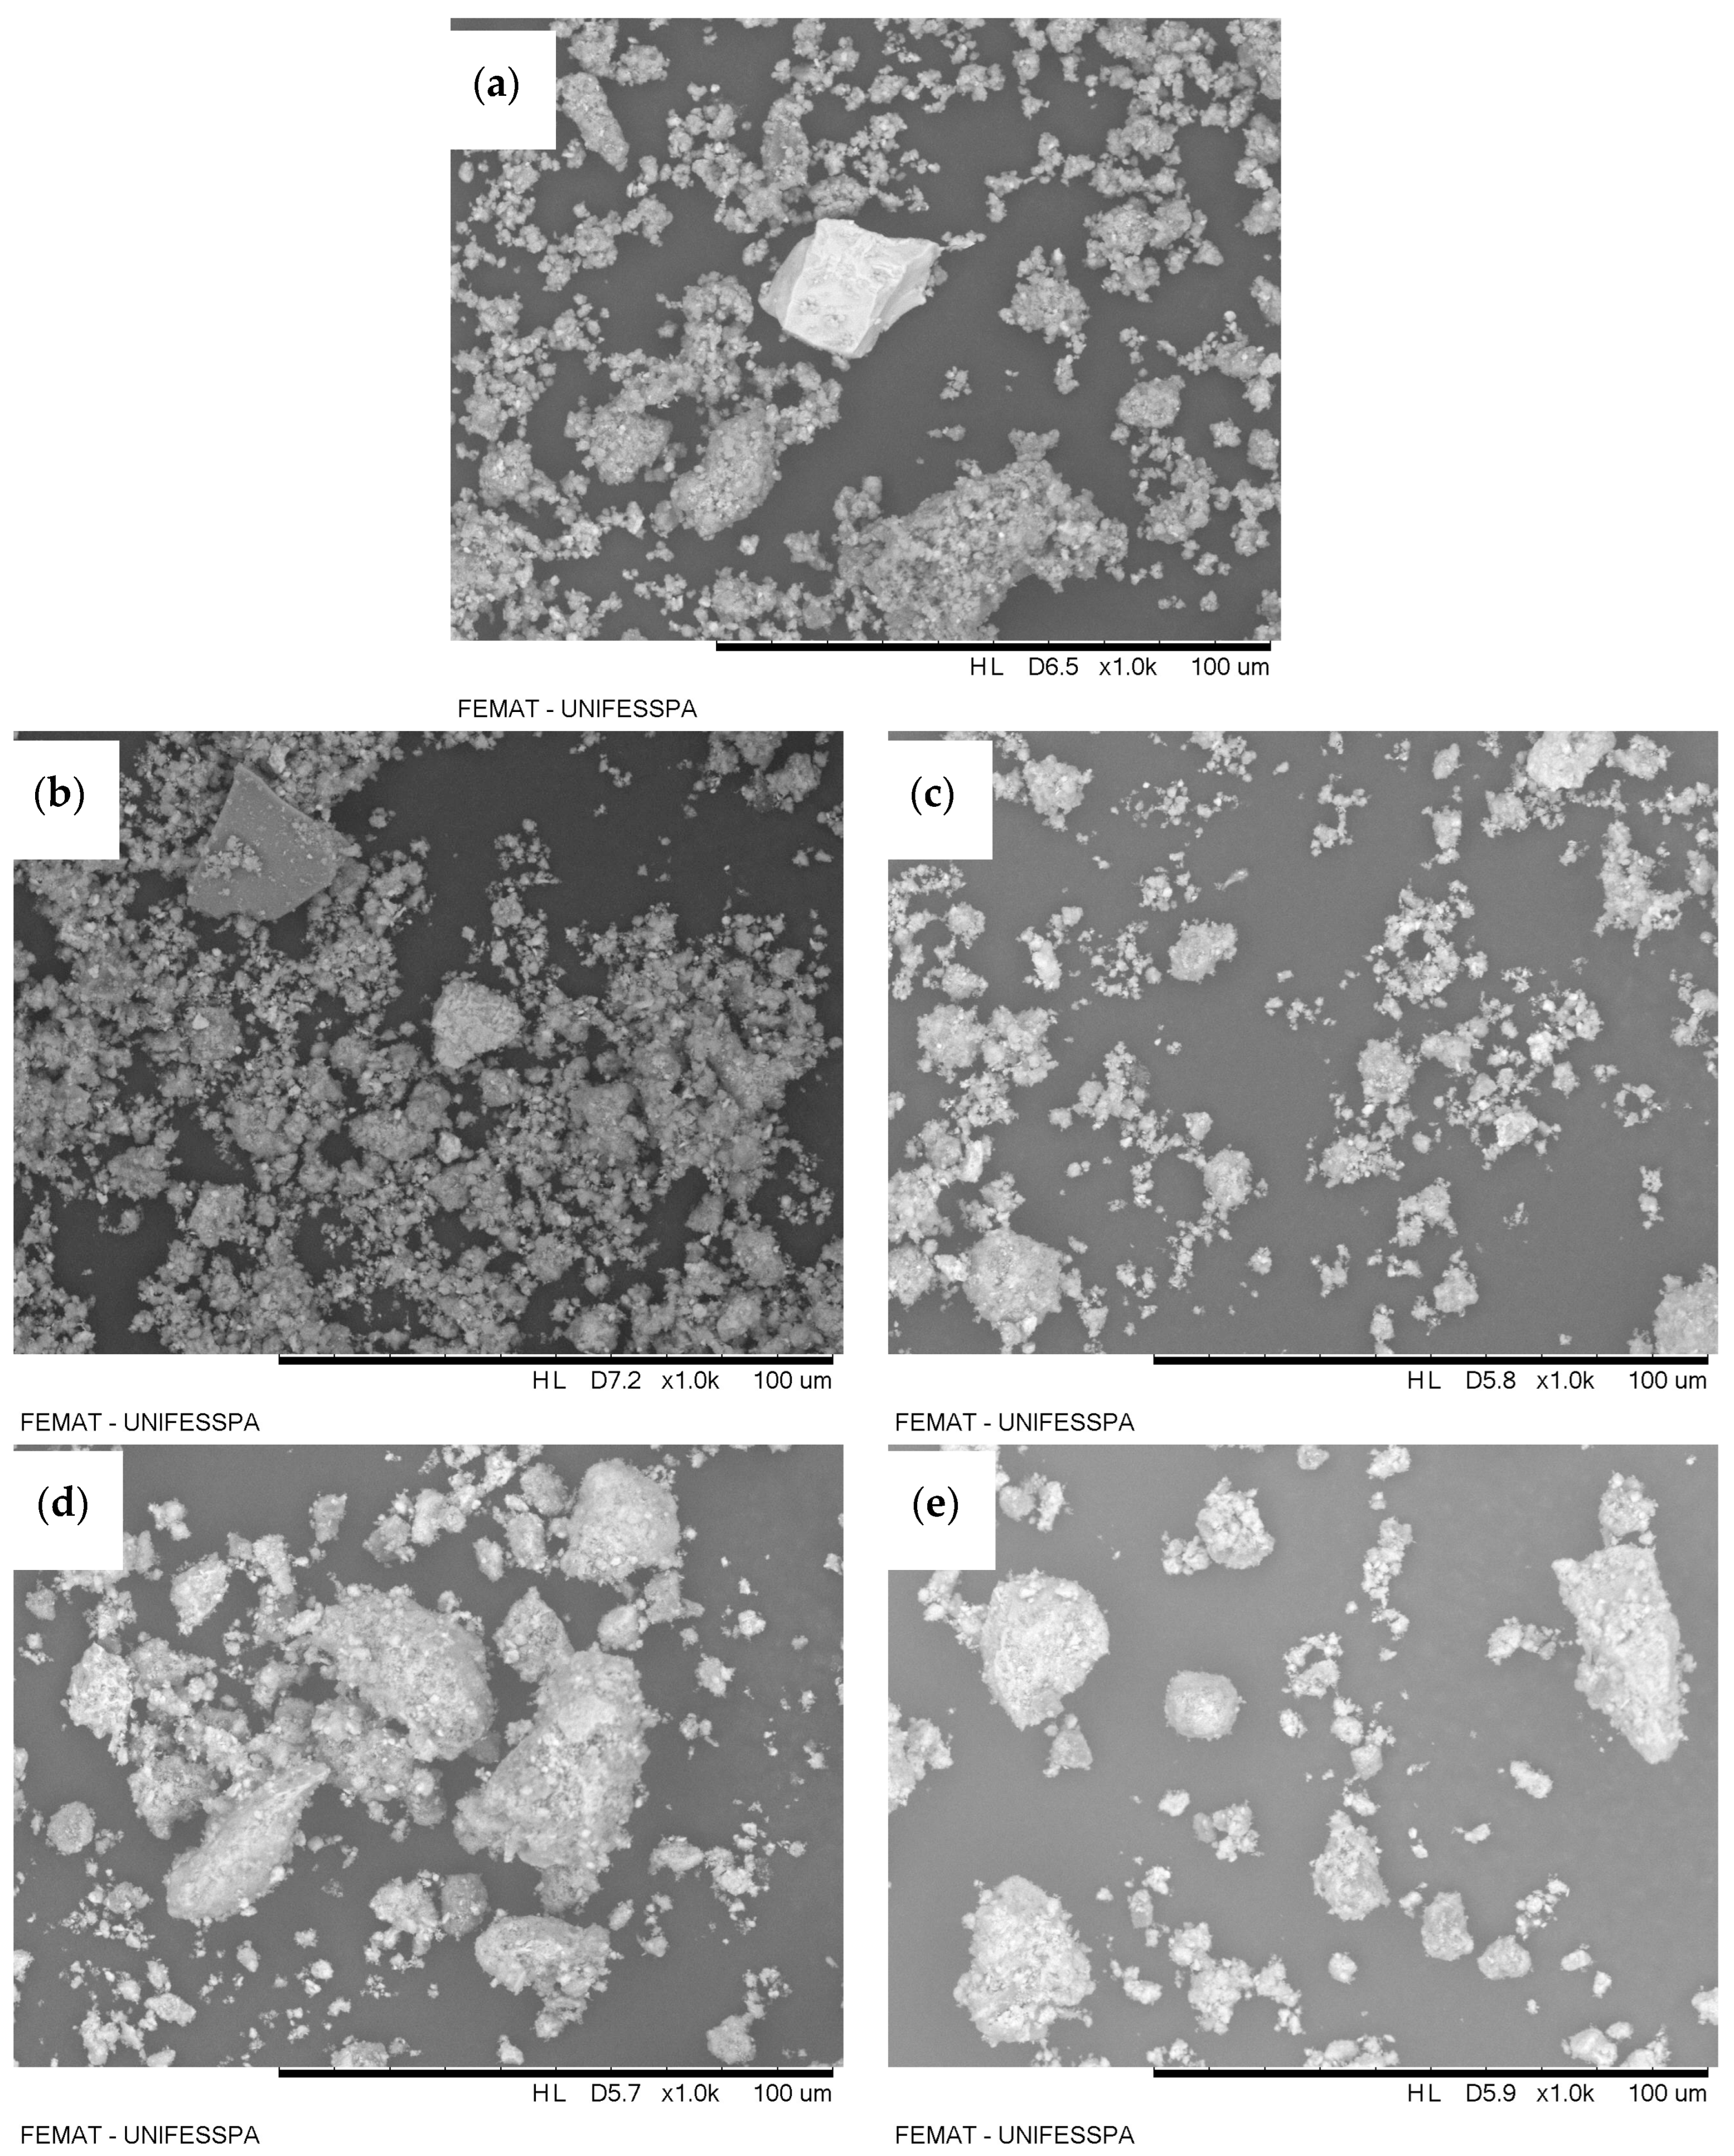
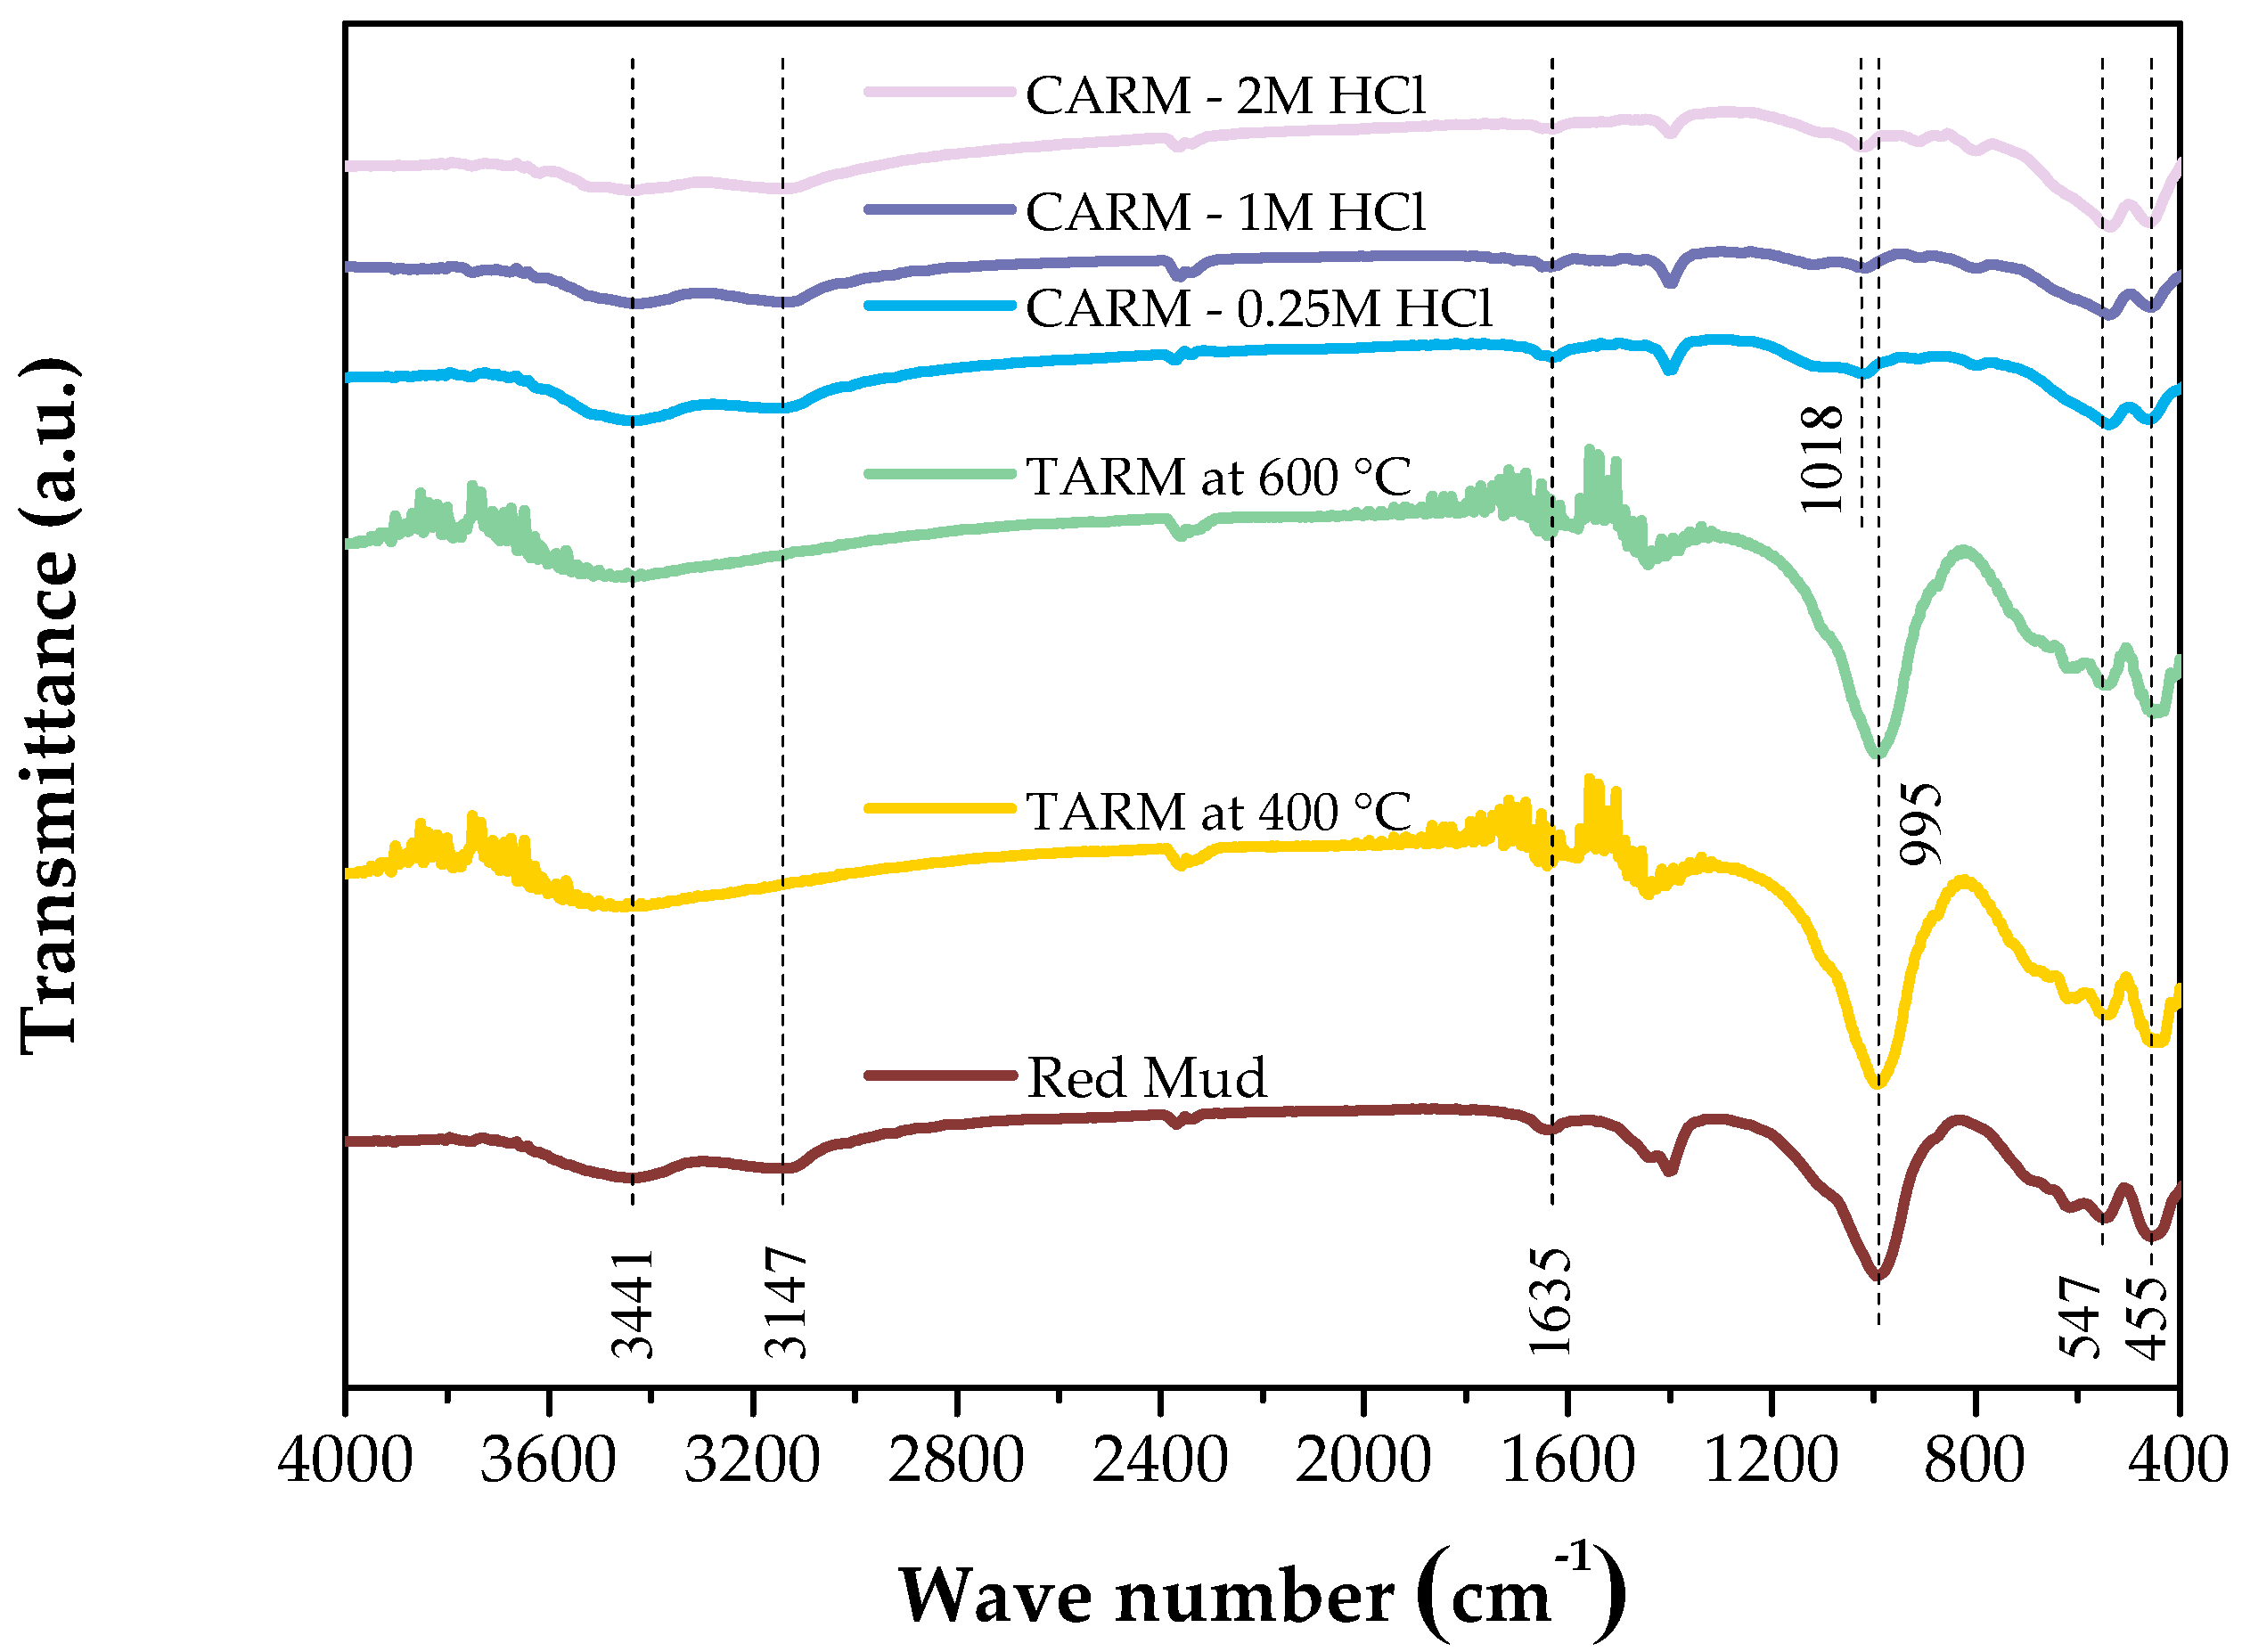
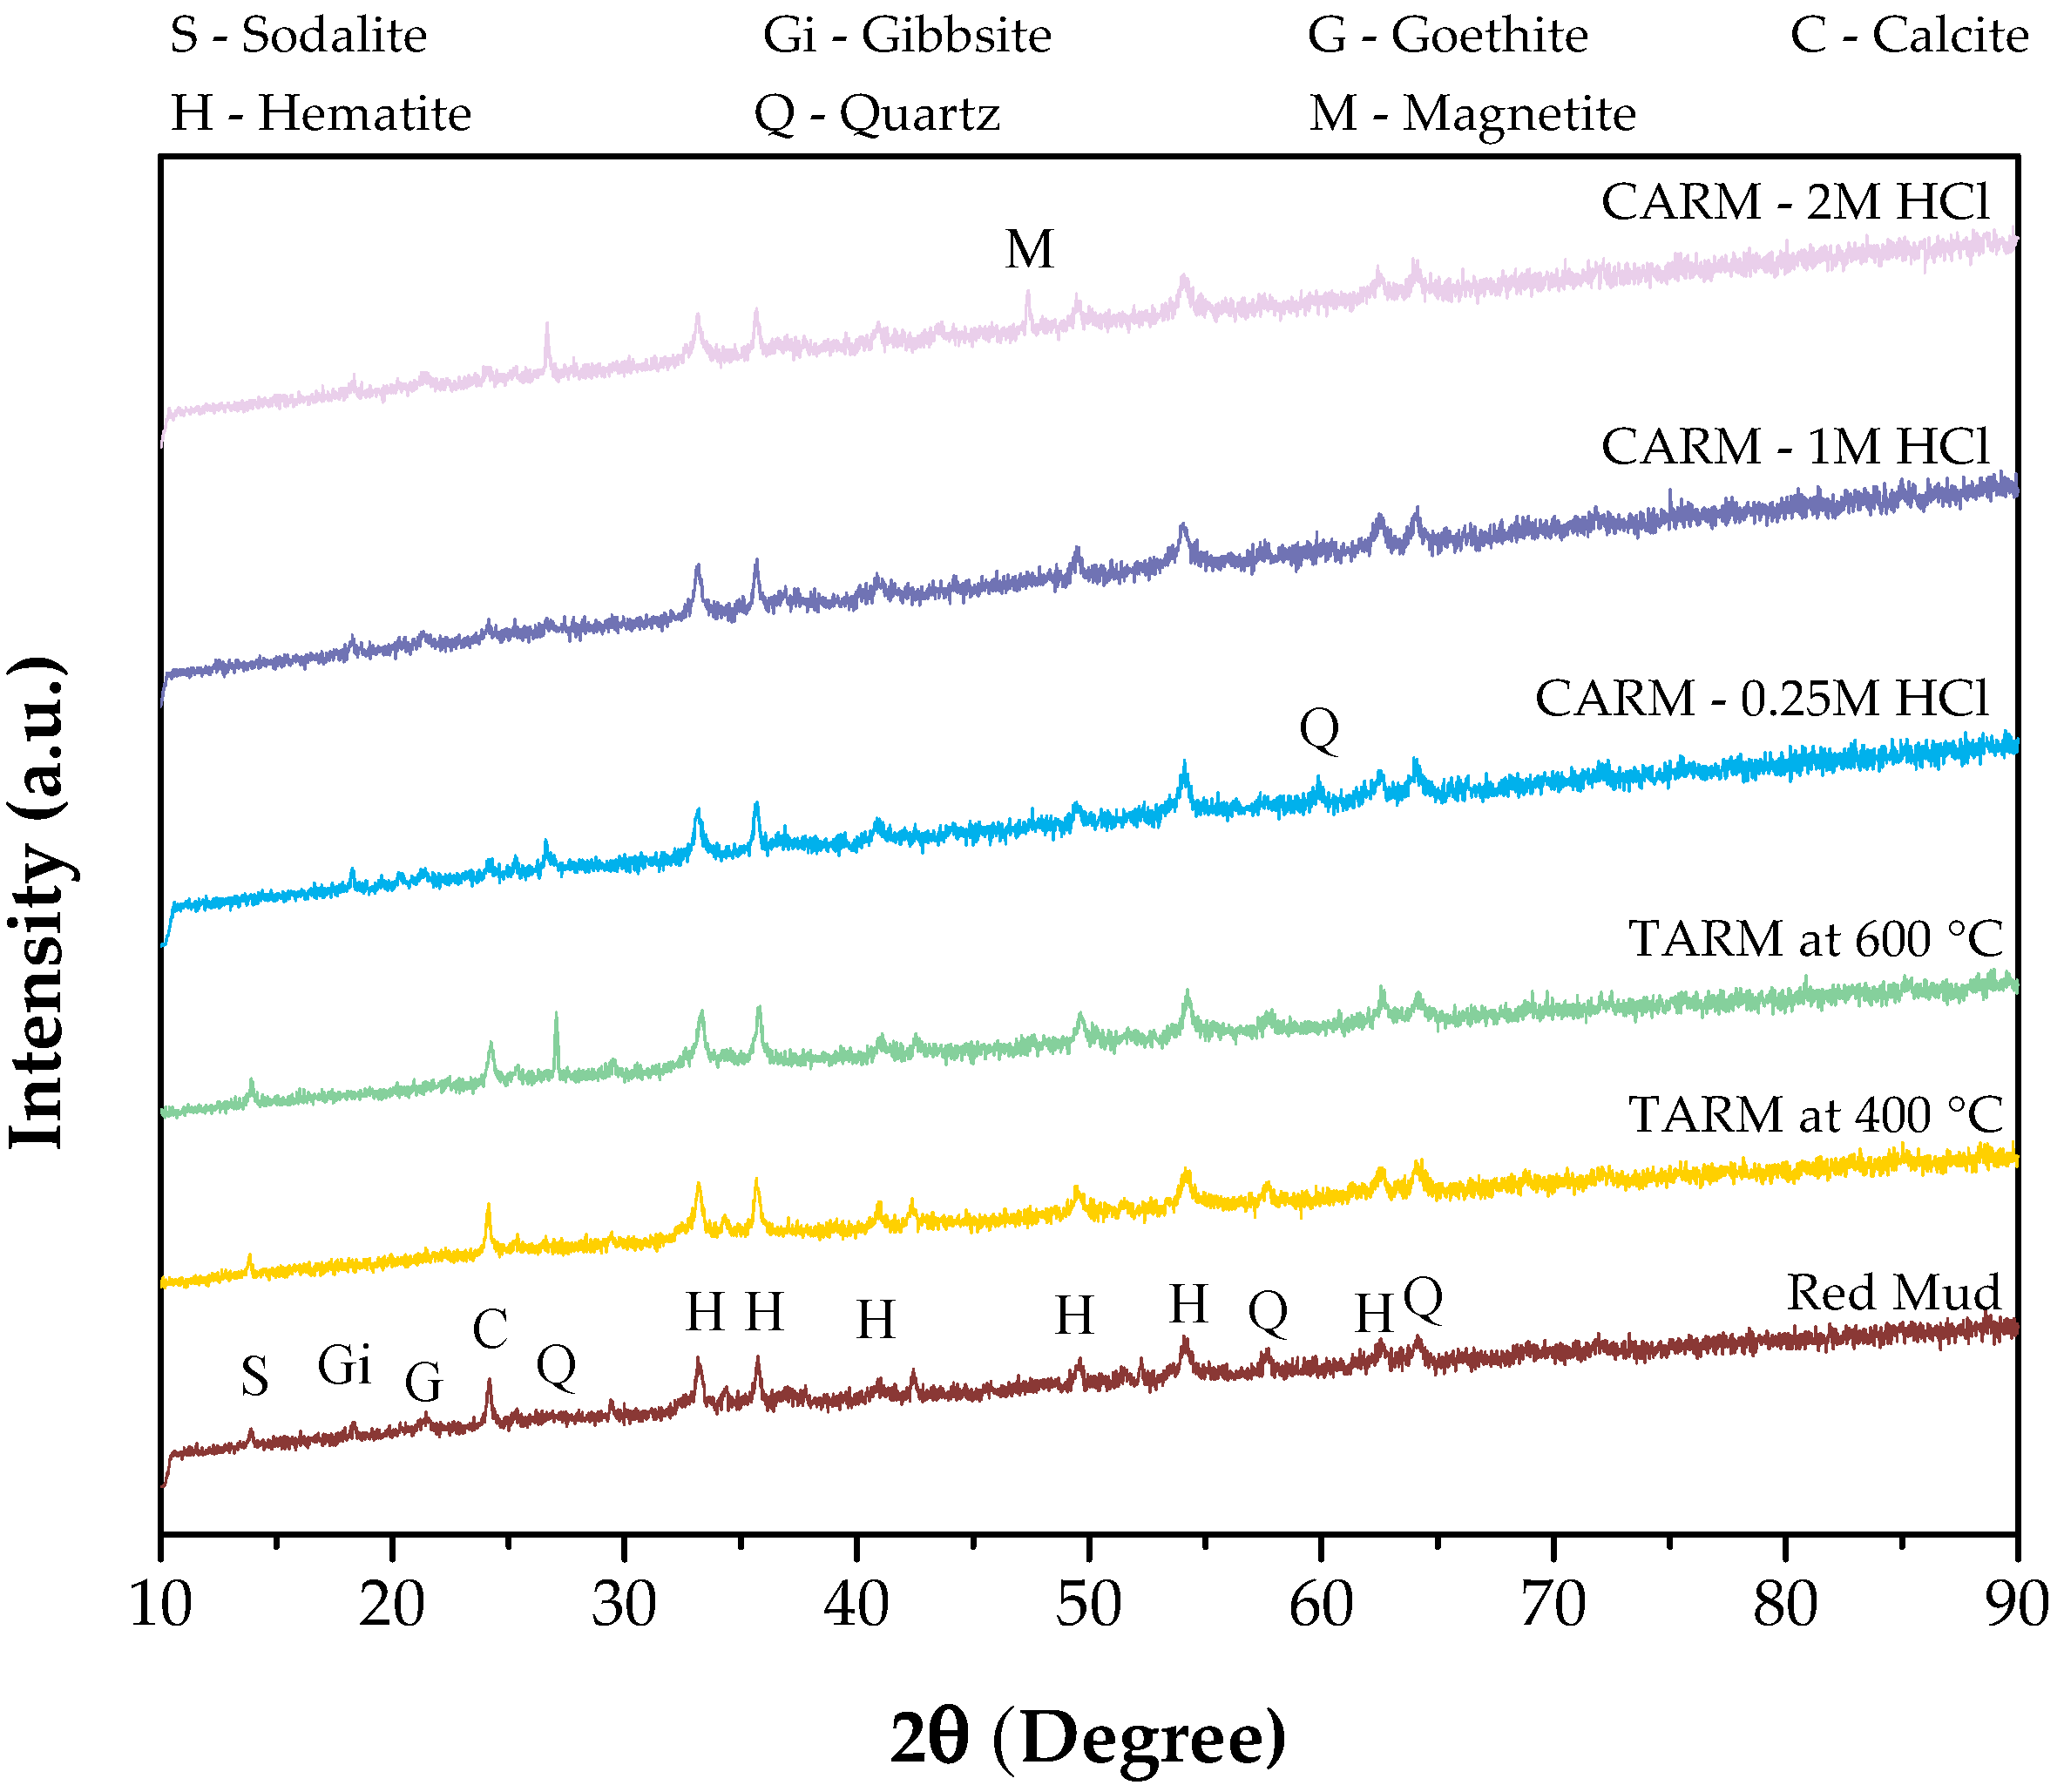
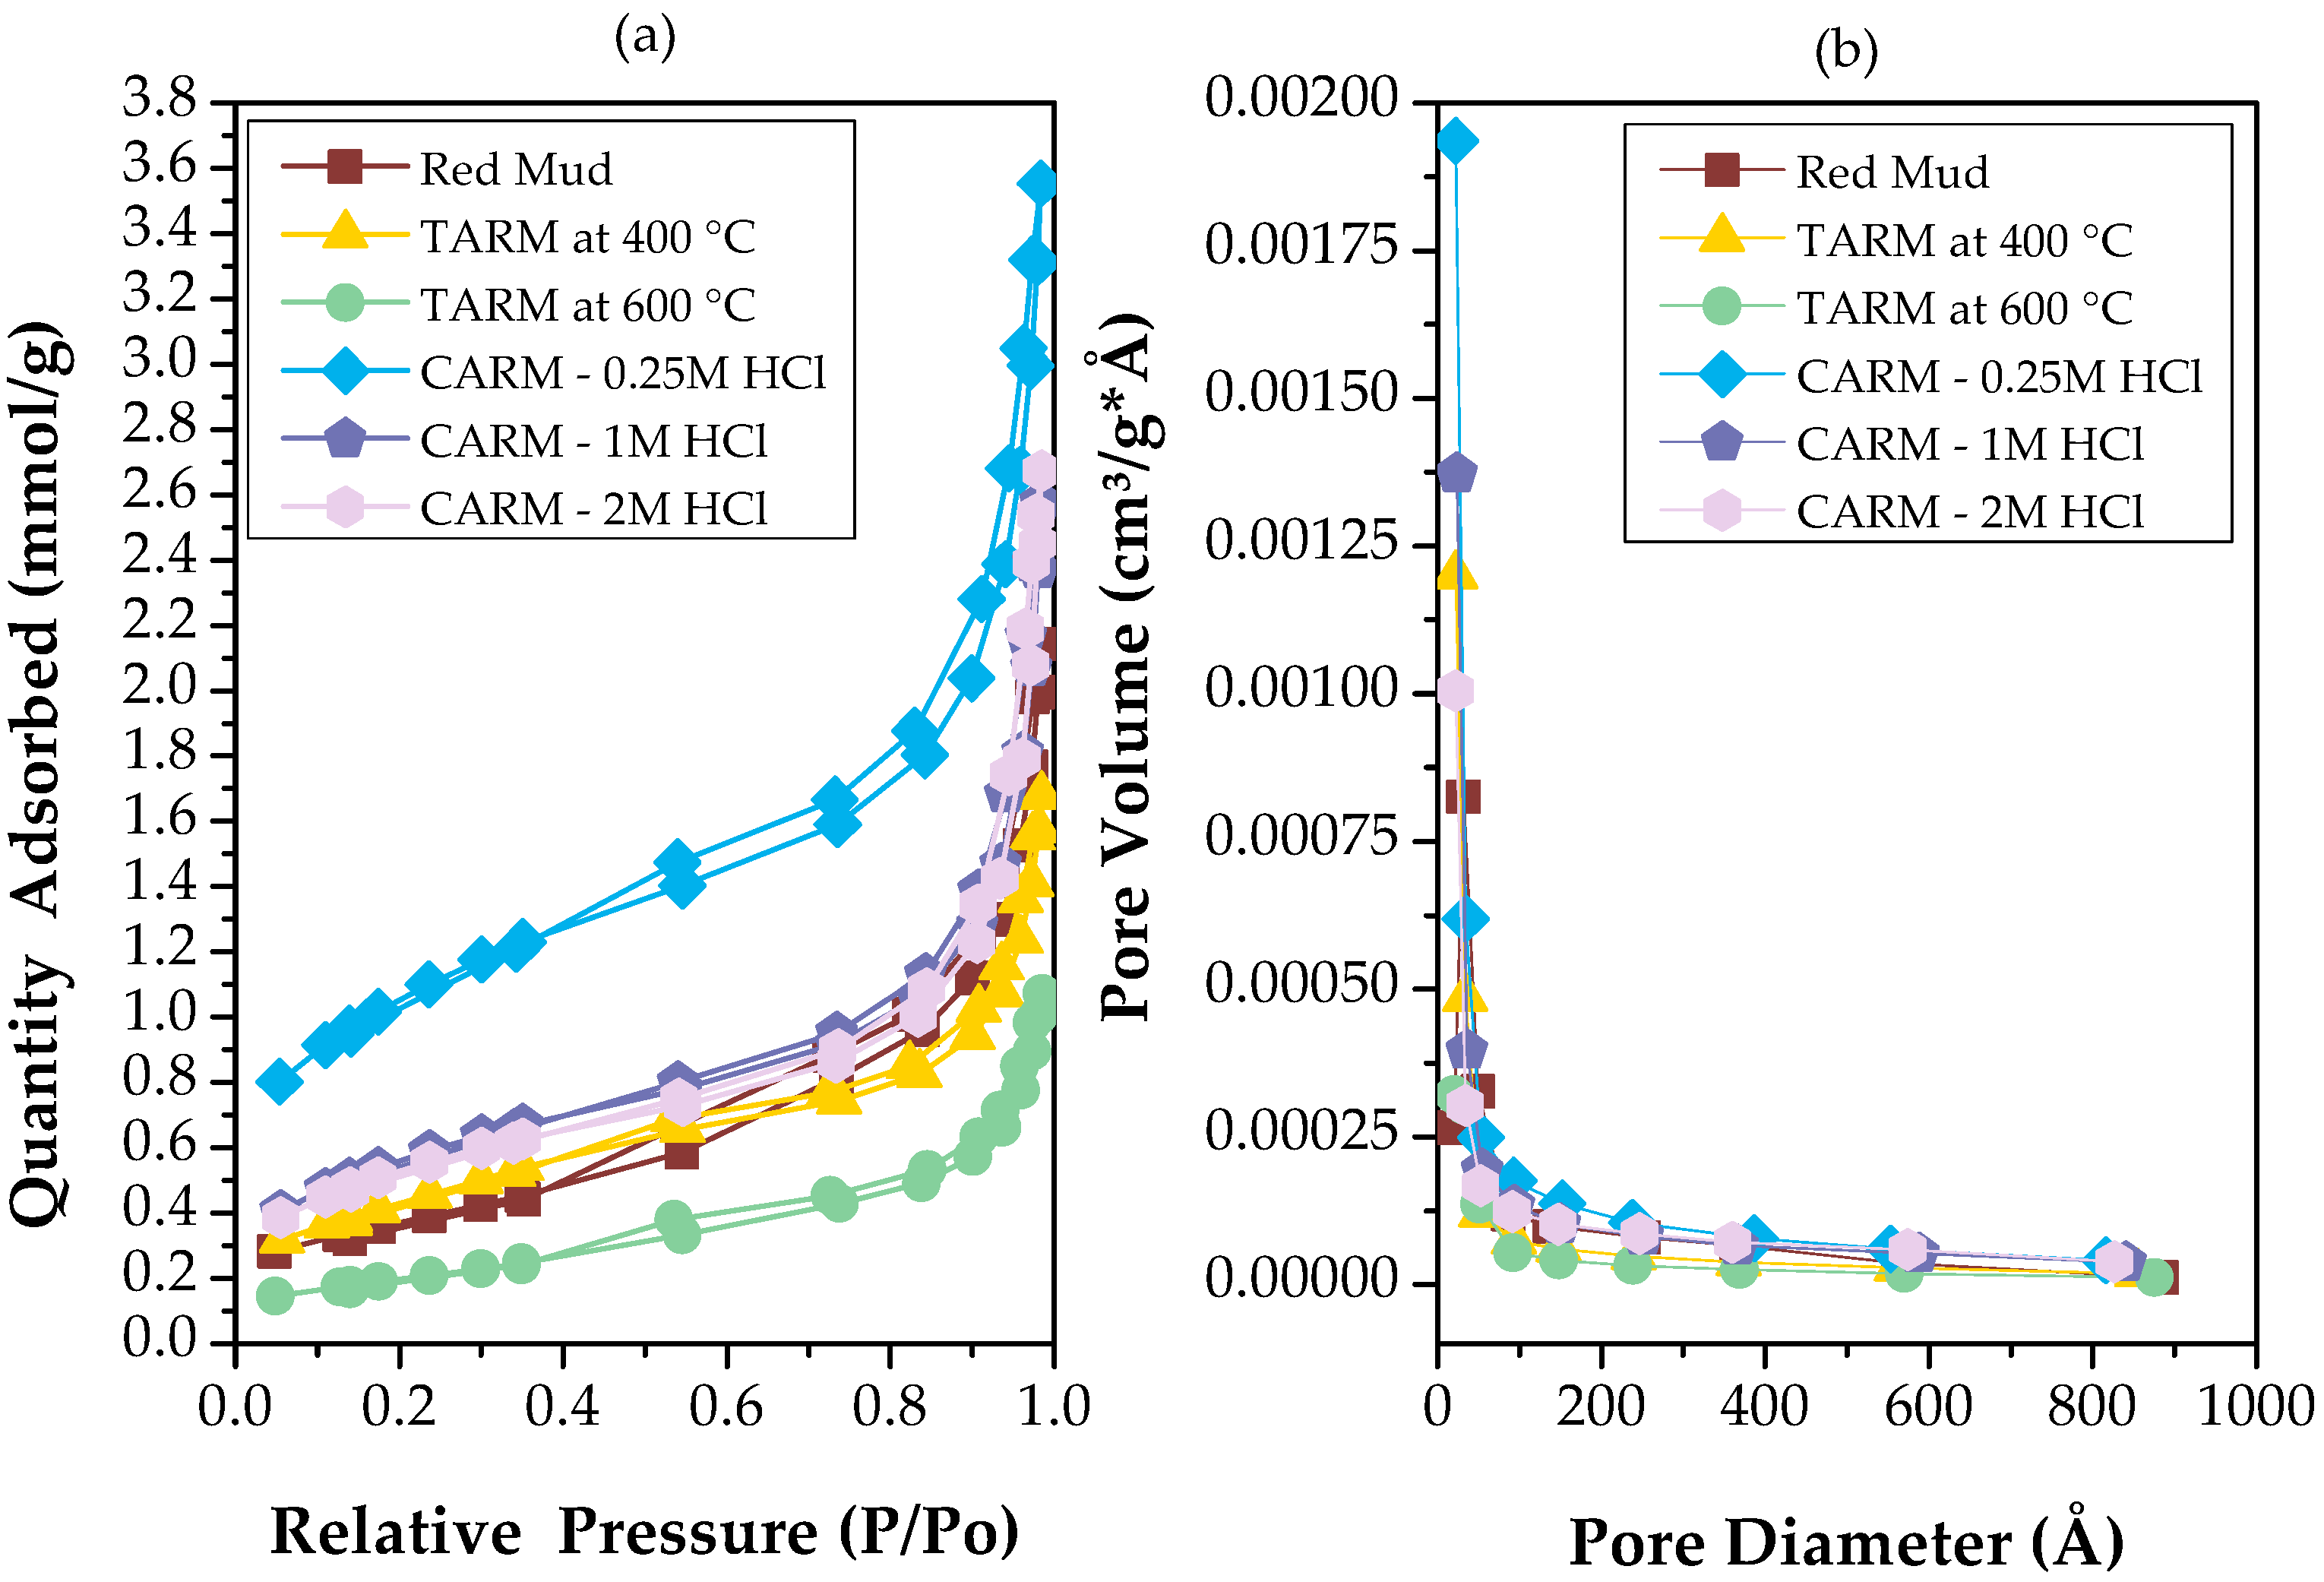
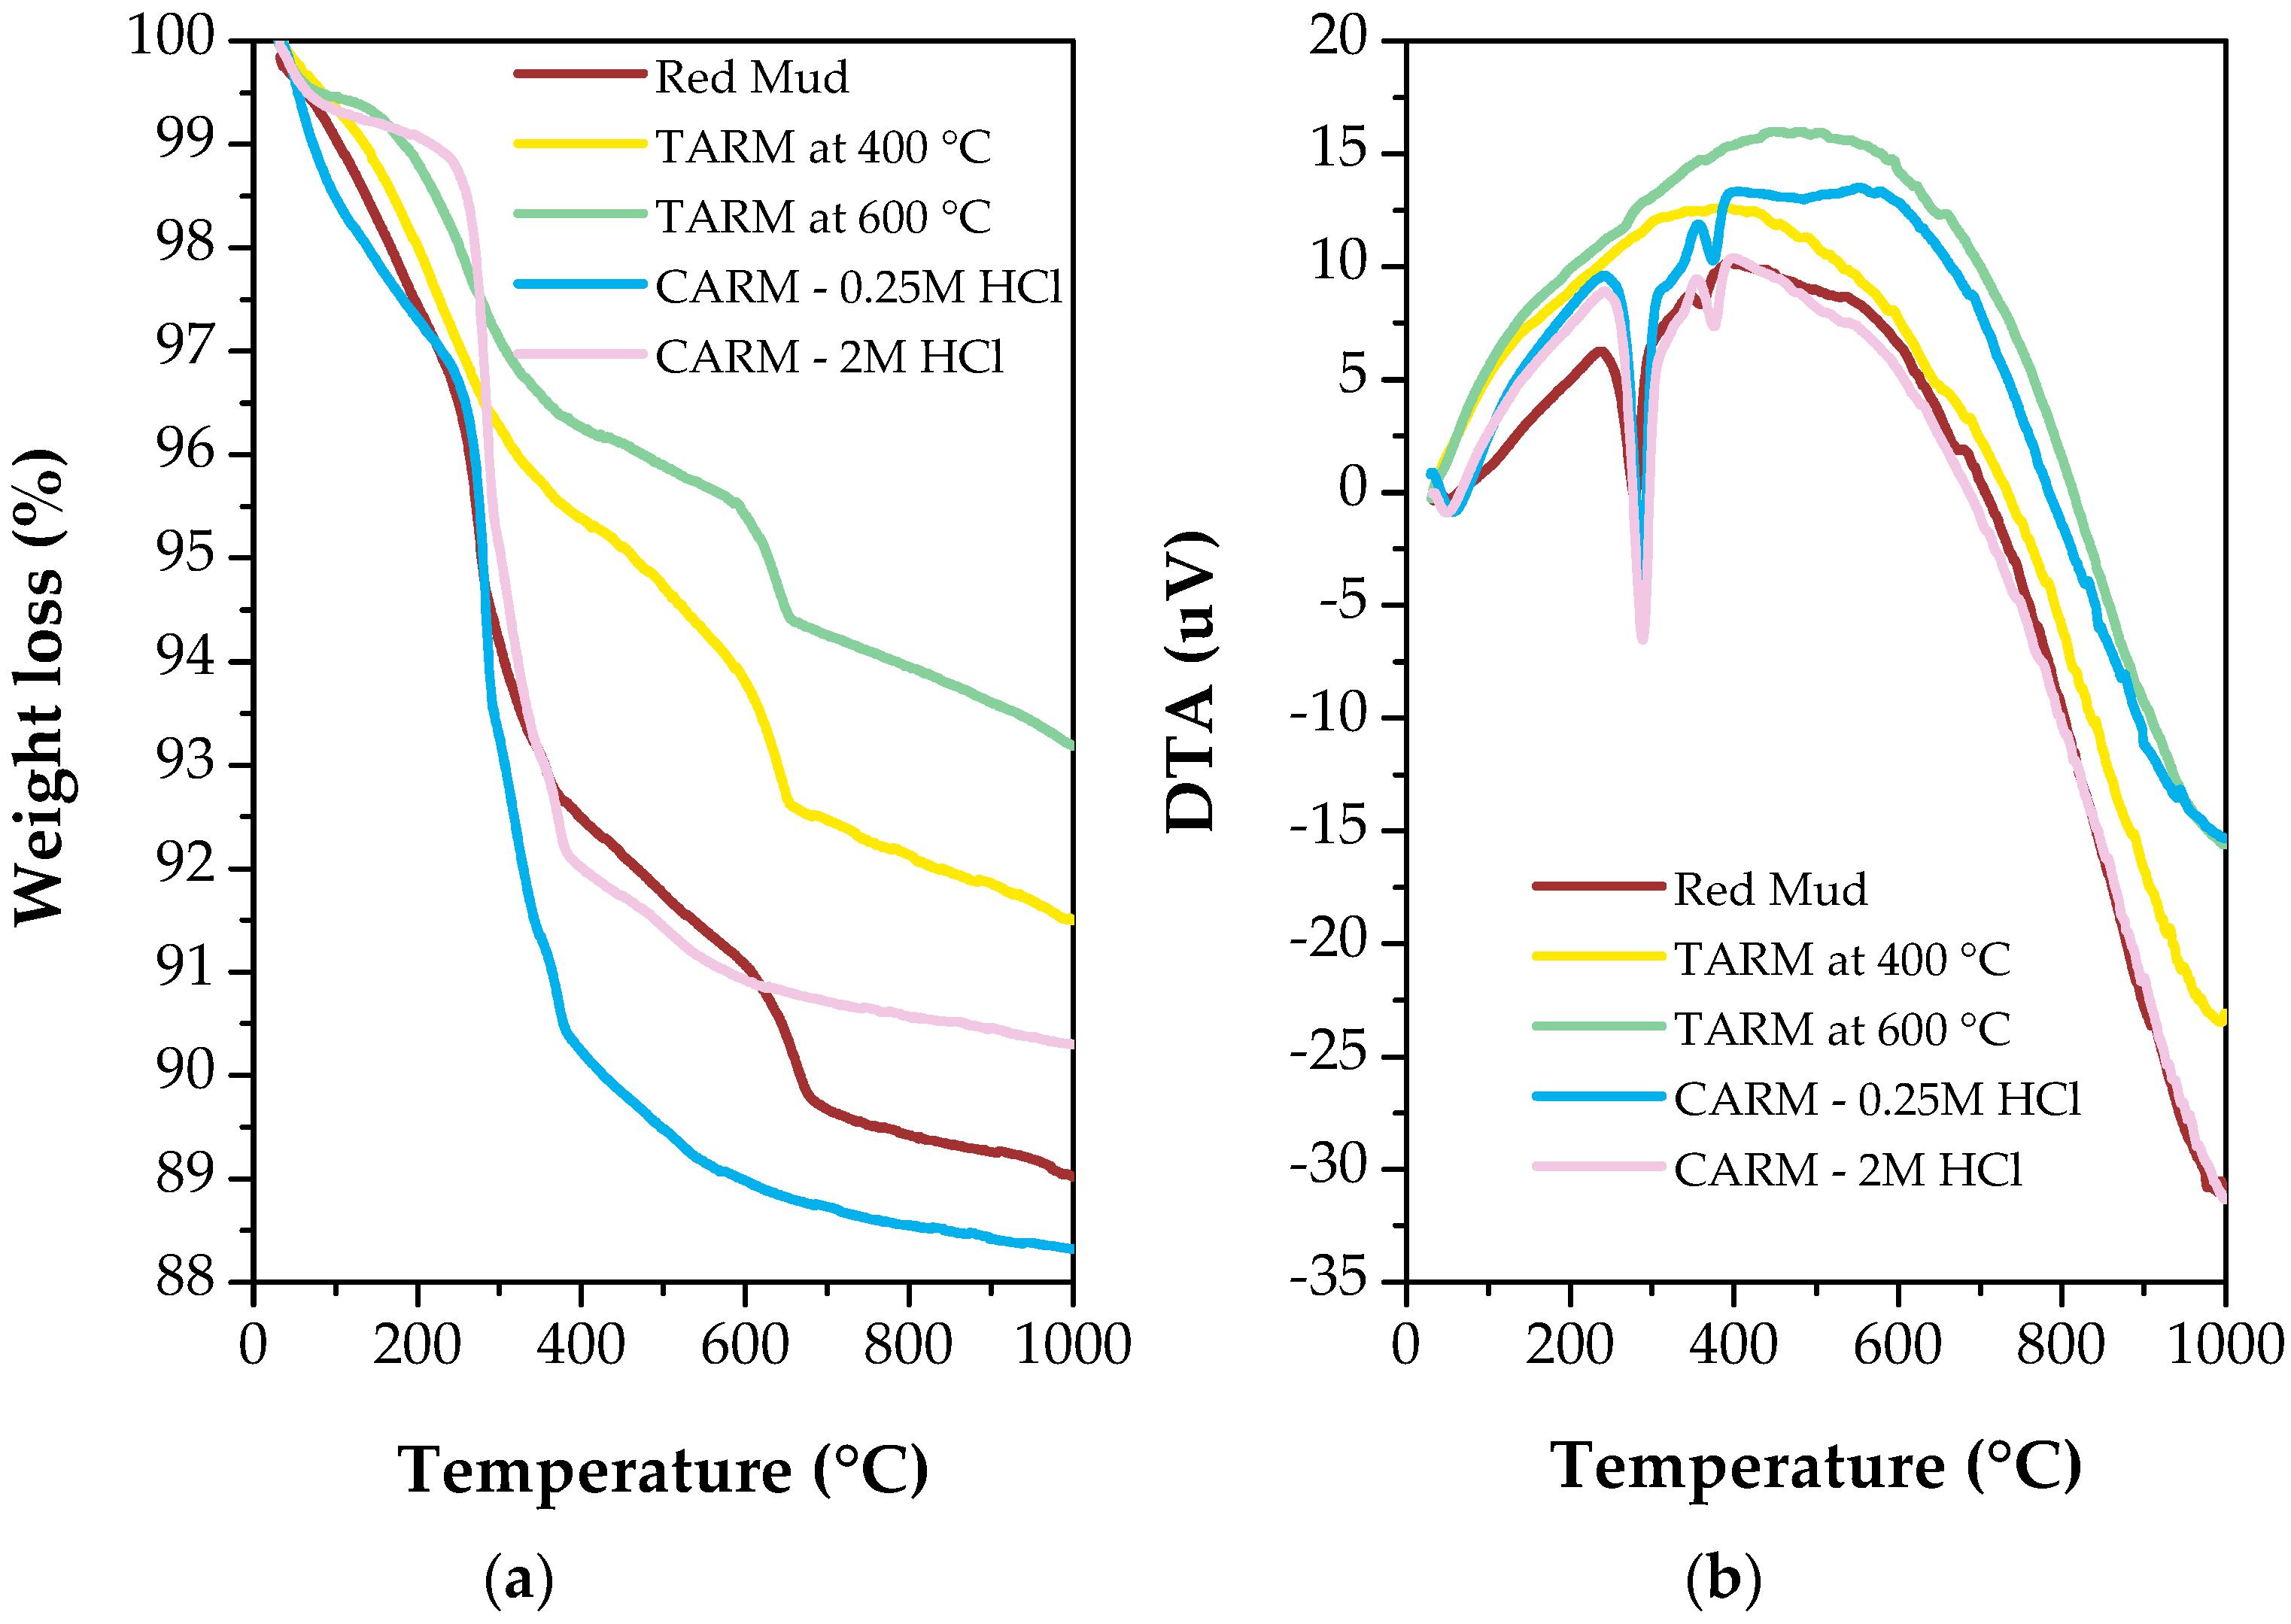
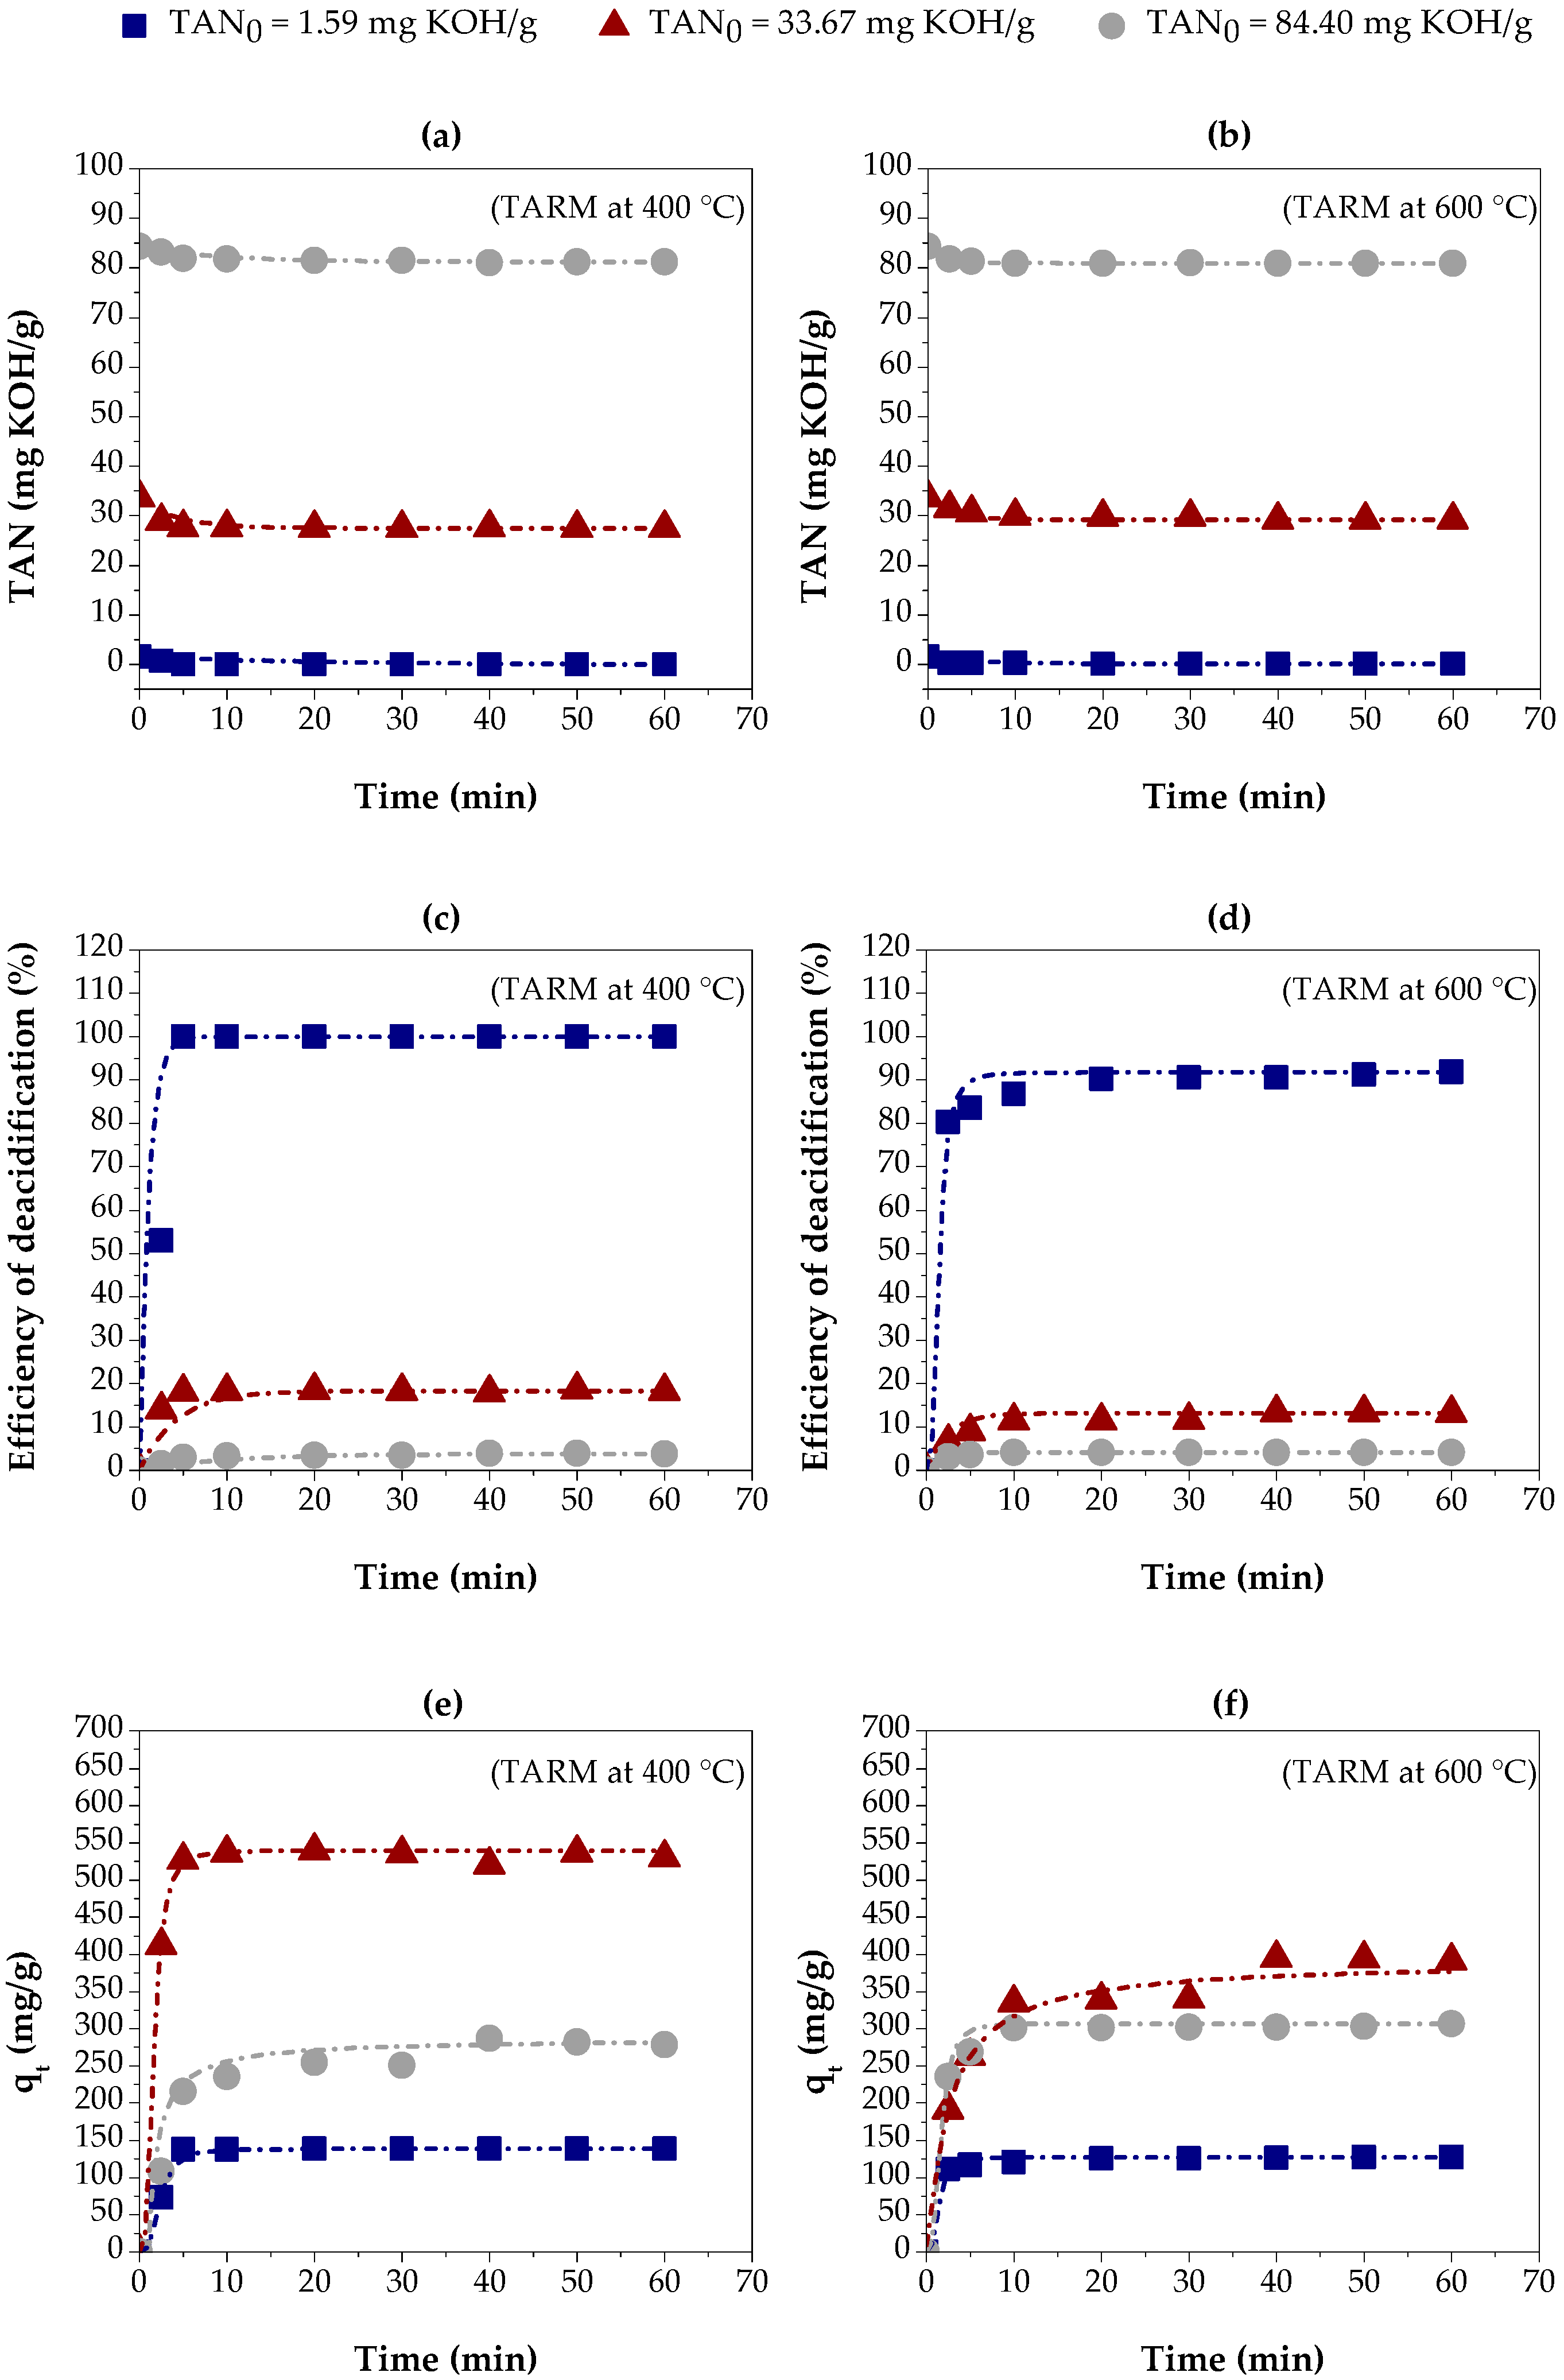
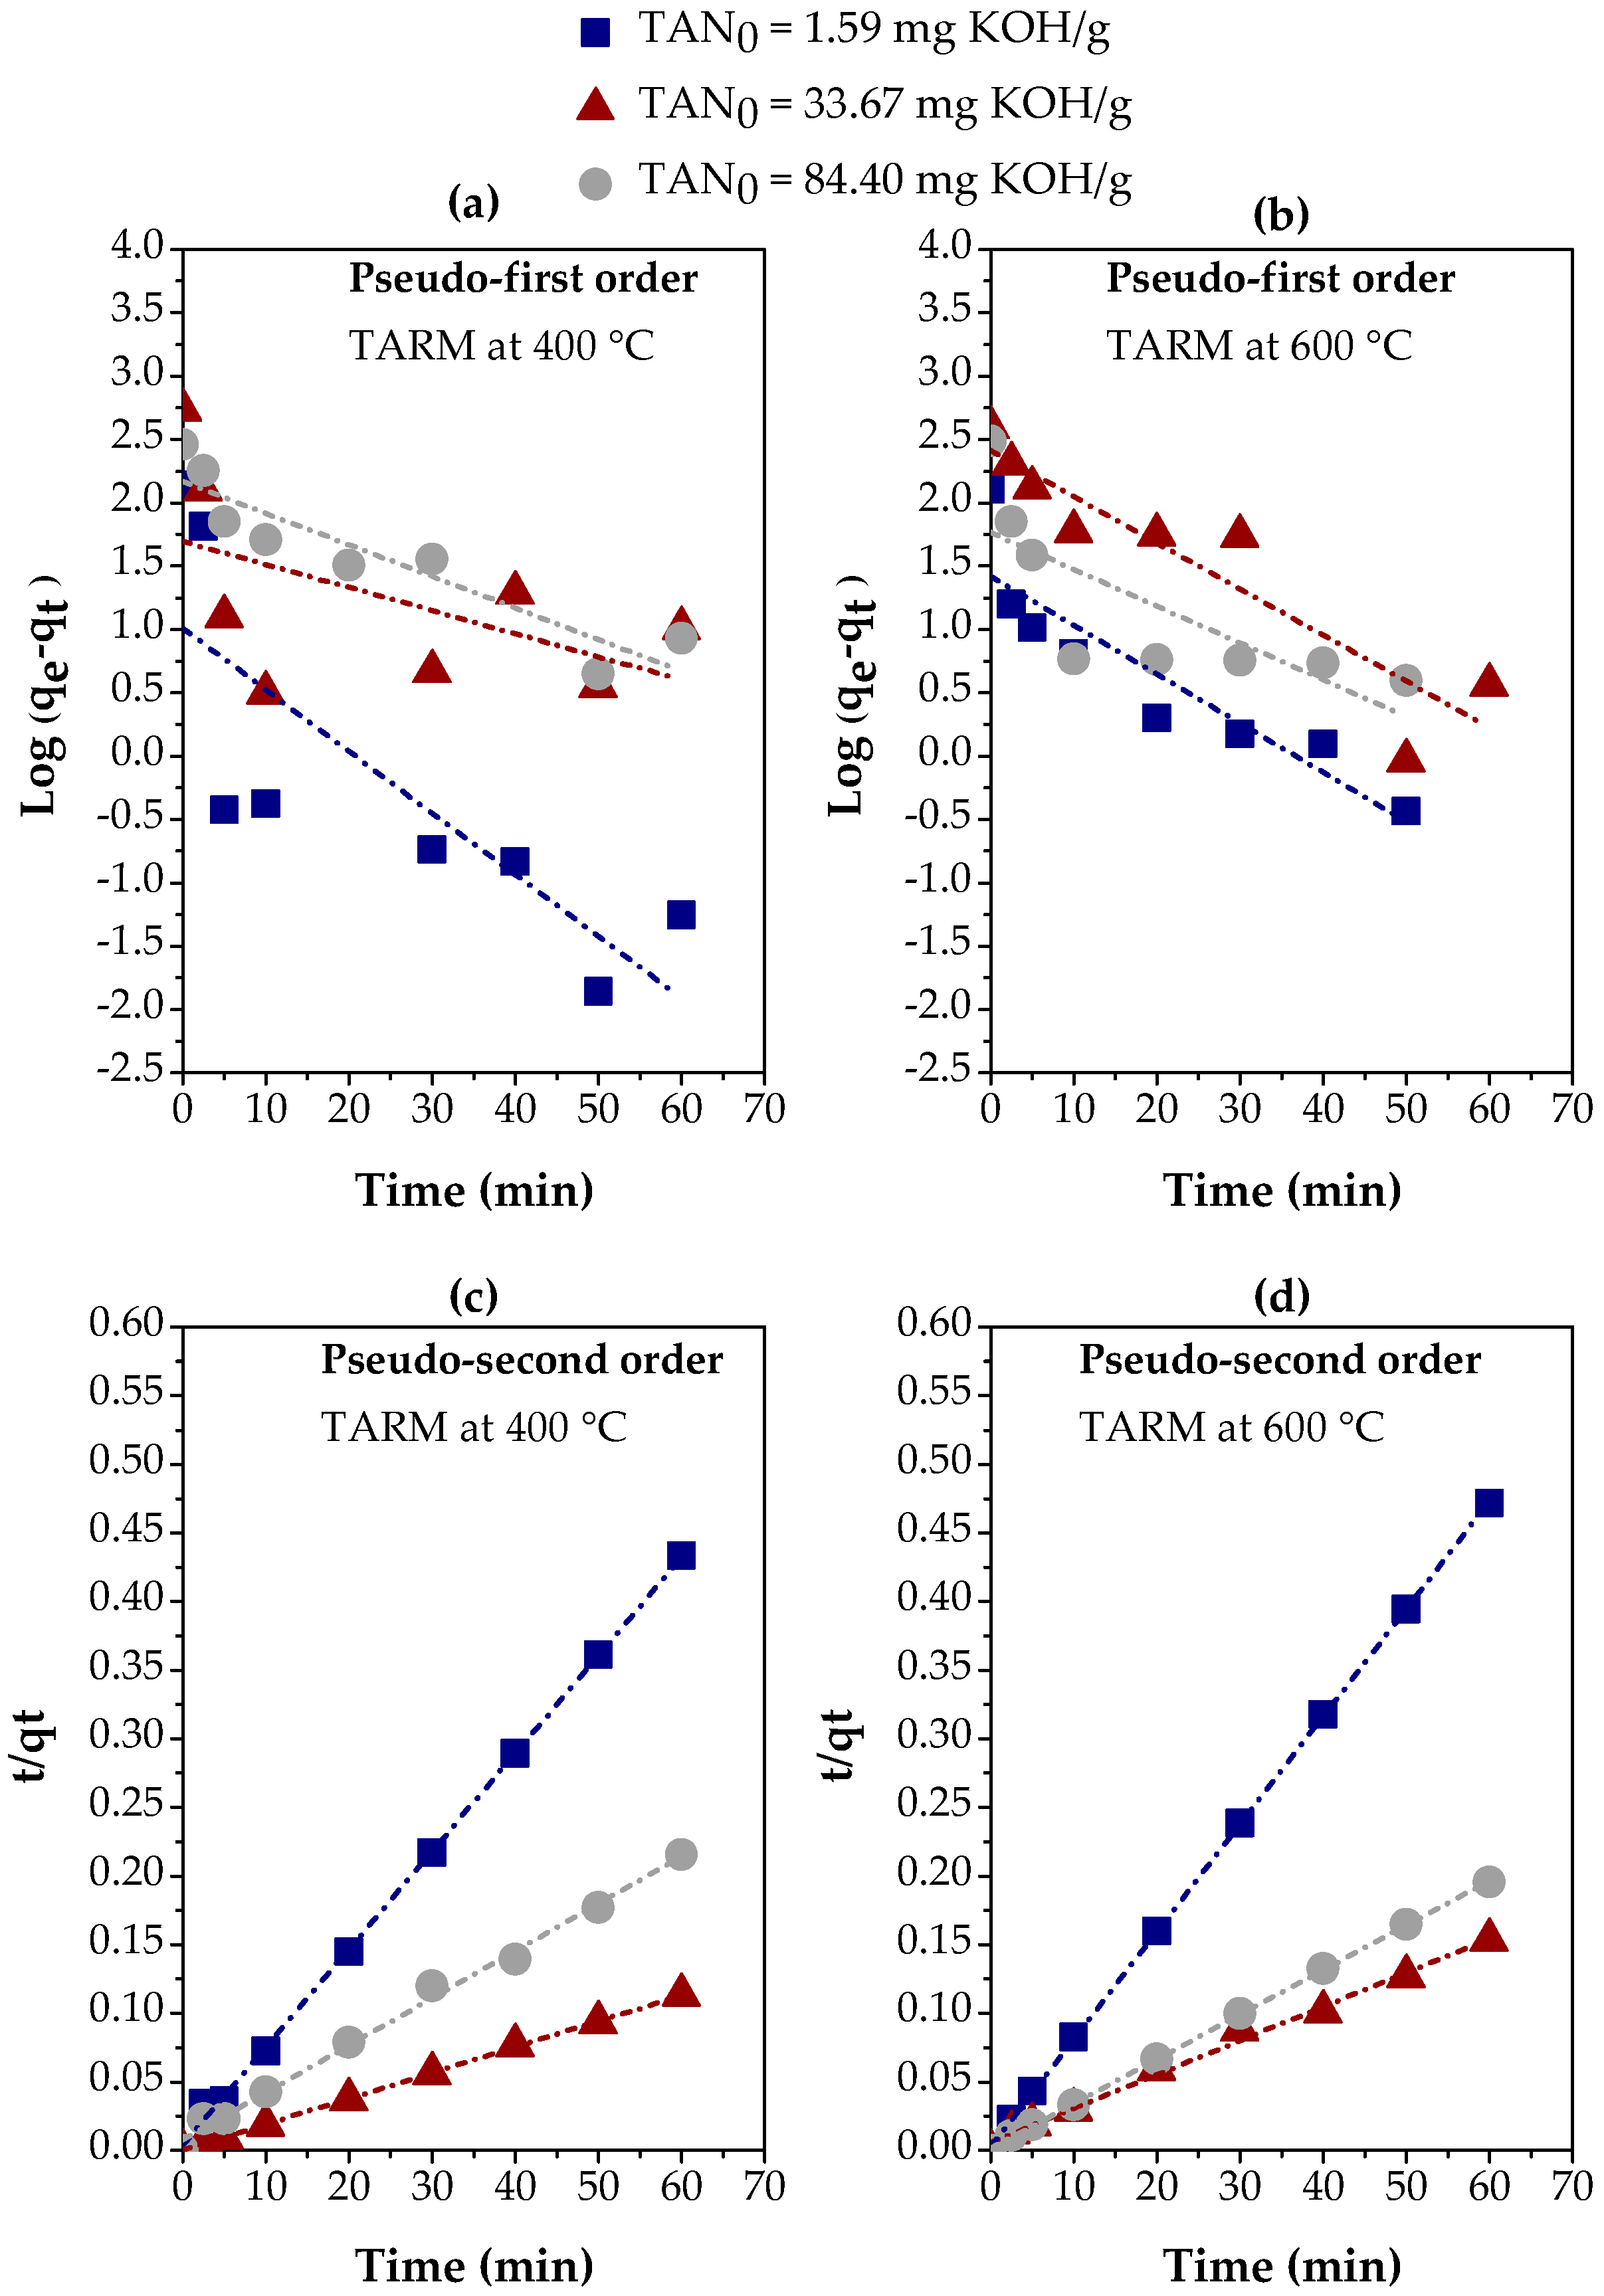
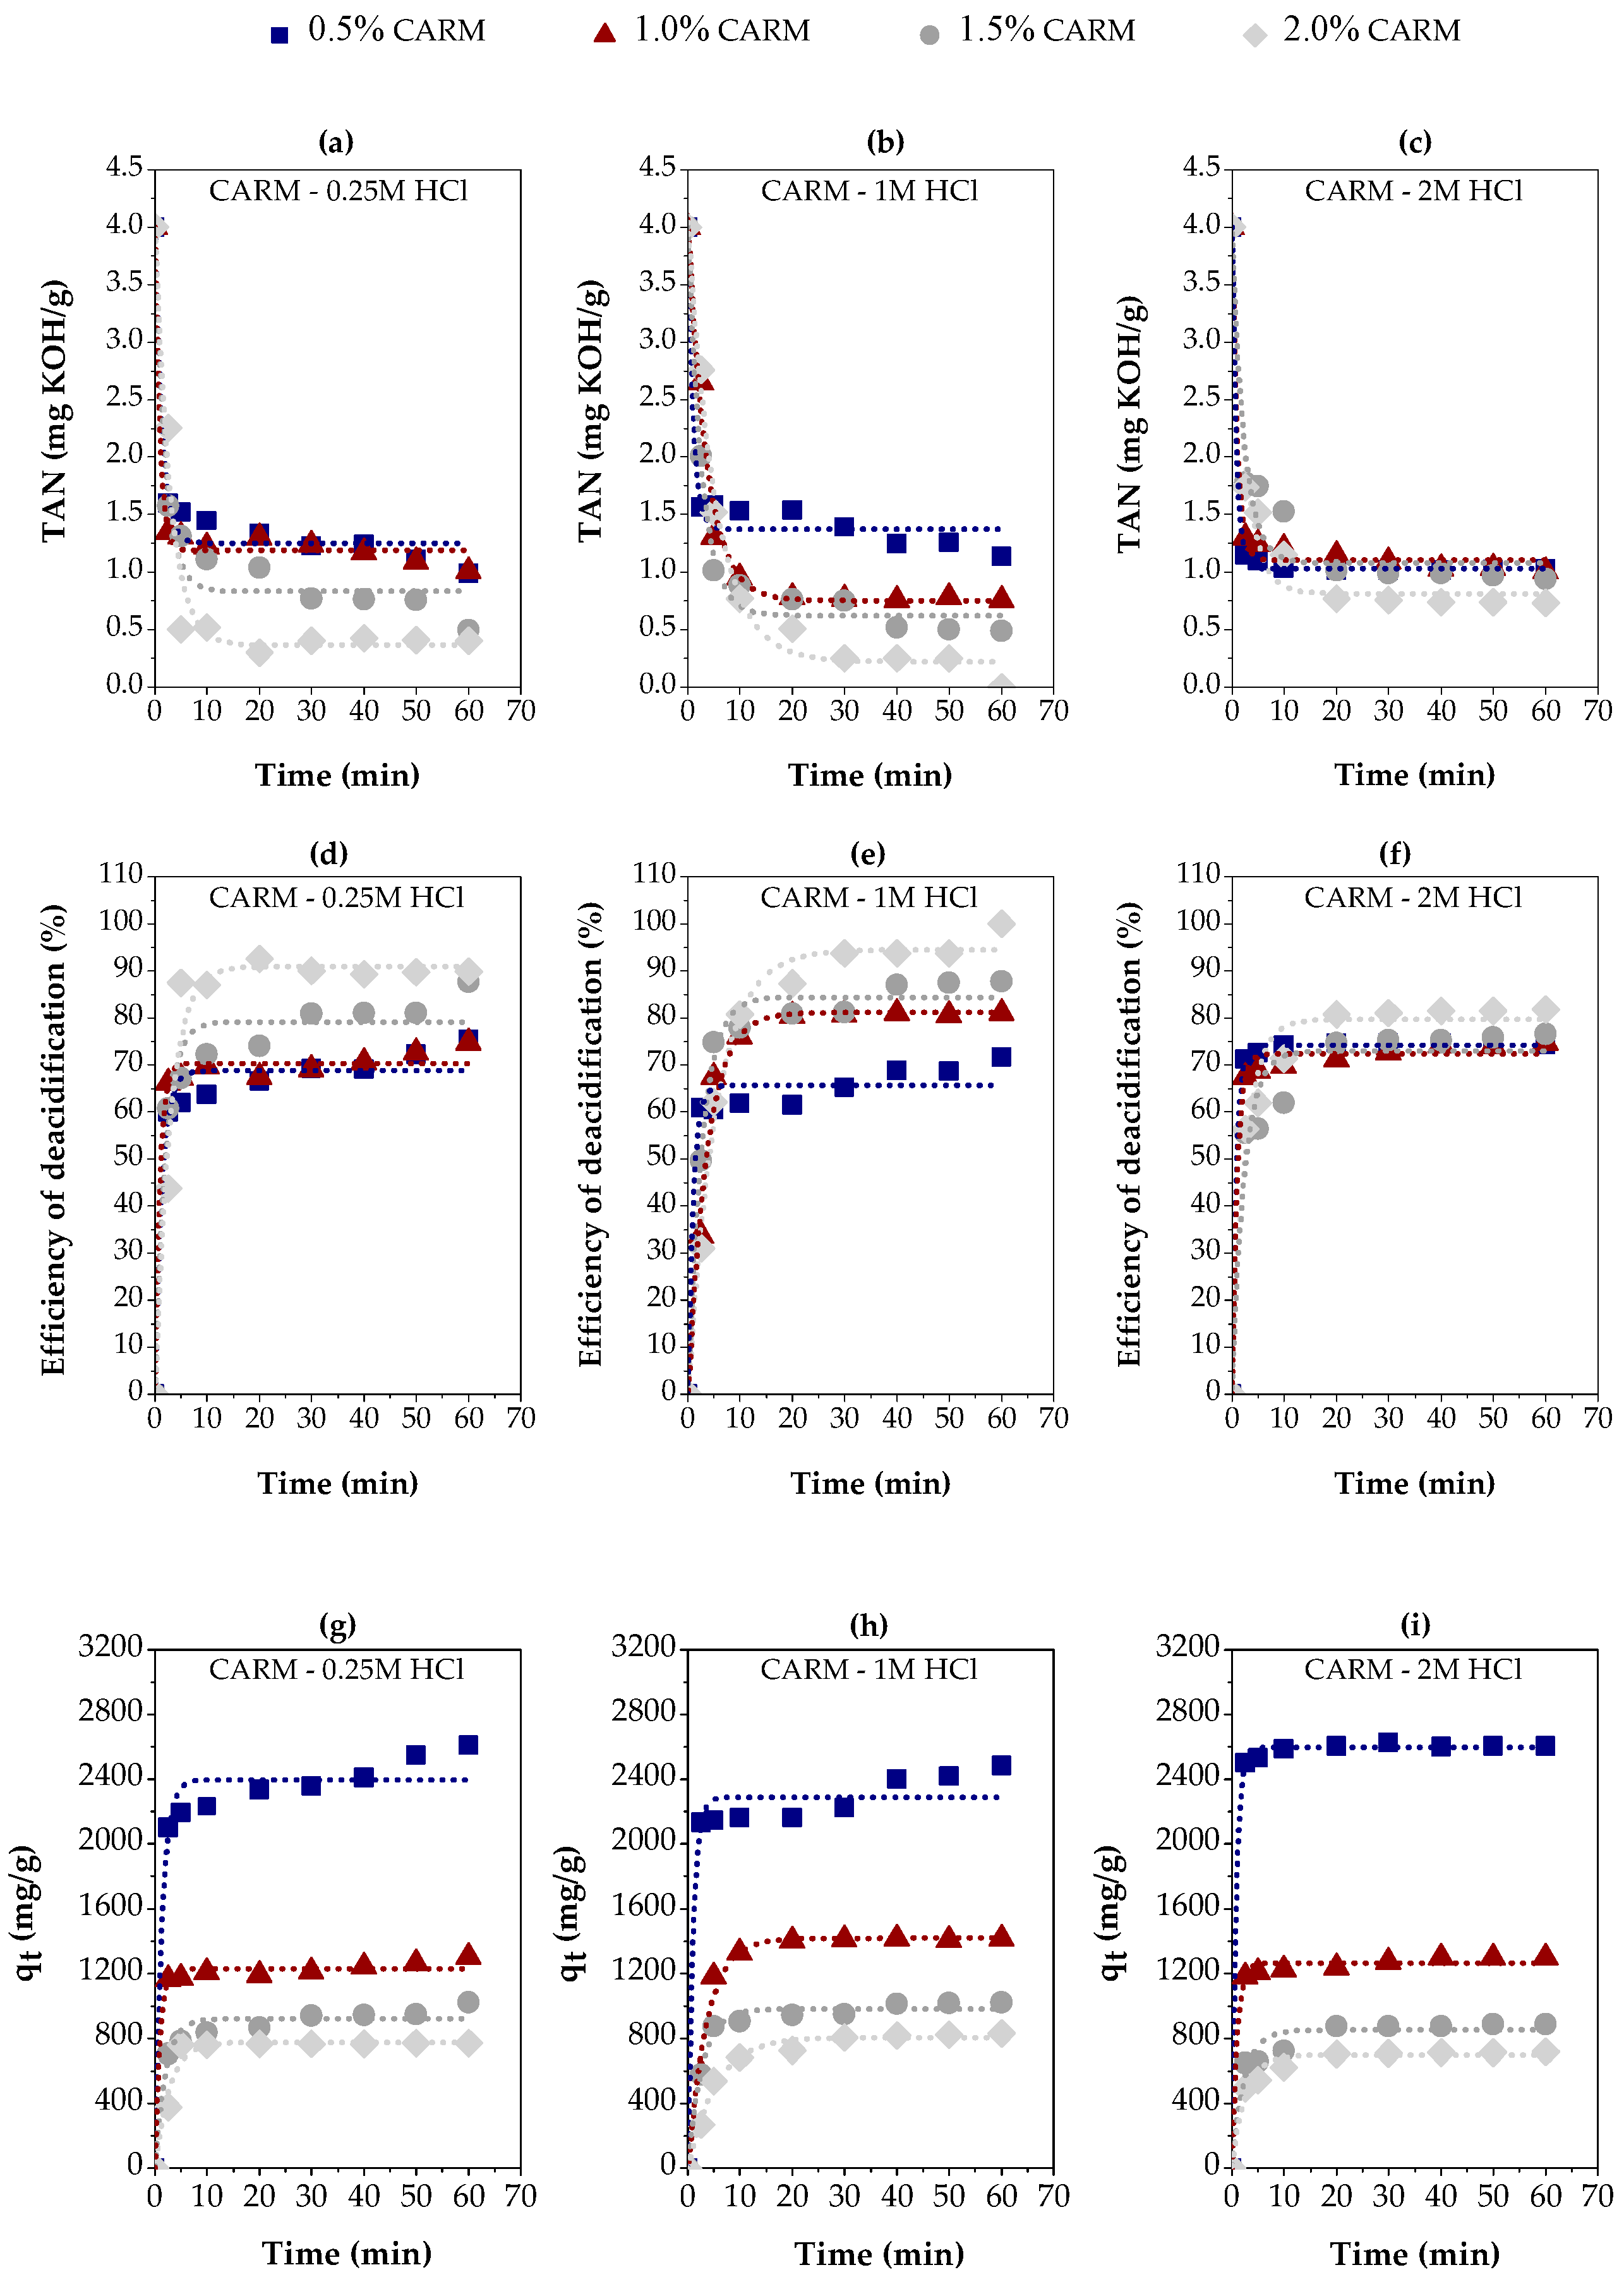
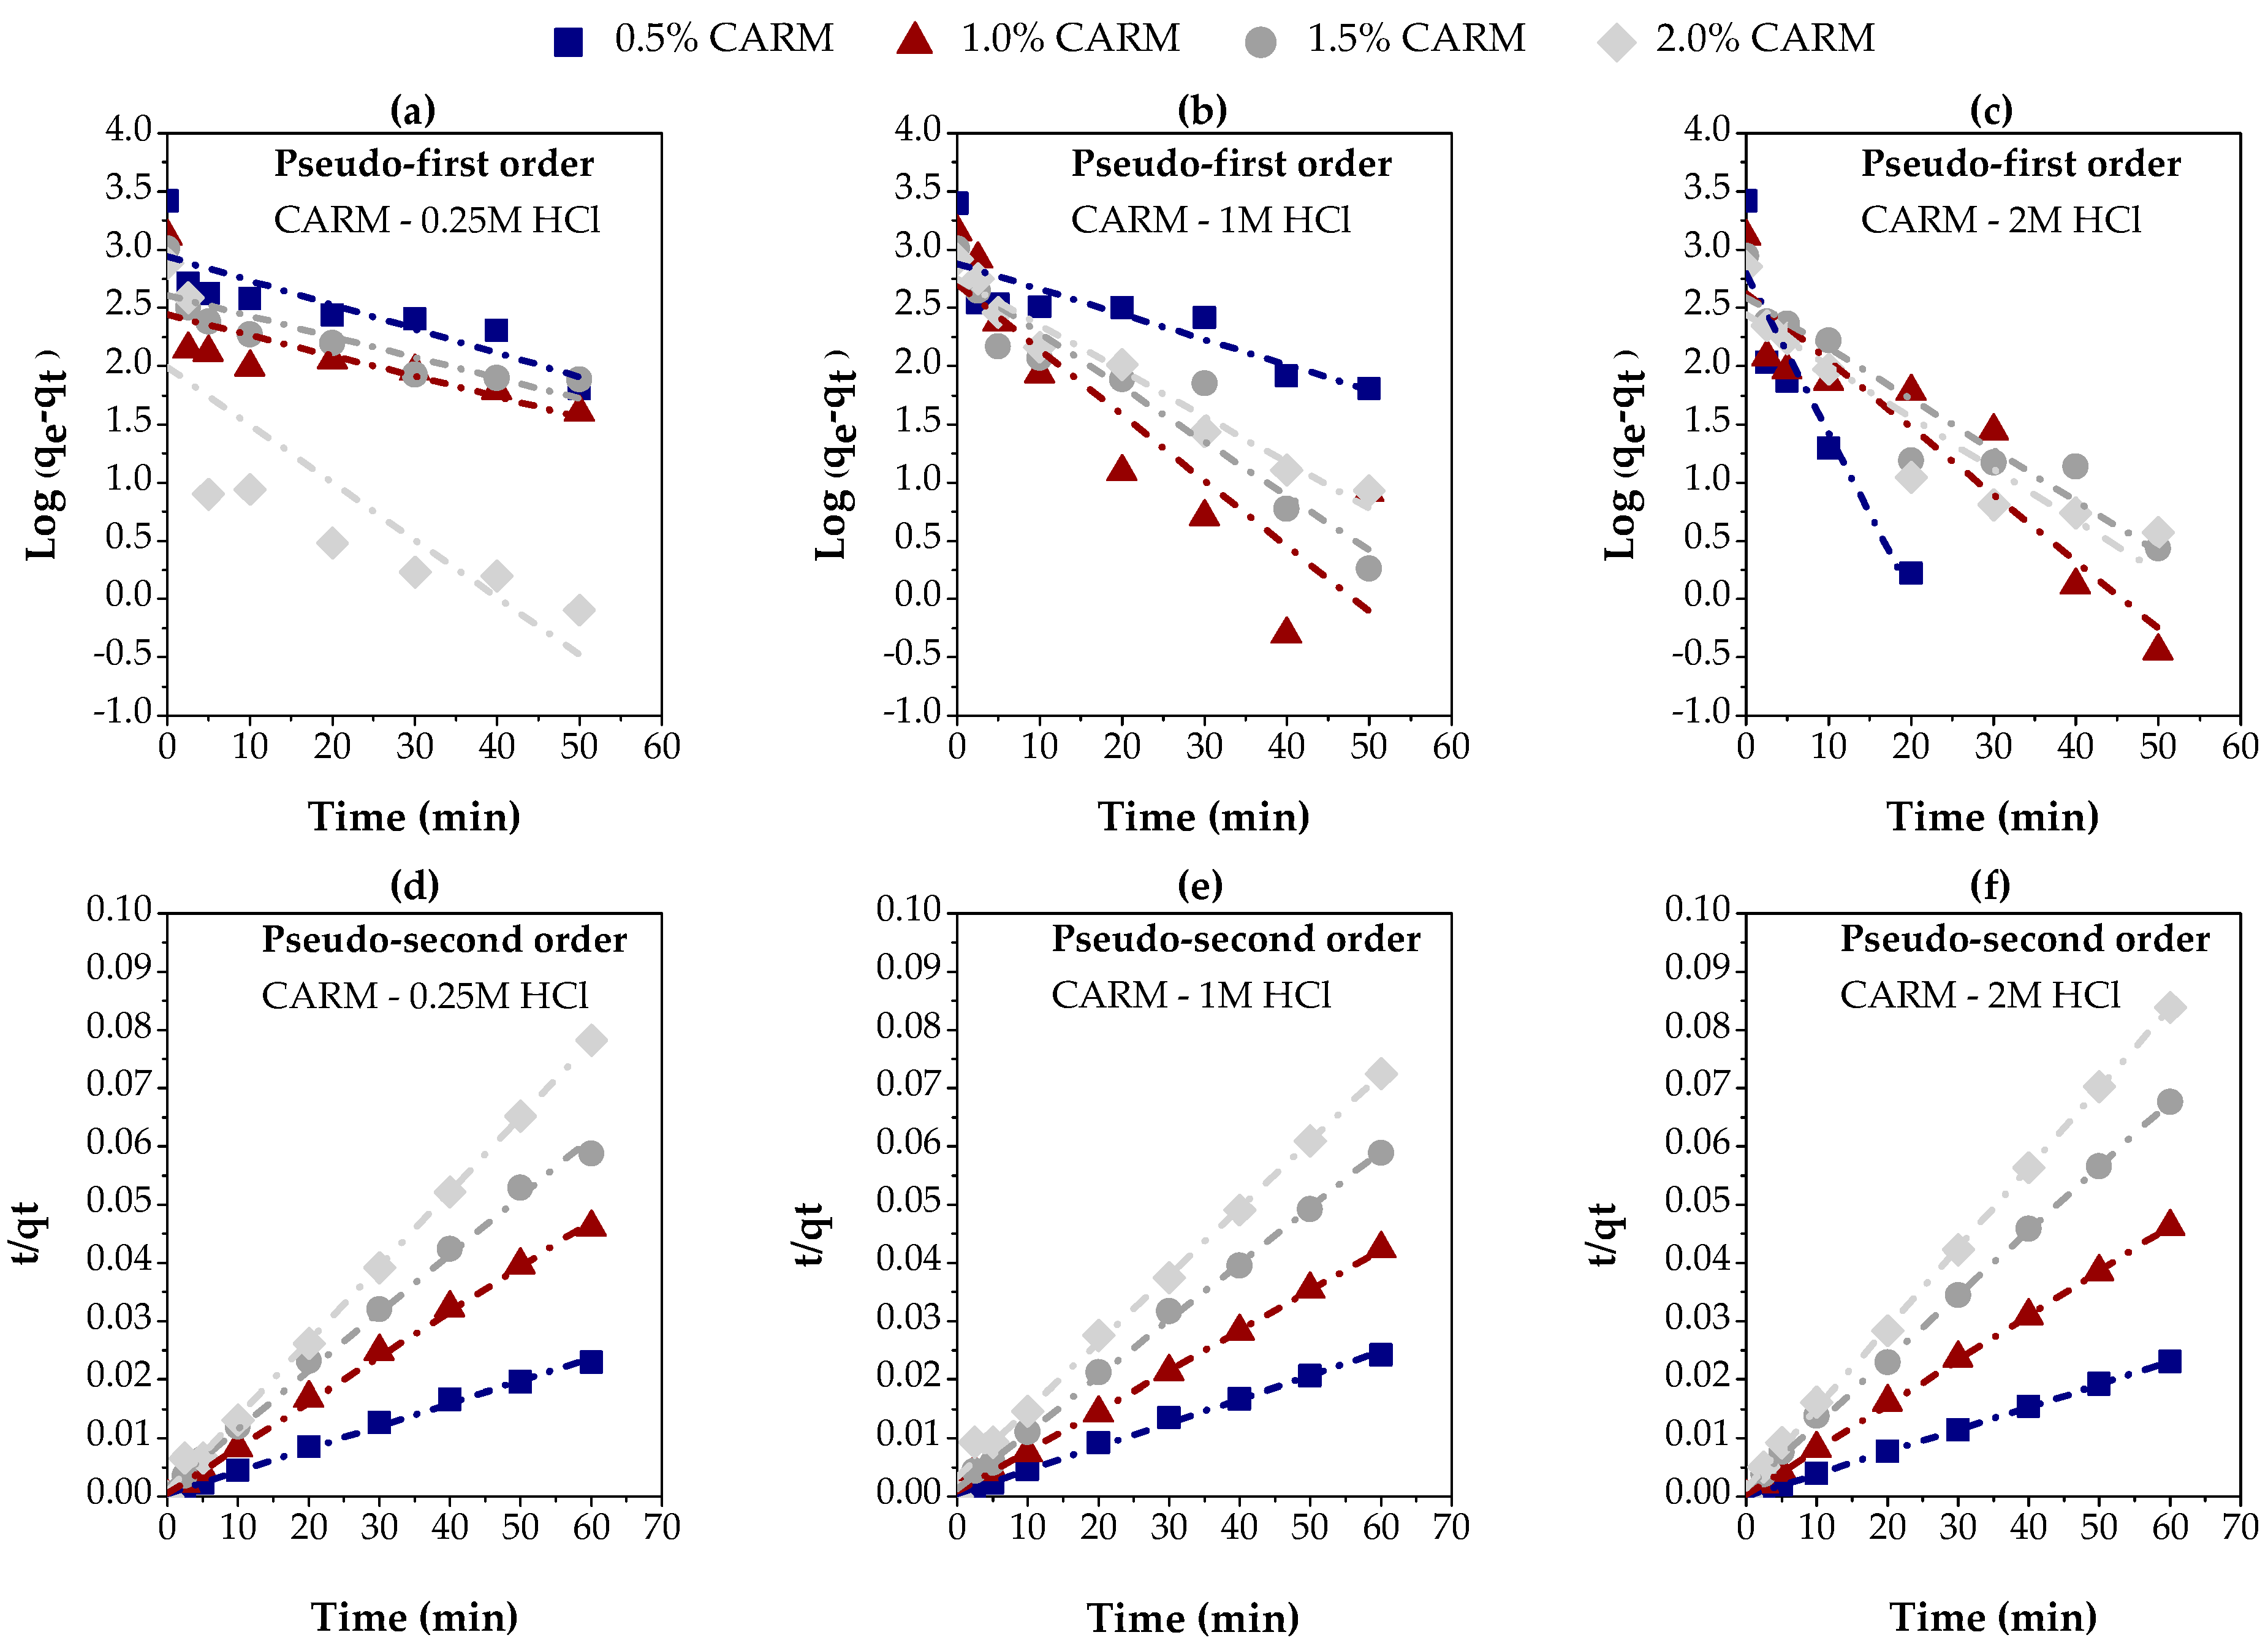
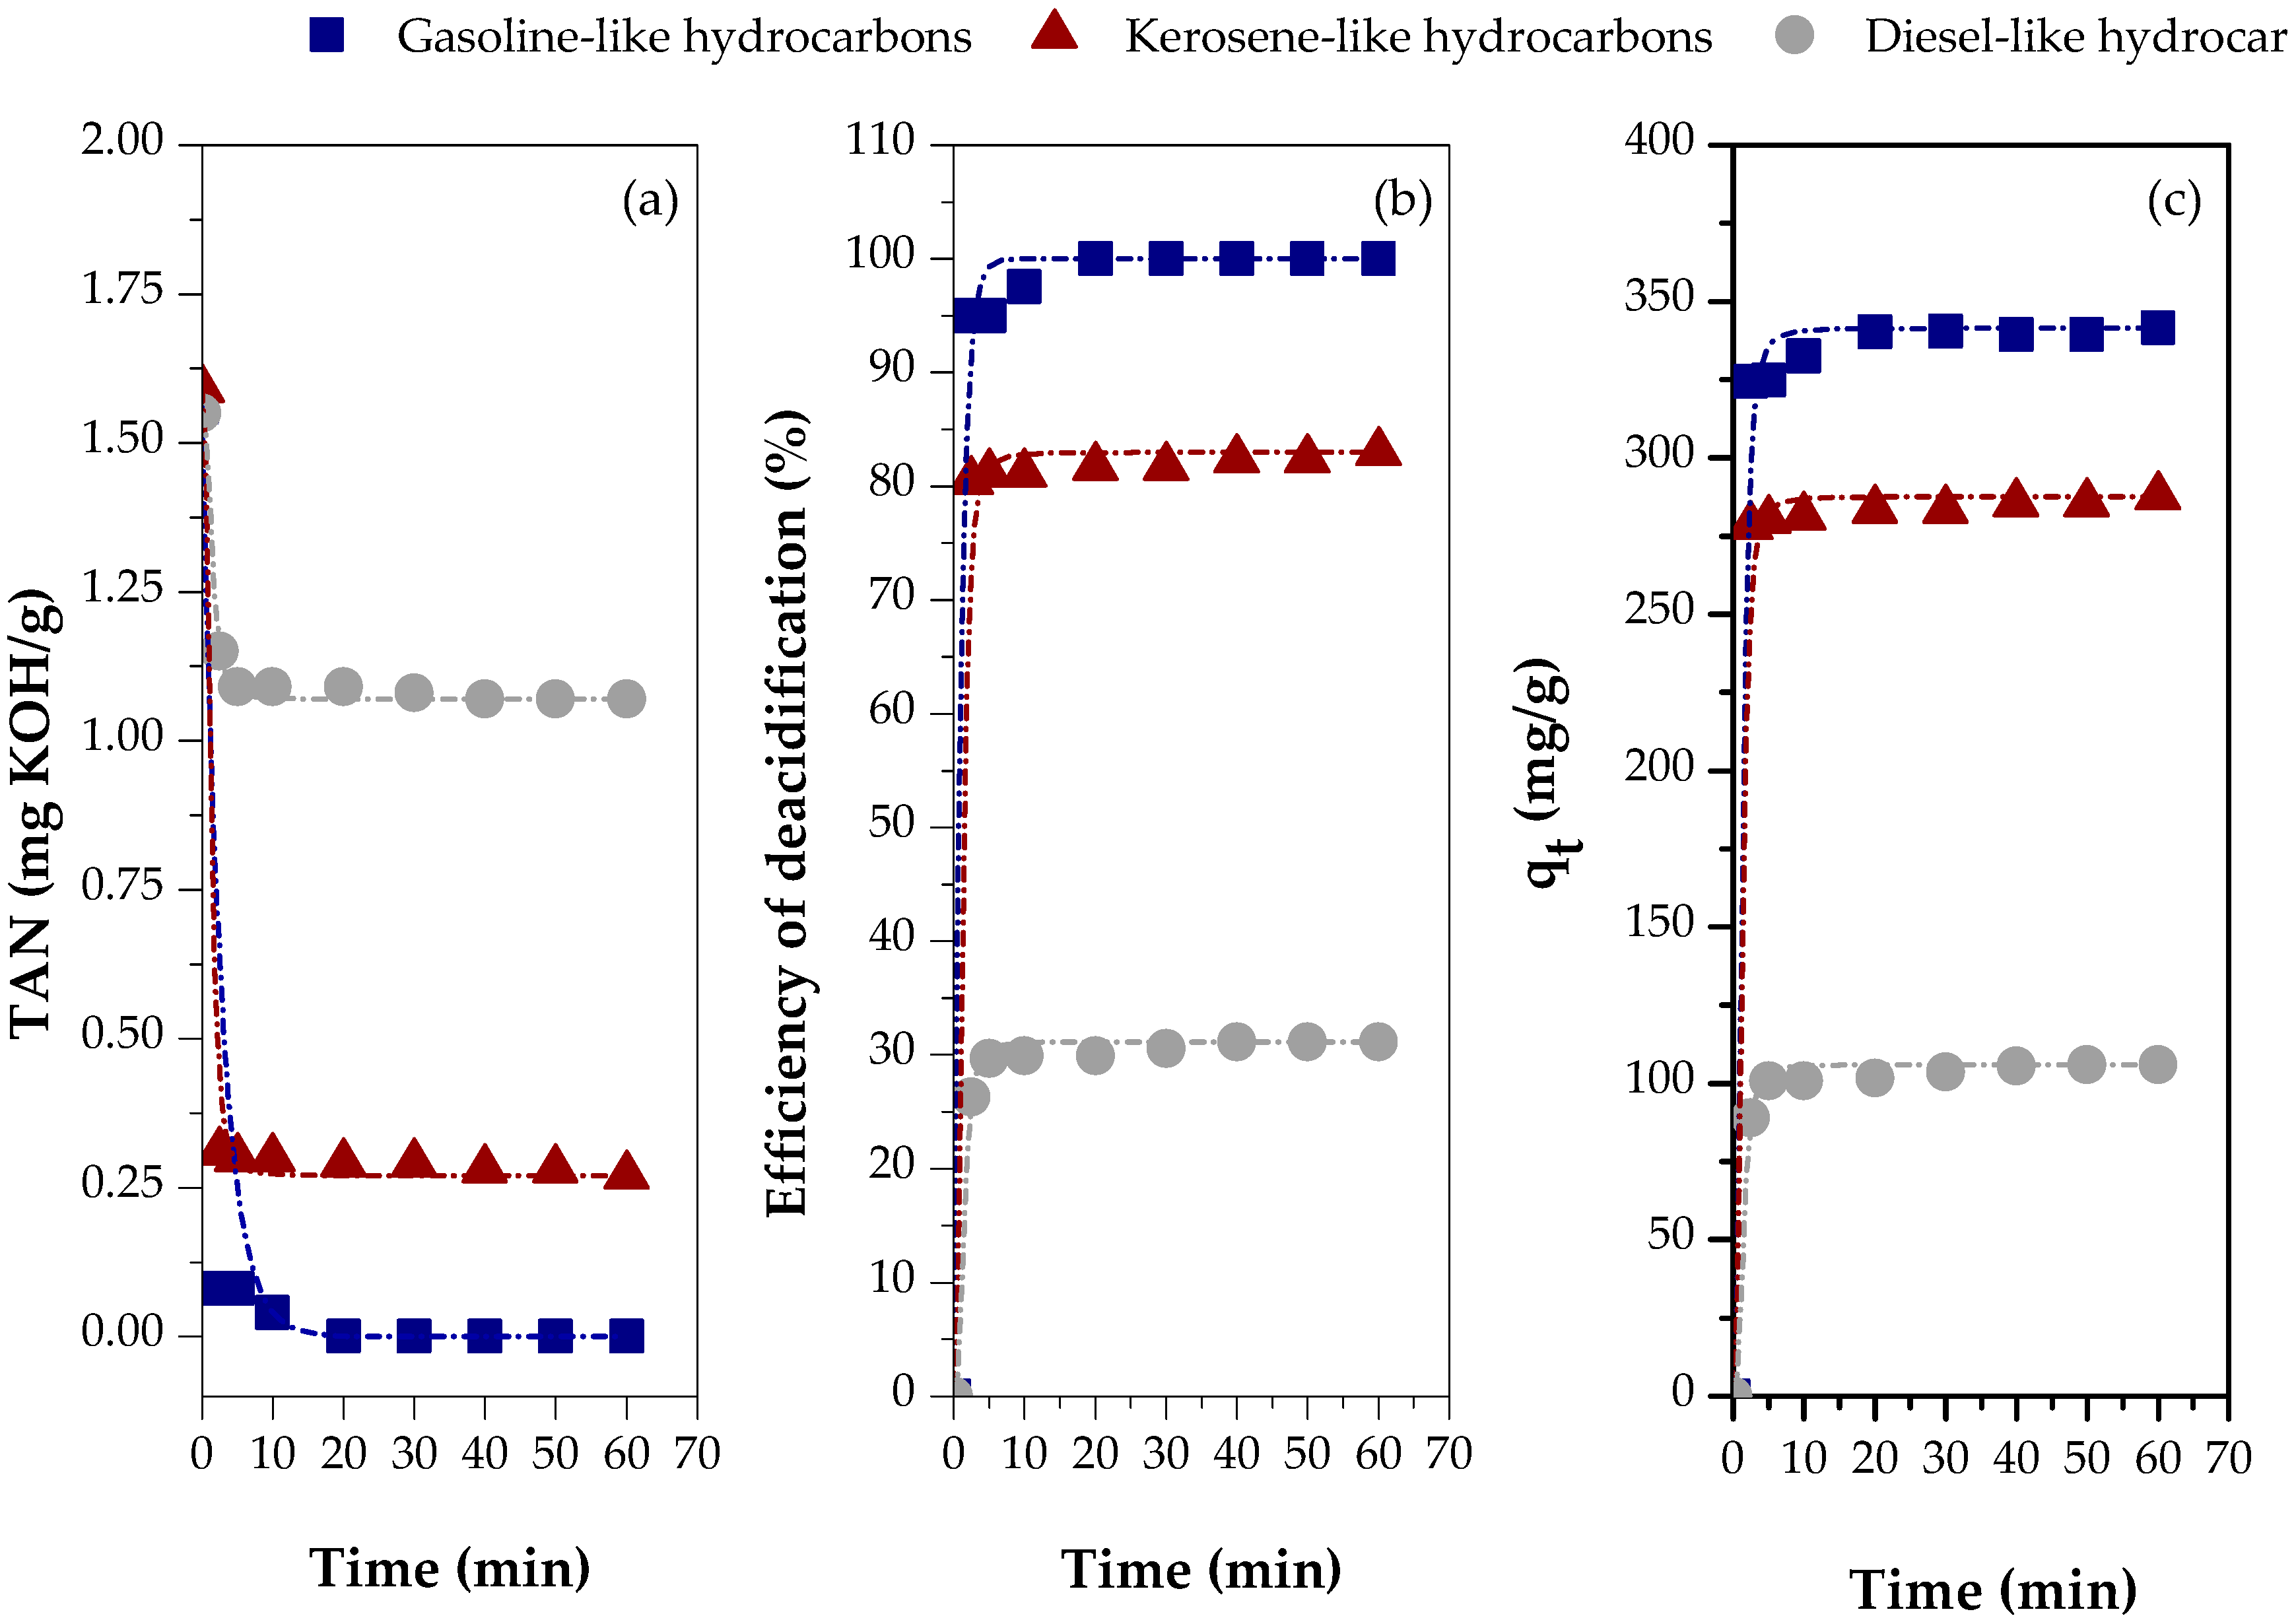
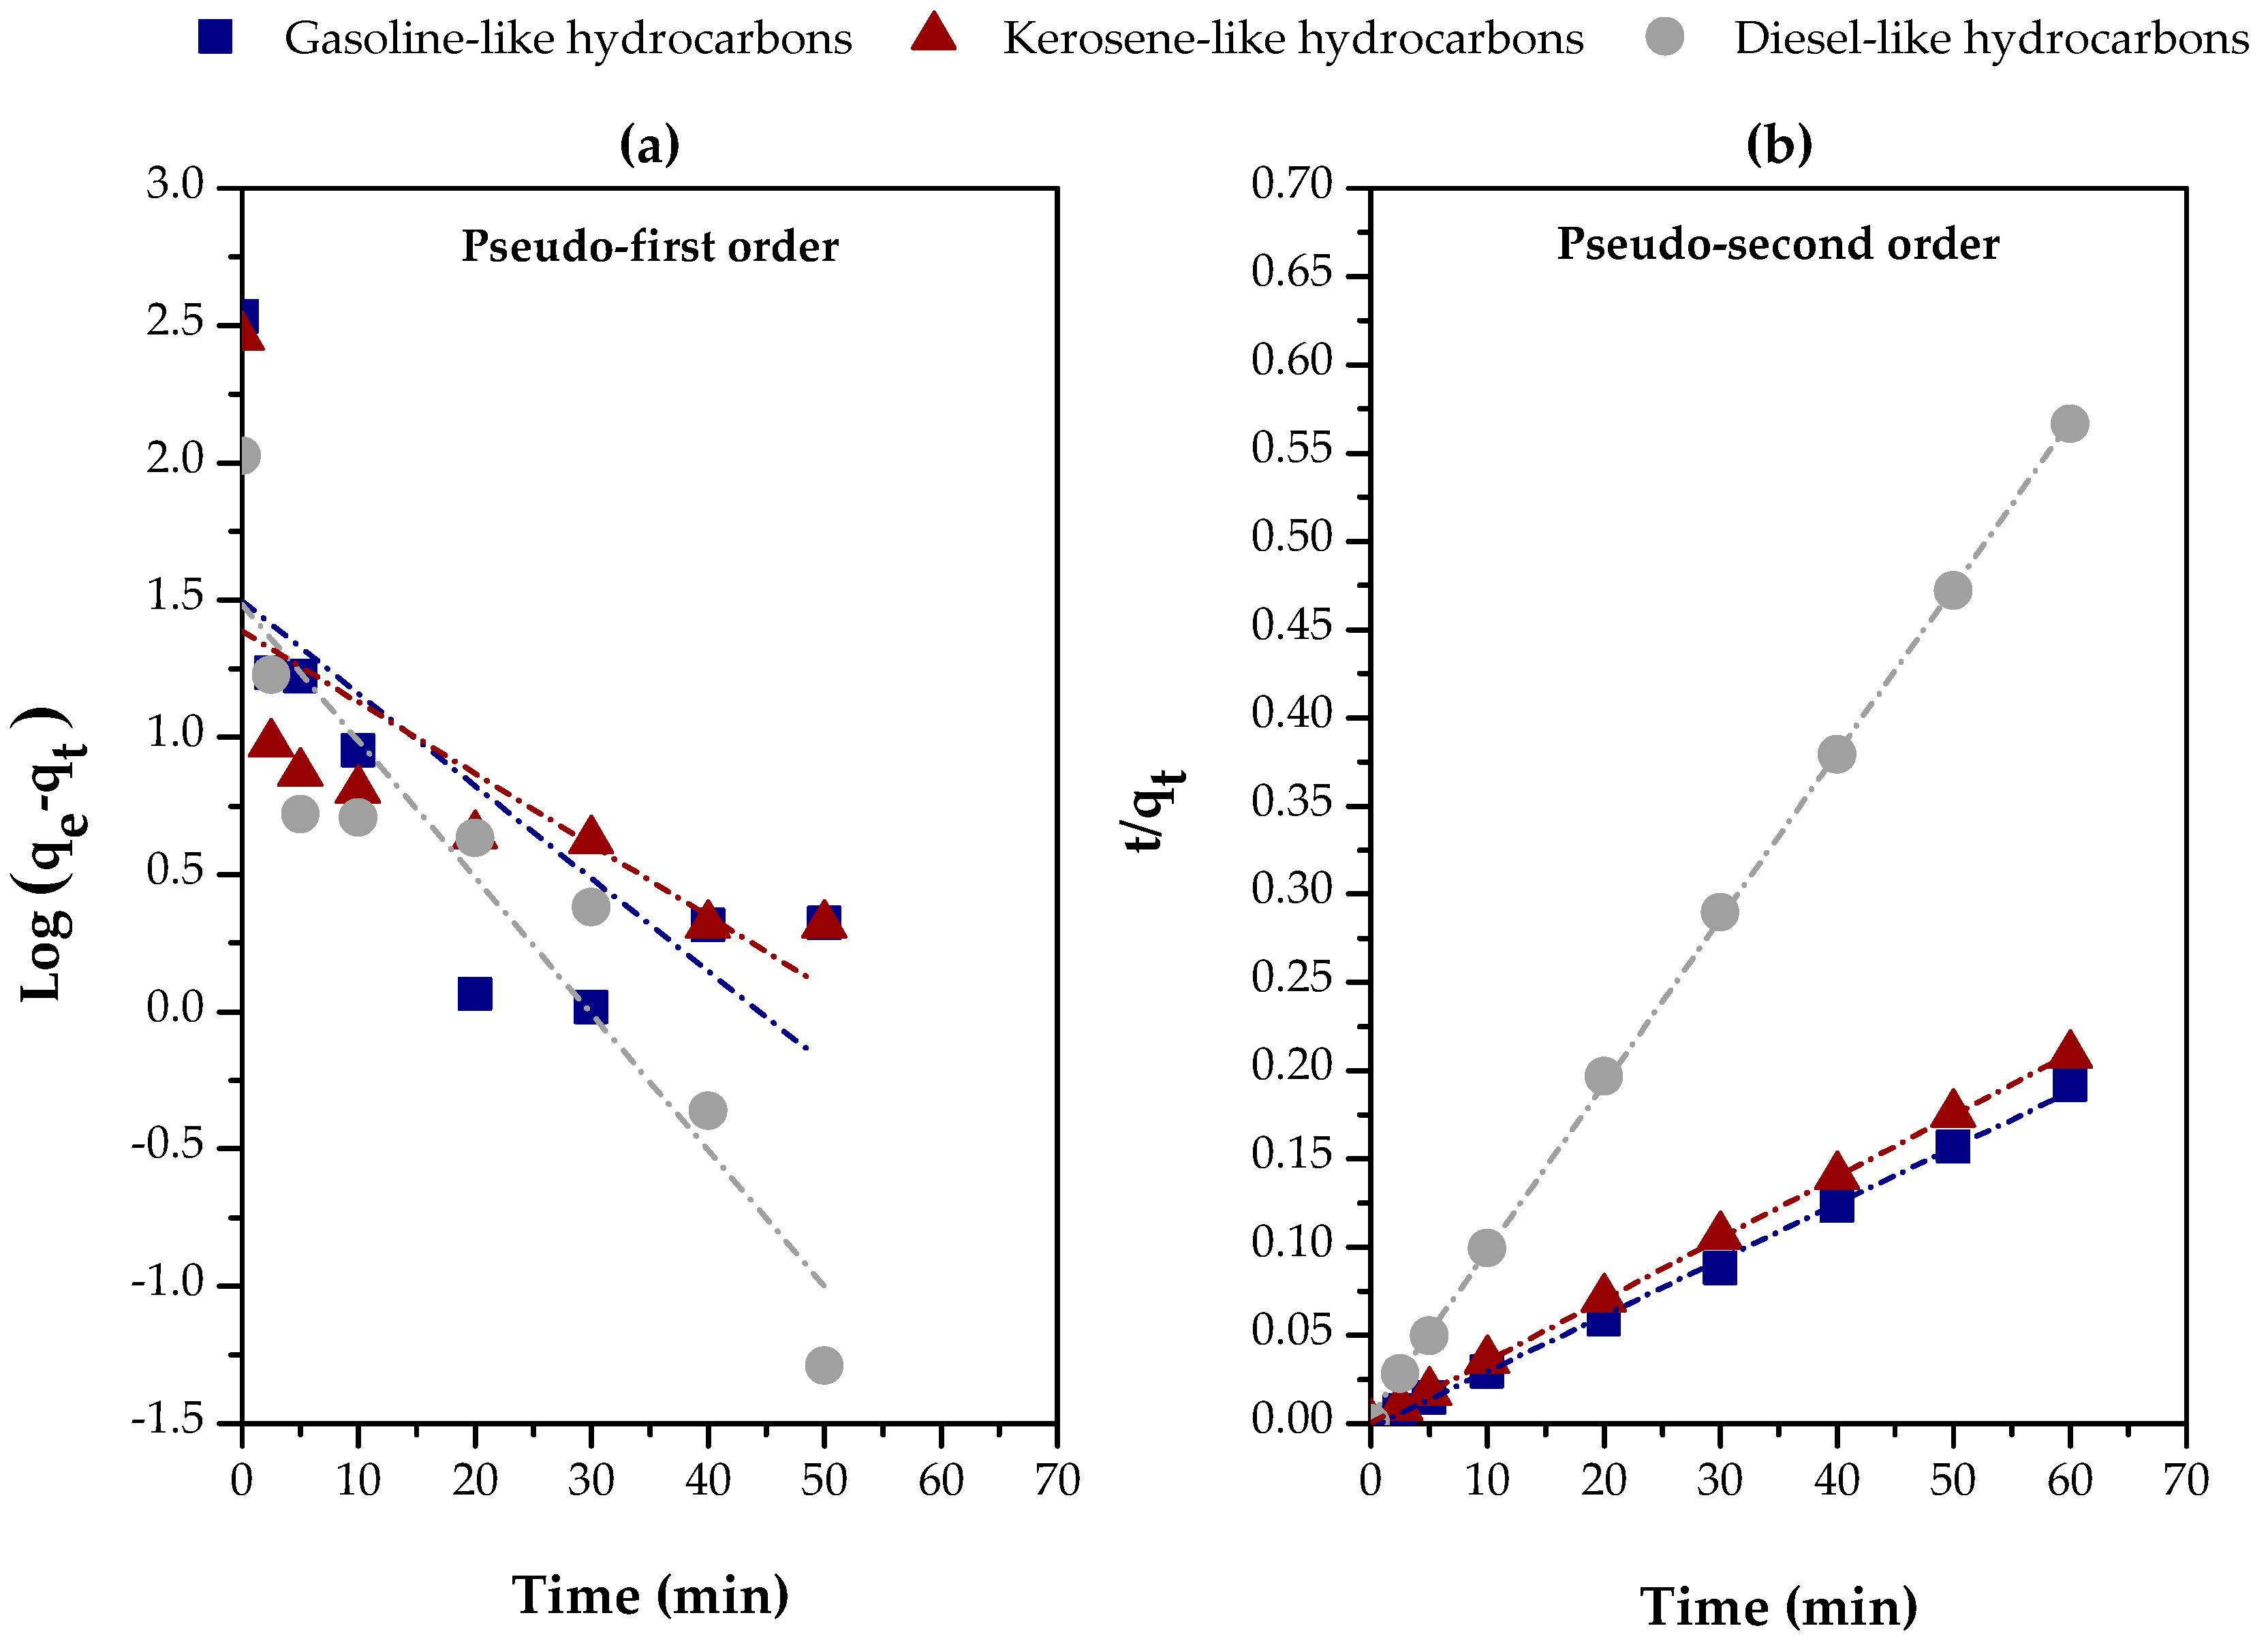
Disclaimer/Publisher’s Note: The statements, opinions and data contained in all publications are solely those of the individual author(s) and contributor(s) and not of MDPI and/or the editor(s). MDPI and/or the editor(s) disclaim responsibility for any injury to people or property resulting from any ideas, methods, instructions or products referred to in the content. |
© 2025 by the authors. Licensee MDPI, Basel, Switzerland. This article is an open access article distributed under the terms and conditions of the Creative Commons Attribution (CC BY) license (https://creativecommons.org/licenses/by/4.0/).