Abstract
Double skin facade (DSF) is an energy-efficient solution for glazing facades. However, previous studies have reported inconsistent findings regarding thermal comfort in naturally ventilated DSF buildings. To examine this issue, this study evaluated airflow velocities in naturally ventilated DSF buildings during transition seasons through a comparative study approach. A full-scale box-type DSF room and a traditional window-wall room were simultaneously monitored in a laboratory building under real climatic conditions, with indoor environmental parameters recorded for 10 days. Airflow sensation surveys complemented the physical measurements to evaluate perceived comfort. The results showed that the DSF room consistently exhibited lower air velocities (≤0.2 m/s) compared to the traditional room, demonstrating minimal response to wind conditions related to its small openings (opening ratio of 4.7%) and increased flow resistance from the dual-layer structure of the DSF. Under unfavorable wind conditions, the DSF room demonstrated higher ventilation rates due to the enhanced stack effect. However, this advantage had a negligible effect on the thermal comfort vote for the indoor temperature range (26 °C to 28 °C). These findings highlight the climate-dependent performance of DSFs: while advantageous for thermal comfort in cooler climates, they may lead to reduced thermal comfort in warm and hot climates due to low indoor airflow velocities. Future work could include the optimization of DSF opening configurations to enhance wind-driven ventilation while maintaining stack ventilation benefits.
Keywords:
wind; natural ventilation; DSF; air movement sensation; thermal comfort; stack ventilation 1. Introduction
Double skin facade (DSF) as a type of building envelope has a relatively short history. Its unique two-layer structure, with the outer layer typically made of glass, separates aesthetic elements from functional ones. The cavity between the two layers provides space for shading devices along with various other elements and materials to achieve energy efficiency and carbon reduction. Interest in DSF remains strong due to its advantages in visual expression, daylighting, indoor thermal comfort, wind pressure reduction, noise abatement, and, more importantly, energy-saving potential [1,2,3].
Previous studies have shown that DSF is more energy efficient than single skin facade (SSF) and traditional opaque walls with windows. Compared with SSF, DSF provides better insulation [4] and more flexibility in solar shading [5,6], leading to energy reduction in both cooling and heating. A review by Pomponi et al. [2] demonstrated that in most cases, DSF is a more energy-efficient alternative to SSF, with an average reduction of 33% in heating energy and 28% in cooling energy. The cases encompassed a wide range of climates, from northern Europe to southern Europe and from the Middle East to East Asia. More recent studies conducted in Iran [7], Turkey [8], and East Asian countries [9,10] have reported similar results. DSF is also a viable energy-efficient retrofit option for traditional opaque walls with windows in cold climates [11,12], hot and dry climates [13], and temperate climates [14,15,16,17]. However, validating the performance of DSF in actual buildings is difficult, and related studies are scarce. Huckemann et al. [18] conducted a large-scale field measurement and survey across 280 office rooms in 28 buildings and concluded that the DSF buildings had slight advantages over the SSF buildings. However, the authors acknowledged that it was “difficult to collect the data amid protracted communication with building operators.”
Interest in DSF continues to grow, focusing on its environmental impact and potential design improvement. Life-cycle analysis (LCA) studies on DSF remain inconclusive so far in the literature. A study in Tehran, Iran showed that compared with a traditional opaque wall with windows, DSF increases the embodied carbon by 23.7% to 47%, although the operational carbon emission is reduced [7]. However, in the UK, an evaluation showed that a DSF in a refurbishment, if properly designed, can have better LCA carbon performance, especially when timber is used for the structure [12,19]. Optimization and innovative designs of DSF primarily focus on leveraging the advantages of the double-layered structure. Proper optimization of DSF geometric configurations can result in energy reduction by up to 28.7% [9,20]. However, more studies focus on working with solar energy control, such as the design and control of shading devices to reduce solar heat gain and glare while maintaining adequate daylight [21,22,23,24,25,26]. One study found that regular shading devices could achieve energy savings of up to 6.8% in two Chinese cities [27]. More innovative solutions include photovoltaic (PV)-integrated blinds or facades [28,29,30,31,32,33], cooling water-integrated blinds [34,35], phase change material-attached blinds [36,37], and greenery in the cavity [38,39]. These studies demonstrated additional benefits that the double-layer structure can offer beyond energy-saving advantages.
Ventilation has long been an important subject in studies on DSF. The double-layered structure offers versatile ventilation strategies to adapt to different climates. Cavity ventilation helps to reduce cooling loads [40,41,42,43,44], while a non-ventilated cavity insulates better [4,45,46]. Enhanced buoyancy in the cavity can be used to ventilate buildings for indoor air quality (IAQ) and thermal comfort [6,47,48]. He et al. [49] analyzed the stack effect of a single-story DSF system using an analytical solar chimney model [50] and found that even in cities with mild to poor solar radiation, satisfactory ventilation rates (>4 h−1) could be achieved 70% of the time during transition seasons. Similar magnitudes of ventilation rates (0.84~2.23 h−1) were also found in a simulation study by Tao et al. [51].
While a DSF can produce sufficient ventilation rates to meet IAQ requirements in buildings, its impact on wind-driven ventilation or more specifically, induced indoor air movement, is less discussed. In cold or cool climates, thermal comfort can be achieved, as demonstrated in Germany by Pasquay [52], in the cold zone of China by Kong et al. [47], or in southern Brazil by Barbosa and Ip [53]. However, in warmer climates, a DSF may underperform compared to a SSF in thermal comfort [53]. In hotter climates, the benefits of a DSF on thermal comfort can be limited [48]. Recent field surveys conducted in temperate climates [54,55] revealed that a significant portion of occupants were dissatisfied with the air velocity in DSF offices. These studies suggest the importance of perceived air movement in regions where cooling by natural ventilation is valued [56]. In China’s hot summer and cold winter regions, natural ventilation is an important strategy for indoor environment control during transition seasons. In wind-driven cross ventilation, key factors include the size and location of inlets and outlets [57,58,59,60], as well as building forms [61]. Despite the many studies on wind-driven natural ventilation, there are limited studies on the impact of DSFs on wind-driven ventilation. Whether the two-layer structure of DSF systems could impede wind-driven ventilation and cause lower air movement than regular window-wall configurations remains unclear. Air speed is a critical factor influencing thermal comfort, particularly in warm conditions. Therefore, it is necessary to examine the impact of DSFs on indoor air velocity and subsequently on thermal comfort.
This study aimed to investigate natural ventilation in DSF buildings, focusing on air movement and its implications for thermal comfort in warmer conditions during transition seasons. Comparative measurements of both air velocities and perceived air movement in a DSF room and a traditional room were conducted. The study attempted to enhance understanding of how a DSF impacts indoor thermal comfort and to inform future research.
2. Methodology
2.1. Experiments
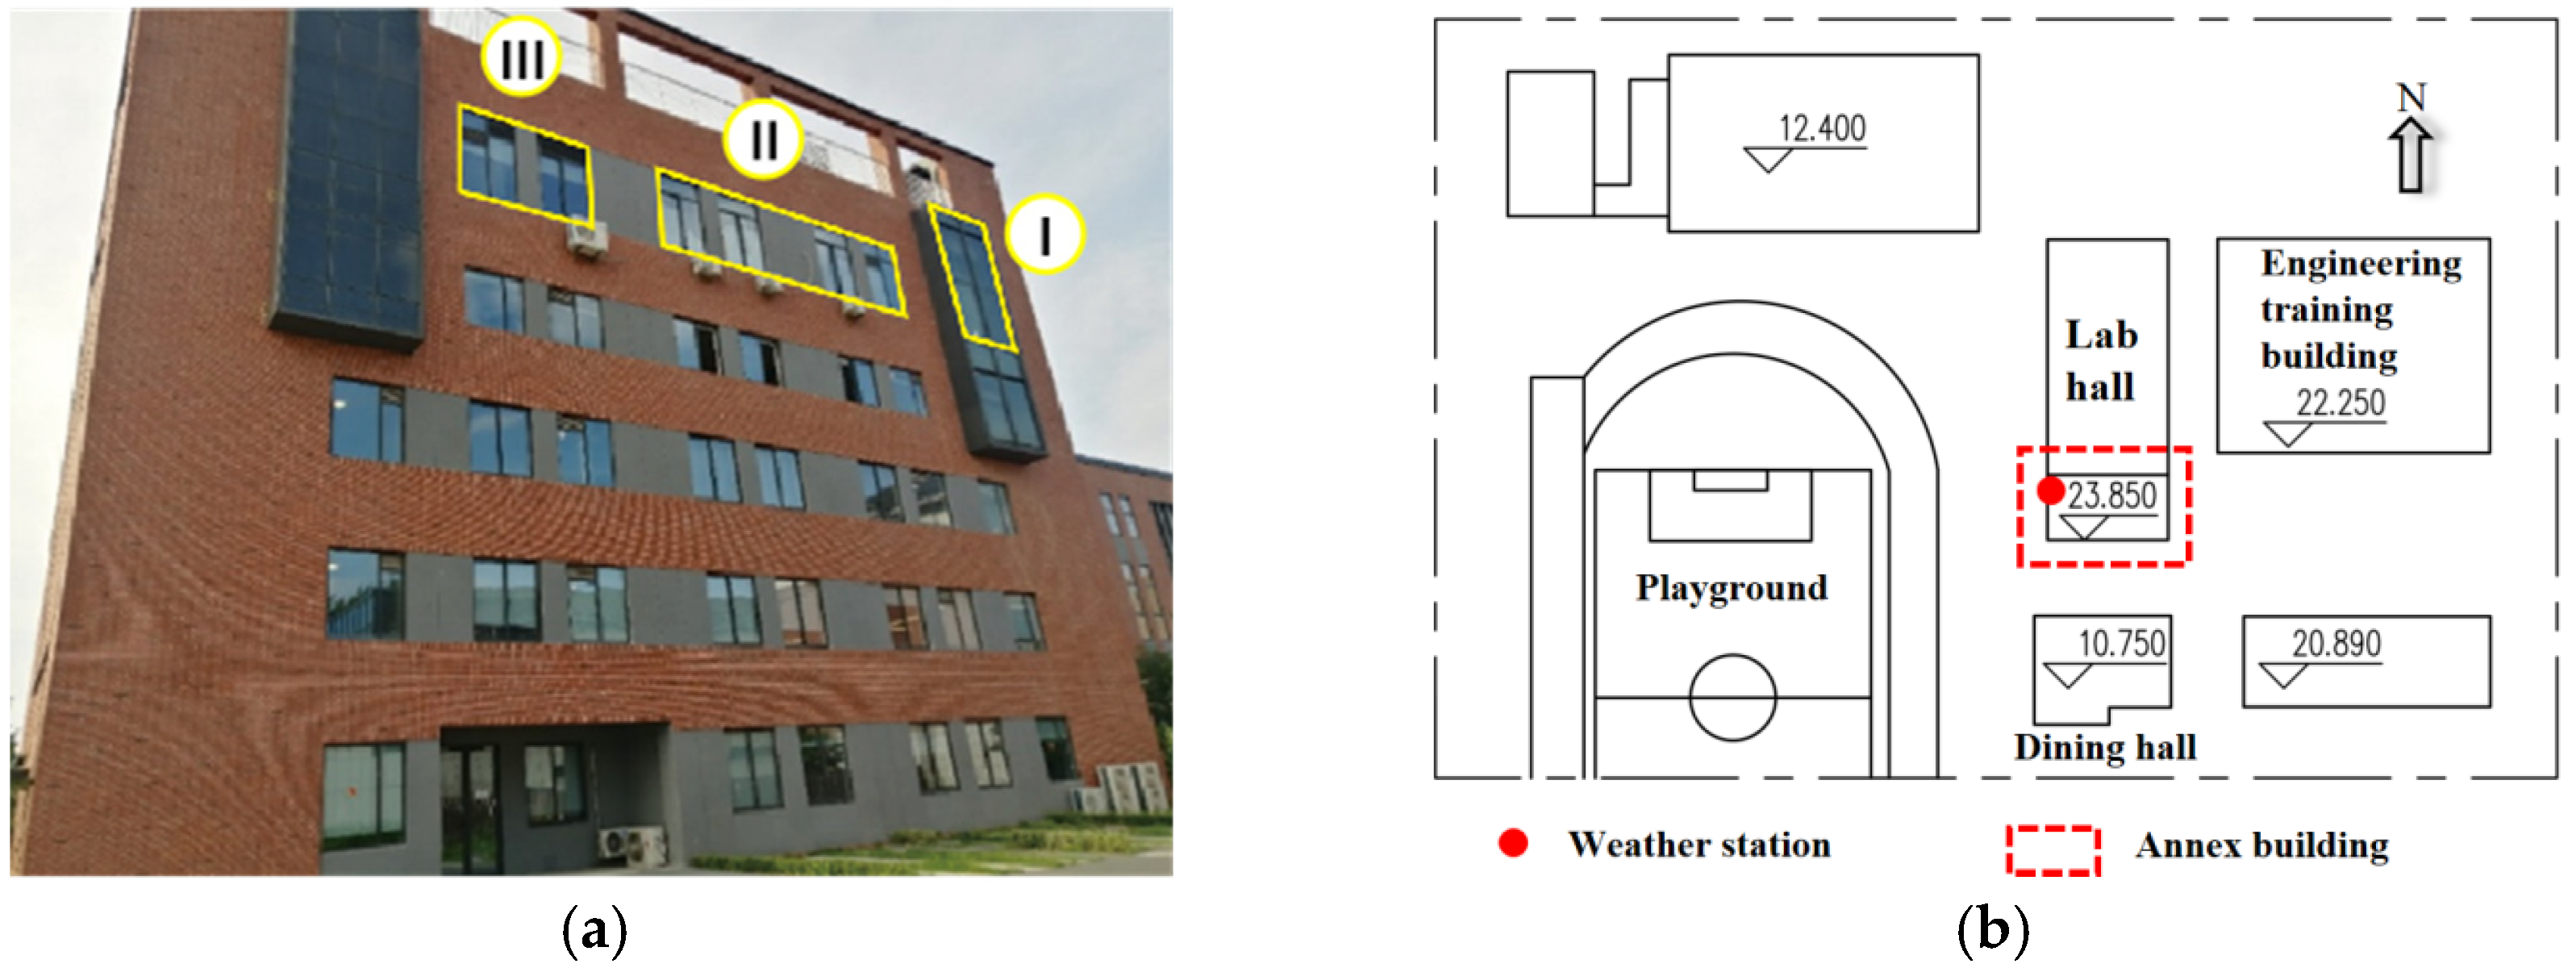
The test was conducted in two rooms (I and III in Figure 1a) located on the fifth floor of a laboratory building in Hangzhou, China. The east-facing building measures 69.2 m in length, 30.2 m in width, and 23.85 m in height. The surrounding area and buildings are illustrated in Figure 1b. A 10.75 m tall dining hall lies to the south, a playground to the west, and a 22.25 m tall engineering training building to the east. The north section of the building is a laboratory hall, and the south section is a five-story annex building. The two sections share a solid wall with no openings or windows.

Figure 1.
Overview of the test site and surroundings (unit: m): (a) Picture of the south side of the annex building and the three rooms I, II, III; (b) sketch of test site and surroundings.
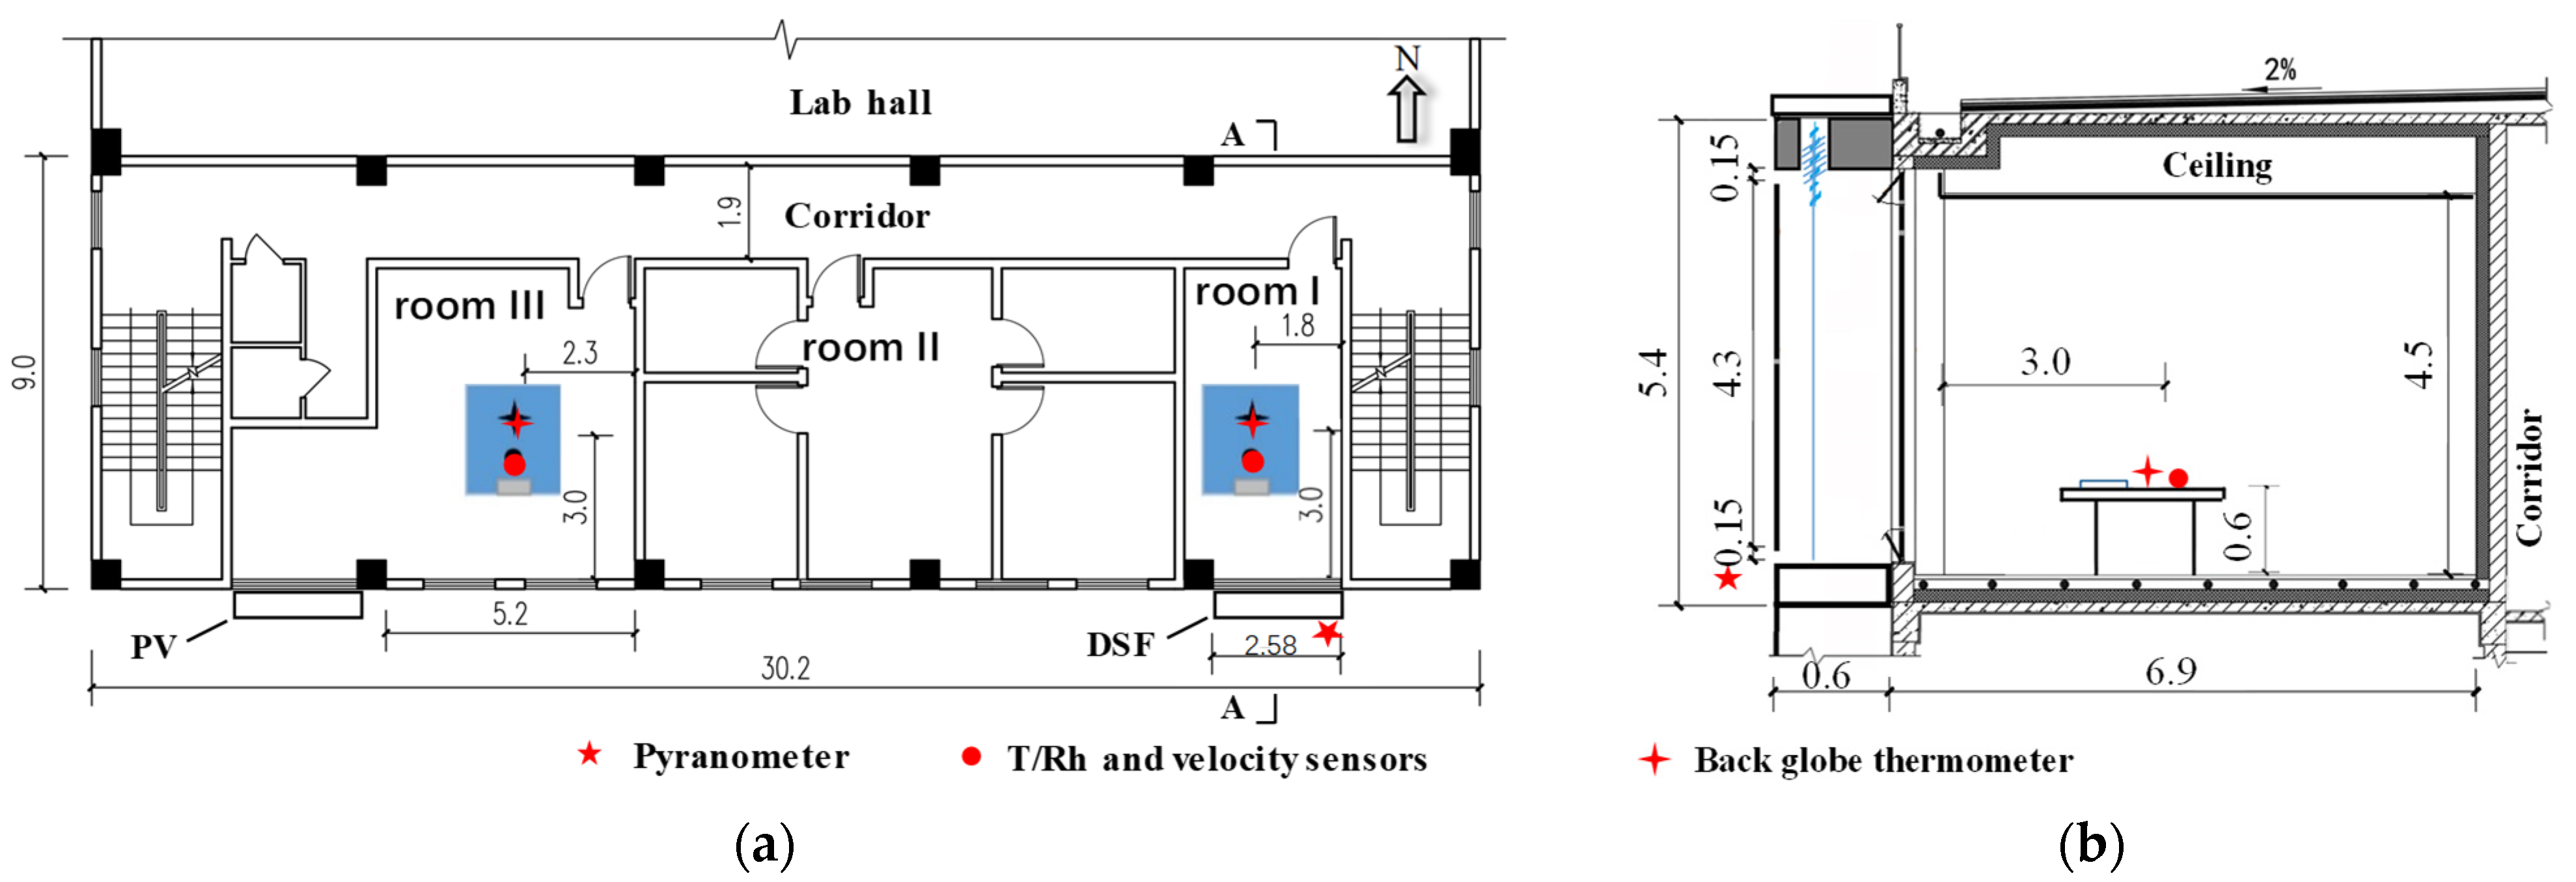
Figure 2 shows a plan view of the fifth floor. Room I is the DSF room. Room II is actually a collection of several rooms simulating an apartment. Room III is the control room with conventional walls and windows. The westernmost window of room III is covered by a ventilated PV façade, which extends from the fourth floor to the fifth floor. The south side of room I consists of a DSF (2.58 m wide) and a solid wall (0.9 m wide). All walls are made of aerated concrete bricks and insulated with 100 mm-thick polyurethane (PU) panels and 10 mm-thick plaster boards. The ceiling and the floor are also insulated to the same extent. None of the rooms were air-conditioned during the study.
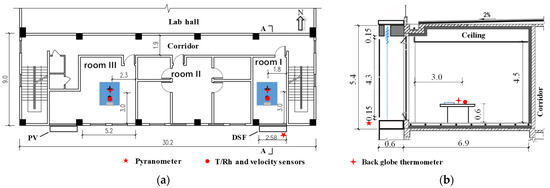
Figure 2.
Plan view of the fifth floor and the measuring points (unit: m): (a) plan view of the fifth floor; (b) sectional view.
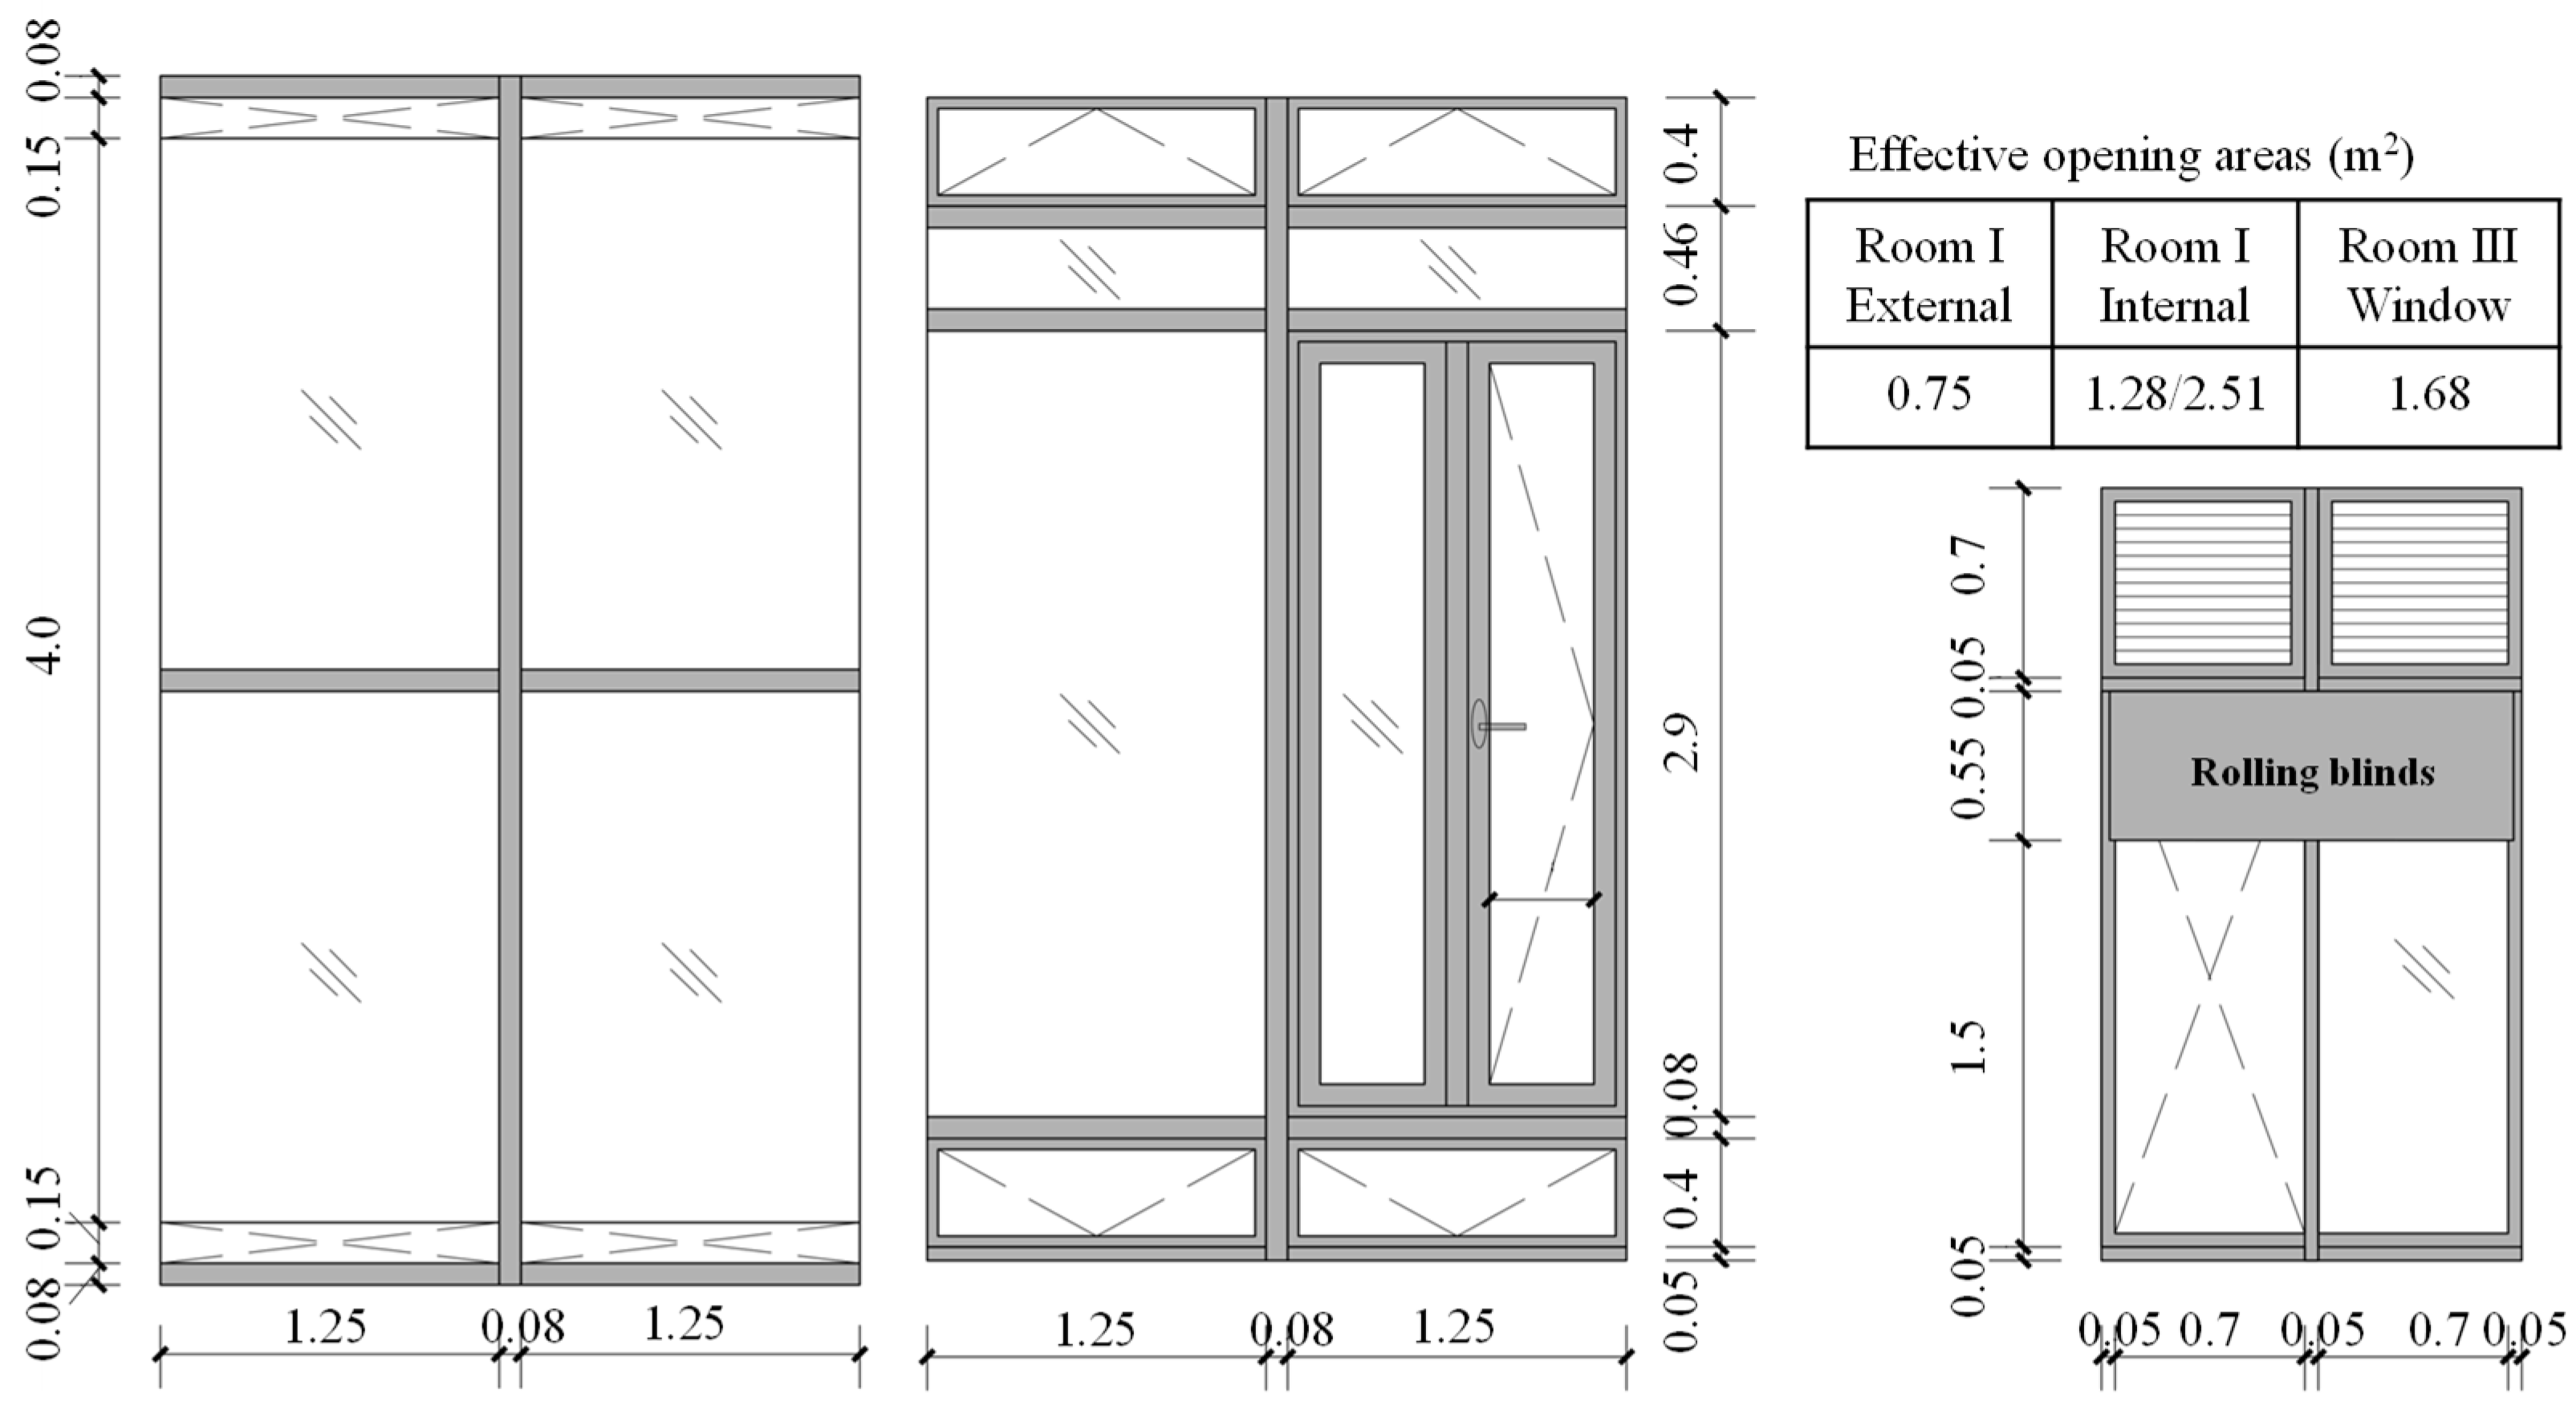
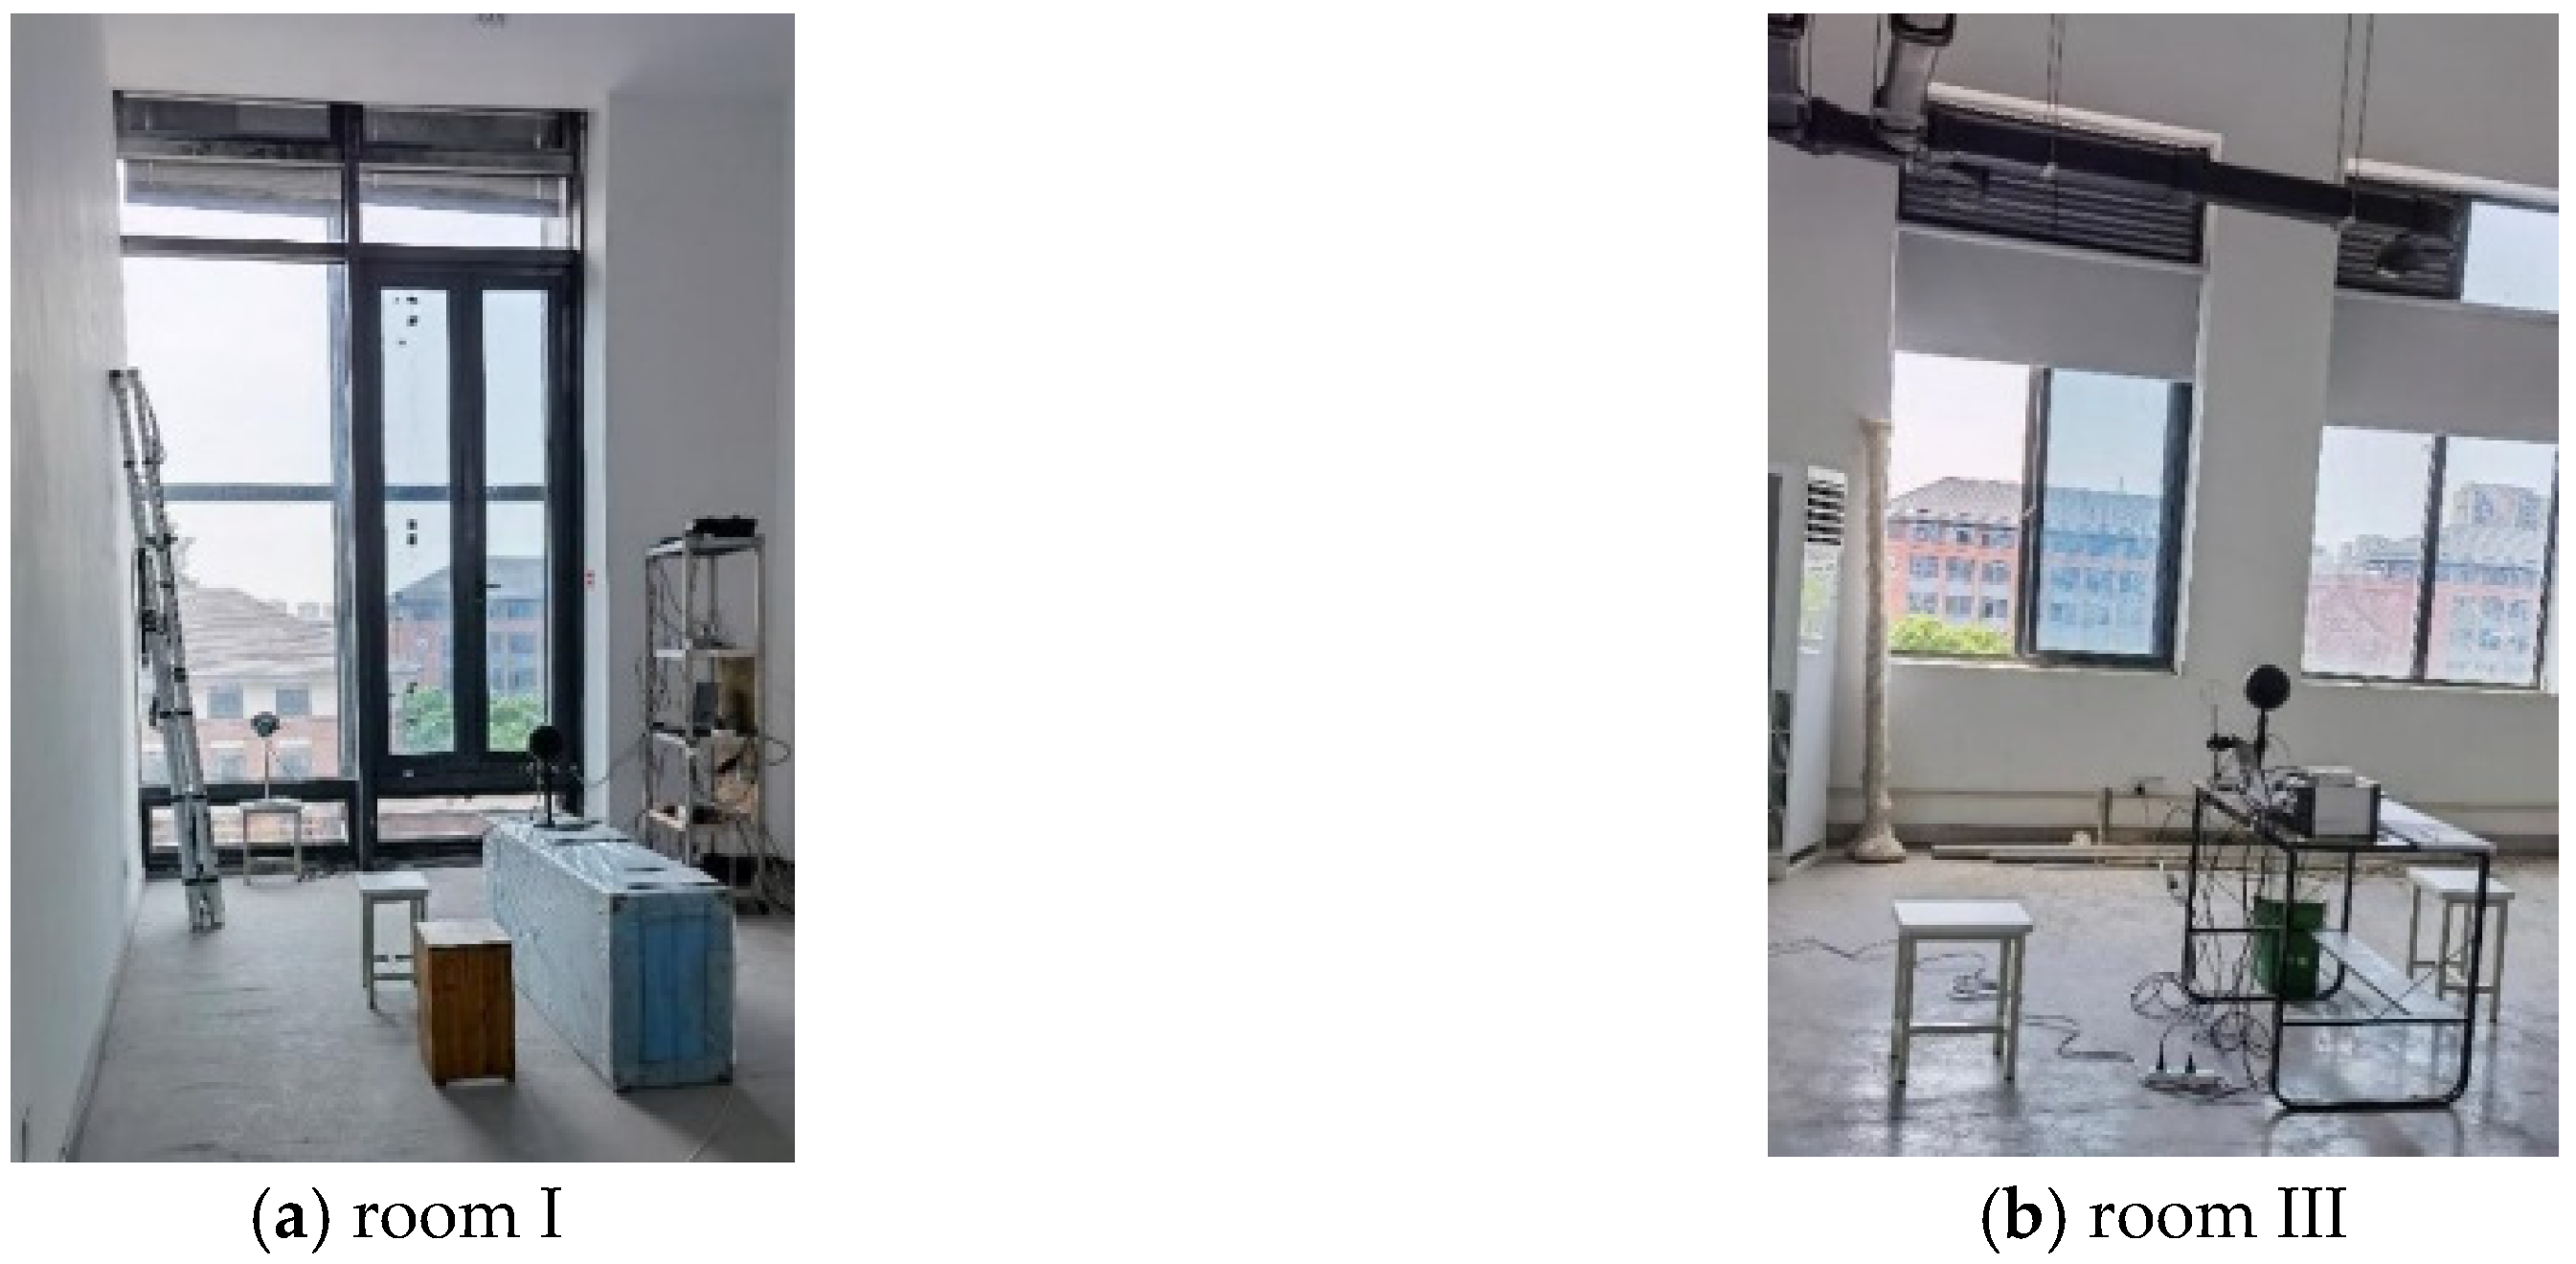
The DSF system is 9 m tall, extending from the fourth floor to the fifth floor, with solid separation between them. It features single glazing as the external layer and double glazing as the internal layer. The external layer is made of tempered laminated glass, with openings of 0.15 m in height at both the top and bottom (Figure 3). The opening area of the external layer is 0.75 m2 (an opening ratio of 4.7%). The internal layer has five operable windows: two awning windows at the top (maximum opening angle 30°), two hopper windows at the bottom (maximum opening angle 30°), and one casement window (maximum opening angle 90°) in the middle. The opening area of the internal layer is 1.28 m2 when the casement window is closed and 2.51 m2 when the casement window is fully open. The cavity depth is 0.6 m. Room III has three sliding windows, but only the leftmost one was kept fully open during the study (Figure 4b). The upper part of the window has two openings with grills. In addition, there is one more grilled opening in the middle window (Figure 4b). Considering the blockage of the rolling blinds and an opening ratio of 0.5 (based on the bar width and spacing) for the grilled openings, the effective opening area of the windows in room III was estimated to be 1.68 m2. During the test, a natural cross-ventilation scheme was implemented. To achieve this, the door (1.0 m × 2.1 m) of each room was left open. The east and west windows of the corridor were also left open (opening area = 1.2 m × 1.8 m = 2.96 m2).
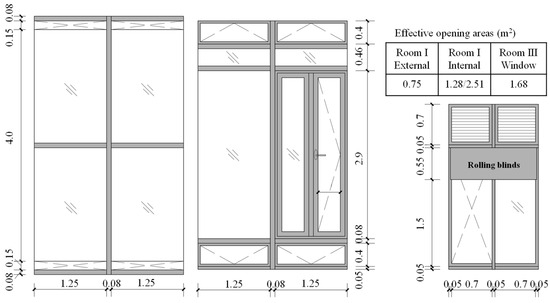
Figure 3.
Dimensions and openings of the DSF layers and the sliding window of room III (unit: m): (from left to right: external layer, internal layer of the DSF, window).

Figure 4.
Pictures of the two tested rooms.
The measured variables included vertical solar irradiation, indoor and outdoor temperatures, relative humidity, black globe temperatures, and air velocities. The measuring points are illustrated in Figure 2. Table 1 lists the sensors used in the experiment and their corresponding sampling intervals. Ambient temperature and solar radiation data were recorded by a weather station located on the building’s roof (Figure 1b).

Table 1.
Sensors used in the experiments and the corresponding sampling intervals.
2.2. Airflow Sensation Survey
Students with various majors were recruited from local universities to represent potential urban office occupants. These volunteers had no prior knowledge of DSFs. All information regarding the DSF, building ventilation, or thermal comfort was withheld before the test. Prior to entering the test rooms, the participants were required to stay calmly in the waiting room (room II) for at least 30 min. Similar to the two test rooms, room II was not air-conditioned, and all rooms maintained comparable temperatures during the survey periods. To ensure relatively stable environmental conditions, each survey period was limited to within 1.5 h. In each sensation survey, the participants spent 5 min in one room (a duration deemed adequate for air movement sensation) and then completed the survey forms before switching to the other room. To minimize the interference of their presence on the indoor environment, the number of respondents in each room was limited to two at a time. Then they swapped rooms. With this arrangement, each respondent finished the sensation assessment of both rooms within approximately 10 min.
The survey questionnaire focused on two primary aspects: perceived thermal comfort and air movement sensation. The thermal comfort vote (TCV) was measured using a five-point scale (1 = least comfortable to 5 = most comfortable). Air movement perception was evaluated on a five-point scale (1 =no feeling to 5 = strongest feeling). The desire for a larger window opening was also evaluated on a four-point scale (1 = not aware of this issue and 2 to 4 = varied degrees of desire for larger openings). The complete questionnaire details are provided in Appendix A.
3. Results
Three tests were conducted between 14 May and 2 June with the same settings, except that the casement window on the internal layer of the DSF was fully open during the second test but closed during the other two tests. In all tests, the top and bottom openings of both DSF layers were kept open in room I. In room III, only the leftmost of the three sliding windows was open. Three sensation surveys were conducted in the third test.
3.1. Weather Data and Indoor Environment Measurement
Figure 5, Figure 6 and Figure 7 present the measured temperatures, relative humidity, and air velocities in the two rooms, along with the corresponding ambient temperature, radiation, and wind conditions during the three tests. There was an issue with the weather station during the third test. As a result, the wind data were missing, and the ambient temperature was measured by a radiation-shielded thermocouple positioned right outside the DSF. The horizontal solar radiation is presented in Figure 5, while the vertical solar radiation outside the external layer of the DSF is presented in Figure 6 and Figure 7.


Figure 5.
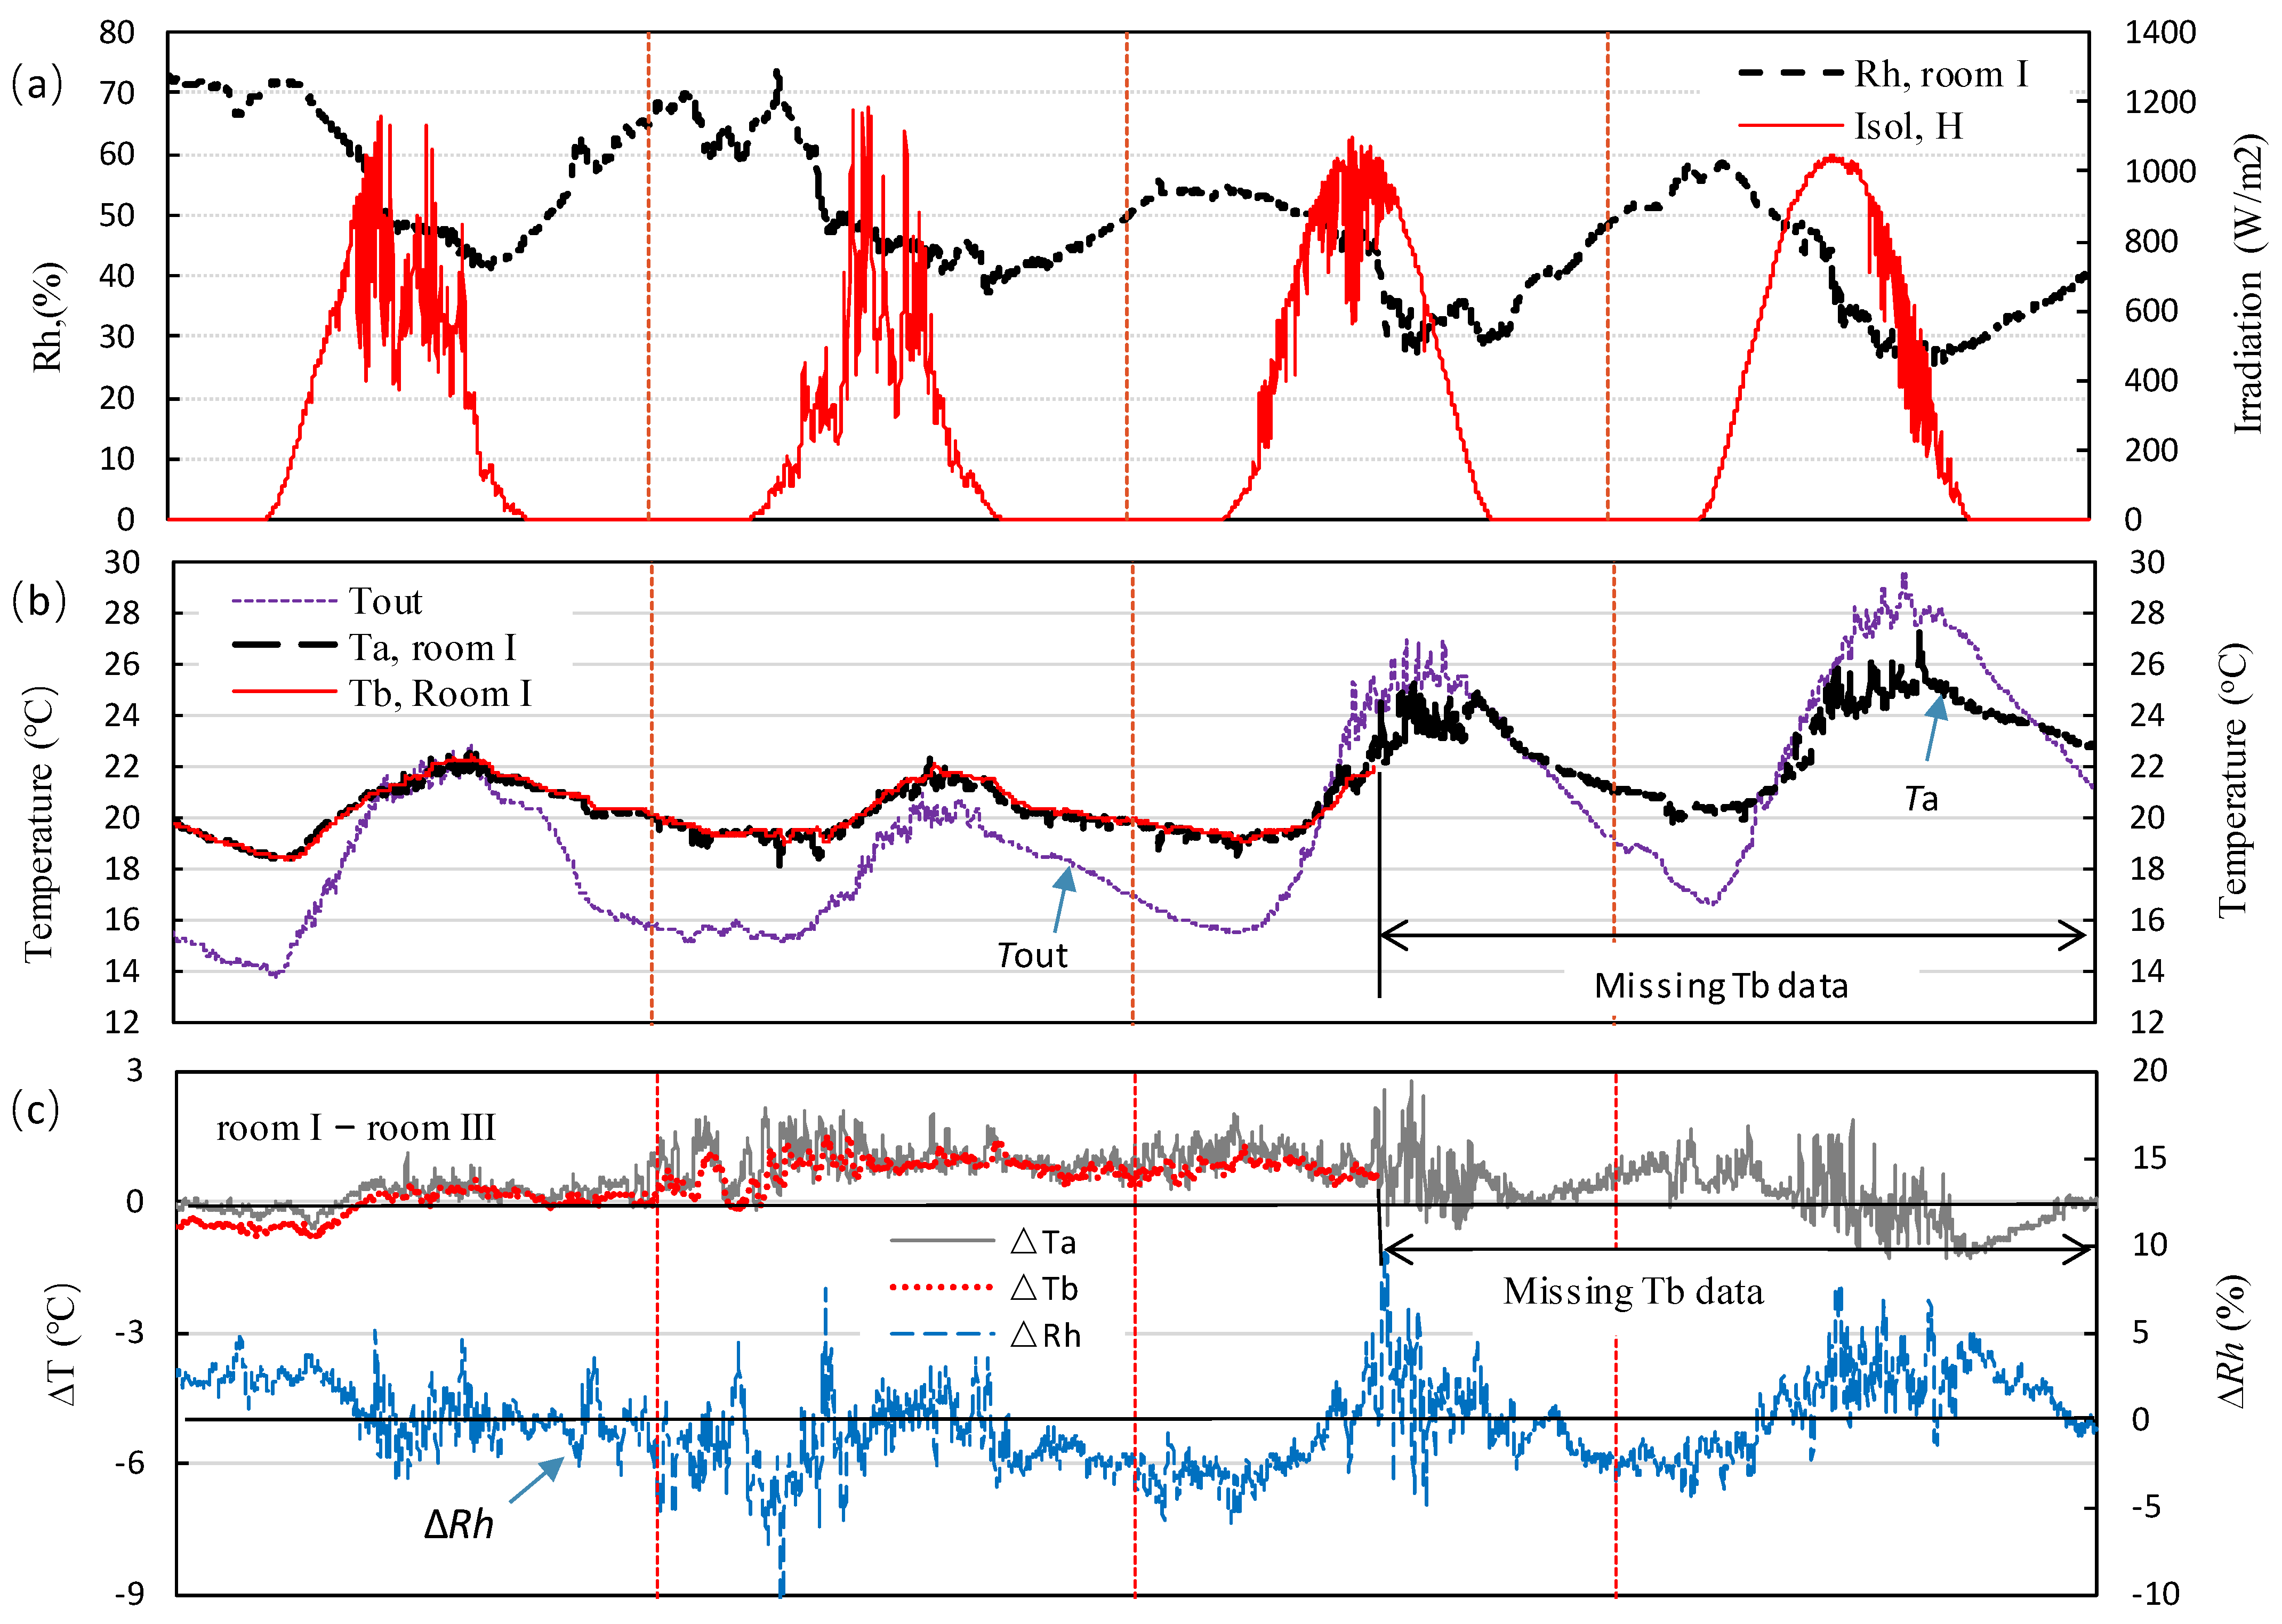
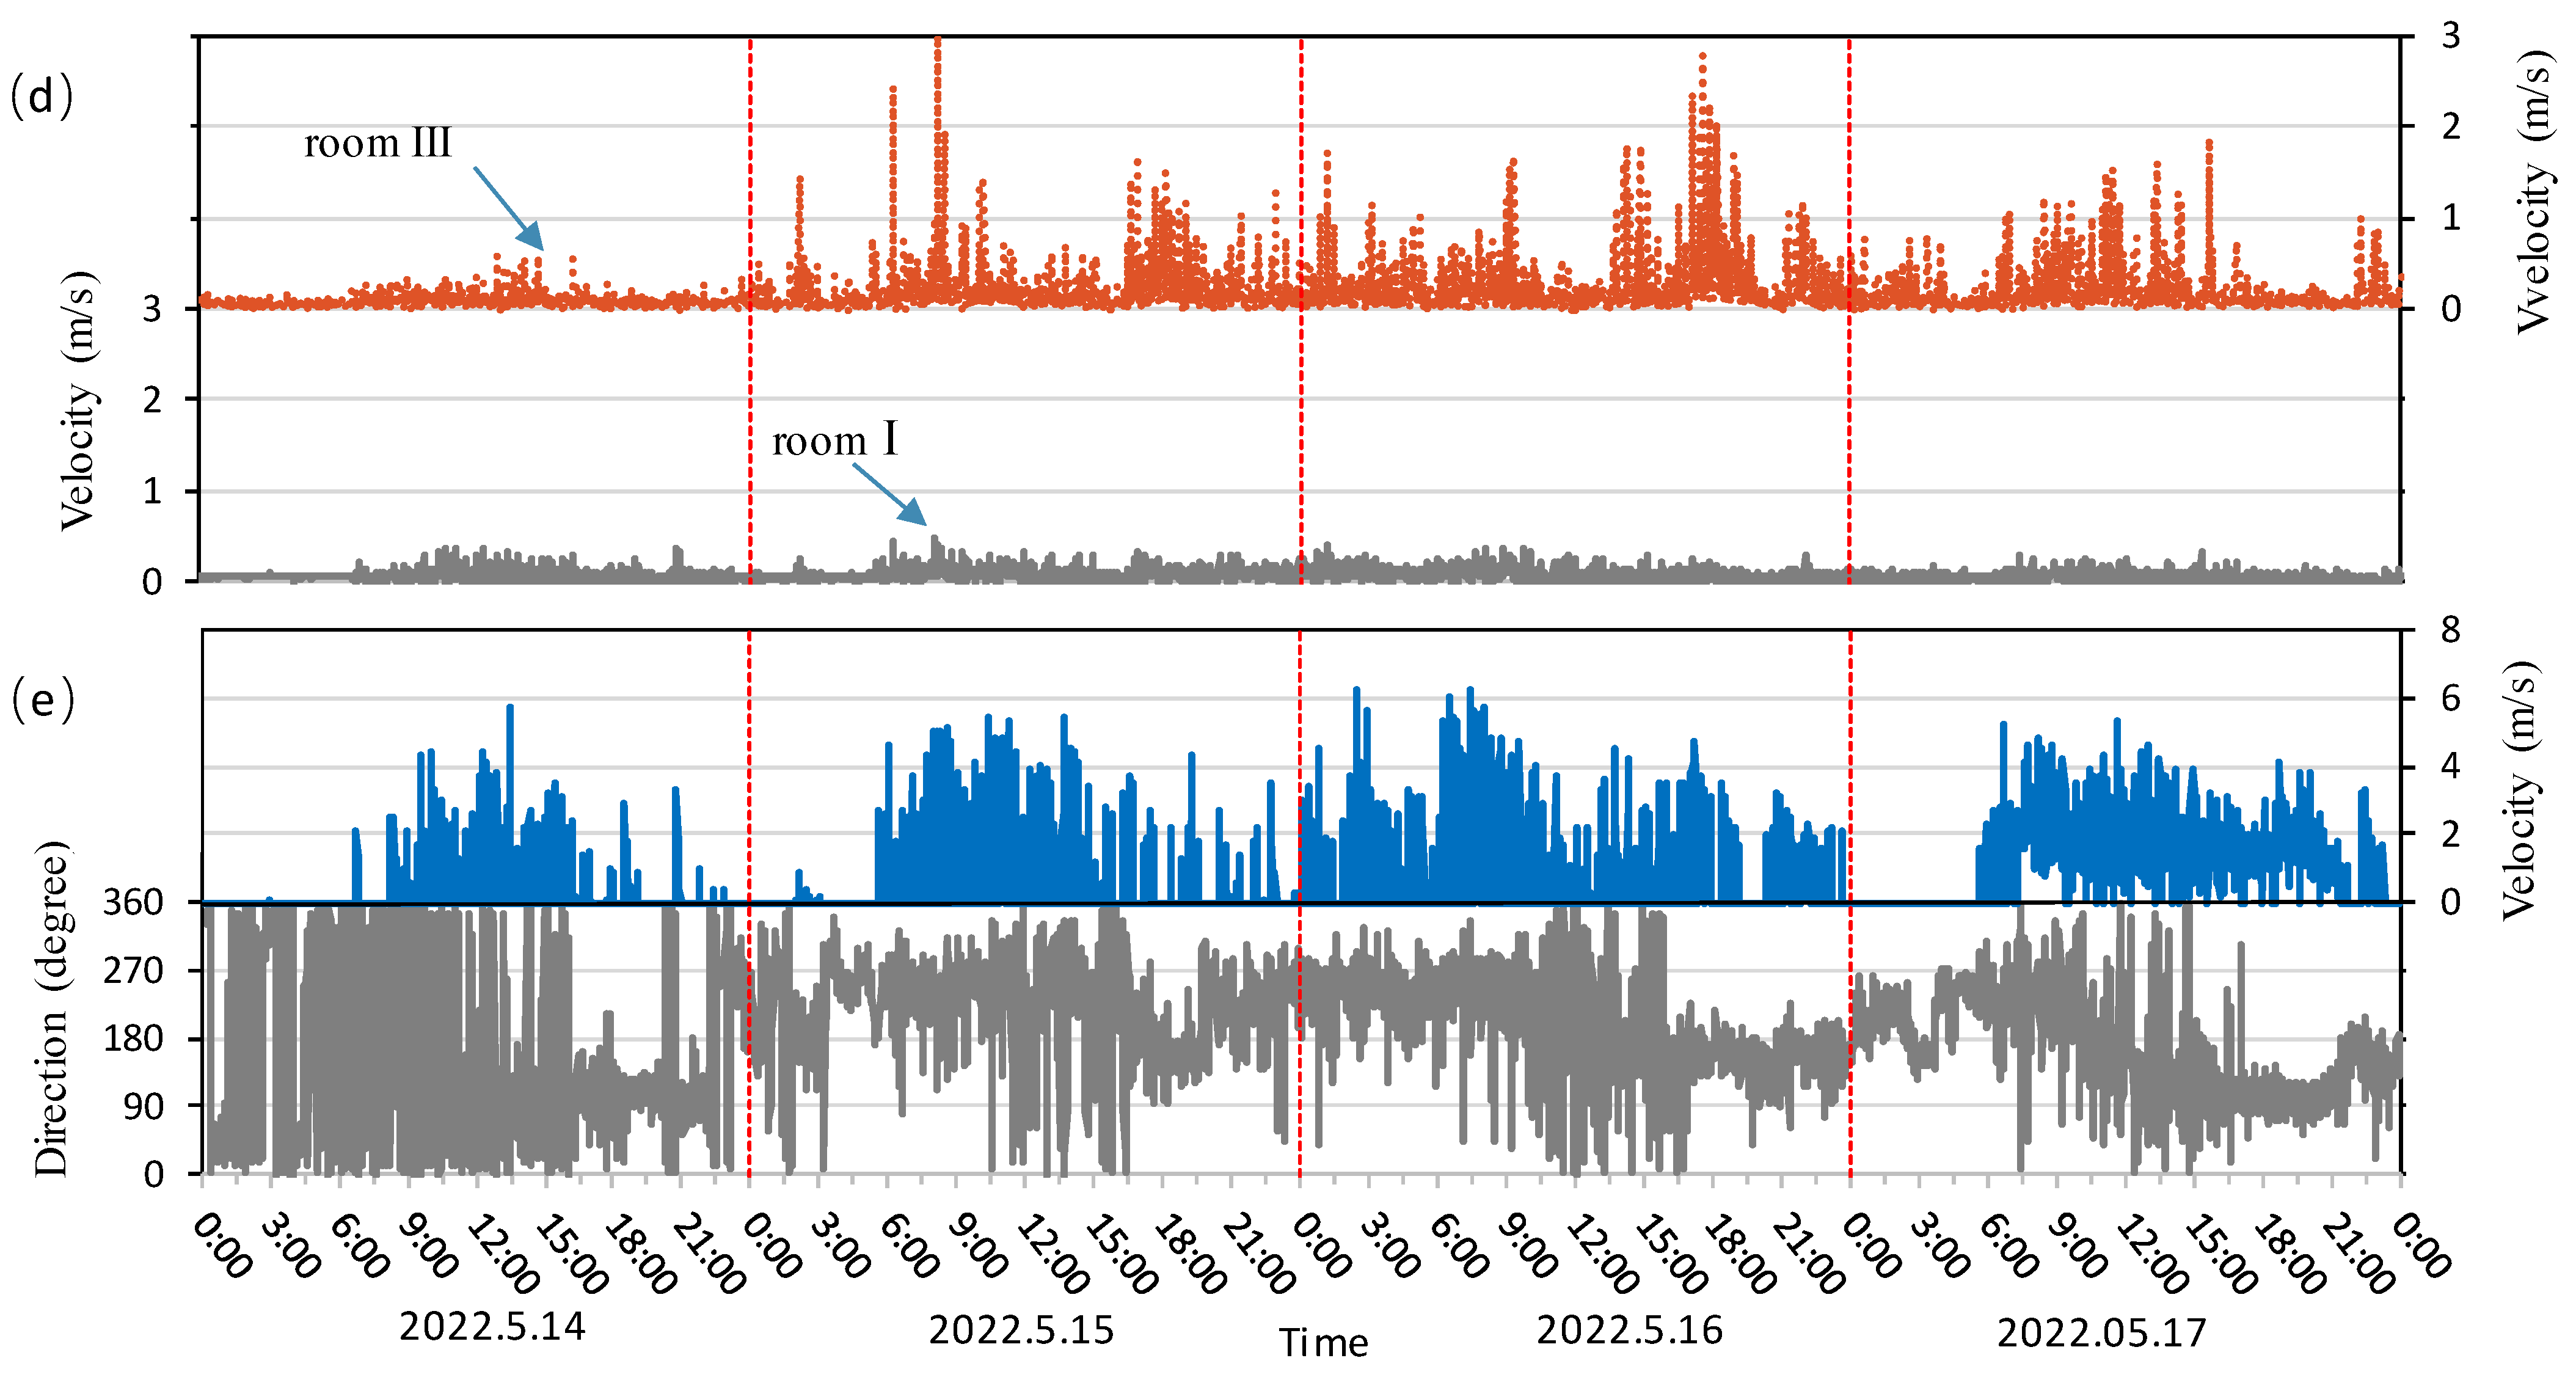
Test 1: measurement data from 14 May to 17 May (casement window closed): (a) relative humidity in room I and rooftop horizontal solar radiation; (b) ambient temperature and air temperature of room I; (c) differences in temperature and relative humidity between rooms I and III; (d) air velocities in rooms I and III; (e) wind speed and direction recorded at rooftop weather station.


Figure 6.
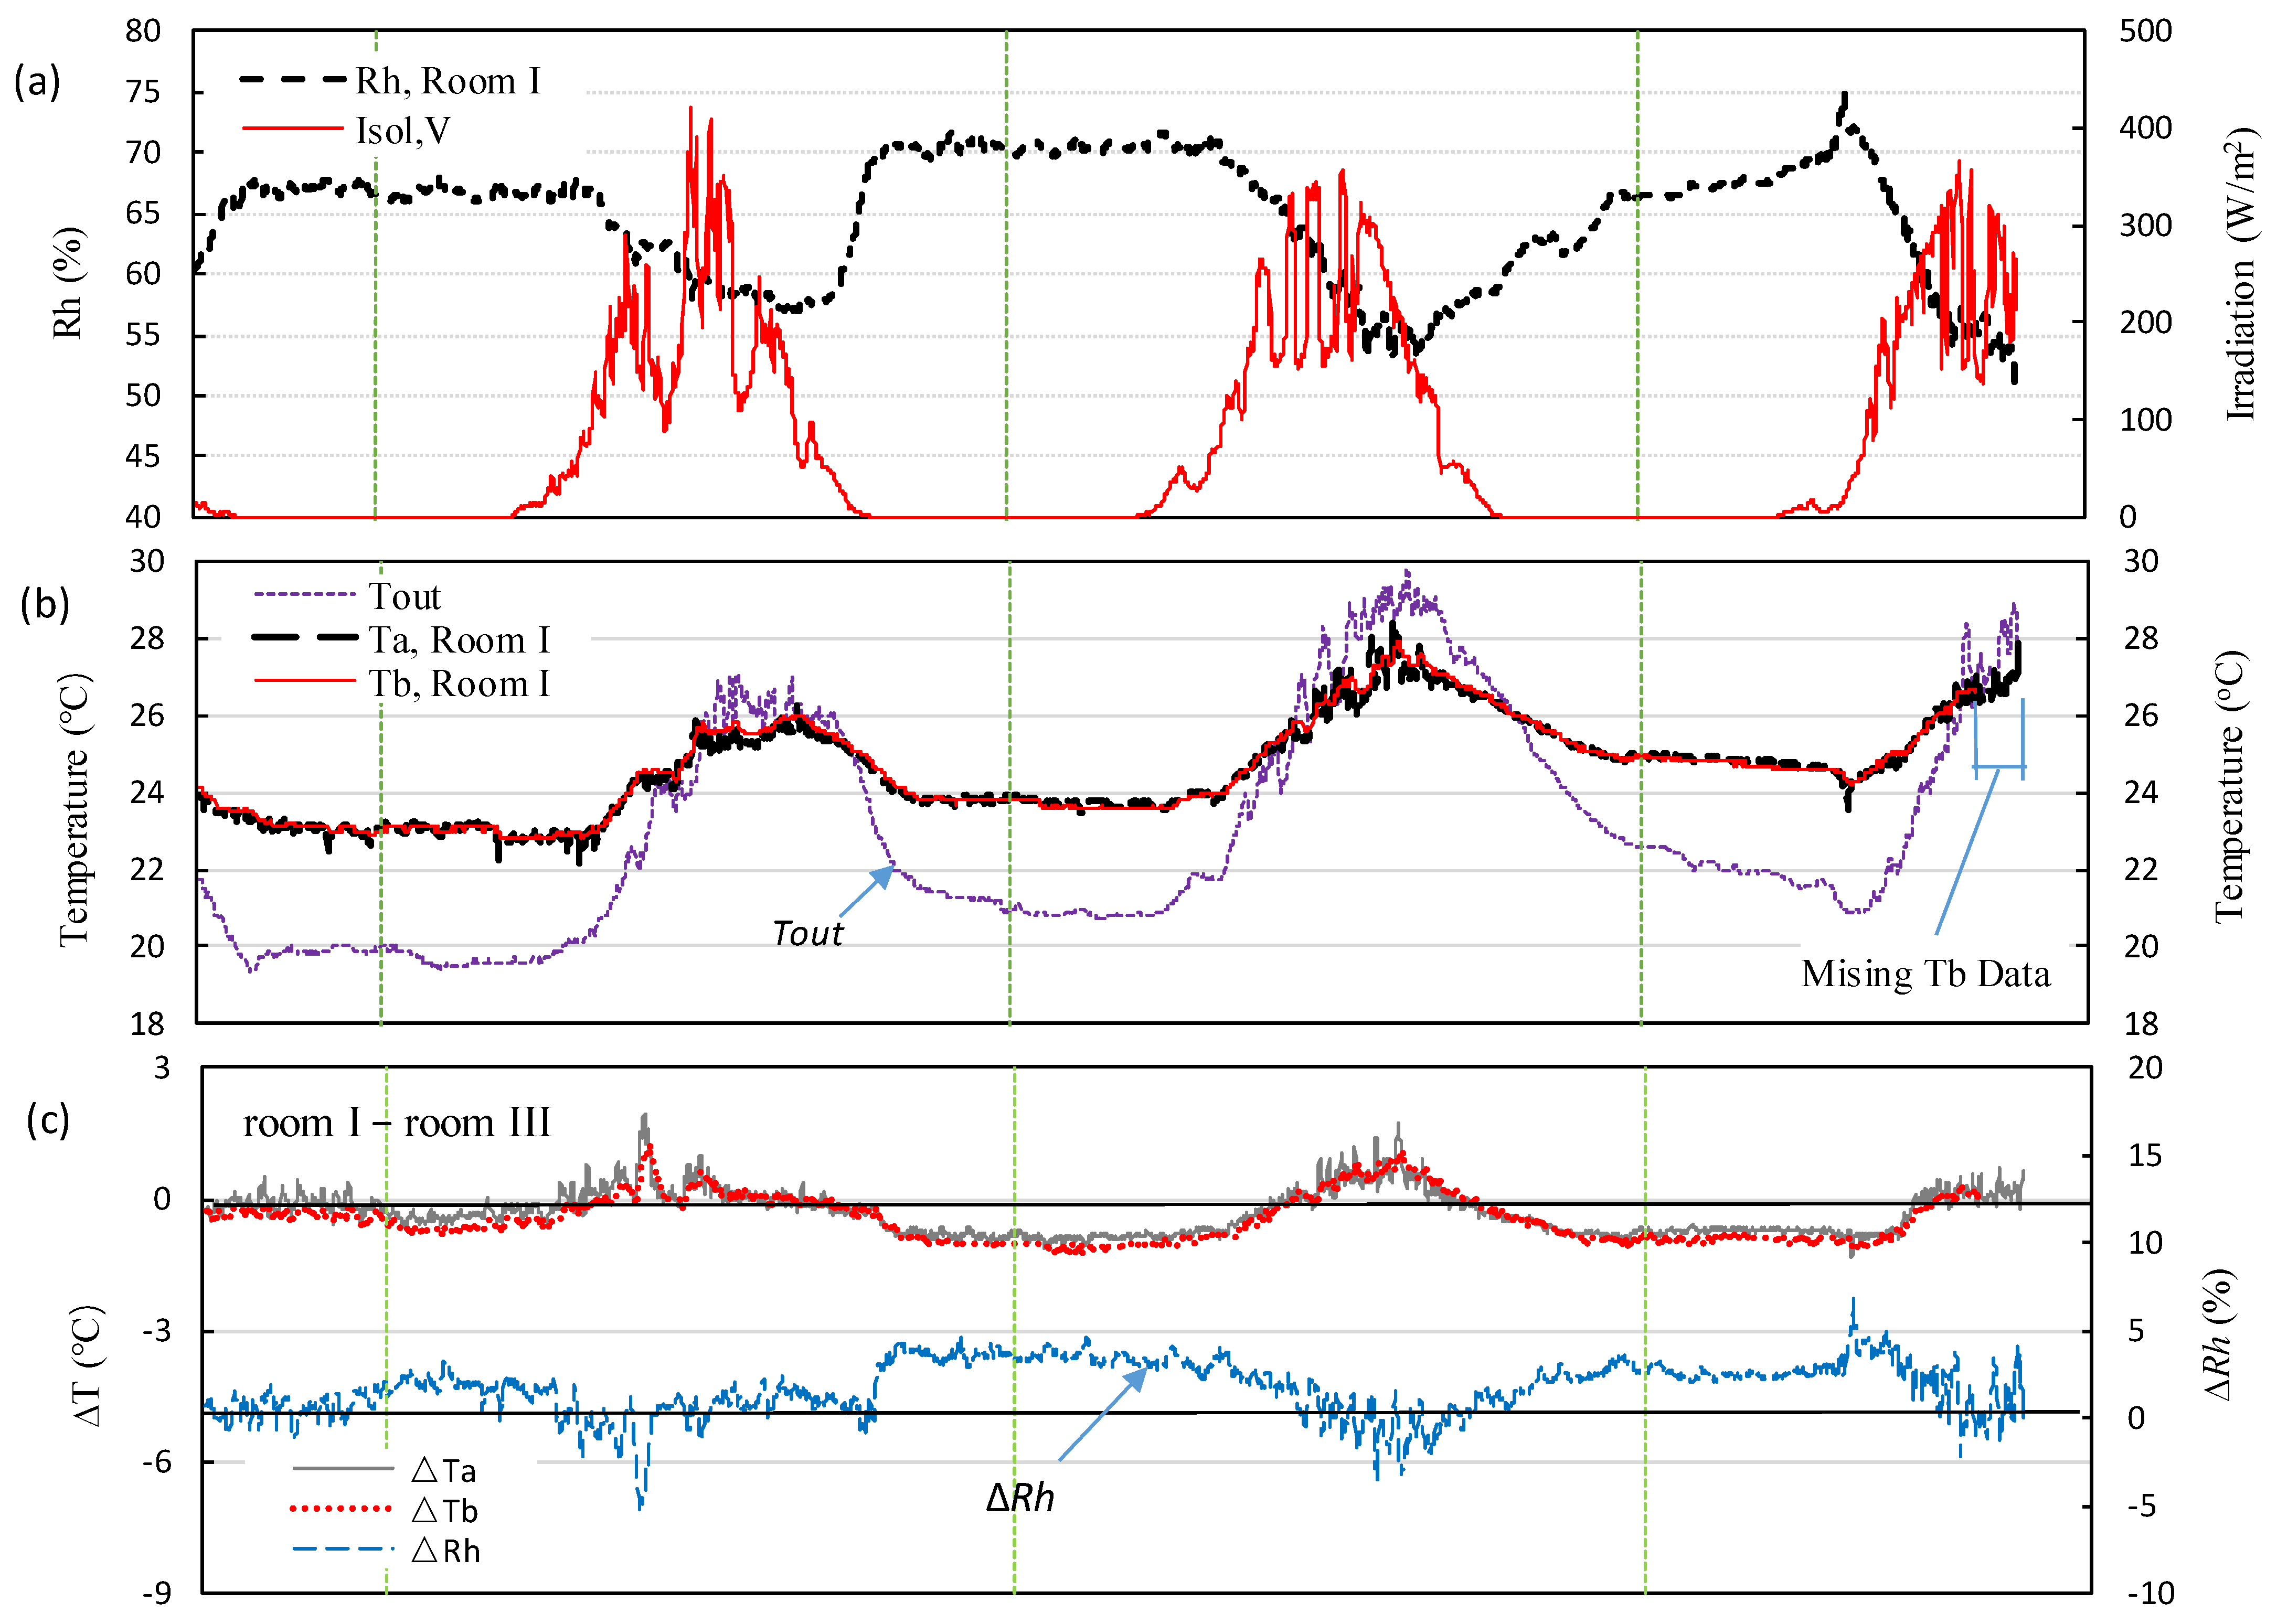
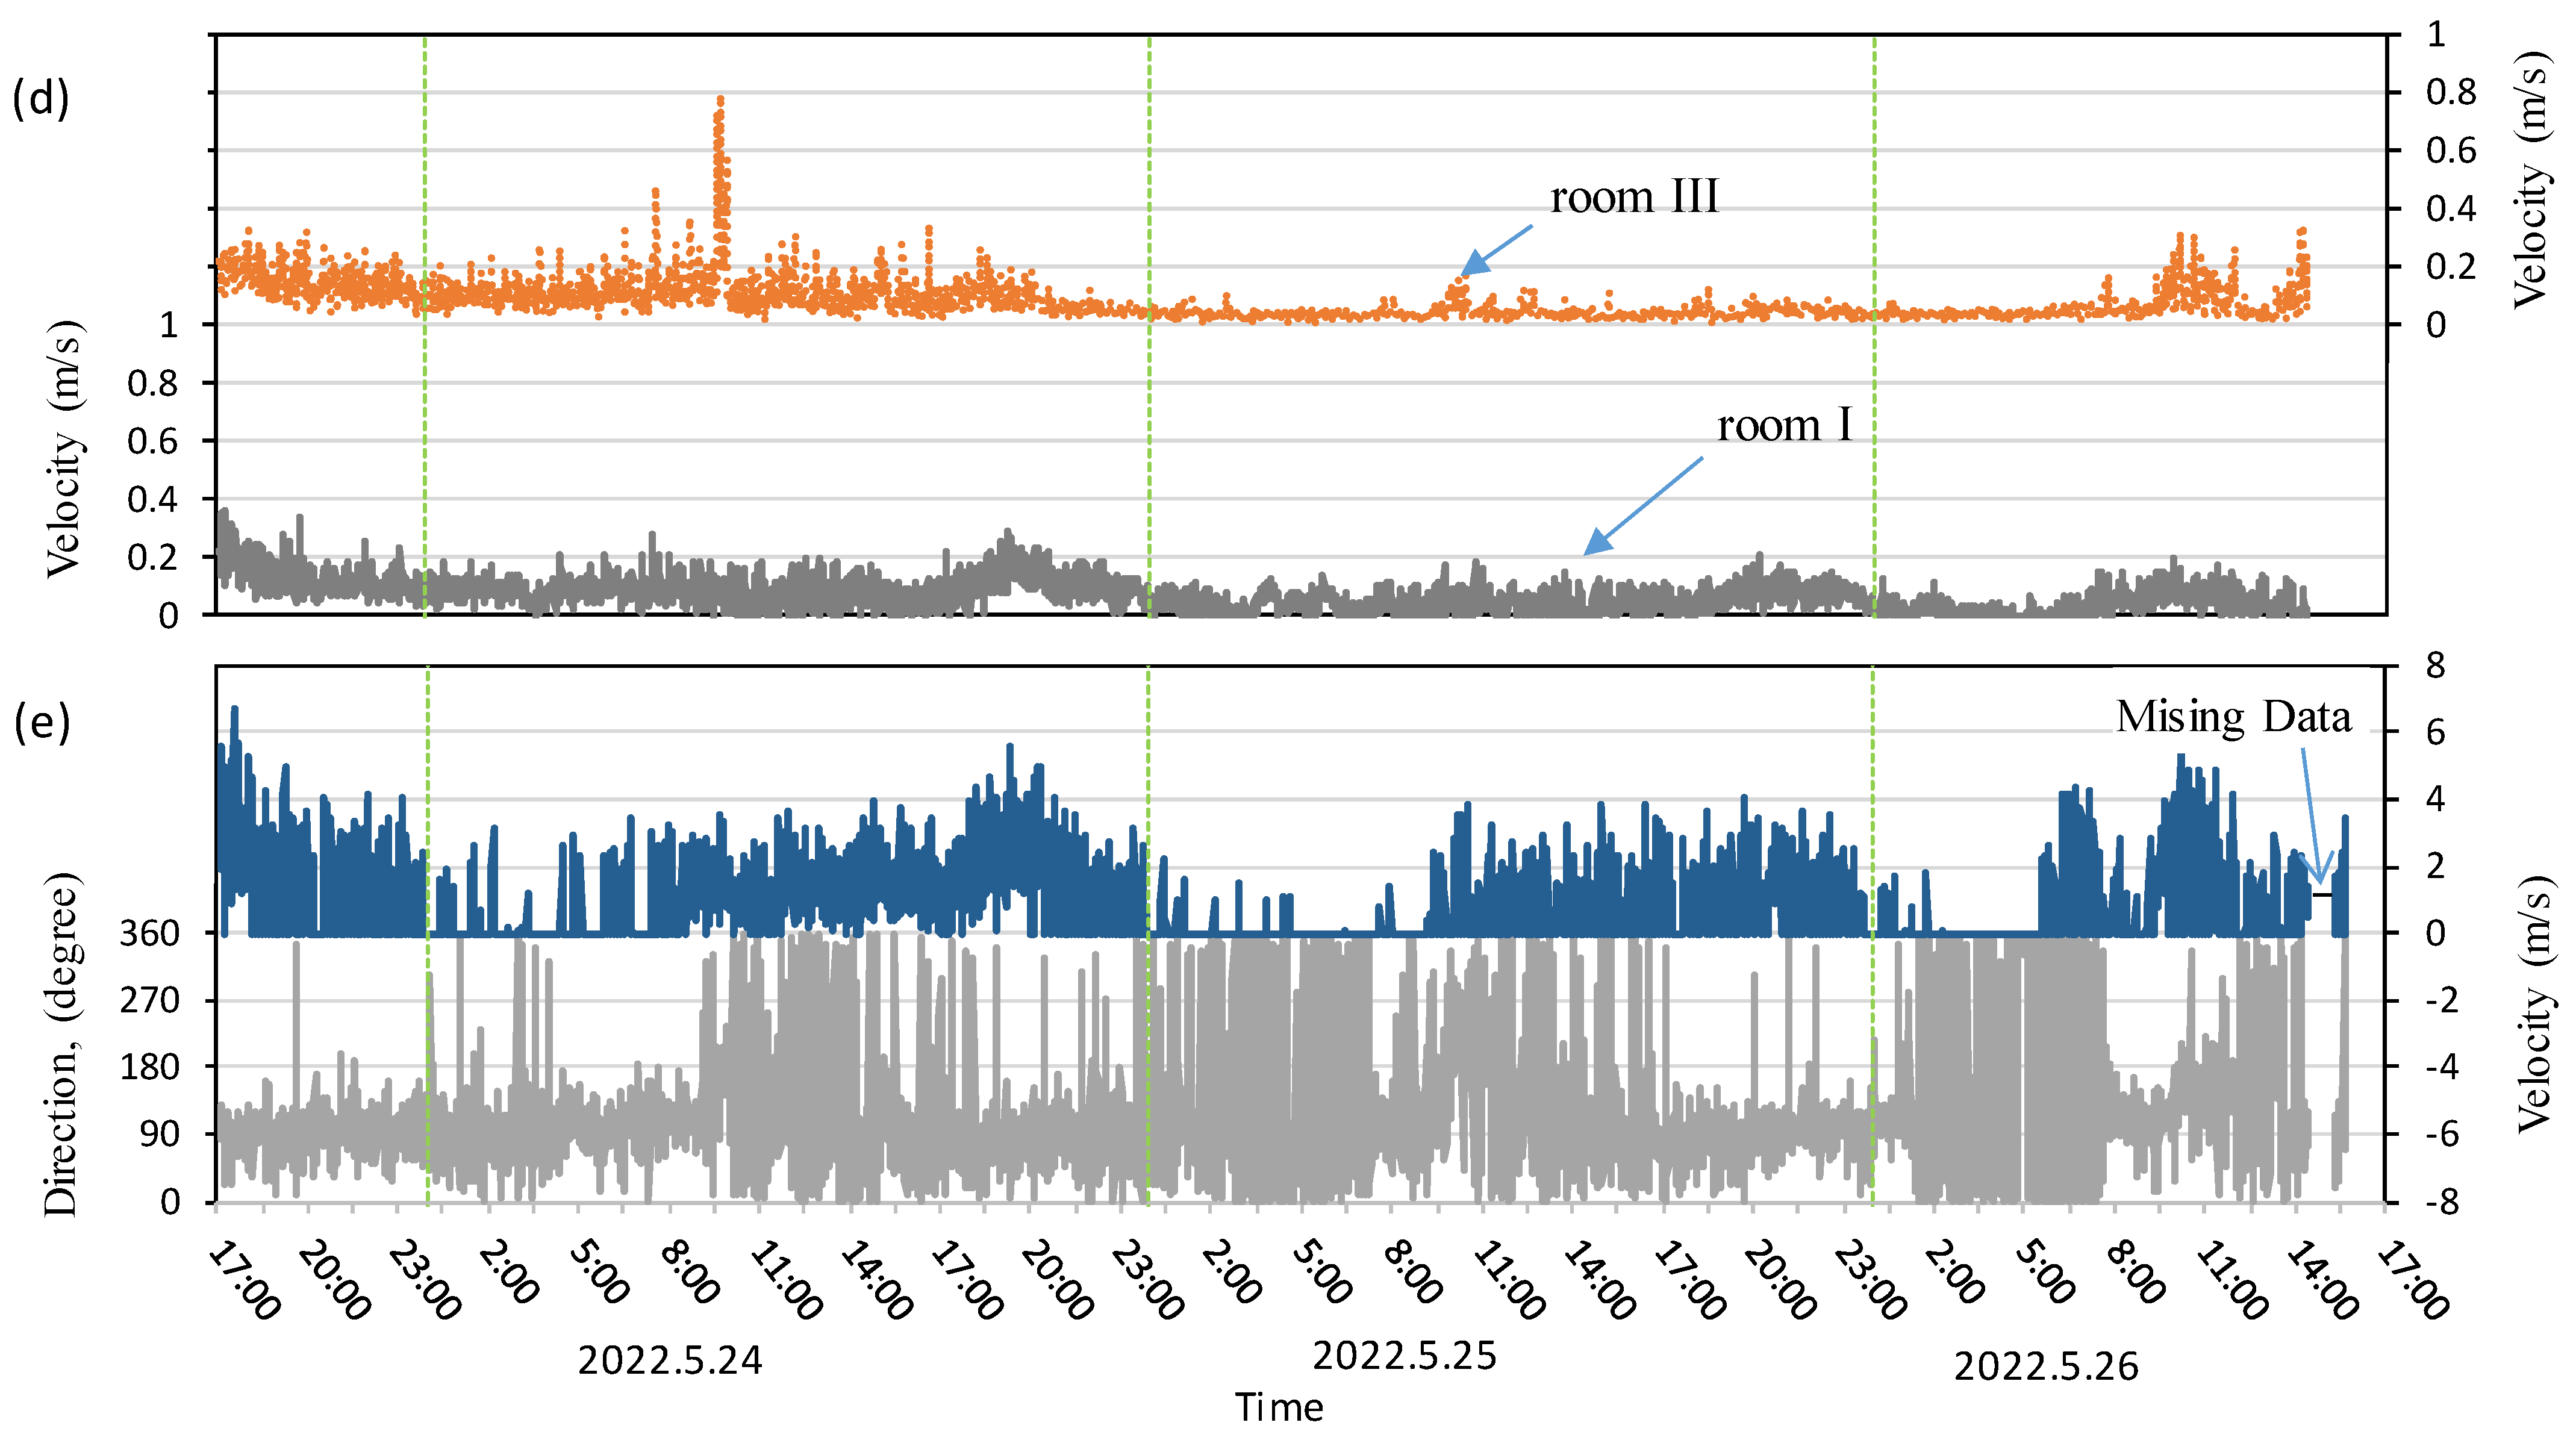
Test 2: measurement data from 23 May to 26 May: (a) relative humidity in room I and vertical irradiation at the facade surface; (b) ambient temperature and air temperature of room I; (c) differences in temperature and relative humidity between rooms I and III; (d) air velocities in rooms I and III; (e) wind speed and direction recorded at rooftop weather station.


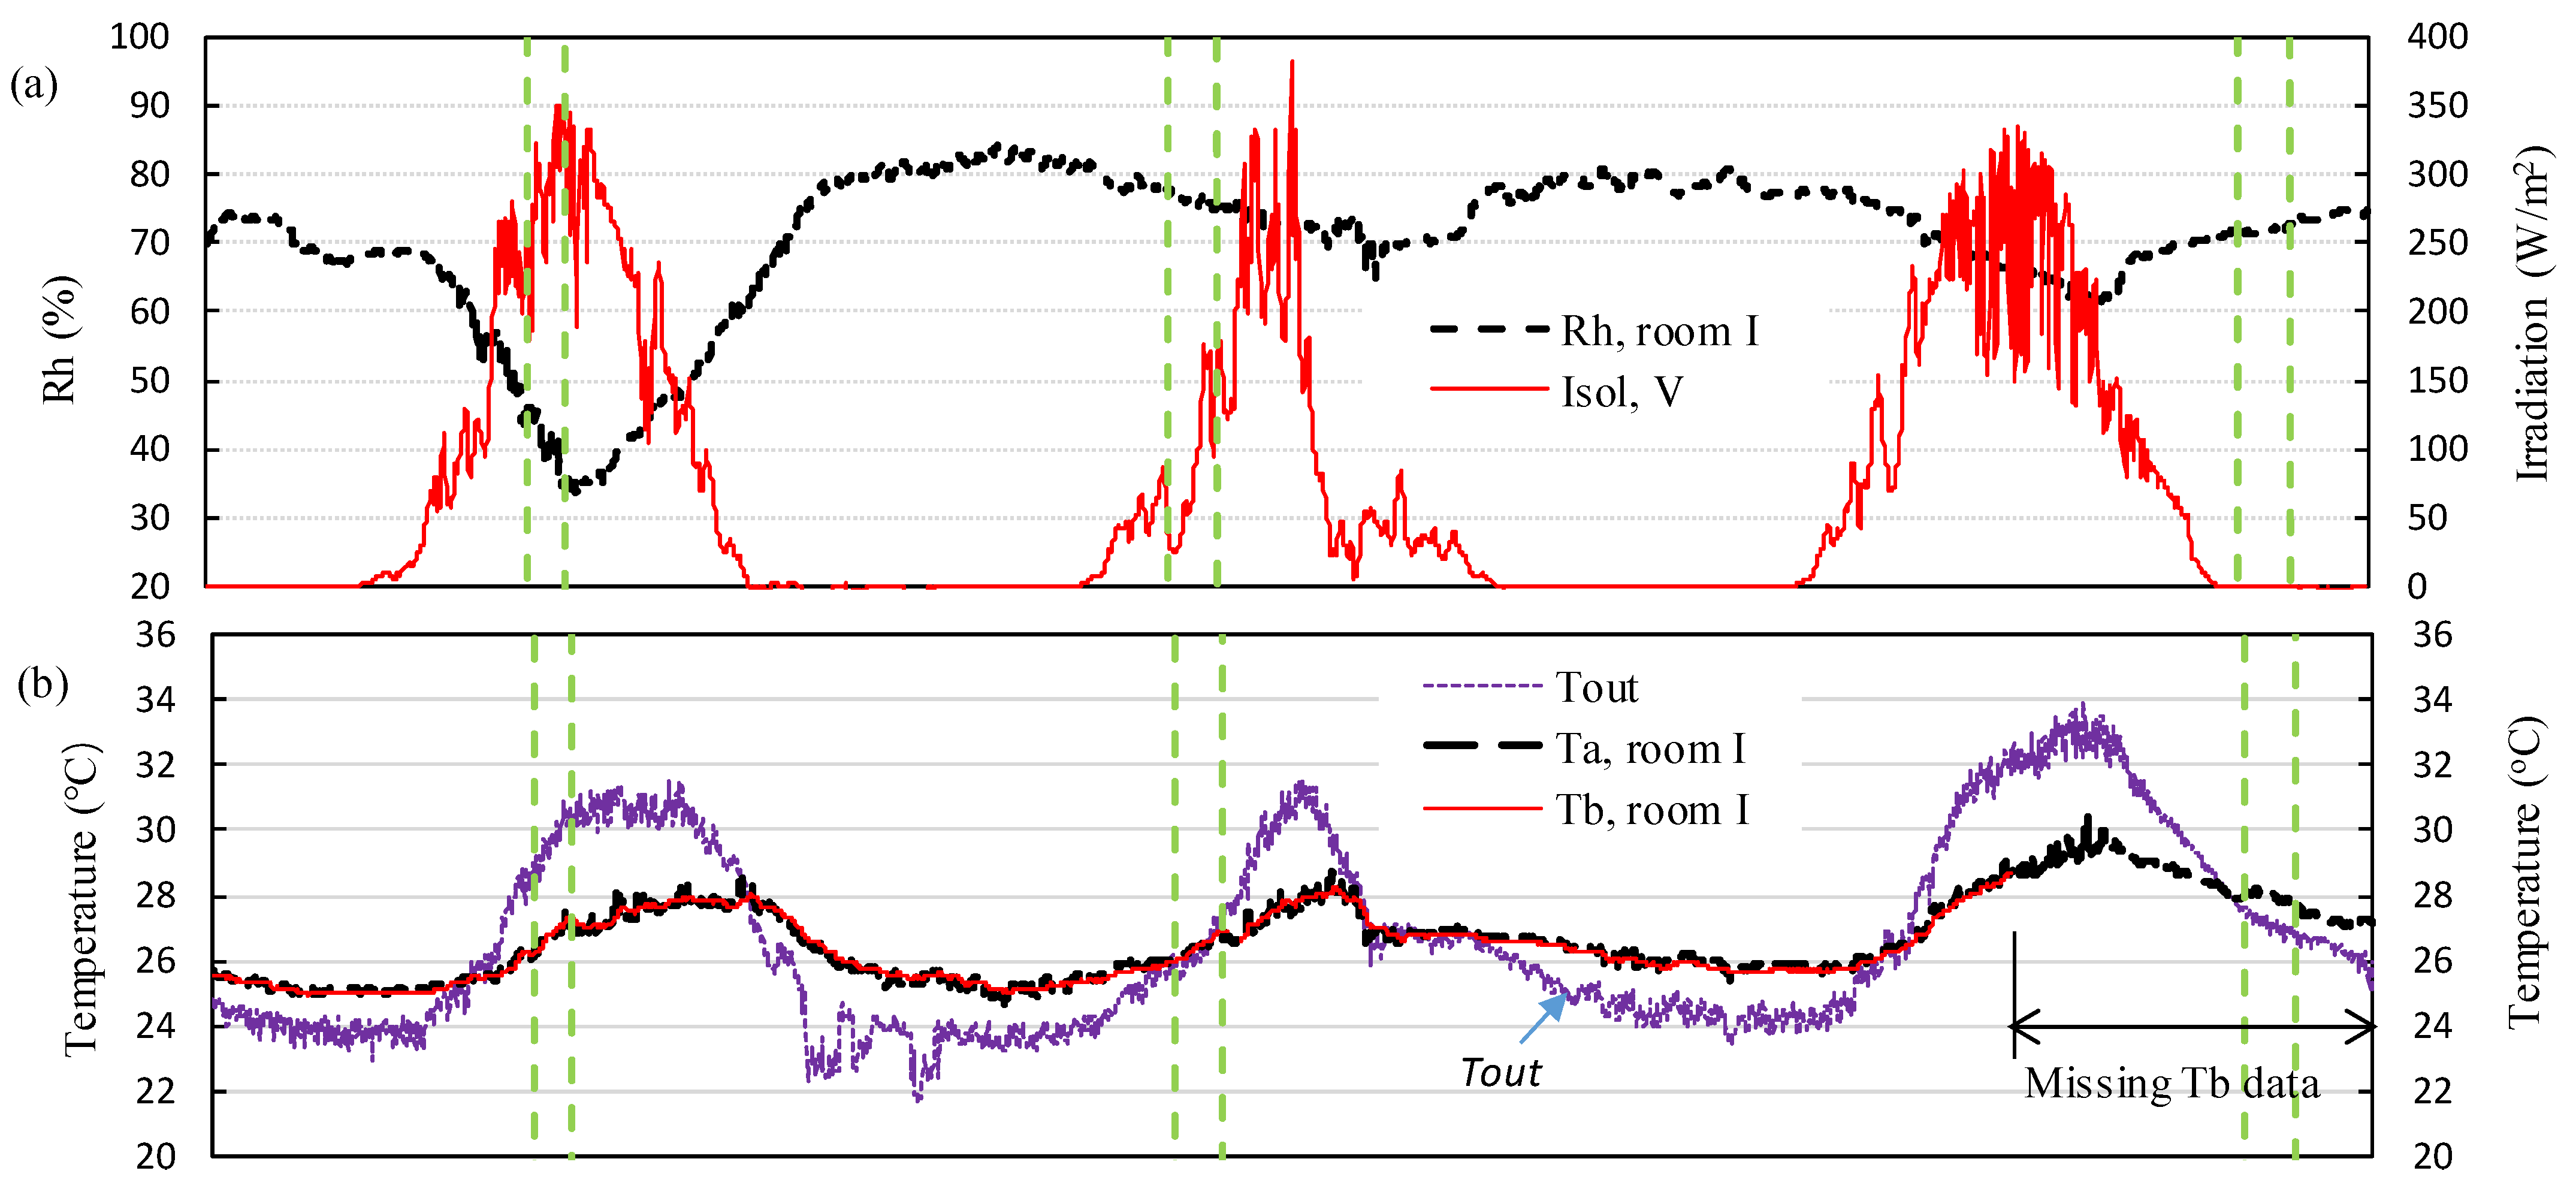
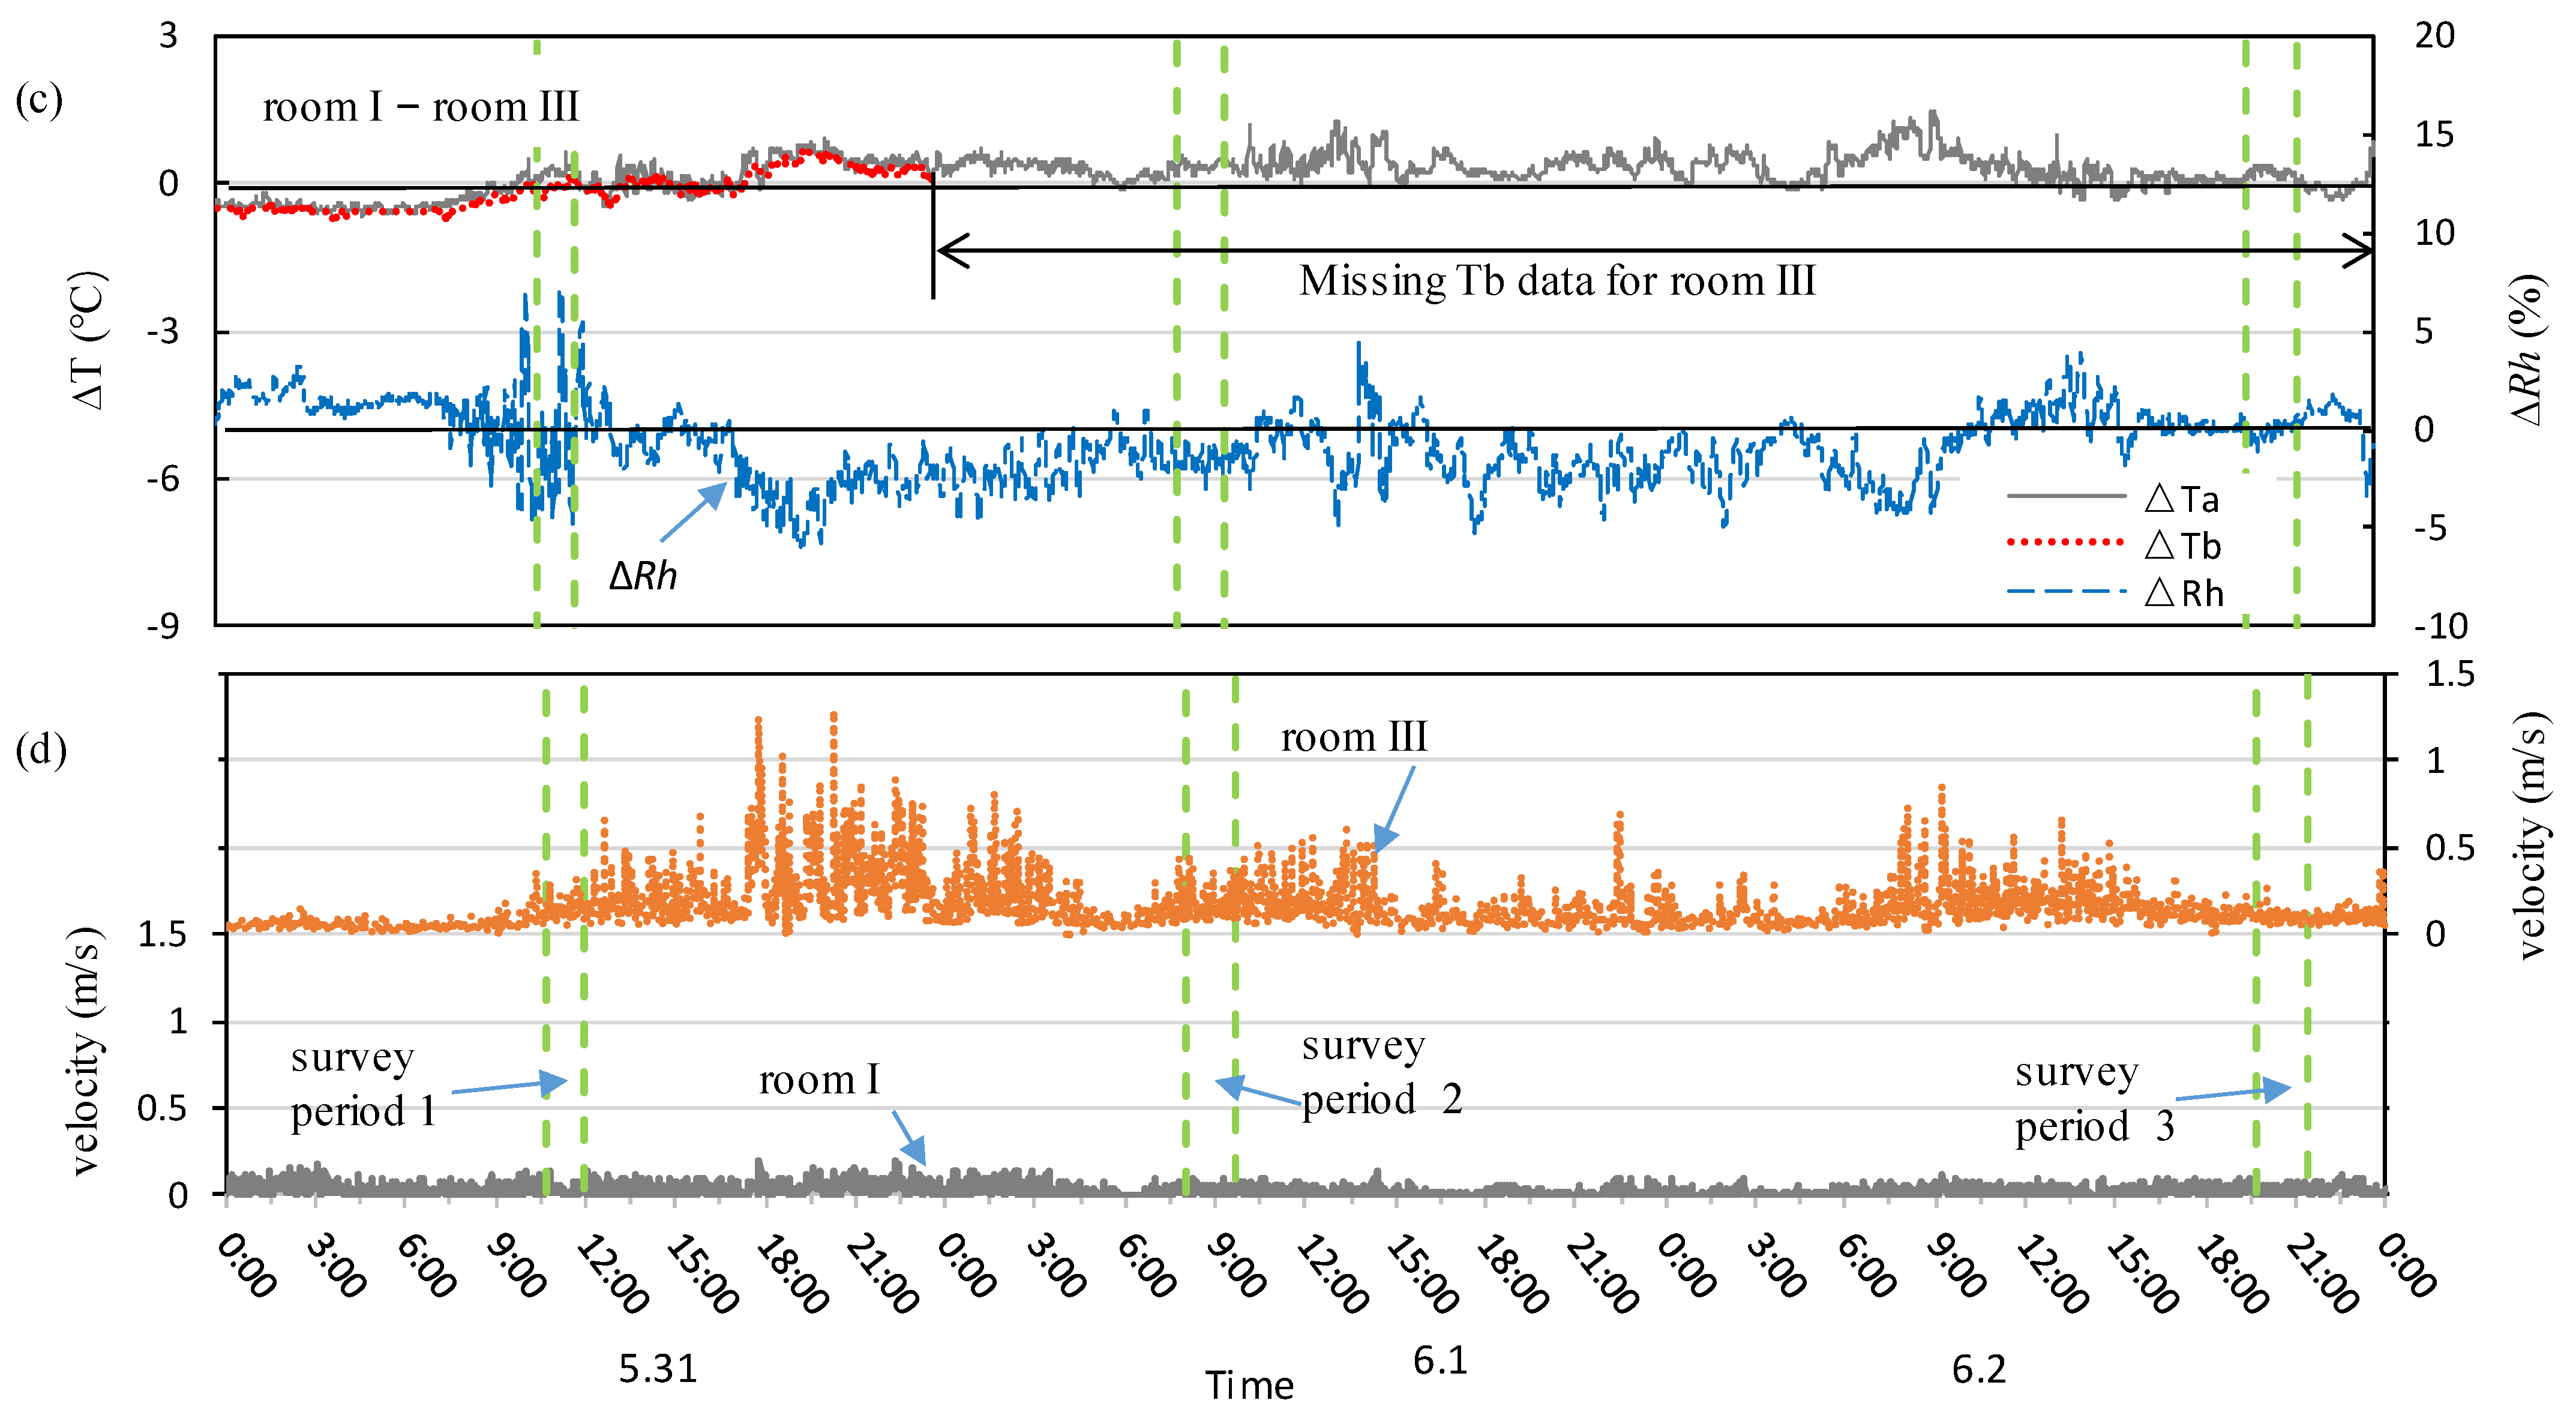
Figure 7.
Test 3: measurement data from 31 May to 2 June: (a) relative humidity in room I and vertical irradiation at the facade surface; (b) ambient temperature and air temperature of room I; (c) differences in temperature and relative humidity between rooms I and III; (d) air velocities in rooms I and III.
Among the 10 days of measurements, there were sunny days as well as partly cloudy days, as indicated by the fluctuations of solar radiation in Figure 5a, Figure 6a and Figure 7a. There was some light rain on 1 June, which caused an increase in relative humidity. Apart from that, the indoor relative humidity was mostly in the comfortable range (40% to 70%). The difference in relative humidity between the two rooms was small, varying between −5% and 5% (Figure 5c, Figure 6c and Figure 7c).
These testing periods were typical of transition seasons, with the daily average ambient temperature increasing from 18.0 °C on 14 May to 27.9 °C on 2 June, as shown in Figure 5b, Figure 6b and Figure 7b. The ambient temperature was lower than the indoor temperature in general except during the daytime with strong solar radiation. The temperature difference between rooms I and III varied between −1.2 °C and 1.5 °C (Figure 5c). The temperature in room I was higher than that in room III most of the time in test 1 but was mostly lower in test 2. In test 3, the temperature was higher again in room I. The black globe temperature and the room temperature were very close, with no significant differences or notable patterns (Figure 5b, Figure 6b and Figure 7b).
The outdoor wind speed measured at the roof fluctuated considerably with peak values exceeding 4 m/s (Figure 5e and Figure 6e). The prevailing wind direction was between 90° and 270°. Despite the high outdoor wind speeds recorded in tests 1 and 2, the air velocity in room I (DSF room) was low during all tests (average below 0.1 m/s, maximum 0.49 m/s). The velocity rarely exceeded 0.2 m/s. In contrast, higher indoor velocities were measured in room III (traditional room) in tests 1 and 3. For example, the average air velocity was 0.19 m/s in test 1, with the maximum velocity reaching 3.1 m/s. Test 2 appeared to be an exception. Both rooms had low air velocities. During the latter two days, the air velocities in room I were even higher than those in room III.
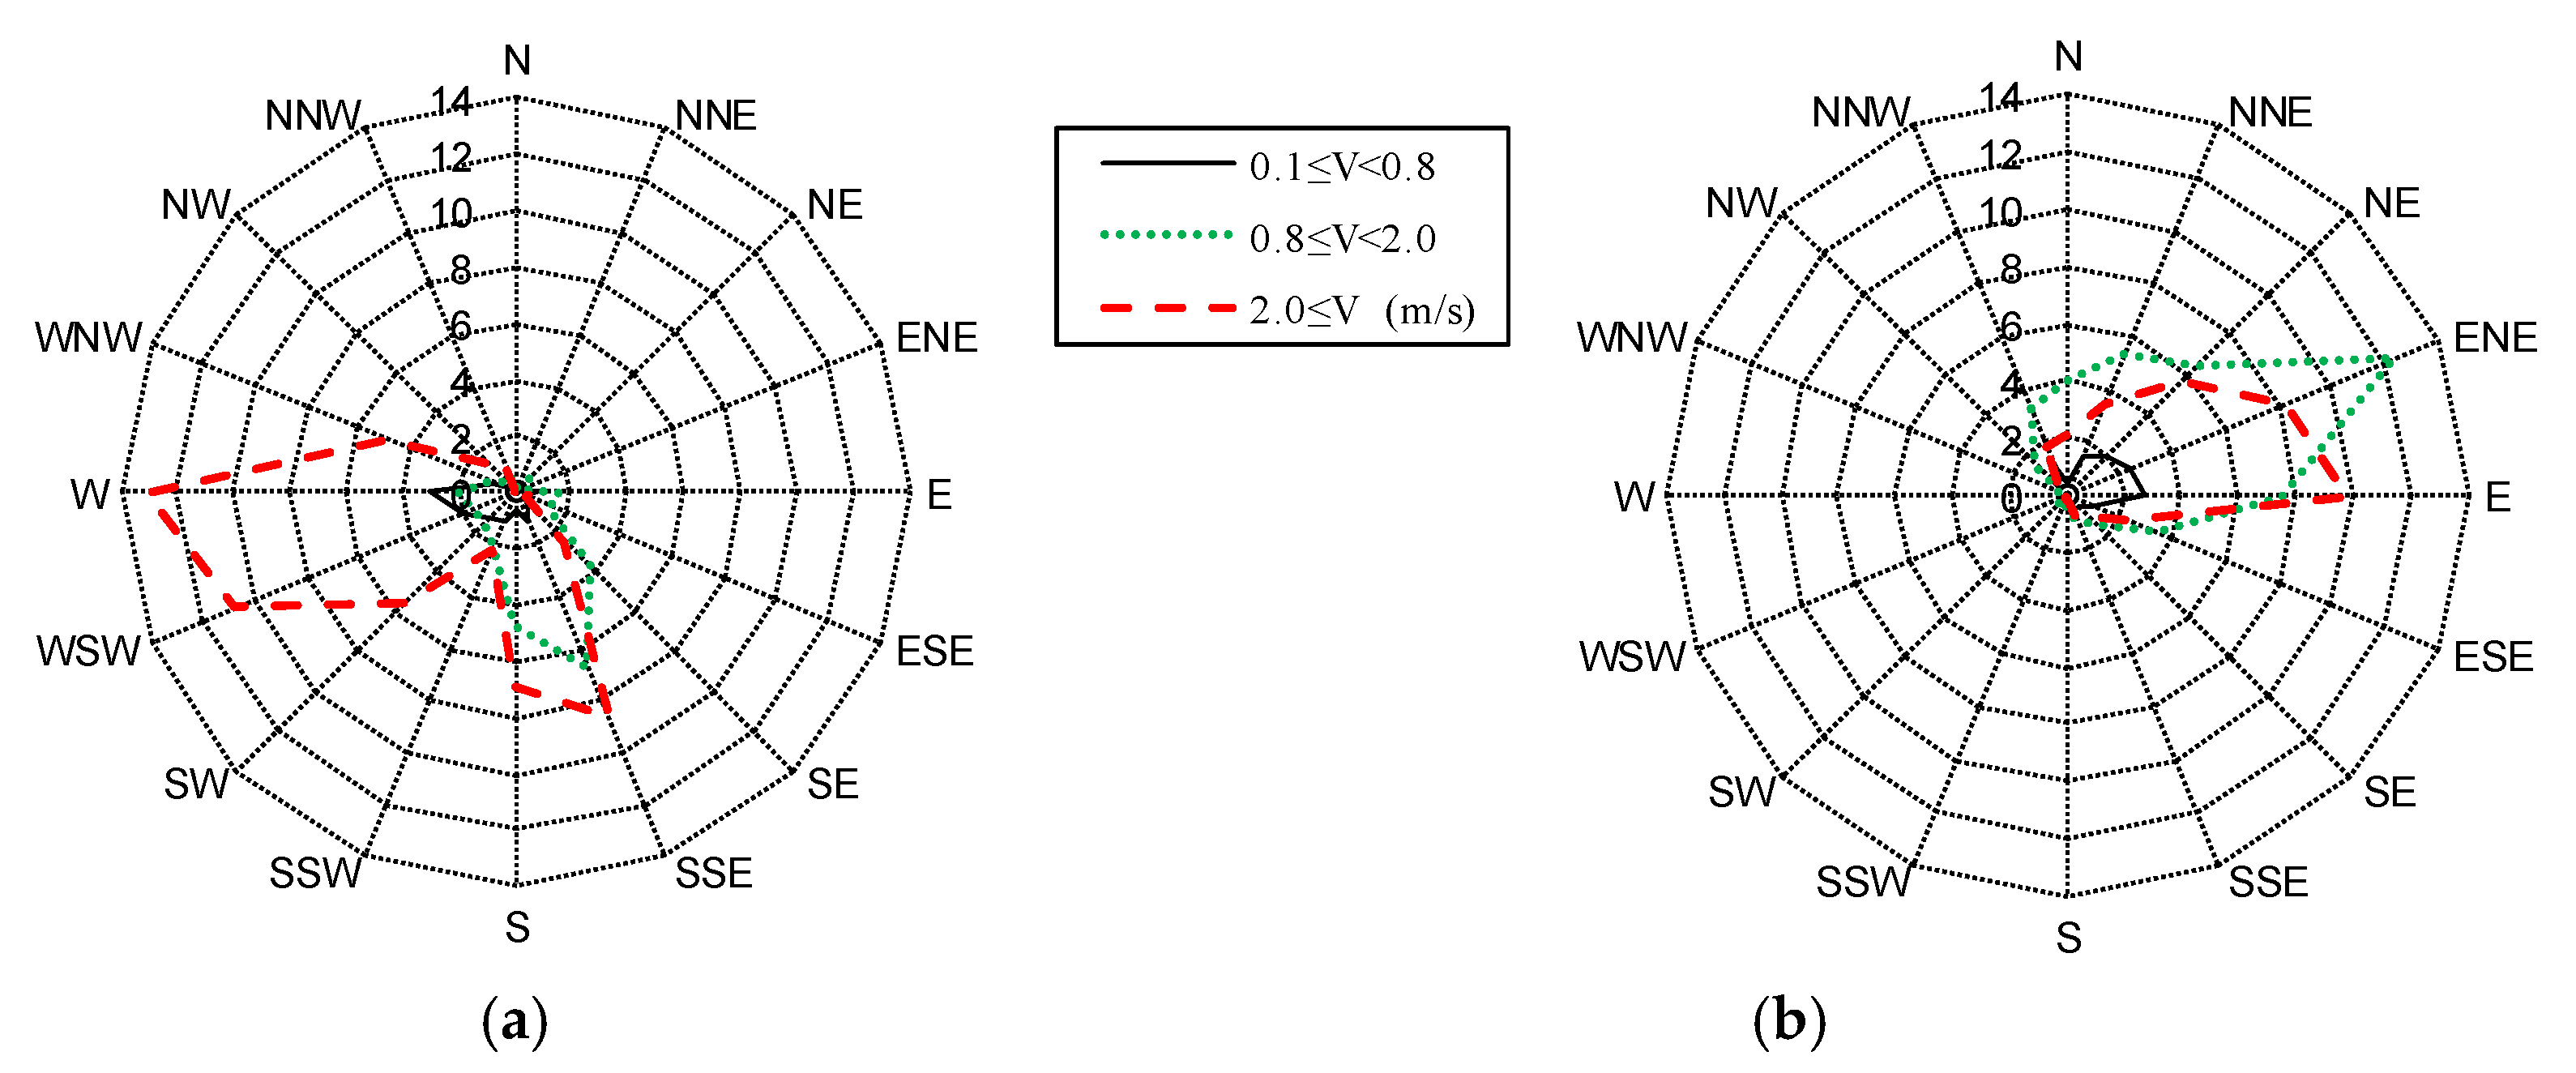
Both wind speed and direction strongly influenced the indoor air velocity in room III. Figure 8 shows the wind rose diagrams for tests 1 and 2. Note that the radial distance represents the occurrence frequency. The prevailing wind direction in test 1 was SSE and W. In test 2, the prevailing wind was from the east (E or ENE). For room III, higher indoor velocities were observed when the wind blew from the SSE or W direction, but not from the east direction (E). For room I, low indoor air velocity (<0.2 m/s) was experienced in all three directions.
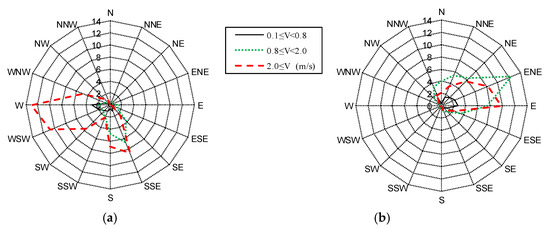
Figure 8.
Wind rose diagrams (the frequency is in percentages): (a) 15–16 May in test 1; (b) 24–26 May in test 2.
To explain the impact of wind directions on building ventilation, one must consider both the relative locations of openings and the surrounding buildings [59,62]. The window openings or facade openings were located on the windward side when the wind blew from the south direction (SSE, S). The two rooms were under cross ventilation with inlets at the windward side and outlets on the lateral side of the building (Figure 1). This is a favorable configuration for wind-driven cross ventilation [59,63]. When the wind was parallel to the openings (W, WSW, ENE, E in Figure 8), ventilation operated as cross ventilation with opposing openings, one at the free flow side and the other at the corridor flow side.
3.2. Airflow Sensation
The sensation survey was carried out in test 3 in three periods, each lasting 1.5 to 2 h, as indicated by the vertical dashed lines in Figure 7. The first one was conducted on the late morning of 31 May, which was mostly sunny. The second one was conducted on the early morning of 1 June, which was partly cloudy weather with drizzle. The third survey took place on the cloudy evening of 2 June. A total of 43 graduate students (84.1% male and 15.9% female) from 13 majors took part in the survey, although not all of them participated in all three tests. Totally, 164 valid reports were collected. The results of the sensation surveys are summarized in Table 2 along with the measured environmental variables. Figure 9 compares the air movement sensation votes and the measured air velocities.
Table 2.
A summary of the averaged values of the measured data during the three surveys.

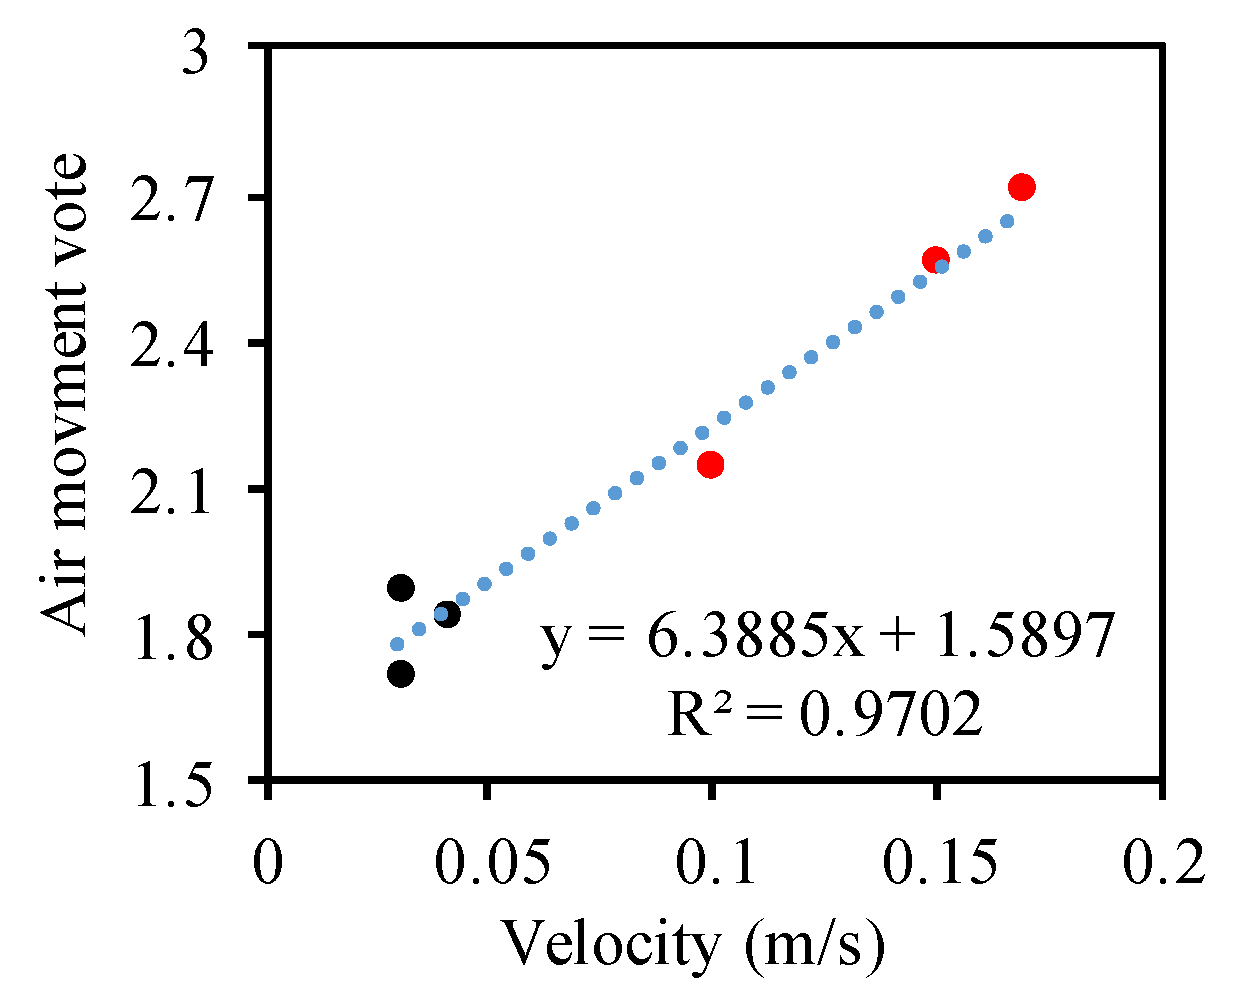
Figure 9.
Comparison of averaged values between air movement vote and measured velocity. The red dots represent data from room III, while the dark dots represent data from room I.
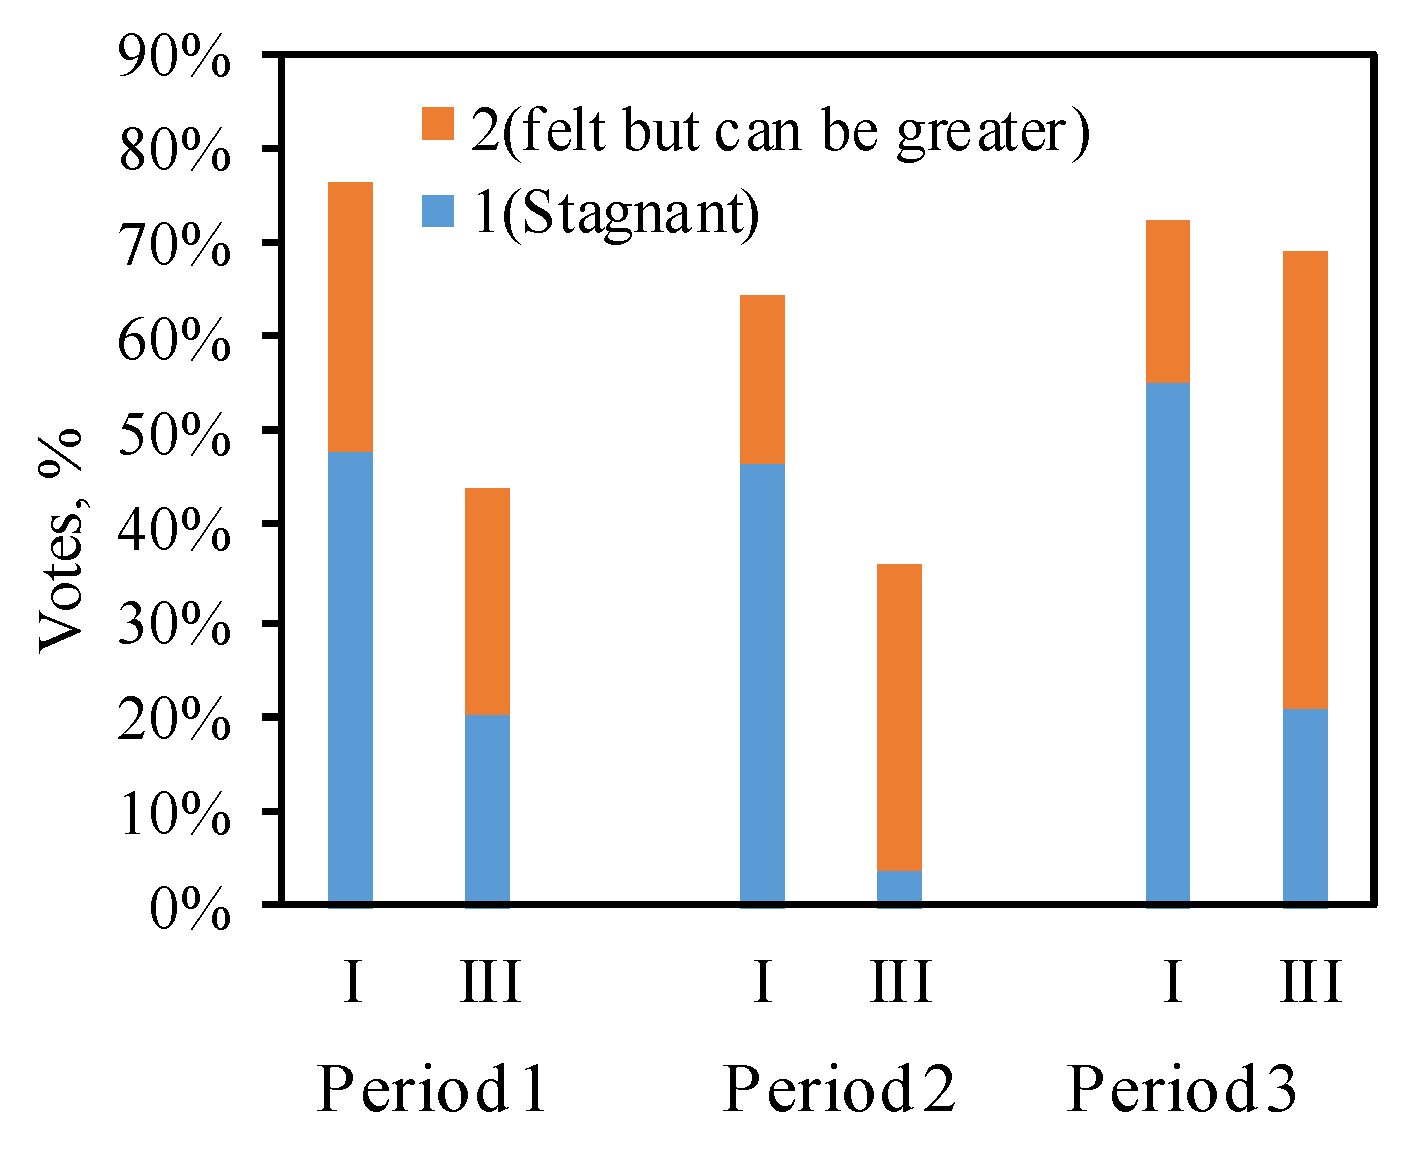
For air movement sensation, the high correlation coefficient (R2 = 0.97) between the subjective votes and the measured data confirms the validity of the method. The percentages of reports voting 1 (stagnant air) in room I were consistently higher than those in room III in all three survey periods (Figure 10). When taking into account the percentage that voted 2 (air movement felt but could be larger), the combined percentages (stacked column heights in Figure 10) of room I remained higher. The corresponding average values of air movement sensation votes in room I were between 1 and 2 (Table 2) while the values in room III were all higher than 2. The difference was significant (p < 0.05, paired t-test), indicating that the participants felt stronger airflow movement in room III than in room I.

Figure 10.
Percentage of the reports that voted 1 (stagnant air) and 2 (felt but can be larger) in two rooms during the three survey periods.
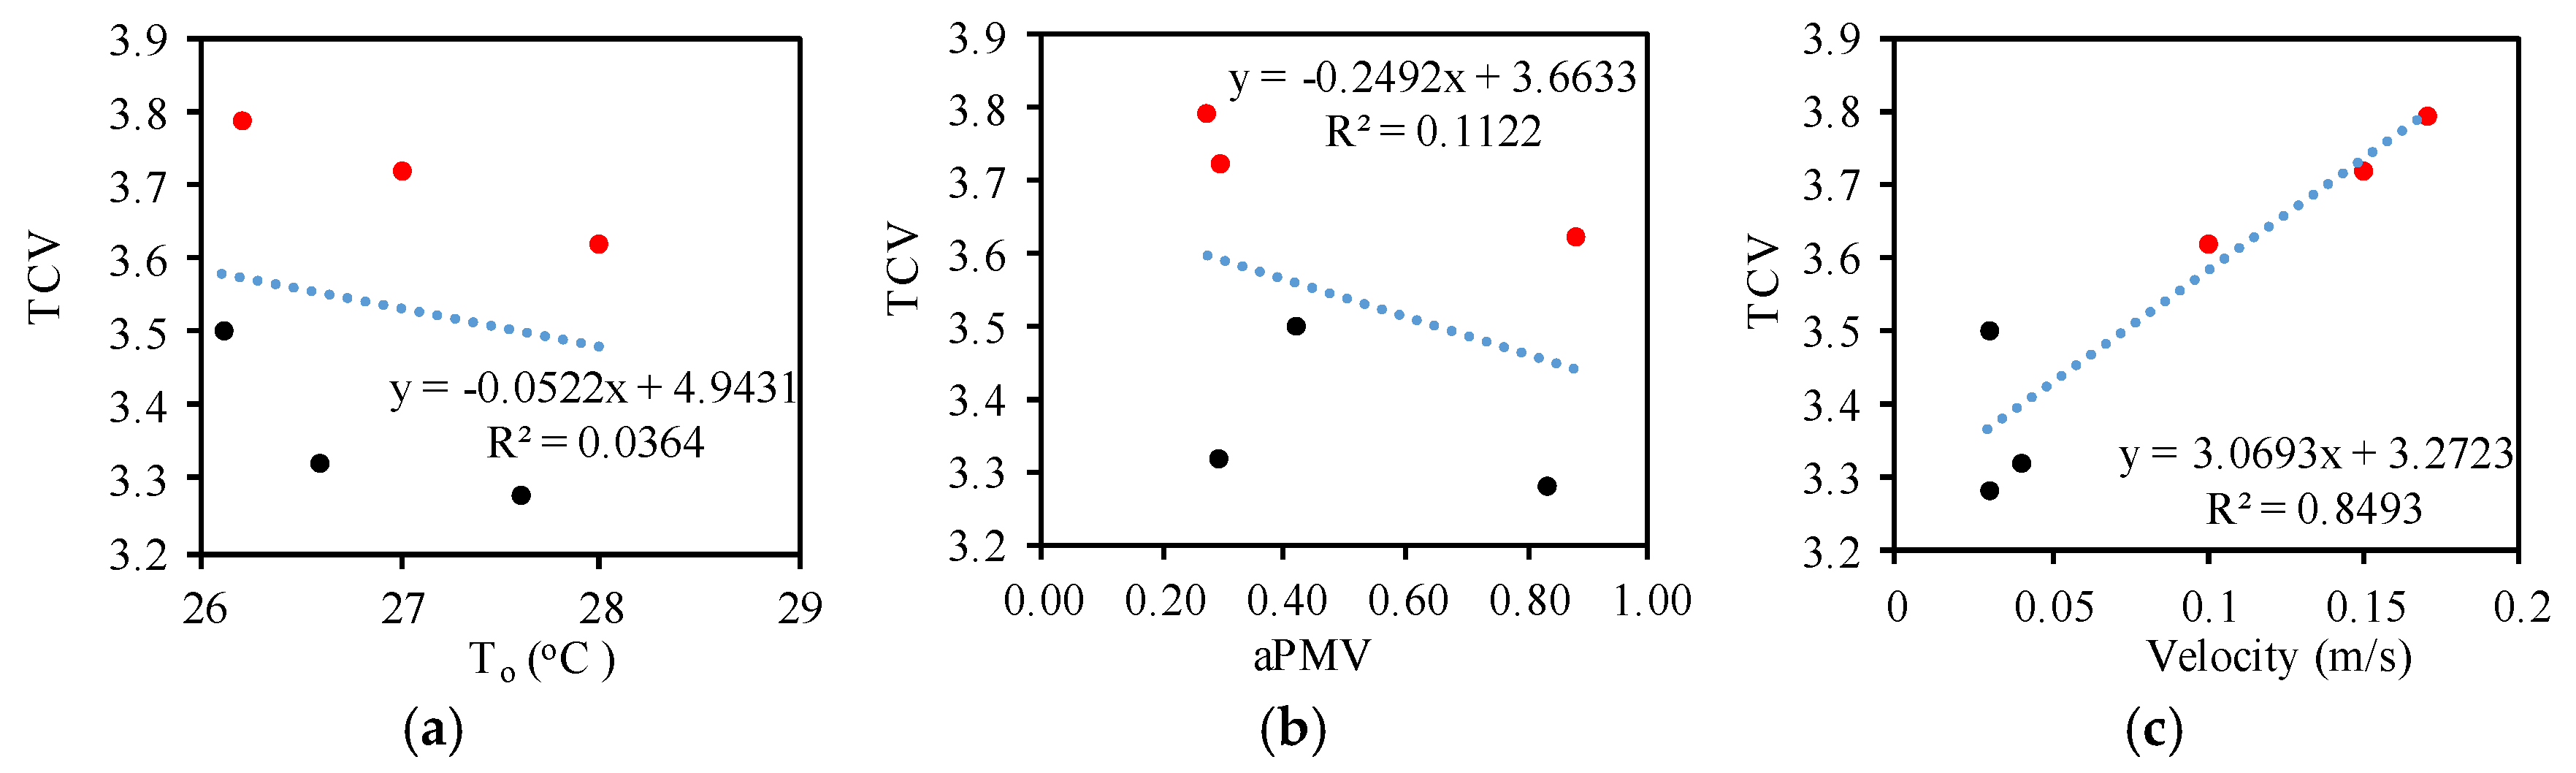
For thermal comfort evaluation, Table 2 compares the values of the thermal comfort votes (TCVs) with the widely adopted thermal sensation index, the adaptive Predicted Mean Vote (aPMV), which modifies the PMV index for naturally ventilated environments. The respondents gave an average TCV higher than 3 (neutral) for both rooms, indicating acceptable comfort levels in both rooms. In all three survey periods, the TCV values of room III were consistently higher than those of room I. In contrast, the aPMV showed no significant difference between the two rooms. This seemingly surprising result is actually reasonable, as the aPMV index, derived from extensive datasets that cover a wider area and broader demographic range, is a rough estimate and may not capture small thermal comfort variations in specific localized settings. The aPMV values were calculated according to the national standards [65], using an adaptive coefficient of 0.17, which is recommended for the region to adjust the traditional PMV. The PMV values were calculated using an online tool [66] compliant with ASHRAE 55-2023 [64], with the following parameters: operative temperature equivalent to air temperature, clothing insulation of 0.57 clo (representing typical participant attire of trousers and short-sleeve shirts), and a metabolic rate of 1.0 met (seated, quiet activity). The aPMV values indicate that both rooms were rated as Class I for the first two surveys (−0.5 ≤ aPMV ≤ 0.5) and Class II for the third survey (0.5 ≤ aPMV ≤ 1). Figure 11 shows the correlations between the TCV and three variables: the operative temperature, air velocity and aPMV. When data from both rooms are considered, neither operative temperature nor aPMV can sufficiently explain the variations in TCV. In contrast, indoor air velocity alone can explain 85% of the observed TCV variance, suggesting that the airflow velocity was the dominant factor governing the thermal comfort perception in the two naturally ventilated rooms.
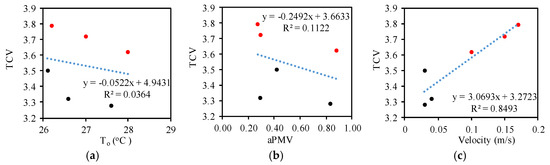
Figure 11.
Correlations between thermal comfort vote and three variables: (a) operative temperature, (b) adaptive PMV value, and (c) velocity. The red dots represent data from room III, while the dark dots represent data from room I.
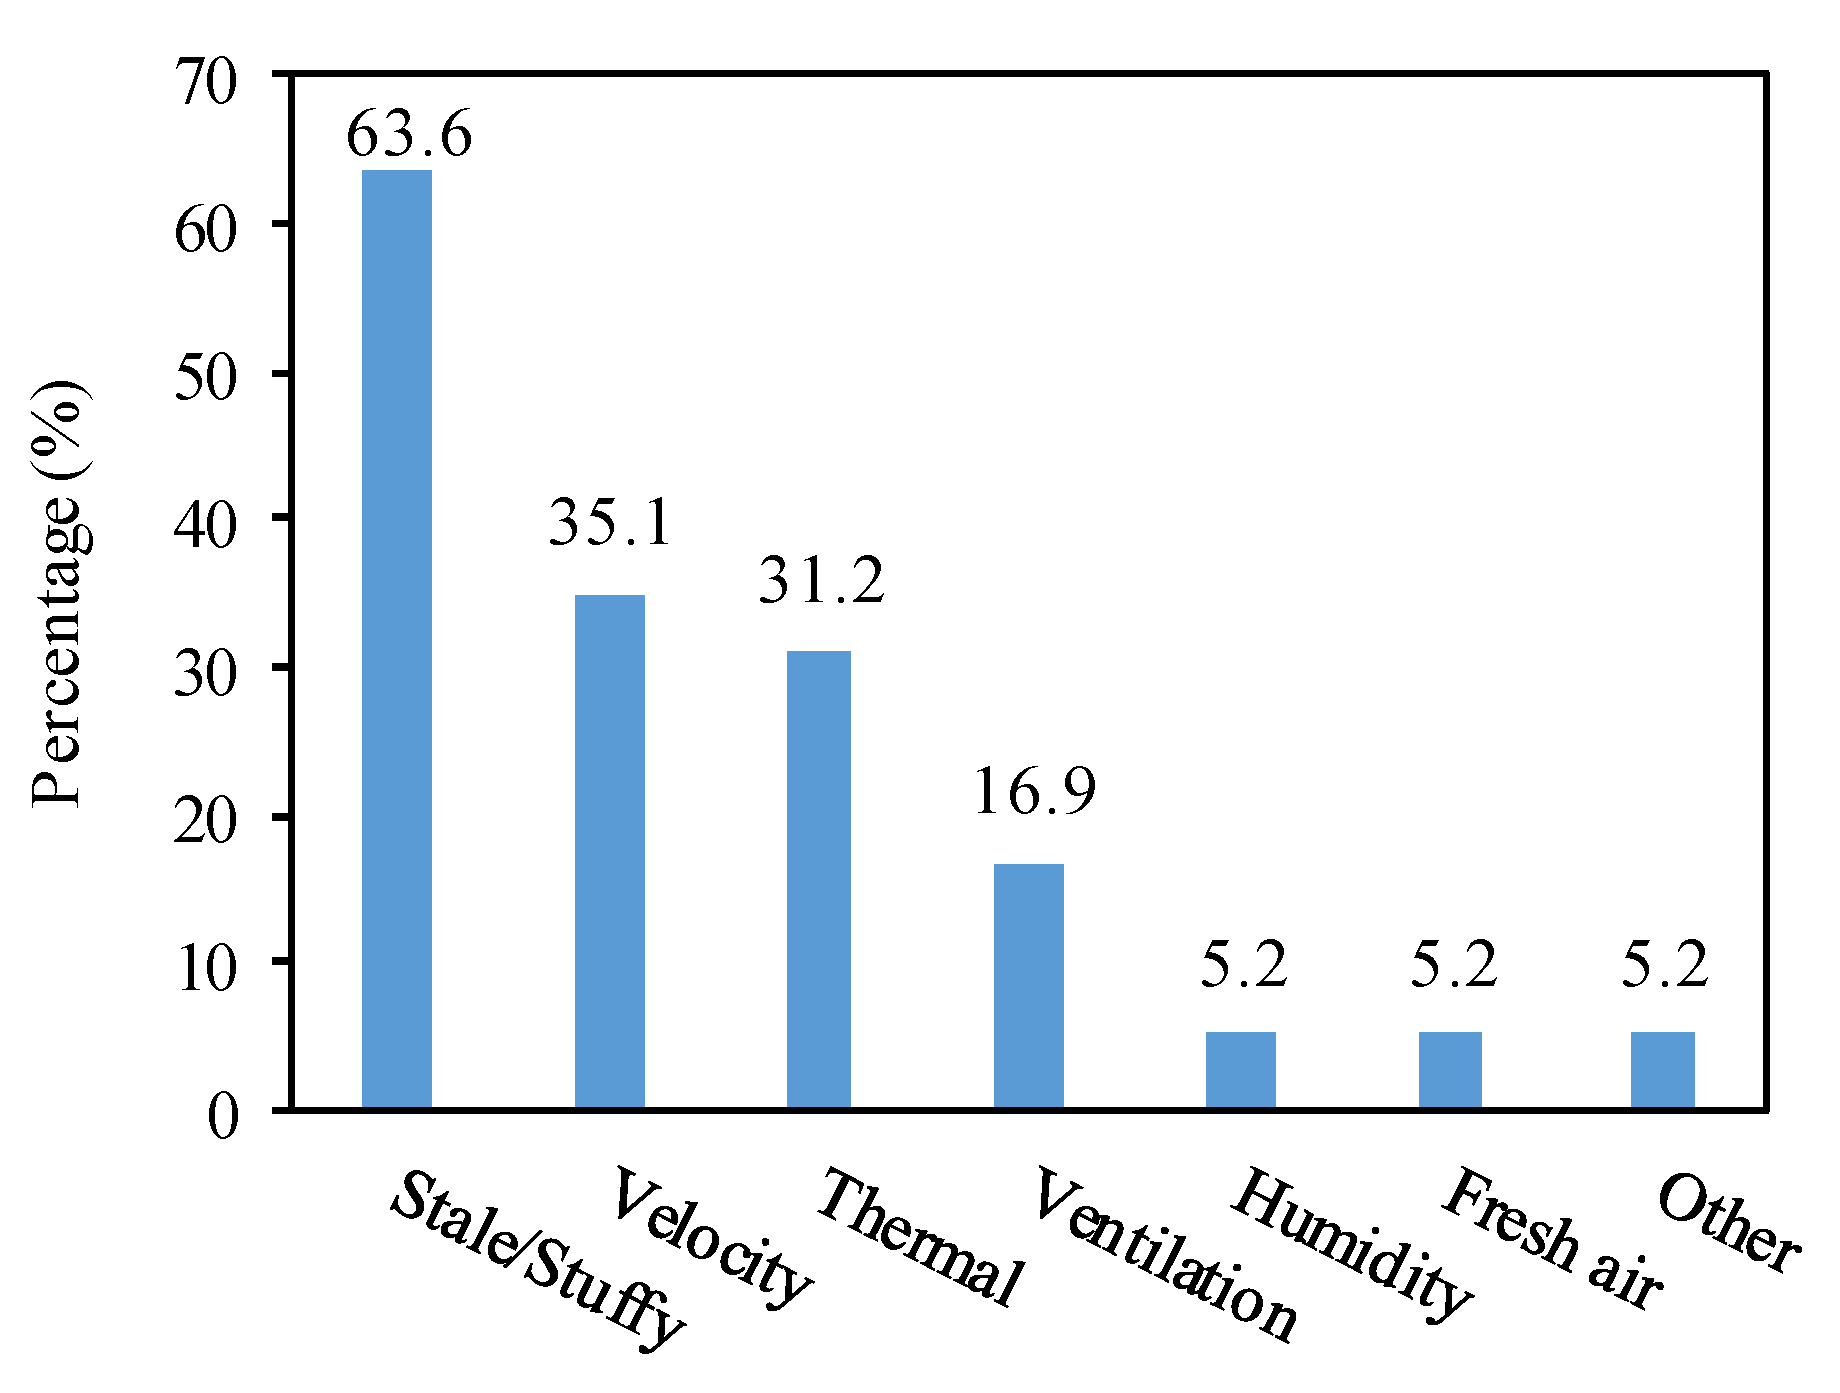
There were more votes for a larger window opening from room I than from room III (Table 2), which is consistent with the voting results of air movement sensation. We analyzed the reasons that the respondents provided for their wishes regarding window opening, and the keywords are summarized in Figure 12. The most frequent words (63.6%) were “stuffy” or “stale,” followed by low “air velocity” (35.1%) and “hot” sensation (31.2%). Thirteen respondents (16.9%) mentioned “poor ventilation” without explicitly stating that the air velocity was too low. High humidity and lack of fresh air were each mentioned four times (5.2%). Other terms, such as “glare,” “view,” and “daylighting,” appeared irrelevant to the question. Only 7 out of 164 reports (from 6 participants) wished for a smaller window opening—all except one were from room I. Regarding the reasons, only two reports were concerned with a “cold” sensation due to increased wind speed, while one simply felt that there was “too much wind.” Three reports were primarily concerned with the cooling load while admitting it was already “too hot.” One report was concerned with security (bug intrusion). However, none of them mentioned the words “stale” or “stuffy” in their explanations.

Figure 12.
Frequency of keywords mentioned in reasons for larger window openings.
4. Discussion
4.1. Driving Forces of Natural Ventilation
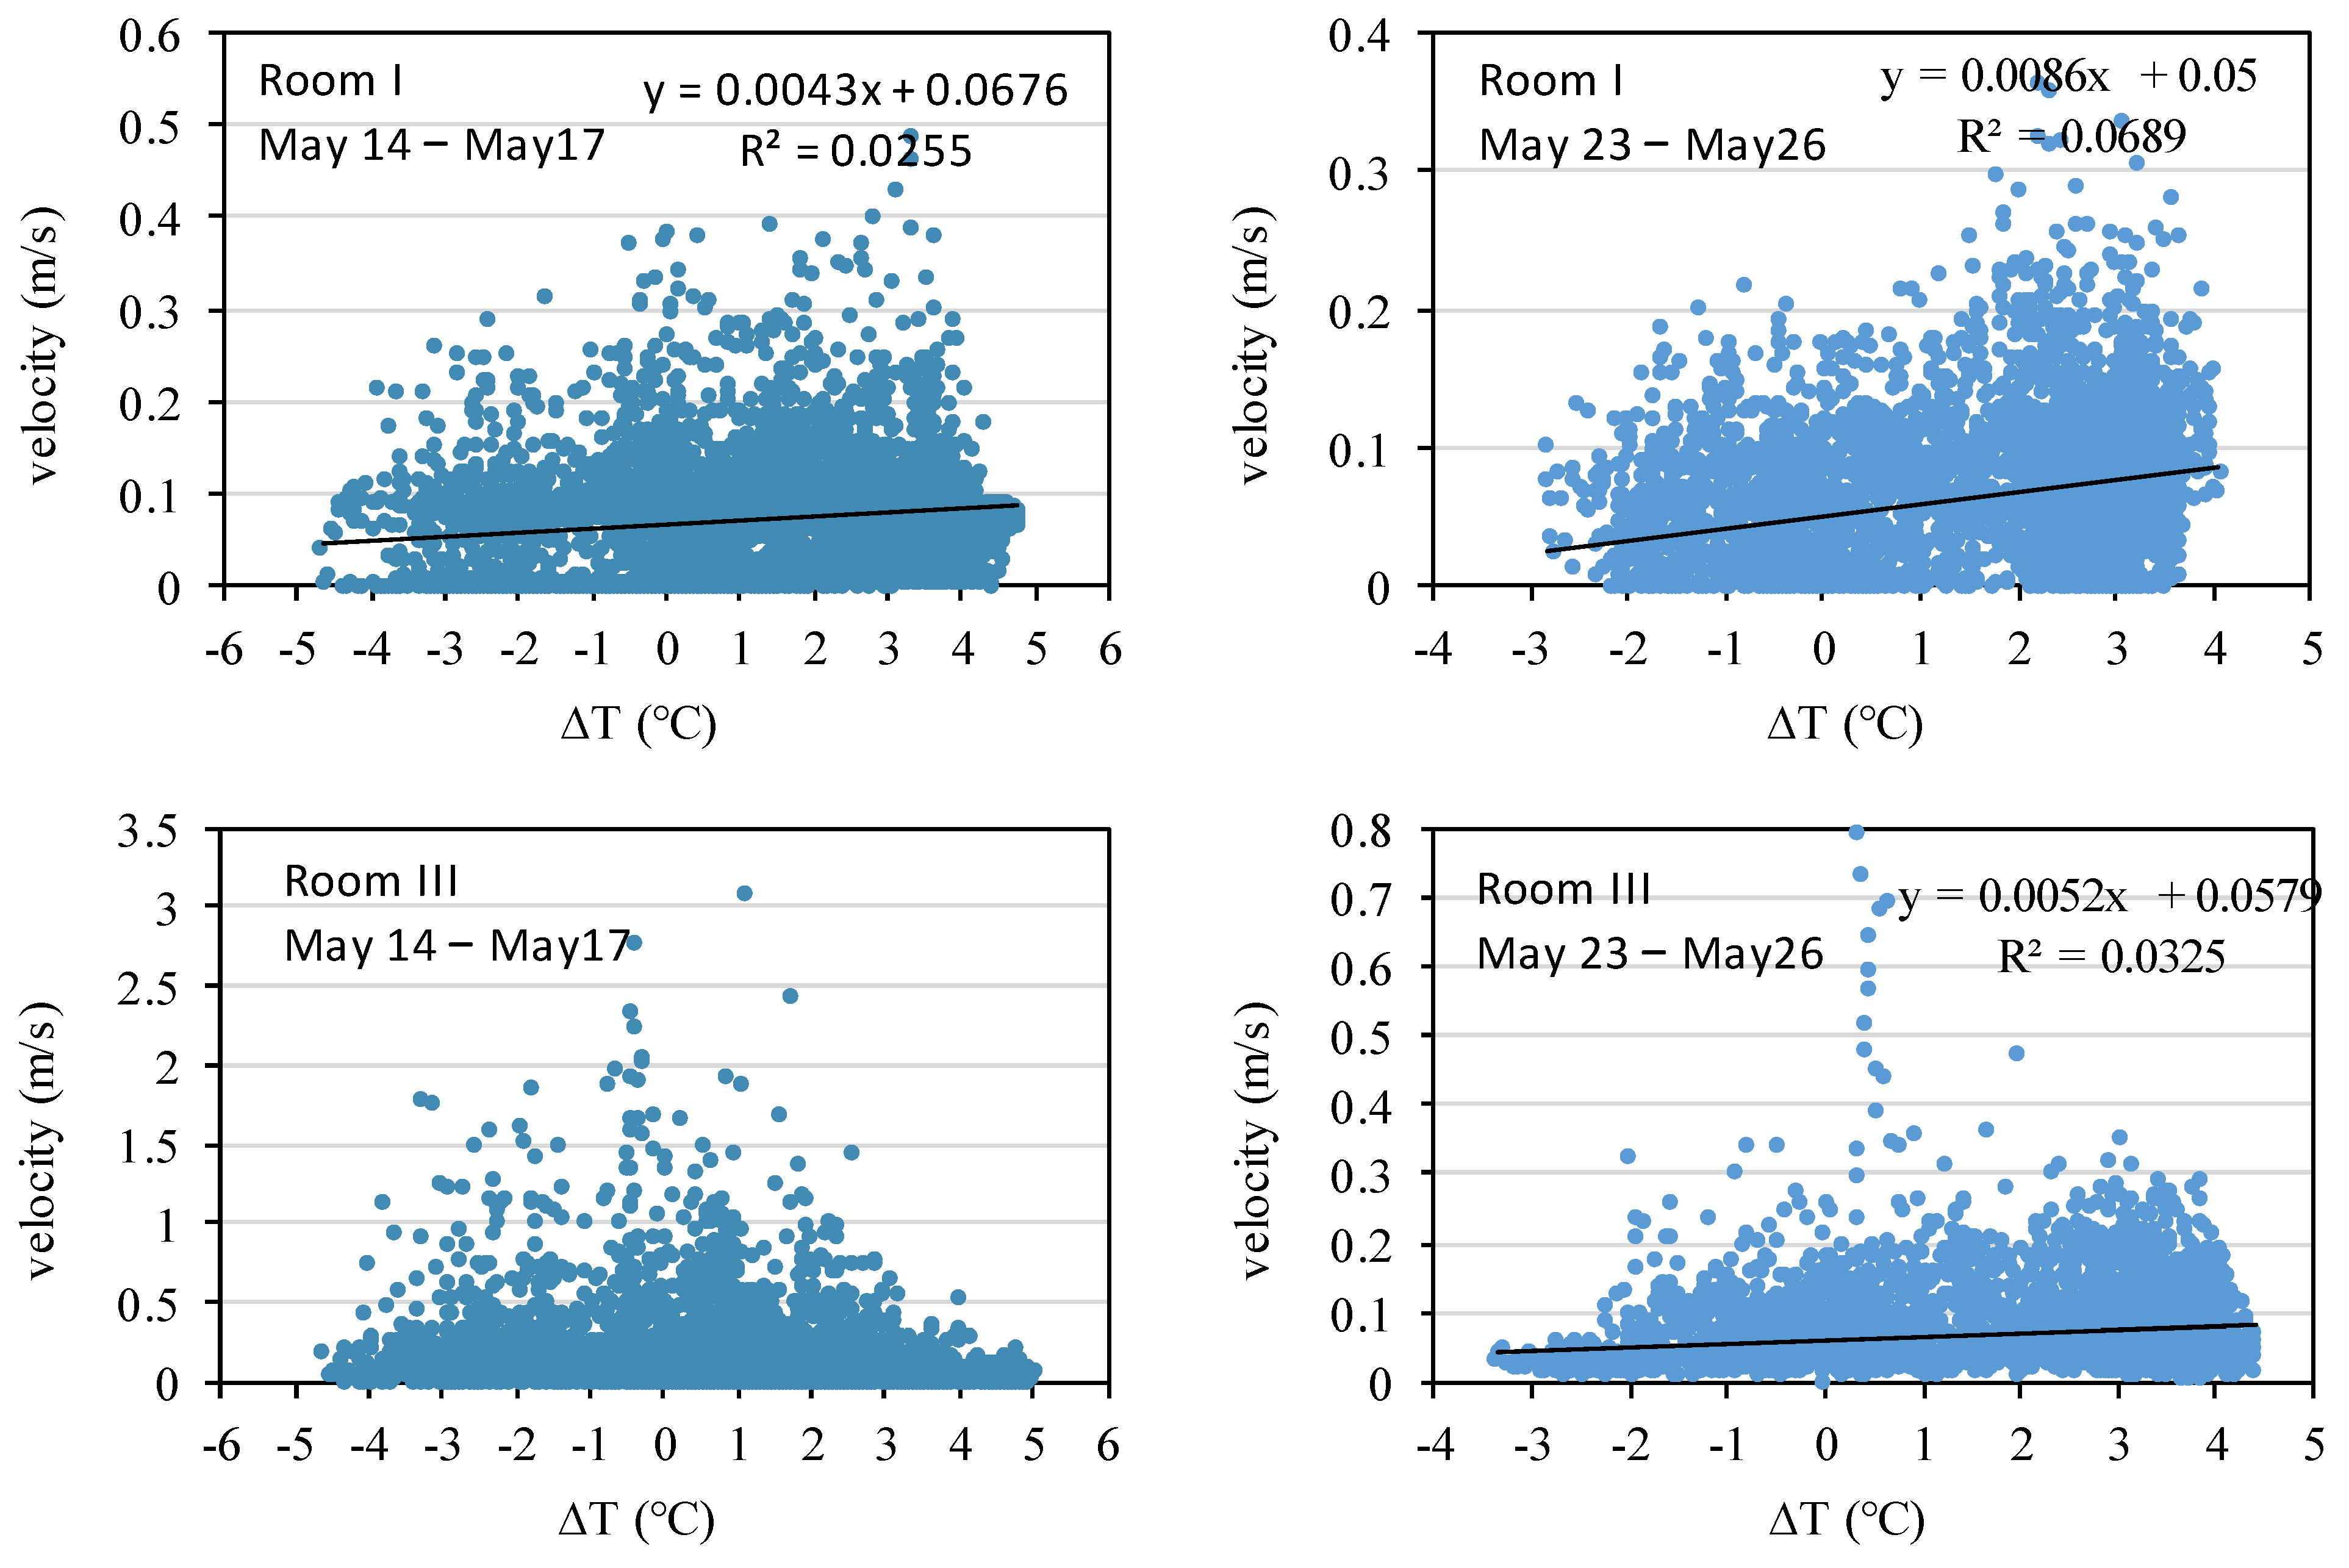
Building ventilation is driven by either wind or buoyancy or both. The wind influence was evident in the conventional room (room III), with high indoor velocities (>0.3 m/s) occurring only under favorable wind conditions. Buoyant forces exist whenever there is a temperature difference between indoor and outdoor air. The correlation between the indoor air velocity and this temperature difference is presented in Figure 13 for the two rooms in tests 1 and 2. As shown in the figure, the correlation is only observable when the influence of wind-driven ventilation is weak, such as in room I in both tests and room III in test 2. The buoyant force most likely prevailed in these cases. This is not surprising, as DSFs are known to enhance buoyancy-driven ventilation [67,68,69]. When the wind influence is strong, such correlation is not observable, such as in room III in test 1. In the latter case, the higher velocities occurred mostly at zero temperature difference, suggesting the dominant influence of wind.

Figure 13.
Scatterplots of room velocities versus buoyancy forces in tests 1 and 2. The buoyancy force is represented by the indoor–outdoor temperature difference. (Top) room I. (Bottom) room III.
The ventilation performance can also be indicated by variations in indoor temperatures. Higher ventilation rates would lead to lower indoor temperatures (enhanced cooling effect). In tests 1 and 3, the temperature in room III was lower than that in room I most of the time (Figure 5c and Figure 7c), indicating that the ventilation rate was higher in room III. This is consistent with the observed higher velocities in room III. In test 2, the lower temperature at night in room I compared to room III corresponds to higher ventilation rates in room I. In other words, the DSF room achieved higher ventilation rates under unfavorable wind conditions (test 2), whereas the conventional room performed better during favorable wind conditions (test 1).
The above analyses show that the DSF has a significant impact on the driving forces of building ventilation. It can minimize the influence of wind even under favorable wind conditions for cross ventilation. When wind conditions are unfavorable, the DSF system performs better with enhanced buoyancy-driven ventilation. Notably, despite enhanced ventilation by DSF, its impact on perceptible air movement is minimal.
4.2. Influencing Factors on Wind-Driven Ventilation of DSF
Our previous measurements demonstrated suppressed wind-driven ventilation in room I with the DSF, where measured indoor air velocities remained low (predominantly <0.2 m/s) and never exceeded 0.5 m/s in all three tests. This section discusses the key factors constraining the ventilation performance.
Wind-driven ventilation is affected by wind characteristics (speed, directions, fluctuations, etc.), opening configurations (size, location), and room geometry [62]. In the study, both rooms were under similar wind conditions with south-facing openings and opposing doors, while the building’s main openings were located on the east and west walls (Figure 1). However, the two rooms differed in opening size. For aesthetic purposes, the external openings of the DSF are often kept as small as possible in the practical design. The DSF had distributed openings with a total opening area of 0.75 m2, while room III had a larger window opening of 1.68 m2 (Figure 3). This dimensional difference is significant for two key reasons: (1) ventilation rates are proportional to the opening area [70], and (2) the opening size affects airflow characteristics. For small openings (e.g., DSF slots), ventilation rates primarily depend on external wind pressure distribution [61]. For larger openings, wind kinetic energy may be preserved, enabling the formation of stream tubes with diameters comparable to the opening size [59]. In room III, the large single window opening was more likely to allow the formation of such stream tubes, resulting in higher observed indoor air velocities at the measuring point, which was located directly in the flow path.
The additional layer of the DSF also increases the flow resistance, with the internal layer effectively acting as a barrier to airflow. As demonstrated by Chu and Chiang [71], both the barrier’s blockage ratio and its proximity to openings can greatly affect the flow resistance. They used experimental measurements and numerical simulation to show that a blockage ratio of 86% using an internal wall could increase the flow resistance significantly while reducing the flow rate by 25%. Positioning the barrier close to either the inlet or outlet was found to significantly amplify flow resistance. In the present study, the internal layer led to an elevated blockage ratio (89%) and was positioned close to the inlet. Both factors contributed to a substantial increase in flow resistance, thereby reducing airflow rates.
Note that the two tested rooms differed in volumetric size and shape because an identically sized control room was unavailable at the study site. For comparison purposes, the measuring points in both rooms were placed at the direct flow path from the openings to the doors, as shown in Figure 2a. For a given ventilation rate, a smaller room would have produced higher airflow velocities. Instead, the significantly lower air velocities measured in room I (the DSF and smaller one) compared to room III (the larger one) demonstrated reduced airflow rates attributable to the negative impact of the DSF.
In summary, the presence of a DSF with a small opening area and an extra layer close to the inlet with a high blockage ratio may have weakened the effect of wind-driven ventilation in the DSF room.
4.3. Impact on Thermal Comfort
Thermal comfort represents a complex physiological response influenced by multiple interacting parameters, including air velocity, temperature, humidity, air quality, as well as behavior-related factors such as clothing and metabolism [64]. In cooler conditions, airflow speed is often restricted for thermal comfort purposes [72]. Ventilation improves natural cooling by increasing the supply of cooler outdoor air. Because a DSF enhances stack ventilation, it can contribute to better thermal comfort in colder climates, as confirmed by several studies [47,52,69]. As air temperature increases, the cooling capacity of ventilation decreases. However, thermal comfort can be maintained through elevated airflow velocities [56,73,74]. When the operative temperatures exceeded typical setpoints in air-conditioned buildings, the TCV was highly correlated with the air velocity (Figure 11). If the DSF restricts indoor airflow velocities, it may underperform conventional windows in thermal comfort in warmer conditions, as demonstrated in Ref. [48]. Barbosa and Ip [53] also demonstrated that the thermal acceptance level in DSF buildings declines from the south region to the hotter north region in Brazil.
The reduced indoor air velocity may be the cause of complaints from occupants in DSF buildings. Figure 10 shows that the majority of reports voted insufficient air movement in the DSF room, consistent with the findings of Ye et al. [55], who conducted a field survey in a high-rise office building with a corridor type DSF in China’s hot summer and cold winter regions. Their survey revealed that most occupants were not satisfied with the natural ventilation performance during transition seasons.
The above analysis indicates that the natural ventilation performance of DSF exhibits significant climate dependence. Our findings support that DSFs can effectively enhance stack ventilation, thereby improving indoor air quality and thermal comfort under cooler conditions. However, their limited capacity for wind-driven ventilation must be acknowledged, as this constraint reduces their natural cooling potential during warmer conditions. This performance dichotomy holds particular relevance for DSF applications in China’s hot summer and cold winter regions, where daily temperatures exhibit substantial fluctuations during transitional seasons (April–May and October–November).
4.4. Limitations of the Study
This study fills a gap in the literature by providing detailed data on the natural ventilation performance of DSFs in a laboratory building. Through a comparison between a DSF room and a control room with a traditional window-wall system under the same weather conditions, we found that the air velocity in the DSF room was significantly lower than that in the control room. Under warmer conditions, this reduction in air velocity explained the lower TCV values in the surveys. However, certain limitations should be acknowledged.
Opening size plays a critical role in wind-driven ventilation performance [75,76,77]. The investigated DSF, with a total opening area of only 0.75 m2, likely imposed significant limitations on wind-driven airflow. In practice, DSF openings are often minimized to preserve facade aesthetics. Unlike the box-type DSF examined in this study, multi-story DSFs typically exhibit even smaller opening ratios (opening area over wall area), as their primary function is to enhance stack ventilation [78]. In Japan, a field investigation of 30 buildings including multi-story type DSFs demonstrated no significant difference between wind-driven ventilation and buoyancy-driven ventilation in terms of air change rate [79]. These findings underscore the need for further research on how opening size and configuration influence wind-driven ventilation in DSFs.
The thermal comfort survey employed a relatively short adaptation time to maintain stable environmental conditions during the entire survey period. Consequently, the collected thermal comfort votes represent relative assessments rather than absolute thermal sensation measurements, reflecting participants’ comparative responses to the controlled experimental conditions. To further mitigate the impact of environmental variability, we employed a comparative study design in which the respondents evaluated their thermal perceptions in two rooms consecutively within a brief timeframe. It is still possible to increase the sample size by conducting more batches of a similar study. While the current sample was limited to student participants (representing young demographics), the methodology allows for expansion through additional batches of similar studies. Although thermal sensation may vary across age groups, we posit that the perception of wind speed remains relatively consistent among different demographics. This assumption is supported by the alignment between the subjective air movement sensation votes and objective physical measurements.
5. Conclusions
This study investigated the natural ventilation performance of DSF buildings during transition seasons. We measured and compared the indoor environment parameters between two rooms on the same floor of a laboratory building, one with a full-scale box-type DSF system and the other with a traditional wall-window system. Air movement sensation surveys were also conducted to measure the perceived airflow and indoor comfort levels. Data collected during three periods for 10 days in total during the transition season between winter and summer were analyzed with the following findings:
(1) The airflow velocities in the DSF room were lower than those in the traditional room and appeared unaffected by ambient wind. The indoor velocities in the DSF room rarely exceeded 0.2 m/s, even under favorable wind conditions, whereas higher indoor velocities and ventilation rates were observed in the control room. This reduction in velocity was attributed to the small openings and the two-layer structure of the DSF, which create greater flow resistance to wind-driven ventilation. This low air velocity was associated with the reduced comfort level felt by the respondents, although no significant difference was found in the adaptive PMV calculated according to the Chinese standards GB/T 50785-2012. This finding provides a plausible explanation for the reported thermal comfort reduction in DSF buildings in warm and hot climatic regions.
(2) The DSF demonstrated better stack ventilation when the wind condition was not favorable to wind-driven ventilation. Although this advantage showed an insignificant effect on the perceived comfort level for the range of indoor temperatures (>26 °C), it has significance in cooler conditions, as the DSF can draw in more cool air compared to a traditional window-wall system in unfavorable wind conditions. This enhanced stack ventilation explains the reported better natural ventilation performance in DSF buildings in cooler climatic regions.
Using measured data from a laboratory building exposed to real environmental conditions, we demonstrated the strengths and constraints of a DSF in natural ventilation performance. Future work could include the optimization of DSF opening configurations and placement to enhance wind-driven ventilation.
Author Contributions
Conceptualization, G.H.; methodology, G.H. and Y.M.; formal analysis, G.H. and Z.F.; resources, G.H. and C.Y.; data curation, Y.M. and L.Y.; writing—original draft preparation, G.H., Y.M., and Z.F.; writing—review and editing, G.H. and Z.F.; visualization, Z.F. and Y.M.; funding acquisition, G.H. and C.Y. All authors have read and agreed to the published version of the manuscript.
Funding
This research was funded by “The Zhejiang Natural Science Foundation of China, grant number LY21E080023” and “The Center for Balance Architecture of Zhejiang University, grant no. 68”.
Data Availability Statement
The original contributions presented in this study are included in the article. Further inquiries can be directed to the first or corresponding authors.
Conflicts of Interest
Authors Linfeng Yao and Changqing Ye were employed by the company The Architectural Design & Research Institute of Zhejiang University Co., Ltd. The remaining authors declare that the research was conducted in the absence of any commercial or financial relationships that could be construed as a potential conflict of interest.
Nomenclature
| aPMV | Adaptive Predicted Mean Vote |
| DSF | Double skin facade |
| PMV | Predicted Mean Vote |
| Isol,H | Horizontal irradiation, W/m2 |
| Isol,V | Vertical irradiation, W/m2 |
| Rh | Relative humidity, % |
| Ta | Room air temperature, °C |
| Tb | Black globe temperature, °C |
| TCV | Thermal comfort vote |
| To | Operative temperature, °C |
| Tout | Outdoor air temperature, °C |
| v | Velocity, m/s |
Appendix A. Survey Report
Please check the “□” of the option that best fits your answer (multiple choices for some questions).
1. Thermal comfort evaluation: Do you feel thermally comfortable?: 1 for the worst (very uncomfortable, 5 for the most comfortable)
(□1, □2, □3, □4, □5)
2. Do you feel the air is stagnant or the wind is too small? 1 for most stagnant) and 5 for strongest wind feeling
□ 1 I felt no wind: the wind is too small.
□ 2 I felt wind, but it can be greater.
□ 3 I wasn’t aware of the need for wind: it is moderate.
□ 4 The wind was a bit strong, but it is not too much.
□ 5 Wind speed was sometimes too high.
3. Would you want a larger opening of the window?
□ 1 Never thought about it (End)
□ 2 I thought about it, and it should be larger (Go to 4)
□ 3 I thought about it, and I think it’s okay now (End)
□ 4 I thought about it, and I think it can be smaller (Go to 5)
4. If you want the window opening to be larger, why?
_________________________________________________________________
5. If you want the window opening to be smaller, why?
_________________________________________________________________
References
- Ghaffarianhoseini, A.; Berardi, U.; Tookey, J.; Li, D.H.W.; Kariminia, S. Exploring the advantages and challenges of double-skin façades (DSFs). Renew. Sustain. Energy Rev. 2016, 60, 1052–1065. [Google Scholar] [CrossRef]
- Pomponi, F.; Piroozfar, P.; Southall, R.; Ashton, P.; Farr, E.R. Energy performance of Double-Skin Façades in temperate climates: A systematic review and meta-analysis. Renew. Sustain. Energy Rev. 2016, 54, 1525–1536. [Google Scholar] [CrossRef]
- Hu, G.; Hassanli, S.; Kwok, K.; Tse, K. Wind-induced responses of a tall building with a double-skin façade system. J. Wind. Eng. Ind. Aerodyn. 2017, 168, 91–100. [Google Scholar] [CrossRef]
- Zhu, J.; He, G. Heat transfer coefficients of double skin facade windows. Sci. Technol. Built Environ. 2019, 25, 1143–1151. [Google Scholar] [CrossRef]
- Preet, S.; Mathur, J.; Mathur, S. Influence of geometric design parameters of double skin facade on its thermal and fluid dynamics behavior: A comprehensive review. Sol. Energy 2022, 236, 249–279. [Google Scholar] [CrossRef]
- Pelletier, K.; Wood, C.; Calautit, J.; Wu, Y. The viability of double-skin façade systems in the 21st century: A systematic review and meta-analysis of the nexus of factors affecting ventilation and thermal performance, and building integration. Build. Environ. 2023, 228, 109870. [Google Scholar] [CrossRef]
- Zomorodian, Z.S.; Tahsildoost, M. Energy and carbon analysis of double skin façades in the hot and dry climate. J. Clean. Prod. 2018, 197, 85–96. [Google Scholar] [CrossRef]
- Inan, T.; Basaran, T. Experimental and numerical investigation of forced convection in a double skin façade by using nodal network approach for Istanbul. Sol. Energy 2019, 183, 441–452. [Google Scholar] [CrossRef]
- Wang, M.; Hou, J.; Hu, Z.; He, W.; Yu, H. Optimisation of the double skin facade in hot and humid climates through altering the design parameter combinations. Build. Simul. 2021, 14, 511–521. [Google Scholar] [CrossRef]
- Kong, X.; Ren, Y.; Ren, J.; Duan, S.; Guo, C. Energy-saving performance of respiration-type double-layer glass curtain wall system in different climate zones of China: Experiment and simulation. Energy Build. 2021, 252, 111464. [Google Scholar] [CrossRef]
- Gratia, E.; De Herde, A. Are energy consumptions decreased with the addition of a double-skin? Energy Build. 2007, 39, 605–619. [Google Scholar] [CrossRef]
- Pomponi, F.; Piroozfar, P.A.E.; Southall, R.; Ashton, P.; Pirozfar, P.; Farr, E.R.P. Life cycle energy and carbon assessment of double skin façades for office refurbishments. Energy Build. 2015, 109, 143–156. [Google Scholar] [CrossRef]
- Aldawoud, A.; Salameh, T.; Kim, Y.K. Double skin façade: Energy performance in the United Arab Emirates. Energy Sources Part B: Econ. Plan. Policy 2021, 16, 387–405. [Google Scholar] [CrossRef]
- Yoon, Y.; Seo, B.; Mun, J.; Cho, S. Energy savings and life cycle cost analysis of advanced double skin facade system applied to old apartments in South Korea. J. Build. Eng. 2023, 71, 106535. [Google Scholar] [CrossRef]
- Baldinelli, G. Double skin façades for warm climate regions: Analysis of a solution with an integrated movable shading system. Build. Environ. 2009, 44, 1107–1118. [Google Scholar] [CrossRef]
- Xu, L.; Ojima, T. Field experiments on natural energy utilization in a residential house with a double skin façade system. Build. Environ. 2007, 42, 2014–2023. [Google Scholar] [CrossRef]
- Wang, Y.; Chen, Y.; Li, C. Energy performance and applicability of naturally ventilated double skin façade with Venetian blinds in Yangtze River Area. Sustain. Cities Soc. 2020, 61, 102348. [Google Scholar] [CrossRef]
- Huckemann, V.; Kuchen, E.; Leão, M.; Leão, É.F. Empirical thermal comfort evaluation of single and double skin façades. Build. Environ. 2010, 45, 976–982. [Google Scholar] [CrossRef]
- Pomponi, F.; D’Amico, B. Holistic study of a timber double skin façade: Whole life carbon emissions and structural optimisation. Build. Environ. 2017, 124, 42–56. [Google Scholar] [CrossRef]
- An, Y.; Choi, H.; Kim, E.; Kim, T. Experimental analysis of seasonal temperature characteristics and cooling and heating energy consumption of a slim double-skin window. Energy Build. 2022, 256, 111681. [Google Scholar] [CrossRef]
- Gelesz, A.; Lucchino, E.C.; Goia, F.; Serra, V.; Reith, A. Characteristics that matter in a climate façade: A sensitivity analysis with building energy simulation tools. Energy Build. 2020, 229, 110467. [Google Scholar] [CrossRef]
- Luo, Y.; Zhang, L.; Wu, J.; Wang, X.; Liu, Z.; Wu, Z. Modeling of solar transmission through multilayer glazing facade using shading blinds with arbitrary geometrical and surface optical properties. Energy 2017, 128, 163–182. [Google Scholar] [CrossRef]
- Wang, Y.; Chen, Y. Modeling and calculation of solar gains through multi-glazing facades with specular reflection of venetian blind. Sol. Energy 2016, 130, 33–45. [Google Scholar] [CrossRef]
- Bueno, B.; Street, M.; Pflug, T.; Braesch, C. A co-simulation modelling approach for the assessment of a ventilated double-skin complex fenestration system coupled with a compact fan-coil unit. Energy Build. 2017, 151, 18–27. [Google Scholar] [CrossRef]
- Shukla, A.K.; Sudhakar, K.; Baredar, P. Recent advancement in BIPV product technologies: A review. Energy Build. 2017, 140, 188–195. [Google Scholar] [CrossRef]
- Wang, M.; Peng, J.; Li, N.; Yang, H.; Wang, C.; Li, X.; Lu, T. Comparison of energy performance between PV double skin facades and PV insulating glass units. Appl. Energy 2017, 194, 148–160. [Google Scholar] [CrossRef]
- Hong, X.; Lin, J.; Yang, X.; Wang, S.; Shi, F. Comparative Analysis of the Daylight and Building-Energy Performance of a Double-Skin Facade System with Multisectional Shading Devices of Different Control Strategies. J. Energy Eng. 2022, 148, 05022001. [Google Scholar] [CrossRef]
- Yang, S.; Cannavale, A.; Di Carlo, A.; Prasad, D.; Sproul, A.; Fiorito, F. Performance assessment of BIPV/T double-skin façade for various climate zones in Australia: Effects on energy consumption. Sol. Energy 2020, 199, 377–399. [Google Scholar] [CrossRef]
- Lee, C.-S.; Lee, H.; Choi, M.; Yoon, J. Design optimization and experimental evaluation of photovoltaic double skin facade. Energy Build. 2019, 202, 109314. [Google Scholar] [CrossRef]
- Ioannidis, Z.; Buonomano, A.; Athienitis, A.; Stathopoulos, T. Modeling of double skin façades integrating photovoltaic panels and automated roller shades: Analysis of the thermal and electrical performance. Energy Build. 2017, 154, 618–632. [Google Scholar] [CrossRef]
- Luo, Y.; Zhang, L.; Wang, X.; Xie, L.; Liu, Z.; Wu, J.; Zhang, Y.; He, X. A comparative study on thermal performance evaluation of a new double skin façade system integrated with photovoltaic blinds. Appl. Energy 2017, 199, 281–293. [Google Scholar] [CrossRef]
- Peng, J.; Curcija, D.C.; Lu, L.; Selkowitz, S.E.; Yang, H.; Zhang, W. Numerical investigation of the energy saving potential of a semi-transparent photovoltaic double-skin facade in a cool-summer Mediterranean climate. Appl. Energy 2016, 165, 345–356. [Google Scholar] [CrossRef]
- Preet, S.; Sharma, M.K.; Mathur, J.; Chowdhury, A.; Mathur, S. Performance evaluation of photovoltaic double-skin facade with forced ventilation in the composite climate. J. Build. Eng. 2020, 32, 101733. [Google Scholar] [CrossRef]
- Shen, C.; Li, X. Thermal performance of double skin façade with built-in pipes utilizing evaporative cooling water in cooling season. Sol. Energy 2016, 137, 55–65. [Google Scholar] [CrossRef]
- Yan, S.; Li, X.; Wang, B.; Shi, W.; Lyu, W. A method to describe the thermal property of pipe-embedded double-skin facade Equivalent glass windown. Energy Build. 2019, 195, 33–44. [Google Scholar] [CrossRef]
- Li, Y.; Darkwa, J.; Kokogiannakis, G.; Su, W. Phase change material blind system for double skin façade integration: System development and thermal performance evaluation. Appl. Energy 2019, 252, 113376. [Google Scholar] [CrossRef]
- Li, Y.; Darkwa, J.; Kokogiannakis, G. Heat transfer analysis of an integrated double skin façade and phase change material blind system. Build. Environ. 2017, 125, 111–121. [Google Scholar] [CrossRef]
- Yang, F.; Yuan, F.; Qian, F.; Zhuang, Z.; Yao, J. Summertime thermal and energy performance of a double-skin green facade: A case study in Shanghai. Sustain. Cities Soc. 2018, 39, 43–51. [Google Scholar] [CrossRef]
- Parhizkar, H.; Khoraskani, R.A.; Tahbaz, M. Double skin façade with Azolla; ventilation, Indoor Air Quality and Thermal Performance Assessment. J. Clean. Prod. 2020, 249, 119313. [Google Scholar] [CrossRef]
- Matour, S.; Garcia-Hansen, V.; Omrani, S.; Hassanli, S.; Drogemuller, R. Wind-driven ventilation of Double Skin Façades with vertical openings: Effects of opening configurations. Build. Environ. 2021, 196, 107804. [Google Scholar] [CrossRef]
- He, G.; Shu, L.; Zhang, S. Double skin facades in the hot summer and cold winter zone in China: Cavity open or closed? Build. Simul. 2011, 4, 283–291. [Google Scholar] [CrossRef]
- Tanaka, H.; Okumiya, M.; Yoon, G.Y.; Watanabe, K. Thermal characteristics of a double-glazed external wall system with roll screen in cooling season. Build. Environ. 2009, 44, 1509–1516. [Google Scholar] [CrossRef]
- Gratia, E.; De Herde, A. Natural ventilation in a double-skin facade. Energy Build. 2004, 36, 137–146. [Google Scholar] [CrossRef]
- Preet, S.; Sharma, M.K.; Mathur, J.; Chowdhury, A.; Mathur, S. Analytical model of semi-transparent photovoltaic double-skin façade system (STPV-DSF) for natural and forced ventilation modes. Int. J. Vent. 2023, 22, 138–167. [Google Scholar] [CrossRef]
- Sanchez, E.; Rolando, A.; Sant, R.; Ayuso, L. Influence of natural ventilation due to buoyancy and heat transfer in the energy efficiency of a double skin facade building. Energy Sustain. Dev. 2016, 33, 139–148. [Google Scholar] [CrossRef]
- Hou, K.; Li, S.; Wang, H. Simulation and experimental verification of energy saving effect of passive preheating natural ventilation double skin façade. Energy Explor. Exploit. 2021, 39, 464–487. [Google Scholar] [CrossRef]
- Kong, X.; Liu, S.; Yang, H.; Zhong, Y.; Qi, C. An experimental study of all-season operation strategy for a respiration-type double-layer glass curtain wall system in cold zone of China. Build. Environ. 2016, 97, 166–176. [Google Scholar] [CrossRef]
- Alibaba, H.Z.; Ozdeniz, M.B. Energy Performance and Thermal Comfort of Double-Skin and Single-Skin Facades in Warm-Climate Offices. J. Asian Arch. Build. Eng. 2016, 15, 635–642. [Google Scholar] [CrossRef]
- Guoqing, H.; Yuan, M.; Guo, X.; Chen, D.; Ye, C. Analysis of Influencing Factors on Cavity Ventilation of Double Skin Façade. Build. Energy Environ. 2022, 41, 1–5. [Google Scholar]
- He, G. A general model for predicting the airflow rates of a vertically installed solar chimney with connecting ducts. Energy Build. 2020, 229, 110481. [Google Scholar] [CrossRef]
- Tao, Y.; Yan, Y.; Fang, X.; Zhang, H.; Tu, J.; Shi, L. Solar-assisted naturally ventilated double skin façade for buildings: Room impacts and indoor air quality. Build. Environ. 2022, 216, 109002. [Google Scholar] [CrossRef]
- Pasquay, T. Natural ventilation in high-rise buildings with double facades, saving or waste of energy. Energy Build. 2004, 36, 381–389. [Google Scholar] [CrossRef]
- Barbosa, S.; Ip, K. Predicted thermal acceptance in naturally ventilated office buildings with double skin façades under Brazilian climates. J. Build. Eng. 2016, 7, 92–102. [Google Scholar] [CrossRef]
- Nasrollahi, N.; Ghobadi, P. Field measurement and numerical investigation of natural cross-ventilation in high-rise buildings; Thermal comfort analysis. Appl. Therm. Eng. 2022, 211, 118500. [Google Scholar] [CrossRef]
- Ye, C.; Yao, L.; Meng, Y.; Zhang, Y.; He, G. Post-Occupancy Evaluation of Green Technologies for a High-Rise Building Based on User Experience. Sustainability 2022, 14, 9538. [Google Scholar] [CrossRef]
- Zhou, J.; Zhang, X.; Xie, J.; Liu, J. Occupant’s preferred indoor air speed in hot-humid climate and its influence on thermal comfort. Build. Environ. 2023, 229, 109933. [Google Scholar] [CrossRef]
- Gao, C.; Lee, W. Evaluating the influence of openings configuration on natural ventilation performance of residential units in Hong Kong. Build. Environ. 2011, 46, 961–969. [Google Scholar] [CrossRef]
- Fu, X.; Tai, V.C.; Moey, L.K.; Rahman, N.F.A.; Ahmad, K.A.; Baglee, D. Opening configurations and natural cross ventilation performance in a double-loaded multi-level apartment building: A CFD analysis. Build. Environ. 2024, 254, 111404. [Google Scholar] [CrossRef]
- Seifert, J.; Li, Y.; Axley, J.; Rösler, M. Calculation of wind-driven cross ventilation in buildings with large openings. J. Wind. Eng. Ind. Aerodyn. 2006, 94, 925–947. [Google Scholar] [CrossRef]
- Shen, X.; Su, R.; Ntinas, G.K.; Zhang, G. Influence of sidewall openings on air change rate and airflow conditions inside and outside low-rise naturally ventilated buildings. Energy Build. 2016, 130, 453–464. [Google Scholar] [CrossRef]
- Vickery, B.J.; Karakatsanis, C.G. External wind pressure distributions and induced internal ventilation flow in low-rise industrial and domestic structures. Ashrae Trans. 1987, 93, 2198–2213. [Google Scholar]
- Jiang, Z.; Kobayashi, T.; Yamanaka, T.; Sandberg, M. A literature review of cross ventilation in buildings. Energy Build. 2023, 291, 113143. [Google Scholar] [CrossRef]
- Derakhshan, S.; Shaker, A. Numerical study of the cross-ventilation of an isolated building with different opening aspect ratios and locations for various wind directions. Int. J. Vent. 2017, 16, 42–60. [Google Scholar] [CrossRef]
- ANSI/ASHRAE Standard 55-2017; Thermal Environmental Conditions for Human Occupancy. American Society of Heating, Refrigerating and Air-Conditioning Engineer: Atlanta, GA, USA, 2023; p. 72.
- GB/T 50785-2012; Evaluation Standard for Indoor Thermal Environment in Civil Buildings. Ministry of Housing and Urban-Rural Development (MOHURD): Beijing, China, 2012.
- Center for the Built Environment. CBE Thermal Comfort Tool. Available online: https://comfort.cbe.berkeley.edu/ (accessed on 25 April 2025).
- Pourshab, N.; Tehrani, M.D.; Toghraie, D.; Rostami, S. Application of double glazed façades with horizontal and vertical louvers to increase natural air flow in office buildings. Energy 2020, 200, 117486. [Google Scholar] [CrossRef]
- Darkwa, J.; Li, Y.; Chow, D. Heat transfer and air movement behaviour in a double-skin façade. Sustain. Cities Soc. 2014, 10, 130–139. [Google Scholar] [CrossRef]
- Gratia, E.; De Herde, A. Guidelines for improving natural daytime ventilation in an office building with a double-skin facade. Sol. Energy 2007, 81, 435–448. [Google Scholar] [CrossRef]
- Awbi, H. Ventilation of Buildings; Routledge: Abingdon-on-Thames, UK, 2004. [Google Scholar] [CrossRef]
- Chu, C.-R.; Chiang, B.-F. Wind-driven cross ventilation with internal obstacles. Energy Build. 2013, 67, 201–209. [Google Scholar] [CrossRef]
- ISO 7730:2005; Ergonomics of the Thermal Environment—Analytical Determination and Interpretation of Thermal Comfort Using Calculation of the PMV and PPD Indices and Local Thermal Comfort Criteria; ISO: Geneva, Switzerland, 2005.
- Fanger, P.O.; Toftum, J. Extension of the PMV model to non-air-conditioned buildings in warm climates. Energy Build. 2002, 34, 533–536. [Google Scholar] [CrossRef]
- de Dear, R.; Xiong, J.; Kim, J.; Cao, B. A review of adaptive thermal comfort research since 1998. Energy Build. 2020, 214, 109893. [Google Scholar] [CrossRef]
- Tecle, A.; Bitsuamlak, G.T.; Jiru, T.E. Wind-driven natural ventilation in a low-rise building: A Boundary Layer Wind Tunnel study. Build. Environ. 2013, 59, 275–289. [Google Scholar] [CrossRef]
- Hou, Y.; Li, A.; Mei, S. Learning from Chinese traditional architecture: Field test and CFD modelling of ventilation enhancement techniques in southern Chinese houses. Int. J. Vent. 2022, 21, 1–18. [Google Scholar] [CrossRef]
- Sacht, H.; Lukiantchuki, M.A. Windows Size and the Performance of Natural Ventilation. Procedia Eng. 2017, 196, 972–979. [Google Scholar] [CrossRef]
- Gratia, E.; De Herde, A. Is day natural ventilation still possible in office buildings with a double-skin façade? Build. Environ. 2004, 39, 399–409. [Google Scholar] [CrossRef]
- Nomura, M.; Hiyama, K. A review: Natural ventilation performance of office buildings in Japan. Renew. Sustain. Energy Rev. 2017, 74, 746–754. [Google Scholar] [CrossRef]
Disclaimer/Publisher’s Note: The statements, opinions and data contained in all publications are solely those of the individual author(s) and contributor(s) and not of MDPI and/or the editor(s). MDPI and/or the editor(s) disclaim responsibility for any injury to people or property resulting from any ideas, methods, instructions or products referred to in the content. |
© 2025 by the authors. Licensee MDPI, Basel, Switzerland. This article is an open access article distributed under the terms and conditions of the Creative Commons Attribution (CC BY) license (https://creativecommons.org/licenses/by/4.0/).