Article

Thermal Impacts of Air Cavities Associated with Insulated Panels Deployed for Exterior Building Envelope Assemblies

by
Utsav Dahal
and
Moncef Krarti
*
Civil, Environmental and Architectural Engineering Department, University of Colorado, Boulder, CO 80309, USA
*
Author to whom correspondence should be addressed.
Energies 2025, 18(13), 3573; https://doi.org/10.3390/en18133573
Submission received: 3 June 2025 / Revised: 2 July 2025 / Accepted: 4 July 2025 / Published: 7 July 2025
(This article belongs to the Special Issue Energy Efficiency and Energy Performance in Buildings—2nd Edition)

Abstract

This paper presents a comprehensive investigation to evaluate the impacts of air cavities between existing walls and insulated panels on the overall R-values of the retrofitted building envelope systems, addressing a key challenge in exterior envelope retrofitting. The effects of several factors are considered including the air cavity thickness (ranging from 0.1 cm to 5 cm), airflow velocity (varying between 0.1 m/s and 1 m/s), and surface emissivity (set between 0.1 and 0.9), in addition to the thickness of the insulated panels (ranging from 1 cm to 7 cm). It is found that any increase in the air cavity thickness increases the overall R-values of the building envelope assemblies when air is trapped within the sealed cavity. However, when air convection is prevalent, the overall R-value of the retrofitted walls decreases with any increase in air velocity and air cavity thickness. For sealed air cavities, the analysis results show a 9% improvement in R-value of the retrofitted walls. However, the R-value of retrofitted walls with unsealed air cavities can degrade by 76% and 81% for natural and forced air flows, respectively. Emissivity adjustment is found to be the most effective in improving the thermal performance of building envelopes with sealed air cavities, increasing the R-value of retrofitted walls by 13.6% when reduced from 0.9 to 0.1.

1. Introduction

The overall building sector accounted for 28.1% of the global total energy consumption during 2023. Specifically, residential buildings consumed 86 exajoules, representing 19.3% of world energy demand, while the other building types accounted for the remaining 8.7% [1]. The ongoing increase in global energy consumption has resulted in significant challenges, particularly for the residential sector [2]. Indeed, high energy demands by the built environment have contributed to increases in greenhouse gas emissions and global warming [3]. In addition, population growth is estimated to drive up to 52% increases in urban building energy demand by 2050, with climate change could increase cooling needs by 14% per °C while reducing heating by 10% per °C and spiking peak electricity demand by up to 170% in some US cities [4].
Improving the energy efficiency of buildings can significantly reduce their energy needs and associated carbon emissions [5]. One effective measure to enhance the energy performance of buildings is to insulate their exterior envelopes. Indeed, the deployment of thermal insulation in the building envelope has been shown to reduce heat transfer, consequently lowering energy needs for space heating and cooling while maintaining suitable indoor thermal comfort levels [6]. It has been shown that insulating building envelope systems can save up to 50–60% of the total energy use in buildings [7], with demonstrated savings of 47.2% in residential buildings through optimized wall and roof thermal insulation levels [8]. The economic benefits of the deployment of thermal insulation depend on the building types and climatic conditions [9]. Recent advances in dynamic and multi-functional insulation materials have indicated that even higher potential for energy and cost savings could be achieved compared with those obtained by their static insulation counterparts for buildings in a wide range of climatic conditions [10].
The thermal performance of building envelopes is characterized by their thermal resistance or R-value, which measures the capability of an envelope assembly to resist heat flow due to a temperature difference across its inner and outer surfaces. Building envelope systems with higher R-values exhibit better thermal insulation properties and lower heat transmission [11]. Moreover, the placement and thickness of the insulation layer can significantly affect the overall R-value of the building envelope assemblies [12]. The presence of air cavities between insulation layers and other construction layers can significantly affect the R-values of building envelope assemblies, with optimal positioning and material selection critical to maximizing energy efficiency [13]. In most applications to building envelope systems, sealed air cavities impede heat flow due to the low thermal conductivity of stationary air, and these sealed cavities can act as thermal barriers and can enhance the overall R-value of building envelope assemblies [14]. However, the thickness of the sealed air cavity may need to be optimized to maximize the thermal performance of building envelope assemblies [15,16]. Moreover, the inclusion of reflective coatings within sealed air cavities can further enhance their thermal performance [17,18]. Thermal impacts of sealed air spaces within specific configurations of building envelope assemblies are documented in the ASHRAE Handbook of Fundamentals [19].
In addition, unsealed and ventilated air cavities within building envelope systems have been considered to enhance air flows for a wide range of applications and purposes. For instance, ventilated facades are utilized to lower temperatures of the exterior surfaces and reduce thermal loads to cool the building [20]. Moreover, ventilated air cavities are used as effective options to dry moisture within building envelope assemblies, including insulation layers, and prevent conditions conducive to mold growth and structural damage [21]. Specifically, airflows within unsealed cavities can dissipate excess heat during the summer season and can retain heat during the winter season, thereby contributing to a balanced thermal performance of wall assemblies throughout the year [22]. To experimentally evaluate the effects of ventilated air cavities, a study has proposed modifications to the ASTM C1363-19 hot box method to measure the effective thermal resistance of ventilated air spaces. With the use of precise temperature and heat flux sensors, the thermal behavior of ventilated cavities can be captured accurately [23]. Parametric studies have shown that the angle of façade placement and the ventilation velocity significantly influence both airflow pattern and thermal resistance level [24]. Another study by Domínguez-Torres et al. demonstrated that optimally designed opaque ventilated façades with windows in Mediterranean climates can reduce yearly heat flux by up to 32%, with key parameters including open ventilation grilles, a 0.1 m air channel thickness, and a 0.4 solar absorptivity outer surface [25]. Thermal performance improvements in ventilated stone facades are empirically demonstrated with optimized design specifications, including insulation thickness and air gap dimensions, which achieved a 30.9% reduction in U-values (from 0.33 to 0.228 W/(m2·K)) [26]. Facades with combined airflow channels and reflective barriers have been found to have increased their overall thermal resistance by up to threefold when compared with non-ventilated retrofitted facades [27].
Low-cost alternative approaches for improving the energy performance of envelope assemblies in specific existing buildings have been proposed, especially in Europe, using prefabricated exterior insulated retrofit panels [28]. Indeed, prefabricated insulated panels have been successfully used as part of a Dutch-inspired initiative to retrofit several homes throughout Europe [29]. A detailed review of alternative designs of insulated panels has been recently presented by Biega and Krarti [29]. The common feature of these insulated panels is the ease of installation along the outside of the existing façades without disturbing building occupants, unlike the case of traditional retrofit approaches. Some of these prefabricated insulated panels must be hung on existing walls, creating potential air cavities [29]. While prefabricated insulated panels are increasingly used for building envelope retrofits [28], to date, no analysis has been reported to address the thermal impacts of these air cavities between the insulated retrofit panels and existing wall assemblies where cavity thickness, airflow, and emissivity interact dynamically. The detailed analysis presented in this paper addresses this research gap to determine the energy performance of wall assemblies retrofitted with prefabricated insulated panels, considering the impacts of sealed and unsealed air cavities. This study aims to evaluate how air cavities in retrofitted wall assemblies affect overall R-values, considering cavity thickness, airflow, and surface emissivity. By quantifying these effects, actionable insights can be provided for optimizing panel installations to maximize their thermal performance. First, the analysis approach is outlined, including the description of the air cavity configurations of retrofitted wall assemblies with insulated panels. Then, the solution methodology is presented with the results of a verification analysis. Finally, the thermal impacts of sealed and unsealed air cavities between wall assemblies and insulated panels under various design and operation conditions are considered to account for air cavity thickness, insulation thickness, surface emissivity, and outdoor conditions.

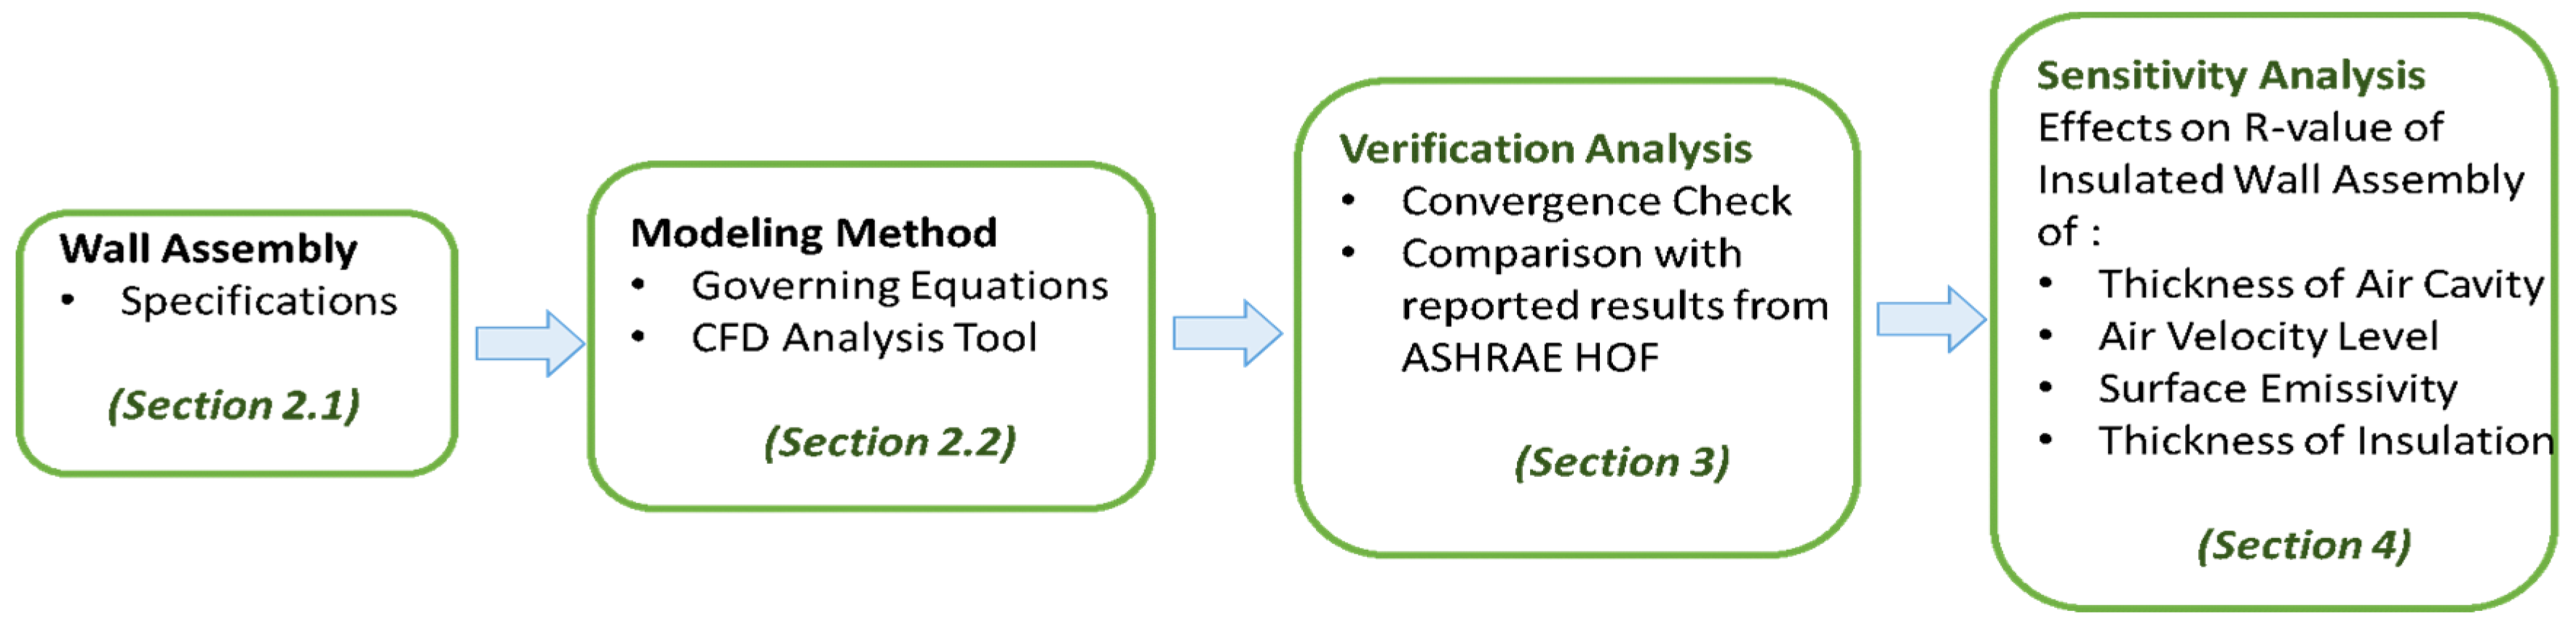
2. Materials and Methods

Figure 1 illustrates the general analysis approach considered in this study using computational fluid dynamics (CFD) modeling. First, the wall assembly with the attached retrofit insulated panel is described in Section 2.1, including material properties and thicknesses. Then, the governing equations used in the CFD modeling analysis are outlined in Section 2.2 to determine the effective thermal performance of retrofitted wall assemblies with insulated panels. The results of the CFD analysis are verified in Section 3 with well-established data, including those listed in the ASHRAE Handbook of Fundamentals (HOF) [20]. Finally, the main findings from a series of sensitivity analyses are summarized and discussed in Section 4 to assess the impacts of various specifications of wall assembly and insulated panel.

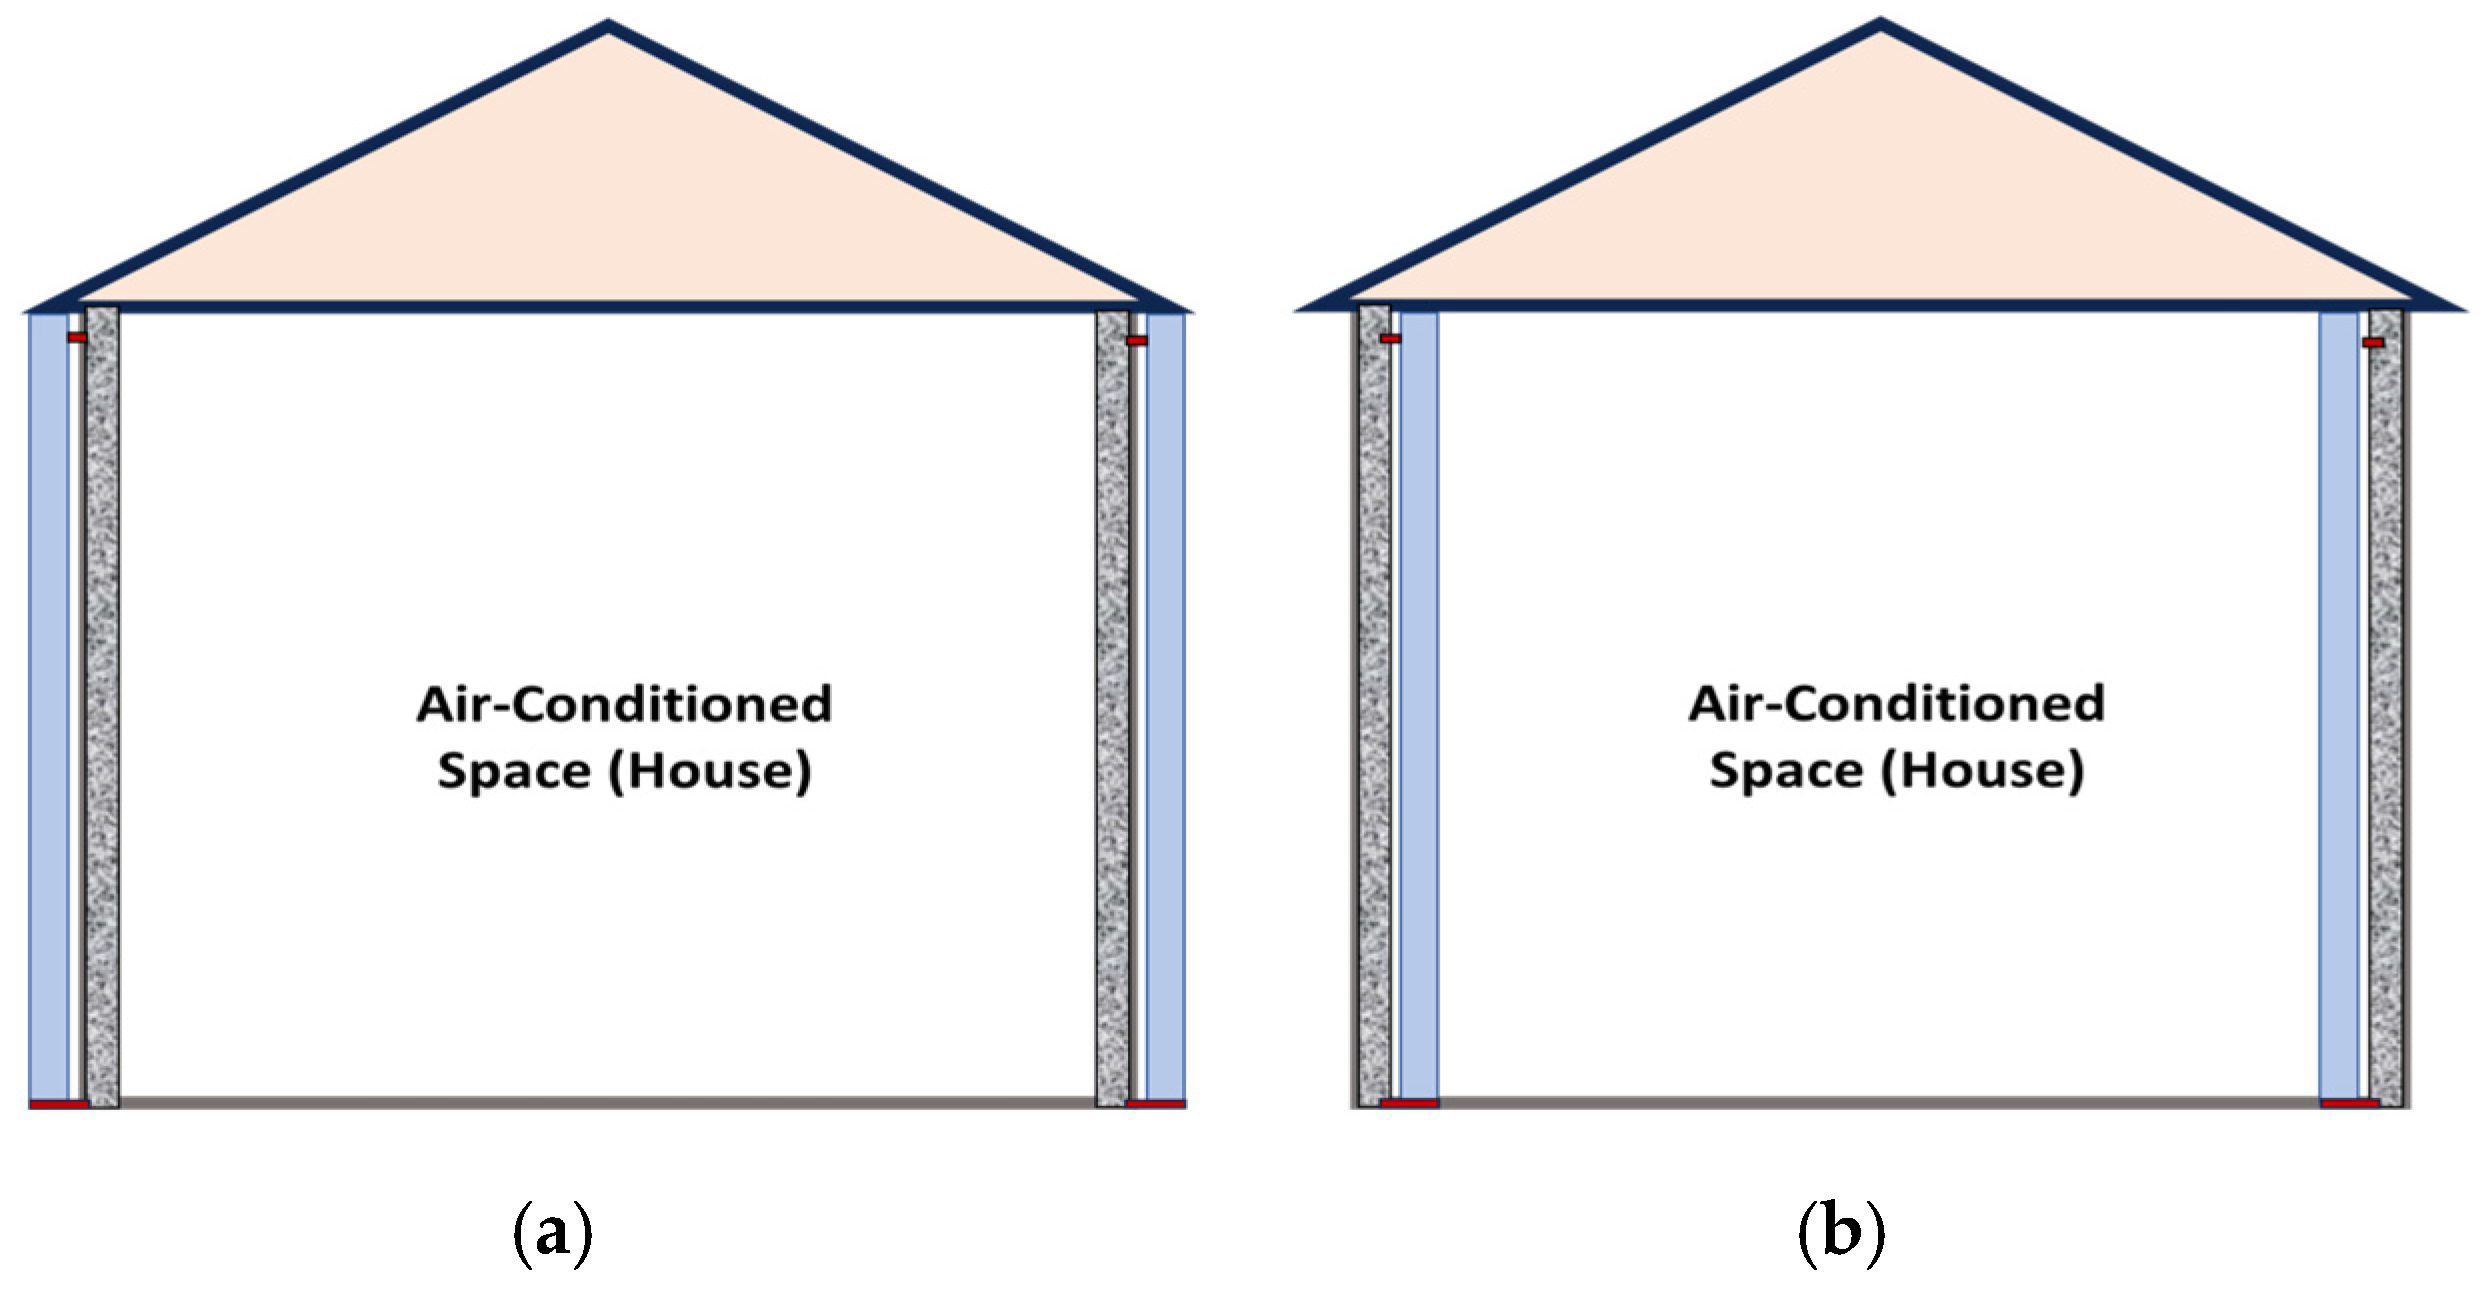
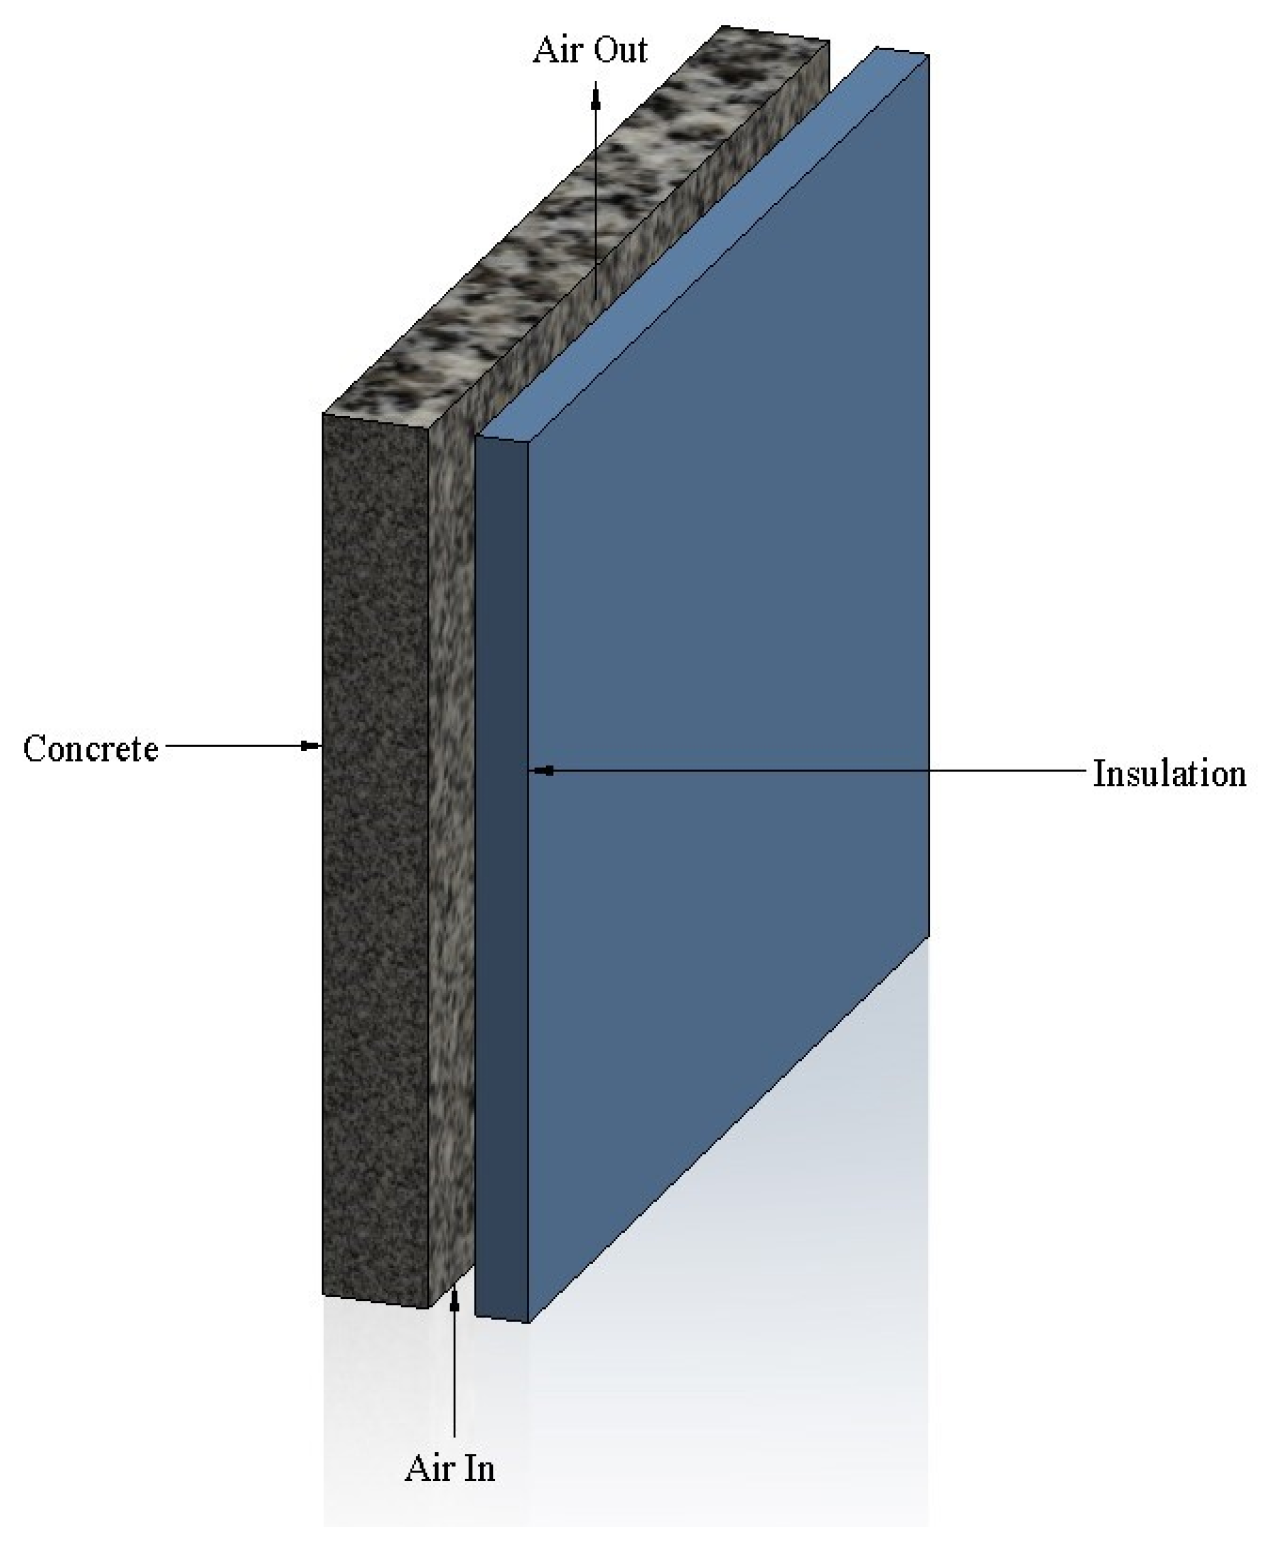
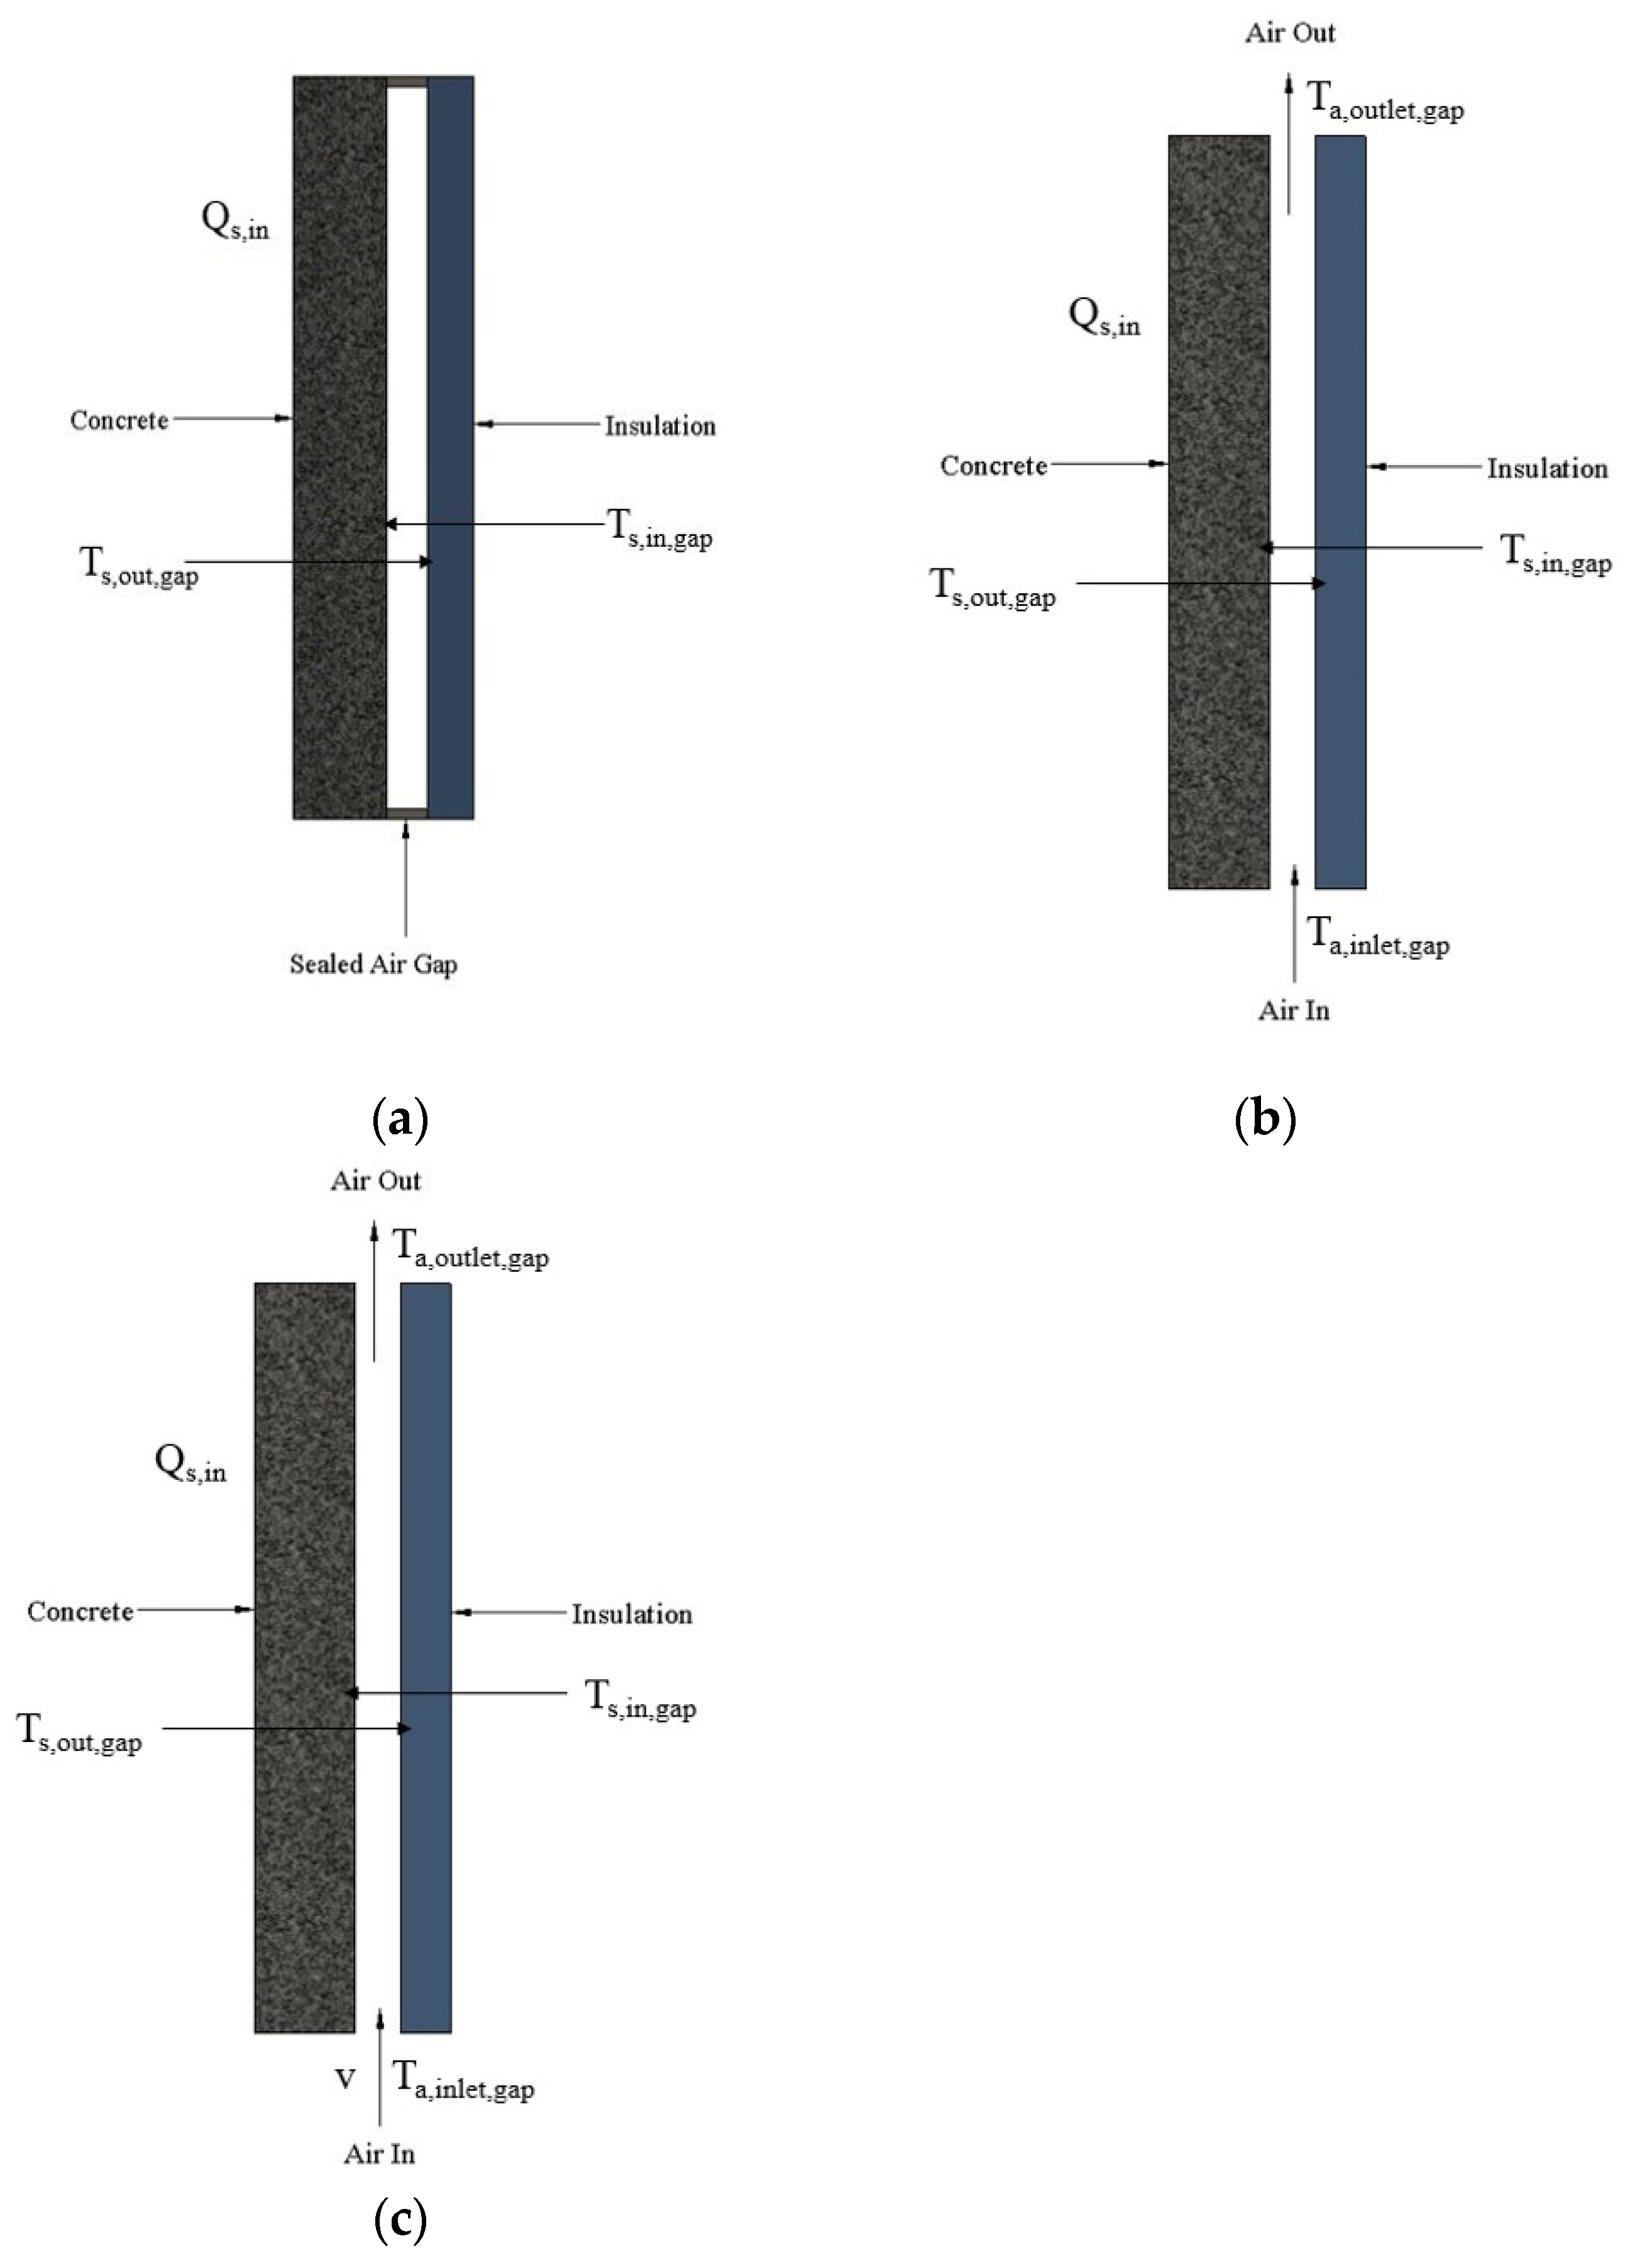
2.1. Wall Assembly Description

For this study, the case of retrofitting existing walls with insulated panels is considered as illustrated in Figure 2. These insulated panels can be prefabricated and seamlessly installed on-site without significantly disturbing the occupants of buildings. Such prefabricated insulated panels have been demonstrated in deep retrofit projects across Europe using the Energiesprong approach [28]. Figure 2 shows an example of a prefabricated insulated panel that can be installed to retrofit existing building walls along either their exterior facade (Figure 2a) or from their interior side (Figure 2b). Figure 3 illustrates an insulated panel and its installation mechanism to an existing wall using guided clips and bars as well as French cleat hangers and receivers based on the design proposed by Biega and Krarti [29]. The installation on the exterior wall facades offers the benefits of easy installation and reduced disturbance to the indoor occupants [24].
To showcase the analysis approach for the impact of air cavities in retrofitted wall assemblies with insulated panels, the specific case of a rigid thermal insulation layer attached to an existing concrete wall is considered, as shown in Figure 4.
As illustrated in Figure 4, an air cavity separating the existing wall and the insulated panel wall can affect the overall heat transfer through the retrofitted wall assembly. Indeed, when the cavity is not sealed, air can freely flow by natural or forced convection and affect the thermal performance of the wall assembly. In addition to the airflow type and rate, the thermal performance of the insulated wall assembly can depend on several factors, including surface emissivity, air thickness, and indoor–outdoor difference. Figure 5 illustrates the three cases of airflow within the air cavity analyzed throughout this study, including a sealed cavity (Figure 5a) and an unsealed air gap with natural convection cavity with free flow of air by natural convection (Figure 5b) or forced convection with a predefined inlet air flow velocity (Figure 5c).

2.2. Overview of Modeling Analysis

For this study, a steady-state condition is considered. The flow of air within the wall cavity, such as noted in Figure 4, is governed by the incompressible Navier–Stokes equations,
Continuity   Equation : · u = 0
Momentum   Equation :   ρ ( u ·   ) u = p + μ 2 u
where u represents the velocity field, ρ the density, p the pressure, and µ the dynamic viscosity of air.
The thermal energy transfer within various layers of the wall assembly including air cavity and solid layers is described by applying the energy balance principle for both the fluid and the solid domains, as in
For   Air   ( Fluid ) :   ρ c p ( u   · ) T = k   2 T + q r a d
For   Solids :   k   2 T s = 0
where T and Ts denote the temperatures of air and solids, respectively, cp and cp,s are their specific heats, k and ks are their thermal conductivities, and qrad is the radiative heat flux.
For this study, the computational fluid dynamics tool, ANSYS version 12, is used to solve the combined heat transfer and airflow problem stated by Equations (1)–(4) [30]. Specifically, the energy balance and momentum balance equations are solved using the discrete ordinates or DO model for radiation and the k-omega model for viscosity. The DO model allows for solving thermal interactions between solid surfaces adjacent to fluids or other solid systems using “semi-transparent” media. The k−ω model is widely utilized for solving turbulence flow problems [31]. The convective terms in the momentum and energy equations have been discretized using a second-order upwind scheme, selected for its effective balance between accuracy and stability for low-speed buoyancy-driven flows [32]. This approach minimizes numerical diffusions while maintaining accurate solutions for flows with air velocity ranging between (0.1 m/s and 1.0 m/s. The coupled pressure-velocity set of equations has been solved using the Semi-Implicit Method for Pressure-Linked Equations (SIMPLE) algorithm with second-order pressure interpolation [32]. For the final solutions, convergence criteria are set to be 10−14 for energy and 10−6 for momentum equations. The CFD analysis uses a structured hexahedral mesh (25,675 nodes and 25,268 elements).

2.3. Thermal Properties of Wall Assembly

In most configurations considered in this study, the height of the wall and thickness of the concrete wall are set to be 1.0 m and 10.0 cm, while the thickness of the insulated panel can vary from 1.0 cm to 7.0 cm. Additionally, the thickness of the air cavity, located between the concrete layer and the insulated panel, is set to vary from 0.1 cm to 5.0 cm. Furthermore, the emissivity of the air cavity inner surfaces is varied from 0.1 to 0.9 while the air velocity for the case of an unsealed air cavity with forced convection is changed from 0.1 m/s to 1.0 m/s with the air flows from the inlet and exits from the outlet of the cavity as depicted in Figure 5. For unsealed air cavities, the inlet air temperature is set to be the same as the ambient outdoor temperature, Ta,air,gap.
The thermal properties for both the concrete layer and insulated panel considered throughout this study are listed Table 1.
The inside air temperature is maintained at 20 °C (293.15 K), and the outdoor air temperature is at 0 °C (273.15 K) to represent winter conditions. (Table 2). The main variables obtained from the CFD based solutions are illustrated in Figure 4 and include (i) air cavity inner and outer surface temperatures Ts,in,gap and Ts,out,gap, (ii) outlet air temperatures from the cavity, Ta,inlet,gap (for free flowing air cases), (iii) heat flux at the interior wall surface, Qs,in, and (iv) net overall heat flow rate for the wall assembly, Qwall.
To calculate the overall R-value of the insulated wall assembly, Rwall, the air temperature difference between the indoors and the outdoors, ∆Tin-out (i.e., 20 K in this study) is divided by the heat flux obtained at the inside wall surface, Qs,in:
R w a l l = T i n o u t Q s , i n
To better assess the impact of the air cavity between the insulated panel and the existing wall assembly, the R-value obtained by Equation (5) is normalized by the R-value of the insulated wall assembly when no air cavity exists, Rwall-no-gap. This normalization allows for a direct comparison of thermal resistance contributed by the air cavity relative to that of the baseline configuration with no air cavity. Thus, the normalized overall R-value, r, is estimated as follows:
r = R w a l l R w a l l n o a i r g a p

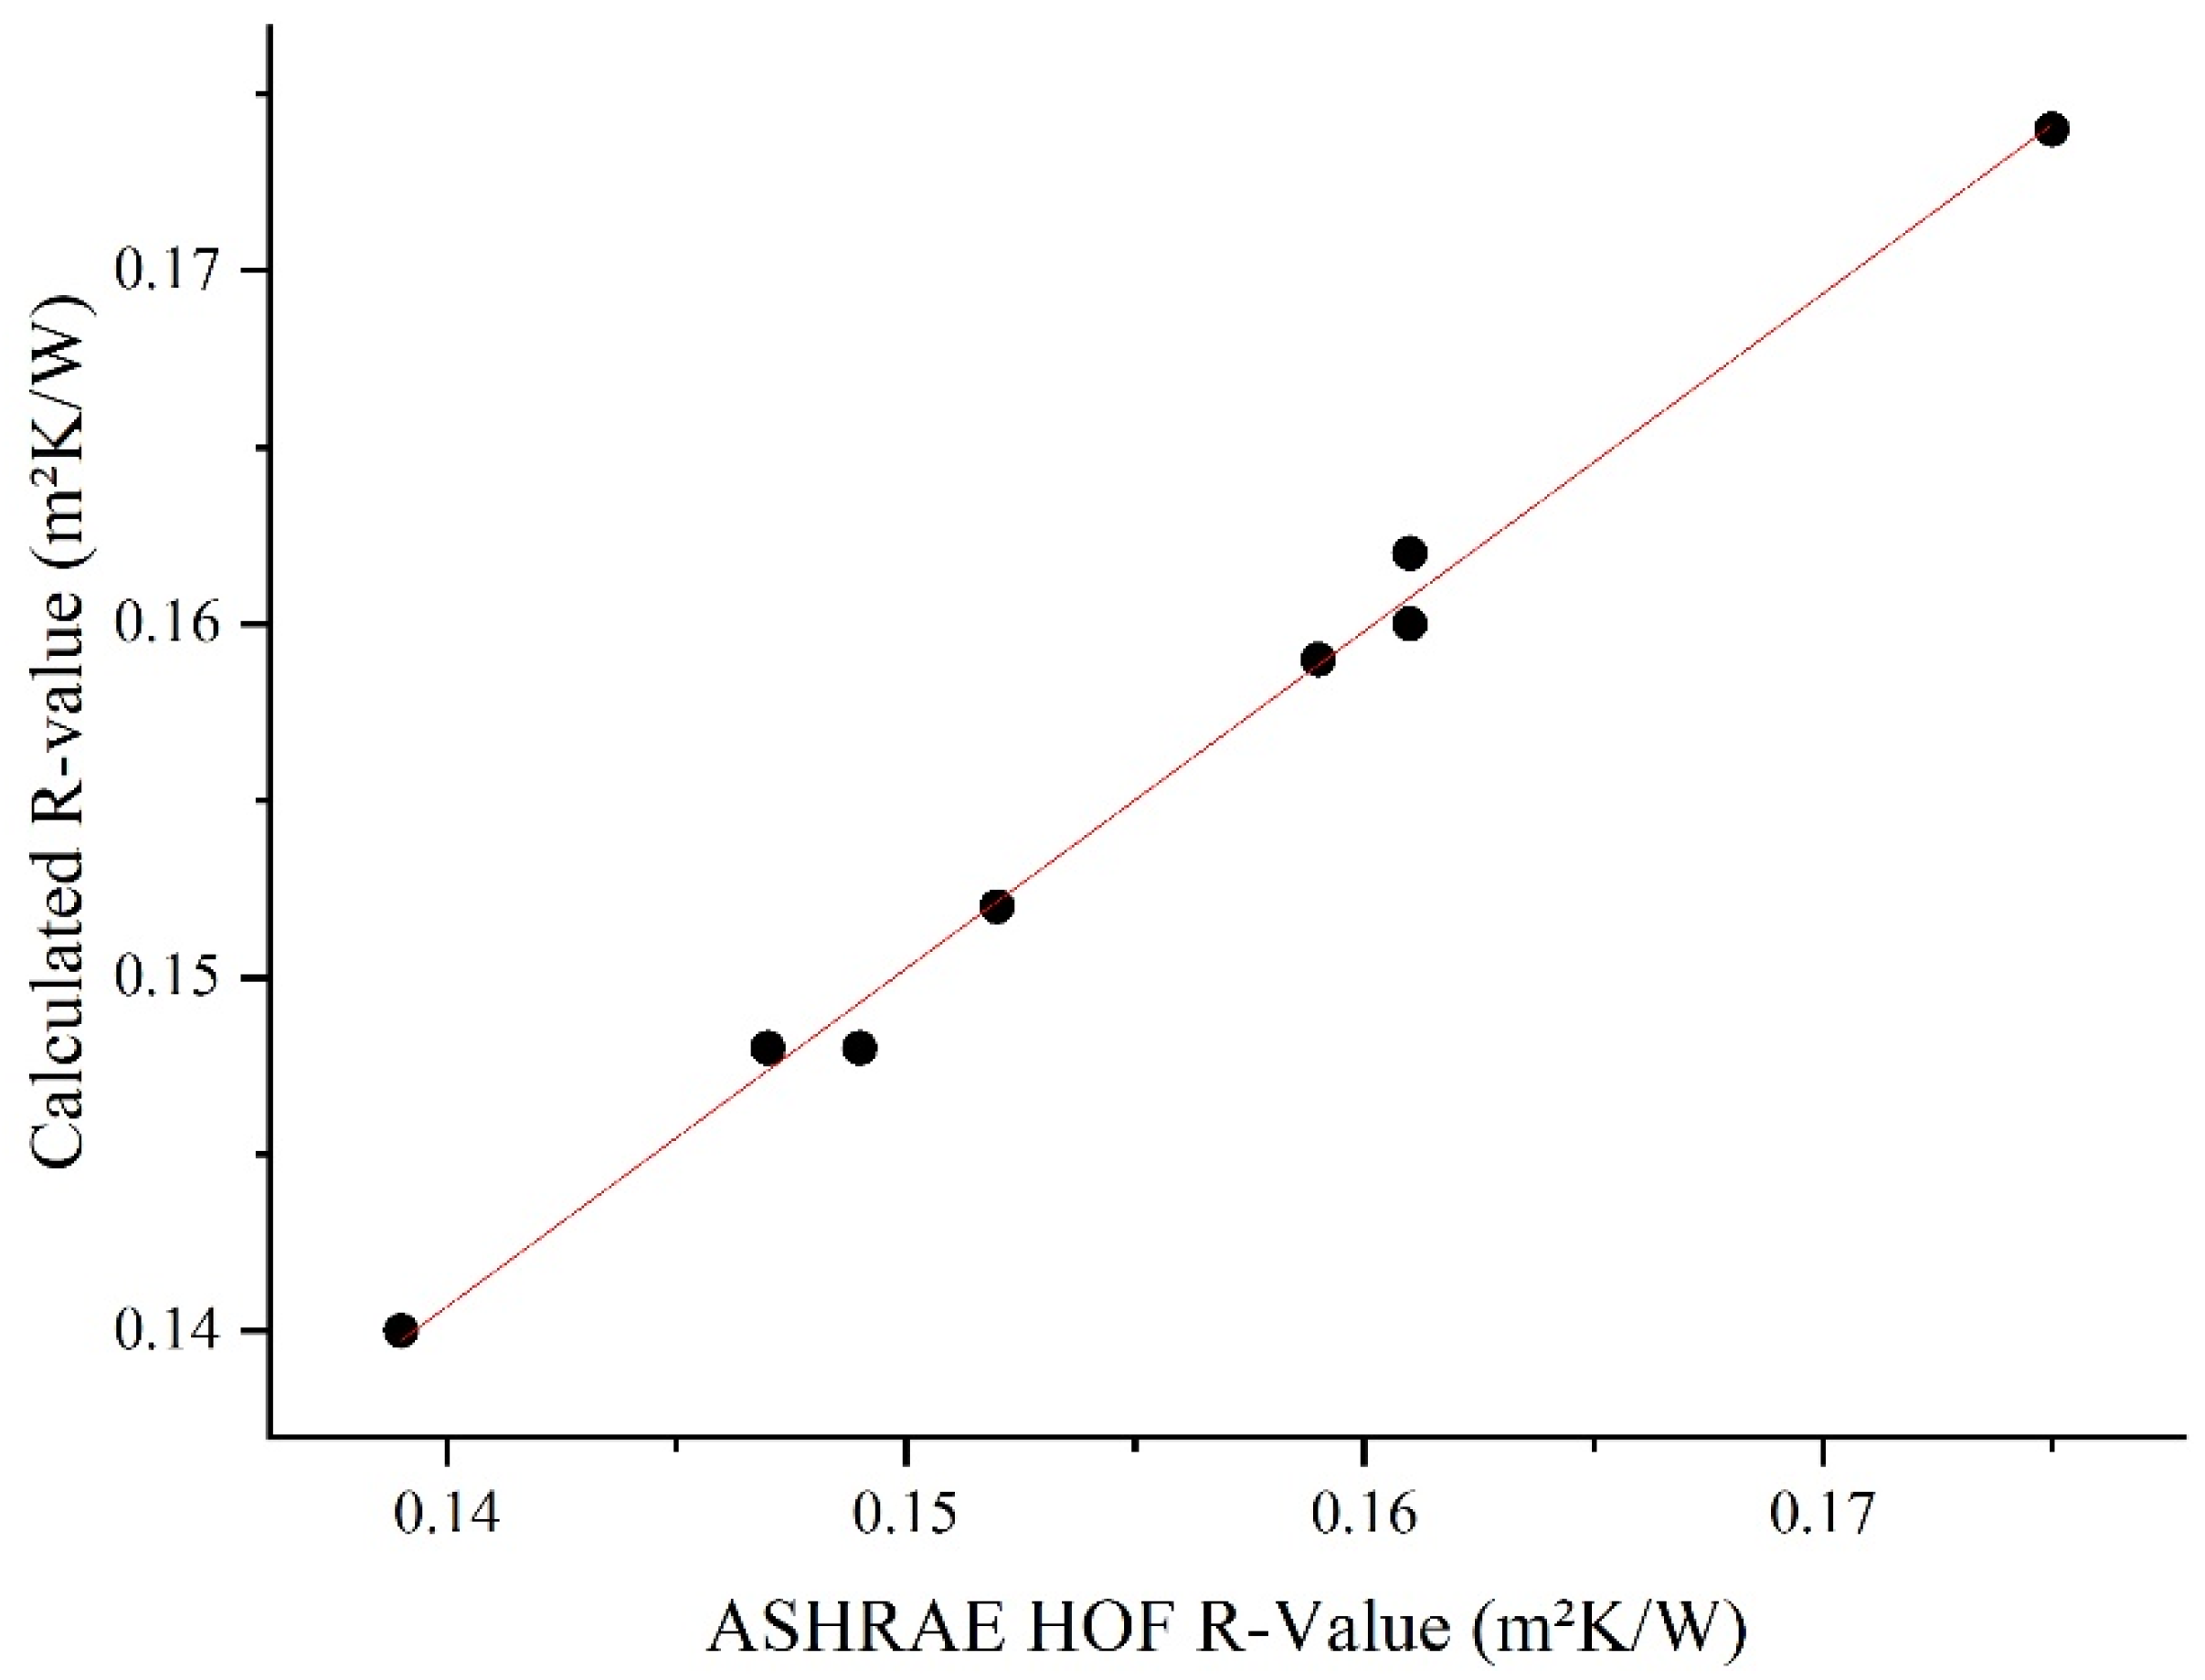
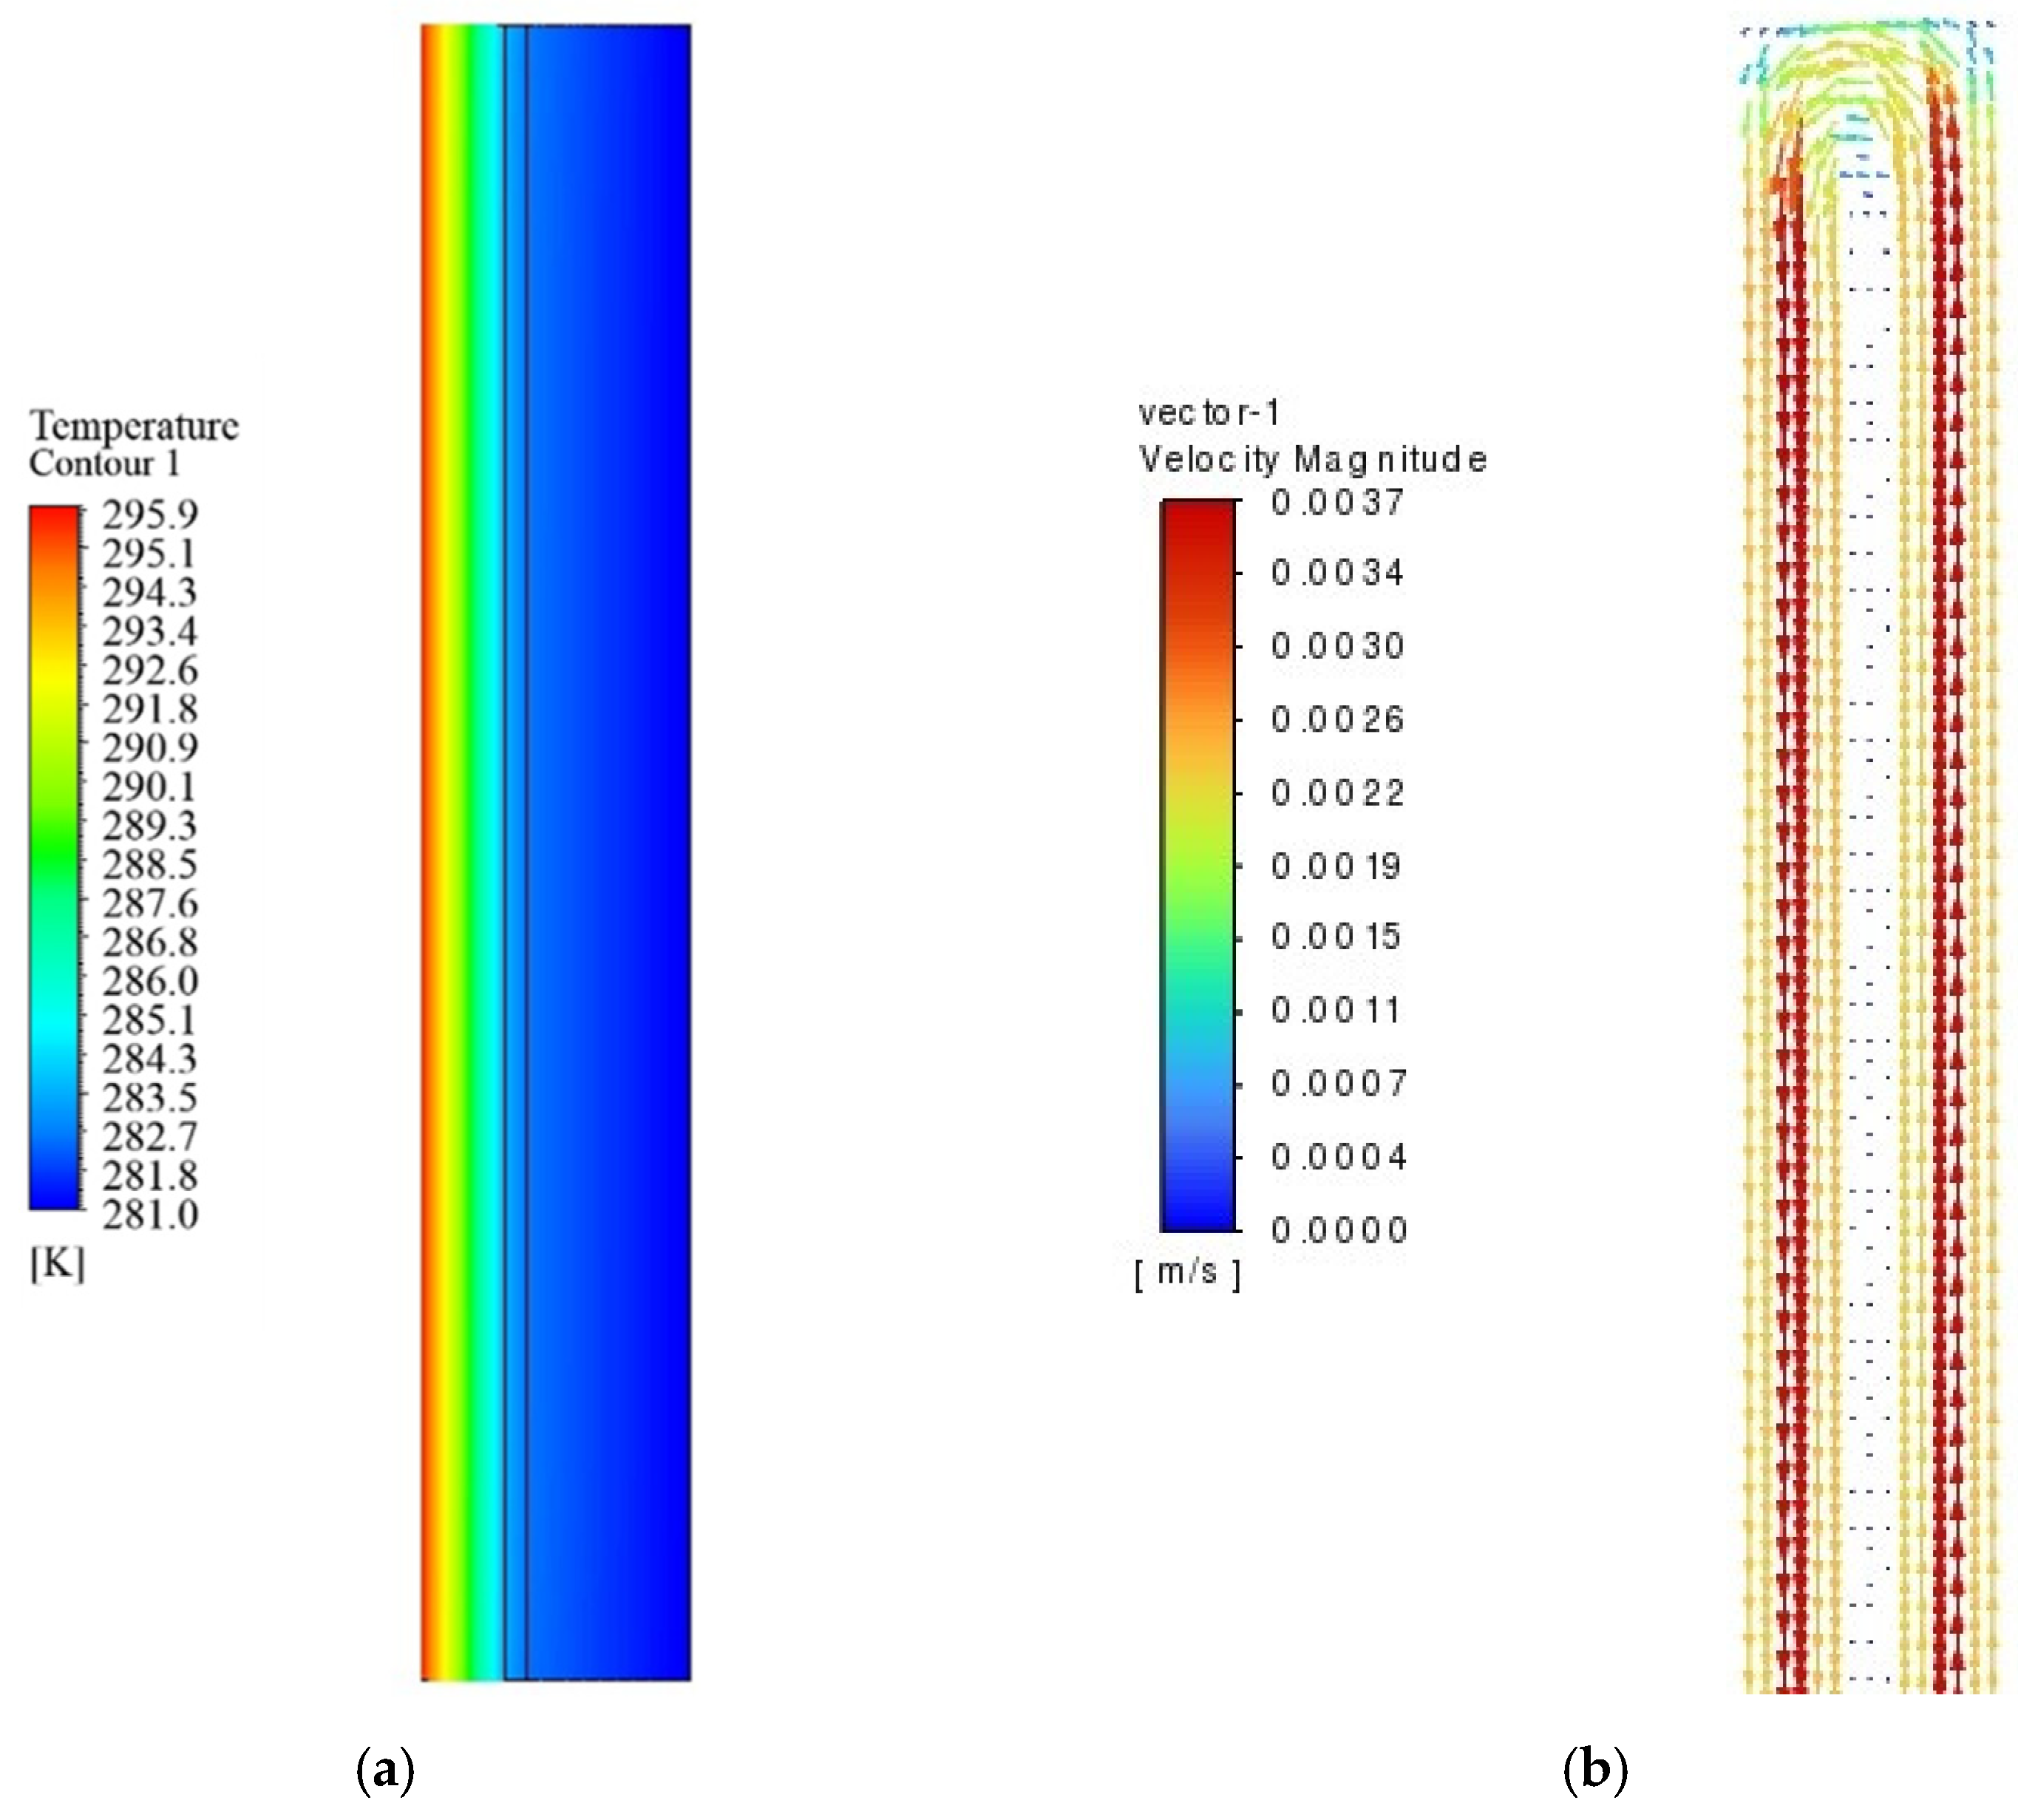
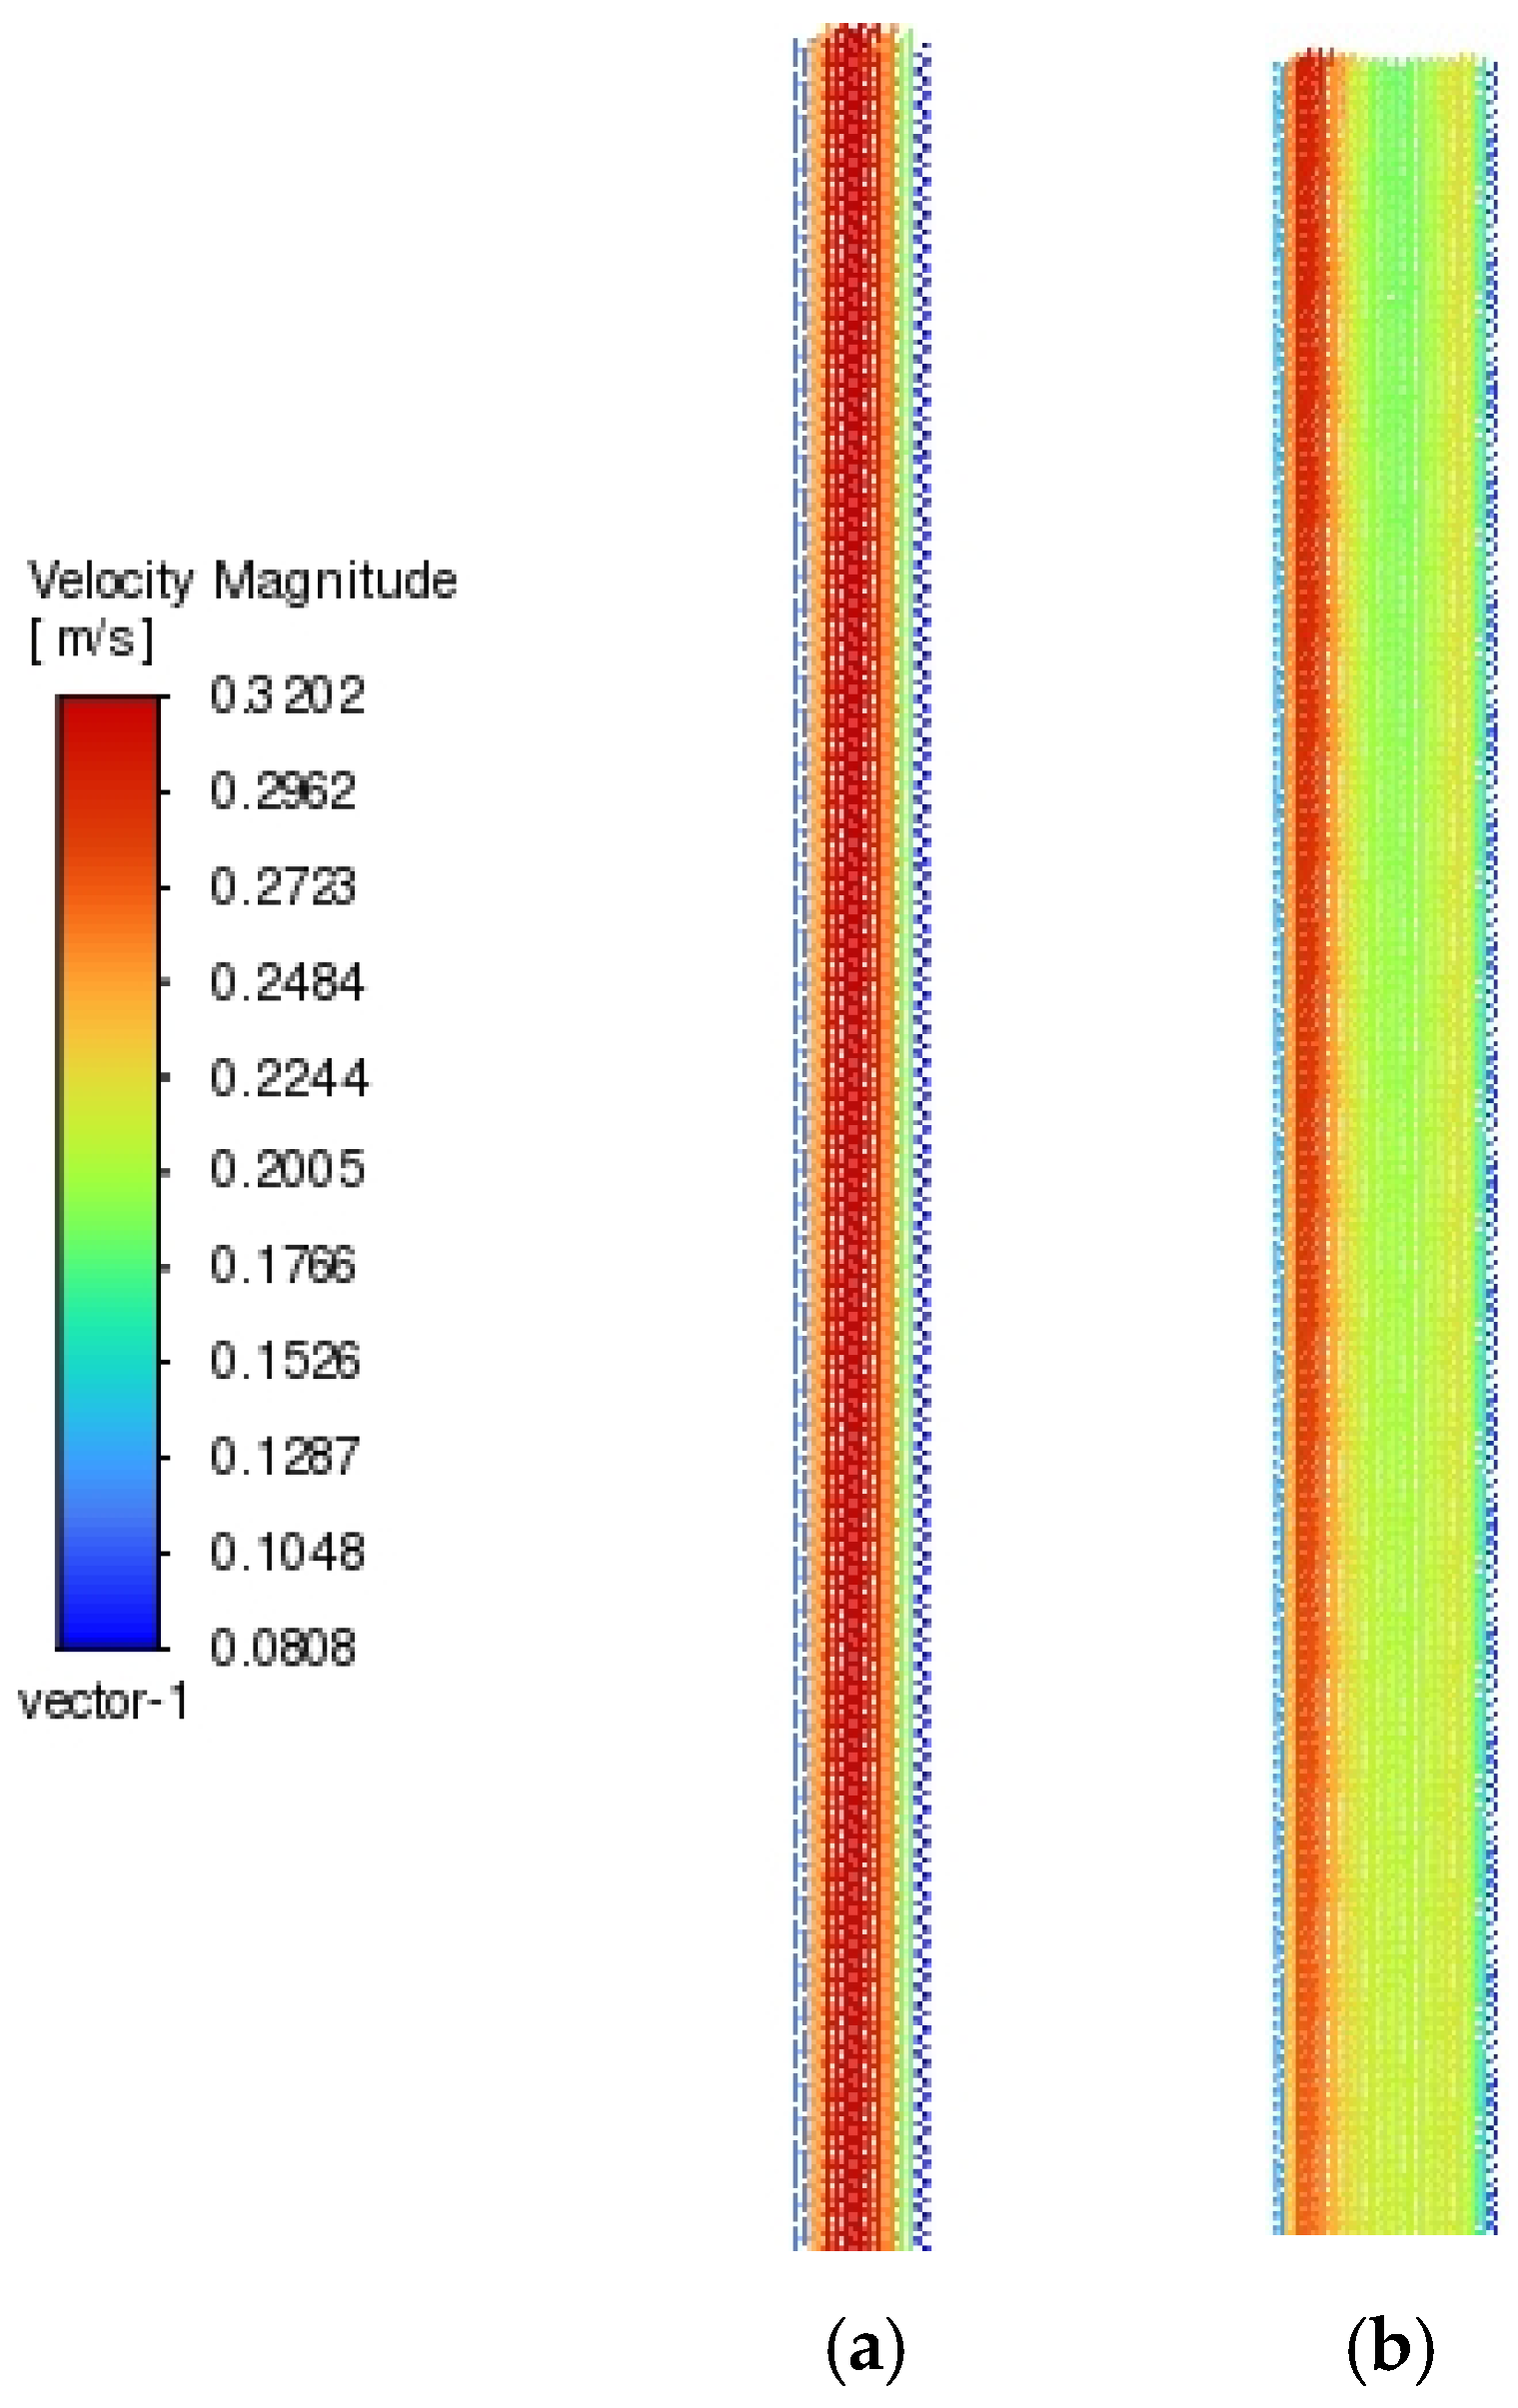
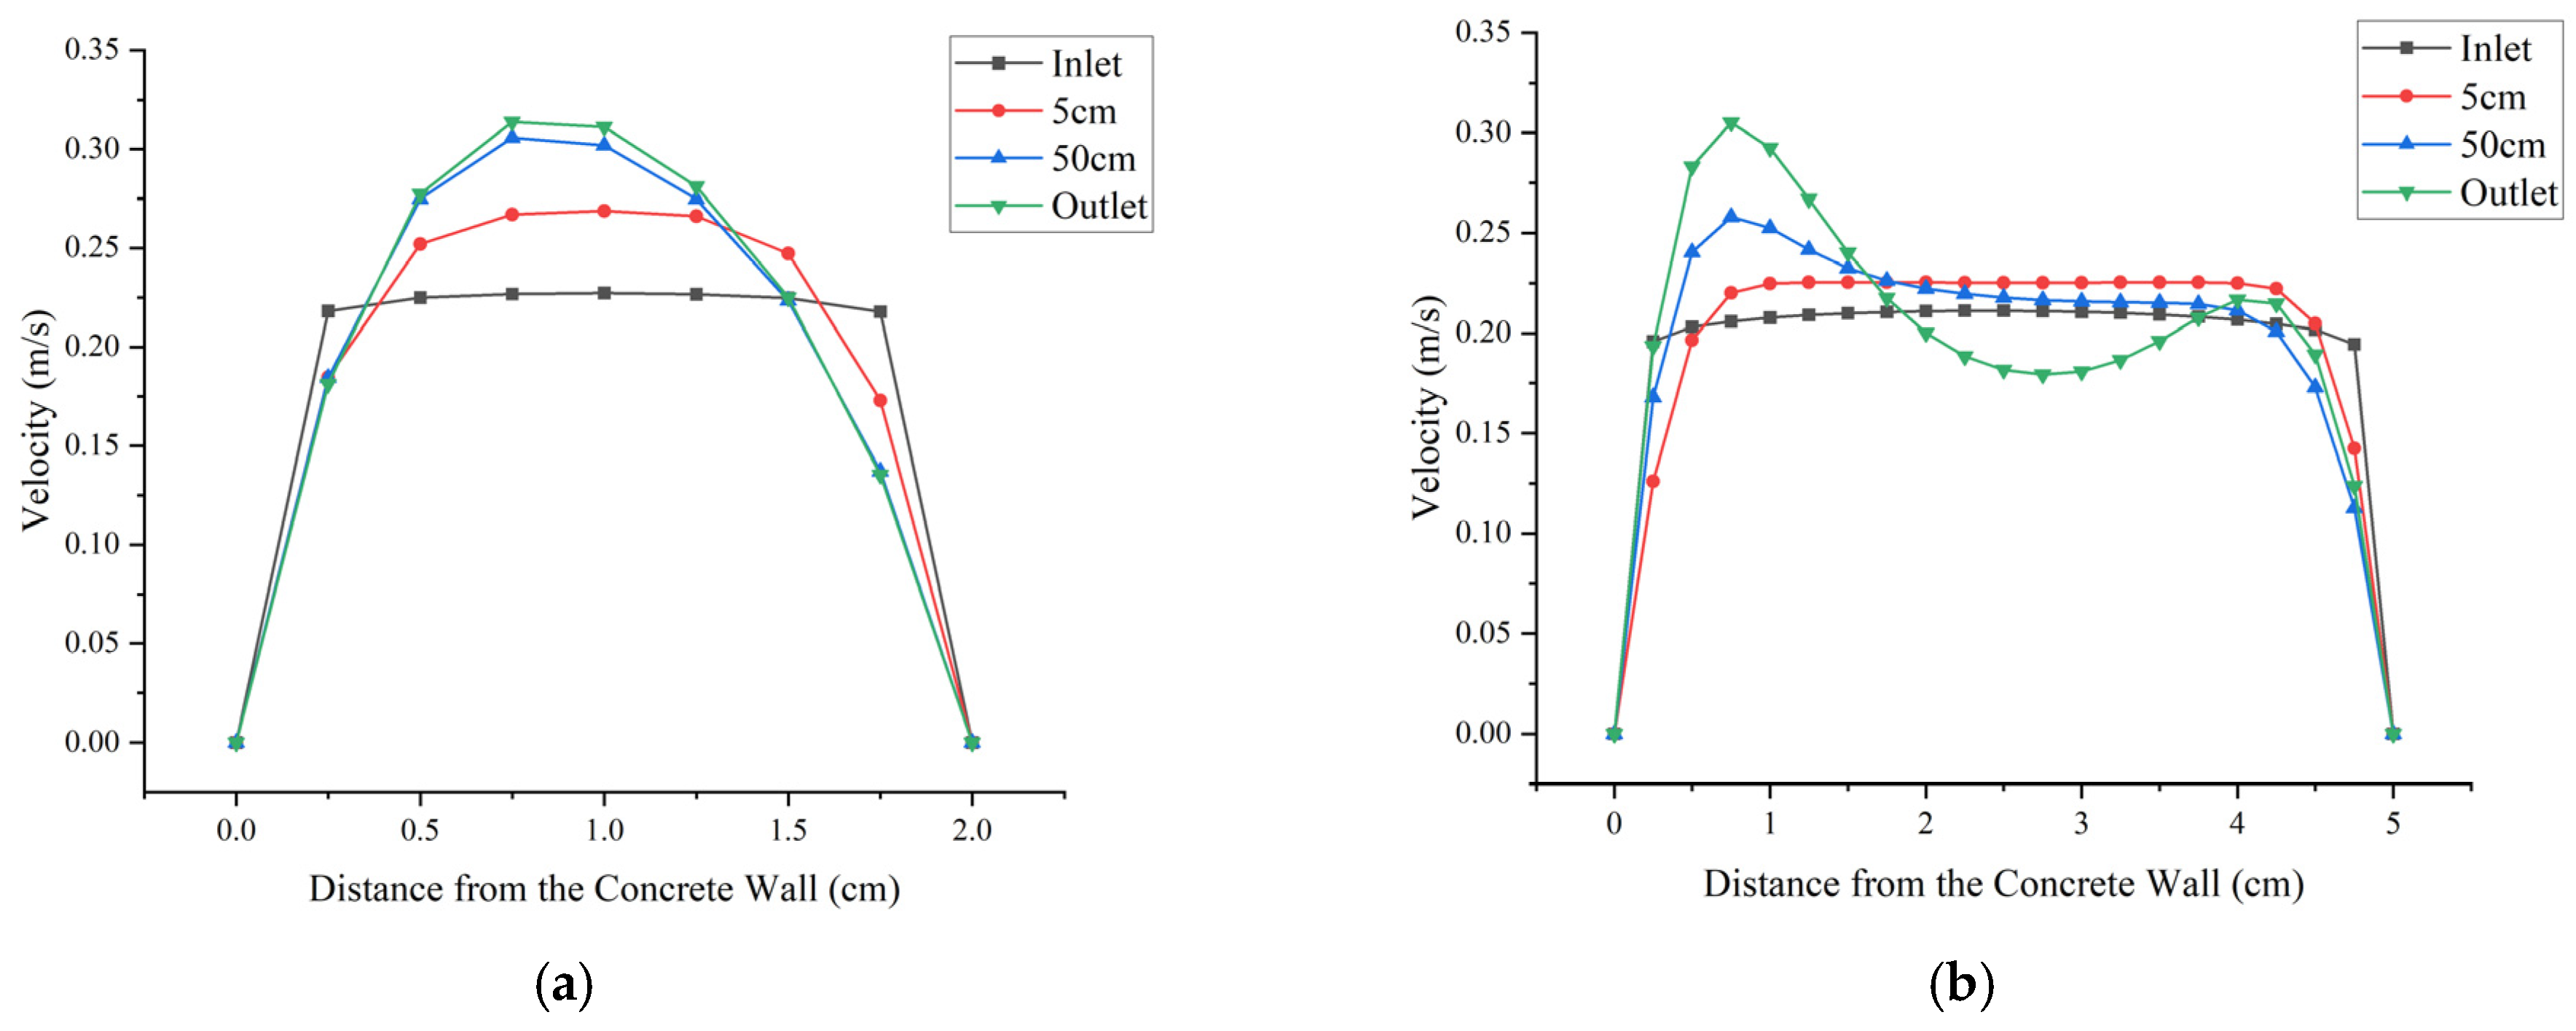
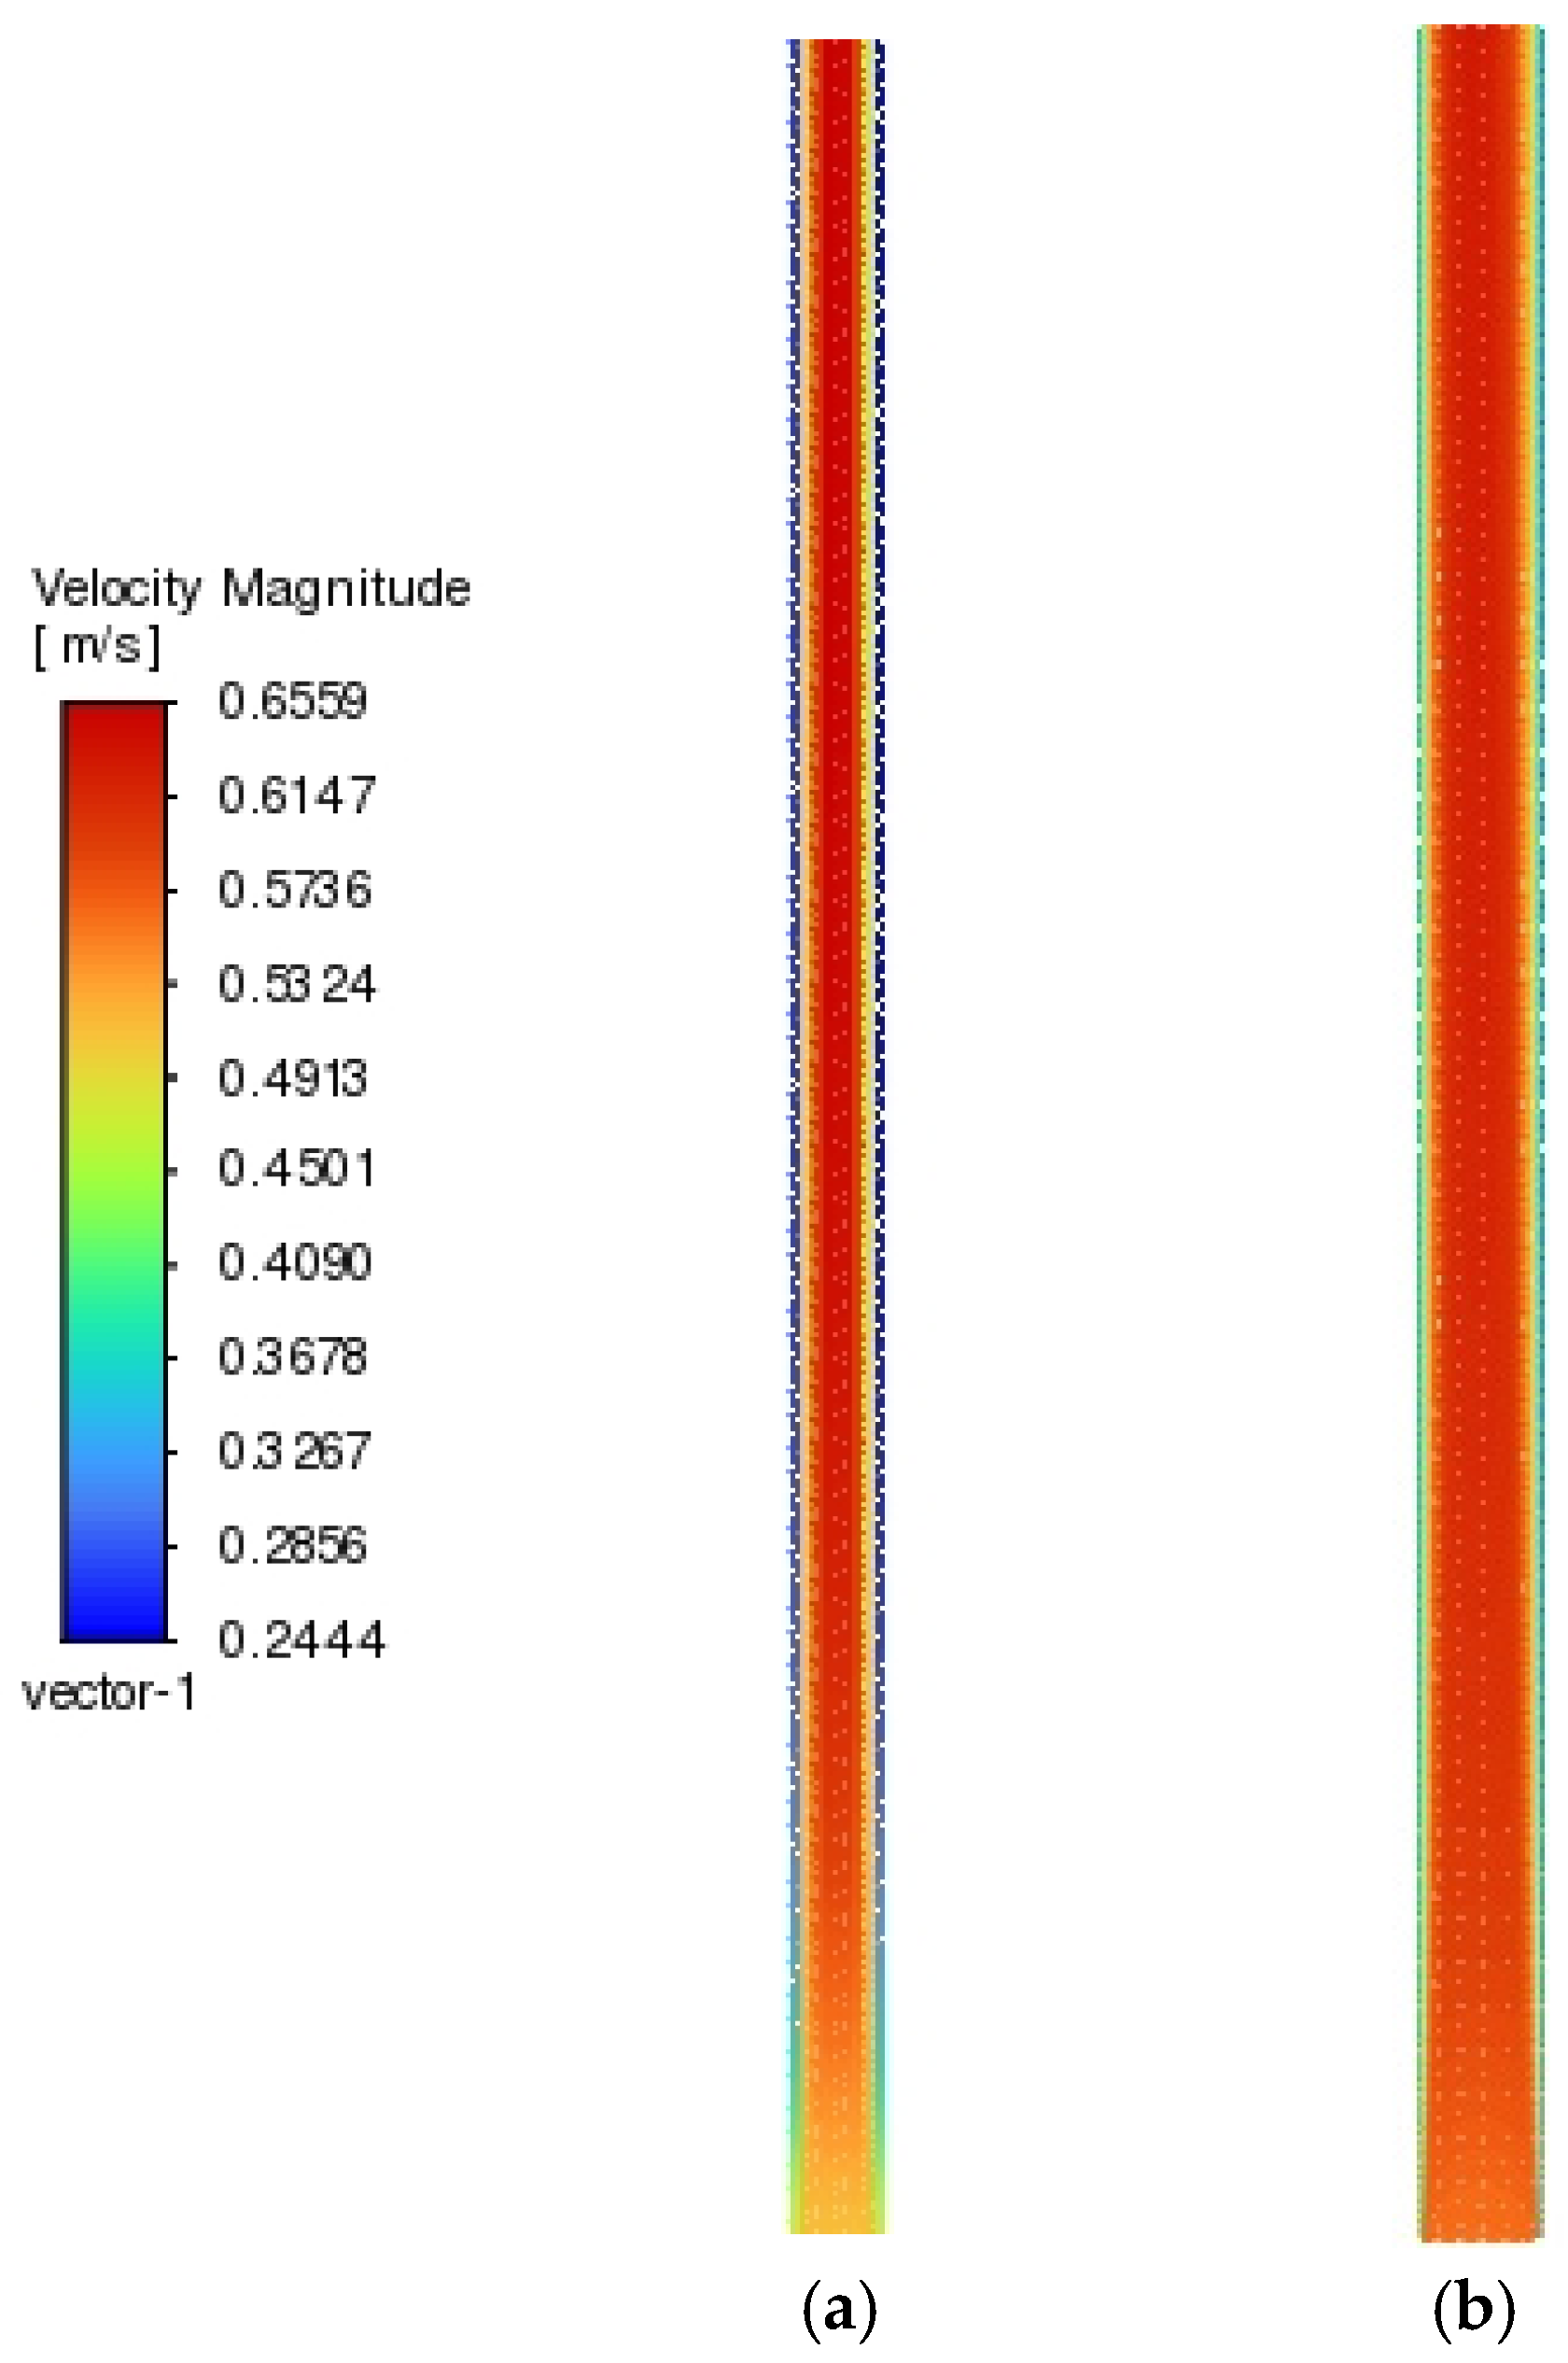
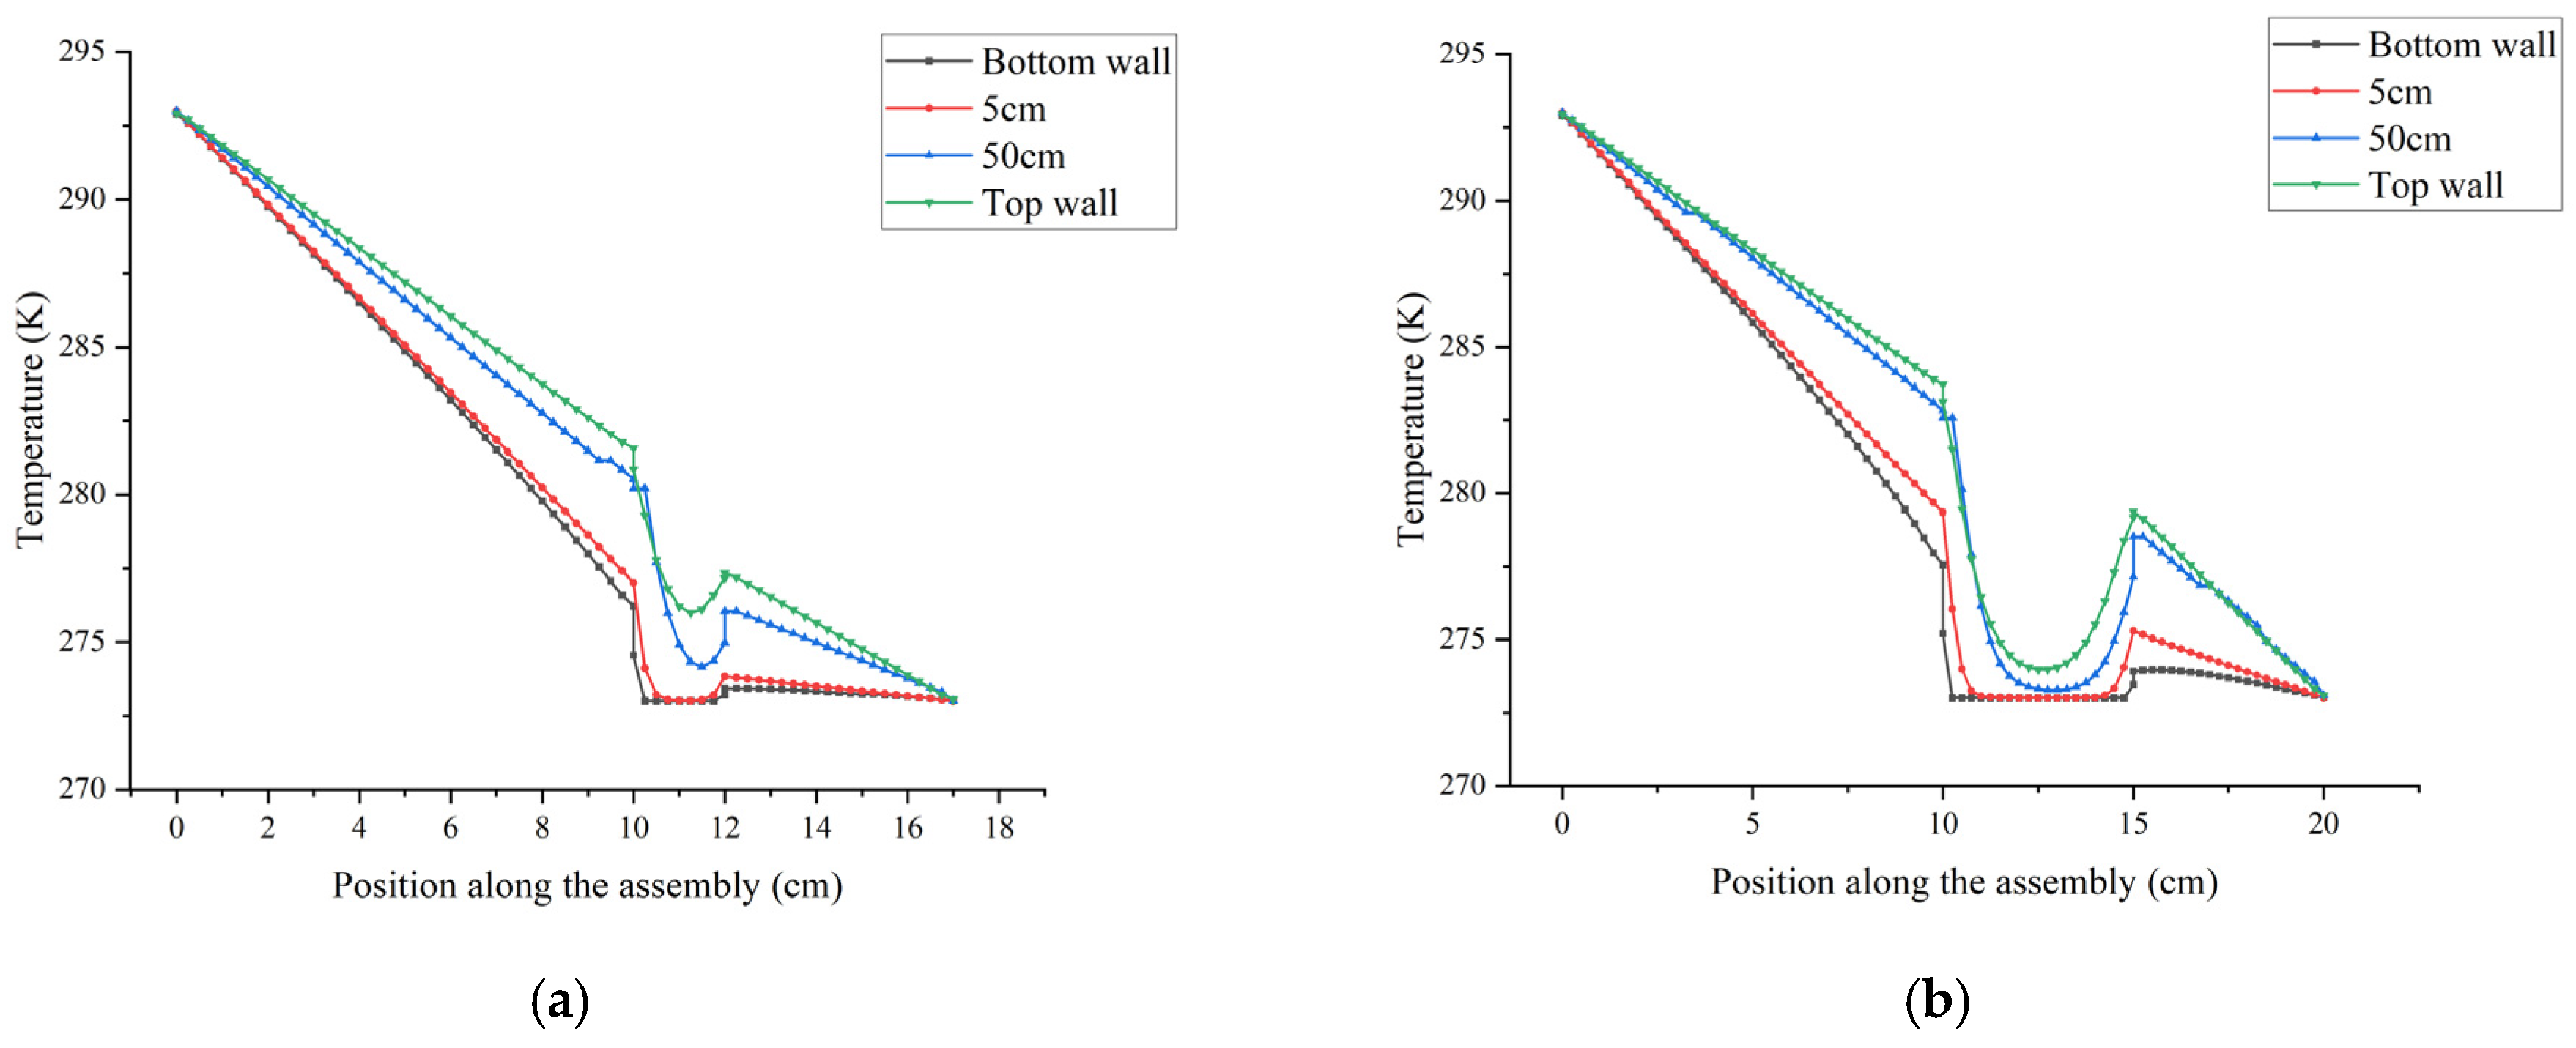
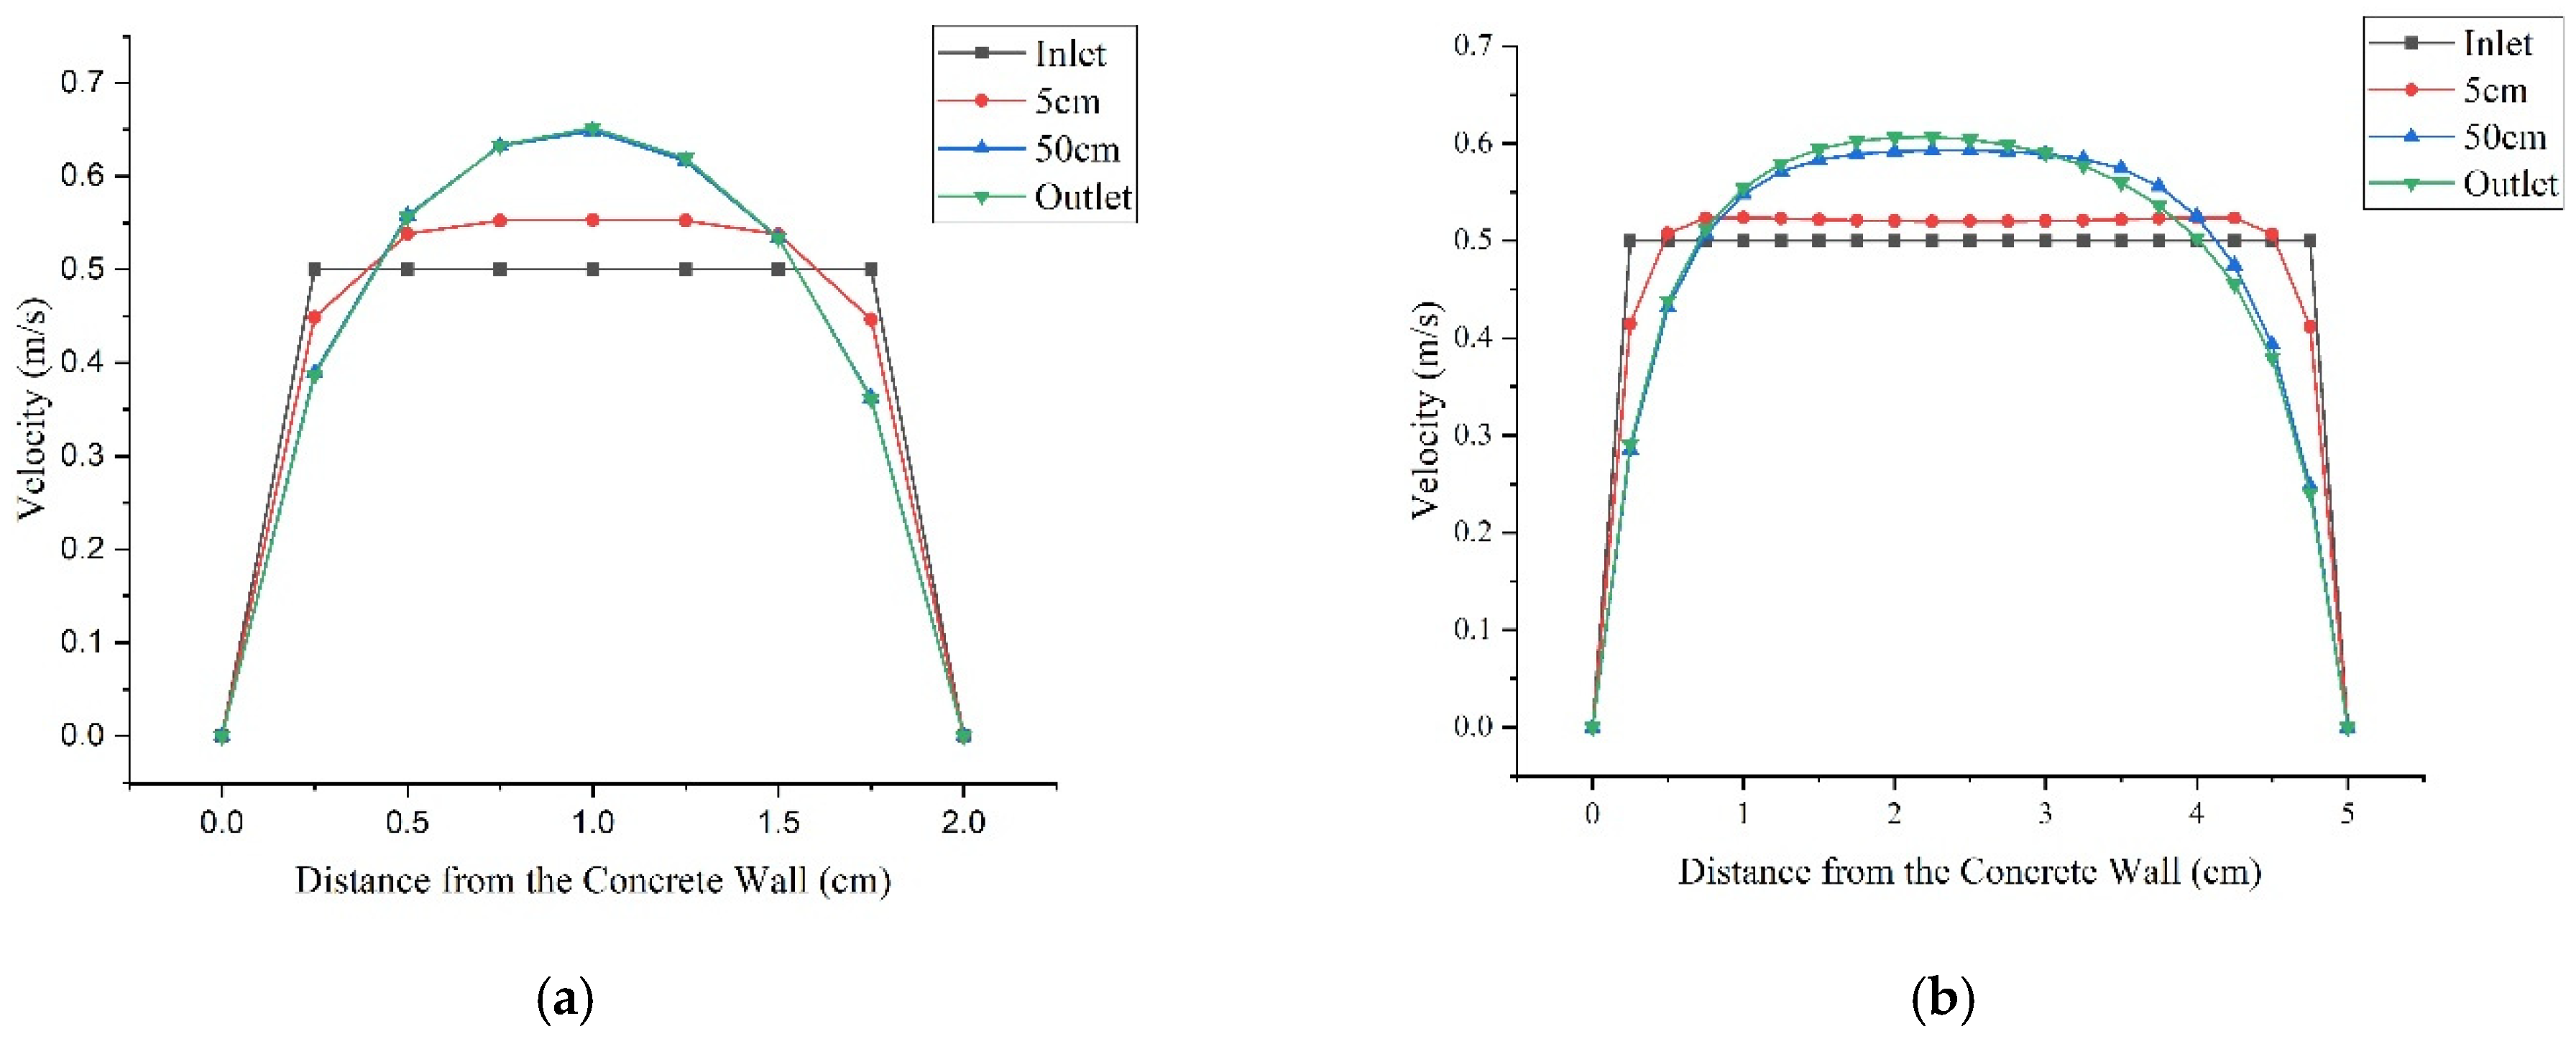
3. Verification Analysis

To verify the accuracy of the modeling approach, the CFD modeling analysis results are compared with those outlined in the ASHRAE HOF for various cavity thicknesses and boundary conditions for the case of sealed air cavities within wall assemblies [18].
Specifically, ASHRAE HOF indicates that the R-value for a sealed air gap with a thickness of 1.3 cm, at a temperature difference of 15 °C, and an average air cavity temperature of 10 °C is 0.16129 m2K/W [18]. Using the CFD modeling approach used in this study based on Equation (1) through Equation (4) with the boundary temperatures at the inside and outside surfaces of the exterior wall assembly set to be 281 K and 296 K, the R-values for both the air cavity and the overall wall assembly are estimated as listed in Table 2 for various mesh configurations having different numbers of nodes. The CFD analysis results are generally very close to the reported ASHRAE HOF value for all the considered mesh configurations, indicating that accurate solutions for assessing thermal interactions within the wall assembly, including the sealed air cavity, can be determined even for coarse mesh configurations.
Table 2. Effect of mesh configurations on the estimations using CFD analysis of the R-values for air cavity and wall assembly.
Number of
Nodes
Number of
Elements
Air Gap Temp
(K)
Heat Flux
(W/m2)
Rwall
(m2K/W)
Rairgap
(m2K/W)
Computation
Time
(s)
Error %
238198283.066.2172.4130.16311.5900.865
17171600283.066.2172.4130.16315.6520.859
68346600283.066.2182.4120.16221.7990.658
13,55613,247283.066.2182.4120.16222.5980.562
17,98917,633283.066.21852.4120.16231.6150.535
25,67525,268283.066.21862.4120.16233.5790.503
To further verify the prediction accuracy of the CFD analysis approach considered in this study, multiple air cavity configurations for the wall assembly of Figure 4 are considered using the same specifications outlined in the ASHRAE Handbook [18]. Specifically, Table 3 compares the CFD model predictions to the reported ASHRAE R-values for sealed air spaces under different thicknesses, air temperatures, and emissivity values.
The results outlined in Table 3 indicate that the differences between the CFD model predictions and ASHRAE data are less than 1% for all the cases, and the Root Mean Square Error (RMSE) value obtained is 0.00096. The CFD model predictions are better visualized in Figure 6, which confirms that the CFD-based solutions match well with the reported ASHRAE values.
Figure 7 presents both the temperature and air velocity obtained by the CFD-based solution for a wall assembly (Figure 4) with a 1.3 cm sealed air cavity. The inner and outer surfaces for the wall assembly are set from 281 K to 296 K, respectively. As outlined in Figure 7a, there is a gradual change in temperature from the outer to the inner surfaces. The consistent temperature gradient indicates that heat is transferring from the warmer indoors to the cooler outdoors through the insulation panel to the concrete layer, passing through the air space, which is acting as an added insulating layer. Moreover, the air velocity within the air cavity shown by Figure 7b highlights the mechanism of heat transfer driven by natural convection airflow loop due to the temperature differences, where warmer air near the insulation panel rises while cooler air near the concrete surfaces flows downwards. This convection loop helps distribute heat within the air cavity. The overall minimal temperature gradient at the sealed air cavity is translated into a reduced heat transfer through the wall assembly.

4. Sensitivity Analysis

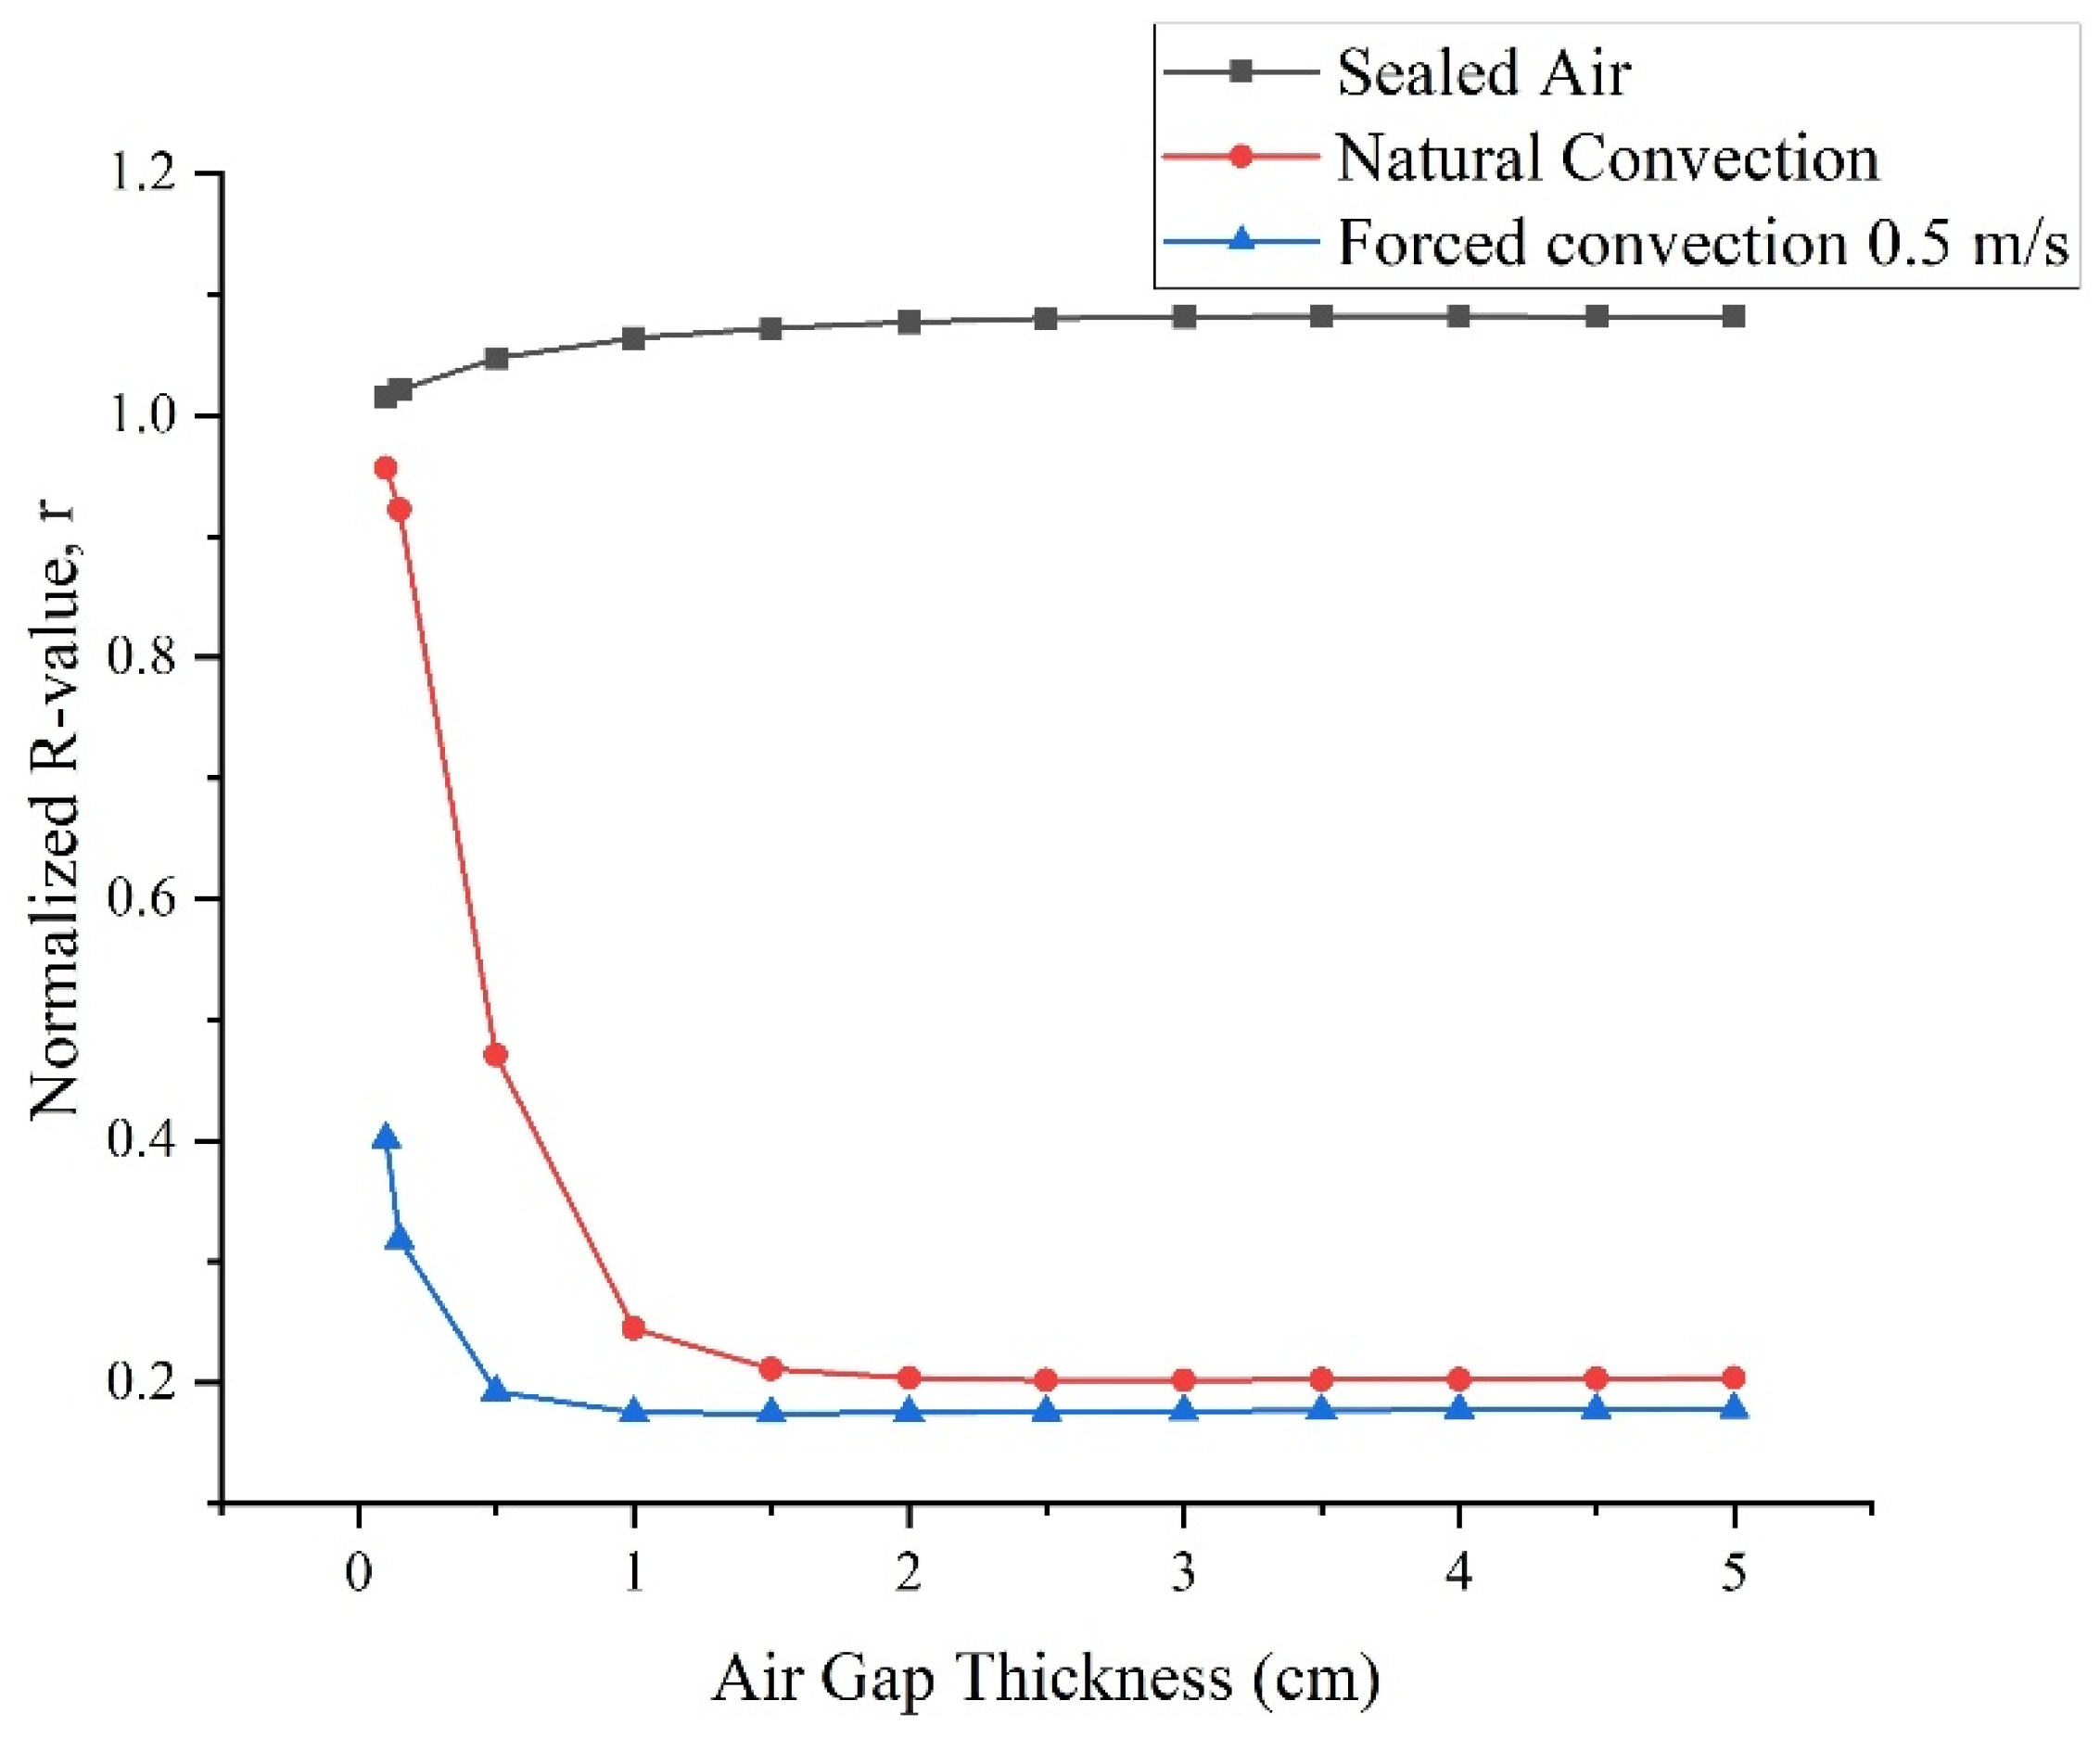
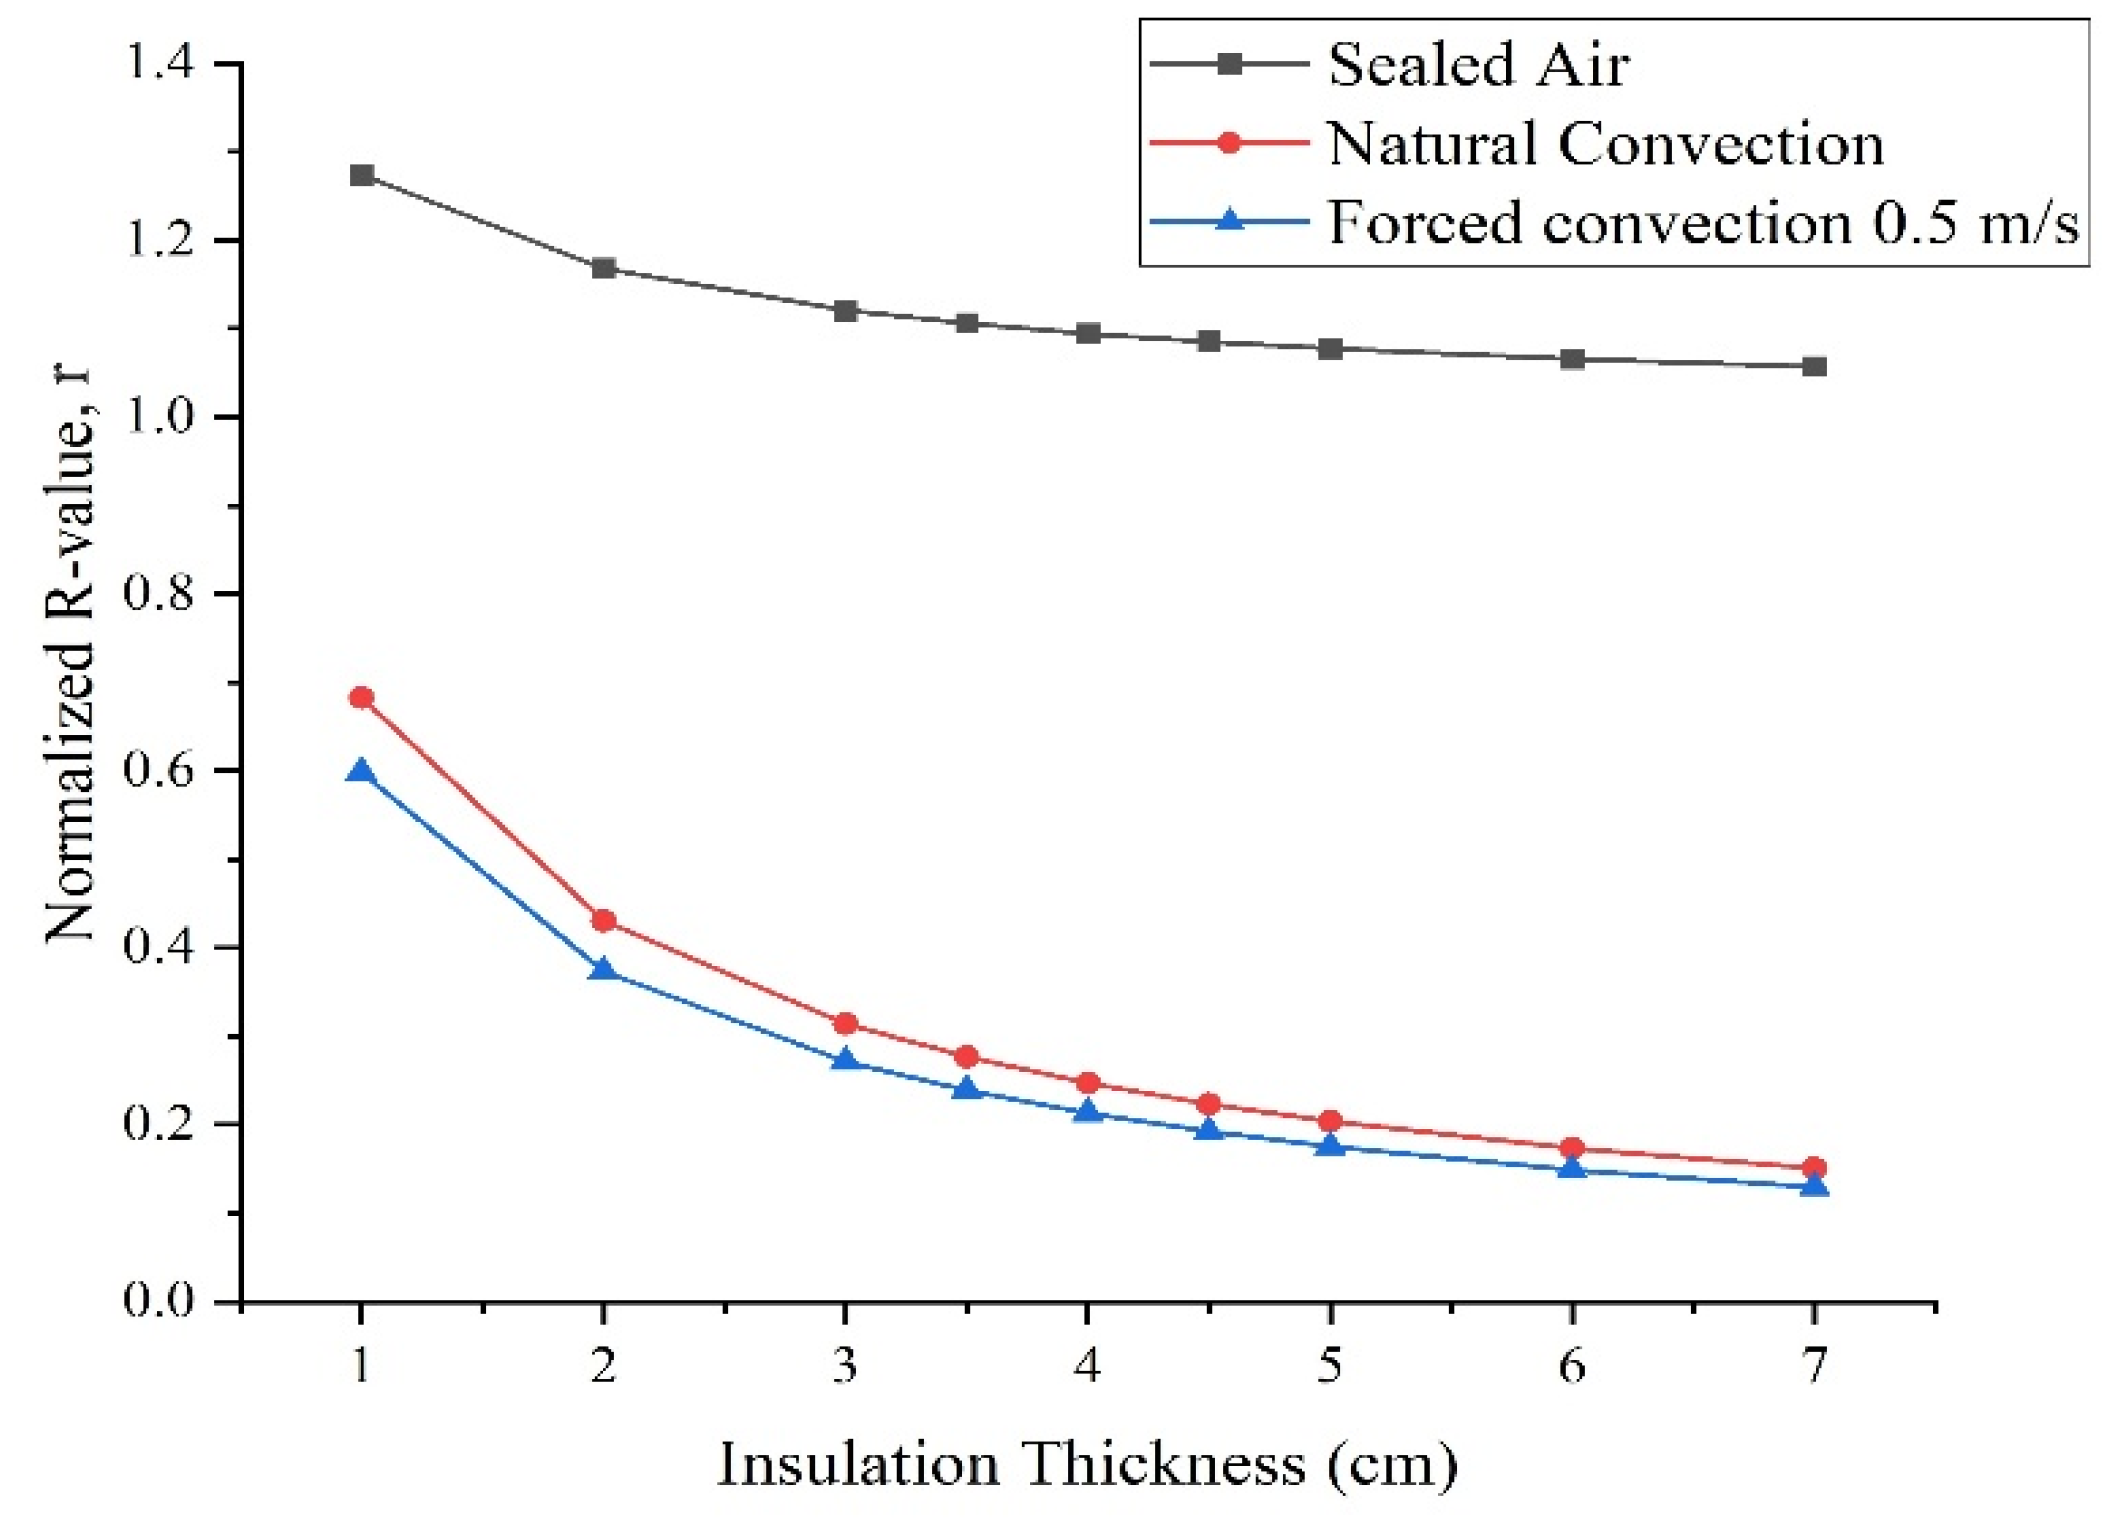
4.1. Impact of Air Cavity Thickness

This section evaluates the impact of air cavity thickness on the overall R-value of the wall assembly under various airflow conditions. Specifically, Figure 8 shows the variation in the normalized R-value of the retrofitted exterior wall assembly with the air gap thickness for three airflow conditions, including sealed and unsealed air cavities with natural or forced convection when the insulated panel is placed outside of the existing exterior wall. The analysis of Figure 8 is carried out when the emissivity of the cavity surfaces is set to be 0.9 while the thickness of the insulated panel is fixed to 5 cm. For the case of forced convection, the air velocity is set to 0.5 m/s to represent typical airflow rates experienced by the exterior wall surface during windy conditions.
In the case of a sealed air cavity, the normalized R-value of the retrofitted wall assembly increases with the air cavity thickness. This increase is especially pronounced for small air cavity thicknesses. As the air cavity thickness increases, the normalized R-value approaches an asymptotic value of 1.09, indicating that beyond a certain threshold, further increases in air cavity thickness do not significantly enhance the R-value of the assembly.
In the case of an unsealed air cavity with an air inlet temperature of 273 K, the normalized R-value decreases sharply with increasing air cavity thickness from 0 to 1 cm and then stabilizes at a low value after 1 cm thickness. This trend indicates that a thicker air cavity may facilitate higher heat transfer from the wall to the colder external environment, severely diminishing the thermal effectiveness of the added insulated panel. This result is due to the fact that when the air cavity thickness increases, convective heat transfer within the cavity becomes more influential, lowering the overall thermal resistance of the assembly. Similar results are obtained for the case of forced convection with an air velocity of 0.5 m/s, since the normalized R-value of the wall assembly decreases even more sharply as the cavity thickness increases. The forced airflow of relatively cold air (i.e., 273 K) uniformly across the air cavity reduces the overall thermal resistance of the wall assembly as air flowing through the cavity bypasses the insulated panel, substantially reducing its thermal impacts.
From Figure 8, natural convection consistently maintains a higher R-value than forced convection, indicating better thermal performance for the wall assembly with an unsealed air cavity. This result is expected as the air moves more slowly within the cavity for natural as opposed to forced convection, allowing the air cavity to resist any heat transfer better. In contrast, forced convection imposes consistent airflow through the cavity, which increases the amount of heat carried away from the cavity surfaces. This process reduces the insulating effect of the air cavity, thereby enhancing heat transfer and diminishing the overall thermal resistance of the insulated wall assembly. Moreover, forced convection shows a more significant initial decline in R-value of the wall assembly, suggesting greater sensitivity to changes in air cavity thickness. For both convection types, the R-value of the wall assembly stabilizes when the air cavity thickness is more than 1 cm.

Heat Transfer Analysis

The impacts of the air cavity thickness on distributions of temperature with wall assembly and air velocity within the cavity are evaluated for various boundary conditions and cavity thicknesses as noted in Figure 9, Figure 10, Figure 11 and Figure 12. The specific unsealed air cavity, coupled with natural convection air flow, is considered.
For the case of a 2 cm air gap thickness (Figure 9a), the temperature distribution shows a more pronounced gradient from cooler to warmer regions, indicating significant temperature variation across the wall. In contrast, the case of a 5 cm air cavity (Figure 9b) provides a more uniform temperature distribution across the air cavity with a reduced gradient, indicating better thermal insulating effects for the air layer. The case of a 2 cm air cavity exhibits a distinct temperature gradient, which is less pronounced for the case of a 5 cm air cavity. The temperatures at the surfaces of the air cavity are higher than those within the air cavity itself due to the radiative heat transfer occurring between these surfaces.
Figure 10 presents velocity profiles within the unsealed air cavity with a thickness of 2 cm (Figure 10a) and 5 cm (Figure 10b). The maximum velocity for the case of a 2 cm air cavity reaches 0.32 m/s, while for the 5 cm air cavity configuration, it is slightly lower at 0.30 m/s. The minimal difference in air velocity between the two air cavity thicknesses is primarily due to the relatively small increase in air temperature within the cavity subject to natural convection. Since the temperature within the air cavity does not rise significantly, the driving force for natural convection remains similar in both cases, leading to only a slight variation in the magnitude of air velocities. For the case of the 2 cm air gap (Figure 10a), the velocity profile shows a high velocity region near the center of the cavity, with air velocities rapidly decreasing towards the surfaces. In contrast, the case of the 5 cm air cavity (Figure 10b) exhibits a broader region of high velocities, particularly near the warmer concrete wall. The higher velocity near the warmer wall decreases the density of the air, causing it to rise faster and resulting in the profile depicted in Figure 10b.
Figure 11 illustrates more clearly temperature profiles along cross-sections of all the layers of the insulated wall assembly at different heights in the case of an unsealed air cavity subject to natural convection. The temperature profiles for two thicknesses of the air cavity are shown in Figure 11, including 2 cm (Figure 11a) and 5 cm (Figure 11b). As depicted in Figure 11, the presence of the air cavity disturbs the linear temperature variation across the wall sections due to colder air flowing from the bottom to the top of the cavity. For the case of a 2 cm air cavity, the air temperature increases substantially from 273 K at the bottom section to an average of 283 K at the top section. However, for the case of 5 cm, the average air temperature at the top outlet of the air cavity is merely 277 K. This difference in outlet air temperature is associated primarily with the difference in the volume of air flowing through the air cavity. Higher air volume for the case of a 5 cm thick cavity results in a lower increase in air temperature compared with the case of a 2 cm thick cavity with lower flowing air volume. A higher flowing volume results in reduced thermal interactions between the air and the cavity surfaces. Moreover, the difference in air temperatures within the air cavity leads to differences, albeit slight, in the temperatures in both concrete and insulation layers. Indeed, cooler air temperatures for the case of a 5 cm thick cavity slightly increase convective heat transfer and lower the temperatures of adjoining surfaces and subsequently the temperatures across the solid layers of the wall assembly. The overall effect of a higher thickness of unsealed air cavity subject to natural convection is a lower total thermal resistance of the insulated wall assembly, as indicated by the results shown in Figure 7.
Figure 12 shows the air velocity profiles along horizontal cross-sections the cavity within the retrofitted wall assembly for two cavity thicknesses (a) 2 m and (b) 5 cm. The x-axis shows the distance from the concrete wall’s outer surface, while the y-axis displays the magnitude of the air velocity. The different curves represent the air velocity profiles estimated at various heights of the wall and the air cavity, including the inlet (i.e., bottom of the wall), 5 cm, 50 cm (i.e., middle section of the wall), and the outlet (i.e., top of the wall). For the case of a 2 cm air cavity (Figure 12a), the air velocity reaches a maximum value of 0.32 m/s around x = 1 cm. Closer to the cavity surfaces (i.e., x = 0 cm and x = 2 cm), the air velocity decreases significantly. Indeed, the air velocity at the cavity surfaces reaches 0 m/s in accordance with the no-slip conditions assumed in the CFD modeling analysis. This pattern is consistent across different wall heights with similar parabolic profiles for air velocity within the cavity, with the highest air velocity occurring around the middle of the air cavity.
For the case of the air cavity with a thickness of 5 cm (Figure 12b), the maximum velocity is slightly over 0.3 m/s, with the most significant changes occurring near the cavity surfaces and at the top outlet for the air stream. The profile indicates that the air velocity is more evenly distributed across the wider 5 cm air cavity compared with the narrower air cavity of 2 cm, with a less pronounced reduction in air velocity toward the center of the cavity. As the distance from the inlet increases, the air velocity reaches its value near the warmer concrete outer surface. The air velocity drops noticeably in the middle of the cavity before it increases again close to the insulated panel. This change in air velocity cross-section profile occurs close to the air cavity outlet for the case of 5 cm cavity thickness due to the thermal interactions between the existing wall outer surface and the flowing air. As air near the warmer existing wall heats up, it becomes less dense and rises, creating a buoyancy-driven flow that increases the air velocity near the existing wall outer surface. However, for air located further from the warm wall surface (i.e., towards the center of the cavity), the influence of the thermal gradient diminishes, leading to a noticeable drop in air velocity around the middle of the cavity. For air located close to the cooler insulated panel surface, its velocity increases again, but not as significantly as that experienced by air near the warmer existing wall surface, due to lower thermal gradients driving the flow. Consequently, air velocity follows the pattern indicated in Figure 12b for profiles specific to the middle section and top of the wall, peaking near the warm wall surface, dropping in the middle of the air cavity, and rising again near the cooler surface of the insulated panel.
Similar results are found for the case of unsealed air cavity configuration with forced convection, as shown in Figure 13, depicting the temperature distributions within the wall assembly, and Figure 14, illustrating the air velocity profiles within the air cavity. When air is forced inside the air cavity, more uniform temperatures are prevalent across the wall sections when compared with those observed for the case of natural convection, as depicted in Figure 15. The uniform air flow removes heat by convection transfer from the air cavity to reject it outdoors when air moves upwards. However, the amount of removed heat is reduced with the increase in air velocity along the cavity. Consequently, the air temperatures at the unsealed cavity outlet are lower for forced convection compared with those for natural convection, regardless of the cavity thickness. Indeed, the differences between outlet and inlet air temperatures are only 5 K and 2 K for the forced convection, while they are 10 K and 4 K for the natural convection when the air cavity thickness is 2 cm and 5 cm, respectively.
The air velocity profiles shown in Figure 14 are specific to two cavity thicknesses, (a) 2 cm and (b) 5 cm, for the case of forced convection with 0.5 m/s inlet air velocity. When the cavity thickness is 2 cm, the maximum air velocity reaches 0.66 m/s, slightly higher than the peak air velocity of 0.6 m/s achieved for the case of the 5 cm thick cavity, as indicated in Figure 16. Indeed, the air velocity profiles generally follow parabolic shapes, with the highest velocities occurring at the cavity center, as depicted in Figure 16, for both cavity thicknesses. The difference between the velocities for the two cavity thicknesses is rather minimal, unlike the case of natural convection. This difference indicates that heat removal is mainly achieved by forced airflow through the air cavity, especially for the case of the 2 cm air thick cavity exhibiting higher velocities than the narrower cavity channel. However, even with the wider cavity, the forced airflow ensures a consistent heat removal from the cavity and thus the wall assembly.

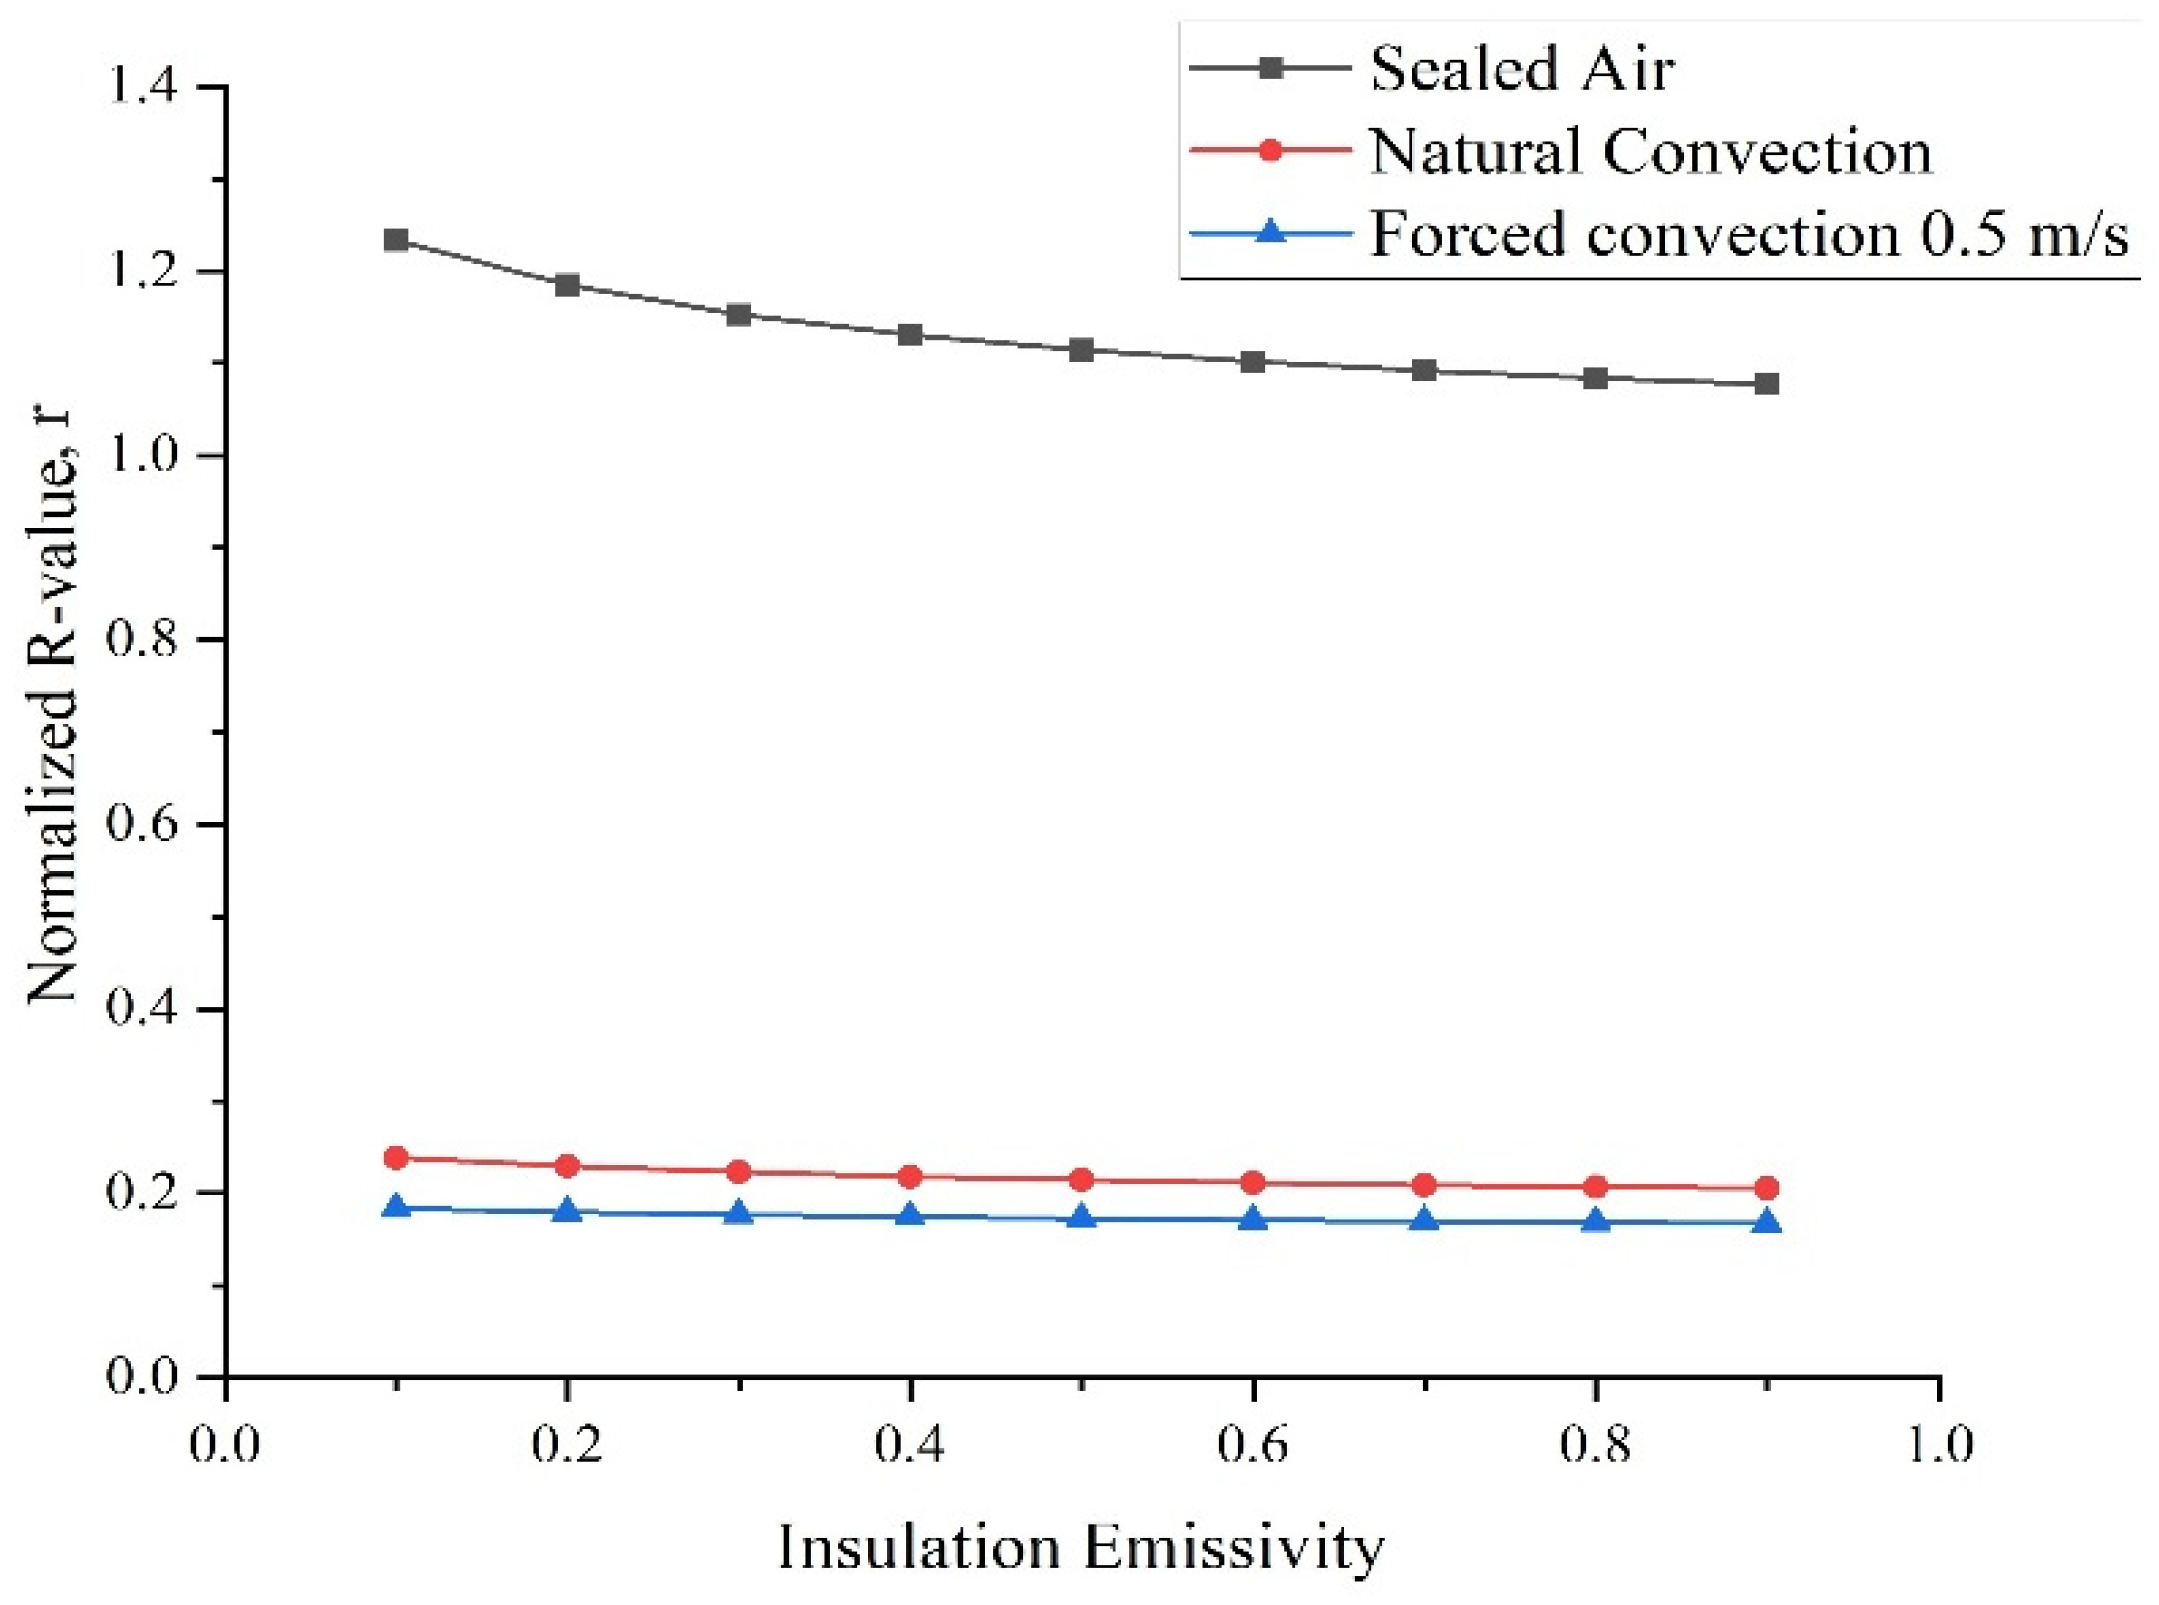
4.2. Impact of Cavity Surface Emissivity

In this section, the effects of the emissivity of the air cavity surfaces are evaluated on the overall thermal performance of retrofitted wall assemblies with insulated panels. Figure 17 illustrates the variations in the normalized R-value, r, with the cavity surface emissivity for three airflow cases, including a sealed air cavity and an unsealed air cavity with natural and forced convection, with an airflow velocity of 0.5 m/s.
In the case of the sealed air cavity, the normalized R-value shows minimal change across all emissivity values. The slight decline in Figure 17 indicates that in a sealed environment, where air within the cavity has minimal movement, the surface emissivity can noticeably affect the overall R-value of the insulated wall assembly.
In the case of an unsealed air cavity with natural convection, the R-value of the insulated wall assembly remains consistently low and is almost unaffected by any change in the emissivity value. This result is associated with the fact that the dominant heat transfer mode within the air cavity is convection, primarily influenced by the introduced cold external air, which efficiently removes heat irrespective of the radiative properties of the insulation layer.
For the case of an unsealed air cavity with forced convection with an air velocity of 0.5 m/s, the results of Figure 17 follow the same patterns as those obtained for the case of natural convection. The dominating influence of air movement leads to consistently lower R-values for the insulated wall assembly when compared with those estimated for the case of natural convection. Indeed, the forced air movement of air intensifies heat transfer through enhanced convection and thus lowers the insulating effects of the air cavity. Enhanced air flow, while increasing heat transfer by convection, reduces any influence of the emissivity of the insulation layer surface.

4.3. Impact of Insulated Panel Thickness

This section investigates the impact of the insulated panel thickness on the overall R-value for the retrofitted wall assembly. Figure 18 outlines the variation in the normalized wall assembly R-value, r, as a function of the insulated panel thickness for three airflow cases. The results of Figure 18 are obtained when the air cavity thickness is 5 cm, the surface emissivity is 0.9, and the air velocity for the case of forced convection is 0.5 m/s.
As shown in Figure 18, the impact of the insulated panel thickness on the overall R-value of the retrofitted wall assembly depends significantly on the airflow type within the air cavity. The overall normalized R-value of the wall assembly decreases with the thickness of the insulated panel, regardless of the air cavity configuration.
For the case of natural convection with the outside insulation case, increased thickness results in decreased normalized R-values, signifying that the ratio of Rairgap to Rno airgap lowers when the insulation thickness increases. This trend occurs because as the thickness of the insulation increases, the potential for convective loops to develop within the air gap also increases, thereby reducing the insulating effectiveness. Natural convection relies on temperature differences within the air gap to drive the movement of air. As the insulation becomes thicker, the temperature gradient across the gap can enhance these convective currents, leading to increased heat transfer and a corresponding reduction in the R-value.
For the case of an unsealed cavity with forced convection at 0.5 m/s, the normalized R-value varies following a similar trend to that of the unsealed cavity case with natural convection. However, the forced convection case results in more pronounced changes in the R-value of the retrofitted wall assembly than those obtained for the natural convection case due to more effective heat transfer associated with higher air velocities within the cavity.

5. Conclusions

In this study, the impacts of air cavities associated with connecting insulated panels to existing wall assemblies are evaluated. The analysis results indicate that these impacts depend on several factors, including primarily the air cavity thickness and the type of airflow within the cavity. The key findings reveal that if an insulated panel needs to be attached along the exterior facade of an existing wall assembly, it is important to seal all the sides of the air cavity and minimize its thickness and use low-emissivity surfaces. For sealed air cavities with optimal thickness (ranging between 2 cm and 3 cm), the R-value of the retrofitted walls improves by 9% while reducing emissivity from 0.9 to 0.1, which increases their R-value by 13%.
However, any significant airflow within the air cavity, due to natural or forced convection, significantly decreases the overall R-value—up to five times lower than that of an insulated wall without any air cavity. Moreover, the thickness and surface emissivity of the air cavity can greatly influence the overall thermal performance of retrofitted wall assemblies. Specifically, lower emissivity enhances the R-value of the retrofitted wall assemblies regardless of airflow within the air cavities, whereas the impacts of air cavity thickness vary, as it increases the R-value when sealed but decreases it under convection, especially with higher air velocities.
This study underscores the complexity of retrofitting wall assemblies with attachable prefabricated insulation panels, as the resulting thermal performance depends on factors such as cavity thickness, airflow, and panel thickness. Moreover, experimental analysis is required to verify the results of this study to ensure proper retrofit practices when installing prefabricated insulated panels.

Author Contributions

Conceptualization, M.K.; methodology, U.D.; software, U.D.; validation, U.D.; formal analysis, U.D.; investigation, U.D.; resources, M.K.; data curation, U.D.; writing—original draft preparation, U.D.; writing—review and editing, M.K.; visualization, U.D.; supervision, M.K.; project administration, M.K.; funding acquisition, M.K. All authors have read and agreed to the published version of the manuscript.

Funding

This research was funded by the Building Energy Smart Technologies (BEST) Center, established by National Science Foundation (NSF) under grant numbers 2113874 and 2113907.

Data Availability Statement

The original contributions presented in the study are included in the article, further inquiries can be directed to the corresponding author.

Conflicts of Interest

The authors declare no conflicts of interest.

Abbreviations

The following abbreviations are used in this manuscript:
CFDComputational Fluid Dynamics
DODiscrete Ordinates, a model for radiation in CFD analysis
HOFHandbook of Fundamentals
SIMPLESemi-Implicit Method for Pressure-Linked Equations

References

  1. IEA. World Energy Outlook 2024; International Energy Agency: Paris, France, 2024; Available online: https://www.iea.org/reports/world-energy-outlook-2024 (accessed on 20 June 2025).
  2. U.S. Energy Information Administration—EIA—Independent Statistics and Analysis. Available online: https://www.eia.gov/pressroom/releases/press542.php (accessed on 29 June 2025).
  3. Fan, Y.; Fang, C. GHG Emissions and Energy Consumption of Residential Buildings—A Systematic Review and Meta-Analysis. Environ. Monit. Assess. 2023, 195, 885. [Google Scholar] [CrossRef] [PubMed]
  4. Wang, C.; Song, J.; Shi, D.; Reyna, J.L.; Horsey, H.; Feron, S.; Zhou, Y.; Ouyang, Z.; Li, Y.; Jackson, R.B. Impacts of Climate Change, Population Growth, and Power Sector Decarbonization on Urban Building Energy Use. Nat. Commun. 2023, 14, 6434. [Google Scholar] [CrossRef]
  5. Hafez, F.S.; Sa’di, B.; Safa-Gamal, M.; Taufiq-Yap, Y.H.; Alrifaey, M.; Seyedmahmoudian, M.; Stojcevski, A.; Horan, B.; Mekhilef, S. Energy Efficiency in Sustainable Buildings: A Systematic Review with Taxonomy, Challenges, Motivations, Methodological Aspects, Recommendations, and Pathways for Future Research. Energy Strategy Rev. 2023, 45, 101013. [Google Scholar] [CrossRef]
  6. Liu, Z.-A.; Li, Y.; Hou, J.; Tian, L.; Wang, S.; Hu, W.; Zhang, L. Impact of Exterior Envelope Thermal Performance on Energy Demand and Optimization Strategies for University Teaching-Office Buildings. Sci. Rep. 2025, 15, 15171. [Google Scholar] [CrossRef]
  7. Shehadi, M. Energy Consumption Optimization Measures for Buildings in the Midwest Regions of USA. Buildings 2018, 8, 170. [Google Scholar] [CrossRef]
  8. Amani, N. Energy Efficiency of Residential Buildings Using Thermal Insulation of External Walls and Roof Based on Simulation Analysis. Energy Storage Sav. 2025, 4, 48–55. [Google Scholar] [CrossRef]
  9. Kalhor, K.; Emaminejad, N. Qualitative and Quantitative Optimization of Thermal Insulation Materials: Insights from the Market and Energy Codes. J. Build. Eng. 2020, 30, 101275. [Google Scholar] [CrossRef]
  10. Fawaier, M.; Bokor, B. Dynamic Insulation Systems of Building Envelopes: A Review. Energy Build. 2022, 270, 112268. [Google Scholar] [CrossRef]
  11. Song, A.; Kim, Y.; Hwang, S.; Shin, M.; Lee, S. A Comprehensive Review of Thermal Transmittance Assessments of Building Envelopes. Buildings 2024, 14, 3304. [Google Scholar] [CrossRef]
  12. Bond, D.E.M.; Clark, W.W.; Kimber, M. Configuring Wall Layers for Improved Insulation Performance. Appl. Energy 2013, 112, 235–245. [Google Scholar] [CrossRef]
  13. Ali, A.; Issa, A.; Elshaer, A. A Comprehensive Review and Recent Trends in Thermal Insulation Materials for Energy Conservation in Buildings. Sustainability 2024, 16, 8782. [Google Scholar] [CrossRef]
  14. Bhamare, D.K.; Rathod, M.K.; Banerjee, J.; Arıcı, M. Investigation of the Effect of Air Layer Thickness on the Thermal Performance of the PCM Integrated Roof. Buildings 2023, 13, 488. [Google Scholar] [CrossRef]
  15. Zhang, T.; Yang, H. Heat Transfer Pattern Judgment and Thermal Performance Enhancement of Insulation Air Layers in Building Envelopes. Appl. Energy 2019, 250, 834–845. [Google Scholar] [CrossRef]
  16. Zhang, T.; Tan, Y.; Yang, H.; Zhang, X. The Application of Air Layers in Building Envelopes: A Review. Appl. Energy 2016, 165, 707–734. [Google Scholar] [CrossRef]
  17. Liu, Y.-L.; Yang, D.-G.; Wang, D.-H.; Liu, X. Research on Thermal and Heat Insulation Properties of Aerogel Heat-Insulating Reflective Coatings. Appl. Sci. 2023, 13, 9700. [Google Scholar] [CrossRef]
  18. Peng, Y.; Lai, J.-C.; Xiao, X.; Jin, W.; Zhou, J.; Yang, Y.; Gao, X.; Tang, J.; Fan, L.; Fan, S.; et al. Colorful Low-Emissivity Paints for Space Heating and Cooling Energy Savings. Proc. Natl. Acad. Sci. USA 2023, 120, e2300856120. [Google Scholar] [CrossRef]
  19. ASHRAE. ASHRAE Handbook—Fundamentals, SI ed.; American Society of Heating, Refrigerating and Air-Conditioning Engineers: Atlanta, GA, USA, 2021. [Google Scholar]
  20. Roig, O.; Summa, S.; Pardal, C.; Isalgue, A.; Di Perna, C.; Stazi, F. Opaque Ventilated Façades: Energy Performance for Different Main Walls and Claddings. Energy Build. 2024, 314, 114280. [Google Scholar] [CrossRef]
  21. Ingebretsen, S.B.; Andenæs, E.; Gullbrekken, L.; Kvande, T. Microclimate and Mould Growth Potential of Air Cavities in Ventilated Wooden Façade and Roof Systems—Case Studies from Norway. Buildings 2022, 12, 1739. [Google Scholar] [CrossRef]
  22. Rahiminejad, M.; Khovalyg, D. Thermal Resistance of Ventilated Air-Spaces behind External Claddings; Definitions and Challenges (ASHRAE 1759-RP). Sci. Technol. Built Environ. 2021, 27, 788–805. [Google Scholar] [CrossRef]
  23. Rahiminejad, M.; Khovalyg, D. Measuring the Effective Thermal Resistance of Ventilated Air-Spaces behind Common Wall Assemblies: Theoretical Uncertainty Analysis and Recommendations for the Hot Box Method Modifications (ASHRAE 1759-RP). Sci. Technol. Built Environ. 2022, 28, 320–337. [Google Scholar] [CrossRef]
  24. Amani-Beni, M.; Tabatabaei Malazi, M.; Sahin, B.; Dalkılıç, A.S. Effects of Facades Positioned at Different Angles on Building Thermal Performance and Flow Behaviors. Front. Archit. Res. 2025, 14, 267–281. [Google Scholar] [CrossRef]
  25. Domínguez-Torres, C.-A.; Suárez, R.; León-Rodríguez, A.L.; Domínguez-Delgado, A. Parametric Energy Optimization of a Ventilated Facade with Windows in Mediterranean Climates. Renew. Energy 2024, 227, 120398. [Google Scholar] [CrossRef]
  26. Sobieraj, J.; Metelski, D.; Rosłon, J. Thermal Performance Analysis and Design Evolution of Ventilated Stone Facades: A Case Study of the Praski Student House (Akademik Praski) in Warsaw. Buildings 2024, 14, 3558. [Google Scholar] [CrossRef]
  27. Zhangabay, N.; Oner, A.; Rakhimov, M.; Tursunkululy, T.; Abdikerova, U. Thermal Performance Evaluation of a Retrofitted Building with Adaptive Composite Energy-Saving Facade Systems. Energies 2025, 18, 1402. [Google Scholar] [CrossRef]
  28. Energiesprong Energiesprong. Available online: https://energiesprong.org/about (accessed on 1 June 2025).
  29. Biega, K.; Krarti, M. Evaluation of Exterior Insulated Panels for Residential Deep Energy Retrofits. Energies 2024, 17, 3988. [Google Scholar] [CrossRef]
  30. ANSYS. ANSYS FLUENT, A Fluid Simulation Software, ANSYS Inc 2024, Canonsburg, PA. Available online: https://www.ansys.com/products/fluids/ansys-fluent (accessed on 1 June 2025).
  31. ANSYS. ANSYS FLUENT User’s Guide. ANSYS Inc. 2025. Canonsburg, PA. Available online: https://www.ansys.com/products/fluids/ansys-fluent (accessed on 5 June 2025).
  32. Qin, J.; Pan, H.; Zhu, Z.; Tian, X.; Rahman, M.M. Assessments of SIMPLE and ASIMPLE Algorithms Based on Buoyancy-Driven Cavity Flows. Int. J. Innov. Sci. Res. Technol. 2020, 5, 700–714. [Google Scholar]
Figure 1. General analysis approach considered for the evaluation of thermal performance of wall assemblies with air cavities.
Energies 18 03573 g001
Figure 2. An existing building with added insulated panels from (a) outside and (b) inside the conditioned space.
Energies 18 03573 g002
Figure 3. Installation details of insulated panel to the outer surface of existing wall using (a) guide clips and French cleat hangers connected to (a) back of the insulated panel and (b) guide bars and French cleat receivers connected to the outside surface of existing wall [29].
Energies 18 03573 g003
Figure 4. Section for an insulated concrete wall assembly.
Energies 18 03573 g004
Figure 5. Three airflow configurations considered in the analysis, including (a) sealed air cavity, (b) unsealed air cavity with natural convection, and (c) unsealed air cavity with forced convection at airflow velocity.
Energies 18 03573 g005
Figure 6. Comparison between the CFD model predictions and reported ASHRAE values for sealed air cavities for various thicknesses and emissivity values.
Energies 18 03573 g006
Figure 7. (a) Temperature and (b) air velocity contours for a wall assembly with a sealed air cavity with a thickness of 1.3 cm.
Energies 18 03573 g007
Figure 8. Variation in the normalized R-value, r, with air cavity thickness for a retrofitted wall assembly.
Energies 18 03573 g008
Figure 9. Temperature contours within the wall assembly for air cavity thicknesses of (a) 2 cm and (b) 5 cm for the case of natural convection.
Energies 18 03573 g009
Figure 10. Velocity profiles at the unsealed air cavity with thicknesses of (a) 2 cm and (b) 5 cm for the case of natural convection.
Energies 18 03573 g010
Figure 11. Temperature profiles along the horizontal cross-sections at different heights of the assembly with unsealed air cavity thicknesses of (a) 2 cm and (b) 5 cm under natural convection.
Energies 18 03573 g011
Figure 12. Air velocity profiles along cross-sections at different heights of unsealed air cavity with a thickness of (a) 2 cm and (b) 5 cm under natural convection.
Energies 18 03573 g012
Figure 13. Temperature contours within the wall assembly with air cavity thicknesses of (a) 2 cm and (b) 5 cm for the case of forced convection.
Energies 18 03573 g013
Figure 14. Velocity profiles within the unsealed air cavity with thicknesses of (a) 2 cm and (b) 5 cm for the case of forced convection.
Energies 18 03573 g014
Figure 15. Temperature profiles along the horizontal cross-sections at different heights of the assembly with unsealed air cavity thicknesses of (a) 2 cm and (b) 5 cm under forced convection.
Energies 18 03573 g015
Figure 16. Velocity profile along the X-axis of the air cavity at different locations for cavity thicknesses of (a) 2 cm and (b) 5 cm under forced convection.
Energies 18 03573 g016
Figure 17. Variation in the normalized R-value, r, with cavity surface emissivity for a retrofitted wall assembly.
Energies 18 03573 g017
Figure 18. Variation in the normalized R-value, r, with insulated panel thickness for a retrofitted wall assembly.
Energies 18 03573 g018
Table 1. Properties for concrete and insulation layers.
MaterialDensity
(kg/m3)
Specific Heat Capacity
(J/kg K)
Thermal Conductivity
(W/m K)
Insulation4515000.025
Concrete24008800.4
Table 3. Comparison of CFD model predictions of wall assembly R-values to ASHRAE data.
Air Space
Thickness
(cm)
Air Space
Temp
(°C)
Air Temp
Difference
(°C)
Effective EmissivityHOF
Rairgap
Value
(m2K/W)
Estimated
Rairgap
Value
(m2K/W)
Error %
1.310150.820.1610.1620.701
1.310150.720.1750.1740.621
1.33050.820.1390.1400.511
1.330150.720.1520.1520.416
11050.820.1490.1480.750
11050.720.1610.1600.743
110300.820.1470.1480.680
110300.720.1590.1590.359
Disclaimer/Publisher’s Note: The statements, opinions and data contained in all publications are solely those of the individual author(s) and contributor(s) and not of MDPI and/or the editor(s). MDPI and/or the editor(s) disclaim responsibility for any injury to people or property resulting from any ideas, methods, instructions or products referred to in the content.

