Article

SOH and RUL Estimation for Lithium-Ion Batteries Based on Partial Charging Curve Features

1
State Grid Suzhou Power Supply Company, Suzhou 215004, China
2
School of Electronic and Information Engineering, Suzhou University of Science and Technology, Suzhou 215009, China
*
Author to whom correspondence should be addressed.
Energies 2025, 18(13), 3248; https://doi.org/10.3390/en18133248 (registering DOI)
Submission received: 30 April 2025 / Revised: 10 June 2025 / Accepted: 14 June 2025 / Published: 21 June 2025
(This article belongs to the Section F5: Artificial Intelligence and Smart Energy)

Abstract

:
Accurate estimation of the state of health (SOH) and remaining useful life (RUL) of lithium-ion batteries (LiBs) is critical for ensuring battery reliability and safety in applications such as electric vehicles and energy storage systems. However, existing methods developed for estimating the SOH and RUL of LiBs often rely on full-cycle charging data, which are difficult to obtain in engineering practice. To bridge this gap, this paper proposes a novel data-driven method to estimate the SOH and RUL of LiBs only using partial charging curve features. Key health features are extracted from the constant voltage (CV) charging process and voltage relaxation, validated through Pearson correlation analysis and SHapley Additive exPlanations (SHAP) interpretability. A hybrid framework combining CatBoost for SOH estimation and particle swarm optimization-support vector regression (PSO-SVR) for RUL estimation is developed. Experimental validation on public datasets demonstrates superior performance of the methodology described above, with an SOH estimation root mean square error (RMSE) and mean absolute error (MAE) below 1.42% and 0.52% and RUL estimation relative error (RE) under 1.87%. The proposed methodology also exhibits robustness and computational efficiency, making it suitable for battery management systems (BMSs) of LiBs.

1. Introduction

Lithium-ion batteries (LiBs) have become a cornerstone of modern energy storage systems, widely adopted in electric vehicles, large-scale energy storage, and portable electronics due to their high energy density, low self-discharge rate, long cycle life, and environmental advantages. However, repeated charge–discharge cycles lead to gradual internal aging of LiBs, resulting in performance degradation. Severe aging can trigger safety hazards such as electrolyte leakage and short circuits. To evaluate battery aging, two key indicators are commonly employed: state of health (SOH) and remaining useful life (RUL). In recent years, researchers have been devoted to developing accurate and flexible methods for estimating the SOH and RUL of LiBs, which can be grouped into two categories: model-based methods and data-driven methods [1].
Model-driven methods typically employ electrochemical models (EMs) [2,3,4] or equivalent circuit models (ECMs) [5,6] to simulate the dynamic response characteristics of batteries. EMs rely on partial differential equations to describe the underlying electrochemical processes during battery aging, including solid electrolyte interface layer formation and lithium inventory depletion. For instance, the single-particle model and pseudo-two-dimensional porous electrode model have been employed to estimate the SOH and RUL of LiBs [7,8]. However, EMs face challenges in developing generalized models for diverse working conditions due to their high complexity and computational cost. In contrast, ECMs simplify battery behavior using electrical components such as resistors and capacitors for easy implementation in battery management systems (BMSs) [9]. However, this simplified approach compromises physical interpretability, resulting in limited model fidelity and an inability to predict internal side reactions.
Big data technology has enabled data-driven methods for SOH and RUL estimation, which eliminate the need for LiB expertise. These methods autonomously learn decay patterns from vast data for accurate estimation. Consequently, numerous studies have focused on leveraging various machine learning techniques [10,11,12]. For instance, Chen et al. [13] extracted twelve features from charging voltage, current, and temperature data and developed a hybrid neural network enhanced with an attention mechanism to achieve accurate SOH and RUL estimation. However, this approach requires extensive feature engineering and relies on comprehensive datasets. Similarly, Tang et al. [14] focused on discharge data under specific operating conditions, proposing an improved Bayesian-optimized bidirectional long short-term memory (BiLSTM) neural network for estimation. However, its applicability in real-world scenarios is restricted by varying discharge modes.
Furthermore, Duan et al. [15] developed a charging voltage slope-based health indicator integrating multi-parameter features, combining a variable forgetting factor online sequential extreme learning machine for SOH estimation with a particle filter-based RUL prediction framework. To explore feature representation and fusion from complete cycles, Cai et al. [16] adopted a dual-modal approach, transforming raw charge–discharge cycles into curve images and Gramian angular field representations, then using a bi-modal fusion regression network for feature extraction and joint prediction. Similarly leveraging comprehensive cycle data, Zhang et al. [17] fused multi-domain features from charge–discharge data, optimizing a CatBoost model via the sparrow search algorithm for high-precision estimation. Despite their innovation, these methods predominantly depend on features extracted from either charging or discharging data, while complete charge–discharge cycles are often unavailable in practice. Under these circumstances, Li et al. [18] assessed battery state of health (SOH) by analyzing partial discharge data without requiring complete charge–discharge cycles. However, the complexity and variability of discharge states in actual operating conditions introduce significant interference to detection. For partial charging data, Gao et al. [19] conducted SOH evaluation through analysis of the incremental capacity (IC) curve and the constant voltage charging capacity, extracting two critical features: the peak value of the incremental capacity curve and the constant voltage charging capacity. Zhang et al. [20] analyzed the Incremental Energy per SOC curve to characterize battery aging, where the IES curve is generated by dividing incremental energy by SOC during the charging phase. This method identifies two key health indicators: the maximum value and standard deviation of the IES curve. Nevertheless, both methods require computational derivation of corresponding curves from direct measurement data, followed by further extraction of HIs, resulting in complex calculations. This limitation restricts their real-world applicability, underscoring the need for more adaptable solutions.
In response to the research gap, this paper developed a SOH and RUL estimation method based on partial charging curve features. The main contributions are summarized as follows:
(1)
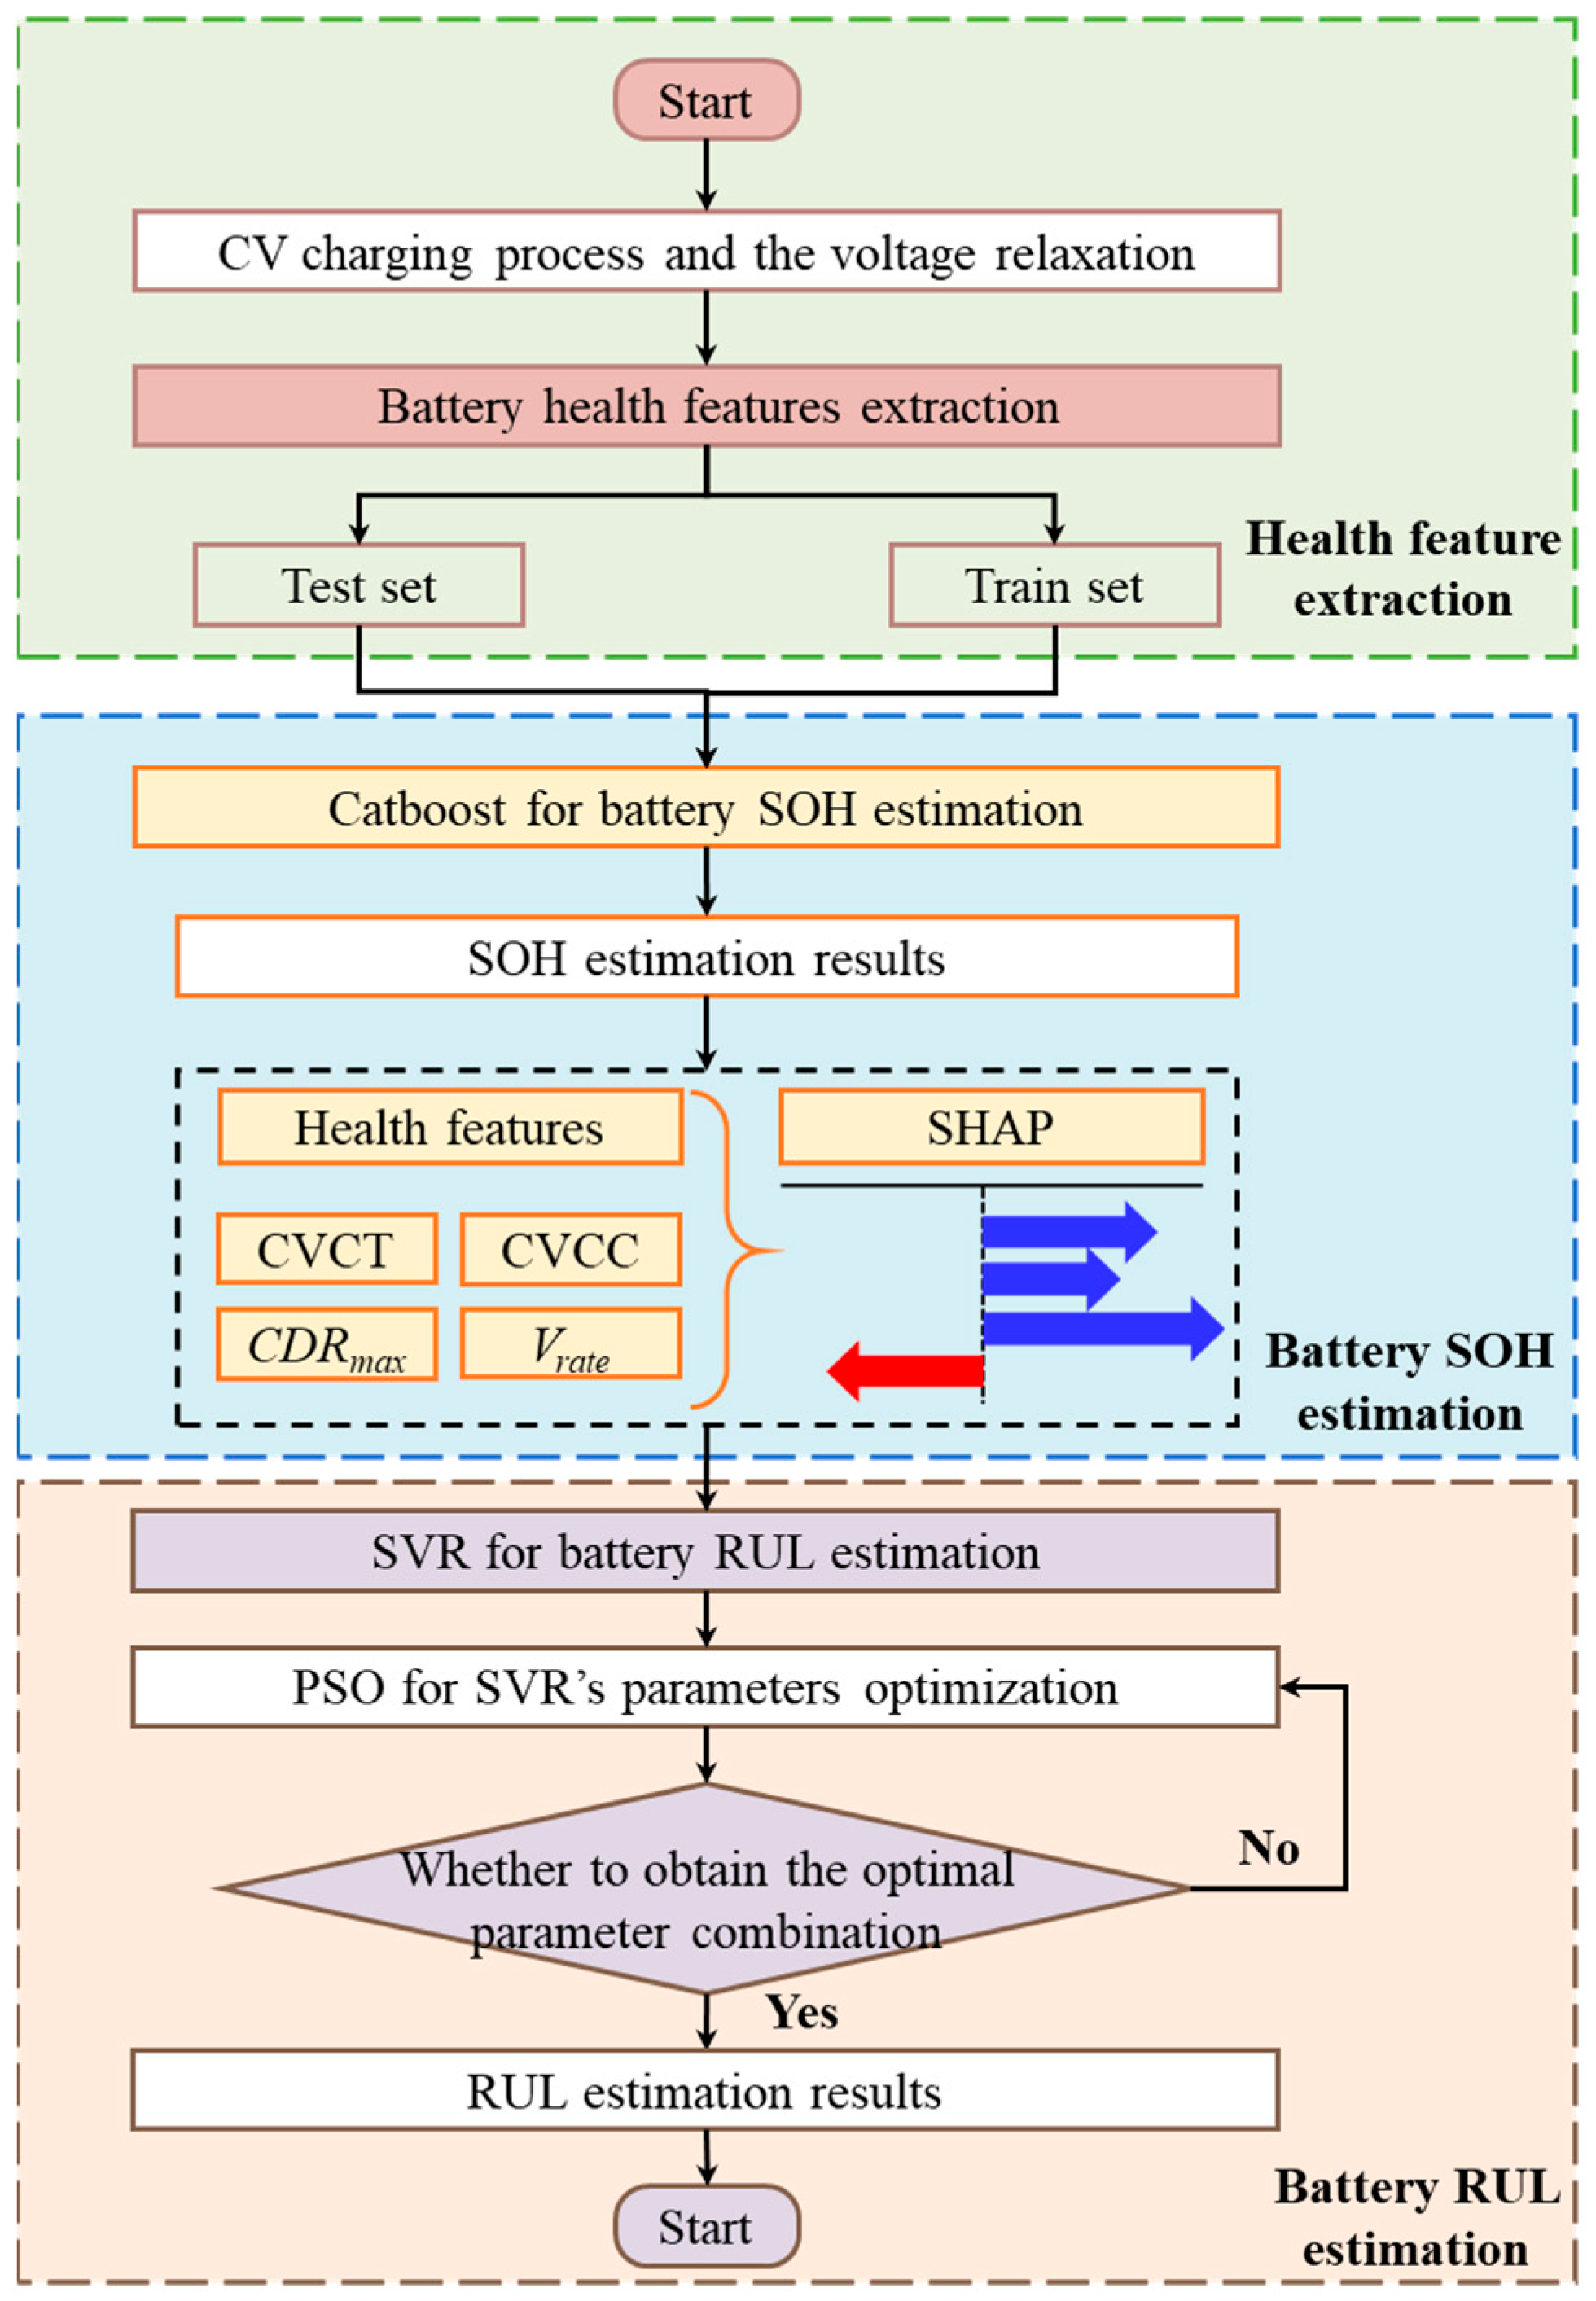
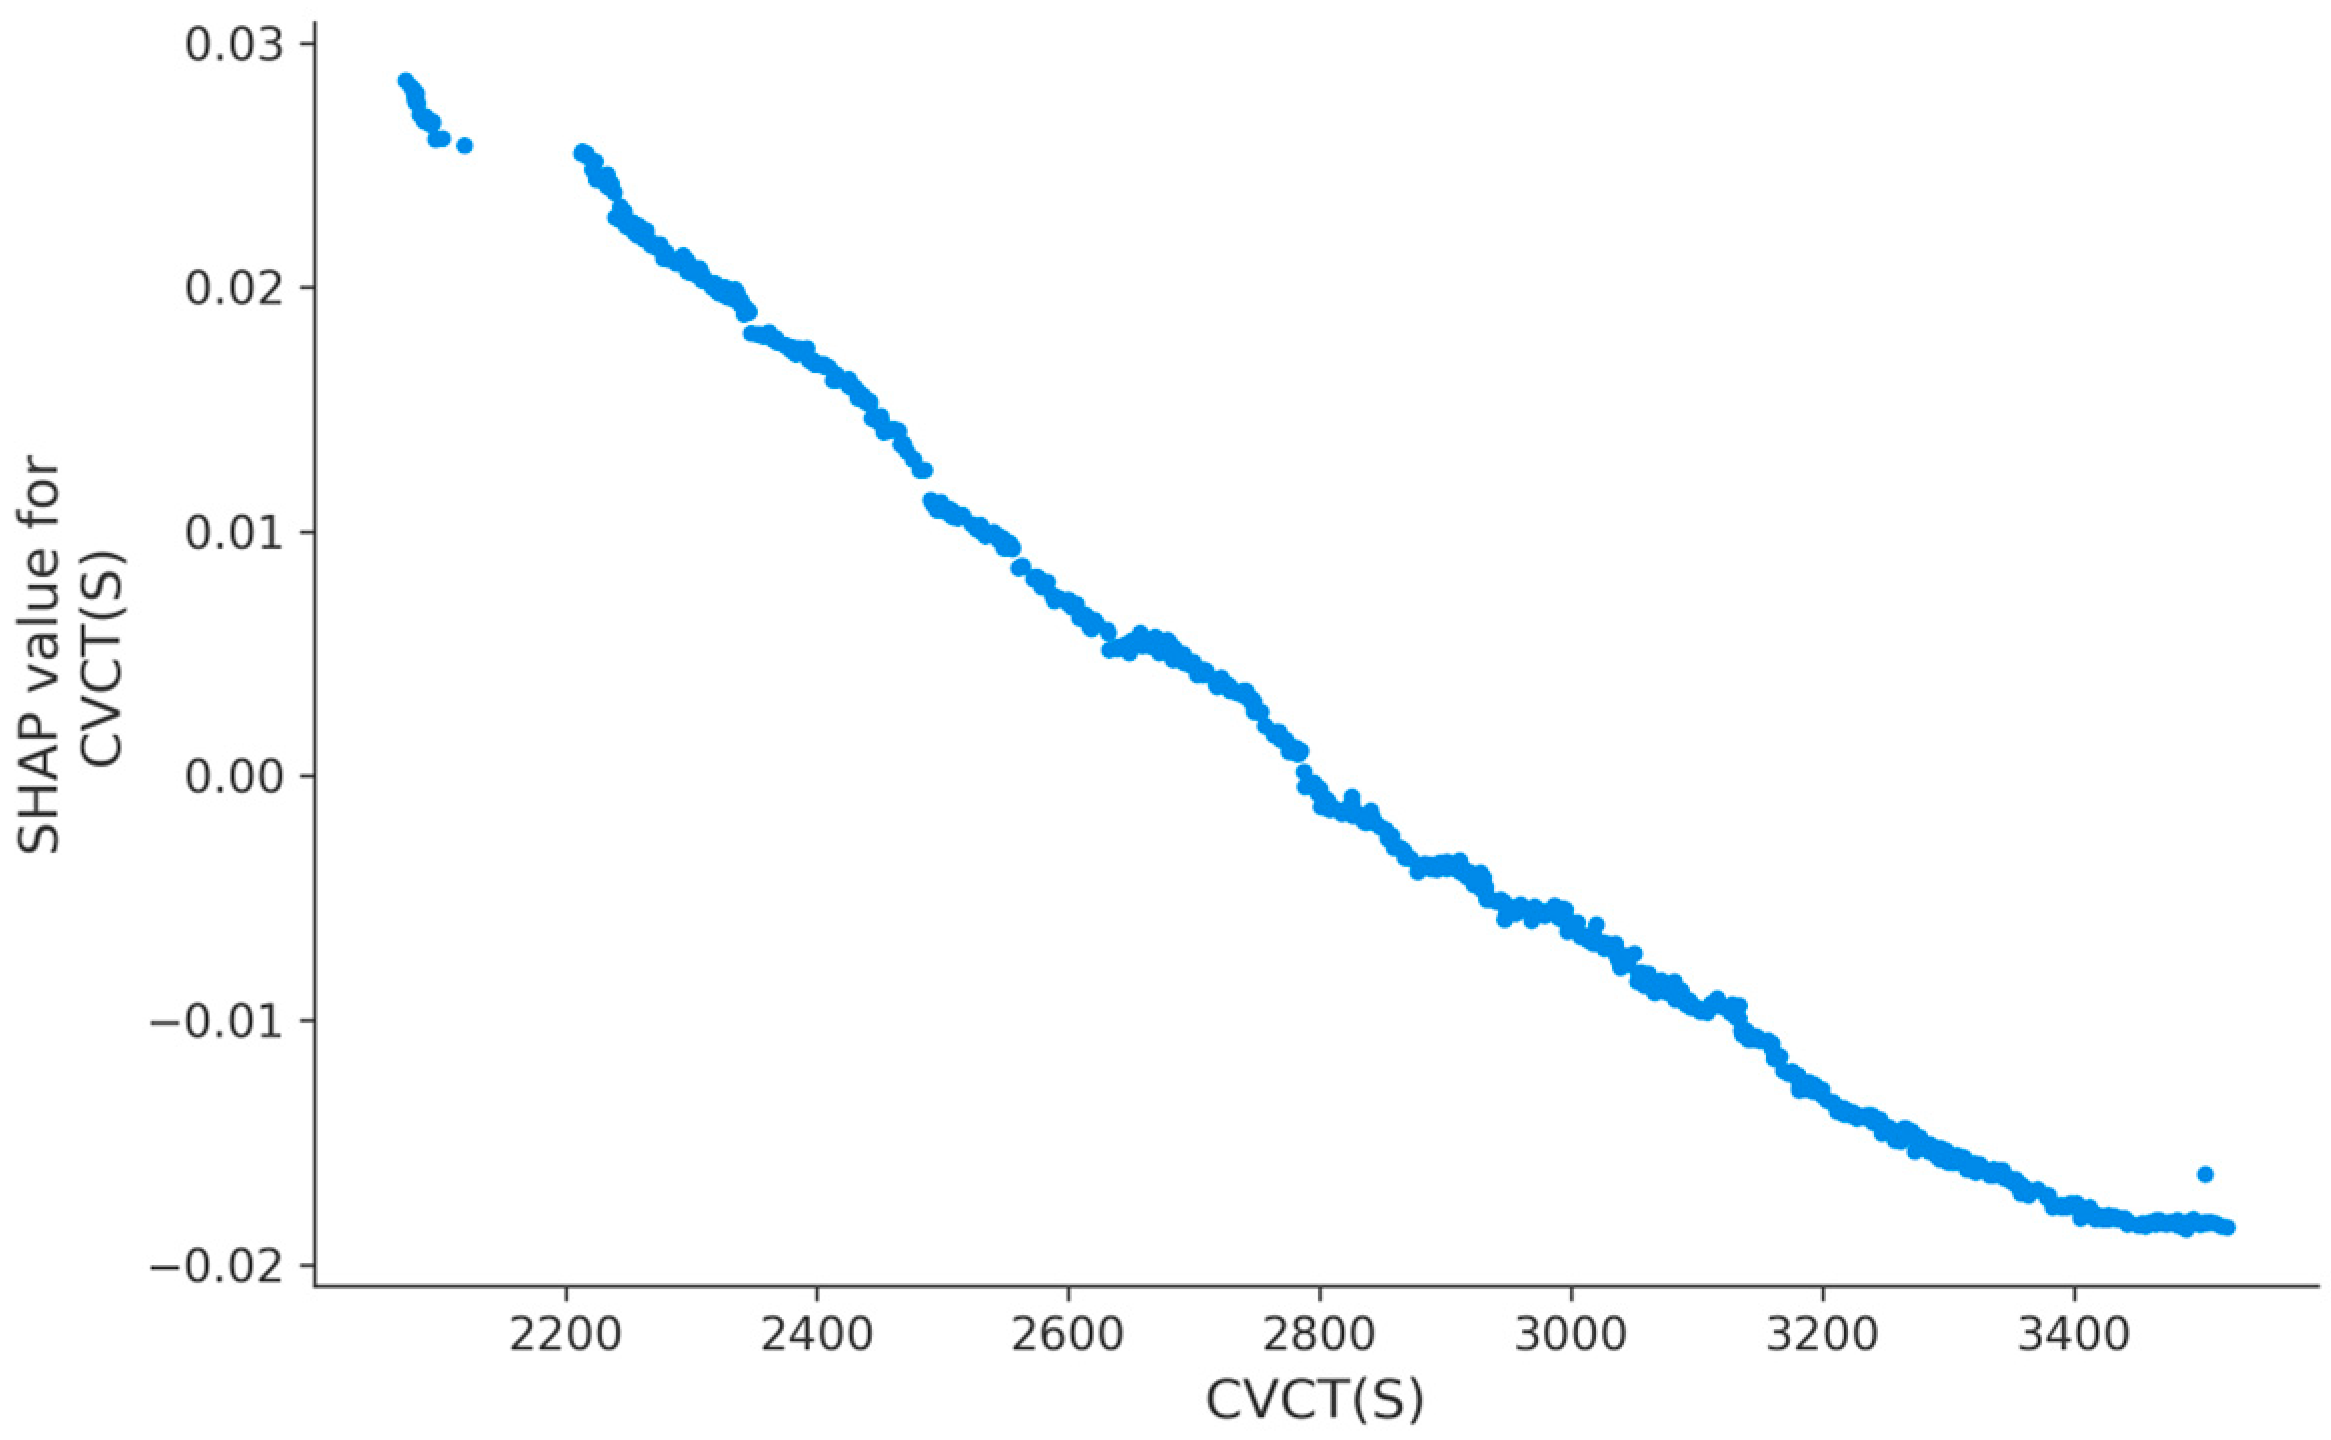
A local health feature extraction strategy focusing on the constant voltage (CV) charging process and voltage relaxation is proposed. By extracting the key health characteristics of some stages in the battery charging process, and the charging data of these two stages are easy to obtain in the actual working condition, the dependence on the full charging curve is eliminated. Pearson correlation analysis and SHapley Additive exPlanations (SHAP) interpretability validation ensure the effectiveness and physical relevance of these features, enabling accurate SOH estimation under practical scenarios with incomplete data.
(2)
An estimation framework combining CatBoost and particle swarm optimization-support vector recognition (PSO-SVR) is developed. CatBoost achieves high-precision SOH estimation using partial charging features, leveraging its strengths with categorical data and gradient bias. Subsequently, PSO-SVR efficiently estimates RUL based on historical SOH sequences. This two-stage approach effectively couples SOH and RUL estimation.
(3)
The proposed method demonstrates superior performance when validated on two distinct battery datasets, outperforming mainstream models including long short-term memory (LSTM), temporal convolutional network (TCN), and Transformer by over 40% in SOH estimation accuracy while maintaining faster computational speeds. Ablation studies confirm the method’s robustness across critical parameters such as feature selection, window length, and optimization processes. SHapley Additive exPlanations (SHAP) analysis provides interpretable insights into the model’s decision-making process, enhancing its credibility for real-world BMS applications.
The paper is structured as follows: Section 2 details data analysis and feature extraction. Section 3 introduces the estimation method. Section 4 presents experimental results and model interpretation. Section 5 concludes the study.

2. Data Analysis and Feature Extraction

2.1. Definition of SOH and RUL

SOH quantifies a battery’s degradation status relative to its pristine condition, primarily manifested through capacity fade and internal resistance growth. Following established conventions in battery health assessment, this study defines SOH using capacity retention as the principal metric [21]:
V SOH = C now C nominal × 100 %
where Cnow represents the current maximum available capacity and Cnominal denotes the nominal capacity.
RUL serves as a critical prediction regarding a battery’s continued operational capability. It estimates the time or number of cycles remaining before the battery, starting from its current state, fails to meet required performance standards. This estimation relies on analyzing performance characteristics and historical usage patterns. In this paper, RUL denotes the predicted count of remaining operational cycles until the battery’s SOH declines to the predetermined end-of-life (EOL) point, set at 80% of its nominal capacity [22].

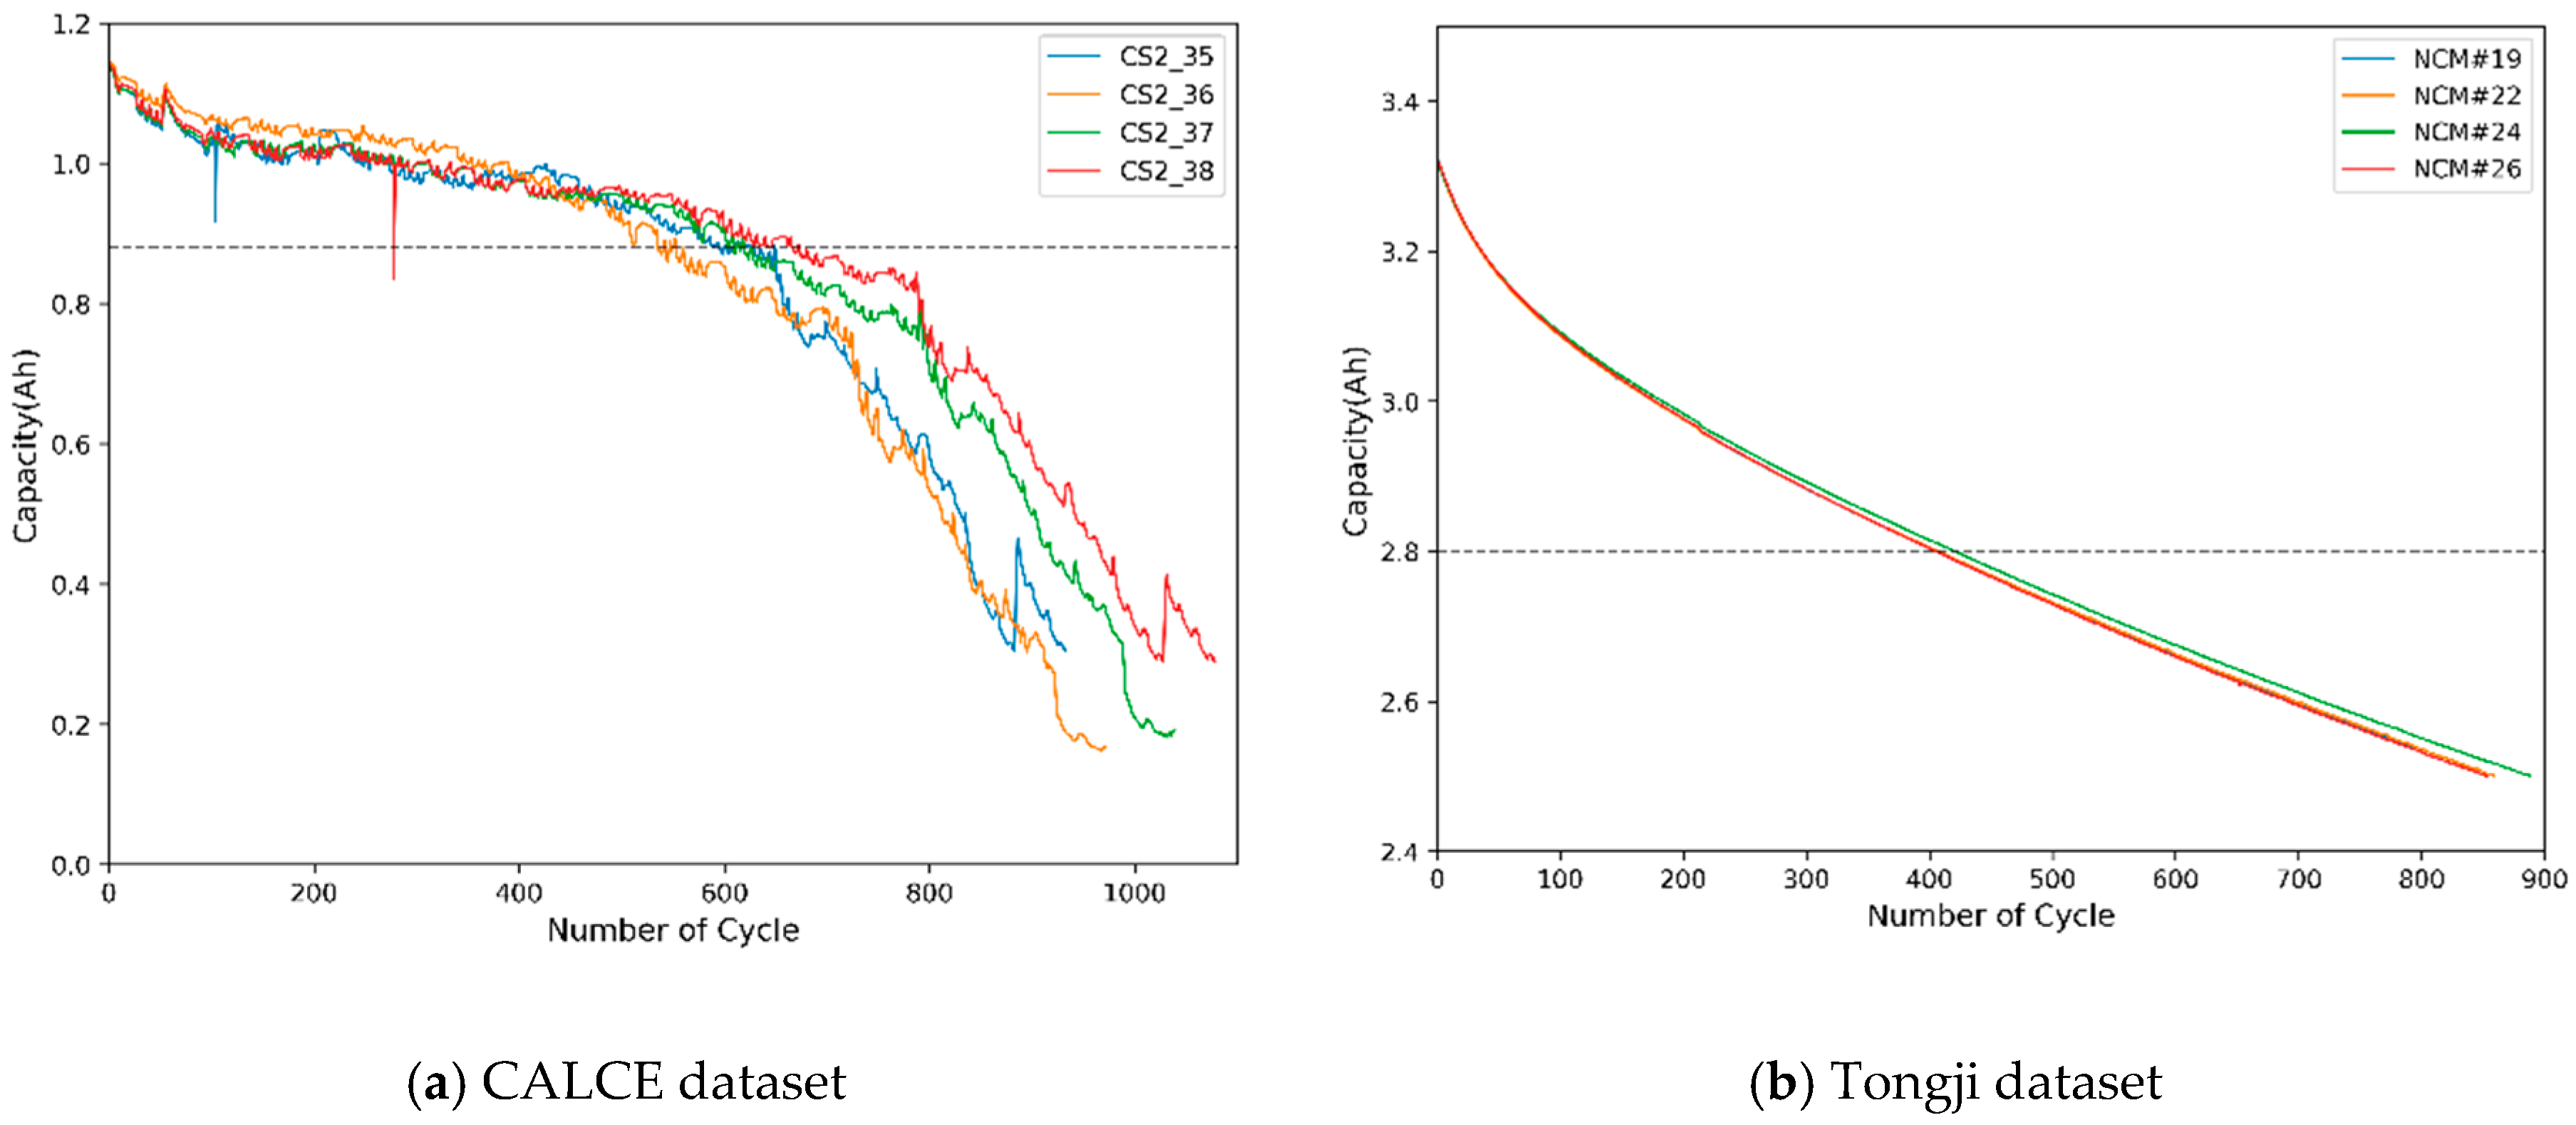
2.2. Analysis of Battery Dataset

To verify the applicability of the proposed method to different battery types, two publicly available datasets from the Center for Advanced Life Cycle Engineering (CALCE) [23] and Tongji University [24] were selected for validation. The CALCE dataset employs lithium cobalt oxide (LCO) batteries, while the Tongji dataset utilizes Ni-Co-Mn (NCM) ternary cathode material batteries. Four battery samples were extracted from each dataset: cells labeled CS2_35, CS2_36, CS2_37, and CS2_38 from CALCE, and four cells numbered 19, 22, 24, and 26 under specific operating conditions from Tongji University, designated as NCM#19, NCM#22, NCM#24, and NCM#26, respectively. The testing conditions for these eight batteries are summarized in Table 1.
During the process of collecting battery charge/discharge data, measurement errors may be introduced due to electromagnetic interference in the environment, sensor noise, or abnormal interruptions, leading to anomalous outliers in the battery capacity degradation curve. These outliers can adversely affect the subsequent assessment accuracy of the SOH and RUL. To address this issue, a sliding Z-score method is adopted for preprocessing to identify outliers in the battery capacity degradation curve. It utilizes a sliding window to calculate the Z-score value for each data point within the window, thereby determining outliers. The formula for the standardized Z-score is as follows:
Z = X μ σ
where X represents the current data point value, μ denotes the mean of the data, and σ is the standard deviation. Data points with absolute Z-score values exceeding a predefined threshold are identified as outliers.
The detected outliers are subsequently marked and replaced using the average of the previous and subsequent non-outlier cycle capacity data within the same periodic sequence. Furthermore, this methodology is extended to process outliers in subsequent health features. Figure 1 show the final test results of the battery capacity degradation curves.

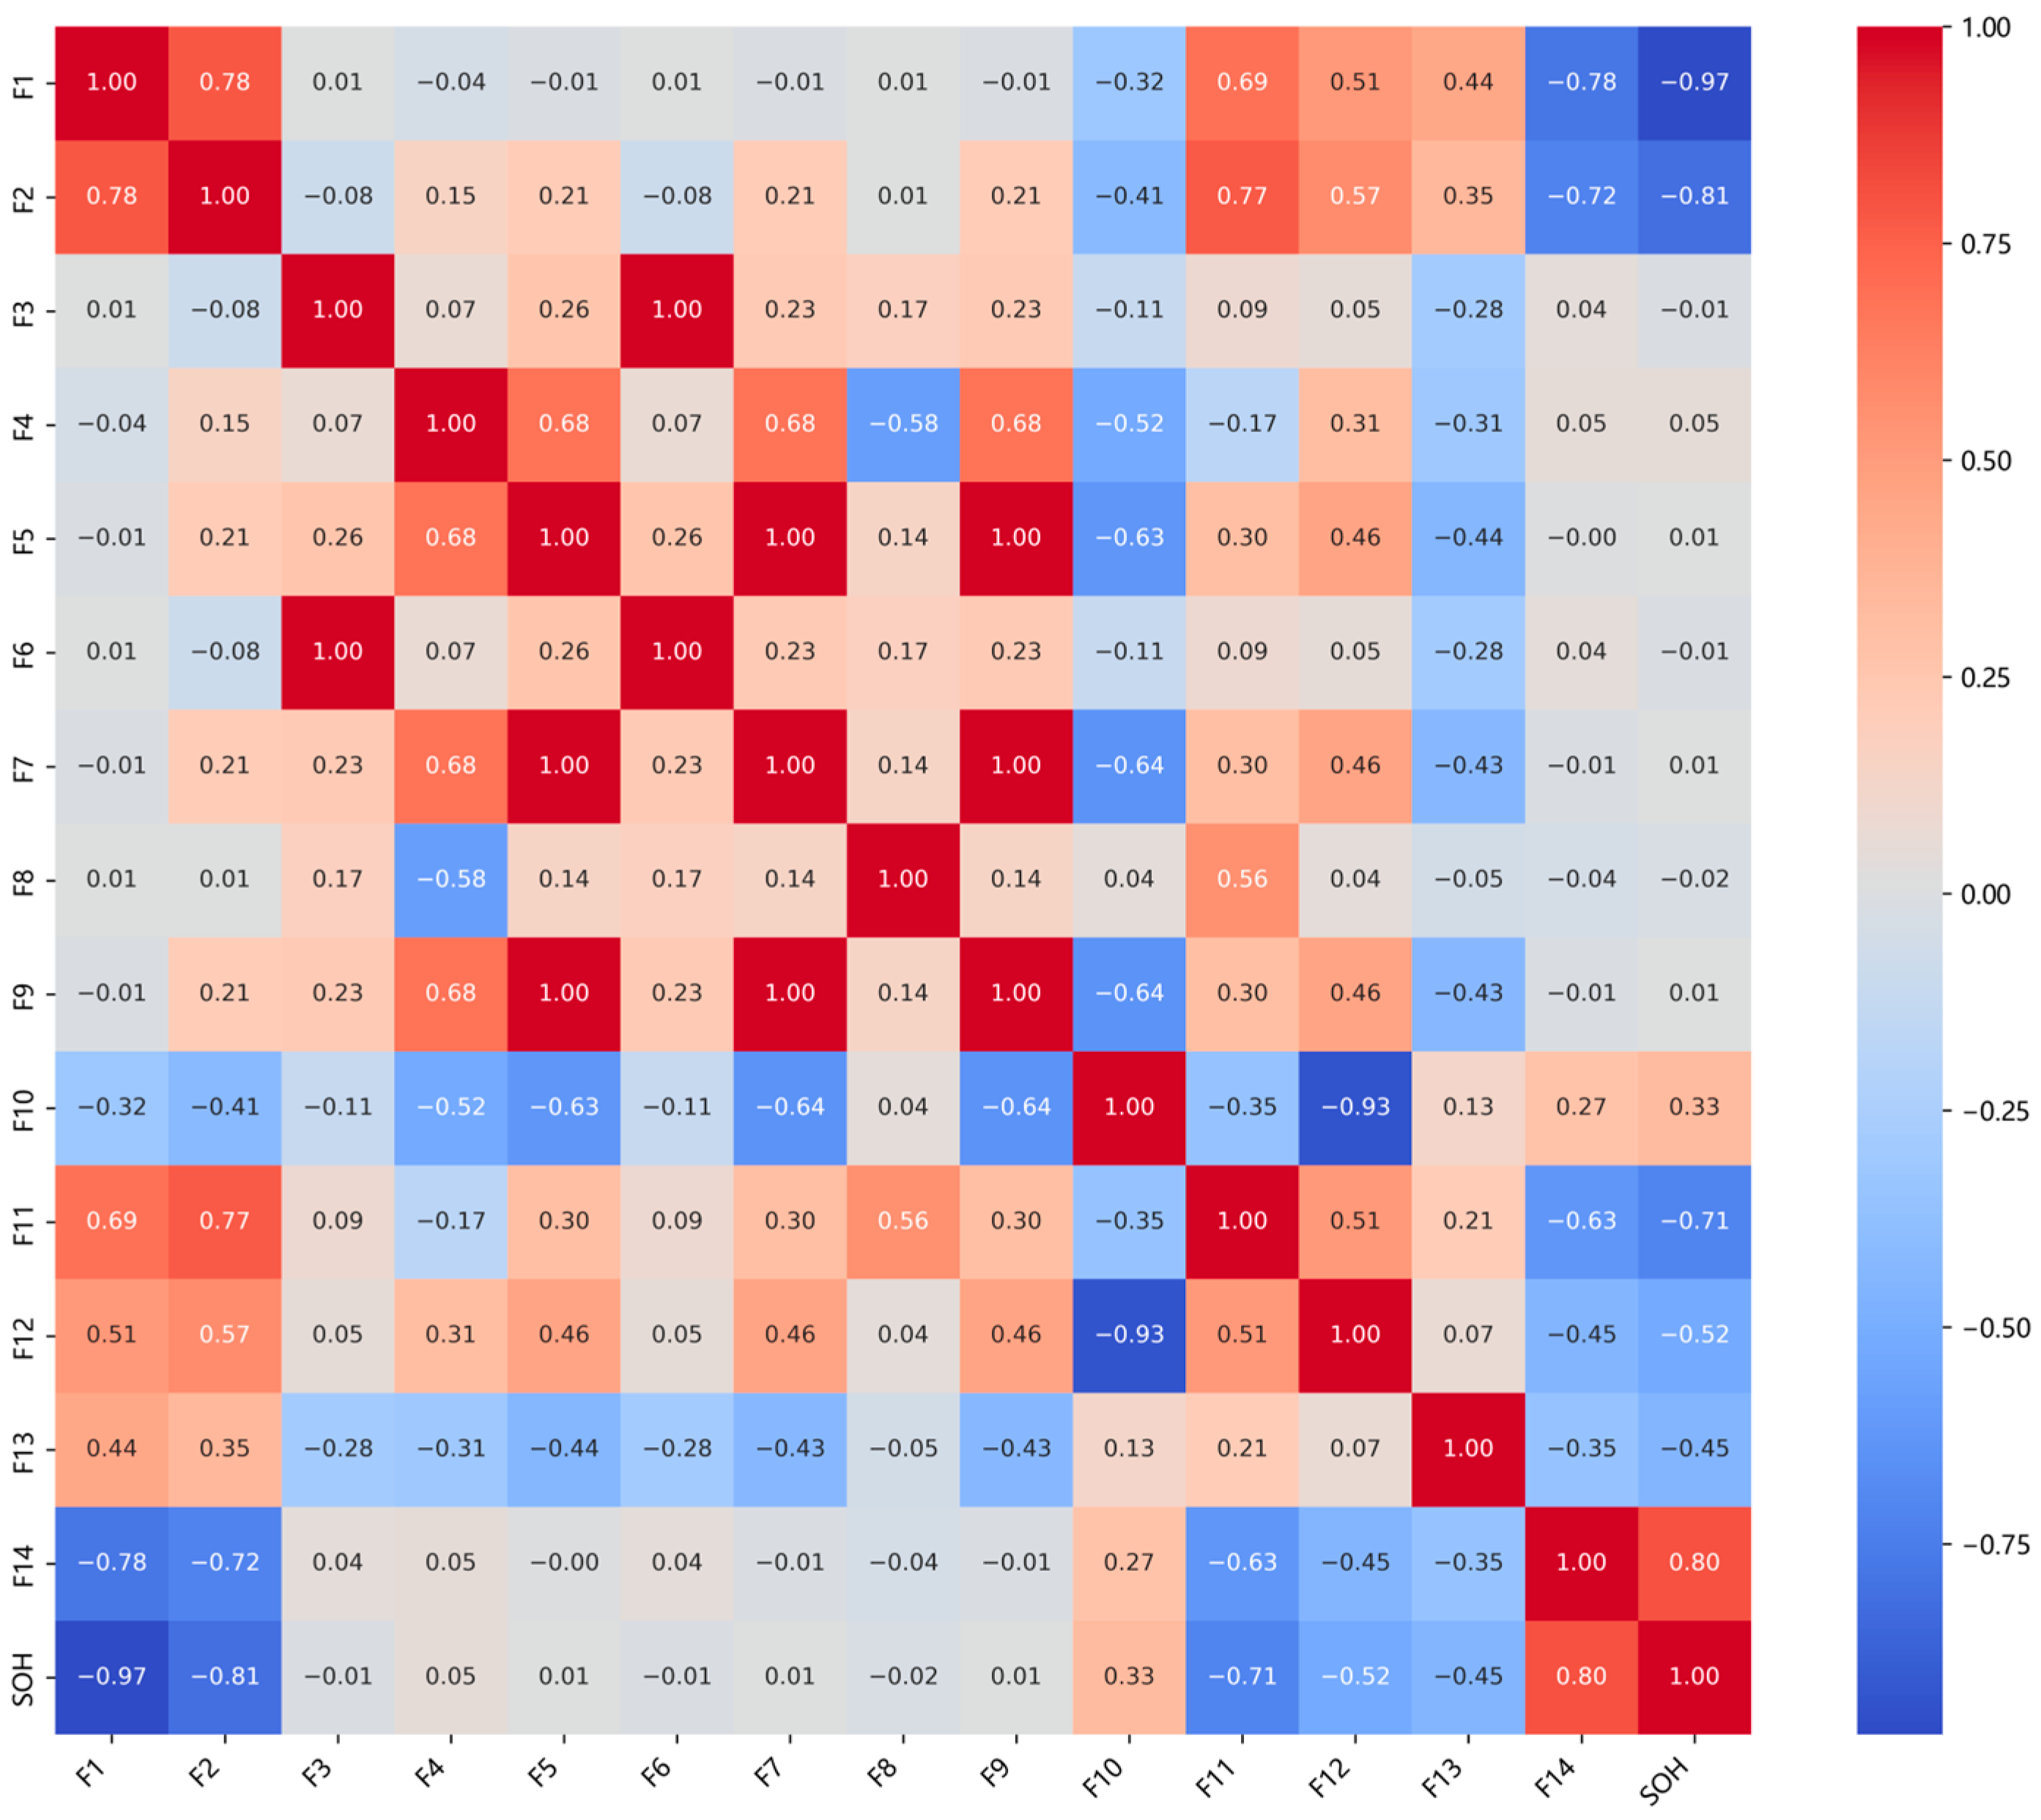
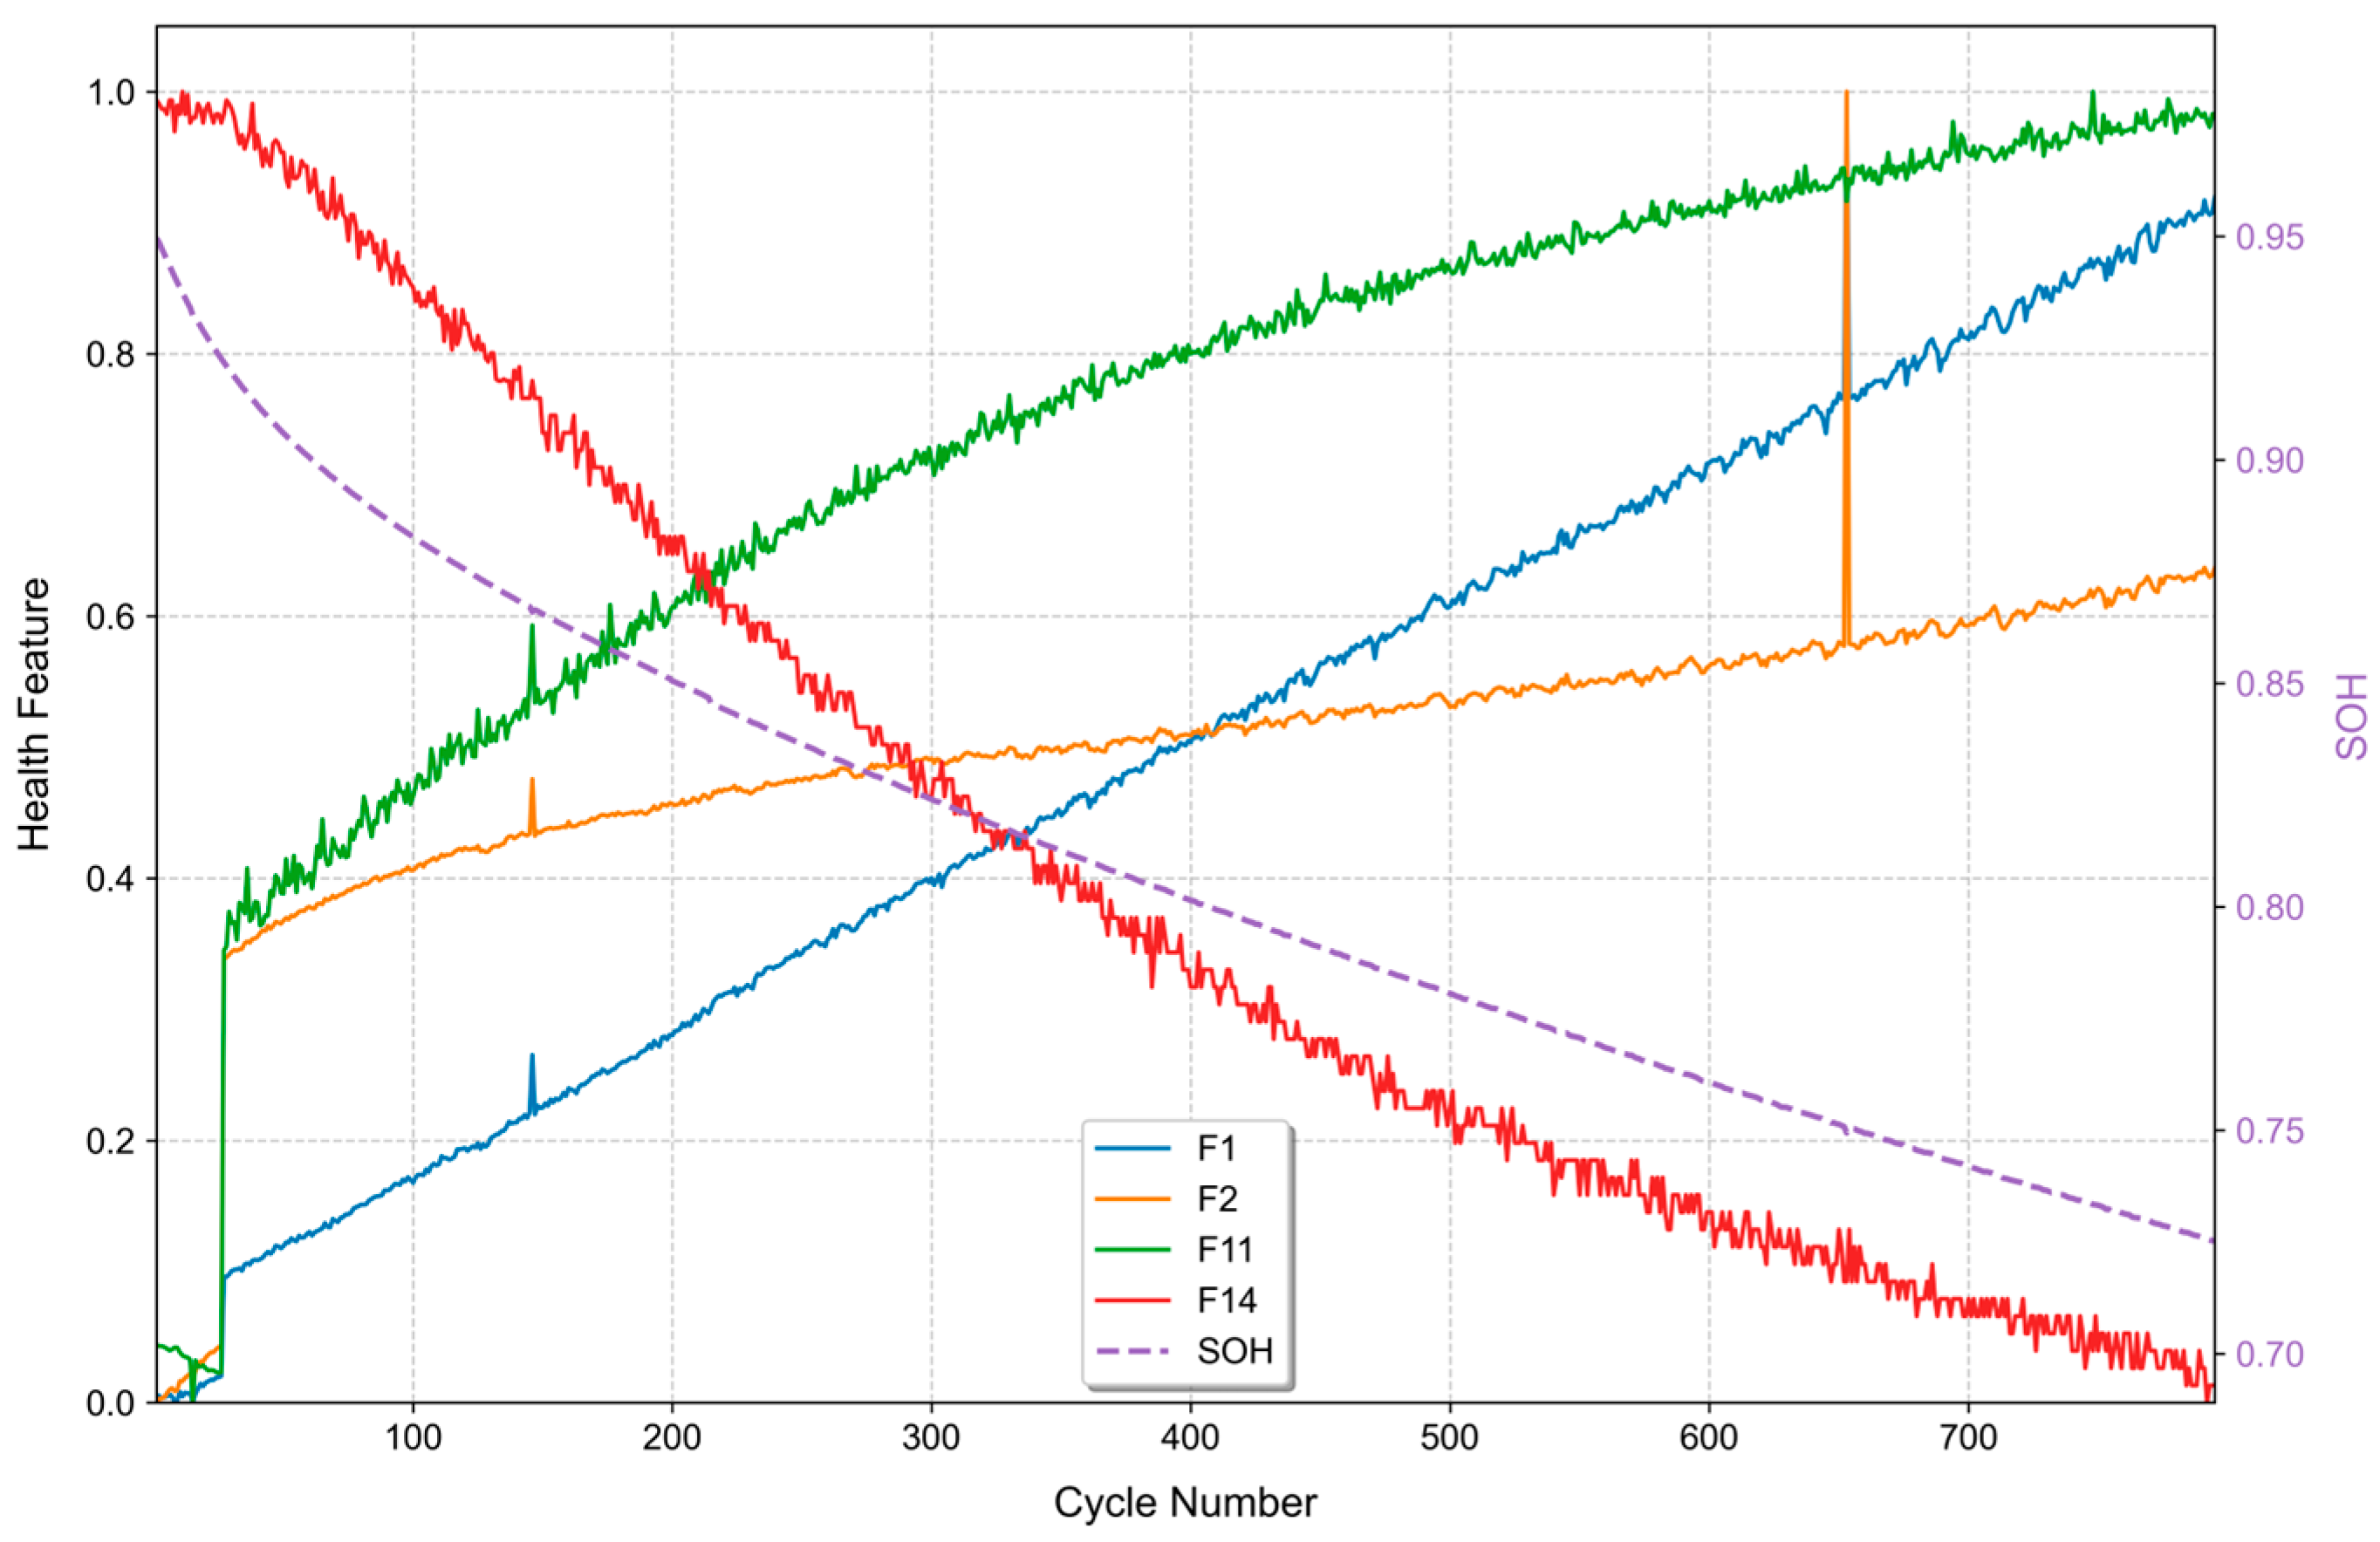
2.3. Health Feature Extraction and Analysis

Given the practical challenges in acquiring complete charging data from BMSs in real-world applications of LiBs, this study focuses on extracting local charging features that capture critical degradation patterns, specifically targeting the CV charging process and the voltage relaxation after charging. Since these phases are performed under more stable conditions and yield more complete data compared to the constant current (CC) charging process, they allow for a better representation that reflects both electrochemical dynamics and aging-induced variations crucial for SOH and RUL estimation.
For the CV charging process, which is particularly sensitive to changes in internal impedance and polarization, a comprehensive set of features is extracted. These features aim to capture subtle changes associated with degradation. As shown in Table 2, the extracted health features can be classified into three types: temporal and capacity features, statistical features, and derived features. Specifically, F1, F2, F3 correspond to the temporal and capacity features; F4, F5, F6, F7, F8, and F9 correspond to the statistical features; and others correspond to the derived features. Temporal and capacity features such as the charging time, capacity accumulated, and current termination value of the CV process. Statistical features are employed to quantify the current distribution and variability, encompassing the average, maximum, minimum, variance, and skewness of the CV current, as well as the standard deviation of current fluctuations. Furthermore, derived features reflecting the decay process itself are crucial. Therefore, we incorporate the average current decay rate (CDR), the maximum CDR, the initial CDR, and average current curvature (KI, avg). Collectively, these CV current features provide a multi-faceted representation of the electrochemical processes occurring as the battery approaches full charge under the CV process.
Post-charge voltage relaxation reveals the battery’s internal electrochemical state, reflecting equilibration processes like charge redistribution and side reactions. Changes in this relaxation behavior over time indicate degradation mechanisms such as electrolyte changes, SEI growth, or dendrite formation. Therefore, this study uses the voltage decay rate during relaxation as a key health feature. This complements information from CV charging, revealing impedance and degradation details potentially missed. Combining features from both the CV process and the voltage relaxation allows for robust health indicators derived from partial operational data.
To establish a robust and parsimonious input vector for the subsequent SOH estimation model, this study employed the Pearson correlation analysis method for feature selection [25]. The Pearson correlation coefficient (PCC) objectively quantifies the similarity between reference and comparison sequences. It is defined below:
r = i = 1 n ( x i x ¯ ) ( y i y ¯ ) i = 1 n ( x i x ¯ ) 2 i = 1 n ( y i y ¯ ) 2
where xi and yi are the two sequences, x ¯ and y ¯ are their respective means, n is the length of the sequence, r is a range of values from −1 to +1, where magnitudes close to 1 signify strong positive or negative linear correlations, respectively, and values near 0 indicate weak or no linear association.
The average results of PCC value analysis between the eight battery feature data selected in this paper and the SOH are shown in Figure 2, where the color intensity indicates the level of correlation between features and the SOH, the color intensity indicates the level of correlation between the features and the SOH. Notably, four specific features exhibited particularly strong correlations to the SOH: CVCT, CVCC, CDRmax, and Vrate, with absolute PCC values exceeding 0.7. The negative signs for CVCC and CDRmax indicate that these features tend to increase as SOH decreases, while the positive signs for CVCT and Vrate suggest they decrease with SOH degradation, both reflecting well-documented aging mechanisms. Consequently, CVCT, CVCC, CDRmax, and Vrate are selected as the most salient features for accurate SOH estimation.
As shown in Figure 2, CVCT exhibits a strong negative correlation with the SOH, with a correlation coefficient as high as −0.97. This correlation arises from the direct relationship between constant-voltage charging duration and battery degradation mechanisms. As battery SOH progressively declines, the thickening of the solid electrolyte interphase (SEI) and lithium plating layers increases internal impedance. This heightened impedance impedes lithium intercalation at the negative electrode, thereby reducing the current decay rate during the constant voltage phase. Consequently, more time is required to reach the cutoff current. Hence, CV duration consistently lengthens with decreasing SOH, demonstrating a significant negative correlation between CVCT and the SOH [26].
Following normalization of features from the NCM#19 battery within the Tongji Dataset, Figure 3 depicts the evolving trends of four selected health features relative to the SOH across charge–discharge cycles. The analysis reveals that CVCT, CVCC, and CDRmax exhibit negative correlations with the SOH, while Vrate shows a positive correlation. Among these features, CVCT demonstrates a notably strong correlation with the SOH, aligning closely with the PCC analysis results.

3. Methodology

3.1. CatBoost

In this work, CatBoost is utilized for battery SOH estimation. It is a gradient boosting decision tree (GBDT) variation noted for its effective handling of categorical features and minimization of information loss [27]. From a boosting perspective, it implements an ordered boosting strategy, an improvement on the standard gradient boosting procedure designed to counteract the prediction shift caused by target leakage, thereby enhancing model robustness and generalization. Regarding its handling of categorical data, CatBoost can effectively process categorical features. It utilizes techniques centered around ordered target statistics to convert these features into numerical representations prior to tree splitting, aiming to minimize information loss and circumvent the limitations of conventional encoding approaches.
CatBoost mitigates the overfitting tendencies common in GBDT by employing random permutations. During tree structure selection, random permutations of training instances are applied to ensure unbiased computation of terminal node values. Notably, CatBoost employs binary decision trees as base predictors, where splitting rules remain consistent across all nodes at the same depth. The final estimation result is formulated as an ensemble of these structured trees, expressed as:
Z = H ( x i ) = k = 1 K η h k ( x i ) = k = 1 K η j = 1 T k c j , k 1 { x i R j , k }
where K represents the number of trees, η represents the learning rate, h(xi) represents the estimation of the k-th tree.

3.2. SHAP

CatBoost, employed for battery SOH estimation, operates as a black-box model. It implicitly maps low-dimensional input features, based on their latent characteristics, into a high-dimensional space to perform classification or regression. While such models often achieve high accuracy and generalization, deriving an analytical formula relating inputs to outputs is typically infeasible. Furthermore, identifying which features drive model predictions remains challenging. This inherent lack of interpretability hinders the practical application of these advanced SOH estimation methods within battery management systems (BMSs) for energy storage. Therefore, this study utilizes the SHAP method to interpret the CatBoost model and quantify the influence of different health features on battery SOH.
SHAP is a methodology for interpreting black-box models, founded on principles from cooperative game theory [28]. It functions by evaluating model outputs for various combinations of input features. By comparing the changes in model output based on the presence or absence of a feature across these combinations, the average magnitude of this change indicates the feature’s importance. This process enables the quantification of each feature’s individual contribution to the prediction. SHAP posits that the model’s prediction for a specific instance can be decomposed into the sum of the Shapley values attributed to each input feature, represented as:
g ( z ) = φ 0 + j = 1 m φ j
where g(z) represents the model’s predicted output, φ0 is defined as the mean prediction across all training samples, and m denotes the total number of input features. Each φj corresponds to the Shapley value of the j-th feature, quantifying its contribution to the model’s output. The Shapley value φj for an input feature xj can be derived as:
φ ( x j ) = S N { x j } S ! ( N S 1 ) ! N ! ( f x ( S { x j } ) f x ( S ) )
where N{xj} represents the set of all possible input feature subsets excluding xj, Here, fx(S) denotes the model’s prediction based on the feature subset S, and fx(S∪{xj}) is the prediction when xj is added to S.

3.3. PSO-SVR

SVR, an adaptation of the support vector machine, is a prominent technique for estimating battery RUL [29]. This method is distinguished by its use of an insensitive loss function. SVR establishes a margin of tolerable deviation around the target function; predictions falling within this margin are not penalized, lending robustness to noise often present in battery measurements. The core objective is to find an optimal regression function that accurately fits data points lying outside this tolerance zone while controlling model complexity via regularization. Through the application of kernel functions, SVR effectively maps input features into high-dimensional spaces, enabling it to model the complex nonlinear degradation dynamics inherent in battery RUL estimation.
Support vector regression (SVR) approximates a linear function in a high-dimensional feature space by mapping input vectors xi through a nonlinear transformation ϕ(x). The objective of SVR is to derive a predicted output f(xi) such that it optimally approximates the target value yi. This function f(xi) is defined as:
y i = f ( x i ) = w × ϕ ( x i ) + b
where w and b denote the undetermined parameters.
The insensitive loss function can be expressed as [30]:
min 1 2 w 2 + C i = 1 l ξ i + ξ i * s . t . y i w ϕ ( x i ) b ( ε + ξ i ) y i + w ϕ ( x i ) + b ( ε + ξ i * ) , i = 1 , 2 , , n ξ i 0 , ξ i * 0
where ε is the threshold for the insensitive loss function, C is the penalty coefficient, and slack variables ξi and ξi* are the distances between actual values and the nearer boundary of ε.
SVR addresses nonlinear regression tasks using kernel functions. The Radial Basis Function (RBF) kernel is specifically adopted in this work to facilitate RUL [26] estimation:
K ( x i , x j ) = exp ( g x i x j 2 )
where g is the parameter of RBF.
Accurate RUL estimation using SVR critically depends on the appropriate tuning of its hyperparameters: C, ε, and g. PSO is utilized to identify the optimal combination of these parameters. PSO is a prevalent swarm intelligence algorithm mimicking collective foraging behaviors [31]. It operates with a population of particles, each representing a potential hyperparameter set, moving through the search space. Particles adjust their trajectories influenced by their individual best experiences and the swarm’s collective best experience, evaluated via a fitness function [32]. This dynamic optimization process, aiming to converge on the best SVR configuration, follows the update rules specified in Equations (10) and (11).
v i d k + 1 = ω v i d k + c 1 r 1 [ ( P b e s t ) i d k p i d k ] + c 2 r 2 [ ( G b e s t ) i d k p i d k ]
p i d k + 1 = p i d k + v i d k + 1
where i represents the particle index, k denotes the current iteration count, ω is the inertia weight coefficient, c1 and c2 represent the social acceleration coefficient, and r1 and r2 are random numbers in the range of [0, 1]. Pbest is the local best location of the particle so far; Gbest is the global optimal position of the particle swarm.

3.4. Proposed Method

This paper proposes a battery SOH and RUL estimation method, the specific steps of which are shown in Figure 4. Firstly, battery health features are extracted from the CV charging process and voltage relaxation data. Then, these features are divided into training and testing sets. For SOH estimation, Catboost is employed, and SHAP is used to analyze the contribution of different health features. Subsequently, for RUL estimation, an SVR model is utilized. PSO is applied to optimize the SVR’s parameters, iterating until an optimal parameter combination is obtained. Finally, the method outputs the SOH and RUL estimation results.

4. Experiment and Discussion

The performance of the SOH and RUL estimation method is assessed using accuracy metrics. Specifically, root mean square error (RMSE) and mean absolute error (MAE) are employed to evaluate the accuracy of the SOH estimations, and relative error (RE) is used for RUL estimations. The definitions for RMSE, MAE, and RE are provided in the following equations:
RMSE = 1 n i = 1 n ( y i y ^ i ) 2 × 100 %
MAE = 1 n i = 1 n y i y ^ i × 100 %
RE = R p r e d R t r u e R t r u e × 100 %
where yi represents the true SOH of the battery at the i-th cycle, y ^ i represents the SOH estimated by the model at the i-th cycle, and n is the total number of cycles. Rpred represents the estimated cycle number when the battery reaches the failure threshold, while Rtrue represents the actual cycle number when the battery reaches the failure threshold.

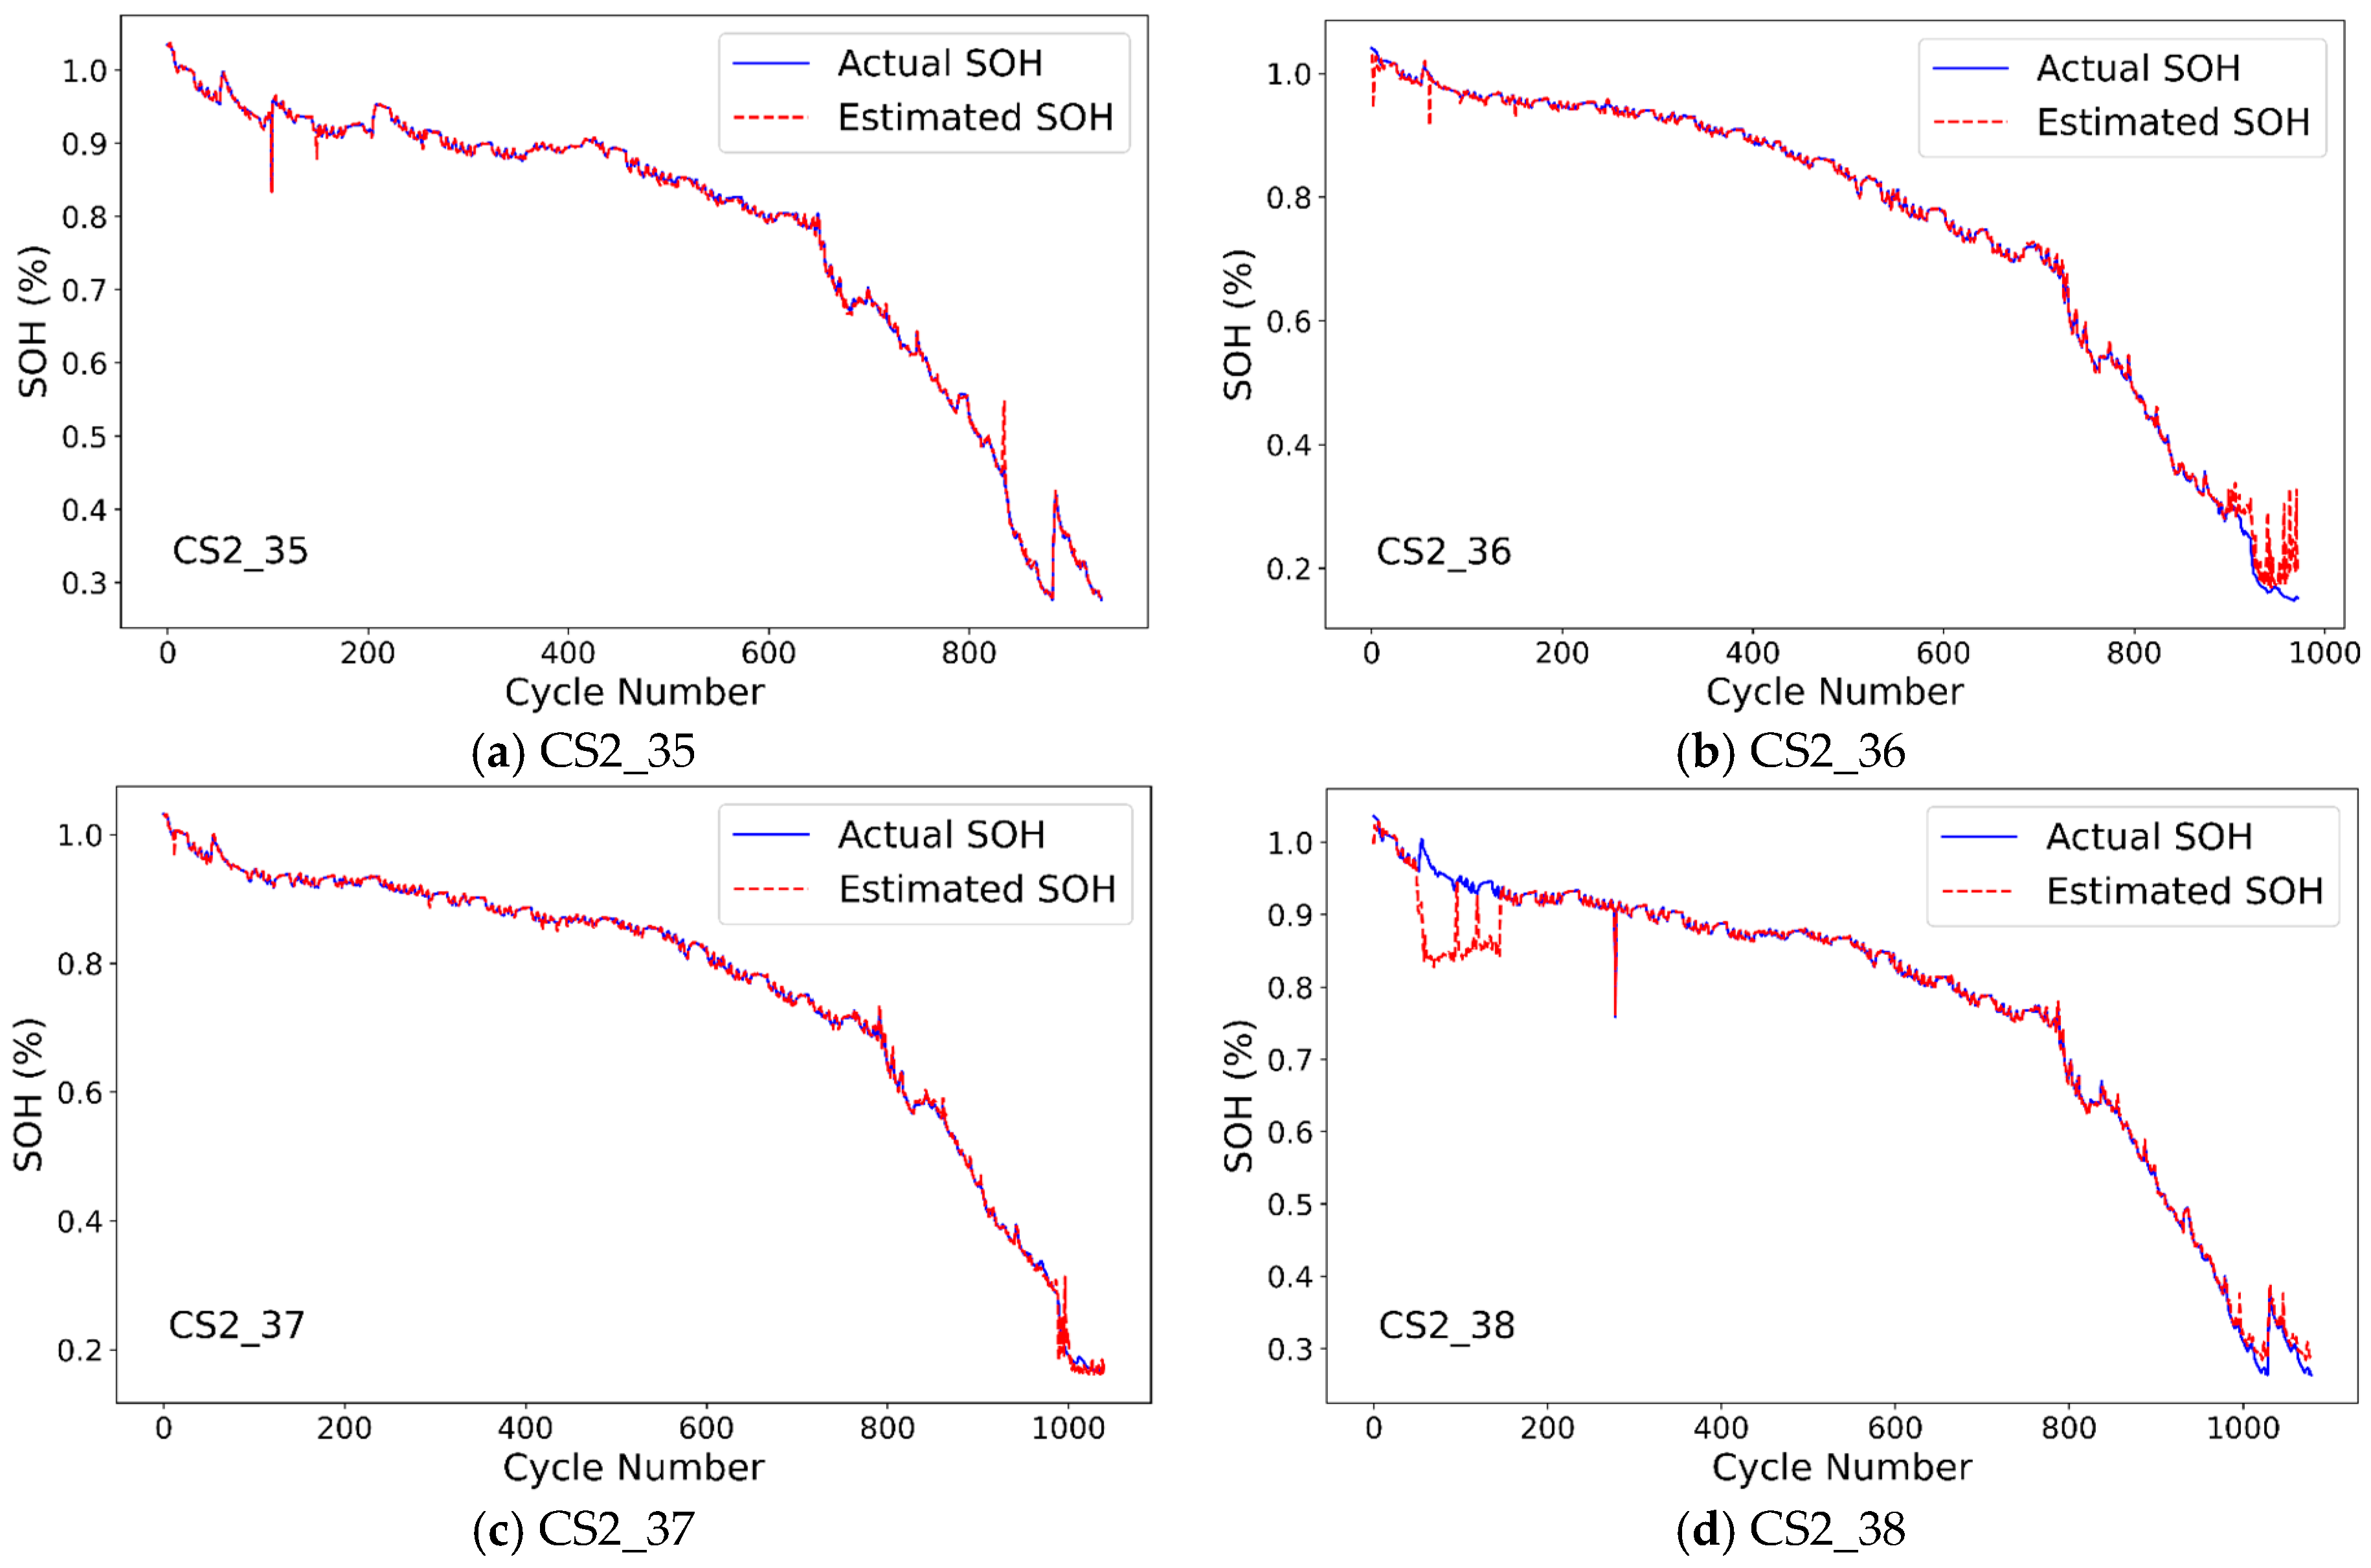
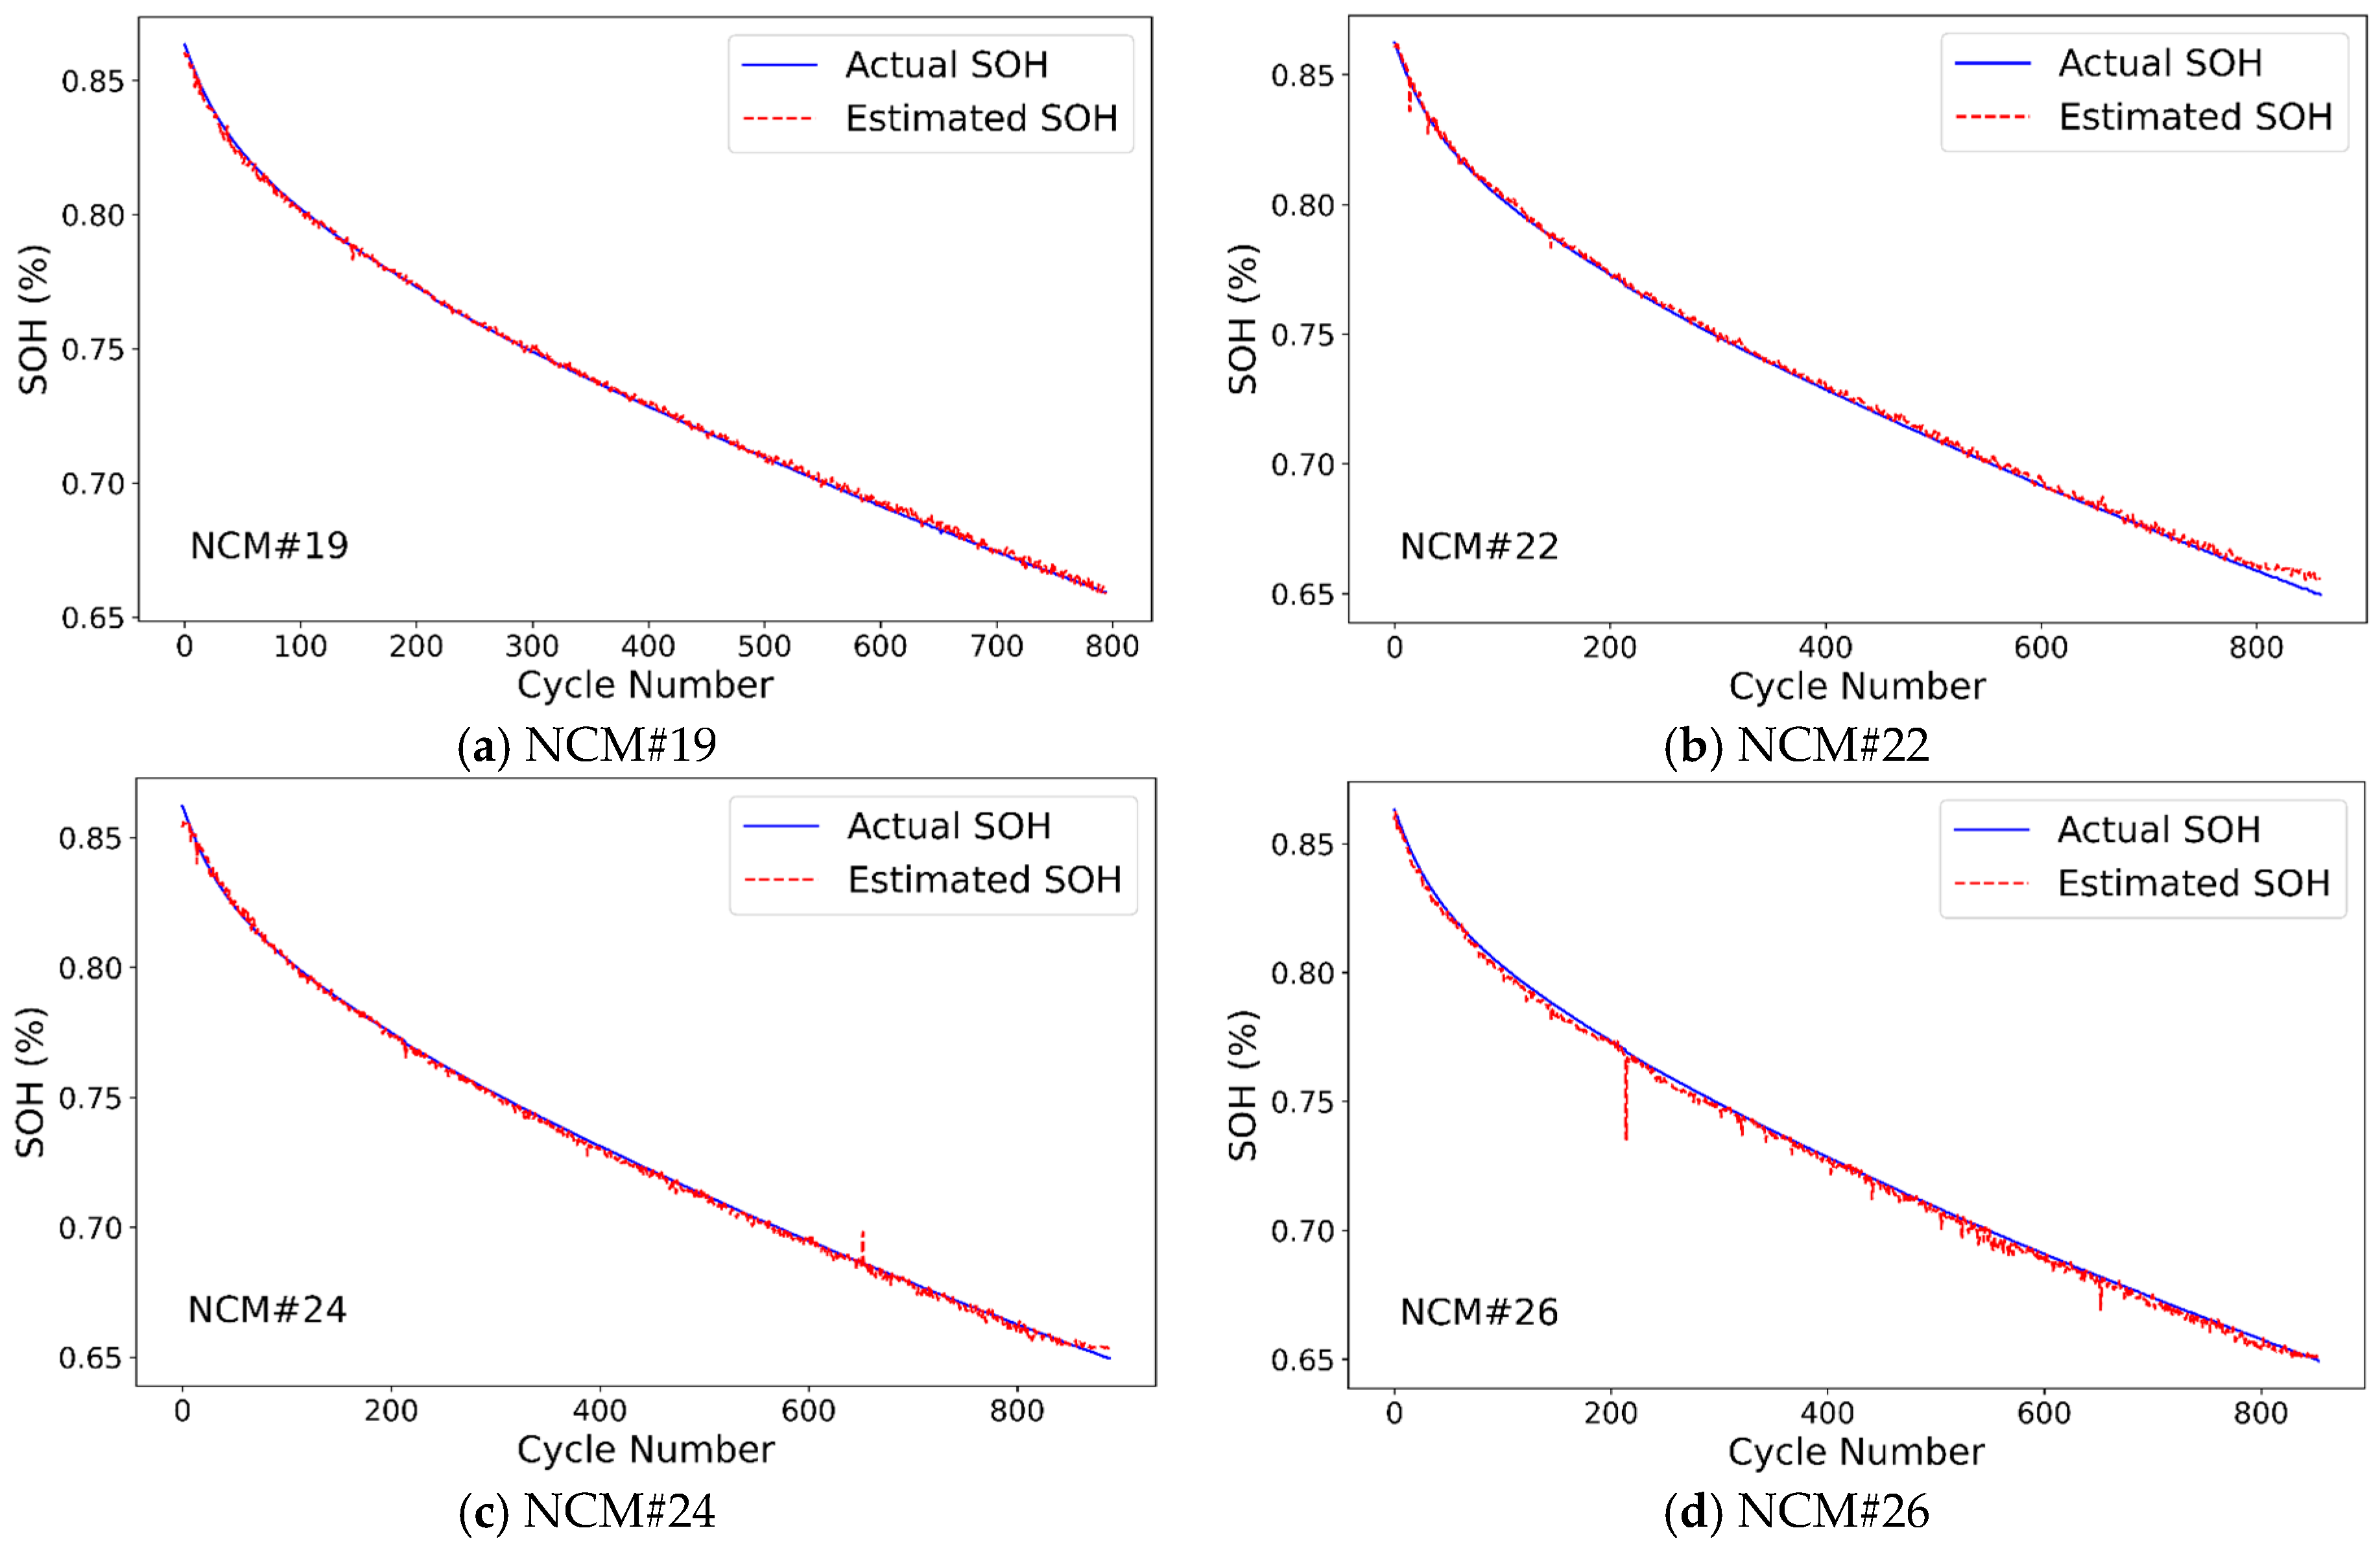
4.1. SOH Estimation Results

Experimental validation is performed separately on the CALCE and Tongji datasets for SOH estimation. A leave-one-out cross-validation (LOOCV) strategy is employed to generate training and validation sets. Specifically, in each iteration, data from one battery within the dataset served as the test set, while data from the remaining three batteries constituted the training set. This process is repeated four times, ensuring each battery’s data was used for testing, thereby completing a full cycle. Subsequently, health features are extracted from the constant voltage charging process and voltage relaxation data of the test battery. These features are then input into the trained CatBoost model to obtain the SOH estimation for that battery. SOH estimation results are shown in Figure 5 and Figure 6 below.
The proposed SOH estimation method is further compared with other models on the CALCE and Tongji datasets. Firstly, extracted health features are input into XGBoost, multilayer perceptron (MLP), and CatBoost models to estimate battery SOH. Second, common time-series deep learning models—recurrent neural network (RNN), LSTM, and gated recurrent unit (GRU)—are employed, using complete voltage curve data during charging process as input for SOH estimation. Finally, comparisons are made with several existing methods, such as Bayesian-LSTM [33], MC-LSTM [34], Transformer [35], and TCN [36]. All the models undergo five randomized runs, and the average RMSE and MAE were calculated. The estimation results on the CALCE and Tongji battery datasets are presented in Table 3 and Table 4, respectively.
The proposed method achieves competitive results, as detailed in Table 3 and Table 4. It achieves an average RMSE and MAE of merely 1.42% and 0.52%, respectively, on the CALCE dataset, and 0.21% and 0.16% on the Tongji dataset. This represents over 40% accuracy improvement compared to temporal deep learning models. When benchmarked against conventional RNN, GRU, and LSTM models that directly use complete charging voltage curve data as input, our method maintains comparable accuracy while offering enhanced interpretability and practical applicability through partial charging curve feature extraction. These findings substantiate that high-quality health features enable more sensitive capture of curve variations under limited battery data conditions, making it particularly suitable for battery SOH estimation.
Furthermore, considering the constrained computational resources in BMSs, we established a LiB health assessment platform using an Intel Xeon Silver 4210 processor to evaluate algorithm deployability. The SOH estimation methods are implemented through the PyTorch 1.12.1 framework, with single-cycle computation times detailed in Table 3 and Table 4, respectively. Experimental results demonstrate that temporal deep learning models necessitate significant computational resources for both training and inference, resulting in a 23% lower computational efficiency compared to our proposed method. This characteristic limits their widespread adoption in resource-constrained environments.

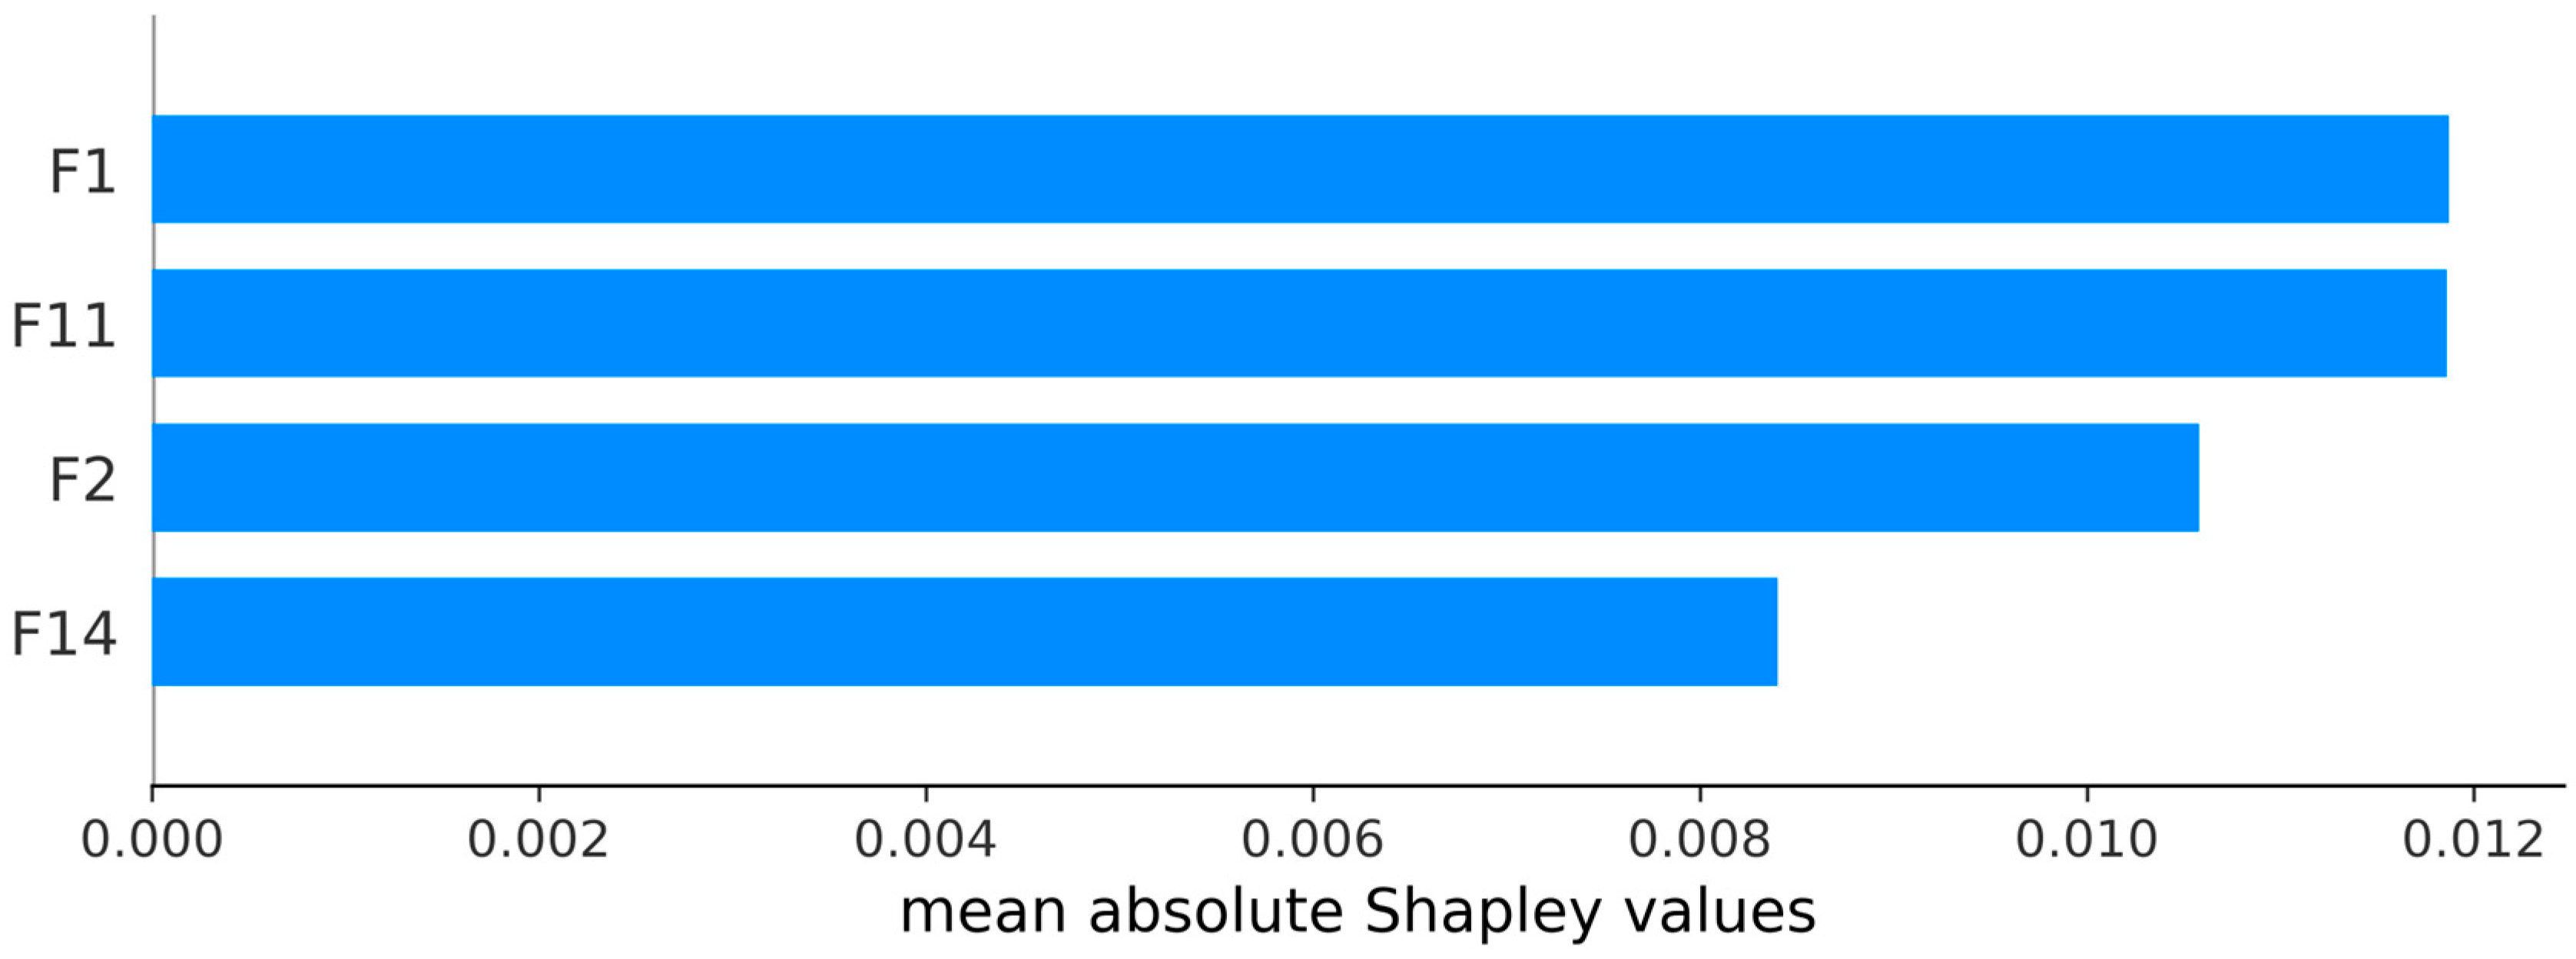
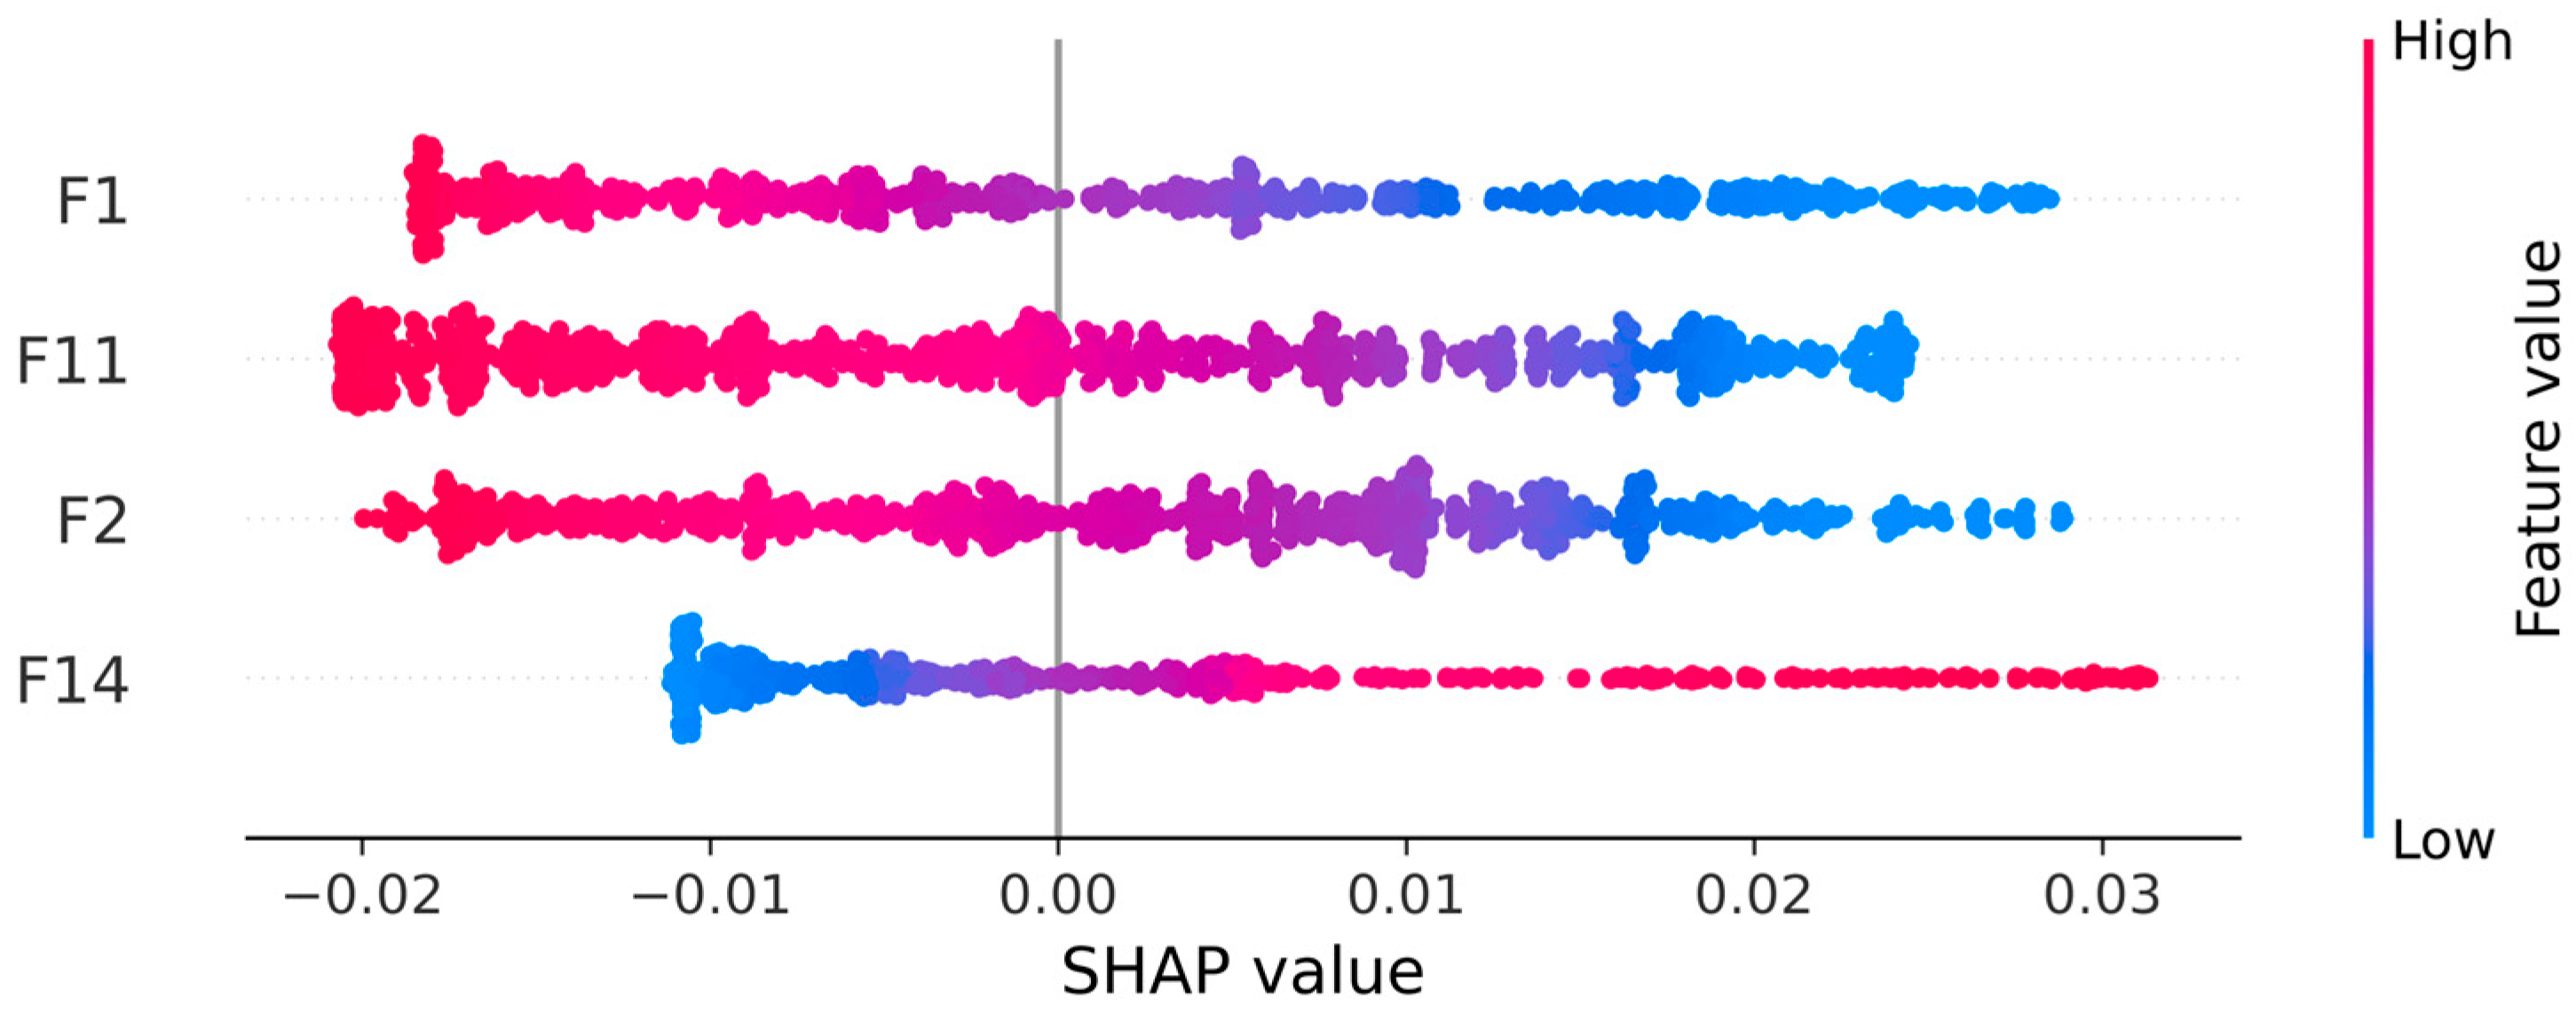
4.2. Interpretability Analysis

To investigate the extent to which health features influence battery SOH estimation results, this study employs the SHAP method to analyze the CatBoost model. The Shapley values of all features are calculated, and the mean absolute Shapley values within each feature category are derived to quantify their relative contributions to SOH estimation. As shown in Figure 7, the mean Shapley values reveal four key health features impacting the battery SOH: F1 (CVCT), F2 (CVCC), F11 (CDRmax), and F14 (Vrate).
Figure 7 presents the feature importance ranking through mean absolute SHAP values, demonstrating the relative contribution of each health feature to the SOH estimation model. Among these, CVCT exhibits the highest impact, followed by CDRmax, while Vrate and CVCC contribute marginally. This result underscores the primary importance of CV charging process characteristics, specifically the constant voltage charging time, in the model’s SOH estimation.
Subsequently, a SHAP summary plot, shown in Figure 8, visualizes the distribution and contribution of Shapley values across these key features. Each point represents a single observation, with its horizontal position indicating the Shapley value’s magnitude and sign and its color representing the feature’s value. This plot reveals the directional impact of each feature. Specifically, for CVCT, CVCC, and CDRmax, higher feature values tend to correspond to negative Shapley values. These features signify a negative impact on the SOH estimation. In contrast, Vrate exhibits a positive impact: higher feature values correlate with positive Shapley values, leading to a higher estimated SOH. This detailed visualization moves beyond simple feature ranking to elucidate the nonlinear relationships and directional impacts learned by the CatBoost model, thereby enhancing the interpretability and trustworthiness of the SOH estimation.
Considering the significant impact of the CVCT feature on the SOH estimation, we plot the dependence of the CV charging time on the model output. Figure 9 demonstrates that when the CV charging time increases, its negative impact on the battery SOH output increases. The relationship exhibits a monotonically decreasing trend across the range of feature values, highlighting the uniformity with which increasing constant voltage charging time is interpreted by the model as an indicator of lower battery health.
To further quantify the impact of CVCT on model prediction accuracy, we conducted an ablation study. We evaluated the SOH prediction performance of three model configurations—F1 + CatBoost, F2 + F11 + F14 + CatBoost, and F1 + F2 + F11 + F14 + CatBoost—across two distinct battery datasets. The results are presented in Table 5:
It can be observed that although health feature F1 exhibits strong overall correlation with the SOH, the inherent variations in battery format and chemistry lead to reduced prediction stability in models relying solely on F1. This instability results in over 60% performance degradation compared to models utilizing all four health features. Similarly, when excluding F1 and employing the remaining three health features as model inputs, predictive performance declines by more than 30%. These findings demonstrate that all four health feature groups contribute substantially to model prediction accuracy, enabling the maintenance of high-precision SOH estimation.

4.3. Features Effectiveness Analysis

To evaluate the effectiveness and information representativeness of the partial charging data features extracted in this study, we employ both the extracted features and the complete raw charging voltage data as inputs of the CatBoost, XGBoost, and MLP models. The validation performance on the CALCE and Tongji datasets is presented in Table 6.
As shown in Table 6, the use of health features extracted in this study as model inputs improves prediction accuracy across various machine learning models compared to using complete voltage profiles while simultaneously reducing prediction time. This enhancement occurs because complete voltage profiles contain substantial temporal details, including minor fluctuations and sensor noise, which interfere with predictions. Moreover, the high dimensionality of complete voltage data significantly increases model parameter quantity, elevates convergence difficulty, and consequently prolongs prediction time. These experimental results indicate that the prediction accuracy improvement derives not only from specific machine learning algorithms but also from high-quality features obtained through the feature extraction strategy.
Furthermore, while existing studies have utilized partial charging or discharging data for battery SOH prediction, this work demonstrates the effectiveness of the proposed method through systematic comparisons with established methods [33,37] employing partial charging/discharging data. The evaluation was conducted using Cells CS2_35 to CS2_38 from the CALCE dataset, with comparative results detailed in Table 7.
Compared to the method proposed by Zhang et al. [37] that extracts features from partial discharge curves, our approach achieves comparable prediction accuracy. However, this method relies heavily on discharge processes, which in practical applications introduces uncertainty due to load variations. This makes it difficult to obtain constant-current discharge data comparable to the controlled conditions in the CALCE dataset, limiting its real-world applicability. Compared with Wang et al.’s method [33] that similarly extracts features from partial charging processes, our approach demonstrates significantly lower RMSE and MAE, indicating improved prediction accuracy. Overall, the proposed method offers enhanced effectiveness and broader applicability compared to existing SOH prediction techniques based on partial charging/discharging data.

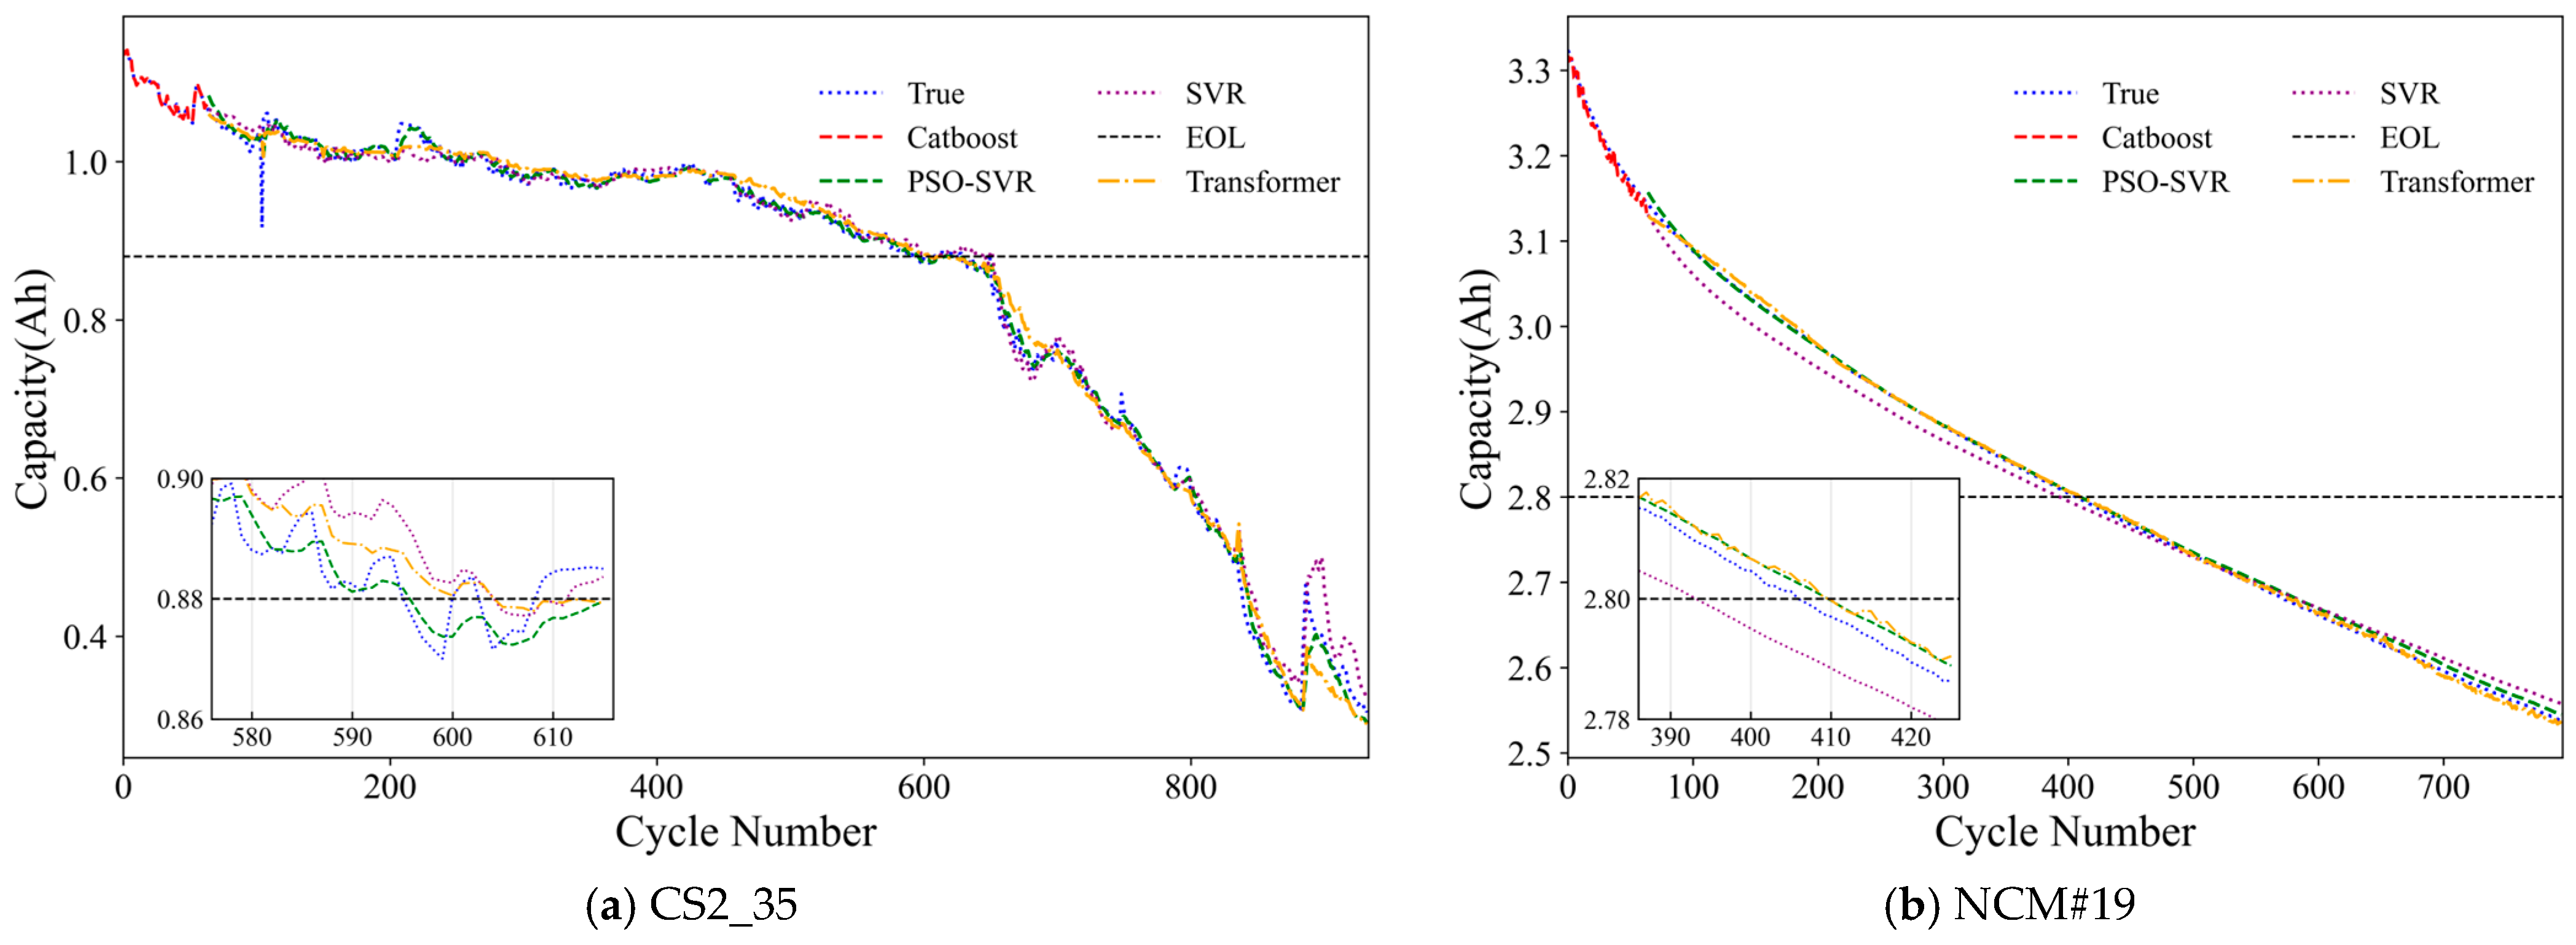
4.4. RUL Estimation Results

To validate the effectiveness of the proposed PSO-SVR method, RUL estimations are performed using the CALCE and Tongji datasets. Figure 10 illustrates partial results of these estimates and compares the performance of the proposed PSO-SVR method with the standard SVR method and the Transformer method [35]. The results demonstrate that the PSO-SVR method effectively captures the capacity degradation trends, enabling accurate estimation of the battery’s RUL by reliably forecasting its capacity at subsequent cycles. For both the CS2_35 and NCM#19 battery datasets, the PSO-SVR estimations exhibit superior alignment with the true capacity trajectory throughout the operational lifespan, particularly in tracking EOL points. Notably, the integration of PSO with SVR significantly enhances estimation accuracy compared to conventional SVR implementations, as evidenced by the reduced error between predicted and measured capacities. Compared with the mainstream Transformer prediction model, Figure 10 demonstrates that both methods achieve comparable prediction accuracy, with the proposed method exhibiting slight but consistent superiority. Crucially, the parameter count of our approach is substantially lower than that of the Transformer, thereby reducing hardware constraints for real-world engineering deployment and better aligning with practical application requirements. This enhanced accuracy, particularly noticeable in the magnified inset regions showing performance near the failure threshold, confirms that the PSO parameter optimization significantly improves the model’s capability to forecast battery RUL reliably.
Further quantitative evaluation of the PSO-SVR method’s performance is presented in Table 8 and Table 9, which detail the RUL estimation results for individual batteries within the CALCE and Tongji datasets. The selection of cycles 64 and 128 as representative points stems from considerations of practical data availability. In many real-world applications, factors such as data storage expenses and the specific focus of battery trend analysis dictate the extent of data collected. It is common for datasets to encompass approximately 50–150 charge–discharge cycles. Cycles 64 and 128 were chosen as they are well-situated within this frequently encountered range, allowing us to demonstrate relevant trends using practically accessible data points. For the CALCE dataset, the RE between the predicted RUL and the true RUL is consistently low, with mean RE values of 0.58% and 0.50% for estimations starting at cycle 64 and cycle 128, respectively. Similarly, for the Tongji dataset, the PSO-SVR method demonstrates strong predictive capability. While the maximum of RE reaches up to 3.3%, the mean RE remains contained at 1.865% and 1.8025% for the cycle 64 and cycle 128 start points. These results highlight the model’s ability to deliver high RUL prediction accuracy across different battery chemistries and degradation patterns. Moreover, the consistent performance across different starting points further substantiates the robustness and practical applicability of the proposed PSO-SVR approach for battery health prognostics.

5. Conclusions

Addressing the practical limitations of conventional battery state estimation, this paper introduces an efficient hybrid framework for lithium-ion battery SOH and RUL assessment using partial charging data. We demonstrate that features extracted exclusively from the CV charging process and voltage relaxation are enough for accurate estimation; these features include CVCT, CVCC, CDRmax, and Vrate, whose relevance to degradation was identified and validated through Pearson correlation and SHAP analysis. This circumvents the requirement for complete cycling data. The proposed architecture combining CatBoost for SOH estimation and PSO-SVR for RUL prediction achieves notable accuracy. SOH estimation errors remained low with an RMSE below 1.42% and an MAE below 0.52%, while RUL RE was under 1.87%. This represents a substantial improvement of over forty percent in SOH accuracy and reduced computational cost compared to existing methods. The use of SHAP enhances model transparency by quantifying feature contributions. In summary, this work presents a robust, accurate, and computationally efficient method poised for integration into practical BMSs, particularly in electric vehicles and grid storage. It should be noted that this paper only verifies the applicability and effectiveness of this method for two batteries, and the applicability of sodium batteries for other types of batteries, such as solid-state batteries, needs to be further studied. The influence of heat generated during battery charge–discharge cycling on SOH, along with validation across broader operating conditions and investigation into real-time embedded applications, constitutes key focal points for future research.

Author Contributions

Conceptualization, K.Q. and Y.L.; methodology, K.Q.; software, Y.L.; validation, K.Q. and Z.L.; resources, K.C. and K.Q.; writing—original draft preparation, Q.Z.; writing—review and editing, K.C. and Z.L.; supervision, K.Q.; project administration, Q.Z.; funding acquisition, Y.L. All authors have read and agreed to the published version of the manuscript.

Funding

This work is supported by Science and Technology Project Funding of State Grid Jiangsu Electric Power Co., Ltd. (J2024015).

Data Availability Statement

The original contributions presented in the study are included in the article, further inquiries can be directed to the corresponding author.

Conflicts of Interest

Authors Kejun Qian, Yafei Li, and Qiheng Zou were employed by the State Grid Suzhou Power Supply Company. The remaining authors declare that the research was conducted in the absence of any commercial or financial relationships that could be construed as a potential conflict of interest. The authors declare that this study received funding from State Grid Jiangsu Electric Power Co., Ltd. The funder was not involved in the study design, collection, analysis, interpretation of data, the writing of this article, or the decision to submit it for publication.

References

  1. Wang, S.; Jin, S.; Deng, D.; Fernandez, C. A Critical Review of Online Battery Remaining Useful Lifetime Prediction Methods. Front. Mech. Eng. 2021, 7, 719718. [Google Scholar] [CrossRef]
  2. Kim, J.; Chun, H.; Kim, M.; Han, S.; Lee, J.W.; Lee, T.K. Effective and practical parameters of electrochemical Li-ion battery models for degradation diagnosis. J. Energy Storage 2021, 42, 103077. [Google Scholar] [CrossRef]
  3. Ma, Y.; Yao, M.; Liu, H.; Tang, Z. State of health estimation and remaining useful life prediction for lithium-ion batteries by improved particle swarm optimization-back propagation neural network. J. Energy Storage 2022, 52, 104750. [Google Scholar] [CrossRef]
  4. Hallemans, N.; Widanage, W.D.; Zhu, X.; Moharana, S.; Rashid, M.; Hubin, A.; Lataire, J. Operando electrochemical impedance spectroscopy and its application to commercial Li-ion batteries. J. Power Sources 2022, 547, 2322005. [Google Scholar] [CrossRef]
  5. Liu, Z.; Zhao, Z.; Qiu, Y.; Jing, B.; Yang, C. State of charge estimation for Li-ion batteries based on iterative Kalman filter with adaptive maximum correntropy criterion. J. Power Sources 2023, 580, 233282. [Google Scholar] [CrossRef]
  6. Song, Z.; Hou, J.; Li, X.; Wu, X.; Hu, X.; Hofmann, H.; Sun, J. The sequential algorithm for combined state of charge and state of health estimation of lithium-ion battery based on active current injection. Energy 2020, 193, 116732. [Google Scholar] [CrossRef]
  7. Li, J.; Adewuyi, K.; Lotfi, N.; Landers, R.G.; Park, J. A single particle model with chemical/mechanical degradation physics for lithium ion battery State of Health (SOH) estimation. Appl. Energy 2018, 212, 1178–1190. [Google Scholar] [CrossRef]
  8. Sangiri, J.B.; Kulshreshtha, T.; Ghosh, S.; Maiti, S.; Chakraborty, C. A novel methodology to estimate the state-of-health and remaining-useful-life of a Li-ion battery using discrete Fourier transformation. J. Energy Storage 2022, 46, 103849. [Google Scholar] [CrossRef]
  9. Hu, X.; Li, S.; Peng, H. A comparative study of equivalent circuit models for Li-ion batteries. J. Power Sources 2012, 198, 359–367. [Google Scholar] [CrossRef]
  10. Wang, Y.; Yang, D.; Zhang, X.; Chen, Z. Probability based remaining capacity estimation using data-driven and neural network model. J. Power Sources 2016, 315, 199–208. [Google Scholar] [CrossRef]
  11. Wang, D.; Miao, Q.; Pecht, M. Prognostics of lithium-ion batteries based on relevance vectors and a conditional three-parameter capacity degradation model. J. Power Sources 2013, 239, 253–264. [Google Scholar] [CrossRef]
  12. Li, Y.; Liu, K.; Foley, A.M.; Berecibar, M.; Nanini-Maury, E.; van Mierlo, J.; Hoster, H.E. Data-driven health estimation and lifetime prediction of lithium-ion batteries: A review. Renew. Sustain. Energy Rev. 2019, 113, 109254. [Google Scholar] [CrossRef]
  13. Chen, B.; Liu, Y.; Xiao, B. A novel hybrid neural network-based SOH and RUL estimation method for lithium-ion batteries. J. Energy Storage 2024, 98, 113074. [Google Scholar] [CrossRef]
  14. Tang, R.; Zhang, P.; Ning, S.; Zhang, Y. Prediction of battery SOH and RUL based on cooperative characteristics in voltage-temperature-time dimensions. J. Electrochem. Soc. 2023, 170, 060535. [Google Scholar] [CrossRef]
  15. Duan, W.; Song, S.; Xiao, F.; Chen, Y.; Peng, S.; Song, C. Battery SOH estimation and RUL prediction framework based on variable forgetting factor online sequential extreme learning machine and particle filter. J. Energy Storage 2023, 65, 107322. [Google Scholar] [CrossRef]
  16. Cai, N.; Que, X.; Zhang, X.; Feng, W.; Zhou, Y. A deep learning framework for the joint prediction of the SOH and RUL of lithium-ion batteries based on bimodal images. Energy 2024, 302, 131700. [Google Scholar] [CrossRef]
  17. Zhang, M.; Yin, J.; Chen, W. SOH estimation and RUL prediction of lithium batteries based on multidomain feature fusion and CatBoost model. Energy Sci. Eng. 2023, 11, 3082–3101. [Google Scholar] [CrossRef]
  18. Li, X.; Yuan, C.; Wang, Z.; He, J.; Yu, S. Lithium battery state-of-health estimation and remaining useful lifetime prediction based on non-parametric aging model and particle filter algorithm. Etransportation 2022, 11, 100156. [Google Scholar] [CrossRef]
  19. Gao, R.; Zhang, Y.; Lyu, Z. A SOH estimation method of lithium-ion batteries based on partial charging data. J. Energy Storage 2024, 103, 114309. [Google Scholar] [CrossRef]
  20. Zhang, C.; Luo, L.; Yang, Z.; Du, B.; Zhou, Z.; Wu, J.; Chen, L. Flexible method for estimating the state of health of lithium-ion batteries using partial charging segments. Energy 2024, 295, 131009. [Google Scholar] [CrossRef]
  21. Jia, J.; Liang, J.; Shi, Y.; Wen, J.; Pang, X.; Zeng, J. SOH and RUL prediction of lithium-ion batteries based on Gaussian process regression with indirect health indicators. Energies 2020, 13, 375. [Google Scholar] [CrossRef]
  22. Liu, Y.; Wang, L.; Li, D.; Wang, K. State-of-health estimation of lithium-ion batteries based on electrochemical impedance spectroscopy: A review. Prot. Control Mod. Power Syst. 2023, 8, 1–17. [Google Scholar] [CrossRef]
  23. Williard, N.; He, W.; Osterman, M.; Pecht, M. Comparative analysis of features for determining state of health in lithium-ion batteries. Int. J. Progn. Health Manag. 2020, 4, 20–27. [Google Scholar] [CrossRef]
  24. Zhu, J.; Wang, Y.; Huang, Y.; Bhushan Gopaluni, R.; Cao, Y.; Heere, M.; Mühlbauer, M.J.; Mereacre, L.; Dai, H.; Liu, X.; et al. Data-driven capacity estimation of commercial lithium-ion batteries from voltage relaxation. Nat. Commun. 2022, 13, 2261. [Google Scholar] [CrossRef]
  25. Zhou, Y.; Huang, M.; Chen, Y.; Tao, Y. A novel health indicator for on-line lithium-ion batteries remaining useful life prediction. J. Power Sources 2016, 321, 1–10. [Google Scholar] [CrossRef]
  26. Yang, D.; Zhang, X.; Pan, R.; Wang, Y.; Chen, Z. A novel Gaussian process regression model for state-of-health estimation of lithium-ion battery using charging curve. J. Power Sources 2018, 384, 387–395. [Google Scholar] [CrossRef]
  27. Prokhorenkova, L.; Gusev, G.; Vorobev, A.; Dorogush, A.V.; Gulin, A. CatBoost: Unbiased boosting with categorical features. Adv. Neural Inf. Process. Syst. 2018, 31, 6638–6648. [Google Scholar]
  28. Lin, B.; Bai, R. Machine learning approaches for explaining determinants of the debt financing in heavy-polluting enterprises. Financ. Res. Lett. 2022, 44, 102094. [Google Scholar] [CrossRef]
  29. Yang, Z.; Wang, Y.; Kong, C. Remaining useful life prediction of lithium-ion batteries based on a mixture of ensemble empirical mode decomposition and GWO-SVR model. IEEE Trans. Instrum. Meas. 2021, 70, 2517011. [Google Scholar] [CrossRef]
  30. Drucker, H.; Burges, C.J.; Kaufman, L.; Smola, A.; Vapnik, V. Support vector regression machines. Adv. Neural Inf. Process. Syst. 1996, 9, 155–161. [Google Scholar]
  31. Eberhart, R.; Kennedy, J. Particle swarm optimization. In Proceedings of the IEEE International Conference on Neural Networks, Perth, WA, Australia, 27 November–1 December 1995; Volume 4, pp. 1942–1948. [Google Scholar]
  32. Long, B.; Xian, W.; Jiang, L.; Liu, Z. An improved autoregressive model by particle swarm optimization for prognostics of lithium-ion batteries. Microelectron. Reliab. 2013, 53, 821–831. [Google Scholar] [CrossRef]
  33. Meng, H.; Geng, M.; Han, T. Long short-term memory network with Bayesian optimization for health prognostics of lithium-ion batteries based on partial incremental capacity analysis. Reliab. Eng. Syst. Saf. 2023, 236, 109288. [Google Scholar] [CrossRef]
  34. Choi, Y.; Ryu, S.; Park, K.; Kim, H. Machine learning-based lithium-ion battery capacity estimation exploiting multi-channel charging profiles. IEEE Access 2019, 7, 75143–75152. [Google Scholar] [CrossRef]
  35. Luo, K.; Zheng, H.; Shi, Z. A simple feature extraction method for estimating the whole life cycle state of health of lithium-ion batteries using transformer-based neural network. J. Power Sources 2023, 576, 233139. [Google Scholar] [CrossRef]
  36. Zhang, D.; Zhao, W.; Wang, L.; Chang, X.; Li, X.; Wu, P. Evaluation of the state of health of lithium-ion battery based on the temporal convolution network. Front. Energy Res. 2022, 10, 929235. [Google Scholar] [CrossRef]
  37. He, S.; Qin, W.; Yun, Z.; Wu, C.; Sun, C. SOH Estimation Method for Lithium-Ion Batteries Using Partial Discharge Curves Based on CGKAN. Batteries 2025, 11, 167. [Google Scholar] [CrossRef]
Figure 1. Capacity degradation curves of LiBs in the two datasets.
Energies 18 03248 g001
Figure 2. PCC matrix of health features and the SOH.
Energies 18 03248 g002
Figure 3. Trends in health characteristics and the SOH.
Energies 18 03248 g003
Figure 4. Battery SOH and RUL estimation flowchart.
Energies 18 03248 g004
Figure 5. SOH estimation results for the CALCE dataset.
Energies 18 03248 g005
Figure 6. SOH estimation results for the Tongji dataset.
Energies 18 03248 g006
Figure 7. The mean Shapley value of health features.
Energies 18 03248 g007
Figure 8. Global explanation of the model via SHAP.
Energies 18 03248 g008
Figure 9. Impact of the CVCT on the model output.
Energies 18 03248 g009
Figure 10. RUL estimation results by PSO-SVR and SVR.
Energies 18 03248 g010
Table 1. Battery dataset information.
DatasetBattery NumberAmbient
Temperature
Charge Cut-Off VoltageDischarge Cut-Off VoltageConstant Current Charging CurrentConstant Current Discharge Current
CALCECS2_3524 °C4.2 V2.7 V0.55 A1.1 A
CS2_3624 °C4.2 V2.7 V0.55 A1.1 A
CS2_3724 °C4.2 V2.7 V0.55 A1.1 A
CS2_3824 °C4.2 V2.7 V0.55 A1.1 A
TongjiNCM#1945 °C4.2 V2.5 V1.75 A3.5 A
NCM#2245 °C4.2 V2.5 V1.75 A3.5 A
NCM#2445 °C4.2 V2.5 V1.75 A3.5 A
NCM#2645 °C4.2 V2.5 V1.75 A3.5 A
Table 2. Detailed information on health features.
No.NameDefinitionNo.NameDefinition
F1CVCTCV charging timeF2CVCCCV charging capacity
F3IendCurrent termination value in CV processF4Iavgaverage of CV charging current
F5ImaxMaximum CV charging currentF6IminMinimum CV charging current
F7Ivariance 1 n i = 1 n ( I i μ I ) 2 F8Iskewness 1 n i = 1 n ( I i μ I ) 3 σ I 3
F9ISD 1 n 1 i = 1 n 1 ( Δ I i μ Δ I ) 2 F10CDRavg 1 n i = 1 n I i + 1 I i Δ t
F11CDRmaxMaximum decay rate of CV charging currentF12CDRinitInitial decay rate of CV charging current
F13KI, avg 1 n i = 2 n 1 ( I i + 1 2 I i + I i 1 ) / ( Δ t ) 2 1 + ( I i + 1 I i 1 ) / 2 Δ t 2 3 / 2 F14Vrate V i n i t V e n d T
I i is the current at the i-th sampling point, n is the total sampling point in the CV process, μ I is the average current in the CV process, σ I is the standard deviation of the current in the CV process, Δ I i is the current difference between adjacent sampling points, μ Δ I is the average Δ I i sequence, T is the total relaxation time, and Vinit and Vend are the initial and final voltages during relaxation.
Table 3. SOH estimation results comparison for the CALCE dataset.
SOH Estimation MethodRMSE (%)MAE (%)Time (s)
Health feature + CatBoost (ours)1.420.520.00319
Health feature + XGBoost2.471.320.00551
Health feature + MLP2.531.430.00735
Complete voltage curve data + RNN2.771.350.02497
Complete voltage curve data + GRU2.671.410.10013
Complete voltage curve data + LSTM2.861.560.12075
Bayesian-LSTM2.701.990.12268
MC-LSTM2.512.310.17521
Transformer2.461.410.0655
TCN2.471.641.06052
Table 4. SOH estimation results comparison for the Tongji dataset.
SOH Estimation MethodRMSE (%)MAE (%)Time (s)
Health feature + CatBoost (ours)0.210.160.00323
Health feature + XGBoost0.240.170.00562
Health feature + MLP0.730.490.00747
Complete voltage curve data + RNN0.690.420.02501
Complete voltage curve data + GRU0.550.350.10030
Complete voltage curve data + LSTM0.580.330.12093
Bayesian-LSTM0.530.360.12283
MC-LSTM0.790.460.17503
Transformer0.530.320.06588
TCN0.570.331.06063
Table 5. Model predictions under the given inputs.
DatasetSOH Estimation MethodRMSE (%)MAE (%)
CALCEF1 + CatBoost2.361.24
F2, F11, F14 + CatBoost2.131.08
F1, F2, F11, F14 + CatBoost1.420.52
TongjiF1 + CatBoost0.410.26
F2, F11, F14 + CatBoost0.380.21
F1, F2, F11, F14 + CatBoost0.210.16
Table 6. Model predictions under varying input conditions.
DatasetSOH Estimation MethodRMSE (%)MAE (%)Time (s)
CALCEHealth feature + CatBoost1.420.520.00319
Health feature + XGBoost2.471.320.00551
Health feature + MLP2.531.430.00735
Complete voltage curve data + CatBoost1.630.870.00915
Complete voltage curve data + XGBoost2.941.820.0127
Complete voltage curve data + MLP3.622.370.0167
TongjiHealth feature + CatBoost0.210.160.00323
Health feature + XGBoost0.240.170.00562
Health feature + MLP0.730.490.00747
Complete voltage curve data + CatBoost0.260.220.00847
Complete voltage curve data + XGBoost0.310.240.0117
Complete voltage curve data + MLP1.31.190.01564
Table 7. Comparative prediction performance of partial-curve-feature-based methods.
SOH Estimation MethodRMSE (%)MAE (%)
Health feature + CatBoost (ours)1.420.52
Partial discharge curves + CGKAN [37]1.381.1
Partial incremental capacity features + BO-LSTM [33]1.811.38
Table 8. RUL estimation results for the CALCE dataset.
Start PointBattery NumberRtrue (Cycle)Rpred (Cycle)RE (%)Mean RE (%)
64CS2_355885900.340.58
CS2_365375390.37
CS2_376066131.16
CS2_386686710.45
128CS2_355885900.340.5
CS2_365375390.37
CS2_376066120.99
CS2_386686700.3
Table 9. RUL estimation results for the Tongji dataset.
Start PointBattery NumberRtrue (Cycle)Rpred (Cycle)RE (%)Mean RE (%)
64NCM#194074110.981.865
NCM#224094130.98
NCM#244234093.3
NCM#264073982.2
128NCM#194074110.981.8025
NCM#224094120.73
NCM#244234093.3
NCM#264073982.2
Disclaimer/Publisher’s Note: The statements, opinions and data contained in all publications are solely those of the individual author(s) and contributor(s) and not of MDPI and/or the editor(s). MDPI and/or the editor(s) disclaim responsibility for any injury to people or property resulting from any ideas, methods, instructions or products referred to in the content.

