Abstract
This work studies the feasibility of integrating a hydrogen-powered propulsion system in a regional aircraft at the conceptual design level. The developed system consists of fuel cells, which will be studied at three technological levels, and batteries, also studied for four hybridization factors (X = 0, 0.05, 0.10, 0.20). Hydrogen can absorb great thermal loads since it is stored in the tank at cryogenic temperatures and is used as fuel in the fuel cells at around 80 °C. Taking advantage of this characteristic, two thermal management system (TMS) architectures were developed to ensure the proper functioning of the aircraft during the designated mission: A1, which includes a vapor compression system (VCS), and A2, which omits it for a simpler design. The models were developed in MATLAB® and consist of different components and technologies commonly used in such systems. The analysis reveals that A2, due to the exclusion of the VCS, outperformed A1 in weight (10–23% reduction), energy consumption, and drag. A1’s TMS required significantly more energy due to the VCS compressor. Hybridization with batteries increased system weight substantially (up to 37% in A2) and had a greater impact on energy consumption in A2 due to additional fan work. Hydrogen’s heat sink capacity remained underutilized, and the hydrogen tank was deemed suitable for a non-integral fuselage design. A2 had the lowest emissions (10–20% lower than A1 for X = 0), but hybridization negated these benefits, significantly increasing emissions in pessimistic scenarios.
1. Introduction
The objectives of the European Climate Law, outlined in the European Green Deal [1], aim to achieve climate neutrality by 2050 and a 55% reduction in greenhouse gases (GHG) emissions by 2030 [2]. These goals are yet to be met, placing significant pressure on the aviation sector. In 2022, the sector accounted for 2% of global energy-related CO2 emissions [3]. Despite operational and technological improvements in the sector, the expected increase in demand over the next 20 years still predicts CO2 emissions to double by 2050 [4].
Two major routes toward the future of clean aviation transport are developing new propulsion technologies and using novel fuels [5,6]. New propulsion technologies aim to move towards aircraft electrification to reduce or even eliminate climate impact. Battery-electric aircraft achieve this goal in flight. However, batteries’ low gravimetric energy densities currently limit their application to short-range aircraft [5]. The short-term solution for reducing emissions is to implement hybrid-electric propulsion systems that combine novel fuels with current propulsion technology, along with the use of batteries to store and deliver energy to electric motors.
Hydrogen can overcome the disadvantages of battery-electric aircraft and while enabling carbon-free flights [7]. It can be used as a combustion fuel to power H2-burning engines or as a reactant in fuel cells (FCs). For commercial aircraft, large amounts of hydrogen would be needed to power the modified jet engines, requiring sustainable production methods such as water electrolysis powered by renewable energy sources [8]. In contrast, for smaller aircraft, such as those in the regional segment, FCs would be beneficial, as their efficiency remains nearly constant with the size [9]. Furthermore, the use of FCs can reduce the climate impact the most by 90% when compared to that of kerosene-powered aviation [4] since only contrails are produced. As a result, FCs are one of the most promising solutions for achieving the least climate impact. FCs are lighter than batteries and widely reported to offer significant advantages over them; however, they have efficiencies of around 50% to 60% [10], which are lower than those of batteries [9]. A complex thermal management system (TMS) is needed to dissipate the high thermal load arising from these inefficiencies [10], and it will significantly impact aircraft drag, weight, power consumption, and costs [11]. Thus, the primary focus of this work is to design a novel TMS that can tackle the challenge of high heat dissipation. Hydrogen’s high heat capacity and its ability to be stored in liquid form at cryogenic temperatures also make it useful as a heat sink for dissipated energy.
2. Literature Review
2.1. Hydrogen Production
As of 2021, hydrogen was mostly produced from fossil fuels, representing a total share of 96% [12]. The different energy sources used in hydrogen production are usually addressed using color names. The most common method for hydrogen production is gray hydrogen production, due to its efficiency, low cost, and high availability of natural gas [13,14]. Blue hydrogen still uses natural gas like gray hydrogen, but with the premise of capturing and storing carbon emissions during the hydrogen production [15]. Green hydrogen, on the other hand, is entirely produced from renewable energy sources. Obtained from water electrolysis or from biofuels [16], it aims to achieve net zero emissions.
2.2. Economic and Storage Challenges
Hydrogen currently meets only 3% of global energy demand [12], primarily in industries like chemicals, steel, and power generation, with minimal use in newer areas like transportation and buildings. Economic viability remains a challenge, as hydrogen production costs must compete with established fuels, which is projected to happen around 2040 for aviation [17]. Infrastructure demands—production, liquefaction, storage, and airport refueling—require significant initial investments [13] and face logistical hurdles, as global hydrogen pipelines are limited [18]. Only low-carbon hydrogen is viable for aviation, though its high cost and lack of differentiation from fossil-based hydrogen impede broader adoption [12]. Furthermore, hydrogen storage poses several safety and operational challenges [8]. One of the main hydrogen storage operational challenges is its low volumetric density. It can be stored as compressed gas (GH2) at high pressures, limited to 1–15% gravimetric efficiency, or as cryogenic liquid (LH2), which achieves over 50% efficiency at near-ambient pressures [9]. LH2 storage, preferable for aircraft, requires advanced insulation to minimize boil-off from heat leakage. Aircraft tanks can be integral or non-integral, with studies showing integral tanks may reduce mass and drag, though non-integral tanks offer more flexible positioning [19]. The gravimetric efficiency is used to assess the storage efficiency of a tank, computed as:
where and denote the weight of the hydrogen content and the tank, respectively.
2.3. Fuel Cell Propulsion
Hydrogen can power aircraft through FCs or gas turbines. For long-range flights, hydrogen-powered gas turbines are preferred for their high power-to-weight ratios, while FCs are more efficient for low-range aircraft due to their suitability for lower power outputs [13]. Proton-exchange membrane fuel cells (PEMFC) are currently the most promising FC type for regional aviation, offering high power density and efficient low-temperature operation. This study focuses on PEMFCs as they are better suited than solid-oxide fuel cells (SOFCs) for aviation applications due to SOFCs’ lengthy setup requirements and operational challenges [9,20].
PEMFCs generate electricity through chemical reactions involving hydrogen and oxygen, with water as the only byproduct. The cell consists of a membrane-electrode assembly layered between porous electrodes, where reactions take place. At the anode, the hydrogen is oxidized and is divided into electrons and protons, creating an electric current. The protons move through the electrolyte, and at the cathode, they combine with oxygen and electrons, producing liquid water as a byproduct. This electrochemical process theoretically achieves an efficiency of 83% [21], and the FC operates within a range of 60–80 °C [22]. An effective water management system is necessary to extend the lifespan of PEMFCs [23]. Multiple PEMFCs are combined in a stack to increase voltage output. They experience three main types of energy losses: activation losses, ohmic losses, and mass transport losses, each affecting the FC’s efficiency and voltage output [24]. PEMFCs are advantageous in aviation due to their specific electrolyte, electrode structure, and catalyst layer, enabling efficient, high-power-density configurations suitable for clean, hydrogen-powered flight.
2.4. Fuel Cell Cooling
Thermal management is a key challenge for PEMFCs due to their low operating temperatures [25], as they require uniform temperatures to maintain membrane hydration and prevent hot spots that can damage components [26]. Cooling methods for PEMFCs vary based on power output, with air cooling and edge cooling suited for low-power applications and phase-change or liquid cooling used for higher-power systems [27]. Air cooling employs airflow through channels to maintain membrane hydration, while edge cooling uses heat spreaders to dissipate heat, though its effectiveness is limited in higher-power applications. Phase-change cooling encompasses different solutions that leverage the material’s state change to dissipate heat [28]. One of the possibilities is to use de-ionized water for evaporative cooling, leveraging the water’s latent heat to achieve efficient temperature regulation with minimal flow rates. Liquid cooling, typically used in automotive PEMFC systems over 10 kW [29], supports high heat rejection but requires a complex balance-of-plant (BoP) for effective operation [30]. Liquid cooling’s effectiveness can be enhanced through optimized flow field designs and advanced coolant channel geometries [20,31].
2.5. Heat Transfer Technologies
The purpose of a TMS in the context of aviation is to manage the heat transfer between heat sources and heat sinks, thereby controlling the temperature of aircraft components and subsystems while ensuring safety, efficiency, and comfort [11]. It wants to maximize the utilization of generated heat to prevent unnecessary heat loss and ensure acceptable temperature limits for enhanced component performance and longevity [25].
Electric machines (such as electric motors and generators, power converters and distributors), batteries, and the FC stack are considered heat sources which pose challenges in heat dissipation as no exhaust is present as in a combustion engine.
A ram air (RA) system, which capitalizes on the dynamic pressure generated by the aircraft’s speed, can contribute to heat rejection. It consists of an air intake with a heat exchanger (HEX) that transfers heat from the coolant to the external air. This solution has been tested in recent works applied to hybrid-electric aircraft [32,33,34,35]. Although it is considered one of the most promising solutions from an energy efficiency standpoint, its effectiveness at the aircraft level is constrained by flight conditions and may introduce larger drag penalties compared to other solutions [35]. As a result, it is typically complemented by additional systems such as liquid cooling [32,35], fuel-based cooling [33,35,36], vapor compression system (VCS) [32,35], and skin heat exchanger (SHX) [35]. Liquid cooling has also been explored for TMS at the aircraft level to transfer heat from the different heat sources to other heat transfer technologies, such as RA or VCS [32,35], or fuel-based cooling or SHX [34,35]. VCS can cool components below ambient temperature by using electricity to power the compressor, reducing drag penalties at the expense of increased energy consumption [35]. Fuel-based cooling is another viable option, as shown in [33,35,36]. This is particularly relevant for the hydrogen powered aircraft that utilize cryogenic hydrogen, which must be heated from approximately 20 K at the storage tank to around 353 k before being used in the PEMFC. Hydrogen can thus absorb a large amount of heat before being used, making it an effective thermal sink.
Although TMS has been flight tested in small aircraft, such as the H2FLY [37], there is limited literature addressing aircraft-level TMS architectures specifically designed for hydrogen powered aircraft operating on PEMFCs to be used for aircraft design. Recognizing hydrogen’s potential as a heat sink, the FutPrInt50 consortium [38] proposed a TMS architecture using this heat transfer technology [39]. This study builds on that work by adapting the proposed system to a hydrogen powered aircraft by PEMFCs. The architectures developed here draw on insights gained not only from the proposed architecture [39] but also from previous studies on hybrid-electric aircraft [35,40] within the same project, offering a novel application of TMS technology in the context of hydrogen propulsion.
3. Implementation
3.1. Reference Aircraft and Propulsion System
This work aims to give continuity to the FutPrInt50 project, where the top level aircraft requirements (TLAR) were based on the performance values and design characteristics of the ATR42-600 [41]. The propulsion system used in this work is depicted in Figure 1, where the propulsion model outlined with the dashed line was adapted from [40]. Hydrogen is used in the FCs to produce electricity managed in the power management distribution unit to power the EMs.
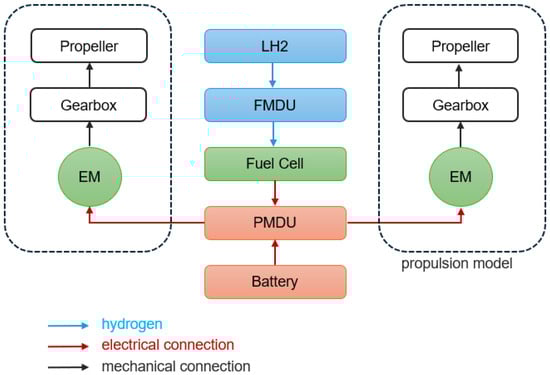
Figure 1.
Propulsion architecture considered. The acronyms EM, FMDU, and PMDU refer to electric motor, fuel management distribution unit, and power management distribution unit, respectively.
Later in this work, a hybridization factor (X) was used to study the impact of implementing batteries on the TMS. These values were used when the batteries contributed 5%, 10%, and 20% of the required power of the electric motors (EMs).
3.2. Mission Profile
A regional flight from Edinburgh to Dublin was considered, and the values of altitude, velocity, and drag coefficient were already given [38]. The altitude profile is represented in Figure 2.
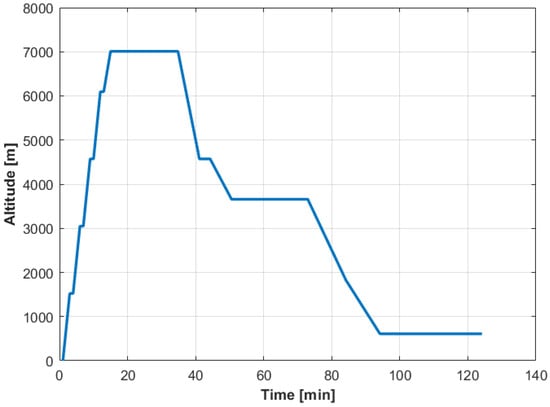
Figure 2.
Altitude profile as a function of flight time for the FutPrInt50 reference aircraft.
3.3. Components
All components integrated into the TMS architecture were modeled using MATLAB® R2024a, including the PEMFC, VCS, pumps, hydrogen tank, heat exchangers, ram air, fans, and ducts. As in our previous work [35], we assume quasi-steady state simulations instead of more computationally intensive unsteady simulations, which would allow for a more detailed assessment of energy management [42]. While this simplification introduces a modeling limitation, it enables the generation of valuable insights during the conceptual design stages, particularly for estimating energy consumption, mass, and drag, which is the main focus of the current paper. This section focuses on the modeling of the PEMFC and hydrogen tank, as the remaining components were adapted from a previous work [35] by the research team, which employed physics-based models for the VCS [43] and HEX [44], efficiency assumptions for pump and fans, and pressure loss assumptions for the ducts. The efficiency and pressure loss values were estimated by the FutPrInt50 consortium [35,45]. For each component, we calculated the heat transfer values and weight contributions.
3.3.1. PEMFC
The PEMFC was studied for three different scenarios depending on the estimated technology scenario by 2035. Its linearized polarization curves are presented in Figure 3 for these scenarios, which were adapted from [46]. It should be noted that the linearization of the polarization curve introduces a modeling limitation, given the inherently nonlinear behavior of PEMFC performance, particularly at the extremes of current density range (i.e., very low and very high values). For more accurate modeling, the Buttler–Volmer equation can be used [47].
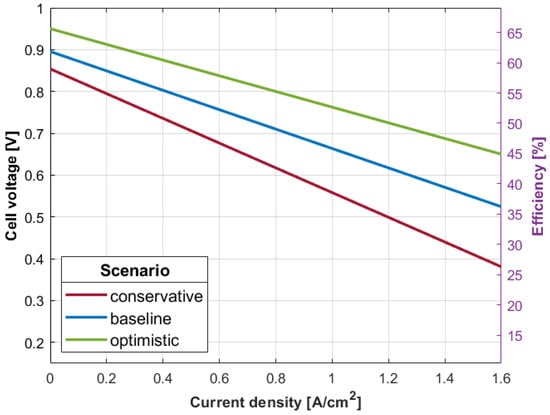
Figure 3.
Linearized polarization curves for 3 different scenarios defined in [46].
The FC was modeled for the maximum power required by the electric motors and the hybridization factor previously defined. To calculate the effective FC area (AFC,eff), the maximum current density adopted for this model was = 0.8 A/cm2:
The polarization curves represented in Figure 3 derive from given polarization coefficients and give us the average cell voltage (Vcell,avg). The FC efficiency () can then be determined based on the thermoneutral voltage () for the high heating value (HHV):
The calculation of the required hydrogen mass flow () is essential for later estimating the fuel required for the mission,
considering a stoichiometric ratio of = 1.05 and the hydrogen HHV of = 1.418 × 10⁵ kJ/kg [48].
Lastly, the heat rejected by the FC that needs to be managed in the TMS is calculated based on the energy balance of the FC. It is considered that 5% of the heat is rejected at the cathode exhaust [46]:
where the effective chemical power of the FC (PH2,HHV,eff) is
and is the electric power output of the cell.
The FC model also includes an air compressor that uses a mass flow rate of ambient air () and a HEX to maintain optimal air conditions at the PEMFC cathode.
The total PEMFC system mass contribution is calculated based on estimated densities, where BoP components contribute with 20%:
where is the power required in the compressor. The densities of the FC, compressor, and humidifier are denoted by , , and , respectively, and their values for each scenario are from [46].
To determine the FC stack area and power output, a MATLAB® R2024a-based simulation (GetPower() function) was developed (Figure 4). This simulation accounts for powering not only the electric motors but also the TMS components and the air compressor integrated into the PEMFC system. Inputs include architecture type (A1 or A2), FC scenario, hybridization factor, motor power requirements, and heat dissipation needs. The simulation iteratively calculates the TMS power (PTMS) and air compressor power (PCOMP) until the error tolerance of 100 W is met, adjusting the PFC accordingly.
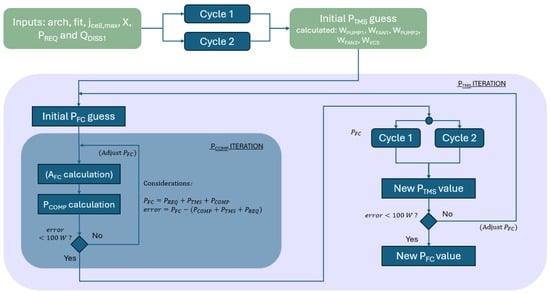
Figure 4.
GetPower() MATLAB® R2024a function diagram.
3.3.2. Tank
The fuel tank volume is determined based on the maximum required fuel mass for the mission profile, with considerations for pressure management and cryogenic conditions. To prevent air entry, the tank filling pressure is set at pfill = 1.2 bar. The maximum allowable venting pressure is set at pvent = 3 bar as in [19]. Excess hydrogen has to be vented if this value is reached increases. A 3% volume allowance is also defined to account for tank contractions and expansions and trapped fuel [49]. The required fuel mass is determined by integrating the hydrogen mass flow over flight time to determine tank volume. The required fill mean density of the mixture is determined according to the defined venting pressure following [50].
Regarding the pressure control of the tank, the pressure change rate is determined based on the first law of thermodynamics and mass conservation, derived from Lin et al. [51]:
where V is the tank volume, and denote the mass flow rate of gaseous and liquid hydrogen, respectively, is the enthalpy of vaporization, and and are the densities of gaseous and liquid content, respectively. The mixer power () ensures a homogeneous fuel mixture, and its value is determined by multiplying the pressure change rate by two [51]. According to [51], the effect of stratification is accounted for by multiplying the pressure fluctuation value obtained with Equation (8) by this factor of two. This approach eliminates the need to directly calculate . Additionally, the conductivity of the tank’s wall and the fluid convection due to the acceleration and vibration levels of the aircraft will also contribute to achieve a homogeneous mixture in the tank [52]. The energy derivative () is computed by interpolating verified data from Verstraete et al. [50] and Lin et al. [51].
The heat leakage to the tank () considers conduction through insulation (polyurethane foam). An additional 30% allowance accounts for heat leakage through the support structure and piping [19]. The tank is placed in the pressurized fuselage, where we assume a cabin temperature of = 296 K, based on Onorato et al. [19], throughout the mission profile. However, it is worth noting that this temperature may vary during the mission. Inside, hydrogen is stored at = 20 K. The insulation thickness is = 0.1 m [19], and its thermal conductivity . A represents the tank surface area.
For the tank mass, it was assumed a gravimetric efficiency of 70% for LH2 storage below 2 bar, based on literature values [9].
3.4. Architectures
This research compares two cooling system architectures, A1 and A2 (depicted in Figure 5 and Figure 6), which are similar except for the inclusion of a VCS in A1. Architecture A1 is based on a previously proposed architecture within the FutPrInt50 consortium [39], which has been adapted for this work. In architecture A2, we opted to propose the removal of the VCS based on the insights gains from the same project for a hybrid-electric aircraft [35], where we also observed higher energy consumptions in TMS architectures that employed a VCS. Both architectures operate with two cycles. Cycle 1 focuses on FC cooling, where the EGW (ethylene glycol-water) refrigerant absorbs heat from the FC and transfers part of it to the hydrogen via the fuel heat exchanger (FHX) 2, heating the fuel to the desired FC inlet temperature. The remaining heat is dissipated through the ram air heat exchanger (RHX), assisted by a fan to increase ram air mass flow if necessary. A pump is used to overcome the pressure losses within the cycle.
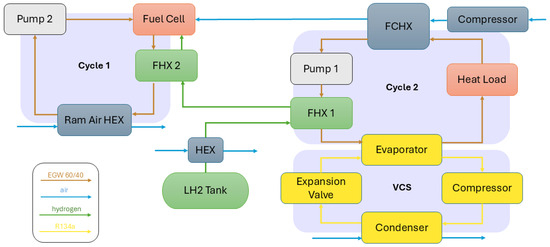
Figure 5.
Architecture 1 comprises two cycles: Cycle 1, which cools the fuel cell; and Cycle 2, which cools other propulsion system components using a VCS. The acronyms HEX, FHX, FCHX, and VCS refer to heat exchanger, fuel heat exchanger, fuel cell heat exchanger, and vapor compression system, respectively.
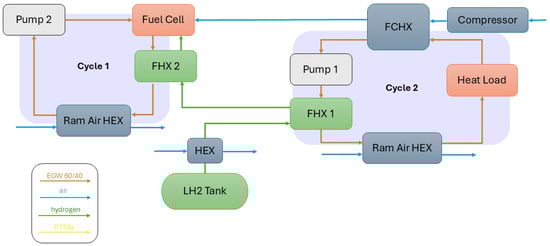
Figure 6.
Architecture 2 comprises two cycles: Cycle 1, which cools the fuel cell; and Cycle 2, which cools other propulsion system components using a ram air HEX. The acronyms HEX, FHX, FCHX, and VCS refer to heat exchanger, fuel heat exchanger, and fuel cell heat exchanger, respectively.
Cycle 2 cools the propulsive components, including the batteries. It starts by absorbing heat in the fuel cell heat exchanger (FCHX), cooling the compressed air entering the FC. Heat is then transferred via the FHX1 to hydrogen, which enters at 220 K (the freezing temperature of EGW) to prevent freezing. The difference between the architectures lies in the heat dissipation step: in A2, a simple RHX releases heat to the RA, whereas in A1, a VCS is integrated to evaluate whether it enhances heat dissipation, following the concept proposed by the FutPrInt50 team [39]. Both architectures are designed to effectively manage the heat loads from the FC and propulsive components, with A1 assessing the potential benefits of the VCS.
3.5. Validation and Verification
The PEMFC model in this work was benchmarked against a reference model from [46]. It used the baseline scenario at maximum power for the simulation, showing excellent agreement with the reference values as shown in Table 1. Power and heat flow distributions, such as delivered power (Pdeliv) at 45.7% and heat dissipation to the TMS (QTMS) at 47.1%, exhibited negligible errors, except for QTMS, which reflects a 1.1% deviation due to excluding hydrogen heat dissipation in this model. Overall, the results confirm the accurate implementation of the PEMFC equations and hydrogen property values.

Table 1.
Power and heat distribution model compared to [46].
As mentioned earlier all the other components were modeled using either established theoretical procedures from classical textbooks [43,44] or assumptions estimated by the FutPrInt50 consortium [35,45].
3.6. Emissions
This study evaluates the carbon equivalent emissions (CO2-eq) of only the energy and coolants used in the propulsion and thermal management systems. While the production of all components in both systems would have a larger environmental impact, the focus of this emission study is solely on comparing the emissions associated with the energy and coolants used in the TMS. This analysis follows the life cycle assessment (LCA) methodology, considering the emissions factors available in the literature for: (i) hydrogen production (gray and blue); (ii) battery production and recharge (Li-ion batteries); and (iii) TMS coolants (EGW and R134a). Equation (10) aggregates these contributions,
with the emission factors (e) presented in Table 2. It is worth mentioning that the battery production is diluted by 2000 cycles of charge-discharge.
Table 2.
Emission factors of each considered contributor.
4. Results and Discussion
4.1. Propulsion Model
The propulsion model behaves consistently across all architectures since it solely depends on the mission profile, which remains unchanged. The maximum power demand of slightly over 1.6 MW occurs during take-off (Figure 7), requiring proper dimensioning of the FC and battery system to meet this output.
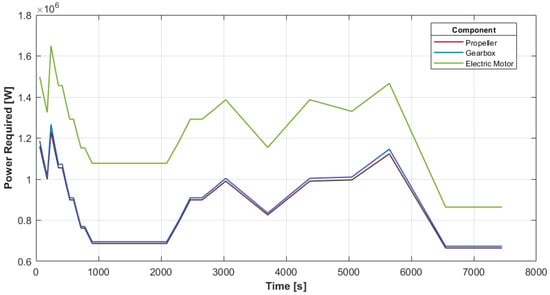
Figure 7.
Power required by the different propulsion components, namely propeller, gearbox, and electric motor.
Electric motor and gearbox efficiencies (Figure 8) influence the power required; gearbox efficiency remains high (97–99%) but decreases during take-off, aligning with peak power needs, while electric motor efficiencies are lower (65–80%) and inversely follow the altitude profile due to their dependence on propeller rotational speed.
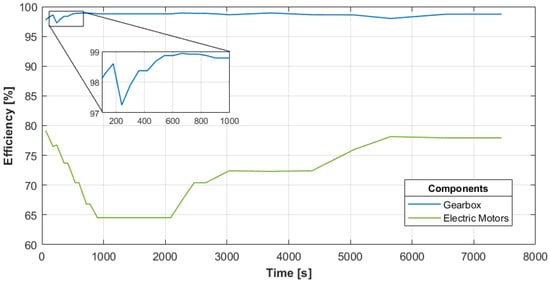
Figure 8.
Efficiency of different propulsion components, namely gearbox and electric motors.
The propulsion model’s mass values are constant across all architectures and PEMFC scenarios and are presented in Table 3.
Table 3.
Propulsion weight.
4.2. PEMFC
The results from the implementation of the GetPower() function indicate that the FC stack’s peak power output occurs during takeoff for both architectures. For A2, the baseline scenario shows a peak of 1.82 MW, while optimistic and conservative scenarios yield 1.78 MW (−2.2%) and 1.86 MW (+2.2%), respectively. For A1 (Figure 9), the baseline peak is 1.90 MW, with the optimistic and conservative scenarios at 1.86 MW (−2.1%) and 1.94 MW (+2.1%).
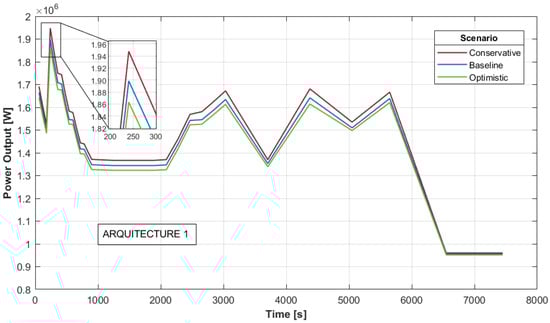
Figure 9.
Fuel cell power output in A1 over the flight duration for three scenarios: conservative, baseline, and optimistic.
The FC stack area and mass (Table 4) are higher for A1 due to the VCS compressor, with A2 showing reductions of 4–5% in both properties.
Table 4.
FC stack properties.
4.3. Tank
This subsection presents the results of the hydrogen tank implementation, starting with the hydrogen mass flow required to power the FCs during the mission. The mass flow varies directly with power demands, with the conservative scenario, for A1, requiring 7–18% more hydrogen compared to the baseline, while the optimistic scenario uses 8–13% less (Figure 10). For architecture A2, the hydrogen mass flow is slightly lower than A1 due to the absence of the VCS.
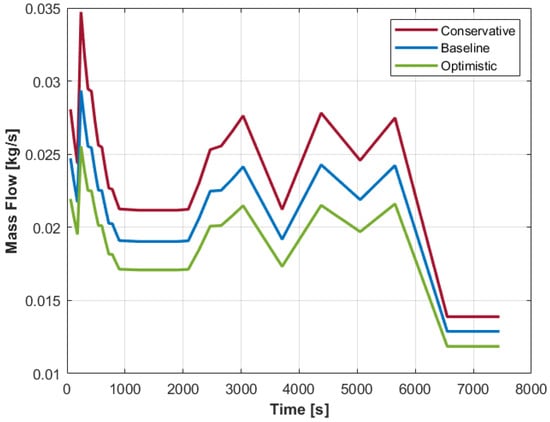
Figure 10.
Required mass flow of hydrogen in A1 over the flight duration for three scenarios: conservative, baseline, and optimistic.
The tank and fuel masses were calculated for both architectures and scenarios (Table 5), with A1 having higher values due to greater power requirements. The conservative scenario shows the largest values, while A2 consistently demonstrates a 4–5% reduction in mass compared to A1. Tank volume and diameter are also larger in the conservative case, and for A1, but in all scenarios, the tank diameter remains smaller than the aircraft fuselage, allowing for a simpler spherical tank design.
Table 5.
Tank and fuel mass.
The pressure variation in the tank reveals that in both architectures, the pressure slightly exceeds the venting threshold (300 kPa) near the end of the mission. For A1 (Figure 11), final pressures range from 302 kPa (+0.7%) in the conservative scenario to 325 kPa (+8.3%) in the optimistic case. For A2, pressures are slightly higher, ranging from 306.4 kPa (+2.1%) to 329.3 kPa (+9.8%). If needed, excess pressure could be managed by venting hydrogen to a recovery system for reuse.
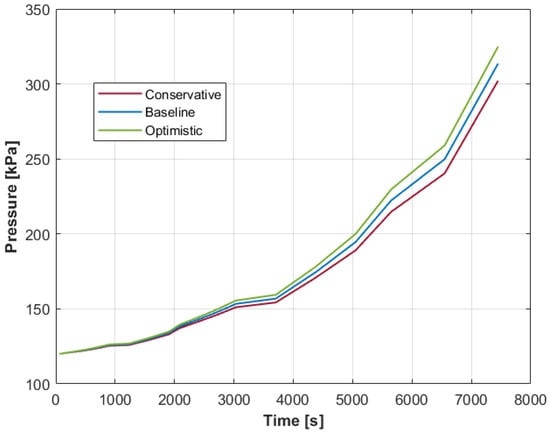
Figure 11.
Tank pressure in A1 over the flight duration for three scenarios: conservative, baseline, and optimistic.
Heat flow to the tank was analyzed assuming conduction as the only heat transfer mode, with the external cabin temperature held constant, which also leads to a constant heat flow to the tank over time. For A1, heat flow rates are 770 W (+7.7%) in the conservative scenario, 715 W in the baseline, and 665 W (−7.0%) in the optimistic. For A2, the rates are slightly lower, with 745 W (+8.0%), 690 W (baseline), and 640 W (−7.2%), respectively. Heat flux increases with tank surface area, which grows with higher fuel requirements.
4.4. Cycle 2
Cycle 2 manages the heat related to the propulsion components (except the FC) and the batteries when X > 0. Figure 12 shows the sum of dissipated heat from these components when X = 0.
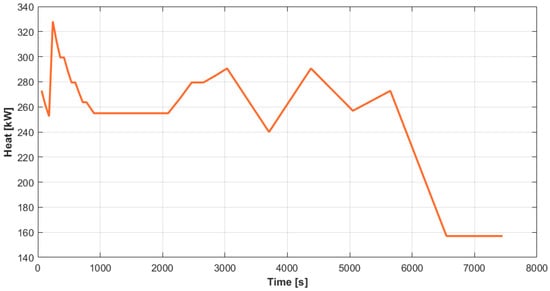
Figure 12.
Heat load over the flight duration.
After conducting the simulation for all the components of this cycle, Table 6 summarizes its weight and energy consumption contributions to the TMS.
Table 6.
Cycle 2 weight and energy consumption ( denotes the relative difference between A2 and A1, as a fraction of A1).
4.5. Cycle 1
Regarding Cycle 1, Figure 13 shows us the power dissipated by the FC system to the TMS (for A1) that needs to be managed in this cycle.
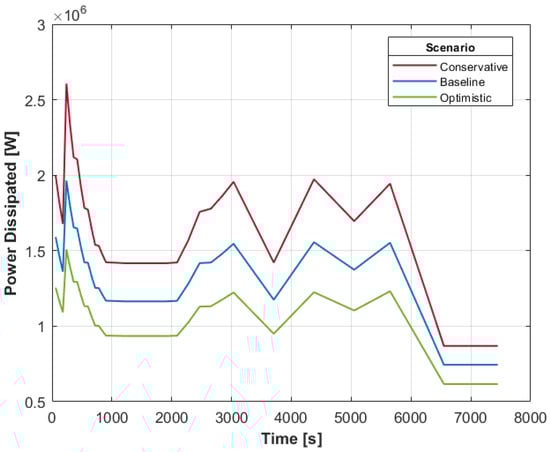
Figure 13.
Power dissipated by the fuel cell over the flight duration, which needs to be managed by the TMS in Architecture A1, considering three scenarios: conservative, baseline, and optimistic.
Similarly to Cycle 2, Table 7 summarizes the contributions of Cycle 1 to the weight and power requirements of the TMS.
Table 7.
Cycle 1 weight and energy consumption ( denotes the relative difference between A2 and A1, as a fraction of A1).
4.6. Overall Analysis
This section analyzes the general results of the TMS and propulsion architectures, focusing on drag, weight, energy consumption, heat dissipation, and emissions for various scenarios and hybridization factors (X = 0, 0.05, 0.10, 0.20) providing valuable insights into their impact on aircraft design.
The drag analysis shows high contributions compared with the aircraft drag, peaking at over 30% during takeoff for the conservative scenario of A1 (Figure 14). Baseline and optimistic scenarios see slightly lower values, ranging between 20–25%. A2 consistently shows lower drag compared to A1 due to the absence of the VCS. Compared to the work by Coutinho et al. [35], which analyzed the same aircraft with a hybrid-electric powertrain and a shorter mission (60 min), the drag penalty in the present study increases by an order of magnitude. Although the mission in the present study is longer than in [35], such an increase represents a significant design challenge.
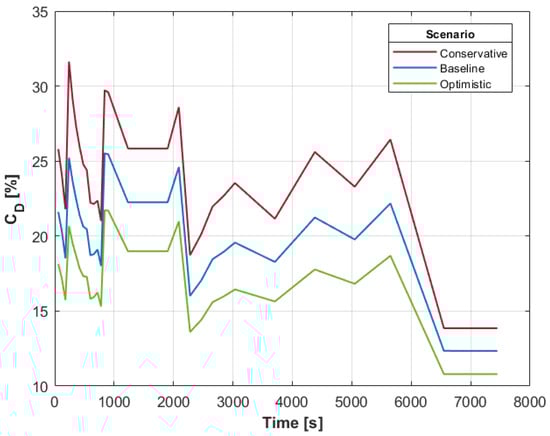
Figure 14.
Relative contributions over the flight duration for Architecture A1, considering three scenarios: conservative, baseline, and optimistic.
In the weight analysis, the propulsion and TMS systems in A2 exhibit a reduction of 10–22% compared to A1, attributed to the removal of the VCS. The TMS weight alone is 30–46% lower for A2, with total weight increasing linearly with hybridization (Figure 15). Battery integration significantly impacts weight, leading to increases of up to 114% in A2 and 90% in A1 for X = 0.20. Relative to the work by Coutinho et al. [35], the present study exhibits a larger TMS mass, ranging from 1.2 to 3 times greater. However, for the same mission profile and aircraft, although equipped with a hybrid-electric powertrain, the TMS mass is 1.2 to 1.9 times lower than the results reported by Figueiras et al. [40]. This represents a promising outcome, suggesting that the proposed TMS configuration offers competitive performance with a reduced TMS mass.
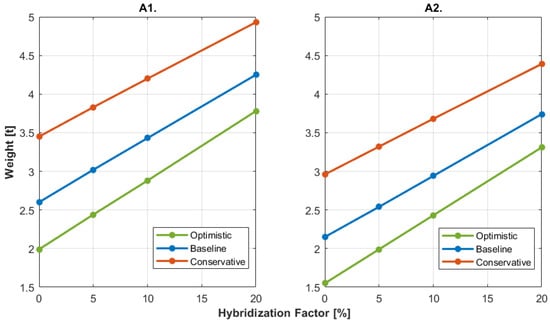
Figure 15.
Total mass of A1 and A2 systems for three scenarios: conservative, baseline, and optimistic.
The energy consumption analysis reveals that A2 consumes significantly less energy (85–97% lower) than A1 due to the absence of the VCS, where the compressor energy dominates. The addition of batteries causes small increases in energy for A1, but for A2, it results in a greater rise due to the higher fan power requirements. Energy consumption in A2 increases by up to 50% in the baseline and 66% in the conservative scenario for higher hybridization factors. Building on the comparison with [35], A1 shows higher energy consumption, although it remains within the same order of magnitude. In contrast, A2 exhibits lower energy consumption, also within the same order of magnitude, compared to three of the architectures reported in [35]. This is a promising outcome given that the results in [35] correspond to a shorter flight duration.
For heat dissipation, energy is primarily dissipated to the RA heat sink, with hydrogen as a secondary sink. Dissipation varies little between architectures (less than 10%), with A2 showing slightly lower values due to reduced power demands. Heat dissipation increases with power requirements and hybridization, rising by up to 20% for RA and 17% for hydrogen compared to the X = 0 case.
The emissions analysis highlights the environmental impact of each architecture and scenario. Table 8 presents the emission values from all configurations studied in tons of equivalent. Two emissions scenarios were analyzed: a pessimistic and an optimistic scenario. The parameters for the pessimistic scenario are as follows: gray hydrogen as fuel, battery recharging using the EU-27 electric mix, and the EGW production via coal. In contrast, the optimistic scenario considers blue hydrogen as fuel, recharging electricity from Sweden, and EGW production from biomass.
Table 8.
Emissions [t CO2-eq] ( denotes the relative difference between A2 and A1, as a fraction of A1).
For X = 0 in the pessimistic scenario, only the emission values are distinguishable between architectures. A2 emits less than 10% of CO2-eq compared to A1 across all scenarios. This difference is attributed to higher power requirements in A1. When batteries are included, these differences are offset by the emissions associated with battery production and recharging, reducing the difference to less than 1%. In the optimistic scenario, emissions decrease by 15 to 20% for X = 0, by around 10% for X = 0.05, and by approximately 7 and 5% for X = 0.10 and X = 0.20, respectively.
The integration of batteries has a significant negative impact on flight emissions. In the pessimistic scenario, for a hybridization of 5%, emissions increase by 1000%. The effect of X = 0.10 varies by 2000% between scenarios. The higher the hybridization factor, the more pronounced these changes become, as shown in Table 9. In contrast, the optimistic scenario has a less pronounced impact on emissions, though it is still considerable. Emissions increase by 60 to 420%, with the largest changes occurring in the optimistic scenario.
Table 9.
Relative difference of emissions for hybridization factors of 5, 10, and 20%, as a fraction of hybridization factor X = 0 [%].
5. Concluding Remarks
The objectives of the study were successfully met, with all components and cycles of the TMS behaving as expected. A2, due to its simplicity and the exclusion of the VCS in Cycle 2, proved superior to A1 in terms of weight, energy consumption, and drag, especially in the pessimistic scenario. A2 showed a weight reduction of 10–23% compared to A1 and significantly lower energy consumption, with A1’s TMS requiring an order of magnitude more energy due to the VCS compressor. Both architectures exhibited high drag contributions, though slightly higher in A1. Strategies that rely less on ram air should be explored in the future to mitigate this issue.
The integration of batteries for hybridization factors (X = 0.05, 0.10, 0.20) increased the system weight significantly, especially in propulsion mass, due to batteries’ high energy density. For the baseline scenario at X = 0.10, the total mass increased by 30% in A1 and 37% in A2. Energy consumption differences were small for A1 but more significant in A2 due to additional fan work in Cycle 2. The study also found that hydrogen’s heat sink capacity was underutilized, limited to 220 K to prevent freezing the refrigerant. Heat dissipated to hydrogen remained constant (∼0.2 GJ), while the RA system handled around 10 GJ. Possible solutions include the use of gases with lower freezing temperatures, such as helium or propane, to transfer heat to hydrogen through an intermediate closed cycle, or the development of cryogenic heat exchangers. These solutions could reduce ram air drag by making more effective use of hydrogen as a heat sink.
The hydrogen tank dimensions were found suitable for a non-integral design within the aircraft fuselage, simplifying implementation. Regarding environmental impact, A2 produced the lowest emissions, particularly for X = 0, with reductions of 10–20% compared to A1. When hybridization was considered, battery emissions offset this advantage. The hybrid configurations notably increased emissions compared to FC-only aircraft, especially in pessimistic scenarios.
Recommendations for future work include fully utilizing hydrogen’s heat capacity during its transition to fuel temperature, exploring intermediate heat transfer gases (e.g., helium or propane), and conducting refrigerant studies to optimize heat transfer. Further suggestions include implementing alternative heat sinks like phase change materials, developing advanced cryogenic heat exchangers to prevent freezing, and integrating hydrogen cooling systems into propulsion models.
Author Contributions
Conceptualization, M.F., F.A. and A.S.; methodology, M.F., F.A. and A.S.; software, M.F.; validation, M.F.; formal analysis, M.F.; investigation, M.F., F.A. and A.S.; data curation, M.F. and F.A.; writing—original draft preparation, M.F.; writing—review and editing, F.A. and A.S.; visualization, M.F.; supervision, F.A. and A.S.; project administration, F.A. and A.S. All authors have read and agreed to the published version of the manuscript.
Funding
This research was funded by Fundação para a Ciência e a Tecnologia (FCT) under project LAETA Base Funding (https://doi.org/10.54499/UIDB/50022/2020). Afzal Suleman acknowledges the NSERC Canada Research Chair Program.
Data Availability Statement
The data presented in this study are available upon request.
Conflicts of Interest
The authors declare no conflicts of interest.
Abbreviations
The following abbreviations are used in this manuscript:
| BoP | Balance-of-Plant |
| EGW | Ethylene Glycol-Water |
| EM | Electric Motor |
| FC | Fuel Cell |
| FCHX | Fuel Cell Heat Exchanger |
| FHX | Fuel Heat Exchanger |
| GH2 | Gaseous Hydrogen |
| GHG | Greenhouse Gases |
| HEX | Heat Exchanger |
| HHV | High Heating Value |
| LCA | Life Cycle Assessment |
| LH2 | Liquid Hydrogen |
| PEMFC | Proton-Exchange Membrane Fuel Cell |
| RA | Ram Air |
| RHX | Ram Air Heat Exchanger |
| SHX | Skin Heat Exchanger |
| SOFC | Solid-Oxide Fuel Cell |
| TMS | Thermal Management System |
| TLAR | Top Level Aircraft Requirements |
| VCS | Vapor Compression System |
References
- European Commission. The European Climate Law. 2020. Available online: https://ec.europa.eu/commission/presscorner/api/files/attachment/862887/european-climate-law-march-2020_en.pdf (accessed on 9 February 2025).
- European Commission. European Green Deal: The Commission Proposes Transformation of EU Economy and Society to Meet Climate Ambitions. 14 July 2021. Online. Available online: https://ec.europa.eu/commission/presscorner/detail/en/IP_21_3541. (accessed on 9 February 2025).
- IEA. Tracking Clean Energy Progress. 2023. Available online: https://www.iea.org/reports/tracking-clean-energy-progress-2023 (accessed on 9 February 2025).
- Fuel Cells and Hydrogen 2 Joint Undertaking. Hydrogen-Powered Aviation—A Fact-Based Study of Hydrogen Technology, Economics, and Climate Impact by 2050; Publications Office of European Union: Luxembourg, 2020. [Google Scholar] [CrossRef]
- Adler, E.J.; Martins, J.R. Reprint of: Energy demand comparison for carbon-neutral flight. Prog. Aerosp. Sci. 2025, 153, 101084. [Google Scholar] [CrossRef]
- Abu Salem, K.; Palaia, G.; Quarta, A.A. Review of hybrid-electric aircraft technologies and designs: Critical analysis and novel solutions. Prog. Aerosp. Sci. 2023, 141, 100924. [Google Scholar] [CrossRef]
- Adler, E.J.; Martins, J.R.R.A. Blended Wing Body Configuration for Hydrogen-Powered Aviation. J. Aircr. 2024, 61, 887–901. [Google Scholar] [CrossRef]
- Suwaileh, W.; Bicer, Y.; Al Hail, S.; Farooq, S.; Mohamad Yunus, R.; Rosman, N.N.; Karajagi, I. Exploring hydrogen fuel as a sustainable solution for zero-emission aviation: Production, storage, and engine adaptation challenges. Int. J. Hydrogen Energy 2025, 121, 304–325. [Google Scholar] [CrossRef]
- Adler, E.J.; Martins, J. Hydrogen-powered aircraft: Fundamental concepts, key technologies, and environmental impacts. Prog. Aerosp. Sci. 2023, 141, 100922. [Google Scholar] [CrossRef]
- Asli, M.; König, P.; Sharma, D.; Pontika, E.; Huete, J.; Konda, K.R.; Mathiazhagan, A.; Xie, T.; Höschler, K.; Laskaridis, P. Thermal management challenges in hybrid-electric propulsion aircraft. Prog. Aerosp. Sci. 2024, 144, 100967. [Google Scholar] [CrossRef]
- Affonso Junior, W.; Gandolfi, R.; dos Reis, R.; Silva, C.; Rodio, N.; Kipouros, T.; Laskaridis, P.; Chekin, A.; Ravikovich, Y.; Ivanov, N.; et al. Thermal Management challenges for HEA—FUTPRINT 50. IOP Conf. Ser. Mater. Sci. Eng. 2021, 1024, 012075. [Google Scholar] [CrossRef]
- International Renewable Energy Agency. Hydrogen Overview. 2022. Available online: https://www.irena.org/Energy-Transition/Technology/Hydrogen (accessed on 9 February 2025).
- Tashie-Lewis, B.; Nnabuife, S. Hydrogen Production, Distribution, Storage and Power Conversion in a Hydrogen Economy—A Technology Review. Chem. Eng. J. Adv. 2021, 8, 100172. [Google Scholar] [CrossRef]
- Basile, A.; Liguori, S.; Iulianelli, A. 2-Membrane reactors for methane steam reforming (MSR). In Membrane Reactors for Energy Applications and Basic Chemical Production; Basile, A., Di Paola, L., Hai, F.L., Piemonte, V., Eds.; Woodhead Publishing Series in Energy; Woodhead Publishing: Cambridge, UK, 2015; pp. 31–59. [Google Scholar] [CrossRef]
- Bauer, C.; Treyer, K.; Antonini, C.; Bergerson, J.; Gazzani, M.; Gencer, E.; Gibbins, J.; Mazzotti, M.; McCoy, S.T.; McKenna, R.; et al. On the climate impacts of blue hydrogen production. Sustain. Energy Fuels 2022, 6, 66–75. [Google Scholar] [CrossRef]
- Anand, C.; Chandraja, B.; Nithiya, P.; Akshaya, M.; Tamizhdurai, P.; Shoba, G.; Subramani, A.; Kumaran, R.; Yadav, K.K.; Gacem, A.; et al. Green hydrogen for a sustainable future: A review of production methods, innovations, and applications. Int. J. Hydrogen Energy 2025, 111, 319–341. [Google Scholar] [CrossRef]
- Westenberger, A. H2 technology for commercial aircraft. In Proceedings of the Advances on Propulsion Technology for High-Speed Aircraft, RTO, Rhode-Saint-Geneese, Belgium, 12–15 March 2007. [Google Scholar]
- International Energy Agency. Low Emission Fuels—Hydrogen. 2023. Available online: https://www.iea.org/energy-system/low-emission-fuels/hydrogen (accessed on 9 February 2025).
- Onorato, G.; Proesmans, P.; Hoogreef, M. Assessment of hydrogen transport aircraft. CEAS Aeronaut. J. 2022, 13, 813–845. [Google Scholar] [CrossRef] [PubMed]
- Zhang, G.; Kandlikar, S. A critical review of cooling techniques in proton exchange membrane fuel cell stacks. Int. J. Hydrogen Energy 2012, 37, 2412–2429. [Google Scholar] [CrossRef]
- Bharti, A.; Natarajan, R. Chapter 7—Proton exchange membrane testing and diagnostics. In PEM Fuel Cells; Kaur, G., Ed.; Elsevier: Amsterdam, The Netherlands, 2022; pp. 137–171. [Google Scholar] [CrossRef]
- Wu, W.; Zhai, C.; Sui, Z.; Sui, Y.; Luo, X. Proton exchange membrane fuel cell integrated with microchannel membrane-based absorption cooling for hydrogen vehicles. Renew. Energy 2021, 178, 560–573. [Google Scholar] [CrossRef]
- Zhang, Z.; Mao, J.; Liu, Z. Advancements and insights in thermal and water management of proton exchange membrane fuel cells: Challenges and prospects. Int. Commun. Heat Mass Transf. 2024, 153, 107376. [Google Scholar] [CrossRef]
- Dicks, A.L.; Rand, D.A.J. Fuel Cell Systems Explained, 3rd ed.; John Wiley & Sons Ltd.: Hoboken, NJ, USA, 2018. [Google Scholar] [CrossRef]
- Srinath, A.; López, A.; Miran Fashandi, S.; Lechat, S.; Legge, G.; Nabavi, A.; Nikolaidis, T.; Jafari, S. Thermal Management System Architecture for Hydrogen-Powered Propulsion Technologies: Practices, Thematic Clusters, System Architectures, Future Challenges, and Opportunities. Energies 2022, 15, 304. [Google Scholar] [CrossRef]
- Soupremanien, U.; Le Person, S.; Favre-Marinet, M.; Bultel, Y. Tools for designing the cooling system of a proton exchange membrane fuel cell. Appl. Therm. Eng. 2012, 40, 161–173. [Google Scholar] [CrossRef]
- Bargal, M.; Abdelkareem, M.; Tao, Q.; Li, J.; Shi, J.; Wang, Y. Liquid cooling techniques in proton exchange membrane fuel cell stacks: A detailed survey. Alex. Eng. J. 2020, 59, 635–655. [Google Scholar] [CrossRef]
- Wu, Q.; Dong, Z.; Zhang, X.; Zhang, C.; Iqbal, A.; Chen, J. Towards More Efficient PEM Fuel Cells Through Advanced Thermal Management: From Mechanisms to Applications. Sustainability 2025, 17, 943. [Google Scholar] [CrossRef]
- Islam, M.; Shabani, B.; Rosengarten, G.; Andrews, J. The potential of using nanofluids in PEM fuel cell cooling systems: A review. Renew. Sustain. Energy Rev. 2015, 48, 523–539. [Google Scholar] [CrossRef]
- Thirkell, A. Systems Study for Fuel Cell Powered More Electric Aircraft. Ph.D. Thesis, Loughborough University, Loughborough, UK, 2021. [Google Scholar] [CrossRef]
- Tawalbeh, M.; Alarab, S.; Al-Othman, A.; Javed, R. The Operating Parameters, Structural Composition, and Fuel Sustainability Aspects of PEM Fuel Cells: A Mini Review. Fuels 2022, 3, 449–474. [Google Scholar] [CrossRef]
- Adler, E.; Brelje, B.; Martins, J. Thermal Management System Optimization for a Parallel Hybrid Aircraft Considering Mission Fuel Burn. Aerospace 2022, 9, 243. [Google Scholar] [CrossRef]
- Kellermann, H.; Lüdemann, M.; Pohl, M.; Hornung, M. Design and Optimization of Ram Air–Based Thermal Management Systems for Hybrid-Electric Aircraft. Aerospace 2021, 8, 3. [Google Scholar] [CrossRef]
- Heersema, N.; Jansen, R. Thermal Management System Trade Study for SUSAN Electrofan Aircraft. In Proceedings of the AIAA SCITECH 2022 Forum, San Diego, CA, USA, 3–7 January 2022. [Google Scholar] [CrossRef]
- Coutinho, M.; Afonso, F.; Souza, A.; Bento, D.; Gandolfi, R.; Barbosa, F.R.; Lau, F.; Suleman, A. A Study on Thermal Management Systems for Hybrid—Electric Aircraft. Aerospace 2023, 10, 745. [Google Scholar] [CrossRef]
- Kellermann, H.; Habermann, A.; Vratny, P.; Hornung, M. Assessment of fuel as alternative heat sink for future aircraft. Appl. Therm. Eng. 2020, 170, 114985. [Google Scholar] [CrossRef]
- DLR. Zero-Emission Air Transport—First Flight of Four-Seat Passenger Aircraft Hy4. Available online: https://www.dlr.de/en/latest/news/2016/20160929_zero-emission-air-transport-first-flight-of-four-seat-passenger-aircraft-hy4_19469 (accessed on 28 May 2025).
- Eisenhut, D.; Moebs, N.; Windels, E.; Bergmann, D.; Geiß, I.; Reis, R.; Strohmayer, A. Aircraft Requirements for Sustainable Regional Aviation. Aerospace 2021, 8, 61. [Google Scholar] [CrossRef]
- Affonso Junior, W.; Tavares, R.; Reyes Barbosa, F.; Gandolfi, R.; dos Reis, R.; Silva, C.; Kipouros, T.; Laskaridis, P.; Balaghi Enalou, H.; Chekin, A.; et al. System architectures for thermal management of hybrid-electric aircraft—FutPrInt50. IOP Conf. Ser. Mater. Sci. Eng. 2022, 1226, 012062. [Google Scholar] [CrossRef]
- Figueiras, I.; Coutinho, M.; Afonso, F.; Suleman, A. On the Study of Thermal-Propulsive Systems for Regional Aircraft. Aerospace 2023, 10, 113. [Google Scholar] [CrossRef]
- Eisenhut, D.; Windels, E.; Reis, R.; Bergmann, D.; Ilário, C.; Palazzo, F.; Strohmayer, A. Foundations towards the future: FutPrInt50 TLARs an open approach. IOP Conf. Ser. Mater. Sci. Eng. 2021, 1024, 012069. [Google Scholar] [CrossRef]
- Yan, J.; Rong, Z.; Wang, Y. A model of PEMFC-battery system to evaluate inner operating status and energy consumption under different energy management strategies. Int. J. Hydrogen Energy 2022, 47, 3075–3086. [Google Scholar] [CrossRef]
- Moran, M.; Shapiro, H.; Boettner, D.; Bailey, M. Fundamentals of Engineering Thermodynamics; Wiley: Hoboken, NJ, USA, 2010. [Google Scholar]
- Incropera, F.P.; DeWitt, D.P. Fundamentals of Heat and Mass Transfer, 7th ed.; John Wiley & Sons: New York City, NY, USA, 2011. [Google Scholar]
- dos Reis, R.; Odaguil, F.; Windels, E.; Teeuwen, Y.; van der Pols, J.; Laskaridis, P.; Bergmann, D.; Eisenhut, D.; Moebs, N.; Brenner, F. Deliverable 2.1—Requirements and Reference Aircraft. Technical Report. 2021. Available online: https://cordis.europa.eu/project/id/875551/results (accessed on 9 February 2025).
- Hartmann, C.; Nøland, J.; Nilssen, R.; Mellerud, R. Dual Use of Liquid Hydrogen in a Next-Generation PEMFC-Powered Regional Aircraft with Superconducting Propulsion. IEEE Trans. Transp. Electrif. 2022, 8, 4760–4778. [Google Scholar] [CrossRef]
- Dickinson, E.J.F.; Hinds, G. The Butler-Volmer Equation for Polymer Electrolyte Membrane Fuel Cell (PEMFC) Electrode Kinetics: A Critical Discussion. J. Electrochem. Soc. 2019, 166, F221. [Google Scholar] [CrossRef]
- The Engineering ToolBox. Fuels—Higher and Lower Calorific Values. Available online: https://www.engineeringtoolbox.com/fuels-higher-calorific-values-d_169.html (accessed on 11 October 2024).
- Brewer, G. Hydrogen Aircraft Technology, 1st ed.; Routledge: Boca Raton, FL, USA, 1991. [Google Scholar] [CrossRef]
- Verstraete, D.; Hendrick, P.; Pilidis, P.; Ramsden, K. Hydrogen fuel tanks for subsonic transport aircraft. Int. J. Hydrogen Energy 2010, 35, 11085–11098. [Google Scholar] [CrossRef]
- Lin, C.; Van Dresar, N.; Hasan, M. Pressure Control Analysis of Cryogenic Storage Systems. J. Propuls. Power 2004, 20, 480–485. [Google Scholar] [CrossRef]
- Verstraete, D. The Potential of Liquid Hydrogen for Long Range Aircraft Propulsion. Ph.D. Thesis, Cranfield University, Wharley End, UK, 2009. [Google Scholar]
- IEA. Towards Hydrogen Definitions Based on Their Emissions Intensity. 2023. Available online: https://www.iea.org/reports/towards-hydrogen-definitions-based-on-their-emissions-intensity (accessed on 9 February 2025).
- Xu, C.; Dai, Q.; Gaines, L.; Hu, M.; Tukker, A.; Steubing, B. Future material demand for automotive lithium-based batteries. Commun. Mater. 2020, 1, 99. [Google Scholar] [CrossRef]
- European Environment Agency. Greenhouse Gas Emission Intensity of Electricity Generation in Europe. 2024. Available online: https://www.eea.europa.eu/en/analysis/indicators/greenhouse-gas-emission-intensity-of-1 (accessed on 11 October 2024).
- Xu, S.; Li, Z.; Yang, Q.; Chu, G.; Zhang, J.; Zhang, D.; Zhou, H.; Gao, M. Comparative Life Cycle Assessment of Energy Consumption, Pollutant Emission, and Cost Analysis of Coal/Oil/Biomass to Ethylene Glycol. ACS Sustain. Chem. Eng. 2021, 9, 15849–15860. [Google Scholar] [CrossRef]
- Wang, H.; Wang, Y.; Mi, H.; Zang, J.; Wang, S. Analysis of Carbon Emission Energy Inventory from Refrigerant Production and Recycling Carbon Compensation. Appl. Sci. 2021, 12, 1. [Google Scholar] [CrossRef]
Disclaimer/Publisher’s Note: The statements, opinions and data contained in all publications are solely those of the individual author(s) and contributor(s) and not of MDPI and/or the editor(s). MDPI and/or the editor(s) disclaim responsibility for any injury to people or property resulting from any ideas, methods, instructions or products referred to in the content. |
© 2025 by the authors. Licensee MDPI, Basel, Switzerland. This article is an open access article distributed under the terms and conditions of the Creative Commons Attribution (CC BY) license (https://creativecommons.org/licenses/by/4.0/).