
A Comparative Analysis of Solar Thermal and Photovoltaic Systems with Heat-Pump Integration in a New-Build House Under Controlled Conditions


Abstract
1. Introduction
1.1. Problem Statement
1.2. Contribution of This Research
1.3. Research Questions
- How can combined benefits of solar PV and solar thermal be evaluated when working with an air-source heat pump used for space heating and domestic hot water?
- What is the relative benefit of solar thermal compared to PV in houses heated with air-source heat pumps?
2. Modelling PV, ST, and Hybrid PV/T Systems in Residential Buildings
3. Materials and Methods
3.1. Development of a Calibrated Model
3.2. Modelling Building Energy Consumption
3.3. Modelling Renewable Energy Systems
- Baseline (heat pump only);
- Heat pump with 4 m2 PV;
- Heat pump with 4 m2 ST;
- Heat pump with 2 m2 PV and 2 m2 ST;
- Baseline—increased hot water demand;
- Heat pump with 4 m2 ST—increased hot water demand;
- Heat pump with 4 m2 PV—increased hot water demand;
- Heat pump with 2 m2 PV and 2 m2 ST—increased hot water demand.
3.3.1. PV System
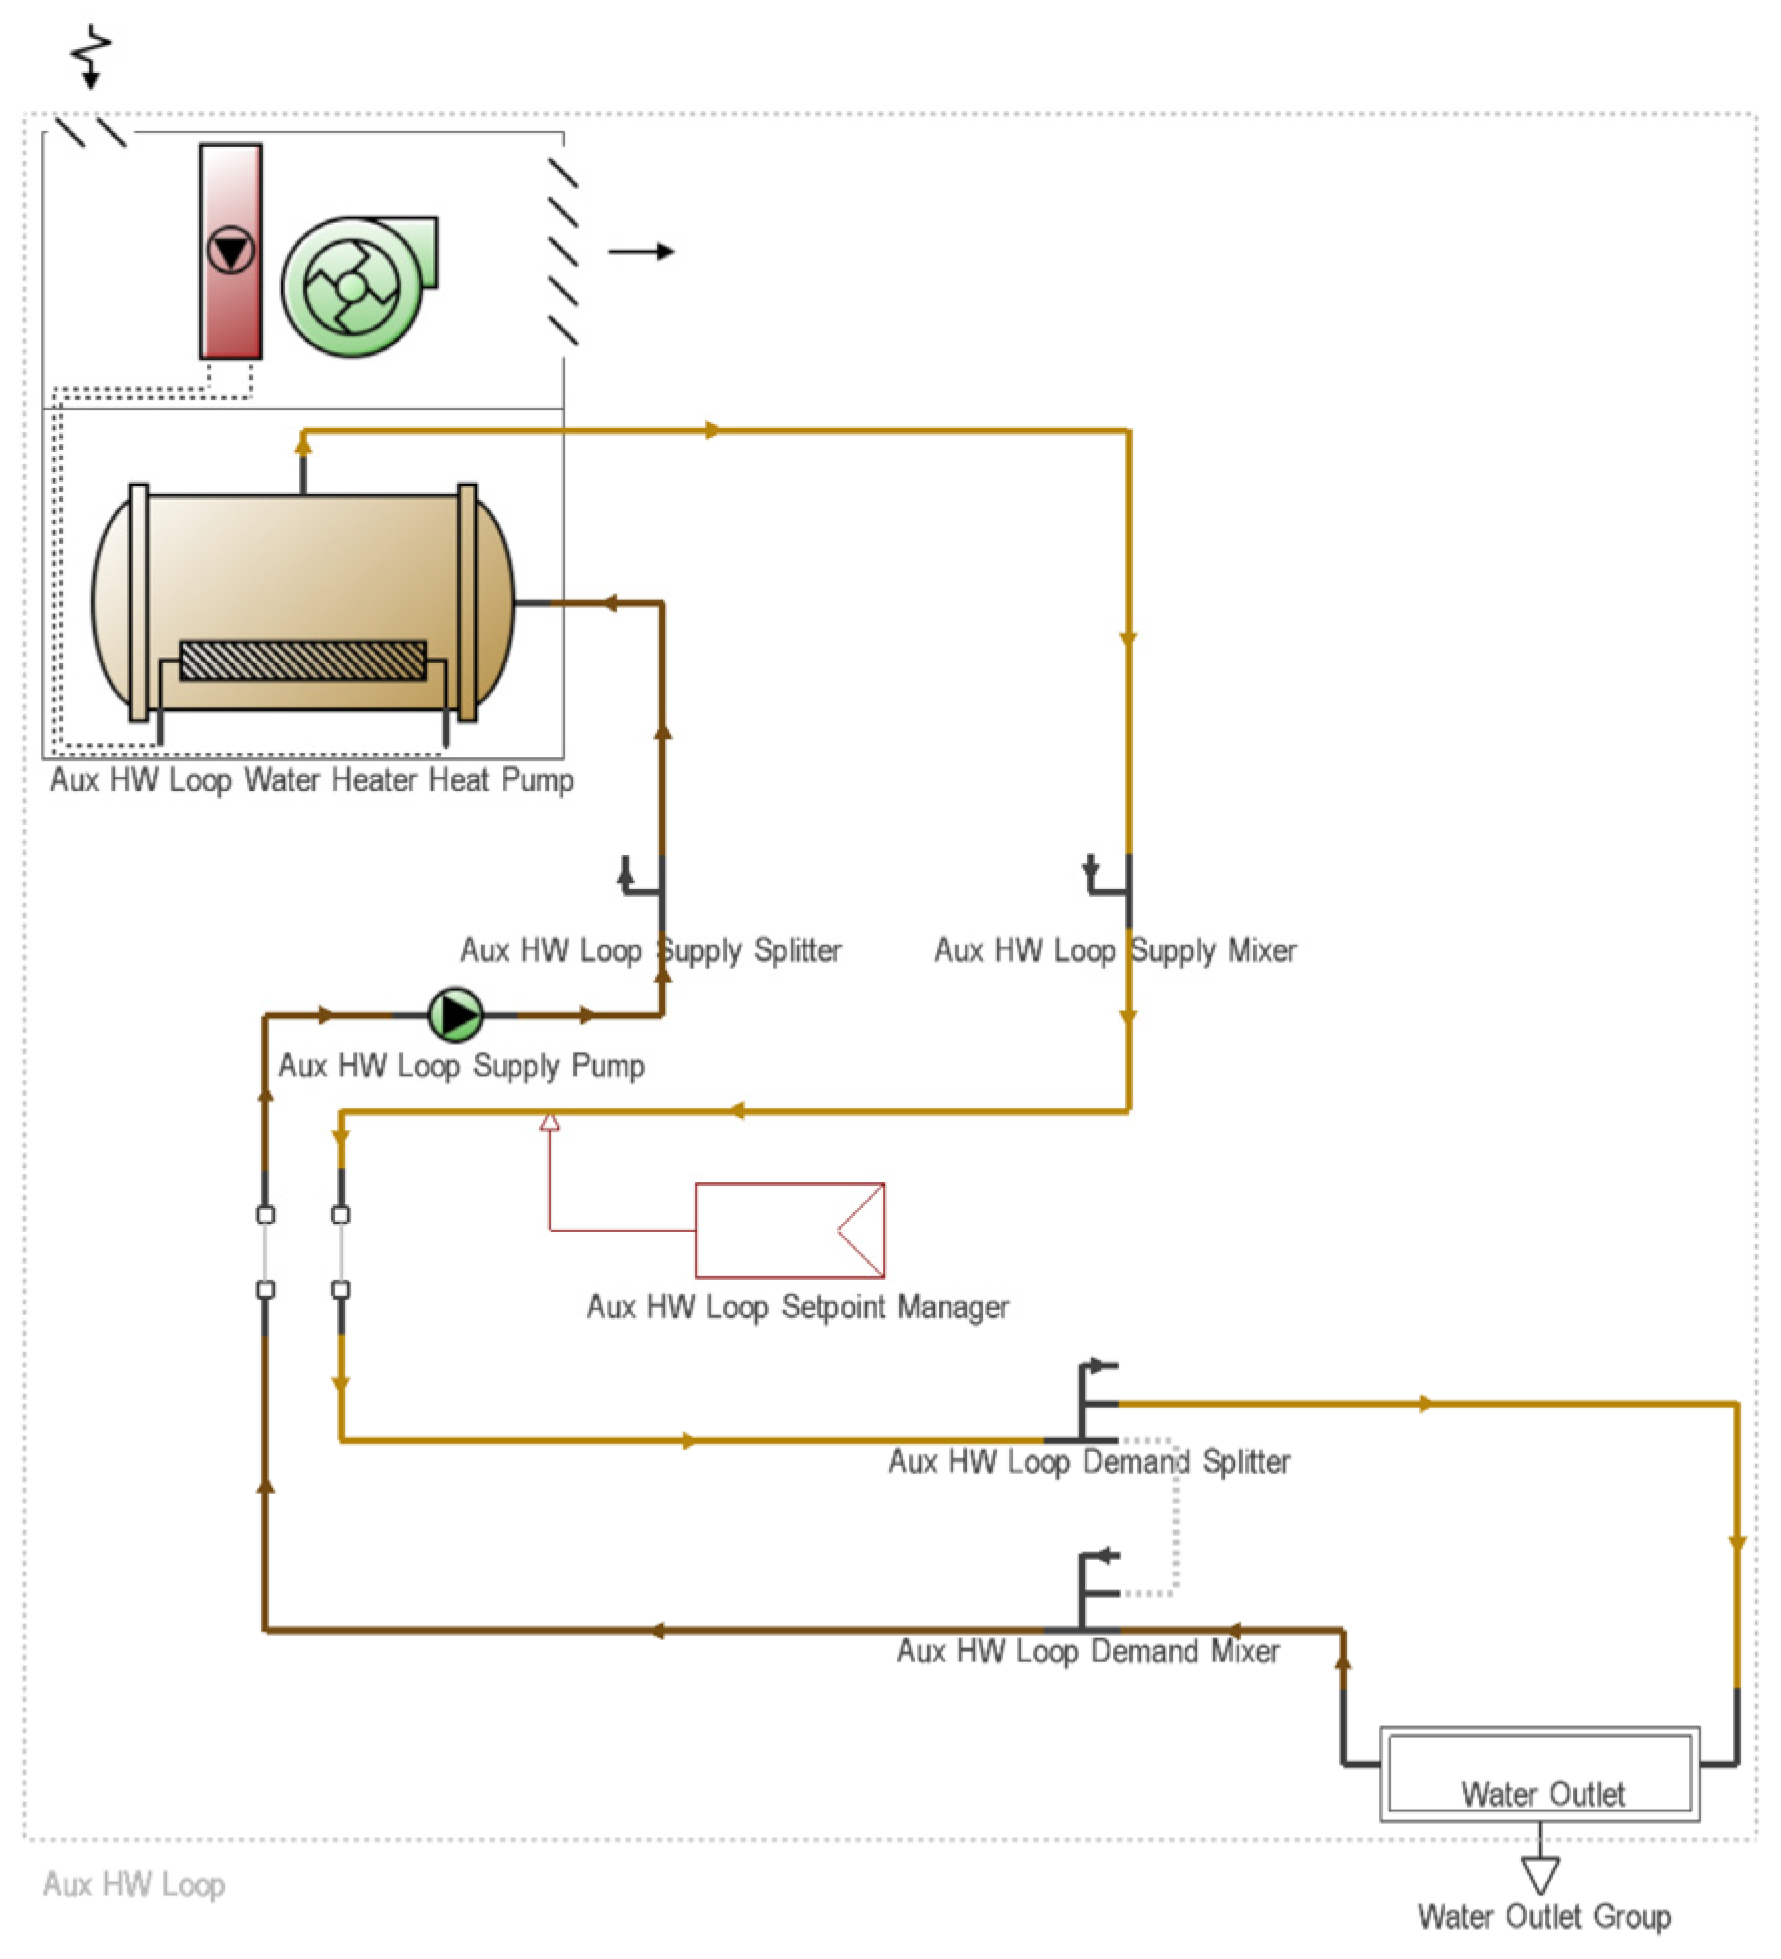
3.3.2. ST System
3.3.3. Increased Hot Water Demand
4. Results and Discussion
4.1. Annual Electricity Consumption and Renewable Generation
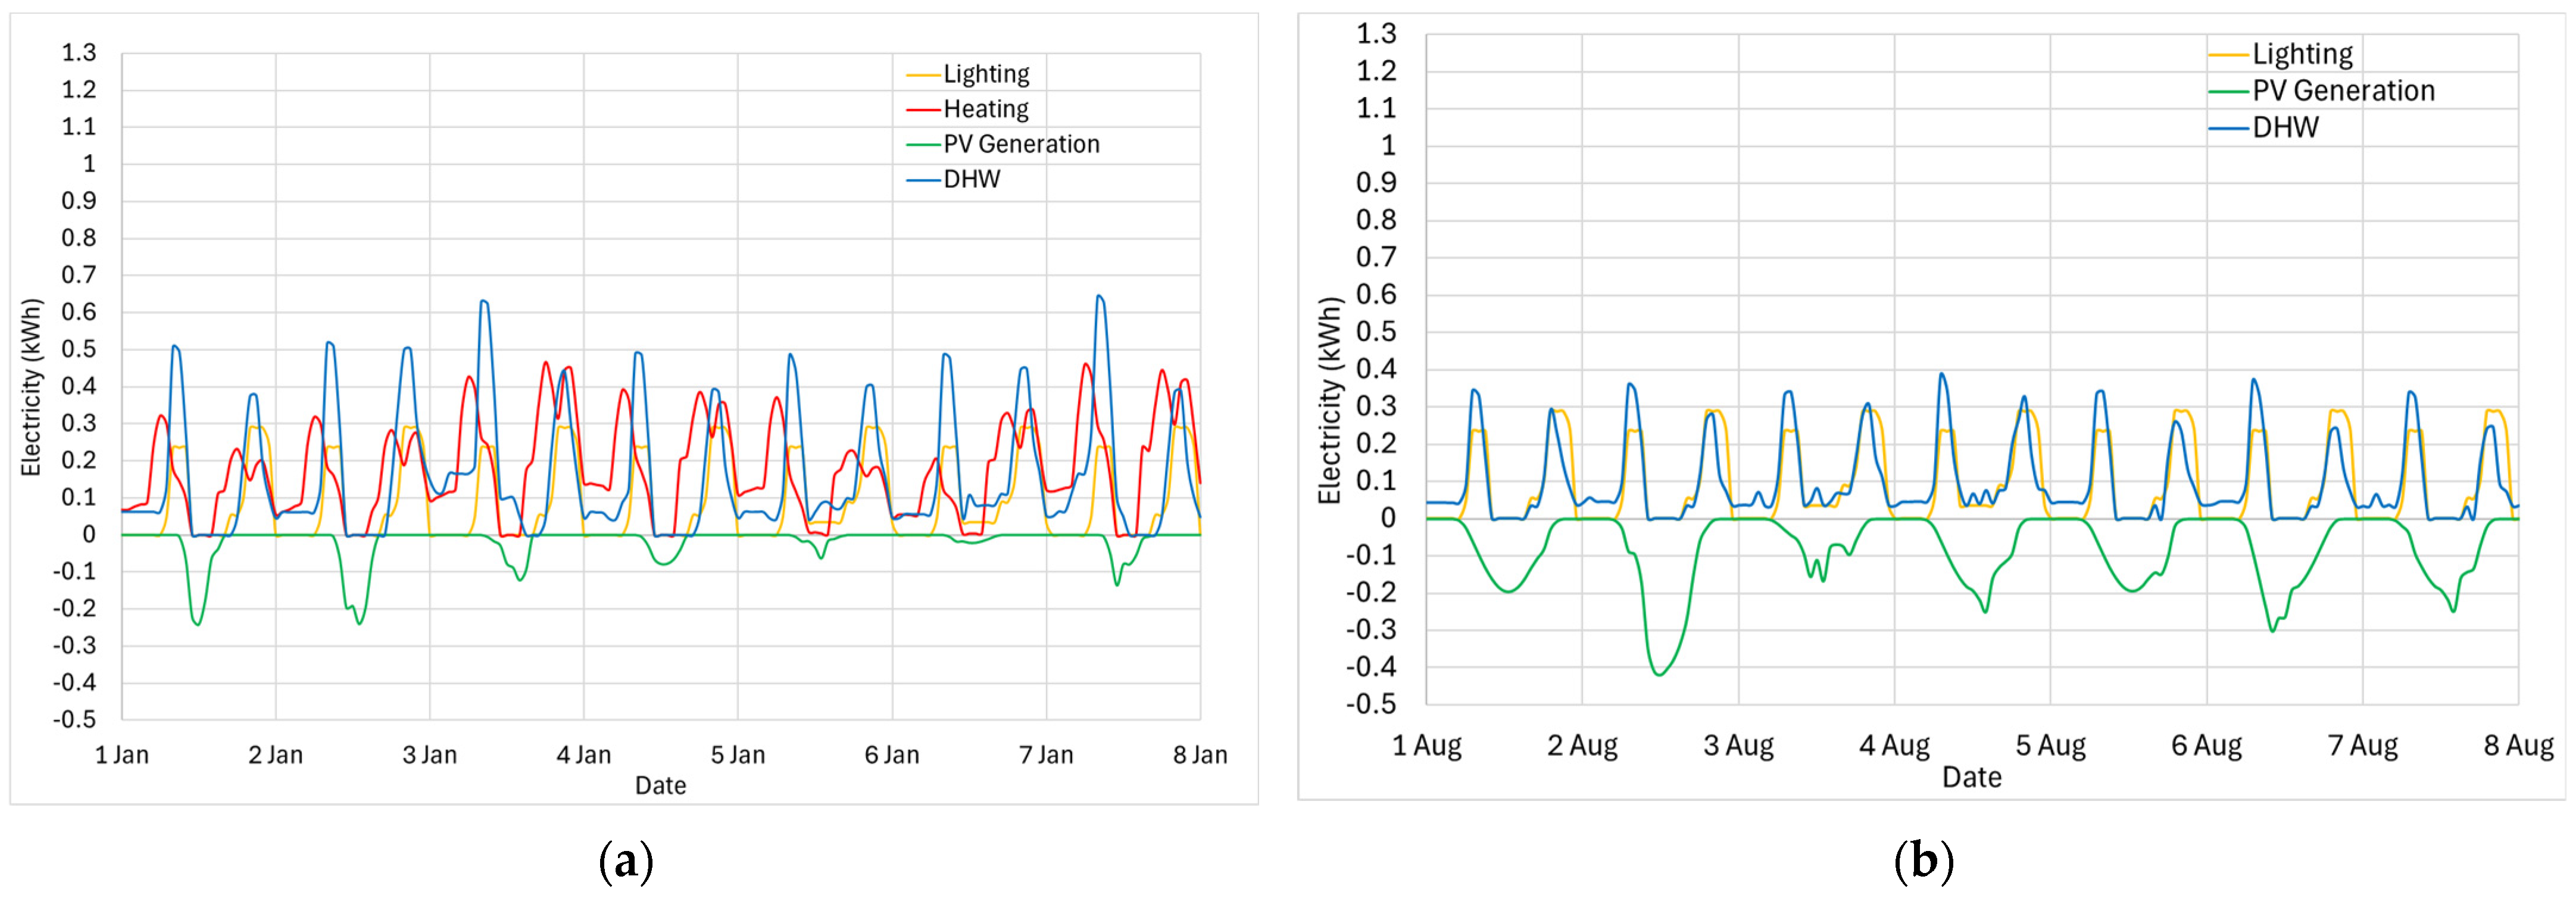
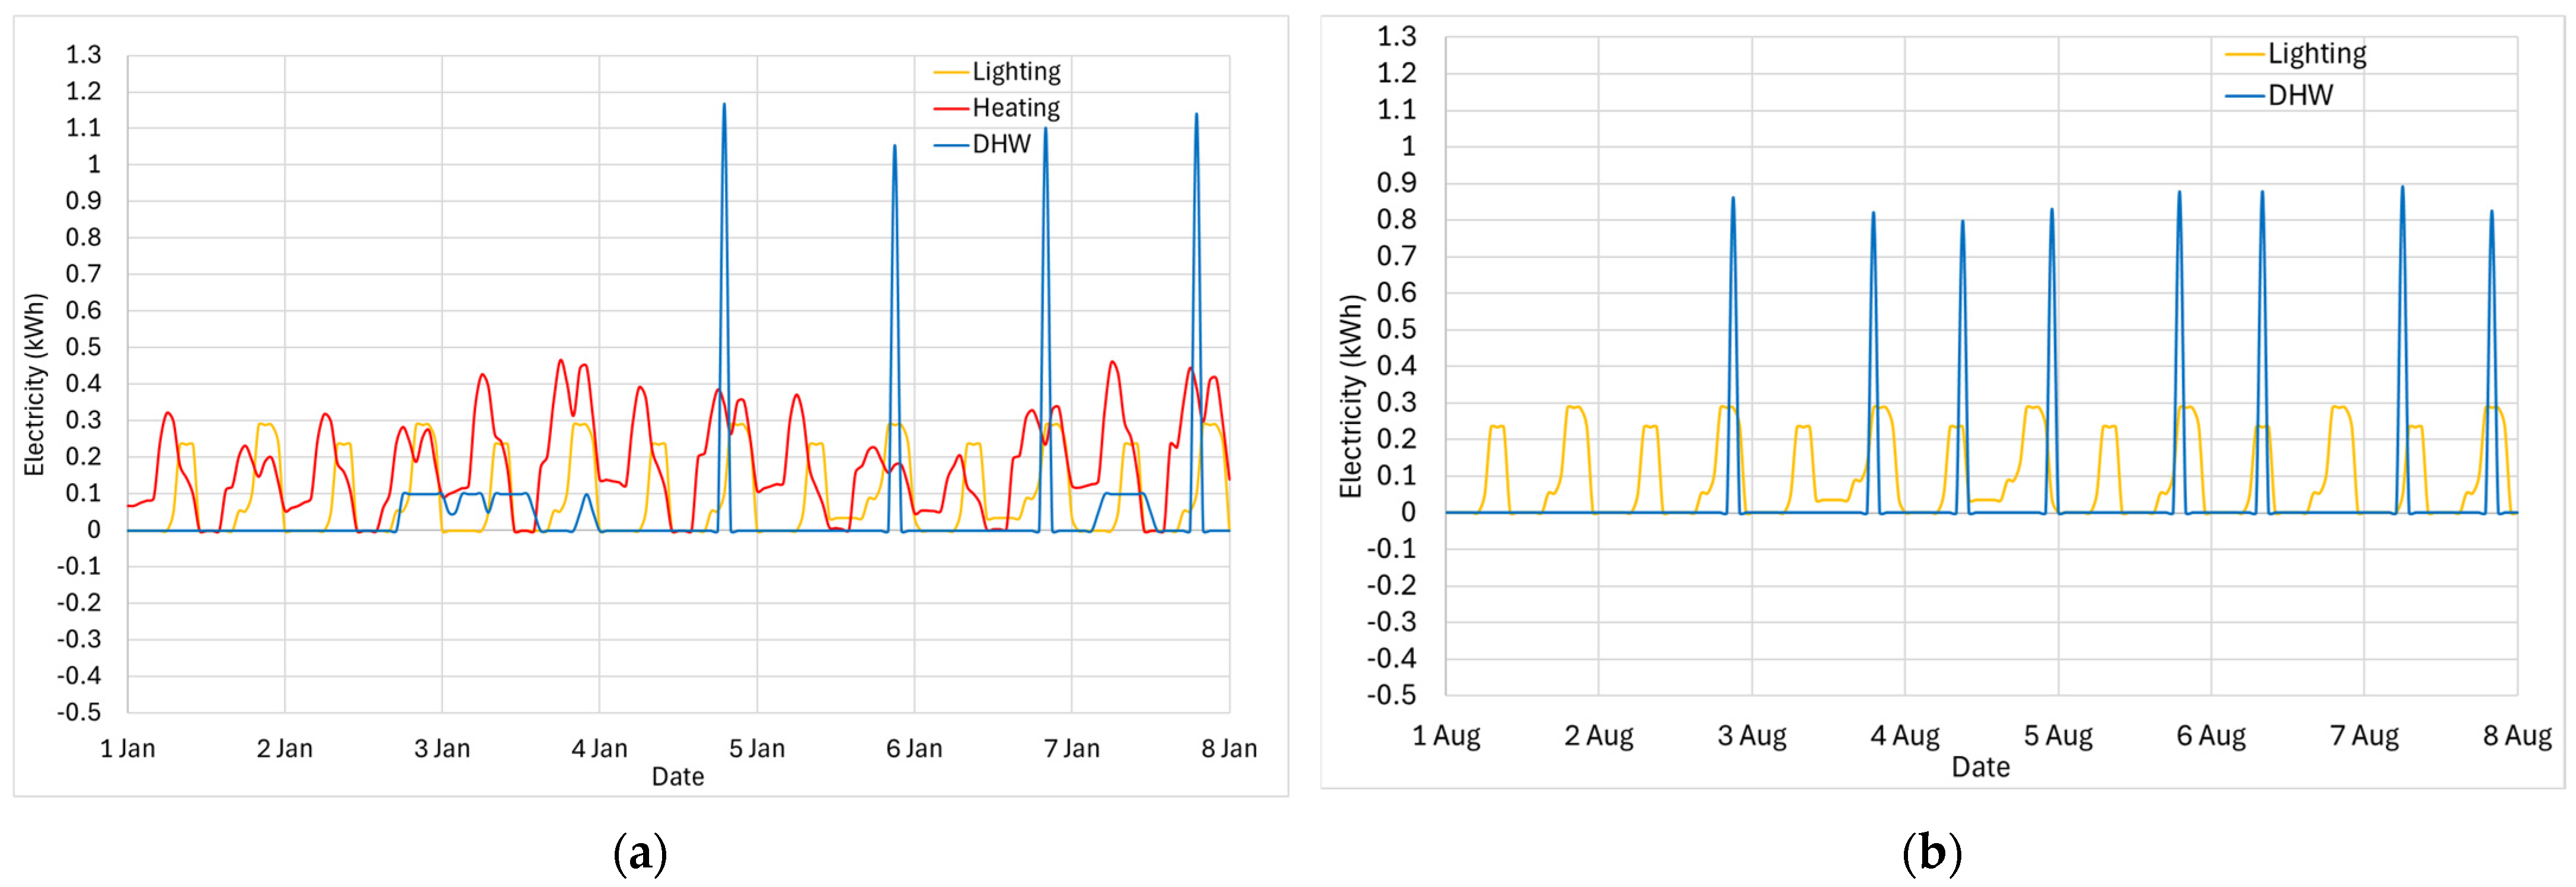
4.2. Hourly Electricity Consumption Patterns
4.3. Cost and Carbon Anlaysis
4.4. Compartive Analysis of PV and ST Systems
5. Conclusions
- The 4 m2 ST system provided 964.6 kWh of thermal energy annually under standard occupancy, increasing significantly to 1528 kWh under higher hot water demand conditions.
- The 4 m2 PV system generated 532.5 kWh of electricity annually, with 290.7 kWh consumed on site and 241.8 kWh exported.
- The relative benefit of ST compared to PV strongly depends on the actual CoP of the heat pump and the assumed hot water demand used in SAP calculations; a lower real COP and higher hot water demand both significantly enhance the benefit and cost-effectiveness of ST systems.
Author Contributions
Funding
Data Availability Statement
Acknowledgments
Conflicts of Interest
Abbreviations
| ASHP | Air-source heat pump |
| DHW | Domestic hot water |
| PV | Photovoltaic system |
| SAP | Standard Assessment Procedure |
| ST | Solar thermal system |
| TFH | The Future Home |
| COP | Coefficient of Performance |
References
- The Stationery Office Limited. The Climate Change Act 2008 (2050 Target Amendment) Order 2019. Available online: https://www.legislation.gov.uk/uksi/2019/1056/contents/made (accessed on 1 June 2025).
- HM Government. Building for 2050; Department for Business, Energy & Industrial Strategy: London, UK, 2022.
- HM Government. The Future Homes and Buildings Standards: 2023 Consultation; Department for Levelling Up, Housing and Communities: London, UK, 2023.
- HM Government RIBA Publishing Ltd. UK Building Regulations. Part L1A: Conservation of Fuel and Power in New Dwellings; HM Government RIBA Publishing Ltd.: London, UK, 2023. [Google Scholar]
- HM Government BEIS. SAP 10.2: The Government’s Standard Assessment Procedure for Energy Rating of Dwellings; BRE Garston: Watford, UK, 2023.
- HM Government. The Home Energy Model Making the Standard Assessment Procedure Fit for a Net Zero Future; Department for Energy Security and Net Zero: London, UK, 2023.
- Climate Change Committee. UK Housing: Fit for the Future? Climate Change Committee: London, UK, 2019. [Google Scholar]
- Abbasi, M.H.; Abdullah, B.; Ahmad, M.W.; Rostami, A.; Cullen, J. Heat Transition in the European Building Sector: Overview of the Heat Decarbonisation Practices through Heat Pump Technology. Sustain. Energy Technol. Assess. 2021, 48, 101630. [Google Scholar] [CrossRef]
- Energy Saving Trust. The Heat Is on: Heat Pump Field Trials Phase 2; Energy Saving Trust: London, UK, 2013. [Google Scholar]
- Carroll, P.; Chesser, M.; Lyons, P. Air Source Heat Pumps Field Studies: A Systematic Literature Review. Renew. Sustain. Energy Rev. 2020, 134, 110275. [Google Scholar] [CrossRef]
- Chesser, M.; Lyons, P.; O’Reilly, P.; Carroll, P. Air Source Heat Pump In-Situ Performance. Energy Build. 2021, 251, 111365. [Google Scholar] [CrossRef]
- Watson, S.D.; Crawley, J.; Lomas, K.J.; Buswell, R.A. Predicting Future GB Heat Pump Electricity Demand. Energy Build. 2023, 286, 112917. [Google Scholar] [CrossRef]
- IEA. IEA Annex 38. Solar and Heat Pump Systems. A Joint Project with the IEA “Solar Heating and Cooling” Implementing Agreement (SHC) Task 44. Available online: https://heatpumpingtechnologies.org/annex38/ (accessed on 24 April 2025).
- Energy House Labs Energy House 2.0 | Energy House Labs | University of Salford. Available online: https://energyhouselabs.salford.ac.uk/labs/energy-house-2-0/ (accessed on 20 February 2025).
- DesignBuilder DesignBuilder Software Ltd. Version 7.3.0.044: Stroud, UK. 2024. Available online: https://designbuilder.co.uk/ (accessed on 1 June 2025).
- Tsang, C.; Fitton, R.; Zhang, X.; Henshaw, G.; Hernandez, H.D.; Farmer, D.; Allinson, D.; Dagli, M.; Jankovic, L.; Swan, W. Dataset for Article: “Calibration of Building Performance Simulations for Zero Carbon Ready Homes: Two Open Access Case Studies in Controlled Conditions”; University of Salford: Manchester, UK, 2025. [Google Scholar] [CrossRef]
- ISO 9869-1:2014; Thermal Insulation—Building Elements—In-Situ Measurement of Thermal Resistance and Thermal Transmittance Part 1: Heat Flow Meter Method. ISO: Geneva, Switzerland, 2014.
- ATTMA. ATTMA Technical Standard L1. Measuring the Air Permeability of Building Envelopes (Dwellings); Air Tightness Testing and Measurement Association: Northampton, UK, 2010. [Google Scholar]
- Fitton, R.; Diaz, H.; Farmer, D.; Henshaw, G.; Sitmalidis, A.; Swan, W. Bellway Homes “The Future Home” Baseline Performance Report; ERDF & Innovate: Salford, UK, 2024. [Google Scholar]
- Tsang, C.; Fitton, R.; Hernandez, H.D.; Henshaw, G.; Sitmalidis, A. Pioneering Net Zero Homes: A Study of Bellway “The Future Home” Simulation Calibration; University of Salford: Manchester, UK, 2024. [Google Scholar]
- Johnston, D.; Miles-Shenton, D.; Wingfield, J.; Farmer, D.; Bell, M. Whole House Heat Loss Test Method (Coheating); Leeds Metropolitan University: Leeds, UK, 2012. [Google Scholar]
- BS EN 17887-1:2024; Thermal Performance of Buildings. In Situ Testing of Completed Buildings. Data Collection for Aggregate Heat Loss Test (Part 1). British Standards Institution: London, UK, 2024.
- Bagalini, V.; Zhao, B.Y.; Wang, R.Z.; Desideri, U. Solar PV-Battery-Electric Grid-Based Energy System for Residential Applications: System Configuration and Viability. Research 2019, 2019, 3838603. [Google Scholar] [CrossRef] [PubMed]
- Albatayneh, A.; Albadaineh, R.; Karasneh, D. The Impact of PV Panels on Cooling and Heating Loads of Residential Buildings in a Humid Subtropical Climate Zone. Energy Explor. Exploit. 2023, 41, 1762–1778. [Google Scholar] [CrossRef]
- Ma, Y.; Xi, J.; Cai, J.; Gu, Z. TRNSYS Simulation Study of the Operational Energy Characteristics of a Hot Water Supply System for the Integrated Design of Solar Coupled Air Source Heat Pumps. Chemosphere 2023, 338, 139453. [Google Scholar] [CrossRef] [PubMed]
- Rezapour, S.; Jahangiri, M.; Shahrezaie, A.G.; Goli, A.; Farsani, R.Y.; Almutairi, K.; Ao, H.X.; Dehshiri, S.J.H.; Dehshiri, S.S.H.; Mostafaeipour, A.; et al. Dynamic Simulation and Ranking of Using Residential-Scale Solar Water Heater in Iran. J. Environ. Eng. Landsc. Manag. 2022, 30, 30–42. [Google Scholar] [CrossRef]
- Antoniadis, C.N.; Martinopoulos, G. Optimization of a Building Integrated Solar Thermal System with Seasonal Storage Using TRNSYS. Renew. Energy 2019, 137, 56–66. [Google Scholar] [CrossRef]
- Da, J.; Li, M.; Li, G.; Wang, Y.; Zhang, Y. Simulation and Experiment of a Photovoltaic—Air Source Heat Pump System with Thermal Energy Storage for Heating and Domestic Hot Water Supply. Build. Simul. 2023, 16, 1897–1913. [Google Scholar] [CrossRef]
- Calise, F.; Dentice d’Accadia, M.; Figaj, R.D.; Vanoli, L. A Novel Solar-Assisted Heat Pump Driven by Photovoltaic/Thermal Collectors: Dynamic Simulation and Thermoeconomic Optimization. Energy 2016, 95, 346–366. [Google Scholar] [CrossRef]
- Pater, S. Long-Term Performance Analysis Using TRNSYS Software of Hybrid Systems with PV-T. Energies 2021, 14, 6921. [Google Scholar] [CrossRef]
- Hawila, A.; Alsalloum, H.; Merabtine, A.; Fardoun, F.; Bennacer, R. Plus Energy Buildings: A Numerical Case Study. Fluid Dyn. Mater. Process 2022, 19, 117–134. [Google Scholar] [CrossRef]
- Bee, E.; Prada, A.; Baggio, P.; Psimopoulos, E. Air-Source Heat Pump and Photovoltaic Systems for Residential Heating and Cooling: Potential of Self-Consumption in Different European Climates. Build. Simul. 2019, 12, 453–463. [Google Scholar] [CrossRef]
- HM Government. National Calculation Methodology (NCM) Modelling Guide (for Building Other Than Dwellings in England and Wales); HM Government: London, UK, 2021.
- Fitton, R.; Henshaw, G.; Swan, W.; Clark, P.; Farmer, D.; Sitmalidis, A.; Zhang, X. Energy House 2.0 Study on Future Homes Standard Heating Systems; University of Salford: Manchester, UK, 2024. [Google Scholar]
- Viridian Solar. Clearline Fusion G1 Solar Photovoltaic Panels; Atlas Building: Cambridge, UK, 2024. [Google Scholar]
- GREENoneTEC. FK8003 7one Frame Collector; Senergy Innovations: Belfast, UK, 2016. [Google Scholar]
- Zukowski, M.; Kosior-Kazberuk, M.; Blaszczynski, T. Energy and Environmental Performance of Solar Thermal Collectors and PV Panel System in Renovated Historical Building. Energies 2021, 14, 7158. [Google Scholar] [CrossRef]
- HM Government. Domestic Hot-Water Use: Observations on Hot-Water Use from Connected Devices; Department for Energy Security and Net Zero: London, UK, 2024.
- Ofgem Energy Price Cap. Available online: https://www.ofgem.gov.uk/energy-price-cap (accessed on 1 December 2024).
- Octopus Energy Smart Export Guarantee. Available online: https://octopus.energy/smart/smart-export-guarantee/ (accessed on 1 December 2024).
- Heat Pump Centre. HPT-Annex 46 Domestic Hot Water Heat Pumps: Calculation Models for Domestic Hot Water Systems; Heat Pump Centre: Eskilstuna, Sweden, 2019. [Google Scholar]


| Building Component | Value | Type |
|---|---|---|
| Brick external wall U-value | 0.17 W/m2K | As-built |
| Rendered external wall U-value | 0.17 W/m2K | As-built |
| Loft ceiling U-value | 0.14 W/m2K | As-built |
| Ground floor PTT-value | 0.14 W/m2K | As-built |
| Windows U-value | 1.20 W/m2K | Design |
| Windows SHGC | 0.51 | Design |
| French Door U-value | 1.40 W/m2K | Design |
| External Door U-value | 1.00 W/m2K | Design |
| Air infiltration rate @50 Pa | 2.50 m3/hm2 | As-built |
| Internal partition U-value | 1.89 W/m2K | As-built |
| Internal floor U-value | 1.16 W/m2K | As-built |
| Internal door U-value | 2.82 W/m2K | As-built |
| Parameters | Value |
|---|---|
| Cell type | Crystalline silicon |
| Cells in series | 60 |
| Active area (m2) | 1.89 |
| Rated electric power output per module (W) | 250 |
| Module heat loss coefficient (W/m2K) | 30 |
| Peak Power (Wp) | 400 |
| Module efficiency | 21.2 |
| Short circuit current (A) | 10.3 |
| Module current at max power (A) | 9.7 |
| Temperature coefficient of short circuit current (A/K) | 0.00515 |
| Open circuit voltage (V) | 42 |
| Module voltage at max power (V) | 34.7 |
| Temperature coefficient of open circuit voltage (V/K) | −0.126 |
| Parameters | Value |
|---|---|
| Maximum flow rate (m3/s) | 0.0000810 |
| Gross area (m2) | 2.02 |
| Aperture area (m2) | 1.84 |
| Test flow rate (m3/s) | 0.0000405 |
| Efficiency Equation Coefficient 1 | 0.73 |
| Efficiency Equation Coefficient 2 (W/m2K) | −3.96 |
| Efficiency Equation Coefficient 3 (W/m2K2) | −0.011 |
| Incident Angle Modifier (IAM) Coefficient 1 | 1 |
| IAM Coefficient 2 | 0.1386 |
| IAM Coefficient 3 | 0 |
| Scenario | Description | Renewable Generation (kWh/year) | DHW Electricity Consumption (kWh/year) | Heating and Lighting Electricity Consumption (kWh/year) | Building Electricity Consumption (kWh/year) |
|---|---|---|---|---|---|
| 1 | Baseline | 0 | 1264.9 | 1198.7 | 2463.6 |
| 2 | 4 m2 PV | 532.5 electricity generated (241.8 exported to grid, 290.7 consumed) | 1264.9 | 1198.7 | 2172.9 |
| 3 | 4 m2 ST | 964.6 solar thermal energy generated | 944.5 | 1198.7 | 2143.2 |
| 4 | 2 m2 PV + 2 m2 ST | 482.3 solar thermal energy generated and 272.2 electricity generated by PV (93.7 exported to grid, 178.5 consumed) | 1104.7 | 1198.7 | 2124.9 |
| 5 | Baseline—increased DHW consumption rate | 0 | 1993.4 | 1198.7 | 3192.1 |
| 6 | 4 m2 ST—increase DHW consumption rate | 1528 thermal energy generated | 1485.8 | 1198.7 | 2684.5 |
| 7 | 4 m2 PV—increase DHW consumption rate | 532.5 electricity generated (241.8 exported to grid, 290.7 consumed) | 1993.4 | 1198.7 | 2901.4 |
| 8 | 2 m2 PV + 2 m2 ST—increase DHW consumption rate | 764 solar thermal energy generated and 272.2 electricity generated by PV (93.7 exported to grid, 178.5 consumed) | 1739.6 | 1198.7 | 2759.8 |
| Scenario | Description | Electricity Consumed (kWh) | Electricity Exported (kWh) | Annual Running Cost (GBP) | Electricity Offsetting Carbon Impact (CO2/year) |
|---|---|---|---|---|---|
| 1 | Baseline | 2463.6 | 0 | 826.19 | 355.99 |
| 2 | 4 m2 PV | 2172.9 | 241.8 | 745.06 | 288.54 |
| 3 | 4 m2 ST | 2143.2 | 0 | 747.69 | 310.94 |
| 4 | 2 m2 PV + 2 m2 ST | 2124.9 | 93.7 | 739.36 | 298.48 |
| 5 | Baseline—increased DHW consumption rate | 3192.1 | 0 | 1004.67 | 458.42 |
| 6 | 4 m2 ST—increase DHW consumption rate | 2684.5 | 0 | 880.31 | 387.04 |
| 7 | 4 m2 PV—increase DHW consumption rate | 2901.4 | 241.8 | 923.54 | 390.97 |
| 8 | 2 m2 PV + 2 m2 ST—increase DHW consumption rate | 2759.8 | 93.7 | 894.92 | 387.75 |
Disclaimer/Publisher’s Note: The statements, opinions and data contained in all publications are solely those of the individual author(s) and contributor(s) and not of MDPI and/or the editor(s). MDPI and/or the editor(s) disclaim responsibility for any injury to people or property resulting from any ideas, methods, instructions or products referred to in the content. |
© 2025 by the authors. Licensee MDPI, Basel, Switzerland. This article is an open access article distributed under the terms and conditions of the Creative Commons Attribution (CC BY) license (https://creativecommons.org/licenses/by/4.0/).
Share and Cite
Tsang, C.; Jankovic, L.; Swan, W.; Fitton, R.; Henshaw, G. A Comparative Analysis of Solar Thermal and Photovoltaic Systems with Heat-Pump Integration in a New-Build House Under Controlled Conditions. Energies 2025, 18, 2988. https://doi.org/10.3390/en18112988
Tsang C, Jankovic L, Swan W, Fitton R, Henshaw G. A Comparative Analysis of Solar Thermal and Photovoltaic Systems with Heat-Pump Integration in a New-Build House Under Controlled Conditions. Energies. 2025; 18(11):2988. https://doi.org/10.3390/en18112988
Chicago/Turabian StyleTsang, Christopher, Ljubomir Jankovic, William Swan, Richard Fitton, and Grant Henshaw. 2025. "A Comparative Analysis of Solar Thermal and Photovoltaic Systems with Heat-Pump Integration in a New-Build House Under Controlled Conditions" Energies 18, no. 11: 2988. https://doi.org/10.3390/en18112988
APA StyleTsang, C., Jankovic, L., Swan, W., Fitton, R., & Henshaw, G. (2025). A Comparative Analysis of Solar Thermal and Photovoltaic Systems with Heat-Pump Integration in a New-Build House Under Controlled Conditions. Energies, 18(11), 2988. https://doi.org/10.3390/en18112988