Abstract
China’s electric vehicle (EV) fleet has reached 30 million, and the effective utilization of their charging and discharging capabilities can provide substantial regulation support to restore supply–demand balance. A prerequisite to achieving this benefit is the proper estimation and utilization of the regulation potential inherent in EVs. This paper focuses on charging stations and introduces a station-aggregator response resource trading mechanism considering energy–power coupling of response capability. First, the response capacity of charging stations is estimated from both energy and power perspectives. Next, trading behavior models are developed separately for charging stations and aggregators. Finally, a joint resource trading mechanism based on a Stackelberg game is proposed to coordinate responses between these entities. Simulation results validate the effectiveness of the proposed estimation method and the economic advantages of the trading mechanism, thereby realizing a win–win outcome.
1. Introduction
The introduction of dual-carbon goals has resulted in a progressively higher proportion of renewable energy generation each year; however, the widespread integration of clean energy inevitably brings strong intermittency, leading to frequent power imbalances and diminishing the system’s regulation capability. Continuing to address these issues from the generation side by constructing new power plants or increasing reserve capacities not only conflicts with the dual-carbon objectives but also imposes substantial economic costs. Therefore, implementing demand response (DR) on the load side constitutes an effective approach to resolving these challenges.
DR participants can be broadly categorized into three sectors: residential loads, industrial loads, and commercial loads. Residential loads can be further divided into household appliances and electric vehicles (EVs). Compared to household appliances, EVs exhibit higher charging power and more regular travel patterns. In China, EVs are growing at an annual rate of up to 90%, exceeding ten million, indicating tremendous potential for DR.
EVs are capable of providing various ancillary services to the power system, and a wide range of control strategies have been extensively studied. Ref. [1] dynamically adjusts the discharge rate of pure EVs in real time, considering actual grid load and EV characteristics, to provide peak-shaving support for the system. In [2], a hierarchical and distributed frequency regulation strategy for EV clusters was optimized based on demand-driven charging loads. A method for evaluating frequency regulation capacity is introduced in [3], taking into account user charging demands and battery degradation. Refs. [4,5] further explore cloud–edge collaborative architectures and reserve provision mechanisms under uncertain activation conditions, respectively, aiming to enhance real-time responsiveness and reliability. However, most of these works focus primarily on system-level control or cluster-level optimization, without fully addressing the heterogeneity and dynamic behavior of EVs at individual charging stations.
In contrast to control-focused strategies, another body of literature emphasizes the commercialization of EV flexibility resources, exploring trading mechanisms between EVs and the grid or aggregators. Ref. [6] treats EVs as mobile storage units participating in peer-to-peer (P2P) energy trading. In [7], a blockchain-based consortium framework is proposed to ensure secure and trustworthy energy trading between EVs and service providers (SPs). A user-perception-based approach that incorporates response willingness is developed in [8], enabling regulation capacity (RC) estimation for individual EVs based on their charging/discharging state and state of charge (SOC). Refs. [9,10] explore auction-based trading mechanisms to incentivize EVs to participate in DR. These energy trading models rely on well-designed scheduling strategies that aim to meet system requirements while maximizing profits or minimizing costs for participants. An adaptive robust optimization model is presented in [11] to handle uncertainty in EV charging demand and reduce station operation costs, while [12] proposes an option-based DR strategy to mitigate supply–demand imbalance risks.
Moreover, refs. [13,14,15] investigate the impact of high energy consumption, usage randomness, and storage constraints of pure EVs on residential DR elasticity and fairness. A decentralized EV scheduling scheme is proposed in [14] to reshape grid load profiles, and [15] further considers user-side time-aware fairness in scheduling. Despite the progress in both control and trading domains, a critical limitation in the above works lies in the lack of detailed, station-level temporal estimation of EV response potential.
Some studies, such as [16], incorporate EVs into energy system planning models, but their treatment of response potential remains qualitative or embedded within upper-level decisions without quantitative analysis. Although Ref. [17] optimizes the DR capability of EV groups, it does not explicitly characterize regulation capacity or account for the fine-grained temporal distribution of charging behaviors at individual stations.
Current research faces the following issues: (1) EV response capability is inherently time dependent, and accurately describing its temporal response potential remains a challenge. (2) Charging stations vary significantly in size, and the sheer number of stations makes direct participation in transactions with the dispatching center highly complex. To address these gaps, this paper proposes a station-aggregator response resource trading mechanism considering energy–power coupling of response capability. The key innovations are as follows:
- (1)
- An innovative energy–power coupling description method is introduced to accurately estimate the response potential at the charging station level, which captures station-level flexibility by considering both energy and power constraints.
- (2)
- A risk-aware load aggregation mechanism is introduced, whereby the load aggregator (LA) coordinates multiple charging stations to form a stable response portfolio.
- (3)
- A Stackelberg game-based interaction model is developed to facilitate strategic decision making between the LA and individual charging stations.
2. Framework and Models
2.1. Framework
From the perspectives of system optimization and market design, the station-based aggregation mode—using charging stations as intermediaries—demonstrates significant advantages compared with the bilateral contracting mode directly between EVs and LAs, which involves high transaction costs, uncertainties in user behavior, and complexities of decentralized management.
As critical infrastructure nodes in integrated transportation–energy coupled systems, charging stations possess the following core advantages: (1) physical aggregation: EV resources can be spatially aggregated through centralized charging pile clusters; (2) operational stability: a predictable baseline of charging loads is formed based on fixed locations; (3) economies of scale: a typical single station, generally equipped with 50–200 charging piles, has MW-level potential for regulation. This “resource pooling” business model significantly reduces transaction friction costs.
However, from the current research perspective, studies on the response capability of charging stations remain relatively limited. DR in EV charging stations exhibits a typical domino effect. When a charging station operator adjusts the charging power for a specific EV, this intervention directly impacts the charging schedule of that EV, consequently altering its charging state in subsequent periods. The central constraint of this chain reaction lies in the charging demand targets set by vehicle owners. Most users specify clear charging objectives, establishing rigid boundaries for DR strategies. Neglecting this characteristic and estimating response capability based solely on instantaneous available power could result in significant risks of strategic failure.
From a behavioral perspective, charging response decisions are further influenced by multiple psycho-economic factors. The willingness of users to respond does not follow a simple linear relationship; instead, it exhibits clear threshold effects and loss aversion characteristics. When electricity pricing incentives or compensations are insufficient, user participation willingness may experience a precipitous decline. Moreover, significant differences exist among users regarding sensitivity to charging duration. Commercial vehicle users might exhibit extreme sensitivity to charging delays, whereas private vehicle users may demonstrate greater temporal flexibility.
Resource competition within charging stations further complicates the issue. During peak periods, when a large number of EVs require simultaneous charging, charging resources may face a risk analogous to a bank run scenario. Under these conditions, simple power regulation could trigger a nonlinear increase in queuing times, and this congestion effect significantly reduces the actual schedulable capacity of the station.
In response to the aforementioned challenges, this paper undertakes the following research. Firstly, an estimation model of the charging station’s response capability is proposed, considering the chain reactions associated with responses, to assess the maximum achievable response capability under given conditions. Then, the behavior models for charging stations and LAs are developed. Finally, a transaction model for response resources between charging stations and LAs is developed to identify appropriate transaction prices and capacities. Figure 1 shows the flowchart of the proposed mechanism. To ensure the reliability and applicability of the estimation, this study utilizes charging data collected over a one-month period as the foundation for response potential estimation. By incorporating continuous operational data from the charging station, the evaluation framework captures the station’s stable response characteristics across diverse conditions, including variations in weather and traffic flow.
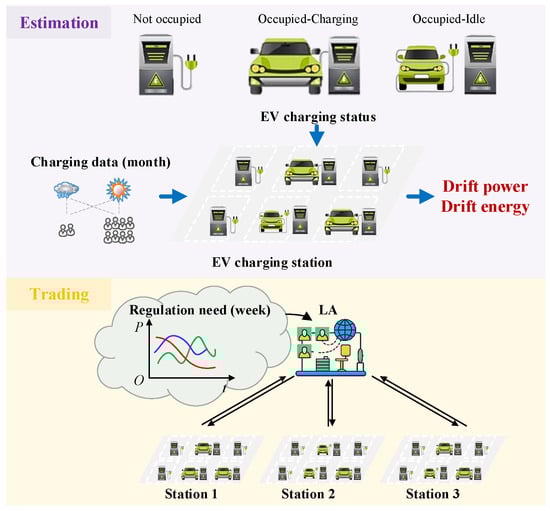
Figure 1.
Flowchart of the proposed trading mechanism.
2.2. EV Model
EVs are essentially mobile energy storage units, whose core characteristic is the dynamic nature of the battery’s SOC. In grid-interactive scenarios, the charging behavior of EVs can be viewed both as adjustable loads and as flexible regulation resources. Through optimized scheduling of charging sequences via intelligent chargers, temporal and spatial shifts in electricity usage can be achieved. The specific EV model is formulated as follows in Equations (1)–(6): Equation (1) calculates the user-specified SOC need, and (2) computes the SOC level at the next time interval, and (3) ensures that the total charging amount meets the user-defined requirement. Equations (4)–(5) impose constraints on charging power and SOC levels. Equation (6) constrains the operational time window during which EV charging is permitted.
where Sne(i) denotes the charging energy demand of user i, C0 represents the battery capacity, Sex(i) indicates the expected state of charge (SOC) for user i, S0(i) represents the initial SOC at the time of user i’s connection, S(i, t) represents the SOC of user i at time t, η is the charge/discharge efficiency, defined as charging efficiency ηc during charging and as the reciprocal of discharging efficiency ηd during discharging, P(i, t) denotes the charging/discharging power of user i at time t, Δt represents the duration of each time interval, PcN and PdN denote the rated charging and discharging power of the EV, respectively, Smax and Smin denote the upper and lower SOC limits of the EV battery, respectively, and tar(i) and tle(i) represent the arrival and expected departure times of user i, respectively.
3. Response Capacity Estimation
Constrained by the rigid charging requirements of EVs, their regulation capacity is not fixed but rather temporally shiftable. Thus, the estimation of their response potential should be based on energy rather than power. This is in contrast to thermostatically controlled loads where direct power adjustments can be achieved by changing temperature setpoints or switching operational states without significantly impacting subsequent usage within reasonable limits, i.e., only affecting user comfort. EVs have urgent charging objectives; adjusting or shifting their charging amount or charging periods inevitably influences subsequent behavior, thereby causing a chain reaction. Therefore, for charging stations, the available regulation power at any given moment is influenced by previous charging behaviors, and the current charging state directly impacts subsequent charging periods. Consequently, the potential estimation should be performed from an energy perspective rather than a power perspective.
To accurately quantify the regulation capability of EVs, the core indicator “drift energy” is introduced, which is defined as the total amount of electrical energy that can be reallocated to other periods without violating users’ charging objectives. Drift energy maintains energy conservation, emphasizing that regulation fundamentally represents temporal redistribution of electricity rather than the creation or elimination of energy. The amount of energy available for shifting depends on the current SOC, remaining parking duration, and charger power capacity. The drift energy gradually diminishes as the scheduled departure time approaches.
Equation (7) computes the required charging time trq(i) to achieve the target SOC for users; here, regulation resources are provided solely through pausing EV charging. This is because overly frequent charging and discharging cycles negatively impact EV batteries, resulting in capacity degradation. From the user’s perspective, the negative sentiment induced by battery degradation significantly outweighs the positive feedback from monetary compensation; hence, EV discharging is not considered. Equation (8) calculates the idle time tdf(i), and (9) computes the drift energy Edf(i) that a specific EV can offer based on this surplus charging time and the rated charging power. This drift energy thus represents the regulation energy available between intervals [tar(i), tle(i)] while still satisfying users’ charging demands.
Drift energy is distributed across specific intervals, yet it remains uncertain precisely within which interval this energy will be realized during actual regulation. While drift energy can effectively characterize the regulation capability of individual EVs, differences in drift durations and drift energies among EVs make it challenging to represent the overall response capability of an entire charging station. For instance, a charging station might offer a drift energy of 10 MWh, yet its actual achievable regulation power within 1 h may not necessarily reach 10 MW due to constraints such as the number of charging vehicles and their charging states. Thus, additional descriptors are required to effectively characterize drift energy. Therefore, the concept of average drift power df(i,t) is introduced, as described in (10). Equation (11) calculates the average drift power provided by I EVs DF(i,t) within the station over the specified interval.
However, using the average drift power fails to accurately reflect the variations in actual regulation capacity across different intervals, obscuring critical differences. In practice, there exist cases where regulation capacity is achievable, but these scenarios cannot be captured by an averaged value alone. Therefore, further exploration into the configuration of response capabilities is required. Consequently, this paper proposes a novel method for evaluating temporal response capacity, using the overall average drift power as a benchmark to investigate the actual regulation capacity available in each interval.
Considering that charging stations must provide relatively stable response capacity rather than extreme values, it is necessary to evaluate the temporal regulation capacity available within each time interval, rather than focusing solely on extreme capacities concentrated in individual intervals. Thus, a scaling factor m is introduced for calculation, as shown in (12). And the response capacity of a charging station ESTA is obtained in (13).
Based on the Monte Carlo method, possible drift power values are generated within the limits set by drift energy and drift intervals. Assume there are T time intervals, with each interval having a discrete value xi, where xi lies within the range [ai, bi]. The generation model is listed below.
The generated candidate response curves must undergo rigorous feasibility verification to ensure their implementation ability under real-world operating conditions. Feasibility evaluation of the curves requires a comprehensive consideration of multiple constraints, including the real-time utilization of charging piles, grid power availability, and user charging demands. To this end, a optimization-based verification model is developed in (17)–(20), enabling quantitative validation of the alignment between response curves and actual operating conditions. The core objective function aims to minimize the sum of squared deviations between the generated response curve and the total charging load, thereby ensuring a high degree of alignment between the scheduling plan and actual load demand. Equation (18) strictly requires that the total charged energy meets the user-defined charging demand, a fundamental condition for maintaining service quality. Equation (19) introduces a deviation threshold constraint; if the deviation exceeds a predefined constant, the solution is deemed infeasible. This mechanism effectively mitigates operational risks caused by significant mismatches between generated curves and actual behavior. Equations (1)–(6) enforces constraints on the normal charging requirements of EVs.
According to the model described above, all generated and feasible x = [x1, …, xi, … xT] are organized into a matrix form M {N T}, as in (21). Here, N denotes the number of generated curves, and T represents the time dimension. Given that individual curves fail to sufficiently represent the overall statistical characteristics of the station’s response capability, this study employs functional data analysis (FDA), utilizing kernel smoothing and principal component decomposition to extract intervals of high-probability response curves with a confidence level p ≥ 95%. Combined with drift energy, this further characterizes the distribution features of the charging station’s response resources.
FDA treats each curve as a smooth function, which can be regarded as a random function drawn from a function space. Functional principal component analysis (FPCA) is employed to extract the main modes of variation. Each function yi(t) is modeled as shown in (22). μ(t) represents the mean function of all curves, obtained through pointwise averaging. ϕj(t) denotes the jth principal component function, derived from the decomposition of the covariance operator. ξkj is the score of the kth curve along the jth principal component direction. According to the Karhunen–Loève expansion, ξkj∼N(0, λj) approximately follows a normal distribution. This allows the construction of a confidence band that captures the majority of function trajectories, as shown in (23).
Finally, the response resource that the charge station can provide is described as drift energy, and the response distribution .
4. Response Resource Trading
4.1. Trading Behavior Formulation
For EV charging stations, accurately assessing the economic cost of their regulation capability is a key challenge in enabling participation in DR with LAs. The amount of response resources that a station can offer to an LA is closely linked to its potential revenue, with the core objective being to maximize profit while maintaining the minimum amount of resource commitment necessary to meet contractual requirements. As such, stations will not provide regulation capacity beyond economically optimal levels but will dynamically adjust their resource provision strategies based on operational status.
where FSTA represents the cost of the charging station for offering response capacity Ei; α, β, and γ are constant coefficients; cLA and cEP,max represent the pricing strategy of the LA, and the maximum intraday electricity price.
To quantify the economic performance of charging stations participating in DR, this study develops a cost model as in (24), which divides the cost of regulating EVs to provide response resources into three components. The first component involves compensation payments from the charging station to EV users to incentivize their participation in load regulation. As the specific distribution of response periods is unknown when the station signs an aggregate contract with the LA, the compensation price is conservatively calculated as the product of the highest daily electricity price and a regulation coefficient. This conservative setting ensures that the station can cover compensation costs even under the most unfavorable electricity price scenarios, thereby avoiding losses caused by price fluctuations.
The second component accounts for the additional control cost incurred when the station adjusts the charging power of EVs. This cost is modeled using a nonlinear function to reflect the increasing marginal cost associated with large-scale regulation efforts; at the same time, it constrains the extent of regulation to prevent excessive disruption of users’ regular charging needs, thereby maintaining service reliability. Given that the specific allocation of response resources during transactions is unknown and thus cannot be calculated based on actual values, an energy-based summary approach is adopted for the computation.
The third component reflects the economic return that the station obtains by providing regulation capacity to the LA. This revenue depends on the contractually agreed response capacity and the prevailing market pricing mechanism. Equation (25) imposes constraints on the response capacity that can be provided during each time interval, and (26) ensures that the total response energy across all intervals does not exceed the contracted amount of response resources.
When procuring regulation resources from charging stations, the LA must consider both economic efficiency and grid demand constraints. The LA’s trading decisions are influenced not only by contractual negotiations with charging stations but also directly by the dynamics of transactions with the dispatching center. Specifically, if the dispatching center anticipates a future increase in DR requirements, the LA is likely to purchase additional station capacity in advance to secure higher returns in subsequent market transactions. However, since the dispatching center’s actual procurement volume Pw is uncertain while the LA’s resource acquisition PLA must be committed in advance, the LA must optimize its resource allocation based on risk assessment to balance potential profit against cost-related risks.
When the dispatching center’s demand Ew exceeds the LA’s allocated capacity ELA, the LA misses out on potential market opportunities due to insufficient resource reserves, thereby incurring implicit opportunity costs. Conversely, if Ew < ELA, the LA faces the risk of resource surplus and bears economic losses arising from contractual commitments with the charging stations. Therefore, the LA’s decision-making behavior can be modeled as shown in (27), with 0 < σ < 1. Equation (29) limits the range of cLA.
where cw represents the purchasing price from the dispatching center.
Ultimately, the feasible strategy sets of the ith charging station (ΩSTA) and LA (ΩLA) can be defined as (30) and (31), respectively.
4.2. Trading Model
The decision-making process between charging stations and LAs exhibits characteristics of a dynamic game, in which both parties engage in co-optimization through resource pricing and capacity adjustments. Specifically, the station’s decision on response capacity is directly influenced by the LA’s pricing strategy—when the LA raises its offer, the station is inclined to provide more adjustable power to capture higher profits; conversely, if the LA lowers its offer, the station may reduce its response capacity to manage operational costs. This bidirectional dependency forms a closed-loop feedback mechanism: upon receiving the reported available capacity from stations, the LA re-optimizes its pricing strategy based on current market supply and demand conditions, thereby indirectly regulating the total volume of response resources to be procured and ultimately maximizing its own profit. The model of the processes is formulated as (32)–(34) based on the Stackelberg game.
Considering that DR events typically occur in the context of the distribution network, it is necessary to take into account the safety operation constraints of the distribution network, as expressed in (35)–(37).
where e and f represent bus e and bus f, Ve,t represents the voltage magnitudes at bus e, Pef,t and Qef,t represent active and reactive power flow from bus e to bus f.
When all participating agents (i.e., charging stations and LAs) reach a state in which no party can improve its payoff by unilaterally changing its own strategy, the system is considered to have reached a stable equilibrium, as shown in (38) and (39).
Lemma 1.
For a noncooperative game, an SE exists when the following three conditions are met:
- 1.
- The player set is finite.
- 2.
- The strategy set is convex, closed, and bounded.
- 3.
- The utility function is continuous and concave.
Clearly, the player set is finite, and ΩLA and ΩSTA i are linear and readily defined as nonempty, convex, and bounded. Then, taking the derivatives of (24) and (27), an SE exists because > 0 and = 0, .
Given the uncertainty in Pw, and the fact that the LA optimizes its resource allocation based on this parameter, this study conducts a sensitivity analysis of the LA’s profit function (FLA) to reveal the dynamic characteristics of its optimal decision-making. Take the derivative of FLA, as in (40).
In the interaction between the LA and the dispatching center, the dynamic variation of the resource matching ratio (ELA/EW) exhibits clear regularity: When the LA’s FLA approaches EW, the system’s marginal benefit tends to increase. Conversely, as the deviation between the two increases, overall system efficiency declines significantly. However, since the value of EW is difficult to determine in advance, it is approximated using the average value over the observed period as in (41); this value in the trading model is used to calculate as follows:
5. Results
The reliability of the proposed estimation method is validated through a case study involving a large-scale charging station with 100 charging piles participating in transactions with an LA. To further assess the effectiveness of the trading mechanism, a multi-agent scenario comprising three charging stations and one LA is examined, with selected parameters modified throughout the process. The dataset used comprises actual data from a specific charging station, revealing that the charging capacities vary among different piles and that the charging patterns differ across EVs. Part of the data are derived from online datasets [18].
5.1. One Charging Station
Figure 2 illustrates the range of drift power. When the response energy provided by the charging station falls within the evaluated potential range, the station is capable of delivering response power arbitrarily within the drift power range. This drift power range is determined via principal component analysis by extracting the upper and lower power envelope curves, which together constitute the overall response power range.
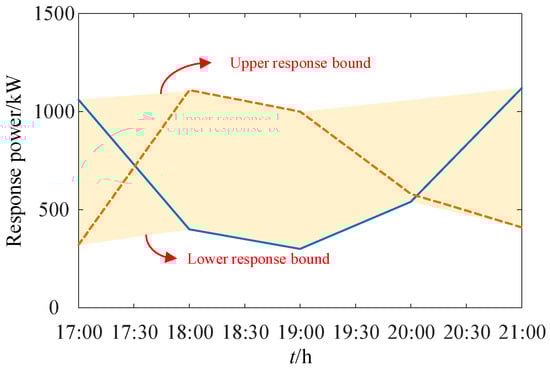
Figure 2.
Range of drift power.
Figure 3 compares the response performance of the charging station under various response scenarios. It can be observed that the charging station is capable of delivering the expected response performance almost perfectly (i.e., meeting 100% of the requirements). Regardless of the amplitude of variation in response levels across consecutive time periods, continuous response performance can be maintained.
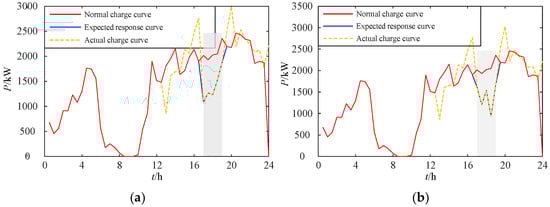
Figure 3.
Verification of different response requirements of specific EVs. (a) Scenario 5. (b) Scenario 462.
Figure 4 randomly selects three EVs to compare the differences in their charging states before and after response under various demand scenarios. It can be observed that the charging times of these vehicles undergo temporal shifts, providing the system with regulation capability through intermittent charging. At the same time, the charging constraints of the EVs are met, ensuring that each EV completes charging prior to its scheduled departure from the station. Such scheduling is essential for EVs, which explains why the actual charging energy is divided by m. This adjustment reflects the fact that an EV’s energy demand does not inherently increase or decrease but is merely redistributed. During this transfer process, the charging shift of some EVs may be affected by others, meaning that not all charging loads can be shifted entirely to alternative time periods. In this context, employing the average available charging time acts as an additional constraint on the adjustable energy, thereby ensuring the accuracy of the response capability assessment.
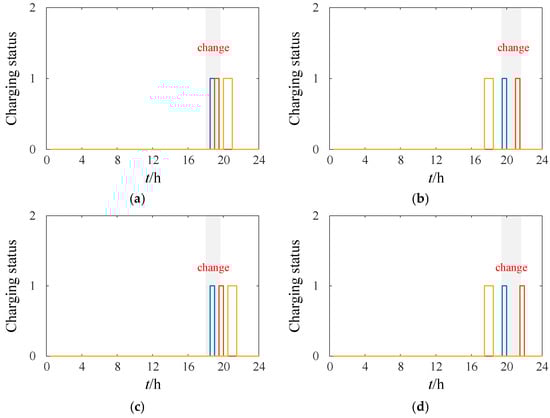
Figure 4.
Verification of different response requirements. (a) Scenario 5-before response. (b) Scenario 462-before response. (c) Scenario 5-after response. (d) Scenario 462-after response.
Figure 5 compares the charging status of Charging Pile No. 1 before and after the response. It can be observed that the charging durations during the response period are consolidated and compressed to maximize the system’s regulation capability. Under the condition of ensuring the expected charging outcome, part of the response capacity is shifted to the late-night period. Additionally, the charging time of the pile is partially advanced, which further expands the regulation capability during the response period.
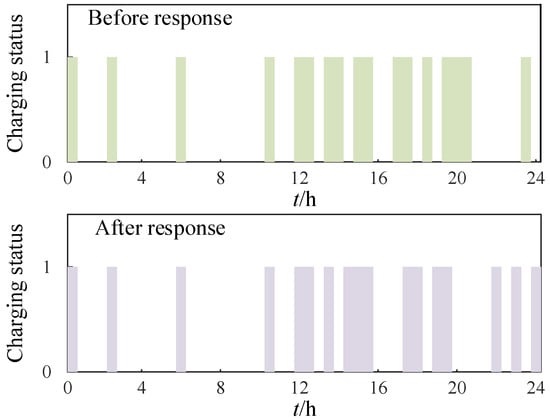
Figure 5.
Comparison of charging pile usage time.
Figure 6 depicts the final configuration of the charging station’s response energy and the LA’s profit, corresponding to an energy procurement price of 1707.7 MWh/USD. According to the established bi-level game model, the LA’s bid is directly associated with the amount of response energy provided by the station. For clarity, the figure presents the station’s response energy alongside the LA’s profit to showcase the effectiveness of the trading mechanism. As illustrated, a higher price offered by the LA does not necessarily yield better outcomes; rather, higher price strategies correspond to the purchase of larger amounts of response energy. In scenarios where market demand is uncertain, excessively high procurement of response energy may lead to wasted purchasing resources and cost losses, whereas excessively low procurement may result in diminished profits and risk losses. Therefore, formulating appropriate pricing and procurement strategies based on historical market demand is economically beneficial for both the LA and the charging station.
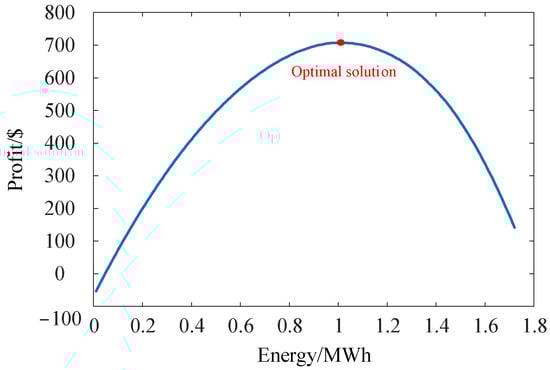
Figure 6.
Transaction response energy and profit of LA.
Figure 7 and Figure 8 compare the proposed mechanism with fixed bidding and fixed response strategies. It can be observed that under both conventional trading mechanisms, the profits obtained by the LA are significantly lower than those achieved by the proposed mechanism. This discrepancy arises because the fixed strategies do not account for the subjective behaviors of the trading parties and therefore cannot adapt dynamically to changes in the market environment. Although such strategies may perform well under static conditions, their effectiveness diminishes in a rapidly changing market. For example, when the supply–demand balance at the dispatch center remains stable in the near term, if the LA continues to procure response capacity at high prices as before, it may incur losses due to an inability to resell part of the response energy to the dispatch center. Conversely, if the charging station sells the same amount of response energy regardless of pricing, it may suffer negative impacts when control costs outweigh the revenues. Therefore, designing a trading mechanism that takes into account the requirements of the charging station, aggregator, and dispatch center is essential.
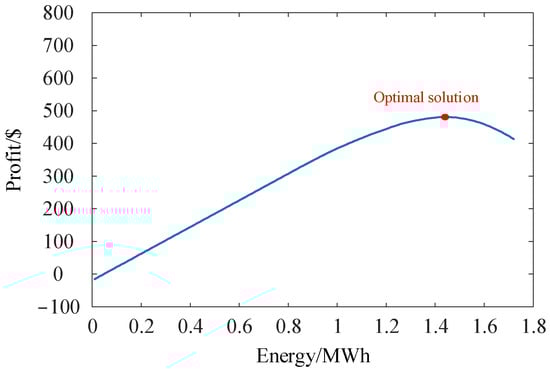
Figure 7.
Transaction response energy and profit of LA with fixed pricing strategy.
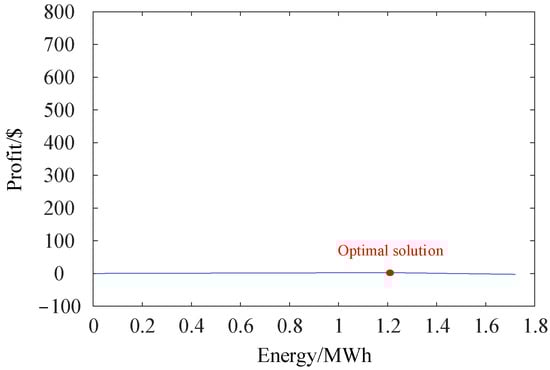
Figure 8.
Transaction response energy and profit of LA with a fixed response strategy.
As shown in Figure 9, the transaction response energy and profit of the LA under the proposed trading mechanism are compared across different charging price scenarios. The findings indicate that the proposed strategy maintains robust performance and scalability, delivering effective solutions under a wide range of charging price variations.
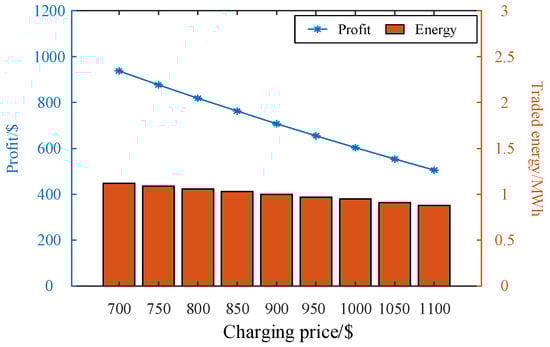
Figure 9.
Transaction response energy and profit of LA with the proposed trading mechanism under the changing charging price.
5.2. Multi-Charging Station
Figure 10 extends the scenario presented in Figure 6 by incorporating transactions between one LA and three charging stations. As illustrated, the proposed trading mechanism remains effective despite the increased number of participants, demonstrating reliable convergence and robustness. Figure 11 illustrates the transaction response energy and corresponding profit of the LA under the proposed trading mechanism, considering three charging stations and varying charging prices.
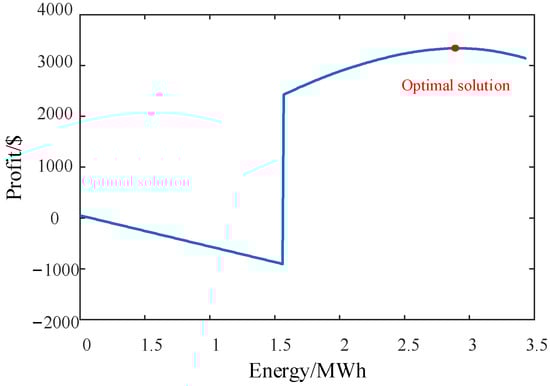
Figure 10.
Transaction response energy and profit of LA with three charging stations.
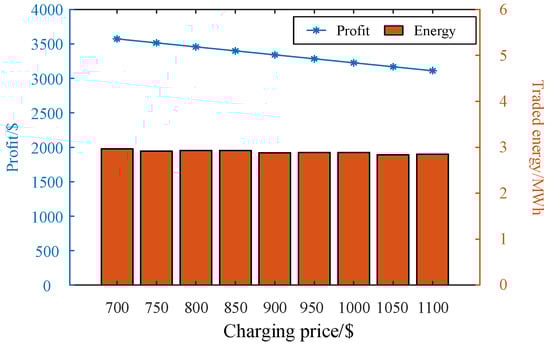
Figure 11.
Transaction response energy and profit of LA with the proposed trading mechanism under the changing charging price (with three charging stations).
Figure 12 and Figure 13 depict the response energy and corresponding profit for each charging station in the trading scenario involving one LA and three charging stations. The results show that each station secures favorable profits, although these vary non-monotonically with changes in the charging price. The comparable response energy among stations is attributed to similar parameter configurations, rather than being a consequence of the proposed method itself.
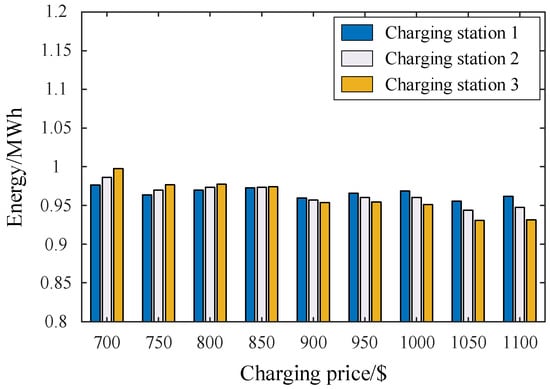
Figure 12.
Transaction response energy of three charging stations with the proposed trading mechanism.
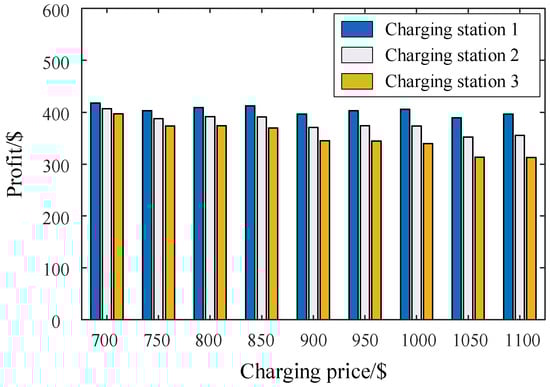
Figure 13.
Transaction profits of three charging stations with the proposed trading mechanism.
6. Discussion
This paper introduces a station-aggregator response resource trading mechanism considering energy–power coupling of response capability. An innovative hybrid energy–power estimation approach is used to evaluate the response capability that a charging station can offer to the system. This method not only broadens the perspective on describing response capability but also enables the precise quantification of both the magnitude and the extent of the charging station’s response. Moreover, by incorporating the uncertainty associated with the dispatch center’s demand for regulation capacity, a bi-level trading mechanism between the LA and the charging station is proposed, thereby achieving a win–win situation in the provision of response capability. Simulation results further indicate that disregarding the decision-making behavior of any trading party is inadvisable, as it leads to reduced benefits for both sides.
Author Contributions
Conceptualization, X.Y.; methodology, H.G. and Y.P.; formal analysis, W.R.; resources, X.J.; data curation, H.G.; writing—original draft preparation, H.G.; writing—review and editing, X.Y.; funding acquisition, M.W. All authors have read and agreed to the published version of the manuscript.
Funding
This research was funded by the State Grid Corporation of China Technology Project, grant number J2024152.
Data Availability Statement
The data presented in this study are available on request from the corresponding author.
Conflicts of Interest
Author Haiqing Gan and Wenjun Ruan were employed by the company Jiangsu Power Grid Company Ltd., Xiaodong Yuan, Xize Jiao, Mingshen Wang and Yi Pan were employed by the company The Electric Power Research Institute, Jiangsu Power Grid Company Ltd. The authors declare that the research was conducted in the absence of any commercial or financial relationships that could be construed as a potential conflict of interest.
References
- Erdogan, N.; Erden, F.; Kisacikoglu, M. A fast and efficient coordinated vehicle-to-grid discharging control scheme for peak shaving in power distribution system. J. Mod. Power Syst. Clean Energy 2018, 6, 555–566. [Google Scholar] [CrossRef]
- Deng, X.; Zhang, Q.; Li, Y.; Sun, T.; Yue, H. Hierarchical distributed frequency regulation strategy of electric vehicle cluster considering demand charging load optimization. IEEE Trans. Ind. Appl. 2022, 58, 720–731. [Google Scholar] [CrossRef]
- Xu, L.; Dou, C.; Yue, D.; Guo, W.; Zhao, N.; Li, H. End-edge-cloud collaboration-based EVs aggregator control method for multiple frequency regulation considering user charging demand. IEEE Trans. Transp. Electrif. 2025, 11, 5017–5028. [Google Scholar] [CrossRef]
- Lu, X.; Wang, L. Cloud-edge collaboration control strategy for electric vehicle aggregators participating in frequency and voltage regulation. IEEE Open J. Veh. Technol. 2024, 5, 1532–1544. [Google Scholar] [CrossRef]
- Pavić, I.; Pandžić, H.; Capuder, T. Electric vehicle aggregator as an automatic reserves provider under uncertain balancing energy procurement. IEEE Trans. Power Syst. 2023, 38, 396–410. [Google Scholar] [CrossRef]
- Alfaverh, F.; Denai, M.; Sun, Y. A dynamic peer-to-peer electricity market model for a community microgrid with price-based demand response. IEEE Trans. Smart Grid 2023, 14, 3976–3991. [Google Scholar] [CrossRef]
- Aggarwal, S.; Kumar, N. A consortium blockchain-based energy trading for demand response management in vehicle-to-grid. IEEE Trans. Veh. Technol. 2021, 70, 9480–9494. [Google Scholar] [CrossRef]
- Xu, X.; Li, K.; Wang, F.; Mi, Z.; Jia, Y.; Wei, W.; Jing, Y. Evaluating multitimescale response capability of EV aggregator considering users’ willingness. IEEE Trans. Ind. Appl. 2021, 57, 3366–3376. [Google Scholar] [CrossRef]
- Yuan, Y.; Jiao, L.; Zhu, K.; Zhang, L. Scheduling online EV charging demand response via V2V auctions and local generation. IEEE Trans. Intell. Transp. Syst. 2022, 23, 11436–11452. [Google Scholar] [CrossRef]
- Yang, N.; Shen, X.; Liang, P.; Ding, L.; Yan, J.; Xing, C.; Wang, C.; Zhang, L. Spatial–temporal optimal pricing for charging stations: A model-driven approach based on group price response behavior of EVs. IEEE Trans. Transp. Electrif. 2024, 10, 8869–8880. [Google Scholar] [CrossRef]
- Ren, Y.; Tan, M.; Su, Y.; Wang, R.; Wang, L. Two-stage adaptive robust charging scheduling of electric vehicle station based on hybrid demand response. IEEE Trans. Transp. Electrif. 2025, 11, 1442–1454. [Google Scholar] [CrossRef]
- Lai, S.; Qiu, J.; Tao, Y.; Zhao, J. Option-based demand response management for electric vehicle aggregator. IEEE Trans. Transp. Electrif. 2024, 10, 4042–4054. [Google Scholar] [CrossRef]
- Li, J.; Li, H.; Huang, T.; Zheng, L.; Ji, L.; Yin, S. Model-free reinforcement learning economic dispatch algorithms for price-based residential demand response management system. IEEE Trans. Ind. Cyber Phys. Syst. 2023, 1, 123–135. [Google Scholar] [CrossRef]
- Nimalsiri, N.I.; Ratnam, E.L.; Smith, D.B.; Mediwaththe, C.P.; Halgamuge, S.K. Coordinated charge and discharge scheduling of electric vehicles for load curve shaping. IEEE Trans. Intell. Transp. Syst. 2022, 23, 7653–7665. [Google Scholar] [CrossRef]
- Tan, M.; Ren, Y.; Pan, R.; Wang, L.; Chen, J. Fair and efficient electric vehicle charging scheduling optimization considering the maximum individual waiting time and operating cost. IEEE Trans. Veh. Technol. 2023, 72, 9808–9820. [Google Scholar] [CrossRef]
- Li, Y.; Han, M.; Yang, Z.; Li, G. Coordinating flexible demand response and renewable uncertainties for scheduling of community integrated energy systems with an electric vehicle charging station: A bi-level approach. IEEE Trans. Sustain. Energy 2021, 12, 2321–2331. [Google Scholar] [CrossRef]
- Kovačević, M.; Vašak, M. Aggregated representation of electric vehicles population on charging points for demand response scheduling. IEEE Trans. Intell. Transp. Syst. 2023, 24, 10869–10880. [Google Scholar] [CrossRef]
- Li, H.; Qu, H.; Tan, X.; You, L.; Zhu, R.; Fan, W. UrbanEV: An Open Benchmark Dataset for Urban Electric Vehicle Charging Demand Prediction. Sci. Data 2025, 12, 523. [Google Scholar] [CrossRef] [PubMed]
Disclaimer/Publisher’s Note: The statements, opinions and data contained in all publications are solely those of the individual author(s) and contributor(s) and not of MDPI and/or the editor(s). MDPI and/or the editor(s) disclaim responsibility for any injury to people or property resulting from any ideas, methods, instructions or products referred to in the content. |
© 2025 by the authors. Licensee MDPI, Basel, Switzerland. This article is an open access article distributed under the terms and conditions of the Creative Commons Attribution (CC BY) license (https://creativecommons.org/licenses/by/4.0/).