Abstract
Within the context of global warming, the frequent occurrence of extreme weather may lead to problems, such as a sharp decrease in new energy output, insufficient system backups, and an increase in the amount of energy consumed by users, resulting in large-scale power shortages within the grid for a short period of time. With the increase in the numbers of electric vehicles (EVs) and microgrids (MGs), which are resilient resources, the ability of a system to participate in demand response (DR) is further improved, which may make up for short-term power shortages. In this paper, we first propose a charging and discharging model for EVs during the onset of a cold wave, and then perform load forecasting for EVs during cold wave weather based on user behavioral characteristics. Secondly, in order to accurately portray the flexible regulation capability of microgrids with massively flexible resource access, this paper adopts the convex packet fitting expression based on MGFOR to characterize the flexible regulation capability of MGs. Then, the Conditional Value at Risk (CVaR) is used to quantify the uncertainty of wind and solar power generation, and a two-layer model with the objective of minimizing the operation cost in the upper layer and maximizing the rate of new energy consumption in the lower layer is proposed and solved using Karush–Kuhn–Tucker (KKT) conditions. Finally, the proposed method is verified through examples to ensure the economic operation of the system and improve the new energy consumption rate of the system.
1. Introduction
Within the context of global warming, the frequent occurrence of extreme weather events poses significant challenges to the safe and stable operation of power systems. The statistics indicate that large-scale power outages caused by extreme weather events have shown a notable upward trend in recent years globally [1,2]. Cold wave events can lead to a sharp decline in the output of renewable energy generation, while simultaneously causing a dramatic surge in electricity demand, which puts the power grid at risk of a supply–demand imbalance. With the large-scale integration of distributed energy sources, such as EVs and MGs, the grid’s flexibility in regulation has been significantly enhanced [3]. However, how to effectively coordinate these distributed resources to participate in system regulation, increase the level of renewable energy consumption, while ensuring system economics, still presents numerous challenges [4,5].
EV load forecasting has become an essential focus as the adoption of EVs grows rapidly worldwide. The accurate forecasting of charging demand is crucial for managing power grid stability, optimizing energy distribution, and supporting the transition to sustainable energy sources. Many existing studies have employed various methods, including statistical models, machine learning techniques, and deep learning models, to predict EV charging loads in different temporal and spatial contexts. Liu et al. proposed a Monte Carlo simulation approach based on the spatial and temporal distribution of parking and driving behaviors to forecast the EV charging load [6]. Tang et al. applied the weighted measurement fusion unscented Kalman filter to enhance the accuracy of EV load prediction by integrating multi-source data [7]. In addition, Hou et al. focused on spatio-temporal node importance and used graph convolutional networks to improve the prediction accuracy of charging loads [8]. However, despite these advancements, several challenges remain, particularly in terms of incorporating real-time traffic data, weather conditions, and the geographical context of charging stations, which are often overlooked in the conventional forecasting models [9]. Furthermore, the integration of EV charging stations with renewable energy sources and smart grid systems requires models that can predict the charging demand, while considering various environmental and operational factors [10]. While the existing models have significantly improved forecasting accuracy, they still struggle with real-time variations and the complexity of coupling transport and power systems [11]. To address these gaps, this paper introduces an approach that considers the impact of extreme weather conditions, such as cold waves, on the forecasting of the EV charging load. This model aims to enhance the robustness of load predictions by accounting for not only spatial and temporal dependencies, but also environmental factors, which are critical for maintaining grid stability during adverse weather events.
The optimization and scheduling of microgrids have become critical areas of research, particularly in the integration of renewable energy and enhancing the flexibility of power systems. To address challenges such as renewable energy fluctuations, energy trading, and profit maximization, various methods have been proposed. Žnidarec et al. introduced a double-layer energy management system designed to optimize short-term microgrid operation by combining online scheduling in the upper layer with real-time dispatch in the lower layer, eliminating the uncertainties caused by renewable energy fluctuations and balancing profit maximization with equipment lifetime extension [12]. Luo et al. applied the game theory to develop a bi-level optimization model that resolves the conflict of interest between electricity consumers, who aim to minimize costs, and microgrid investors, who seek to maximize profits, effectively balancing the objectives of both these parties [13]. Additionally, Li et al. developed a multi-objective optimization model for park microgrids in China, integrating green power trading with the spot market to reduce operational costs, while promoting the low-carbon transition, although this model overlooks dynamic pricing and carbon emissions [14]. Furthermore, Li et al. also explored energy trading and coordination in multi-microgrid systems using the cooperative game theory, yet the existing models face challenges in managing the complex interactions between microgrids [15]. Kaleta et al. proposed a co-optimization framework for balancing wind energy with DR contracts, though their model does not fully incorporate risk aversion in energy management [16].
Renewable energy, such as wind and solar power, plays a significant role in modern power systems due to its environmental benefits. However, the inherent variability and intermittency of renewable energy generation introduce substantial uncertainties, making it challenging to ensure system stability and efficient operation. Several other studies have addressed these challenges by proposing models that account for renewable energy uncertainties. Dolatnia et al. developed a multi-carrier energy hub optimization model that incorporates renewable energy and electric vehicle parking lot uncertainties [17]. Similarly, Wang et al. explored the uncertainty in new energy outputs, particularly from wind and solar sources, to determine optimal locations and capacities for charging stations in distribution networks [18]. Furthermore, Ai et al. assessed the flexibility of power systems with high-level renewable energy penetration, considering the uncertainty of wind and PV outputs [19]. Qi and Su introduced a stochastic optimization model for integrated energy systems, addressing the uncertainties of renewable energy generation and indirect carbon emission [20]. Despite these advancements, a key challenge remains in accurately modeling the uncertainties associated with renewable energy outputs, which complicates the optimization and scheduling processes. To address this, this paper utilizes the CVaR to describe renewable energy uncertainty, providing a more robust approach to managing these uncertainties and enhancing the flexibility and reliability of power systems under varying renewable energy scenarios.
The optimization of distribution networks has become increasingly complex with the integration of distributed generation (DG) sources and EVs. Several studies have focused on addressing the challenges posed by this integration, such as voltage deviations, increased system losses, and power quality issues. Chang et al. propose a distributed reactive power optimization method for flexible distribution networks driven by probabilistic scenarios, addressing uncertainties from distributed PV output and loads [21]. Cha et al. introduce a hierarchical EV scheduling platform that optimizes both customer preferences and system operation, emphasizing the need for coordinated charging to reduce the peak load and operational losses [22]. Lu et al. focus on reconfiguring distribution networks to optimize the flow of power from distributed sources, incorporating advanced optimization algorithms to balance network losses, voltage deviations, and distributed generation outputs [23]. Wu et al. propose a three-stage dynamic reactive power optimization strategy for active distribution networks that also accounts for carbon emission, which is an emerging concern in modern grid operations [24]. However, despite these advancements, many of these models fail to effectively address the simultaneous optimization of renewable energy consumption and operational costs, especially when dealing with the fluctuating nature of renewable generation and EV charging demand. This paper proposes an optimization model that not only improves the integration of renewable energy sources, but also minimizes operational costs in the distribution network. By focusing on both the efficient absorption of renewable energy and cost-effective system operation, this approach offers a solution to enhance the performance and sustainability of distribution networks.
This paper introduces a two-tier optimal operation model for distribution networks considering the participation of elastic resources in flexible regulation. Initially, we propose a charging and discharging model for EVs during the onset of a cold wave, and then perform load forecasting for EVs under cold wave weather based on user behavioral characteristics. Subsequently, in order to provide an accurate depiction of the flexible regulation capability of microgrids in the context of substantial flexibility resource access, this paper employs the convex packet fitting expression based on MGFOR to characterize the flexible regulation capability of MGs. In the following section, the CVaR is utilized to quantify the uncertainty surrounding wind and solar power generation. A two-layer model is proposed, with the objective of minimizing the operation cost in the upper layer and maximizing the rate of new energy consumption in the lower layer. This model is solved by KKT conditions. The validity of the proposed method is substantiated by means of numerical illustrations, thereby ensuring the economic operation of the system and enhancing the rate of new energy consumption.
The structure of the remainder of the paper is as follows: Section 2 shows the modeling and load forecasting for an EV in cold wave weather and the MGFOR-based MG flexible adjustment capability. Section 3 develops a two-layer optimization model for distribution networks considering the uncertainty of wind and photovoltaic generation outputs. Section 4 solves a two-layer optimization model considering the CVaR with KKT. Section 5 analyzes an example, and Section 6 draws conclusions.
2. Modeling of Resilient Resource EV and MGFOR
2.1. Modeling and Load Forecasting for EV in Cold Wave Weather
2.1.1. Charge and Discharge Characteristics of EVs in Cold Weather
In cold weather, EV charging slows down and discharge efficiency decreases. Mainly due to the battery’s demand for operating temperature, the battery thermal management system (BTMS) needs to heat the battery by consuming electrical energy to guarantee operation within a reasonable temperature range.
There are two main ways to heat electric vehicle batteries: external heating and self-heating. The external heating method has a complicated structure, low heating efficiency, and uneven heating, so it is less commonly used nowadays. Battery self-heating mainly includes two kinds: charging self-heating and discharge self-heating. The charging self-heating method is to heat the battery using heat generated by an internal chemical reaction in the battery, but there is a risk of lithium precipitation in this process. However, during the discharge self-heating method of the battery, the negative electrode potential is higher, and there is almost no risk of lithium precipitation, so this method is widely used. According to the discharge self-heating method, the power transfer path when an EV is connected to the grid is abstracted as the schematic diagram shown in Figure 1.

Figure 1.
Electricity transfer path diagram when EV is connected to grid.
During charging, the charging pile charges the EV with power , and the EV battery receives electrical energy as and provides the BTMS with heating power .
where is the power of the battery used to store electrical energy, and is the charging and discharging efficiencies.
During discharge, the battery discharges to the charging post and the BTMS at a rated discharge power . Power flowing to the charging post is , and power flowing to the BTMS is .
The BTMS is used to maintain the EV battery within the normal operating temperature range. In cold weather, when the battery operating temperature is less than the minimum normal operating temperature , it needs to be heated by the BTMS to the maximum normal operating temperature with power size , and then heating will stop. The power function of the BTMS is shown as follows:
The heating time and the stopping time of can be expressed as follows:
where is quality of the battery, is specific heat capacity of battery materials, is electrothermal conversion efficiency of battery materials, is the temperature dissipation factor, and is ambient temperature at the onset of a cold wave.
The state of charge of the EV battery with respect to the time required for the fastest full charge is difficult to assess in the presence of variations. Therefore, the power dissipation power of the BTMS is approximated by the average value of the power of the BTMS over an operating temperature cycle.
2.1.2. Behavioral Characterization of EV Users
This paper involves two kinds of EV, which are private cars and online cars. The behavioral characteristics of EV users will determine the charging pattern of EVs. In this paper, the behavioral characteristic indicators of the EVs are classified from the perspective of EV load forecasting, as shown in Table 1.

Table 1.
Performance characteristic indexes of EVs.
The travel location probability matrix in the above table is obtained from the origin–destination matrix and Dijkstra’s shortest path algorithm.
In order to better describe the EV travel destinations and count the distribution of charging demands, this article combines several theories, such as travel chain, and divides the areas to be planned into three categories according to the functional types and load characteristics of each area in the city: commercial areas, work areas, and residential areas.
2.1.3. Travel Chain Model
Unlike online cars, electric private cars have a more regular travel pattern. The travel chain involved in this paper is shown in Figure 2. The probability distribution of the three travel trips is 52.8%, 24.1%, and 23.1%.
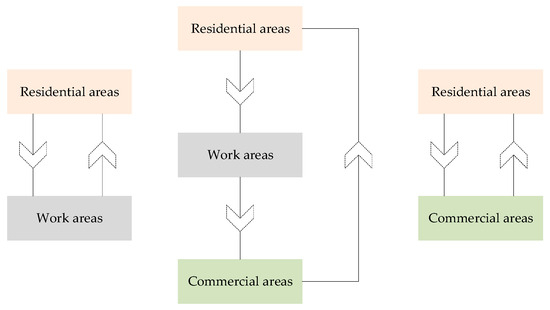
Figure 2.
The typical travel chain structure for private cars.
2.1.4. Travel Probability Matrix and Shortest Path Search Algorithm
The travel probability matrix, also known as the OD matrix, refers to the traffic volume from all the starting points to the destination in the transportation network. The rows of the matrix represent the traffic flow at each initial location, while the columns represent the traffic flow at each destination. The OD matrix can be obtained by reverse predicting the actual traffic flow of electric vehicles on each road section measured by the transportation department.
where is the number of nodes in the transportation network, the molecules represent the number of electric vehicles that depart from and arrive at transportation network node , the denominator represents the total number of electric vehicles departing from transportation network node , and indicates the probability of the electric vehicles traveling from traffic network node to traffic network node at time ~.
The Dijkstra algorithm is a classic shortest path search algorithm proposed by Dijkstra in 1959. This algorithm considers all the points within the search range, so it can obtain the shortest distance path. Therefore, Dijkstra’s algorithm is widely used to solve the single-source shortest path problem in directed graphs. This research used this algorithm to select the shortest driving path for the electric vehicles.
2.1.5. Load Forecasting for EV in Cold Wave Weather
From Section 2.1.1, Section 2.1.2 and Section 2.1.3, we obtained the actual charging power of the EVs at the onset of a cold wave, the user behavioral characteristic indicators of the online and private vehicles, and the travel chain of the private vehicles. With this information, the charging load of EVs at the onset of cold wave can be predicted. The specific prediction process is shown in Figure 3.
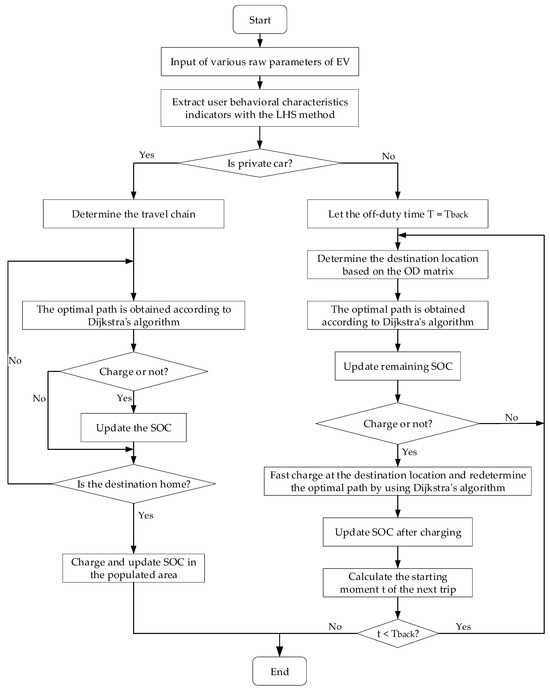
Figure 3.
The EV load forecasting process at the onset of a cold snap.
2.2. MGFOR Modeling with Resilient Resources
2.2.1. Definition of MGFOR
MGFOR is defined as a set of microgrid stable operating points that take into account multiple types of resilient resource in the microgrid and satisfy the power balance constraints of the microgrid and the safe operation constraints of equipment for each resilient resource during the dispatch cycle. Among them, the microgrid operation points are represented by vector composed of active and reactive power transmitted from the distribution grid to the microgrid.
where and are active power and reactive power transferred from the distribution grid to the microgrid, respectively.
The model of MGFOR can be represented in the following form:
where is a vector of the key decision variables of the microgrid node during the dispatch cycle, including active power and reactive power transmitted from the distribution grid to the microgrid; is the vector formed by the remaining variables in the microgrid; is the constraint of the microgrid’s tidal balance equation; and is an operational, security inequality constraint for microgrid resilient resources.
2.2.2. The Solution of MGFOR
Since the actual MGFOR is unknown, in order to obtain the approximation data of its boundary sample points more accurately and ensure the balance of solution efficiency and accuracy, this paper adopts a nonlinear trend model to find the boundary points of MGFOR using a radial iterative search algorithm, and then utilizes the convex packet fitting method to obtain the observable MGFOR image.
Considering the above microgrid operation constraints and using the coupled node contact power and of the distribution microgrid as the target observation variables of MGFOR, the direction parameter is adjusted to minimize and in order to obtain the boundary points of MGFOR, and the objective function is shown as follows:
where and are the orientation parameters, which can be calculated by Equation (10), is the initial search angle, is the pacemaker, and is the total number of searches.
After solving a series of running domain boundary sample points, a convex packet fitting method can be used to obtain an MGFOR image, which is the minimum convex set containing all the boundary sample points.
2.2.3. MGFOR-Based Characterization of MG Adjustability
Based on a series of boundary sample points, the flexible regulation capability of the microgrid is described using the convex packet segmented linearized fitting formula as shown in the following equation:
where and are the active power and reactive power acquired by the root node of the MG, respectively; is the th convex packet vertex; and are the active and reactive components of the th convex bag vertex, respectively; is the corresponding th segment factor; and is the number of vertices of the bumped bunches.
3. A Two-Tier Optimized Operation Model for Distribution Networks Based on CVaR Quantified Uncertainty
3.1. Uncertainty Modeling Considering Wind and Solar Power Generation
3.1.1. Conditional Value at Risk Theory
Value at risk (VaR) is a widely used risk measurement tool in the financial sector, which refers to the maximum possible loss of a financial asset or portfolio of securities over a specified future time period under normal market conditions and at a given level of confidence. However, VaR is not a consistency risk measure and does not satisfy subadditivity. Additionally, the non-adequate measurement of tail loss leads to limited applications. The conditional value at risk (CVaR) can overcome these shortcomings. The CVaR reflects the average potential loss that could be suffered if the loss exceeds the VaR value and is an expectation value that provides a more complete measure of the potential risk of the system than VaR.
Since the functional expressions of CVaR values are often difficult to solve, Rockafellar and Uryasev introduced the discrete value to approximate the CVaR value.
where is the decision variable, is the loss function, is the objective function that responds to a random event, is the threshold, is a certain confidence level, is the number of samples for the loss function , and stands for the probability that the th sample occurs.
3.1.2. Multi-Scenario Generation and Reduction Techniques
In this paper, scenario generation is based on the scenery historical data. It is assumed that both wind and photovoltaic power follow a normal distribution , where is the expected value of the wind and solar historical data, and is the percentage of fluctuation. Then, the Latin hypercube sampling (LHS) method is used to generate a large number of wind and PV output scenarios obeying probability distributions and the corresponding scenario probabilities.
In order to improve computational efficiency, the number of generated scenes needs to be reduced, leaving representative, typical scenes. We use the simultaneous backward reduction (SBR) method based on the Kantorovich distance for scene number reduction. Let the set of retained scenes be and the set of deleted scenes be . The Kantorovich distance is defined as follows:
where and are the scenarios of sets and , respectively; refers to the Euclidean geometric distance between and ; represents the product of the probabilities of scenarios and ; and and stand for the probabilities corresponding to scenarios and in sets and , respectively.
3.1.3. Quantification of Wind and Solar Uncertainty Based on CVaR Theory
Since the actual output of wind power may deviate from the forecast value, it introduces fluctuation to the VPP balancing load. In this paper, the wind and solar deviation values are quantified based on the CVaR theory. The deviation values of wind and solar energy at a given moment can be expressed in the following form:
where is the actual wind and solar output at a given moment in time, and represents the predicted value of wind and solar output at a given moment in time.
Let the loss of load risk cost coefficient be and the wind and solar curtailment risk cost coefficient be , so the loss of load risk cost function and the wind and solar curtailment risk cost function can be expressed in the following form:
Combining the multi-scene generation reduction technique with Equation (13) yields a quantitative expression for the CVaR of the loss of load and wind and solar curtailment.
Thus, the expression for the quantized values of uncertainty for wind and solar energy based on the CVaR theory are shown below.
3.2. Upper Layer Model
3.2.1. The Ladder-Type Carbon Price Mechanism Model
In adhering to the operating guidelines of the Chinese carbon market, free carbon emission allowances (CEAs) are assigned to the individual emission sources using a baseline method. Typically, if the actual carbon emissions fall below the allocated allowances, the surplus allowances can be traded in the carbon market. Conversely, if the emissions exceed the allocated allowances, it is mandatory to procure additional allowances. In a departure from the conventional model of carbon trading with a fixed carbon price, this paper introduces a ladder-type carbon price mechanism with the aim of fostering enthusiasm for carbon reduction initiatives and imposing effective constraints on carbon emission. The ladder-type carbon price mechanism includes the CEA model, the actual carbon emissions model, and the ladder-type carbon trading cost model.
- (1)
- The CEA model
There are three main types of carbon emission source: purchased electricity from the power grid, gas turbines, and diesel units. This paper contends that the source of carbon emissions from purchasing electricity from the power grid is coal-fired units.
- (2)
- The actual carbon emissions model
- (3)
- The ladder-type carbon trading cost model
The actual CEAs trading volume that can be used in the carbon trading market is as follows:
The ladder-type carbon trading cost is formulated as follows:
where is the ladder-type carbon trading cost of the distribution network, is the actual CEA trading volume of the distribution network, is the benchmark carbon price, is the growth rate of the carbon price, and is the interval length of the ladder-type carbon price.
3.2.2. Upper-Layer Objective Function
The objective function of the upper-layer model is the optimal economics of distribution network operation.
where is risk aversion factor, is the gas turbine operating cost, is the diesel unit operating cost, is the grid-connected cost of wind and solar power generation, is the cost of energy storage charging and discharging, is the MG output dispatch cost, is the demand response cost, is the cost of purchasing and selling electricity, is the gas turbine operating cost coefficient, is the diesel unit operating cost coefficient, is the wind power generation grid-connected cost coefficient, is the solar power generation grid-connected cost coefficient, and are the energy storage charging and discharging cost coefficients, is the MG output dispatch cost coefficient, is the interruptible load cost coefficient, is the transferable load cost coefficient, and are the purchasing electricity cost coefficient and the selling electricity cost coefficient, and are the wind and solar outputs, and are energy storage charging and discharging power, is the MG output, is the interruptible load, is the transferable load, and is selling electricity from the power grid.
3.2.3. Upper-Layer Constraints
- (1)
- Gas turbine output constraintwhere and are the upper and lower limits of the gas turbine output, respectively.
- (2)
- Diesel unit output constraintwhere and are the upper and lower limits of the diesel unit output, respectively.
- (3)
- Wind and solar power generation constraintswhere and are the forecast errors for the wind and PV outputs, respectively; and are the upper limits for the forecasting wind and PV outputs, respectively.
- (4)
- Energy storage constraintwhere and are the charging efficiency and discharging efficiency of energy storage, respectively; and are the upper and lower limits of the energy stored in the energy storage; is the energy stored at the initial moment of storage; is the energy stored at the last moment of storage; indicates the energy stored that can be used to charge; indicates the energy stored that cannot be used to charge, and the opposite holds for ; and are the upper and lower limits of storage charging power, respectively; and and are the upper and lower limits of storage discharging power, respectively.
- (5)
- MG output constraint
Based on the convex packet segmentation linearization constraint in Equation (12), a series of convex packet vertices can be obtained using Equation (35).
where and are the active and reactive power outputs from the MG to the distribution network, respectively; and are active and reactive power captured by the distribution network, respectively.
- (6)
- DR constraintwhere is the interruptible load coefficient, is the transferable load coefficient, and is the forecast load before the demand response.
- (7)
- Power purchase and sale constraintswhere indicates that the distribution network can purchase electricity from the power grid; indicates that the distribution network cannot purchase electricity from the power grid. The opposite holds for .
- (8)
- Distribution network power flow constraintwhere is injected power and is load power, respectively; refers to the sum of branch active power injected into node ; refers to the sum of branch active power flowing out of node , respectively; , , , and have the same meaning. and are active and reactive power flowing in line ; represents the minimum value of node voltage and represents maximum value of node voltage, respectively; and stands for resistance on line and stands for reactance on line , respectively. is line capacity.
- (9)
- Power balance constraints in cold weatherwhere is the EV charging load, and is the load growth factor affected by cold weather.
3.3. Lower-Layer Model
3.3.1. Lower-Layer Objective Function
The lower-layer objective function describes the maximum rate of new energy consumption connected to the distribution network.
3.3.2. Lower-Layer Constraints
The lower-layer objective function constraints are the same as those in Equation (37).
4. KKT Conditions for Solving the Two-Tier Model
For two-tier optimization problems, a common solution is to replace the lower-layer problem with KKT conditions. The KKT conditions formed by the lower-layer model are as follows:
where is the objective function of the lower-layer problem, is an equation constraint for the lower-layer problems, is the inequality constraint for the lower-layer problems, respectively, and and represent Lagrange multipliers.
The lower layer model can be transformed into Formulas (50)–(53).
where the dual variables and are nonlinear and need to be linearized using the large M method. Linearization is shown as follows:
where and are binary variables, and is an infinitely large number.
As a result, the two-tier optimized operation model of the distribution network is transformed into a single-tier model through the KKT condition in the form shown below.
The constraints include Equations from (29) to (47) and Equations from (50) to (53).
5. Example Analysis
5.1. Parameter Setting
In order to verify the validity of the EV load forecasting proposed in this paper, an urban road network in southeastern South Dakota, USA, is selected as the EV driving area, as shown in Figure 4. In this paper, according to the functional types and load characteristics of each area of the city, the area to be created is divided into three categories: a commercial area, a work area, and a residential area. The number on the road indicates the length of the road in kilometers. The private cars use the BYD Yuan PLUS series with 49.92 kWh energy. The net cars use the BYD Seagull series with 30.08 kWh energy. A total of 60 kW is used for the fast-charging chargers, and 20 kW is used for the slow-charging chargers for domestic use. The heating power of the BTMS is about 10 kW when the outdoor temperature is −25 degrees Celsius in cold weather.
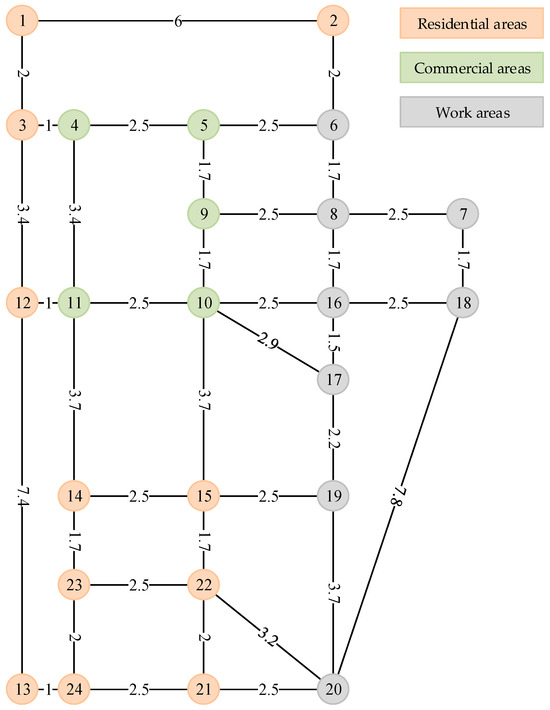
Figure 4.
Schematic diagram of EV traffic network.
This paper uses an improved 33-node distribution network, as shown in Figure 5. The microgrid includes PV and energy storage. The time scale for distribution network operation is set for a full day during a cold wave event. A relationship curve between daily load, wind power, and photovoltaic generation during cold wave weather is shown in Figure 6. Ten wind power and photovoltaic output scenarios are considered in this paper. Figure A1 and Figure A2 in Appendix A display generation and reduction diagrams of the wind power and photovoltaic output scenarios. The electricity trading prices adopt a time-of-use pricing model, as shown in Table 2. The relevant parameters of the gas turbine and diesel generator sets are listed in Table 3. The relevant parameters for energy storage are shown in Table 4. The other distribution network parameters are shown in Table 5.
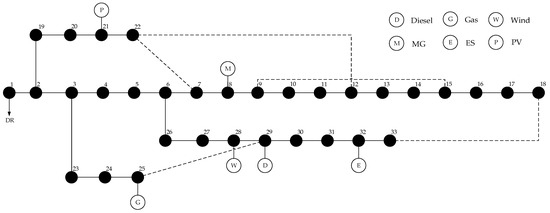
Figure 5.
Improved 33-node distribution network.
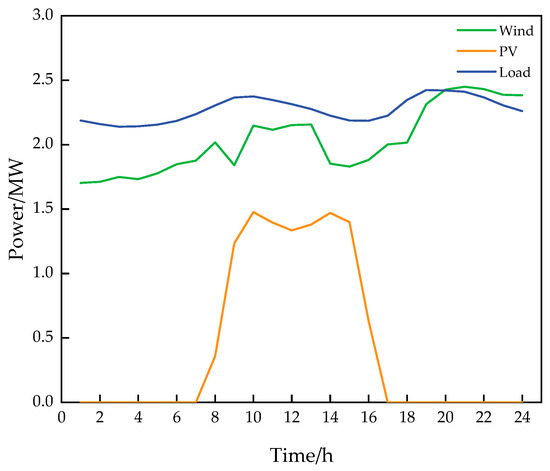
Figure 6.
Daily load versus wind and PV generation curves during cold weather conditions.

Table 2.
Purchase and sale price of electricity.

Table 3.
Parameters of gas turbine and diesel unit.

Table 4.
Parameters of energy storage.

Table 5.
The other relevant parameters in the distribution network.
5.2. Load Forecast Results for EV During Cold Waves
Figure 7 illustrates the charging demand of the different types of vehicle at various time periods and network nodes. Figure 7a displays the charging demand of private cars across the different time periods and network nodes throughout the day. As shown, the charging demand of the private cars peaks during the rush hours (approximately 8:00–9:00 a.m. and 6:00–7:00 p.m.), particularly at specific network nodes, such as nodes 2 and 6. During the other times of the day, the demand remains relatively stable. Figure 7b shows the charging demand of the ride-hailing vehicles, which exhibits significant fluctuations, especially during the morning and evening rush hours. The demand for charging from the ride-hailing vehicles substantially exceeds that of the private cars during these times, particularly at the network nodes, such as nodes 2 and 5. In the other periods, the demand for charging from the ride-hailing vehicles remains relatively low, but still maintains a certain level. Figure 7c presents the charging demand for all the vehicles, demonstrating broader fluctuations. Notably, during the morning and evening peak hours, the overall demand for charging increases significantly, with this figure showing the overlap in demand from the different vehicle types. For example, at nodes such as nodes 3 and 4, the charging demand is noticeably higher than that of the private cars, indicating a higher charging demand from the ride-hailing vehicles during these times. These figures reflect the spatial and temporal variabilities in charging demand, which are of significant importance for grid load management during cold weather events.
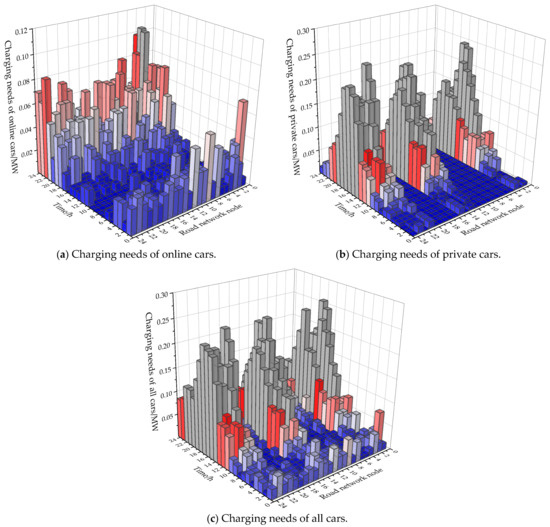
Figure 7.
EV load forecasting during cold waves.
Figure 8 illustrates the charging demand of the electric vehicles (EVs) at the different time periods throughout the day under both normal temperature and cold wave conditions. Under normal temperature conditions, the charging demand exhibits a typical daily fluctuation, with a peak around 12:00 p.m., followed by a gradual decline. This fluctuation is generally associated with changes in travel demand and vehicle usage frequency. The charging demand during the peak periods is mainly concentrated between noon and evening. Under cold wave conditions, the fluctuation in the charging demand curve is similar to that observed under normal temperature conditions. However, the overall charging demand significantly increases across all the time periods. This is because under cold wave conditions, EV charging requires additional power to be delivered to the battery thermal management system (BTMS), resulting in a higher charging demand. Moreover, cold wave weather led to an increase in charging demand during all the time periods, with a noticeable rise in the morning and the evening. During these periods, the charging demand under cold wave conditions is significantly higher than under normal temperature conditions. This suggests that low temperatures may reduce the battery efficiency of vehicles, thereby increasing the charging demand. In contrast, during the noon period, while the charging demand under cold wave conditions remains higher than under normal temperature conditions, the gap between the two is relatively smaller. This may be because temperatures are relatively higher around noon, allowing for the battery to recover, thereby reducing the difference in charging demand.
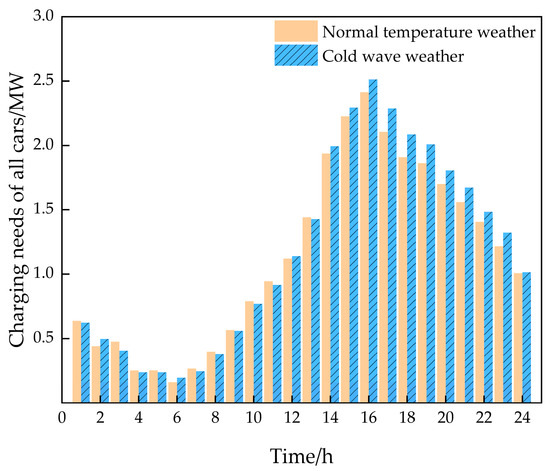
Figure 8.
Comparison of EV load forecasting under normal temperature weather and cold wave weather.
From this analysis, it is evident that cold wave conditions have a significant impact on charging demand. Compared to the normal temperature conditions, the charging demand during a cold wave is generally higher, especially during the morning and evening peak periods.
5.3. MGFOR Feature Analysis
Based on the discussion in Section 2.2, MGFOR for a typical time period is obtained by using the convex packet fitting method with a scheduling interval of 1 h, as shown in Figure 9.
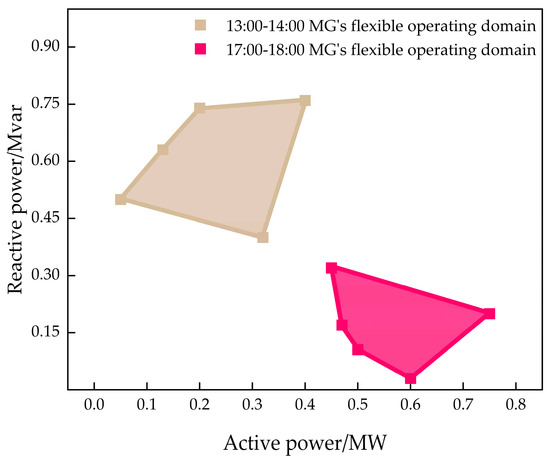
Figure 9.
MGFOR at typical time periods.
From a spatial scale perspective, the size of the flexible operating domain (MGFOR) shown in the figure is related to the characteristics of resources such as energy storage and photovoltaics (PVs) within the MG. In this study, the MG demonstrates a relatively good, flexible operating domain in regard to both active and reactive power, indicating that it has strong adjustability as a flexible dispatch unit for the distribution network. From a temporal scale perspective, during the 13:00–14:00 period, the PV output level is high, and the MG exhibits strong reactive power regulation capability; however, as the PV output level decreases during the 17:00–18:00 period, the reactive power regulation capability of the MG significantly decreases.
Therefore, the spatial location and range of MGFOR are often related to the load characteristics, distributed generation capacity, and equipment operation modes within the region. The visualization of MGFOR is crucial for the real-time coordinated optimization of the operation between the distribution grid and MGs.
Distribution microgrid contact active power is analyzed as an example of contact active power between the distribution grid and the MG, and the results are shown in Figure 10.
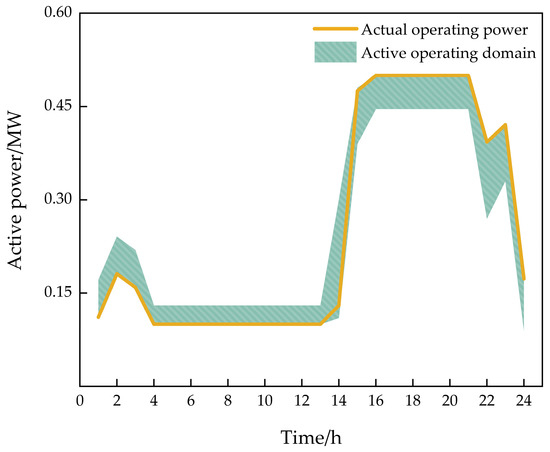
Figure 10.
Active operating domain of MG.
As shown in Figure 10, under the influence of cold wave weather, the EV charging demand significantly increases between 16:00 and 24:00, especially during the evening peak period from 16:00 to 21:00. During this time, energy storage in the microgrid (MG) will either maintain its discharge state or remain unchanged, with the active power of the connection operating along the upper boundary of the active power operation domain. However, during the period from 01:00 to 13:00, the EV charging demand is relatively low, and the distribution network’s own resources can meet the load demand. Any excess power can be transmitted through the connection line to the energy storage in the MG, which will either maintain its charging state or remain unchanged, with the active power of the connection operating along the lower boundary of the active power operation domain.
5.4. Characterization of Distribution Network Operation During Cold Waves
Figure 11 presents a comparison between the power balance results of the traditional single-layer distribution network model and the dual-layer distribution network model that considers renewable energy consumption.
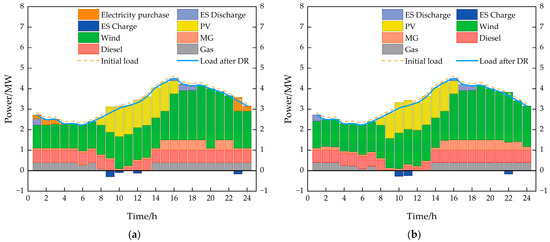
Figure 11.
Comparison of power balances of different modeled distribution networks. (a) Power balancing in traditional single-tier distribution network model during cold waves. (b) Power balance of a two-layer model for distribution networks considering new energy consumption during cold waves.
In the traditional distribution network model, wind and photovoltaic generation exhibits relatively stable outputs, but these renewable energy sources play a limited role in meeting load demands, especially during the high-demand period from 16:00 to 21:00, where the system still relies on traditional power sources, such as diesel generators, gas turbines, and electricity purchased from the grid.
In the dual-layer distribution network model, the consumption of renewable energy is better supported. Specifically, when wind and photovoltaic generation outputs are abundant, the energy storage system plays a crucial role. By utilizing the energy storage charging and discharging mode, the system effectively adjusts the load, achieves more renewable energy consumption, and stores excess power during low-demand periods to be used during high-demand times.
In the single-layer model, the amount of wind power consumed is only related to the electricity price of wind power, while in the double-layer model, the lower-level objective function requires new energy to be consumed locally as much as possible. Therefore, although the cost of purchasing electricity from the grid at 20:00–24:00 is lower than the cost of using wind power output, the wind power generation result shown in Figure 11b is still higher than that shown in Figure 11a. The same applies to photovoltaic power generation.
From the analysis above, it is evident that in the dual-layer distribution network model, overall load balancing is more efficient. Through the scheduling of the energy storage system, the system more flexibly responds to load demand fluctuations, especially during the peak period from 16:00 to 21:00. In contrast, the traditional distribution network model still heavily relies on external grid power during peak periods, leading to greater load fluctuations and limited space for renewable energy consumption.
Table 6 compares the performances of the traditional single-layer model and the two-layer model in the optimization of distribution network operations.

Table 6.
Comparison of optimization results between traditional single-layer model and two-layer model for distribution network operation.
In terms of operating costs, the operating cost of the two-layer model is CNY 56,858.97, while the operating cost of the traditional single-layer model is CNY 56,827.84. Although the cost of the two-layer model is slightly higher, the difference is very small, only CNY 31.13. This suggests that the two-layer model is nearly equivalent to the traditional single-layer model in terms of operating costs, indicating that the two-layer model is able to maintain cost-effectiveness.
In terms of carbon emissions, the net carbon emissions of the traditional single-layer model total 3.93 tons, while the net carbon emission total of the two-layer model is slightly lower at 3.67 tons, resulting in a reduction of 0.26 tons. The carbon emission penalty for the traditional single-layer model is CNY 7570.81, whereas the carbon emission penalty for the two-layer model is CNY 122.96 lower. This shows that the two-layer model has a certain advantage in reducing carbon emissions.
In terms of new energy consumption, the new energy consumption rate of the traditional single-layer model is 65.45%, while the new energy consumption rate of the two-layer model is 68.65%, an increase of 3.2 percentage points. This indicates that the two-layer model improves the new energy consumption rate.
From the above analysis, it can be concluded that the two-layer model proposed in this study, compared to the traditional single-layer model, has a slight increase in operating costs, but performs better in reducing carbon emissions and improving the new energy consumption rate. This demonstrates its advantages in terms of environmental friendliness and new energy utilization. Therefore, the two-layer model is more suitable for distribution network operation optimization scenarios with high requirements for carbon emission reduction and energy efficiency.
6. Conclusions
In this paper, for the distribution grid operation problem of resources that are flexibly regulated, a distribution grid operation model is obtained through the load prediction of EVs at the onset of a cold wave on the one hand and the flexible regulation capability of the MG determined using MGFOR on the other hand. On this basis, a bi-level optimization operation model of the distribution grid is proposed by quantifying the uncertainty of wind and solar power generation with the CVaR. The KKT condition is used to transform the bi-level model into a single-level model for solving, so as to obtain the optimal economic cost and new energy consumption rate of the distribution network. The conclusions drawn from the example analyzed are as follows:
- (1)
- The batteries of EVs under cold weather need to be heated by the BTMS system to ensure that the temperature is within a reasonable range; these EVs obtain less power, charge more often, and have a higher charging demand. The validity of the load prediction model for EVs during cold weather is verified.
- (2)
- By describing the flexible regulation capability of the microgrid using the convex hull fitting expression based on MGFOR, the flexible operating region of active and reactive power of the microgrid is obtained, providing a potential solution for the distribution network to handle the surge in EV loads during cold wave weather.
- (3)
- By constructing a two-layer operational model for distribution networks considering the uncertainty of wind and photovoltaic generation outputs and solving the problem using KKT conditions, the operational characteristics of the distribution network are obtained. Compared to the traditional single-layer distribution network model, the proposed model demonstrates significant improvements in carbon emission reduction and new energy consumption, with the total cost remaining nearly unchanged, thereby validating the effectiveness of the model presented in this study.
Author Contributions
Conceptualization, methodology, validation, writing—original draft preparation and formal analysis, L.S., X.L., W.J., J.Y. and C.W.; writing—review and editing, X.L. and W.J.; supervision, project administration and funding acquisition, L.S. and C.W. All authors have read and agreed to the published version of the manuscript.
Funding
This work was supported by the Technology Project of State Grid Jiangsu Electric Power Co., Ltd., China, under Grant J2024178.
Data Availability Statement
The original contributions presented in the study are included in this article; further inquiries can be directed to the corresponding author.
Conflicts of Interest
Lu Shen, Xing Luo and Wenlu Ji were employed by the State Grid Nanjing Power Supply Company. The remaining authors declare that the research was conducted in the absence of any commercial or financial relationships that could be construed as a potential conflict of interest.
Appendix A
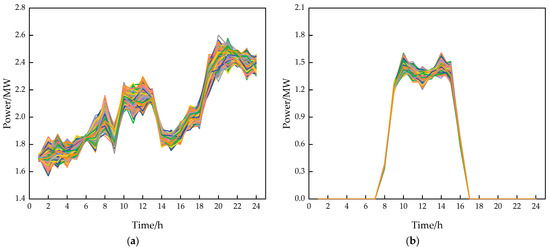
Figure A1.
Scenario generation in cold wave weather. (a) Three-thousand wind power output scenarios in cold wave weather. (b) Three-thousand PV output scenarios in cold wave weather.
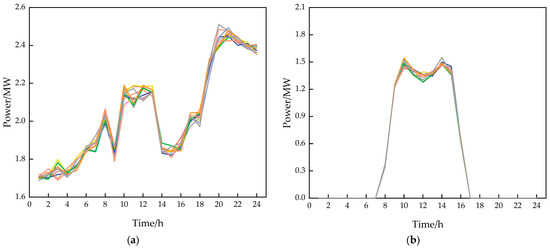
Figure A2.
Scenario reduction under cold wave weather. (a) Ten wind power output scenarios with scenario reductions in cold wave weather. (b) Ten PV output scenarios with scenario reductions in cold wave weather.
References
- Wang, Y.; Chen, C.; Wang, J.; Baldick, R. Research on Resilience of Power Systems Under Natural Disasters-A Review. IEEE Trans. Power Syst. 2016, 31, 1604–1613. [Google Scholar] [CrossRef]
- Stanković, A.M.; Tomsovic, K.L.; De Caro, F.; Braun, M.; Chow, J.H.; Čukalevski, N.; Dobson, I.; Eto, J.; Fink, B.; Hachmann, C.; et al. Methods for Analysis and Quantification of Power System Resilience. IEEE Trans. Power Syst. 2023, 38, 4774–4787. [Google Scholar] [CrossRef]
- Kumar, M.; Sharma, D. Energy Management in Microgrids with Uncertainty in EV and Renewable Sources. Iran. J. Sci. Technol. Trans. Electr. Eng. 2025, 49, 639–661. [Google Scholar] [CrossRef]
- Yang, N.; Zhu, L.; Wang, B.; Fu, R.; Qi, L.; Jiang, X.; Sun, C. A Master-Slave Game-Based Strategy for Trading and Allocation of Virtual Power Plants in the Electricity Spot Market. Energies 2025, 18, 442. [Google Scholar] [CrossRef]
- Adham, M.; Keene, S.; Bass, R.B. Distributed Energy Resources: A Systematic Literature Review. Energy Rep. 2025, 13, 1980–1999. [Google Scholar] [CrossRef]
- Liu, H.; Xing, Z.; Zhao, Q.; Liu, Y.; Zhang, P. An Orderly Charging and Discharging Strategy of Electric Vehicles Based on Space-Time Distributed Load Forecasting. Energies 2024, 17, 4284. [Google Scholar] [CrossRef]
- Tang, M.; Guo, X.; Qiu, J.; Li, J.; An, B. Electric Vehicle Charging Load Demand Forecasting in Different Functional Areas of Cities with Weighted Measurement Fusion UKF Algorithm. Energies 2024, 17, 4505. [Google Scholar] [CrossRef]
- Hou, S.; Zhang, X.; Yu, H. Electric Vehicle Charging Load Prediction Considering Spatio-Temporal Node Importance Information. Energies 2024, 17, 4840. [Google Scholar] [CrossRef]
- Bian, R.; Wang, L.; Liu, Y.; Dai, Z. Electric Vehicle Load Forecasting Based on Convolutional Networks with Attention Mechanism and Federated Learning Method. IET Gener. Transm. Distrib. 2024, 18, 2313–2324. [Google Scholar] [CrossRef]
- Matrone, S.; Ogliari, E.; Nespoli, A.; Leva, S. Electric Vehicle Supply Equipment Day-Ahead Power Forecast Based on Deep Learning and the Attention Mechanism. IEEE Trans. Intell. Transp. Syst. 2024, 25, 9563–9571. [Google Scholar] [CrossRef]
- Shi, J.; Zhang, W.; Bao, Y.; Gao, D.W.; Wang, Z. Load Forecasting of Electric Vehicle Charging Stations: Attention Based Spatiotemporal Multi–Graph Convolutional Networks. IEEE Trans. Smart Grid 2024, 15, 3016–3027. [Google Scholar] [CrossRef]
- Žnidarec, M.; Šljivac, D.; Knežević, G.; Pandžić, H. Double-Layer Microgrid Energy Management System for Strategic Short-Term Operation Scheduling. Int. J. Electr. Power Energy Syst. 2024, 157, 109816. [Google Scholar] [CrossRef]
- Luo, J.; Panchabikesan, K.; Lai, K.-H.; Olawumi, T.O.; Mewomo, M.C.; Liu, Z. Game-Theoretic Optimization Strategy for Maximizing Profits to both End-Users and Suppliers in Building Rooftop PV-based Microgrids. Energy 2024, 313, 133715. [Google Scholar] [CrossRef]
- Li, X.; Zhang, Z.; Jiang, Y.; Yang, X.; Zhang, Y.; Li, W.; Wang, B. Multi-Objective Operation Optimization of Park Microgrid Based on Green Power Trading Price Prediction in China. Energies 2025, 18, 46. [Google Scholar] [CrossRef]
- Li, C.; Kang, Z.; Yu, H.; Wang, H.; Li, K. Research on Energy Optimization Method of Multi-microgrid System Based on the Cooperative Game Theory. J. Electr. Eng. Technol. 2024, 19, 2953–2962. [Google Scholar] [CrossRef]
- Kaleta, M. Robust Co-Optimization of Medium- and Short-Term Electrical Energy and Flexibility in Electricity Clusters. Energies 2025, 18, 479. [Google Scholar] [CrossRef]
- Dolatnia, A.; Sarvari, P.; Sarmadi, B.; Baghramian, A. An Interval-based Model for Stochastic Optimal Scheduling of Multi Carrier Energy Hubs in the Presence of Multiple Sources of Uncertainty. Electr. Power Syst. Res. 2025, 242, 111447. [Google Scholar] [CrossRef]
- Wang, G.; Li, H.; Yang, X.; Lu, H.; Song, X.; Li, Z.; Wang, Y. Multi-Objective Site Selection and Capacity Determination of Distribution Network Considering New Energy Uncertainties and Shared Energy Storage of Electric Vehicles. Electronics 2025, 14, 151. [Google Scholar] [CrossRef]
- Ai, Q.; Xiang, J.; Liu, Y.; Qu, L.; Cao, J.; Li, X.; Wang, Y. Multi-Scenario Flexibility Assessment of Power Systems Considering Renewable Energy Output Uncertainty. Front. Energy Res. 2024, 12, 1359233. [Google Scholar] [CrossRef]
- Qi, N.; Su, J. Stochastic Optimization of Integrated Electricity-Heat-Gas Energy System Considering Uncertainty of Indirect Carbon Emission Intensity. IET Gener. Transm. Distrib. 2025, 19, e70014. [Google Scholar] [CrossRef]
- Chang, J.; Zhang, J.; Liao, X.; Lu, J. Distributed Reactive Power Optimization of Flexible Distribution Network Based on Probability Scenario-Driven. Energy Rep. 2025, 13, 68–81. [Google Scholar] [CrossRef]
- Cha, J.; Han, C.; Song, S.; Kang, S.; Lee, D.; Chang, M.; Jang, G. Hierarchical Co-Optimization of EV Scheduling Considering Customer and System in Distribution Networks. Sustain. Energy Grids Netw. 2024, 38, 101361. [Google Scholar] [CrossRef]
- Lu, D.; Li, W.; Zhang, L.; Fu, Q.; Jiao, Q.; Wang, K. Multi-Objective Optimization and Reconstruction of Distribution Networks with Distributed Power Sources Based on an Improved BPSO Algorithm. Energies 2024, 17, 4877. [Google Scholar] [CrossRef]
- Wu, Y.; Xiong, Y.; Peng, X.; Cai, C.; Zheng, X. Research on a Three-Stage Dynamic Reactive Power Optimization Decoupling Strategy for Active Distribution Networks with Carbon Emissions. Energies 2024, 17, 2774. [Google Scholar] [CrossRef]
Disclaimer/Publisher’s Note: The statements, opinions and data contained in all publications are solely those of the individual author(s) and contributor(s) and not of MDPI and/or the editor(s). MDPI and/or the editor(s) disclaim responsibility for any injury to people or property resulting from any ideas, methods, instructions or products referred to in the content. |
© 2025 by the authors. Licensee MDPI, Basel, Switzerland. This article is an open access article distributed under the terms and conditions of the Creative Commons Attribution (CC BY) license (https://creativecommons.org/licenses/by/4.0/).