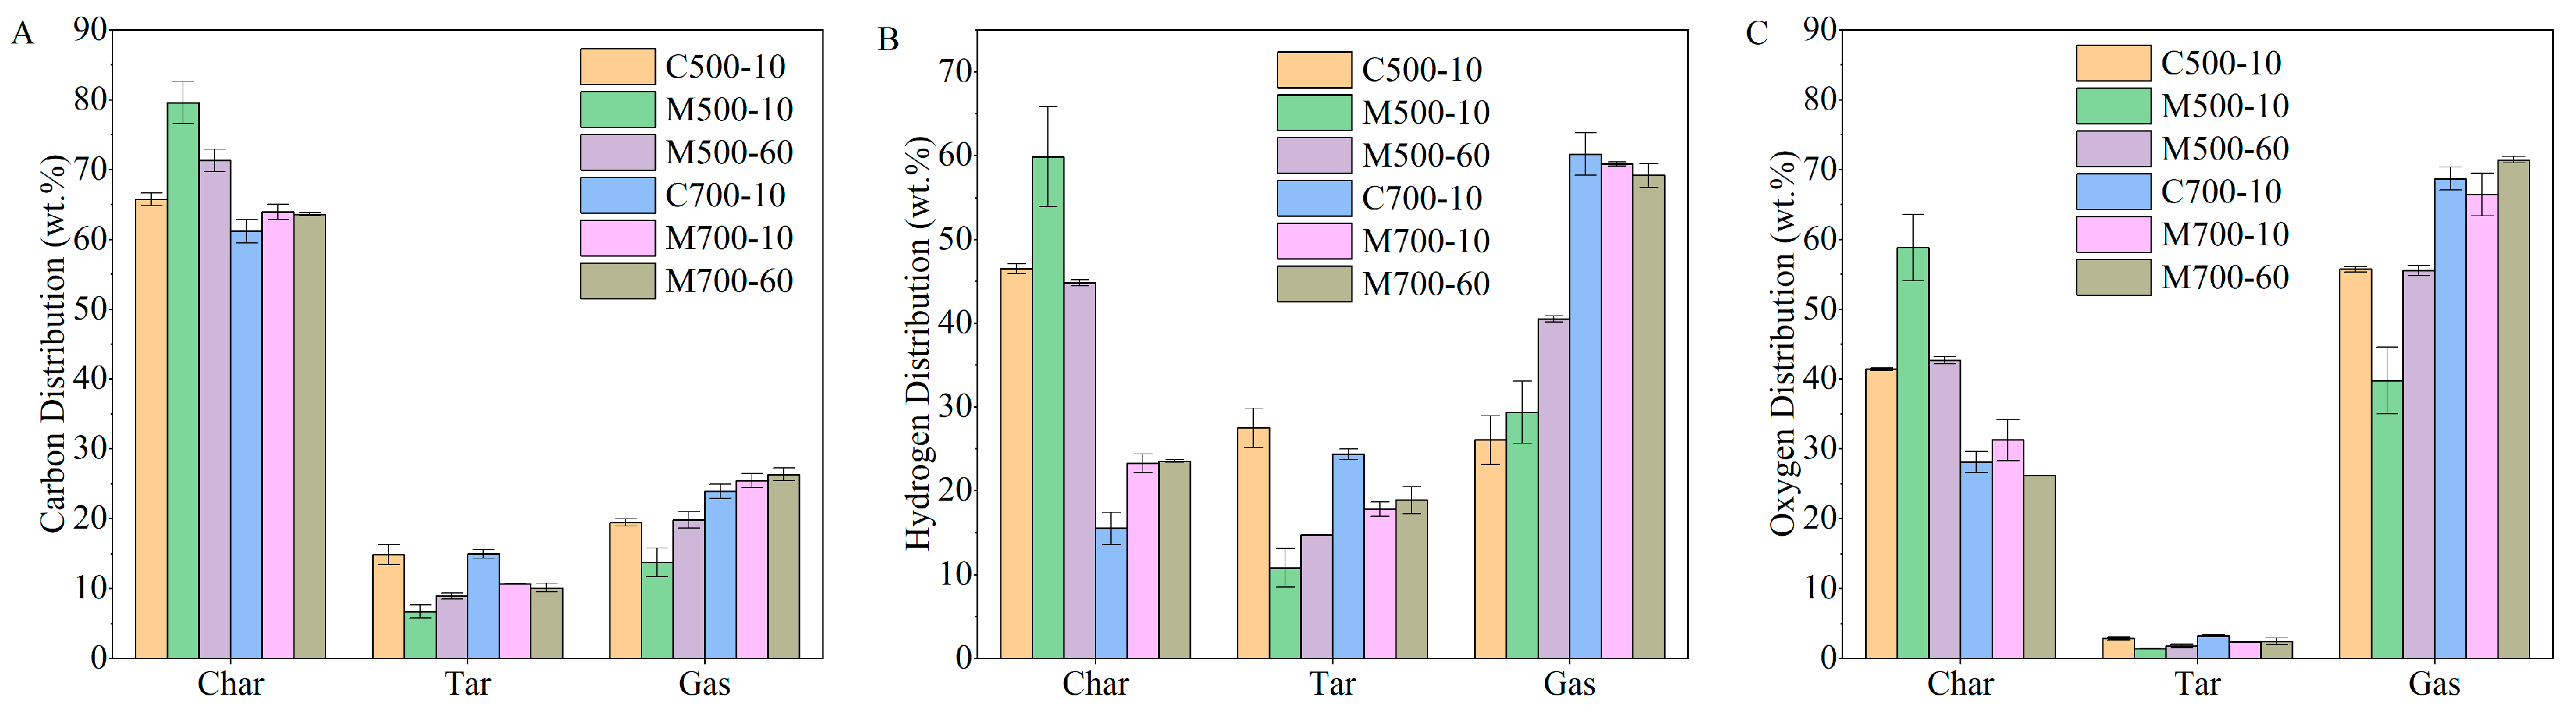
3.1. The Distribution of Pyrolysis Products and H2 Yield
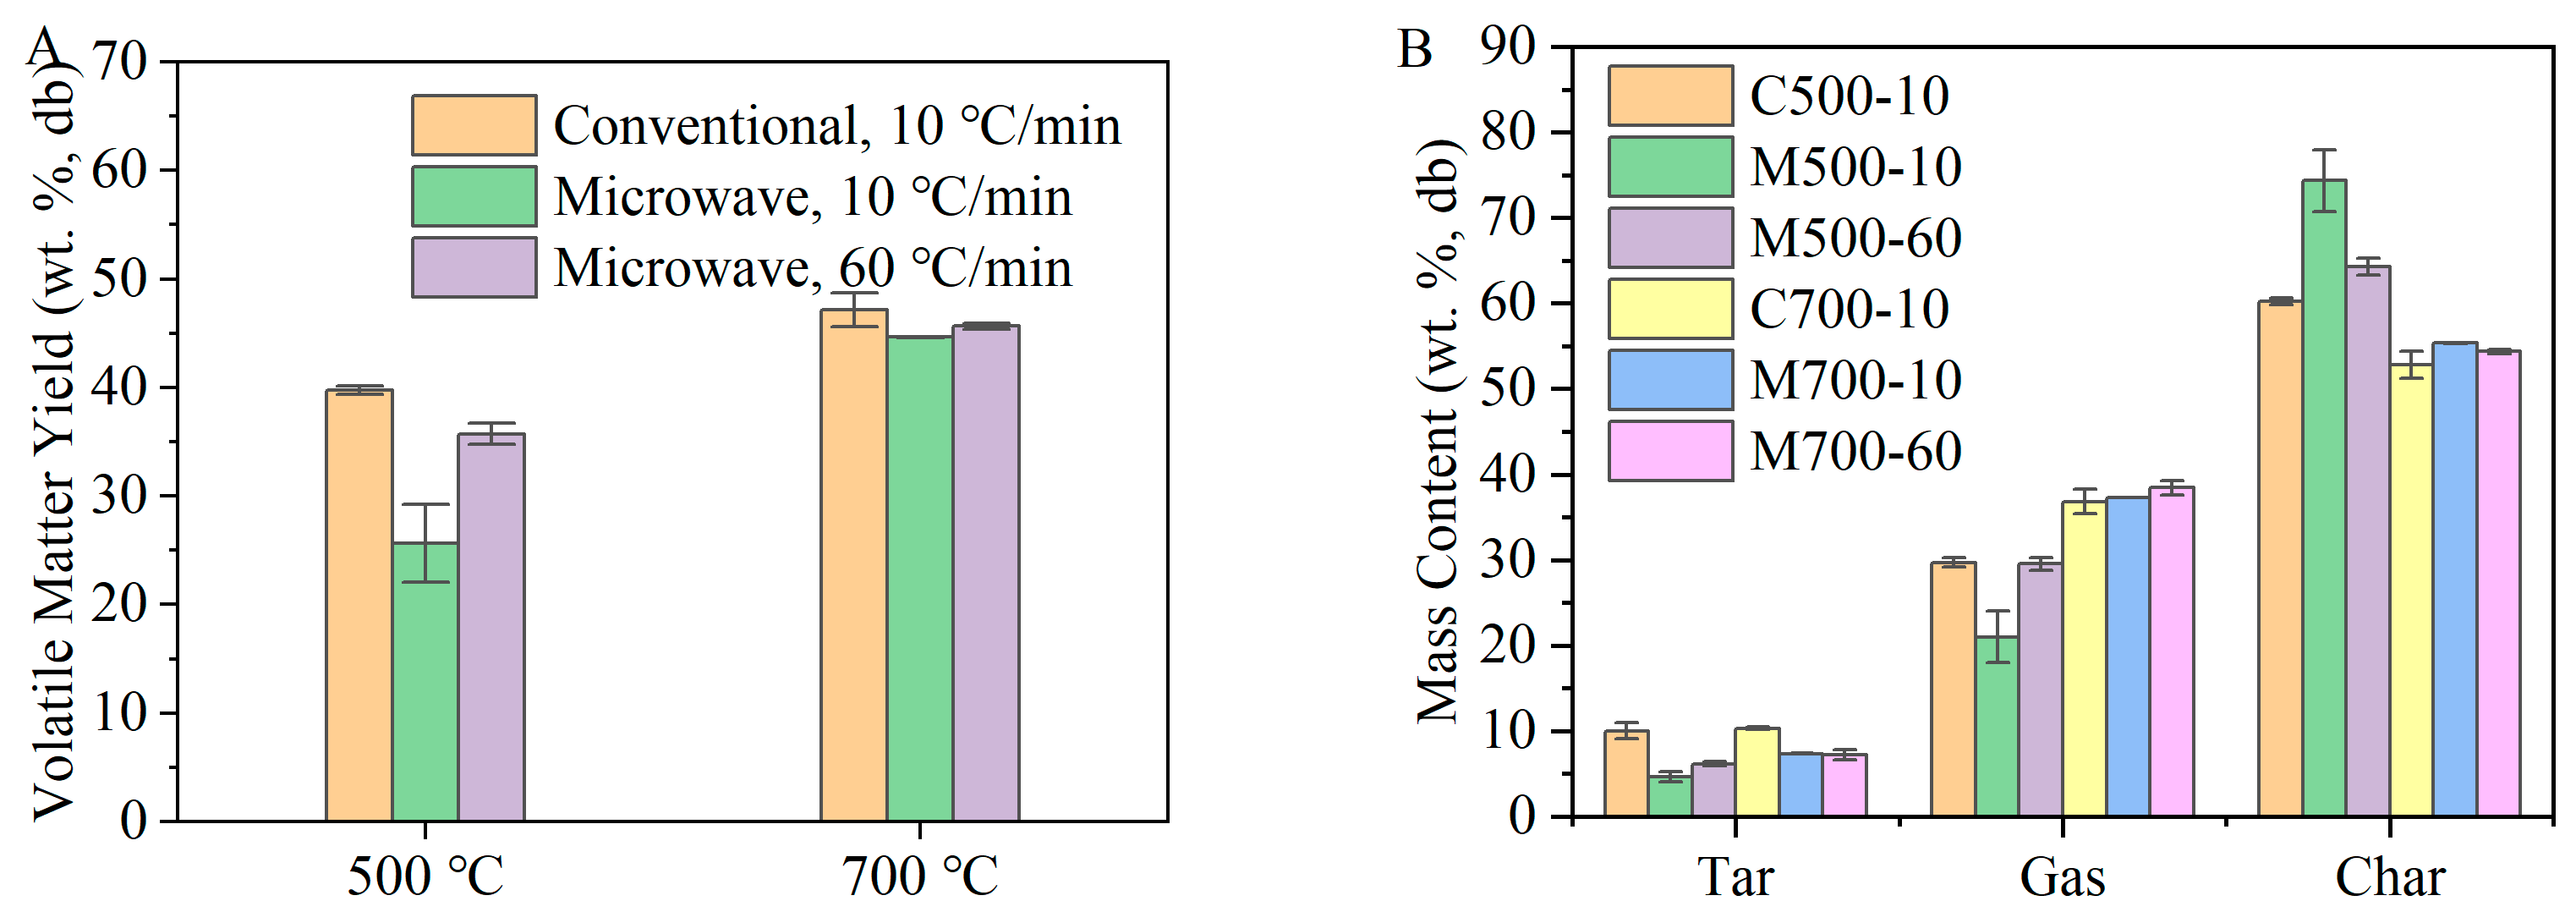
During pyrolysis, the combined gas and tar released from coal particles were regarded as volatiles, and their yields were determined under different conditions. The yield of volatile matter and distribution of pyrolysis products are shown in
Figure 2. The highest volatile yield and gas production were achieved at 700 °C and the heating rates of 10 and 60 °C/min using the conventional and microwave heating methods, respectively. These conditions are referred to as C700-10 and M700-60 in
Figure 2, where C or M, 700, and 10 or 60 represent conventional or microwave heating, the target temperature, and the heating rate, respectively.
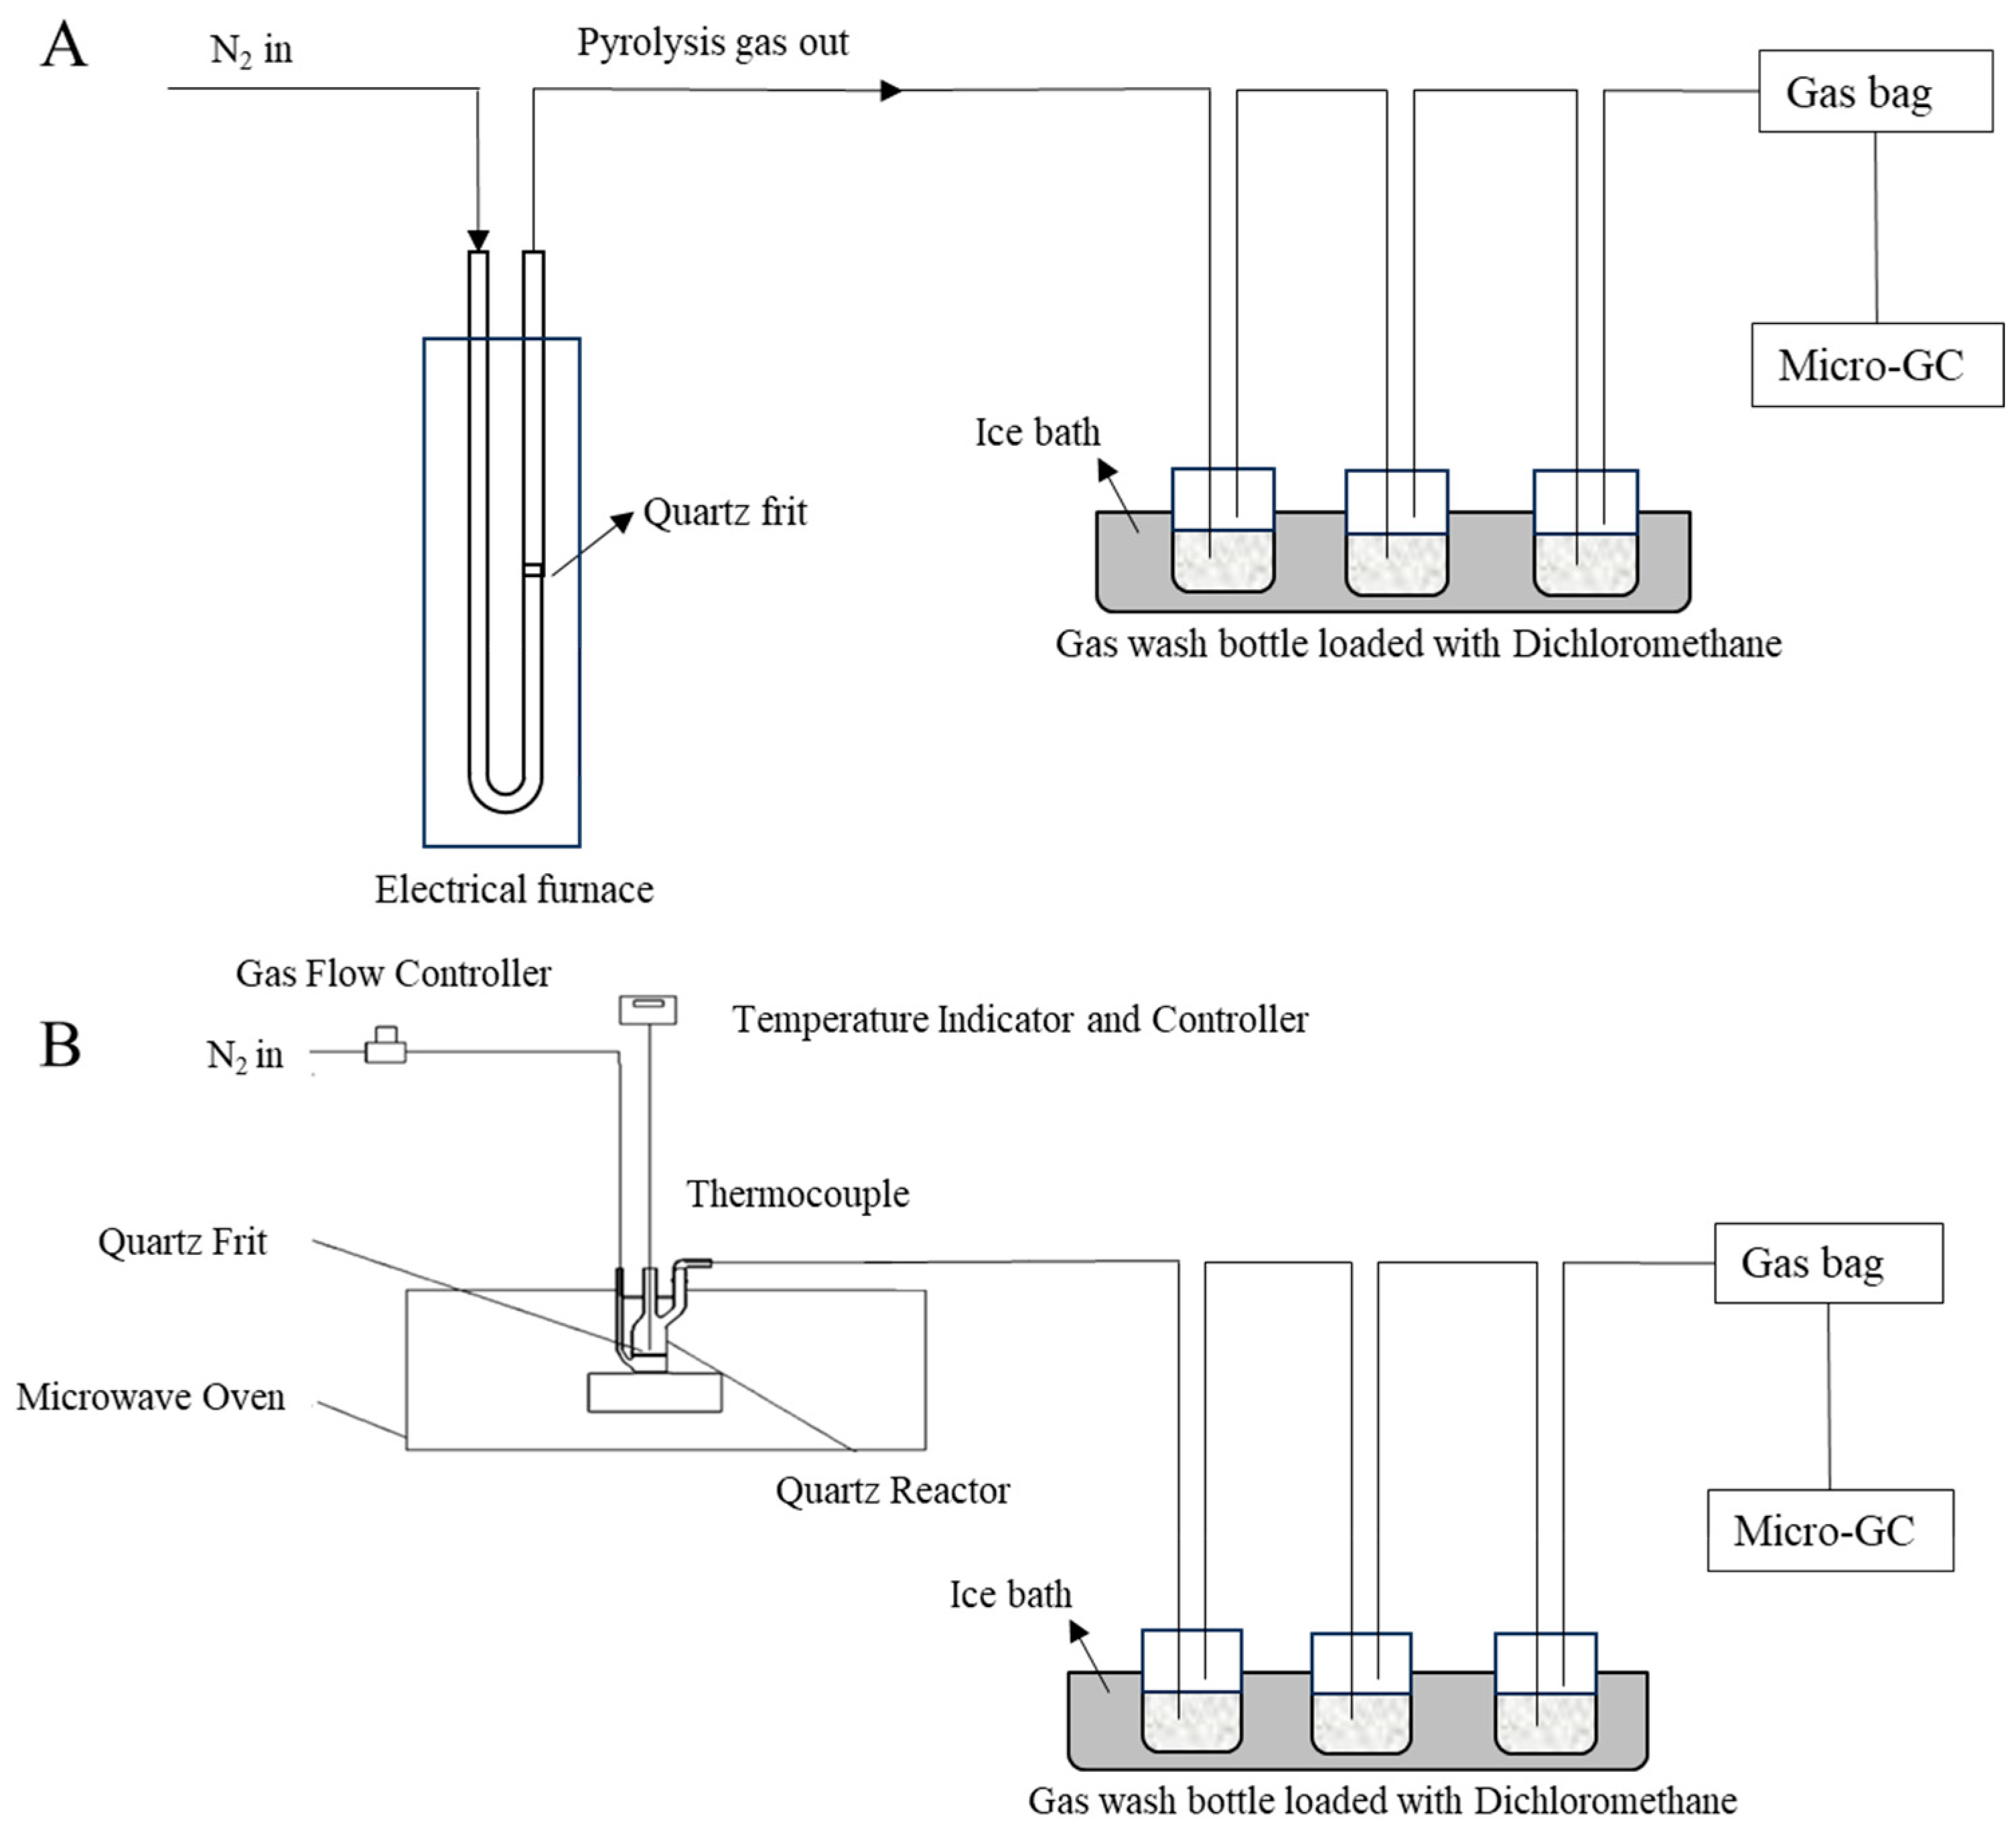
At 500 °C, the yield of volatile matter (25.65%) under microwave heating was much lower than that under conventional heating (39.75%), which may have resulted from the unevenly distributed temperature field in the coal layer and fast heat loss along the direction of the purge gas as expected by the volumetric heating nature of coals under the microwave. Silicon carbide, with a particle size of 500–1000 µm, was blended with the coal sample as a microwave absorber. As a result, the coal particles near the silicon carbide particles were heated from the outside towards the core. The heat generated by microwave absorption within the coal sample and transferred from the inside to the surface was minimal due to the coal’s limited ability to convert microwave energy into heat. Hence, the existence of SiC particles also contributed to the uneven temperature field in the coal layer. When coal turns into char at some degree (at around 300–400 °C in this study), the uneven temperature field is relieved because of the char’s better dielectric properties, which still cannot fully compensate for the yield decrease because of the different heat histories. The yield of volatiles was promoted to 35.71% when the higher heating rate was adopted. The rapid temperature increase due to fast heating is believed to enhance the driving force of pyrolysis, releasing more volatile matter in a shorter time [
27]. The shorter residence time at low temperatures also alleviated the effect of an uneven temperature field on volatile yield. Consistently, at 700 °C, the coal sample under conventional heating had a slightly higher yield of volatiles than that under microwave heating. Abdelsayed et al. [
16] suggested that this phenomenon may occur because the selective energy needed to heat specific functional groups in coal can reach a steady state under a fixed microwave power, becoming independent of the bulk temperature of char, whether it is 500 or 700 °C.
The difference in volatile matter yield under various conditions influenced the resulting pyrolysis product distribution. At 500 °C, a considerable number of volatiles were released from the coal samples, except under microwave heating at a 10 °C/min heating rate (M500-10). Consequently, among the three conditions, the yields of tar and gas were lowest under M500-10. Although the char yields under M500-60 and C500-10 were similar, microwave heating favoured the conversion of more volatiles into gas rather than tar. At higher temperatures, the difference in process parameters had a minimal impact on the volatile yield, as shown in
Figure 2. However, a similar trend was also observed at 700 °C, with microwave heating resulting in a higher proportion of volatiles being converted into lighter gases. Additionally, the higher heating rate promoted more volatiles to evolve as gas, as can be seen by the slightly higher gas yield and lower tar yield under microwave heating at a 60 °C/min heating rate.
The volumetric concentrations and yields of H
2 under different pyrolysis conditions are shown in
Table 2. The highest H
2 concentration was achieved with M700-10. When considering the yield of H
2 per gram of ash-free coal, the yield with M700-10 was significantly higher than under other conditions. This could be attributed to the high temperature and the mechanism of the microwave-assisted heating method. When comparing the results of samples heated to 500 °C and 700 °C, it is evident that the higher temperature promotes H
2 production due to the increased cracking of larger tar molecules, leading to the release of H
2 [
4]. Additionally, in the case of C500-10, the coal is not fully pyrolysed and still contains volatiles. Due to the selective heating feature of microwave heating, plasma and local hot spots were formed [
28], which were conducive to coal decomposition. Microwave heating outperformed conventional heating in terms of H
2 production under all reaction conditions. However, the effect of the heating rate on H
2 production was inconsistent, necessitating further detailed exploration of its pyrolysis characteristics, as discussed in the following sections.
3.2. The Evolution of Pyrolysis Gas
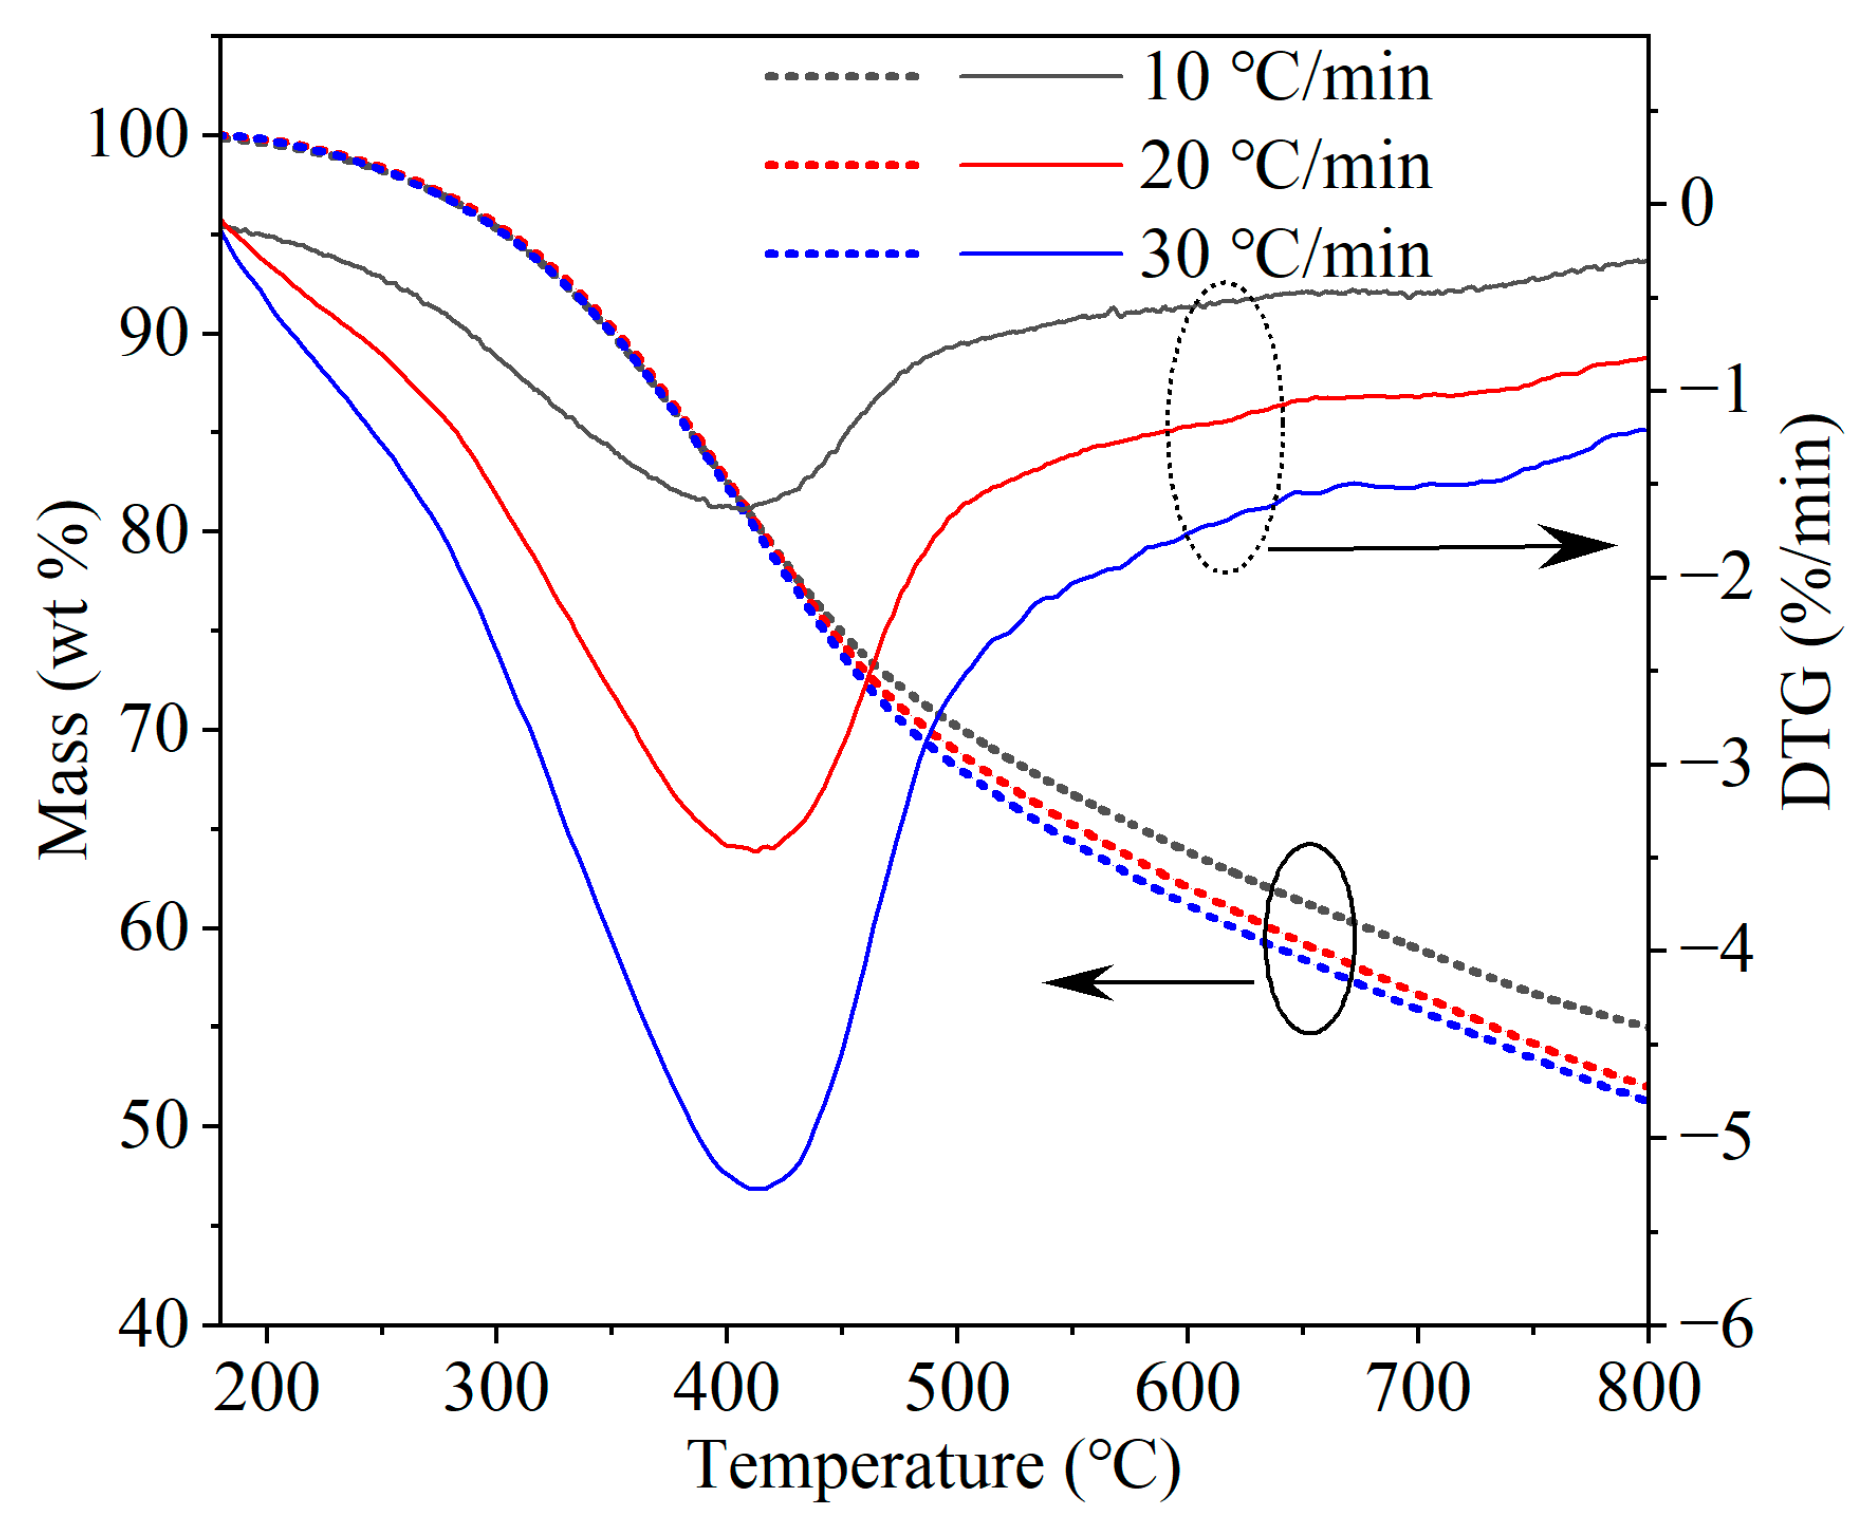
The TGA mass loss and corresponding loss rate with the temperature and heating rate are shown in
Figure 3. The mass loss (TG) and the maximum loss rate (DTG
max) increased with the heating rate. At high heating rates, the powerful driving force of the decomposition reaction [
27] was reflected by higher concentrations of tar and gas molecules produced in a shorter time, leading to increased volatile matter release and less char. DTG
max of the three curves appeared in the range of 400–410 °C, corresponding to the decomposition of coal structures and release of volatiles in the early stages of pyrolysis. DTG
max shifted to higher temperatures at higher heating rates as a result of heat hysteresis. The second peak between 690 and 720 °C could be attributed to polycondensation reactions in the later stages of coal pyrolysis.
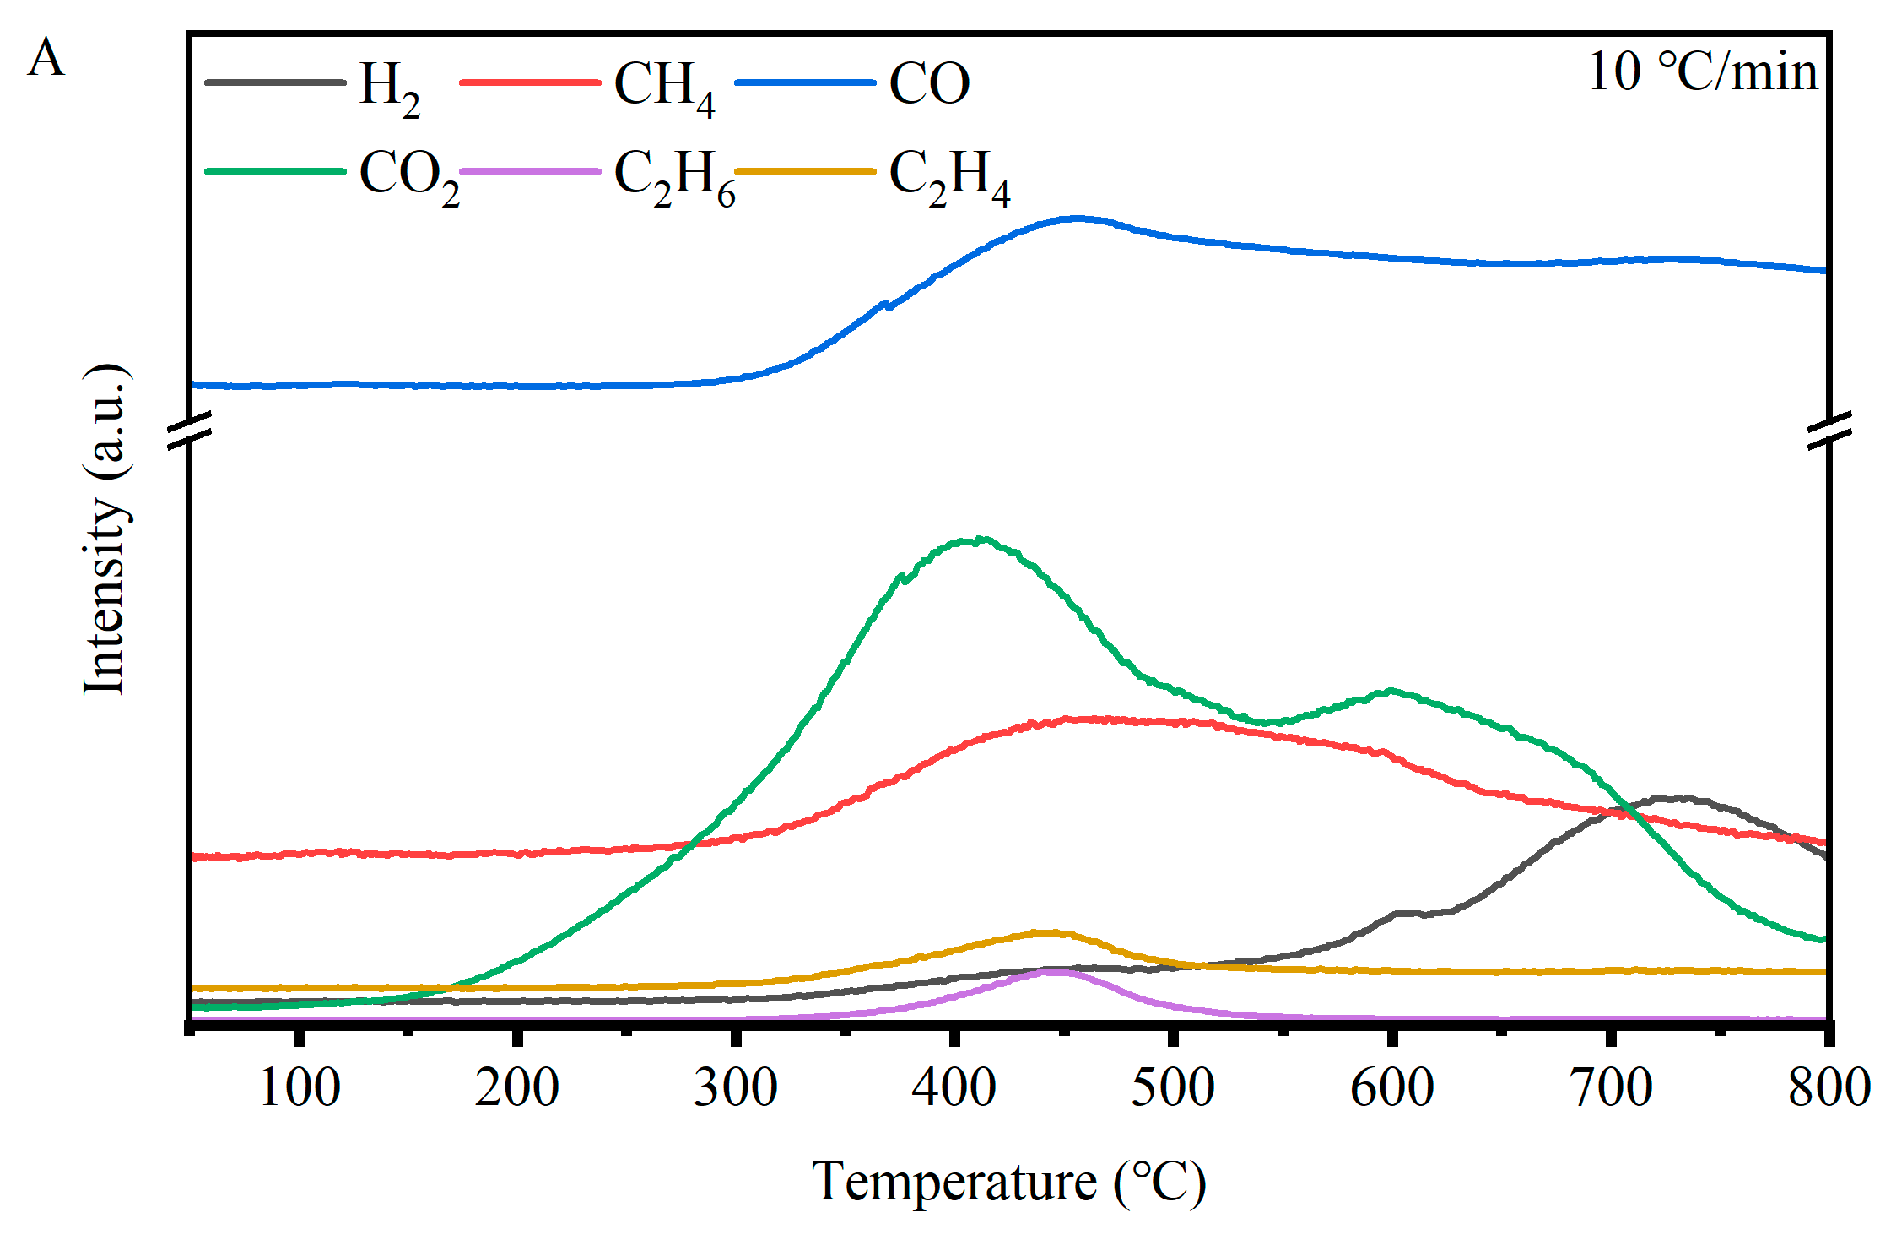
Figure 4 shows the evolution of pyrolysis gases as a function of temperature and heating rate, as measured using MS. When analysing these results, it should be noted that due to the gas transfer line between TGA and MS being heated to 280 °C, some secondary reactions may take place and impact the measured gas composition. For CO
2, the peak temperature shifted from 407 °C at 10 °C/min to 450 °C at 30 °C/min because of heat hysteresis. CO
2 was also the earliest gas to be released, originating from the decomposition of fragile oxygen-containing functional groups, such as carboxyl, carboxylate, etc. The second peak at around 600 °C was detected at 10 °C/min. At higher heating rates, this peak appeared as a shoulder peak. This could be ascribed to the decomposition of oxo-carbon at high temperatures [
29], as supported by Wang et al. [
30], who assigned the shoulder peak at 600 °C to the decomposition of ether, quinone, and oxygen-containing heterocyclic compounds in the coal sample, and even found a third peak at 800 °C formed by the decomposition of carbonates. However, this third peak was not detected in our tests, likely due to the difference in ash content and composition [
31].
The appearance of the CO peak was later than that of CO
2, at around 450–490 °C. CO is believed to have mainly come from the O-containing bridge of aromatic–aromatic or aromatic–aliphatic structures, and they are the main source of CO at low temperatures [
19,
30]. CO was also detected at high temperatures because of the decomposition of some stable phenols, the release of oxygen in nascent char, and the CO
2 gasification reaction [
30,
32]. Similarly, the peak temperatures of CH
4 and C
2 hydrocarbons were close to that of CO, suggesting they were formed during the decomposition of the same structures. The cleavage of ether structures acting as the bridge of aromatic rings and alkyl groups can lead to the formation of light hydrocarbons and CO. In the later stages of pyrolysis, methane can form from polycondensation reactions of aromatic structures.
The evolution of H
2 varied significantly with the reaction conditions, such as the heating rates. There were two peaks of H
2 in the three curves. At the heating rate of 10 °C/min, the increasing H
2 intensity in the range of 450–490 °C resulted from the combination of H radicals, corresponding well to the first H
2 peaks at heating rates of 20 and 30 °C/min. The first peak at a heating rate of 10 °C/min appeared at around 600 °C, gradually disappearing as the heating rate increased. This peak corresponded well with the second peak of CO
2 and was formed during cyclisation, dehydrogenation, aromatisation, and PAH growth reactions [
15]. Furthermore, some stable O-containing compounds retained in the char due to the lower volatile release rate also acted as precursors for oxygen-containing tar molecules, which subsequently underwent secondary reactions in the later stages, producing CO, CO
2, H
2, and aromatic compounds. The second H
2 peak at 725 °C was formed during the polycondensation and dehydrogenation reactions in the later stages of pyrolysis.
3.3. The Evolution of Surface Functional Groups
The in situ DRIFTS spectra for the coal sample are shown in
Figure 5. The assignment of peaks and bands is given in
Table 3 [
15,
33]. The peak at 3550 cm
−1 was assigned to the stretching vibration of the -OH functional group, corresponding to phenols, acids, alcohols, and moisture, which gradually disappeared at higher temperatures. The intensities of peaks in the range of 3000–2800 cm
−1, corresponding to -CH
x stretching vibrations for methine, methylene, and methyl groups, decreased with temperature, forming CH
4. The other source of CH
4 was the decomposition of -O-CH
3 at 1450 cm
−1, which was promoted at higher temperatures.
The decreased intensity of the band at 1715 cm
−1, corresponding to the decomposition of carboxyl and carbonyl C=O groups, led to the evolution of CO, CO
2, and H
2O during pyrolysis. The higher intensity of the peak at 1610 cm
−1 between 400 and 500 °C, compared with that in raw coal, corresponding to the aromatic structures of char, can be explained by the cracking and decomposition of less stable structures, leading to a large aromatic skeleton being exposed. The decrease in the intensity of this peak at higher temperatures can be attributed to the cyclisation, aromatisation reaction, and aromatic ring growth, forming condensed and ordered aromatic rings that are usually infrared-inactive. These changes correspond with an increase in H
2 evolution between 400 and 600 °C, as shown in
Figure 4A.
The changes in the intensities of aromatic hydrogen -CH out-of-plane vibrations in the range of 900–700 cm
−1 followed a similar trend, namely, they increased from room temperature to 500 °C, followed by a decrease at higher temperatures. This trend could be explained by cyclisation and aromatisation reactions, as discussed above. The information about the stretching vibration of aromatic -CH in the range of 3100–3000 cm
−1 is limited due to its low intensities at all temperatures, and the apparent peak only appeared at temperatures above 500 °C. The increased peak intensity in the band range of 1300–900 cm
−1 observed in char after heating, corresponding to C-O stretching vibrations, and the increase in the aromatic -CH vibrations in the range of 3100–3000 cm
−1 and 900–700 cm
−1 compared with raw coal could indicate the presence of some cross-linkage via ether bridging or aromatic substitution. The subsequent decrease after 600 °C, corresponding to the diminishing oxygen content in the char, aligned with the declining trends observed in the evolution curves of CO and CO
2 in
Figure 4A.
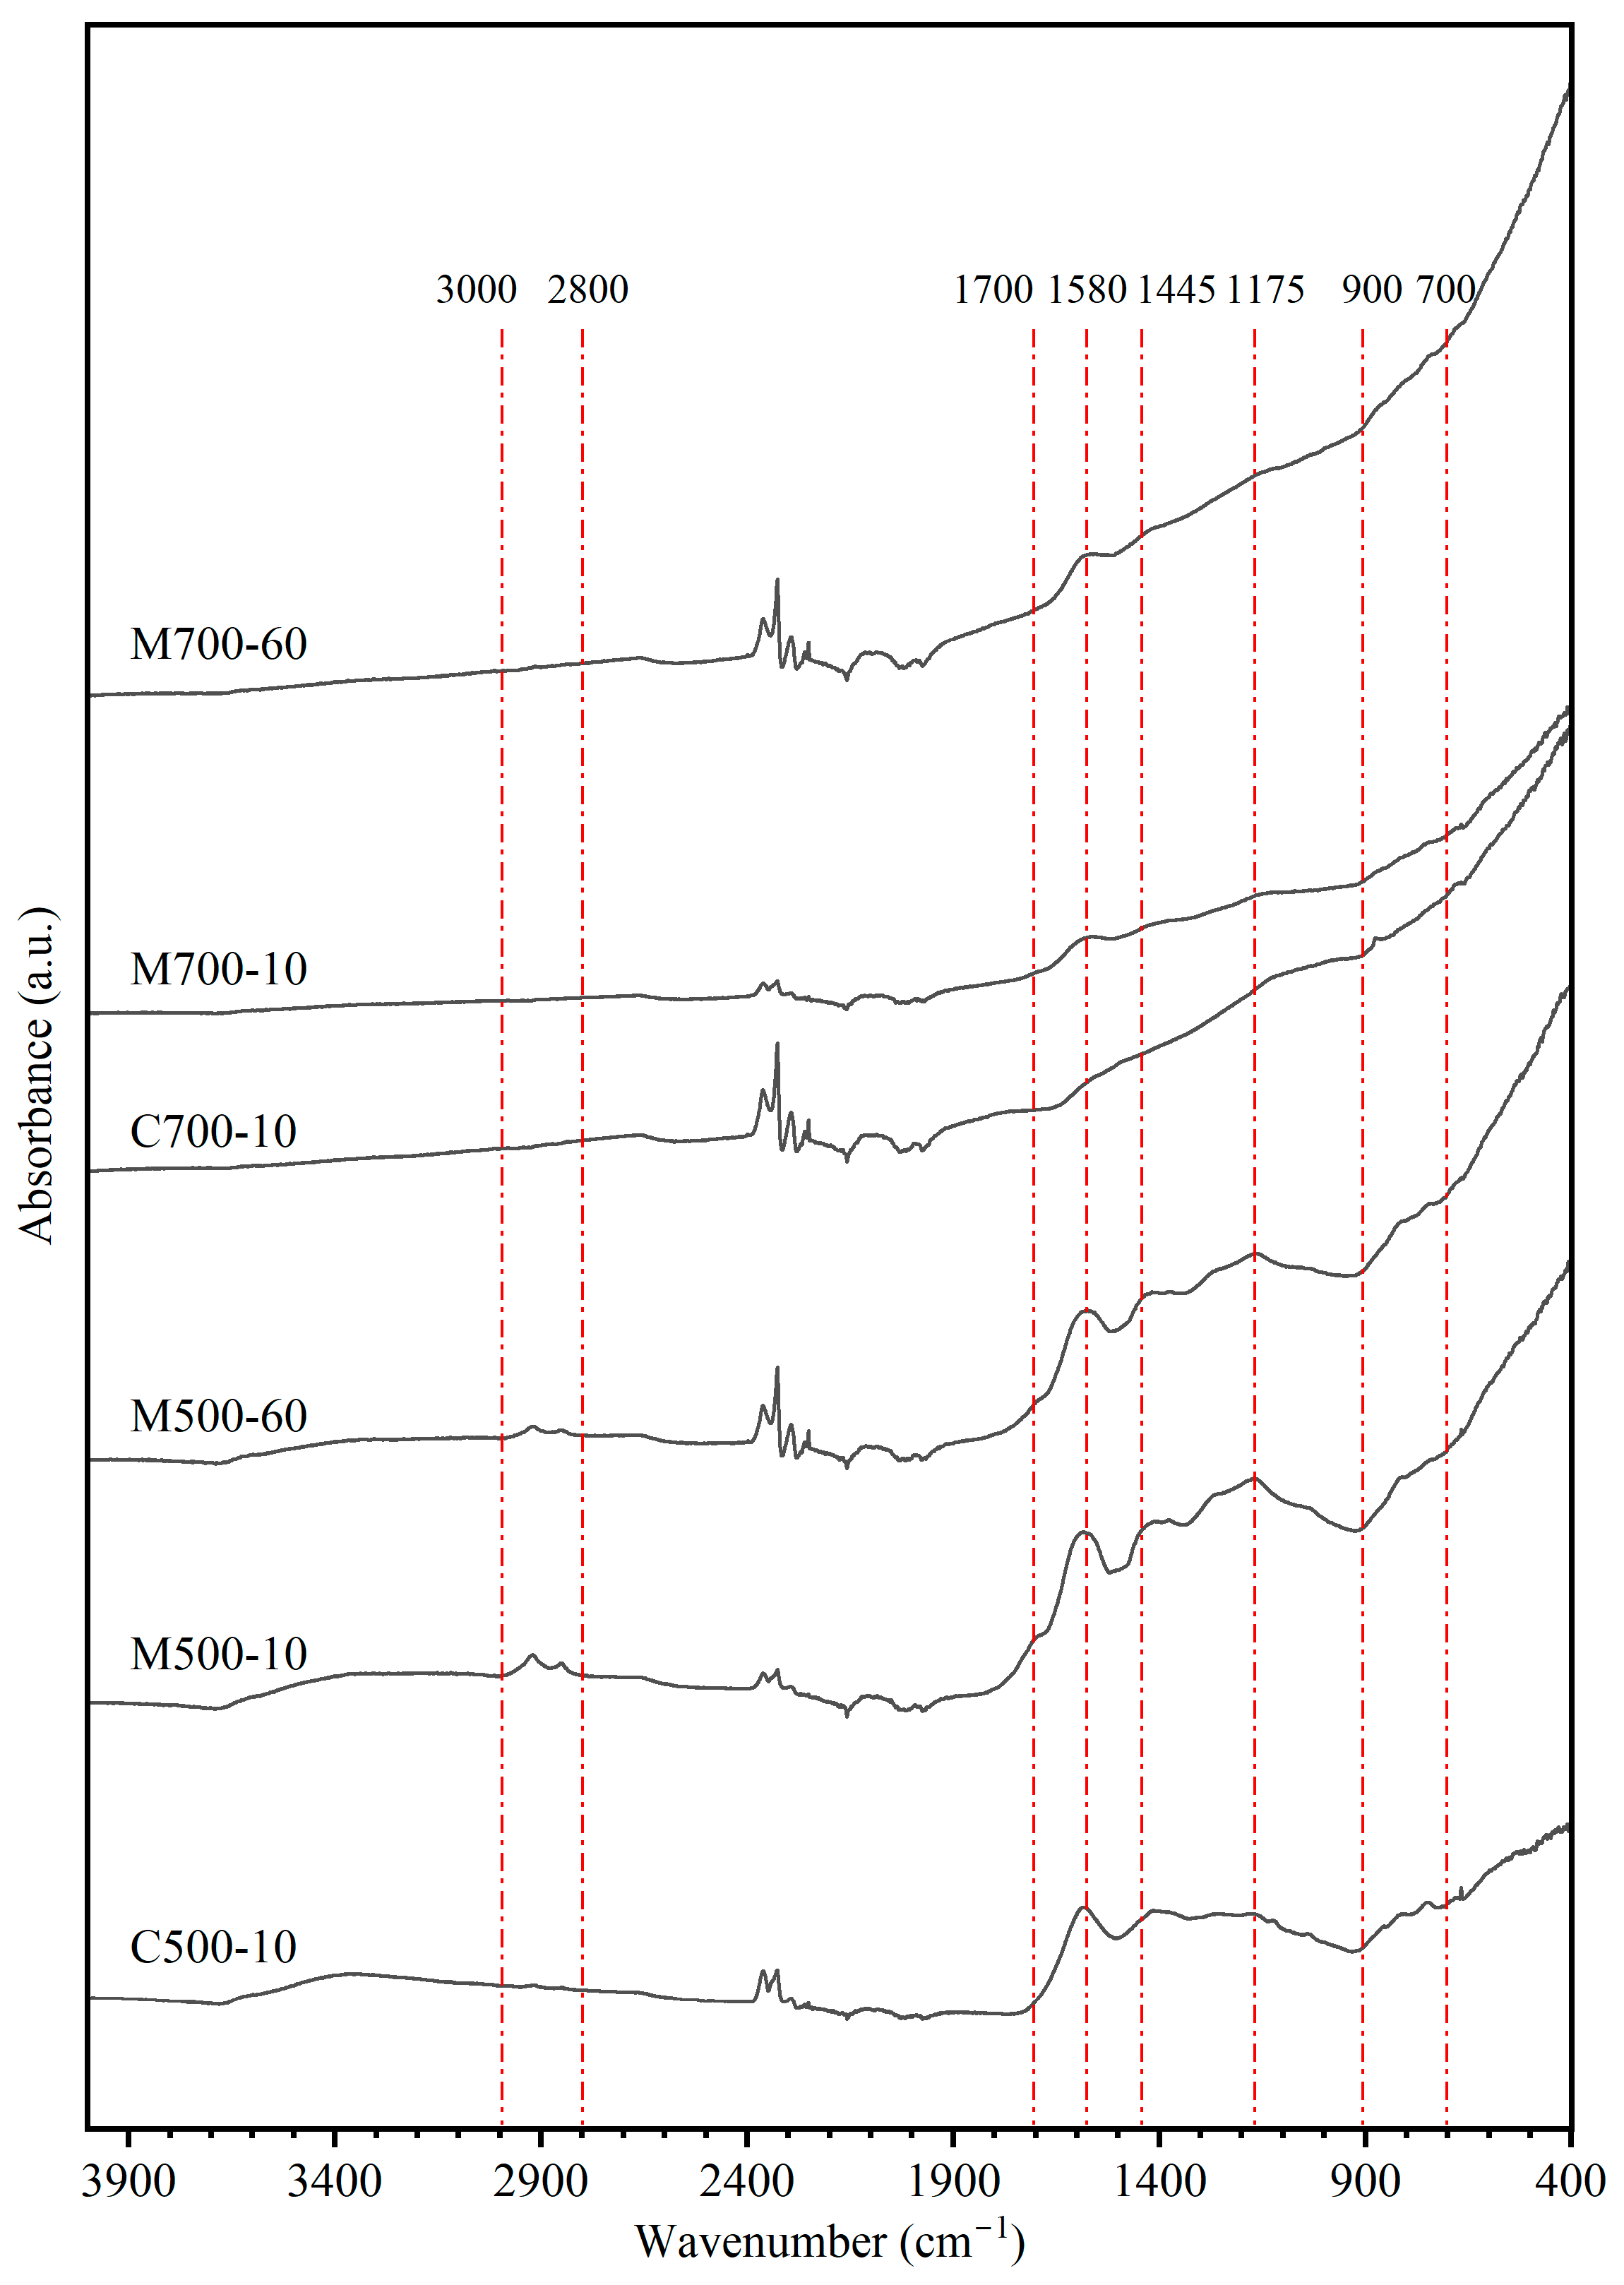
The results of the ATR-FTIR analysis of char samples from conventional and microwave pyrolysis tests, which are shown in
Figure 6 and
Table 4, indicate some systematic differences. Under microwave heating at 500 °C, aliphatic structures between 2800 and 3000 cm
−1 were still present, which may have led to lower CH
4 yields (detailed in
Section 3.4) compared with conventional heating. Furthermore, the higher intensity of the bending vibration of the -O-CH
3 structure under microwave heating also indicated the lower CH
4 yield in the evolved gas. These results show that due to lower volatile matter yield (
Figure 2), more organic functional groups were retained in the char under microwave heating. The peaks at 1700 cm
−1 and 1580 cm
−1, corresponding to the stretching vibrations of C=O and C=C, along with the peaks between 900 and 700 cm
−1, can be used to estimate the aromatic nature of char. The detection of C-O-C structures at 1175 cm
−1 suggests the persistence of oxygen cross-linking at 500 °C.
At 700 °C, the IR spectra of conventional and microwave chars showed a close resemblance, except for the C=C structure. The higher peak intensity at 1580 cm
−1 for microwave char represents fewer fused aromatic structures. Liu et al. [
15] also observed that microwave-heated chars were less aromatic. It is postulated that the directional movement of polar functional groups under a microwave field prohibits the ether bond breakage and aromatic formation at temperatures below 700 °C [
15].
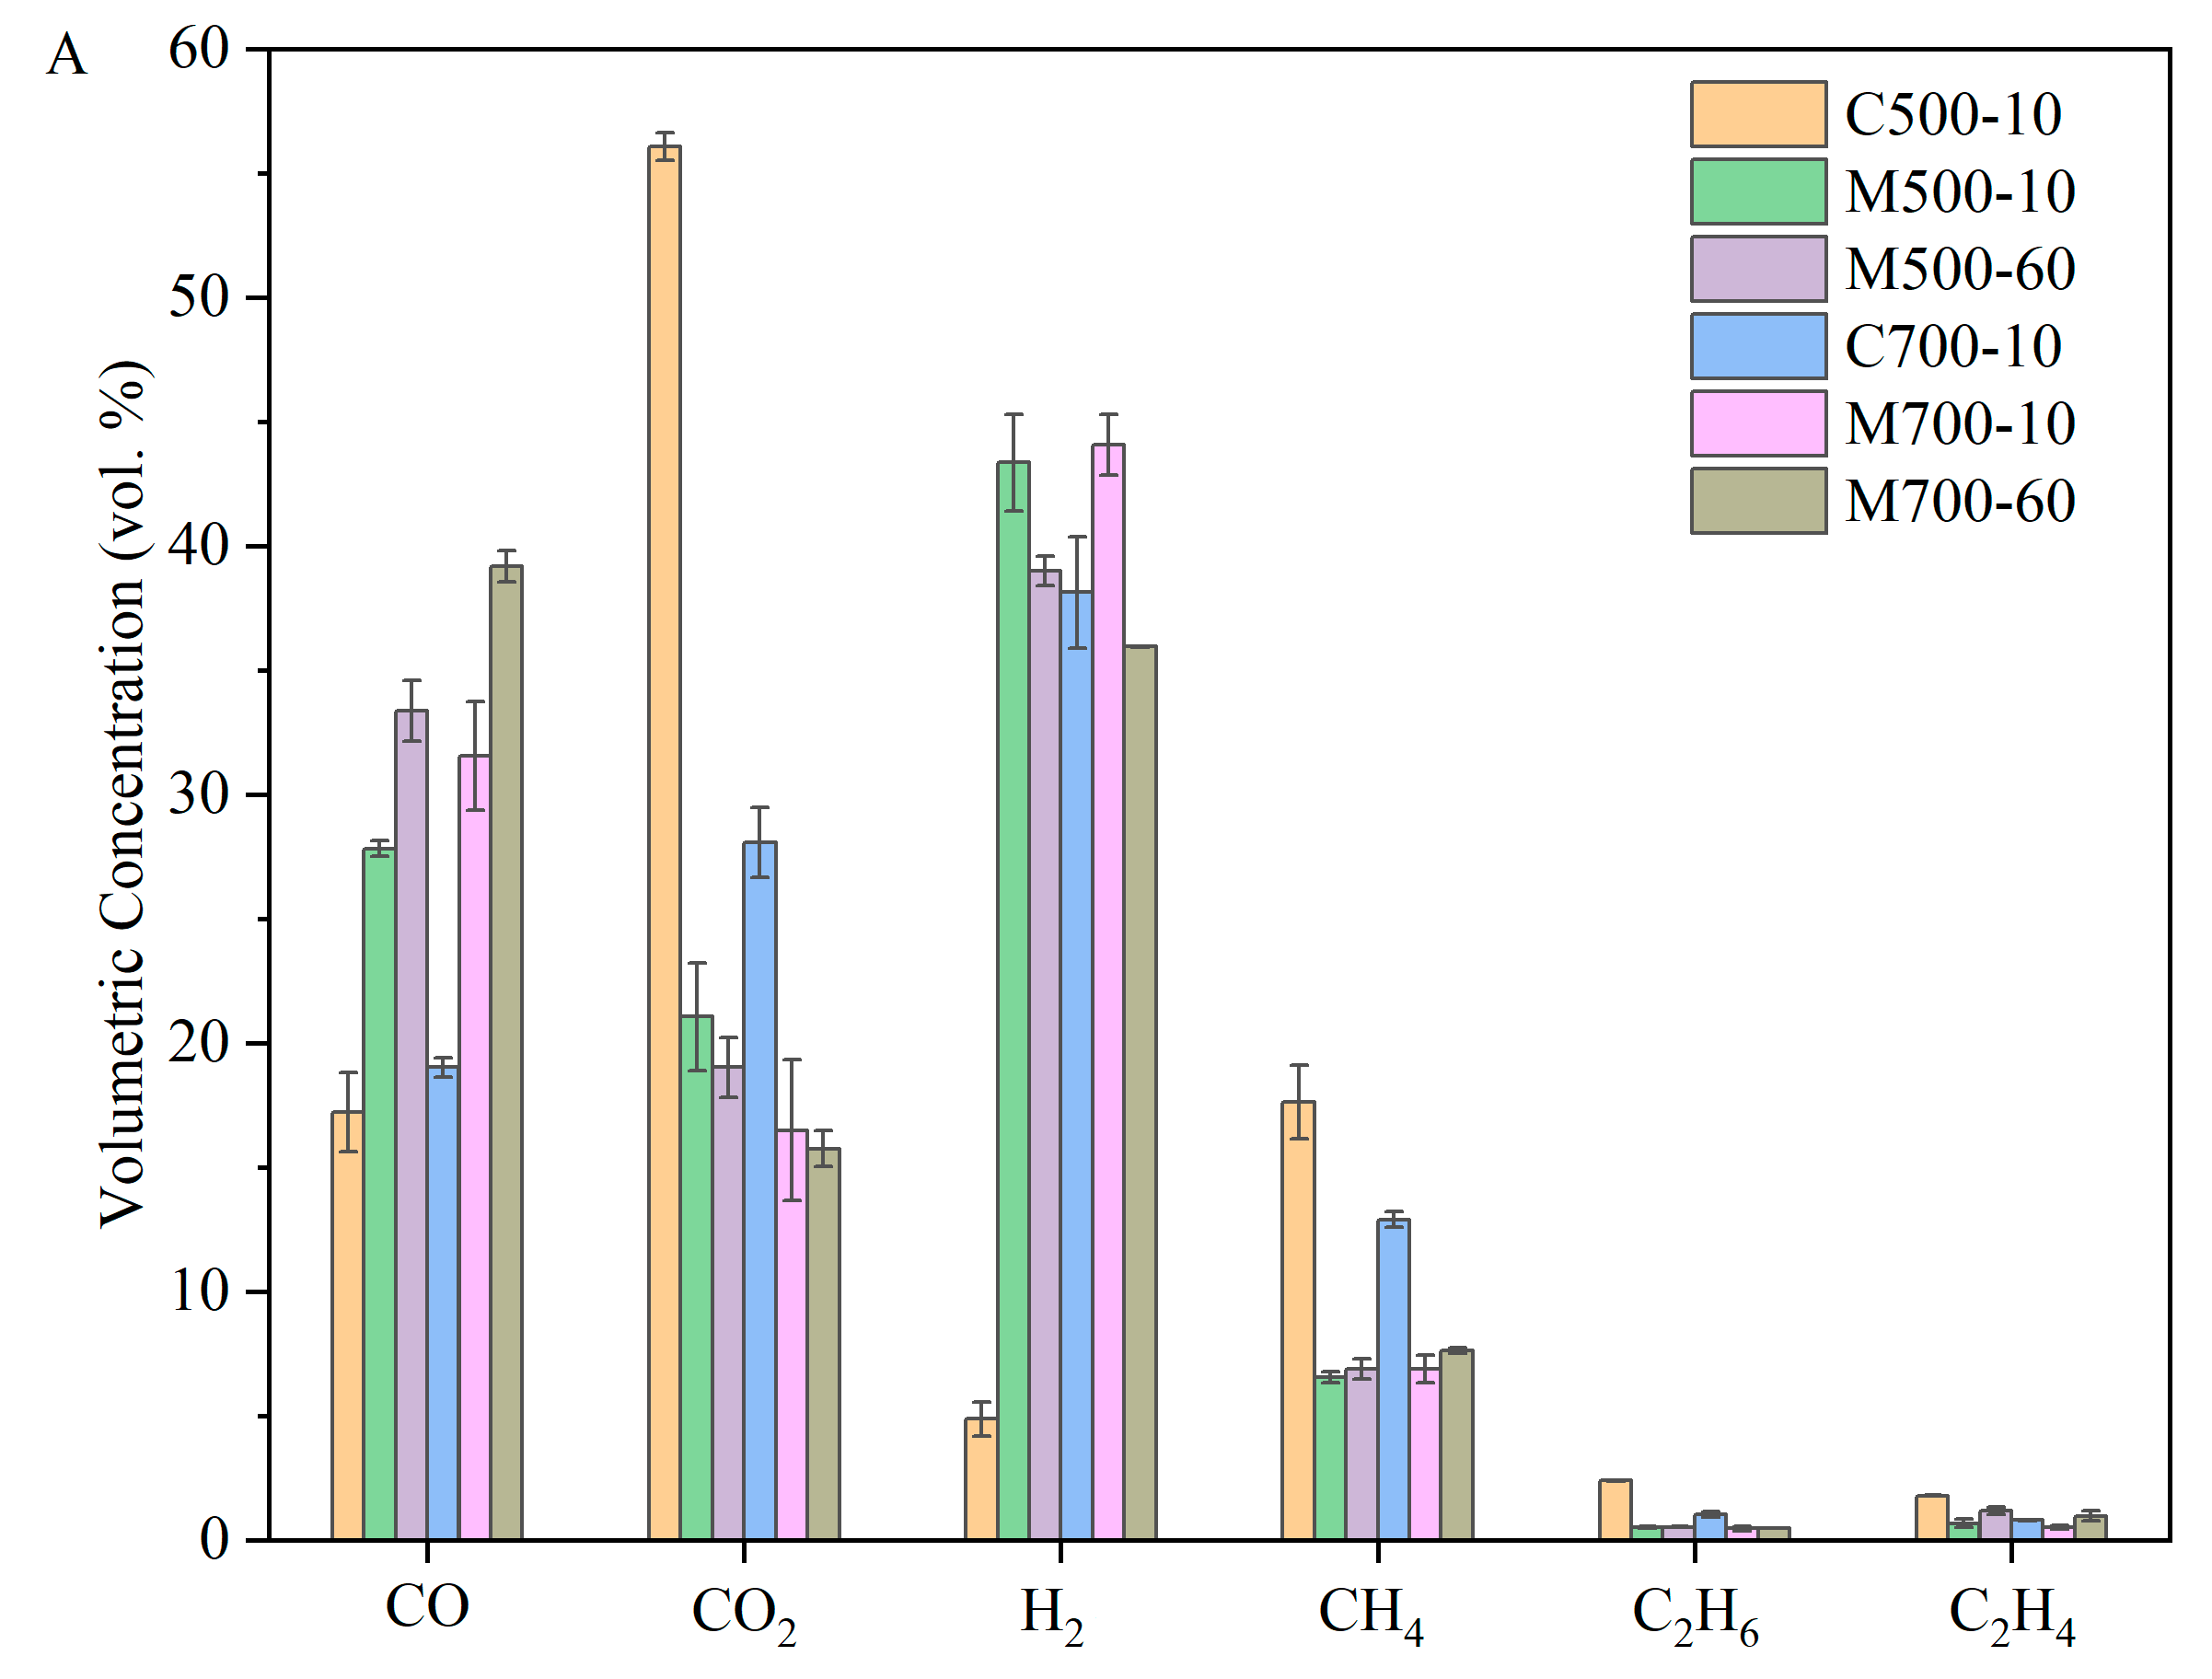
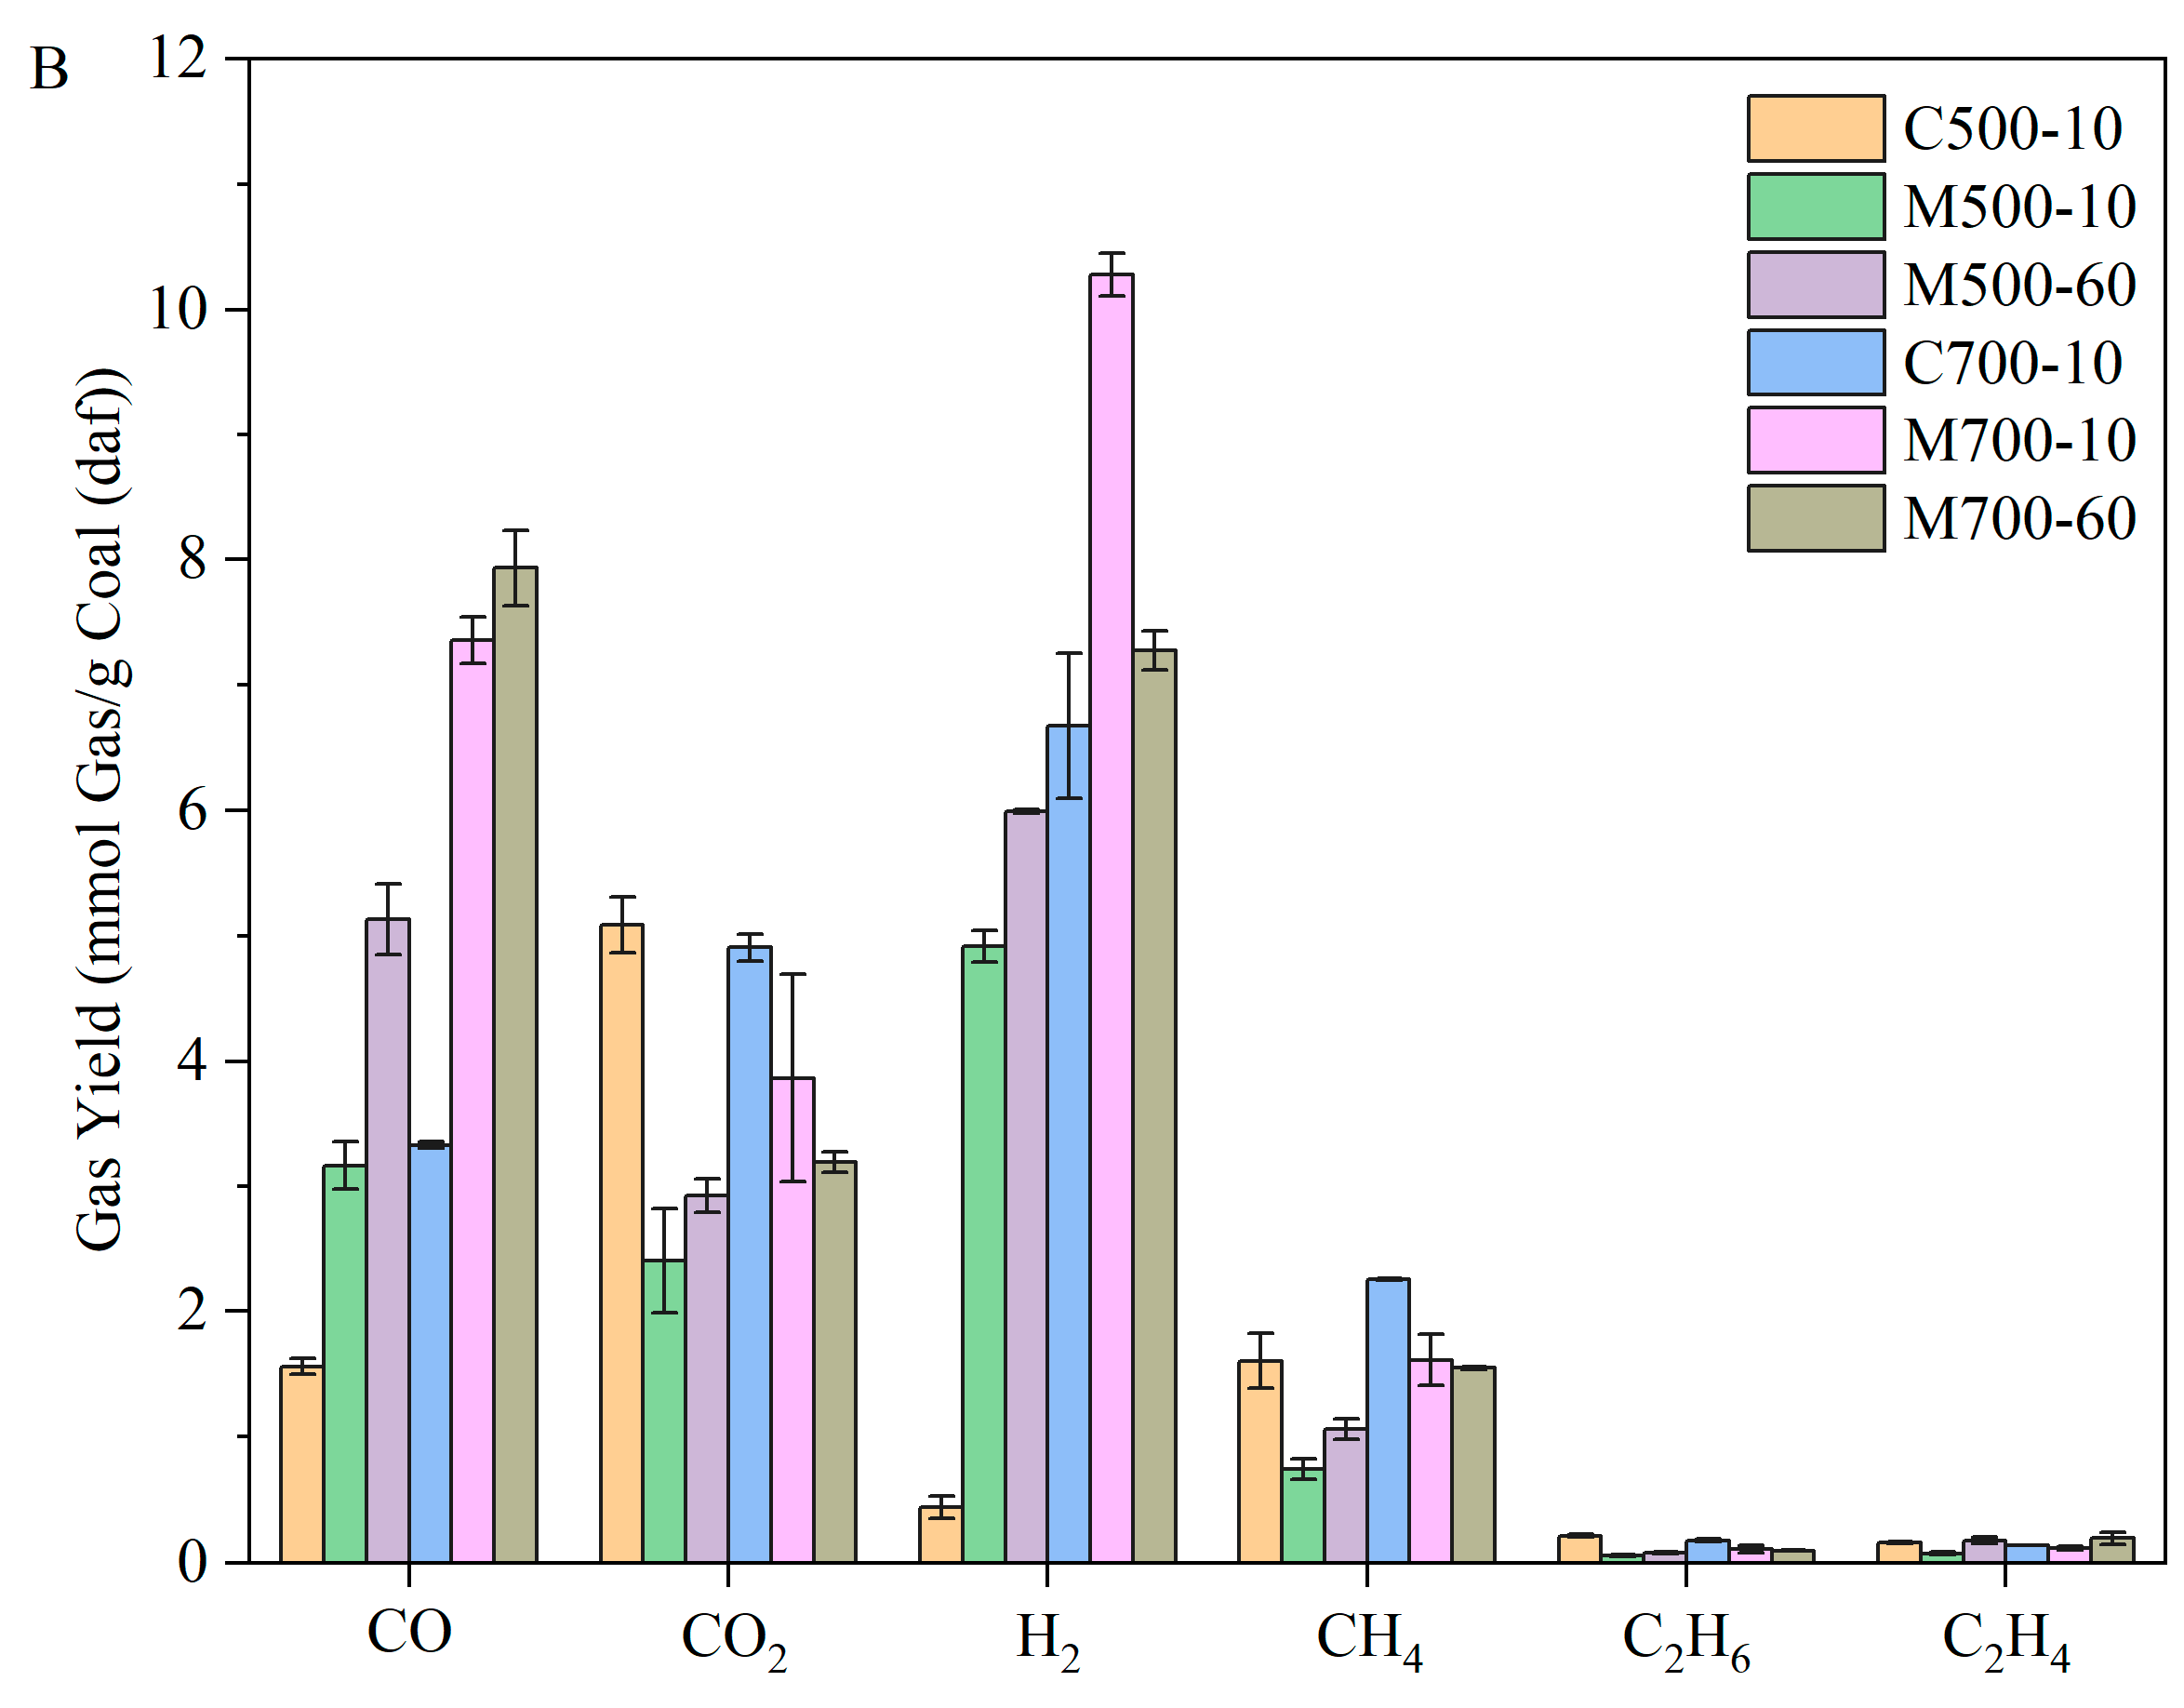
3.4. Gas Composition and Yield
Figure 7 shows the composition and the corresponding yields of evolved gases measured using Micro-GC. The key focus of the analysis of pyrolysis gases was the efficiency of coal pyrolysis for H-rich gas production. The gas compositions under the same heating rate and heating methods could be compared to explore the effect of temperature.
Under the conventional heating method, the concentration of H
2 increased from 4.88 vol.% at 500 °C to 38.14 vol.% at 700 °C due to the promotion of cracking, cyclisation, aromatisation, and polycondensation reactions. The higher CO yield in conventional heating at 700 °C in
Figure 7B could be attributed to the intensified cracking reactions of organic fragments [
15], such as ethers and other O-containing heterocycles, as well as the dry reforming reaction at 700 °C. The dilution effect of H
2 and CO masked the changing trend of other gases, which can only be observed in the corresponding gas yields. The evolution of CH
4 was closely related to -CH
x and -O-CH
3 functional groups [
34]. Hence, the increase in CH
4 yield reflected the shedding of aliphatic structures in char, as discussed in
Section 3.3. The difference in the yields of C
2 hydrocarbons at different temperatures is negligible, as most were released before 500 °C (
Figure 4). However, the previous explanation does not apply to the decrease in CO
2 yield, as the high intensity of the CO
2 signal in
Figure 4 persists beyond 500 °C. The decrease is likely due to the CO
2 gasification of carbon-containing fragments and methane, which could consume CO
2 and produce CO at high temperatures [
19,
30,
35]. This also helped to clarify the significant increase in CO yield.
Under microwave heating, the differences in gas concentrations were less pronounced with temperature. This was because the evolved volatiles, influenced by local hot spots and selective heating of polar functional groups, underwent intense secondary cracking reactions, leading to the formation of lighter products, which corresponded to a lower tar yield. When considering the gas yield per gram of parent coal (based on dry ash-free), the differences become significant.
Figure 7 shows that the volumetric concentrations and yields of all gases, except for CO
2, increased due to the higher volatile matter yield at higher temperatures, with this effect being particularly notable for H
2. The different trend of CO
2 with temperature in
Figure 7A,B was likely due to a smaller increase than other gases and dry reforming reactions. As can be seen in
Figure 4, most CO
2 evolved before 500 °C. The yield of CO at 700 °C was more than 2.5 times greater than at 500 °C, while for CO
2, the increase was only around 50%. This suggested that under microwave heating, high temperatures favour the formation of CO rather than CO
2 as the product gas from the decomposition of O-containing structures and molecules.
The pyrolysis gas composition under different heating methods can be evaluated by comparing C500-10, M500-10, C700-10, and M700-10 in
Figure 7. The volumetric concentrations and yield trends of six sorts of gas with heating methods remained consistent at 500 and 700 °C, namely, the changing trend of gas composition was not masked by the boosting of some gas. At 500 °C, the intense cracking reactions under microwave heating, evidenced by the high CO and H
2 yield, compensated for the lower gas yield and produced high-quality syngas. It is noteworthy that the yield of CO
2 decreased dramatically under microwave heating, accompanied by higher H
2 and CO yields. This phenomenon could be attributed to two main factors: (1) self-gasification [
36] and (2) the selective decomposition and different behaviour of O-containing intermediates and compounds under microwave heating [
20]. Among the factors, self-gasification was mentioned by Menéndez et al. [
32], who argued that microwave-induced self-gasification could occur at a much lower temperature (even at 500 °C) than with conventional heating. The self-gasification (i.e., the Boudouard reaction, CO
2 (g) + C (s) ⇌ 2 CO (g)) greatly suppressed CO
2 formation and boosted CO yield under microwave heating. The unevenly distributed electron clouds of the polar organic structures were selectively removed from the coal matrix under microwave heating due to their intense vibration in the electromagnetic field [
10]. This phenomenon was also called selective decomposition, during which a high content of H- and O-rich radicals was formed and went through secondary reactions. In conclusion, the intense selective decomposition of polar structures and self-gasification promote H
2 and CO formation under microwave heating. Consistently, the lower concentration of CH
4 under M500-10 was likely a result of dry reforming reactions.
At 700 °C, the gaps in gas volumetric concentration and yield between conventional and microwave heating are less pronounced than those at 500 °C. This could be attributed to the growing thermal effect of temperature on the behaviour of coal pyrolysis. However, the hydrogen gas concentration and yield peaked under microwave heating at 700 °C and a heating rate of 10 °C/min, reaching 44.07 vol.% and 10.28 mmol gas/g coal (daf), respectively. At the same time, a high volumetric concentration of CO (31.56 vol.%) made the pyrolysis gas rich in syngas (75.03 vol.%) and enhanced its value.
The effect of the heating rate on coal pyrolysis was investigated under microwave heating. At 500 °C, the yields of all sorts of gases presented increments when the heating rate increased, which could be directly relevant to the higher volatile matter yield. The higher content of volatile matter under M500-60, as reactants for the next cracking reactions, would form light gases, especially CO. Furthermore, the substantial increase in the volumetric concentration of CO demonstrated the microwaves’ selectivity for O-containing structures, leading to more oxygen being released into the gas phase. In addition, the relatively lower increment in H
2 yields was attributed to the shorter residence time for secondary cracking reactions and dissociation of organic fragments, resulting in fewer formations of H radicals. In general, H radicals are formed through the cleavage of H-containing functional groups and covalent bonds during coal pyrolysis, as they can act as heavy radical stabilisers and reduce the molecular weight of tar compounds [
9,
37]. The combination of H radicals is also one of the mechanisms of H
2 gas formation [
30].
At 700 °C, the impact of volatile matter yield on coal pyrolysis gas is negligible due to close volatile matter yields. Thus, the influence of the heating rate on gas composition could be determined. A similar conclusion was drawn in this case, i.e., higher heating rates promoted the formation of CO, while the yield of H
2 decreased. This change can be attributed to a higher ratio of oxygen being released from the coal sample (discussed in
Section 3.6) and a shorter residence time for secondary reactions.
3.5. Tar Analysis
The changes in the tar composition at 500 °C and 700 °C are shown in
Figure 8. Under conventional heating, the detection of acids at 500 °C could be strong evidence for the relatively gentle decomposition process compared with that at 700 °C. Furthermore, the lower concentration of polyaromatic compounds supports the conclusion above, namely, the decomposition of coal structures at 500 °C was not fierce enough to break condensed aromatic structures into fragments. This is consistent with observations by Dong et al. [
38], who found that the total amount of polyaromatic compounds increased with temperature and peaked at 800 °C due to the two competitive reactions occurring during coal pyrolysis: the formation and decomposition of polyaromatic compounds, which resulted from the cracking of the coal matrix and polycondensation reactions, and the cracking of polyaromatic compounds at high temperatures, respectively. The decreased number of phenols and other O-containing compounds with temperature, such as ketones and ethers, indicated the formation of CO rather than CO
2, as shown in
Figure 7. Similar levels of aliphatic concentration at 500 and 700 °C resulted from two opposing processes. The formation of aliphatics resulted from C-C bond breakage in the coal matrix, and the consumption resulted from it being cracked into lighter fragments and further disassociated into H and CH
X radicals.
The variations in the main components under microwaves are shown in
Figure 8B. In coal, short alkyl bridges or ether linkages connect the aromatic and hydroaromatic units [
38]. When heated, weak C-C bonds in coal begin to break, producing fragments containing benzene rings. In this case, the selective heating of polar units (e.g., ethers and phenols) under microwave heating intensified the decomposition of the coal matrix and tar, promoting the transformation of oxygen into the gas phase (detailed in
Section 3.6). Compared with conventional heating, changes to those in the main components in the tar under microwave heating could be expected as the effect of temperature on coal pyrolysis became significant at high temperatures; there was an increase in polyaromatic compounds and the deoxygenation of tar molecules. Additionally, comparable concentrations of aliphatics at 500 and 700 °C were observed, which indicated that the impact of microwaves on coal pyrolysis was pronounced at low temperatures.
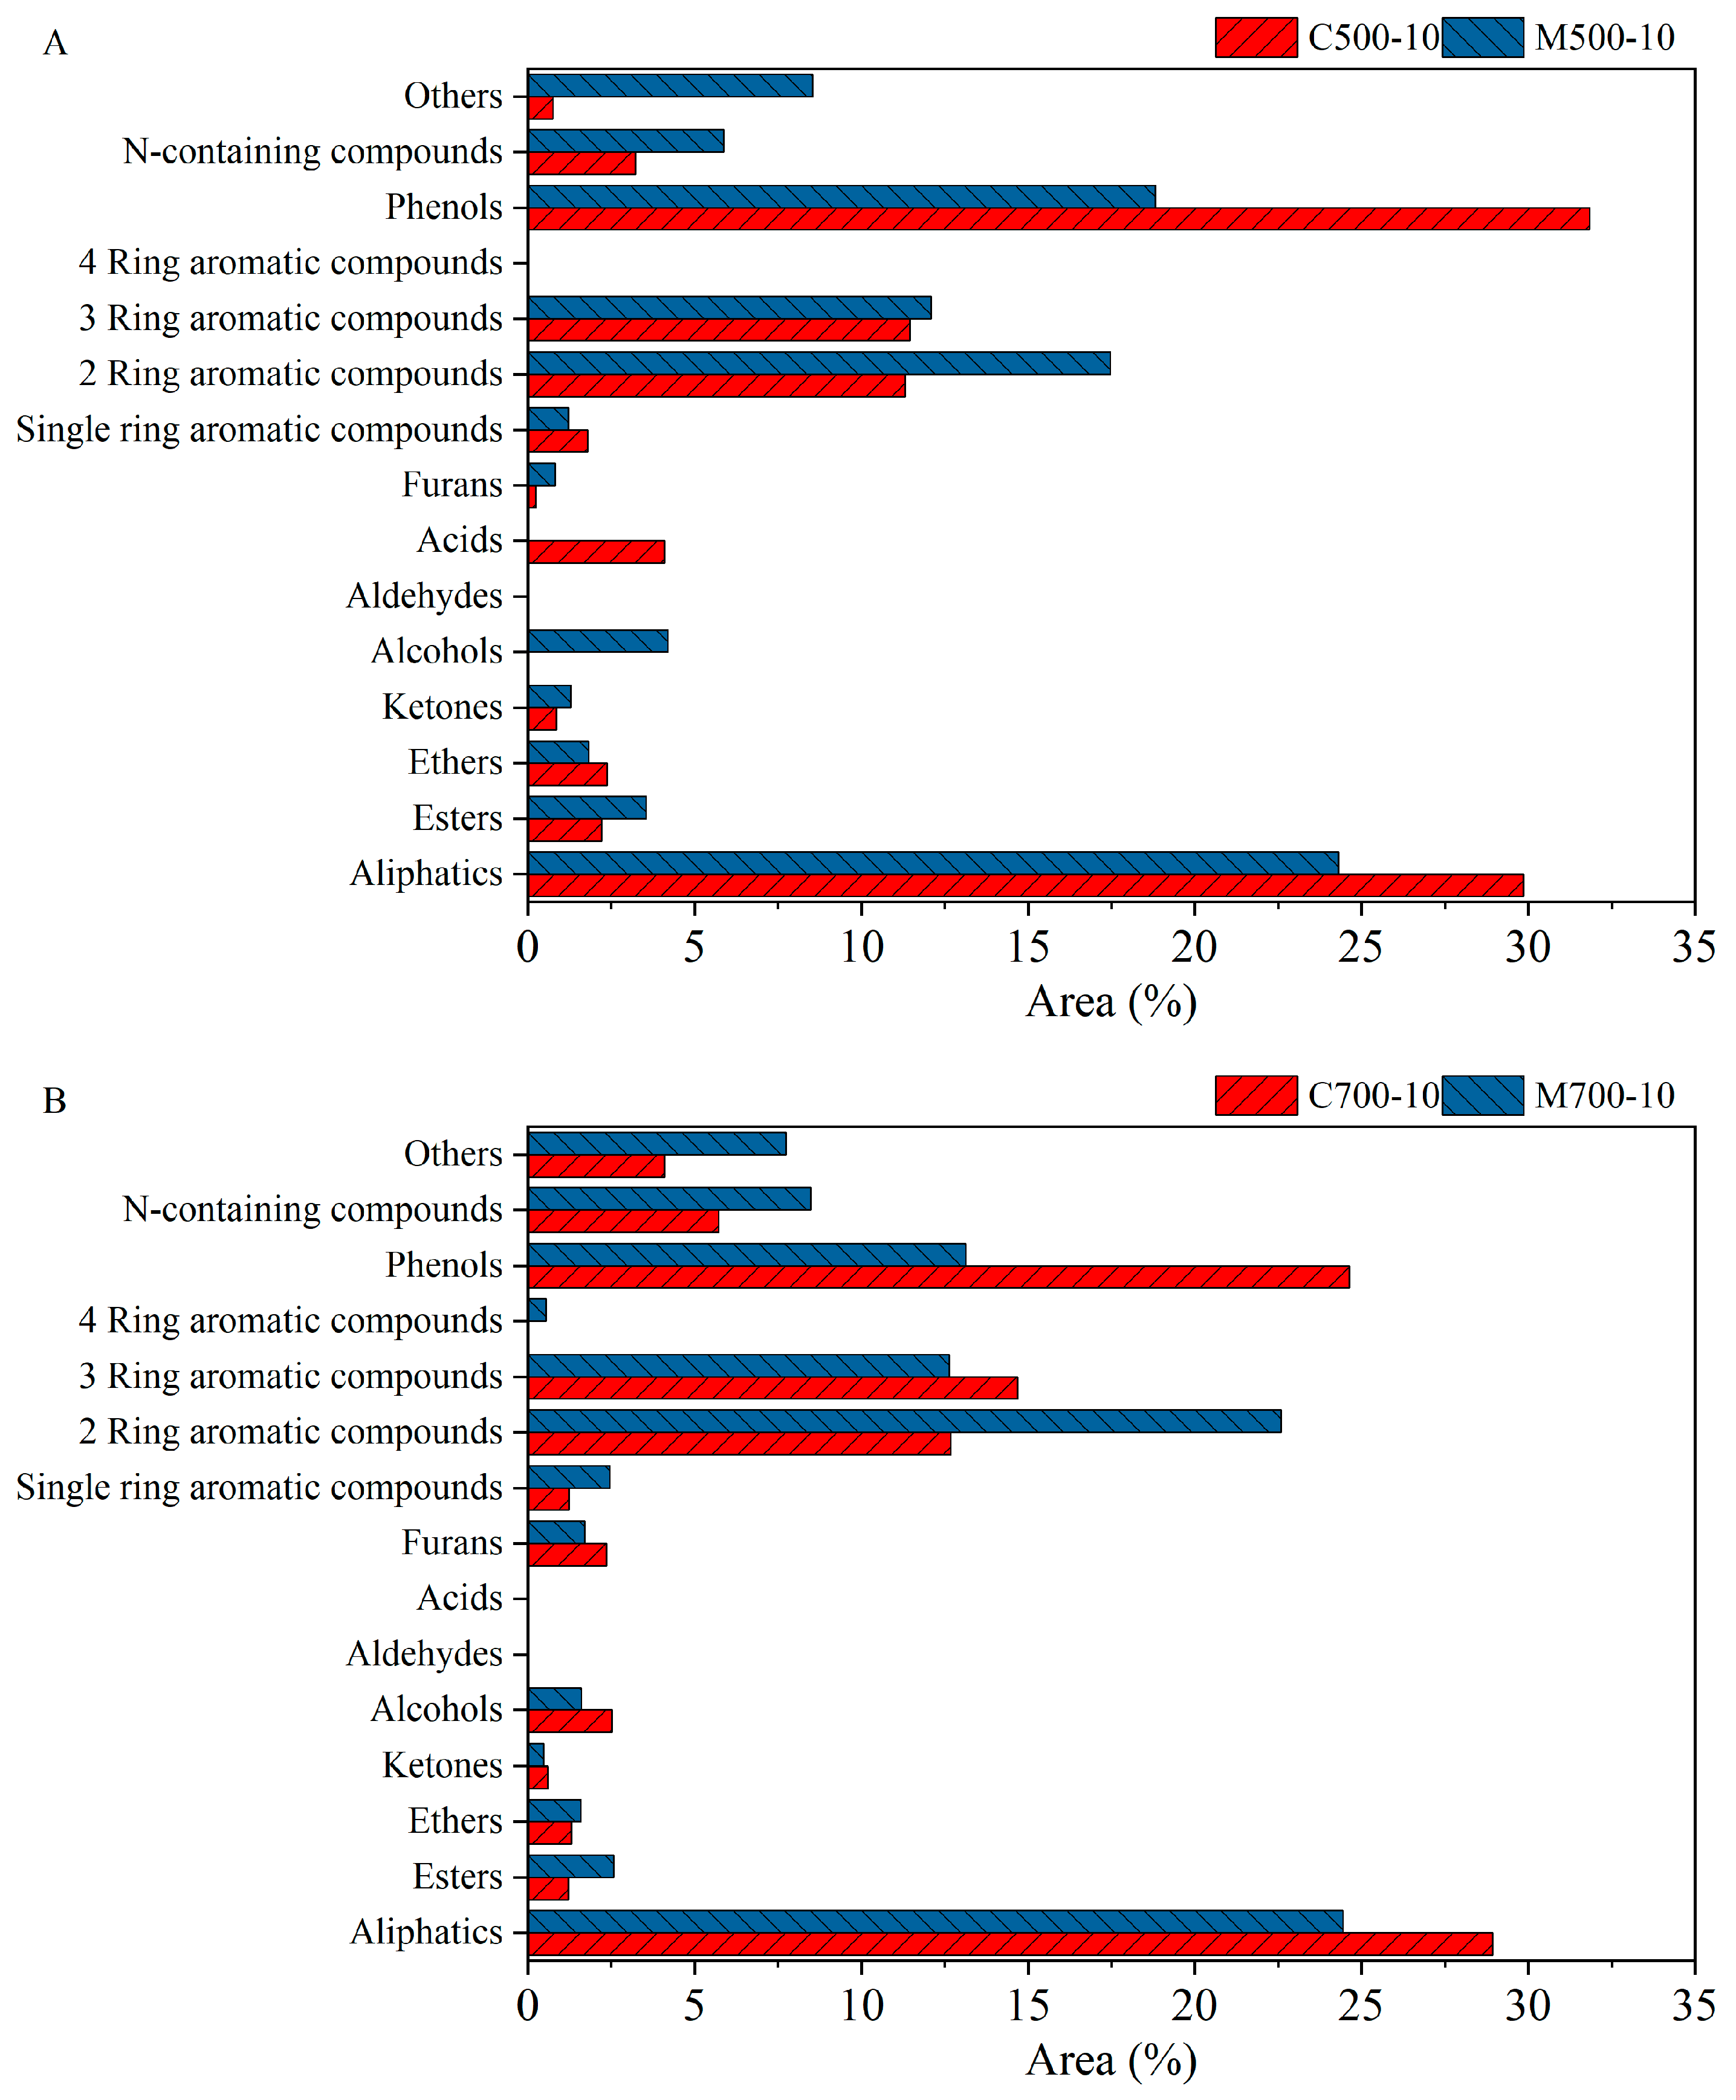
Figure 9 compares the composition of tar samples under conventional and microwave heating methods. The lower concentration of phenols under microwave heating in
Figure 9A was ascribed to the high removal efficiency of microwave to polar functional groups, which corresponded well to the lower oxygen concentration in the tar (detailed in
Section 3.6) and a higher CO concentration in the gas phase. The absence of acids also supports the above-mentioned argument. The removal of aromatic structure from the coal matrix was also intensified under microwaves, giving rise to more aromatic compounds in the tar. The lower concentration of aliphatics was not only due to the intense decomposition and dissociation of aliphatic structures but also, in part, to the lower volatile yield in microwave pyrolysis. When the temperature increased to 700 °C, the distribution and variation tendencies of the main components under different heating methods were consistent with those at 500 °C. In particular, the concentration of phenols decreased, and those of aromatic and aliphatic compounds increased, indicating the intense release of oxygen- and hydrogen-containing radicals, as reflected by the high concentration of CO and H
2 in the gas phase [
18]. The four-ring aromatic compounds were only detected under microwave heating because of the polycondensation of aromatic compounds at higher local temperatures [
38,
39]. Differing from the reason for the lower concentration of aliphatics under microwave heating and at 500 °C, the slightly lower volatile matter yield under microwave heating and at 700 °C confirmed the assumption that intense decomposition and disassociation of aliphatics under microwave heating give rise to H and CH
x radicals, which then form hydrogen and methane gas.
The impact of the heating rate on tar compositions under microwave heating is demonstrated in
Figure 10. At 500 °C, the difference in the concentration of phenols was negligible. However, the higher tar yield at 60 °C/min enlarged the difference in the chemical characteristics of tars. The appearance of aldehydes under M500-60 confirmed that the tar was preserved well and closer to the “nascent” tar that directly evolved from the decomposition of the coal matrix. This also explains the greater proportion of aliphatics in the tar. Moreover, the presence of four-ring aromatic compounds and higher concentration of polyaromatic compounds in the tar generated at a higher heating rate suggests the heavy nature of the “nascent” tar, as also reported by Okumura [
40], who argued that aromatic components are released from the coal before the cleavage and cross-linking reactions proceed sufficiently in the coal.
At 700 °C, the significantly higher concentration of phenols in tar formed at 60 °C/min was closely related to the intense release of O-containing radicals from the coal matrix and limited secondary cracking reactions due to the shorter residence time of the radicals. In other words, weakened secondary reactions cause more oxygen to be transferred to tar. The comparable concentration of four-ring aromatic compounds at different heating rates was due to the polycondensation reactions at high temperatures. The lower concentration of single-ring and two-ring aromatic compounds in 60 °C/min tar suggests the cracking of large aromatic radicals in a longer residence time at 10 °C/min, which is the same as what is shown in
Figure 9B when conventional heating is used for comparison. The cracking temperature (700 °C) of polyaromatic compounds under microwave heating is lower than that under conventional heating (800 °C [
38]) due to the presence of hot local spots. Consistently, aldehydes were also present in the tar at 60 °C/min, as the shorter residence time prevented complete secondary cracking reactions of volatile molecules, resulting in a lower H
2 concentration in the gas phase. The slightly lower concentration of aliphatics may be attributed to the dilution effect caused by the significantly higher concentration of phenols in the tar.
3.6. The Distribution of Elements Among Pyrolysis Products
Figure 11 shows the distributions of carbon, hydrogen, and oxygen among pyrolysis products calculated based on their yields and composition. Comparing C500-10 and C700-10, although the increase in volatile yields from 500 °C to 700 °C was nearly 8%, the carbon content in the char showed less variation. This contrasts with the significant decreases in oxygen and hydrogen contents in the char with temperature under conventional heating. Moreover, released oxygen and hydrogen were more easily transferred into the gas phase rather than the liquid phase at 700 °C. This, to some extent, suggests the argument that in comparison with polymerisation and condensation reactions, cracking reactions that release hydrogen- and oxygen-rich light gas are favoured at higher temperatures [
27]. Compared with 500 °C, the close elemental proportions of carbon but lower hydrogen content and higher oxygen content in the 700 °C tar suggested the tar’s heavier nature. This also corresponds to the increase in polyaromatic compounds, phenols, and other O-containing compounds in the tar with temperature, as shown in
Figure 8A.
With a substantial increase in volatile release from 500 to 700 °C, the elemental composition of tars remained relatively stable, and more elements were released into the gas phase. This finding supports the feasibility of producing light gases through the pyrolysis of brown coal and provides a strong foundation for this study.
A similar trend was observed under microwave heating, where the contents of three elements in the char decreased with temperature. The extent of these changes was greater than that under conventional heating. This could be attributed to the higher volatile yield at 700 °C under microwave heating. The increases in tar and gas can also be attributed to the same reason mentioned above. Namely, cracking reactions dominated the coal pyrolysis process, with lighter tar and gas as products rather than heavy tar and coke from polycondensation reactions. At 700 °C, the three elemental losses in the char tended to convert into gases, with the hydrogen content of the char decreasing the most. This enables the feasibility of producing H-rich gas through coal pyrolysis, as evidenced by the high concentrations of H
2 and CH
4 in
Figure 7.
At 500 °C, when comparing the elemental distribution of samples under different heating methods, evolved hydrogen from the coal matrix was found to be concentrated in the gas phase under microwave heating, while the changes in carbon and oxygen distribution were less apparent because of the incomplete devolatilisation at this low temperature. The higher hydrogen content in the gas phase further demonstrated the advantage of microwave-assisted pyrolysis, especially at low temperatures.
At 700 °C, the microwave heating promoted the transfer of carbon, oxygen, and hydrogen to the gas phase, demonstrating a significant impact of microwaves on reaction pathways and elemental distribution in pyrolysis products. However, the difference between conventional and microwave heating in gas-phase elemental distributions was less pronounced at 700 °C.
In summary, the difference between microwave and conventional heating was more pronounced at lower temperatures due to the impacts of microwaves on the reaction pathways and pyrolysis mechanism, including impacts on complex reactions, such as coal matrix decomposition and subsequent secondary reactions (e.g., reactions between radicals and gasification reaction), resulting from the characteristics of selective heating under microwaves. Such differences decreased at higher temperatures due to the reaction pathways becoming dominated by the combined effects of microwave and thermal energy.
The effect of heating rates on the elemental distribution can be examined by comparing the microwave pyrolysis results at 10 °C/min and 60 °C/min and target temperatures of 500 °C and 700 °C. At 500 °C, a higher heating rate increased the volatile matter yield and transfer of carbon, oxygen, and hydrogen to the gas phase. At 700 °C, the distributions of carbon and hydrogen were similar across different heating rates, indicating that temperature was the main contributing factor. However, there were apparent differences in oxygen distribution, where the impact of selective heating of microwaves on secondary pyrolysis reactions should be considered. At higher heating rates, more volatile molecules with polar functional groups were quickly released from coal particles, which would be less affected by secondary reactions. This limits the secondary cracking reactions, leading to lower H2 gas formation. Conversely, longer residence time at lower heating rates can promote the secondary cracking of volatiles to form lighter gases.
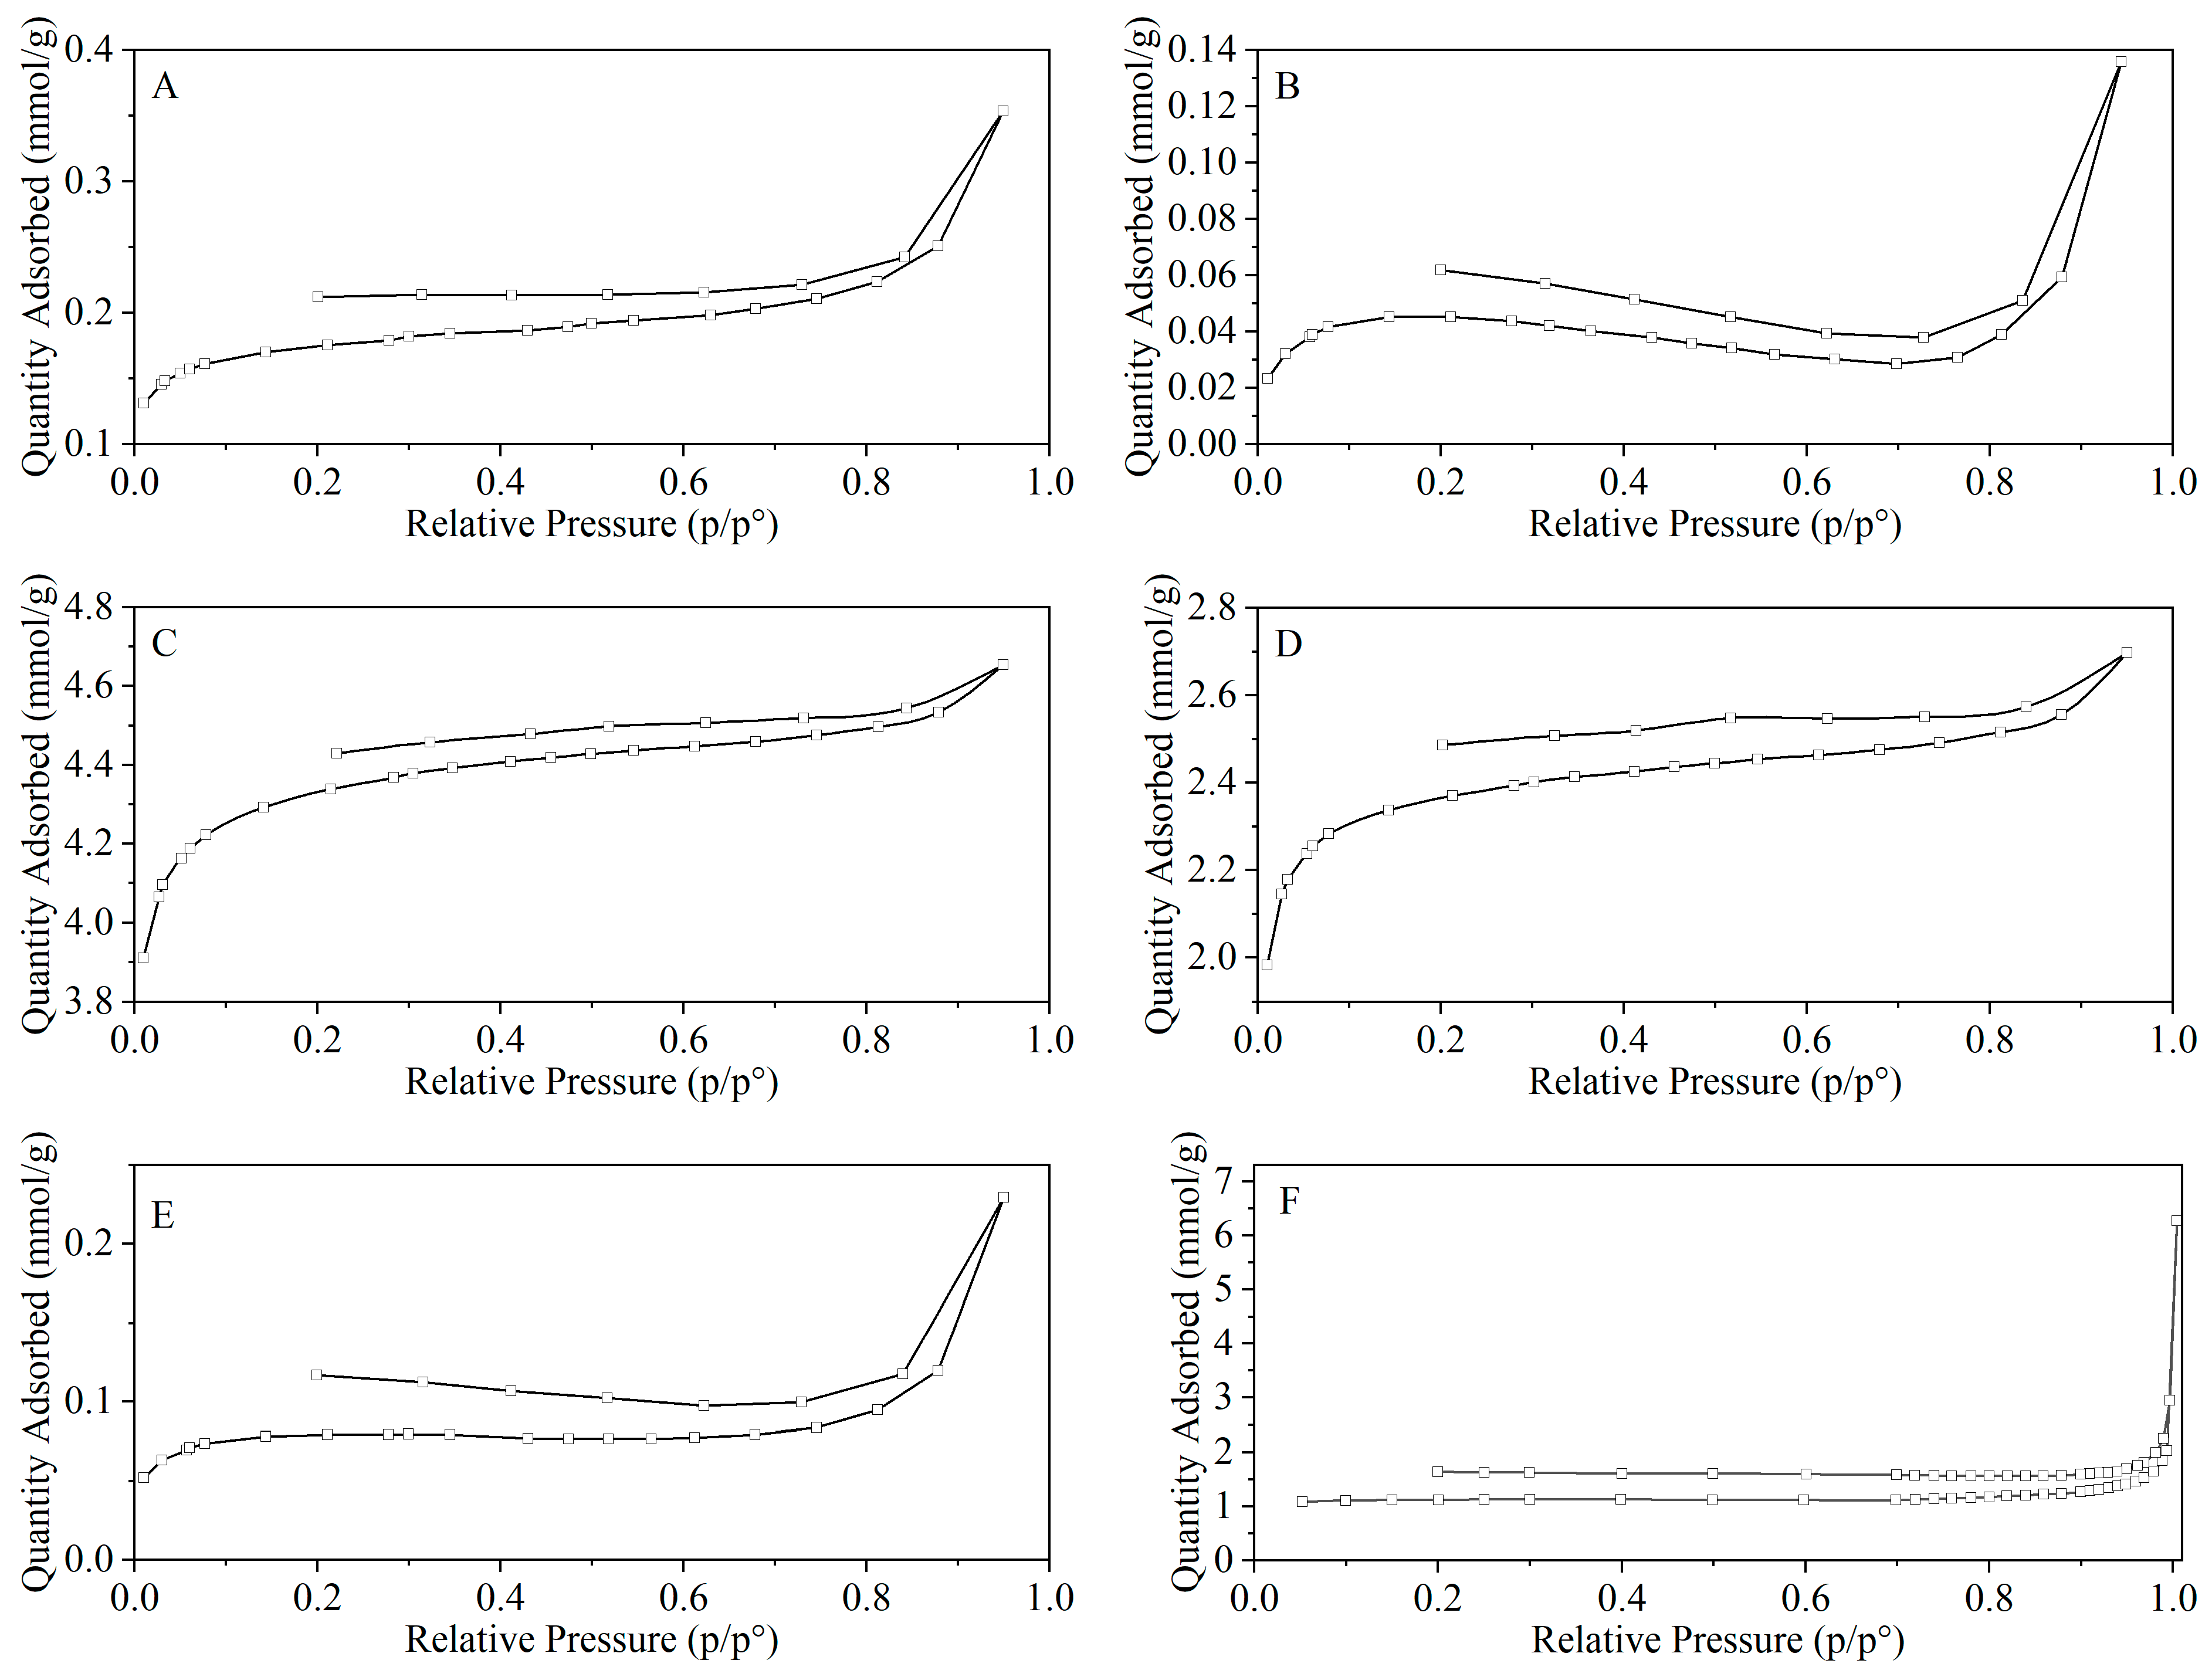
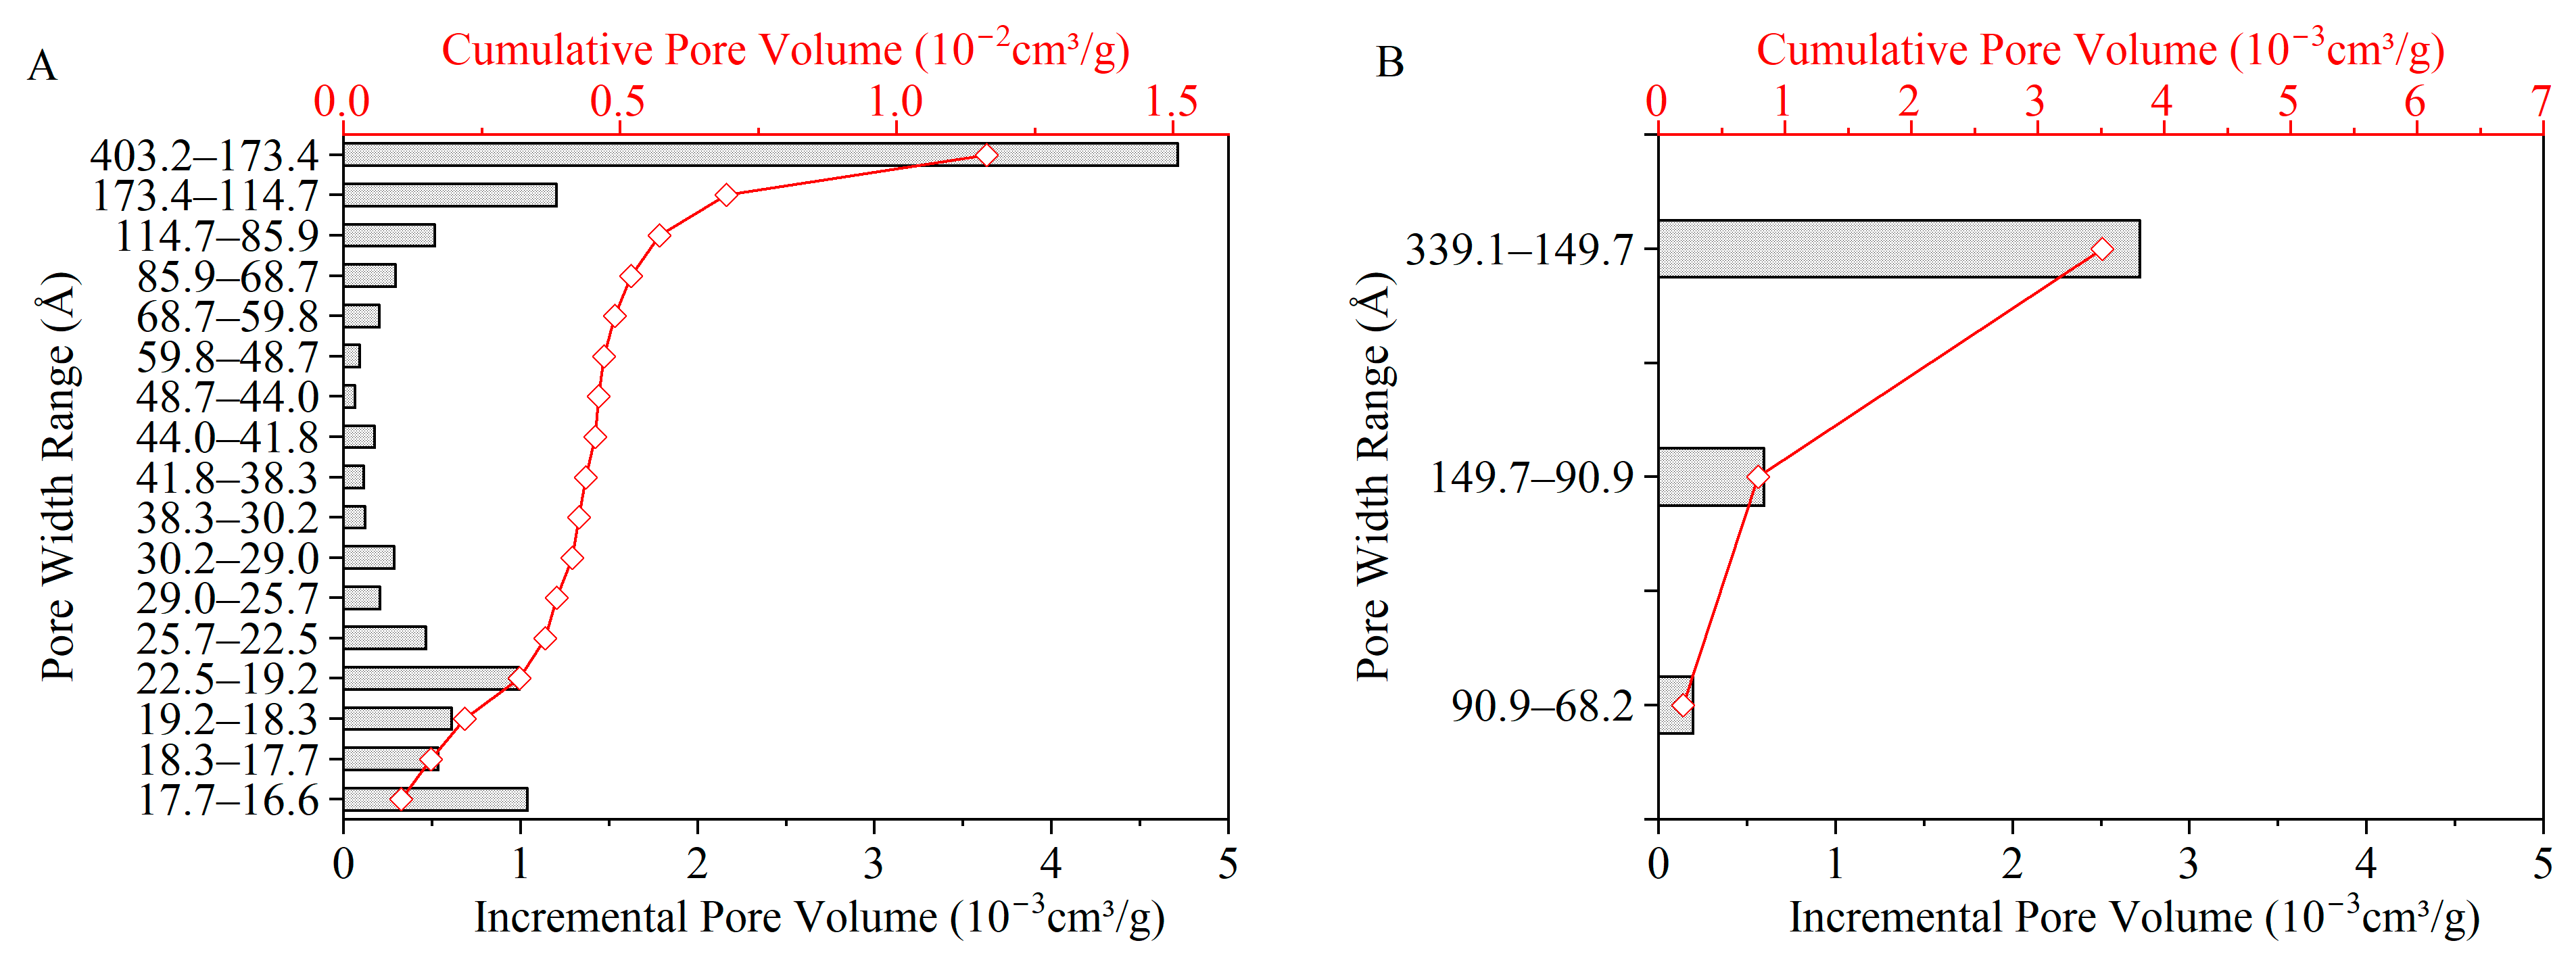
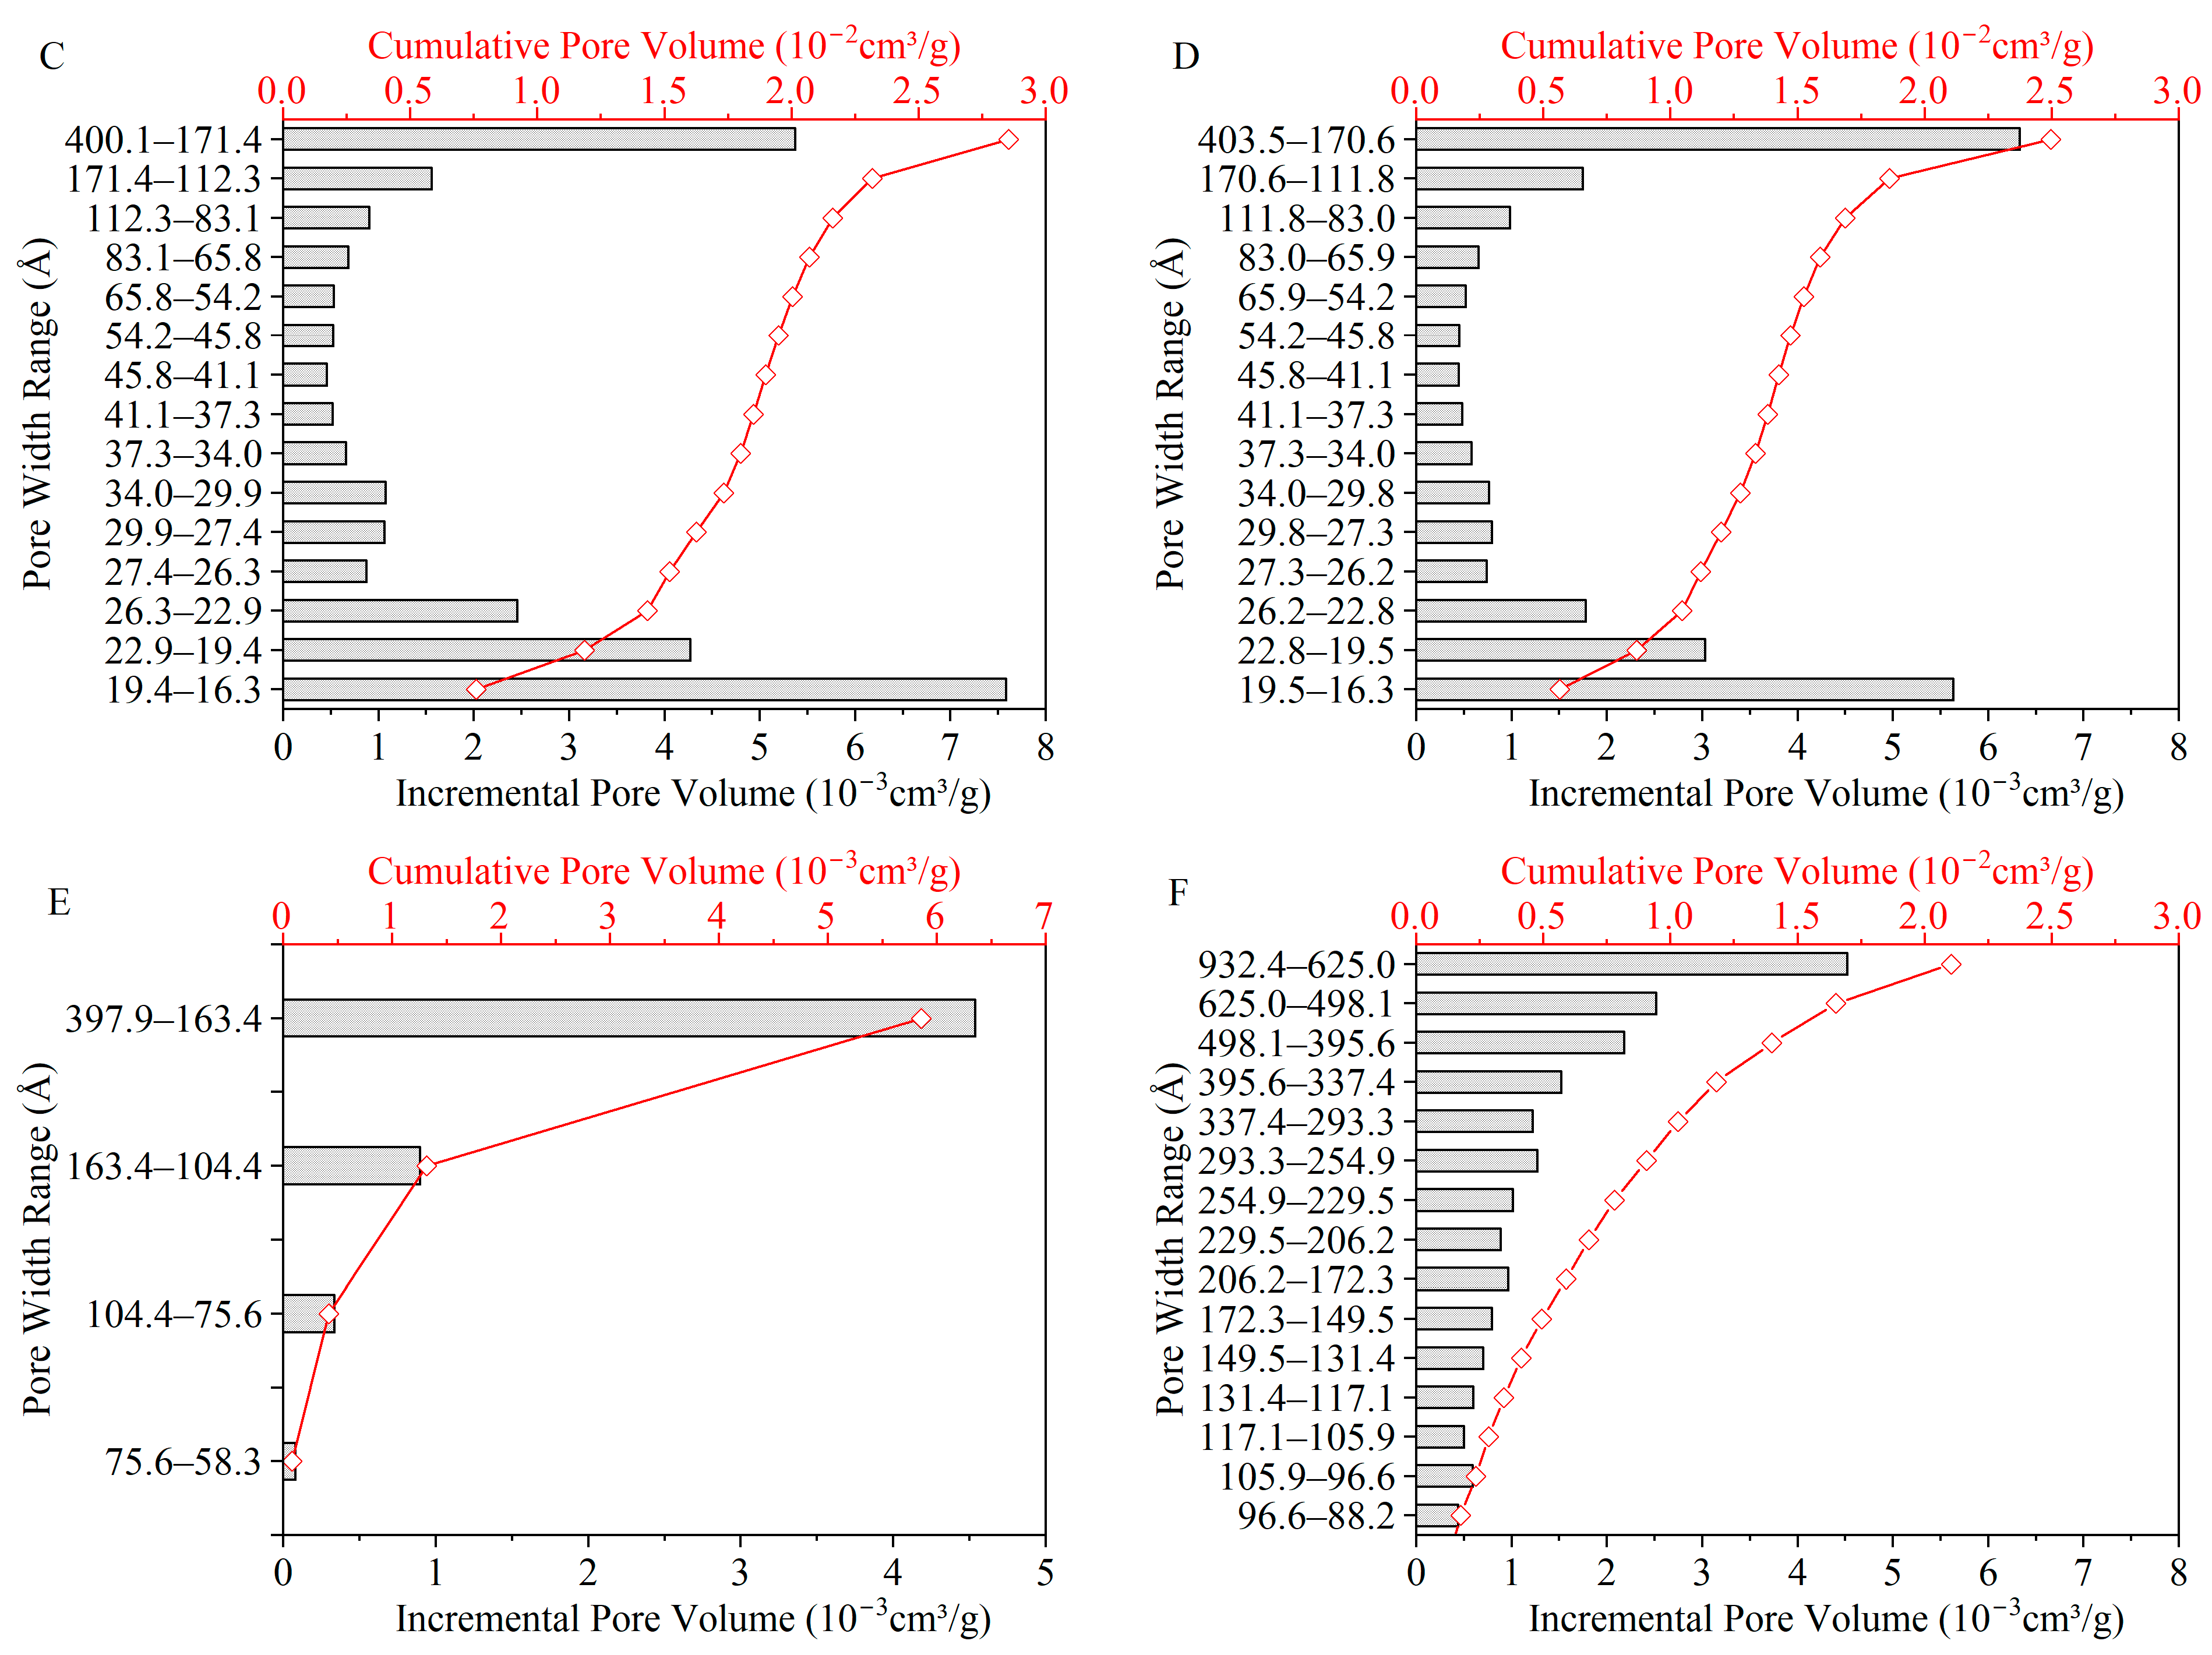
3.7. The Pore Structure of Char
Figure 12 and
Figure 13 show the pore structure characteristics of chars obtained through microwave and conventional heating. The BET surface area, average pore width, and total pore volume are listed in
Table 5. According to the IUPAC classification method [
41], the isotherms, under C500-10, M500-10 and M500-60, belong to type II and are dominated by mesopores. The isotherm of M700-60 is of type III, indicating the prevalence of macropores. The remaining isotherms (C700-10 and M700-10) correspond to type I, suggesting the existence of numerous micropores. The hysteresis loop is attributed to the capillary condensation taking place in mesopores and macropores. The incomplete closure of the hysteresis loop at P/P
0 = 0.4 might suggest the dominance of ink-bottle pores, surface chemistry, or network effects that hinder desorption [
41,
42]. The fact that Victorian brown coal pores may be slit-shaped [
43], the evidence that low-rank coals have very rough, approximately cylindrical pores [
44], and the complex network of coal samples are likely to explain the shape of the hysteresis loop.
Under microwave heating, the hysteresis loop became broader as the pyrolysis temperature and heating rate increased, suggesting an increase in the formation of mesopores and macropores as more intense removal of volatiles occurred with increasing pyrolysis temperature and heating rate. Under conventional heating, the effect of temperature on hysteresis was the same, but at 700 °C, comparable volatile yield and less broad loops indicated a lower fraction of mesopores and macropores compared with microwave heating, suggesting a difference in the evolution process of pore formation and development. However, the different distribution of surface functional groups in the char would also affect the capillary condensation. At 500 °C, chars under conventional heating with less O-containing and aliphatic functional groups (
Figure 6) had a lower affinity to N
2, leading to a smaller and narrower hysteresis loop [
45]. At 700 °C, however, the FTIR spectra of chars produced by both heating methods appeared similar, masking potential differences in surface chemistry. To further understand these effects, complementary characterisation techniques such as XPS and Raman spectroscopy are recommended for future studies.
The specific surface area and total pore volume in
Table 5 increased with temperature, which is consistent with the literature [
16] for both microwave and conventional heating methods. The distribution of pore volume and the corresponding specific surface area of chars increased with temperature under conventional heating due to the release of volatile matter, along with cross-linking reactions continuously contributing to the creation of porous structure [
14]. This also explains the lower surface area and total pore volume of chars under M500-10 and M500-60 due to their lower volatile matter yields in the early stages of pore structure development [
14,
16].
Under microwave heating at 700 °C and 10 °C/min (M700-10), the volume of mesopores increased significantly at the expense of micropores. This indicates that some micropores developed into mesopores or diminished. The loss of micropores can be attributed to the presence of local hot spots, resulting in a collapse of the porous structure and a decrease in specific surface area [
14]. Furthermore, the volumetric heating and the temperature gradient from the centre to the surface of particles under microwave heating promote the rapid buildup of pressure within the particles, leading to faster volatile release against the wall of micropore structures [
15]. Under the effect of high heating rates, chars formed under microwave heating had the most mesopores and macropores among all char samples. This suggests faster pore formation and development, followed by condensation and the collapse of the porous structure. The faster heating of the coal particle interior under microwave heating compared with conventional heating conditions is expected to facilitate faster release of volatiles and the buildup of pressure within the particles, resulting in the formation of larger mesopores and macropores. Under conventional heating, due to heat transfer from the surface to the centre of the particles, outer particle layers undergo devolatilisation first. This facilitates the release of evolved volatiles through the pore structure to the surrounding environment, thus preserving the micropores generated during volatile formation. The overall consequence is a higher surface area for chars under conventional heating, as shown in
Table 5.


