Article

Study on Fracture Interference and Formation Mechanisms of Complex Fracture Networks in Continental Shale Oil Horizontal Well Staged Fracturing

1
College of Petroleum Engineering, Xi’an Shiyou University, Xi′an 710065, China
2
Shaanxi Key Laboratory of Well Stability and Fluid & Rock Mechanics in Oil and Gas Reservoirs, Xi’an Shiyou University, Xi’an 710065, China
3
Changbei Operating Company, Changqing Oilfield, PetroChina, Xi′an 710018, China
*
Author to whom correspondence should be addressed.
Energies 2025, 18(11), 2862; https://doi.org/10.3390/en18112862
Submission received: 27 March 2025 / Revised: 10 May 2025 / Accepted: 21 May 2025 / Published: 30 May 2025
(This article belongs to the Topic Enhanced Oil Recovery Technologies, 3rd Edition)

Abstract

Continental shale oil fracturing dynamics are governed by interactions between hydraulic fractures and pre-existing natural fractures. This study establishes a fluid–solid coupling model using globally embedded cohesive elements to simulate fracture propagation in naturally fractured reservoirs. Key factors affecting fracture network complexity were quantified: (1) Weakly cemented natural fractures (bond strength coefficient <0.5) promote 23% higher fracture tortuosity compared to strongly cemented formations. (2) Optimal horizontal stress differentials (Δσ = 8–10 MPa) balance fracture length (increased by 35–40%) and branching complexity. (3) Injection rate elevation from 0.06 to 0.132 m3/min enhances the stimulated volume by 90% through improved fracture dimensions. The findings provide mechanistic insights for optimizing fracture network complexity in shale reservoirs.

1. Introduction

In recent years, with continuous global economic development, worldwide energy demand has been escalating, rendering the exploration of new energy sources a critical challenge for China′s economic advancement. China possesses abundant shale oil resources, serving as a strategic alternative resource for increasing hydrocarbon reserves and production. In 2024, shale oil output surged to 6 million metric tons, demonstrating a year-on-year growth exceeding 30%, while shale gas production maintained a stable scale above 25 billion cubic meters [1]. According to the latest 2024 assessment by the Ministry of Natural Resources, China′s shale oil geological resources are estimated at 397.46 × 10⁸ metric tons, with technically recoverable resources reaching 34.98 × 10⁸ metric tons, projected to become the primary driver for stabilizing and enhancing oil production in the future [2]. Currently, hydraulic fracturing remains the predominant technique for unconventional energy extraction, including shale oil and gas [3,4,5,6]. The propagation behavior and underlying mechanisms of fractures directly govern extraction efficiency [7,8,9,10,11,12], necessitating a systematic investigation into fracture interference and complex network formation dynamics. Consequently, researchers worldwide have conducted extensive investigations through numerical simulations and experimental studies to address these challenges.
Zhu et al. [13] developed a pore pressure cohesive zone model to simulate hydraulic fracturing processes in plastic formations with laminated fractures. Their results indicate that natural fractures in boundary strata facilitate hydraulic fracture initiation and propagation in the target formation, with fracture connectivity dictating propagation modes (i.e., tensile vs. shear failure). Wang et al. [14] established a fully coupled fluid–solid model for hydraulic fracture propagation, revealing a novel fracture branching pattern where hydraulic fractures are arrested by weakly cemented natural fractures, generating bifurcated fractures connecting to natural fracture tips. Shi et al. [15] proposed a stress field superposition model to investigate interactions between hydraulic fractures and open/closed natural fractures. The study demonstrated that induced stress differentials at fracture tips correlate linearly with net pressure and hydraulic fracture length. Hydraulic fracture deflection encounters minimal resistance when fracture deflection angles are <90° or natural fracture dip angles are <45°, favoring complex network formation. Fu et al. [16] created a planar heterogeneous multi-dimensional fracturing model using cohesive elements, identifying three interaction modes: natural fracture opening, shearing, and penetration, alongside composite network morphologies. Larger horizontal stress differentials, acute angles between σHmax and natural fractures, higher natural fracture tensile strength, and elevated injection rates enhance penetration efficiency. Based on the combined finite-discrete element method (FDEM), Yan et al. [17,18] established a seepage–stress-coupled FDEM numerical method by considering the seepage laws in the rock matrix and fractures as well as the fluid filtration loss characteristics in the fractures. The hydraulic fracturing problems of complex fracture networks in two-dimensional and three-dimensional fractured reservoirs were analyzed. Nguyen et al. [19] elucidated a finite element method to simulate the stochastic extension process of hydraulic cracks using zero-thickness cohesive units, but it was not integrated into the ABAQUS platform.
Duan et al. [20] employed discrete element modeling to investigate bedding-controlled fracture propagation in shale, finding that 5 MPa stress differentials and 75-degree approach angles significantly influence fracture interactions. Increasing bedding density elevates borehole pressure while reducing the total fracture count. Jiang et al. [21] conducted physical simulations under true triaxial stress, revealing that weaker bedding strength promotes bedding-parallel fractures and suppresses vertical height. Higher bedding density amplifies complexity but reduces the dominant fracture height. Ma et al. [22] integrated electromechanical characterization, true triaxial experiments, and numerical modeling, demonstrating that breakdown pressure escalates with confining stress, while higher stress differentials promote internal microfracturing. Tatyana Kukhalova et al. [23] On the basis of studying the natural gas production process in gas fields with complex geological formations, identifying the main controllable variables and control roles, and analyzing the possibilities of implementation of distributed control systems in natural gas production facilities, a mathematical model of distributed parameters of gas-bearing reservoirs was obtained, which has a better transient quality and allows to achieve the control effect in the desired area instead of a specific point.
Current research predominantly focuses on qualitative analyses of natural fracture/bedding impacts, with limited quantitative characterization of fracture interference and network evolution mechanisms. This study addresses this gap by investigating dynamic fracture interference under multi-field coupling and establishing quantitative network characterization models. Utilizing finite element analysis with globally embedded zero-thickness cohesive elements, we systematically analyze the effects of natural fracture cementation strength, horizontal stress differentials, Young′s modulus, and injection rates on fracture propagation during staged horizontal well fracturing. The findings provide critical insights for optimizing hydraulic fracturing operations in unconventional reservoirs.

2. Materials and Methods

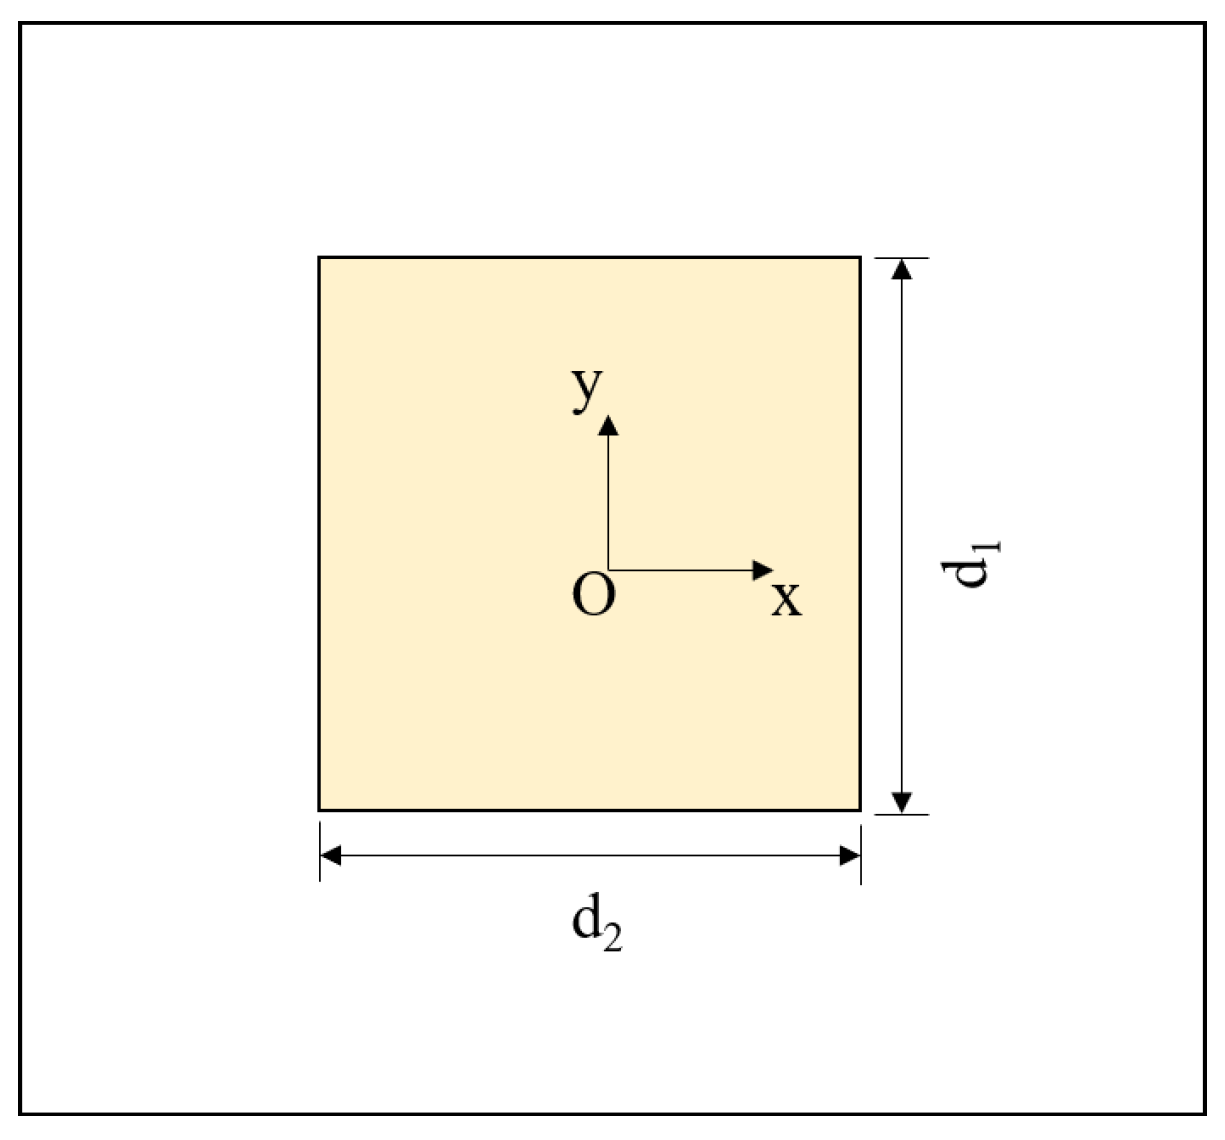
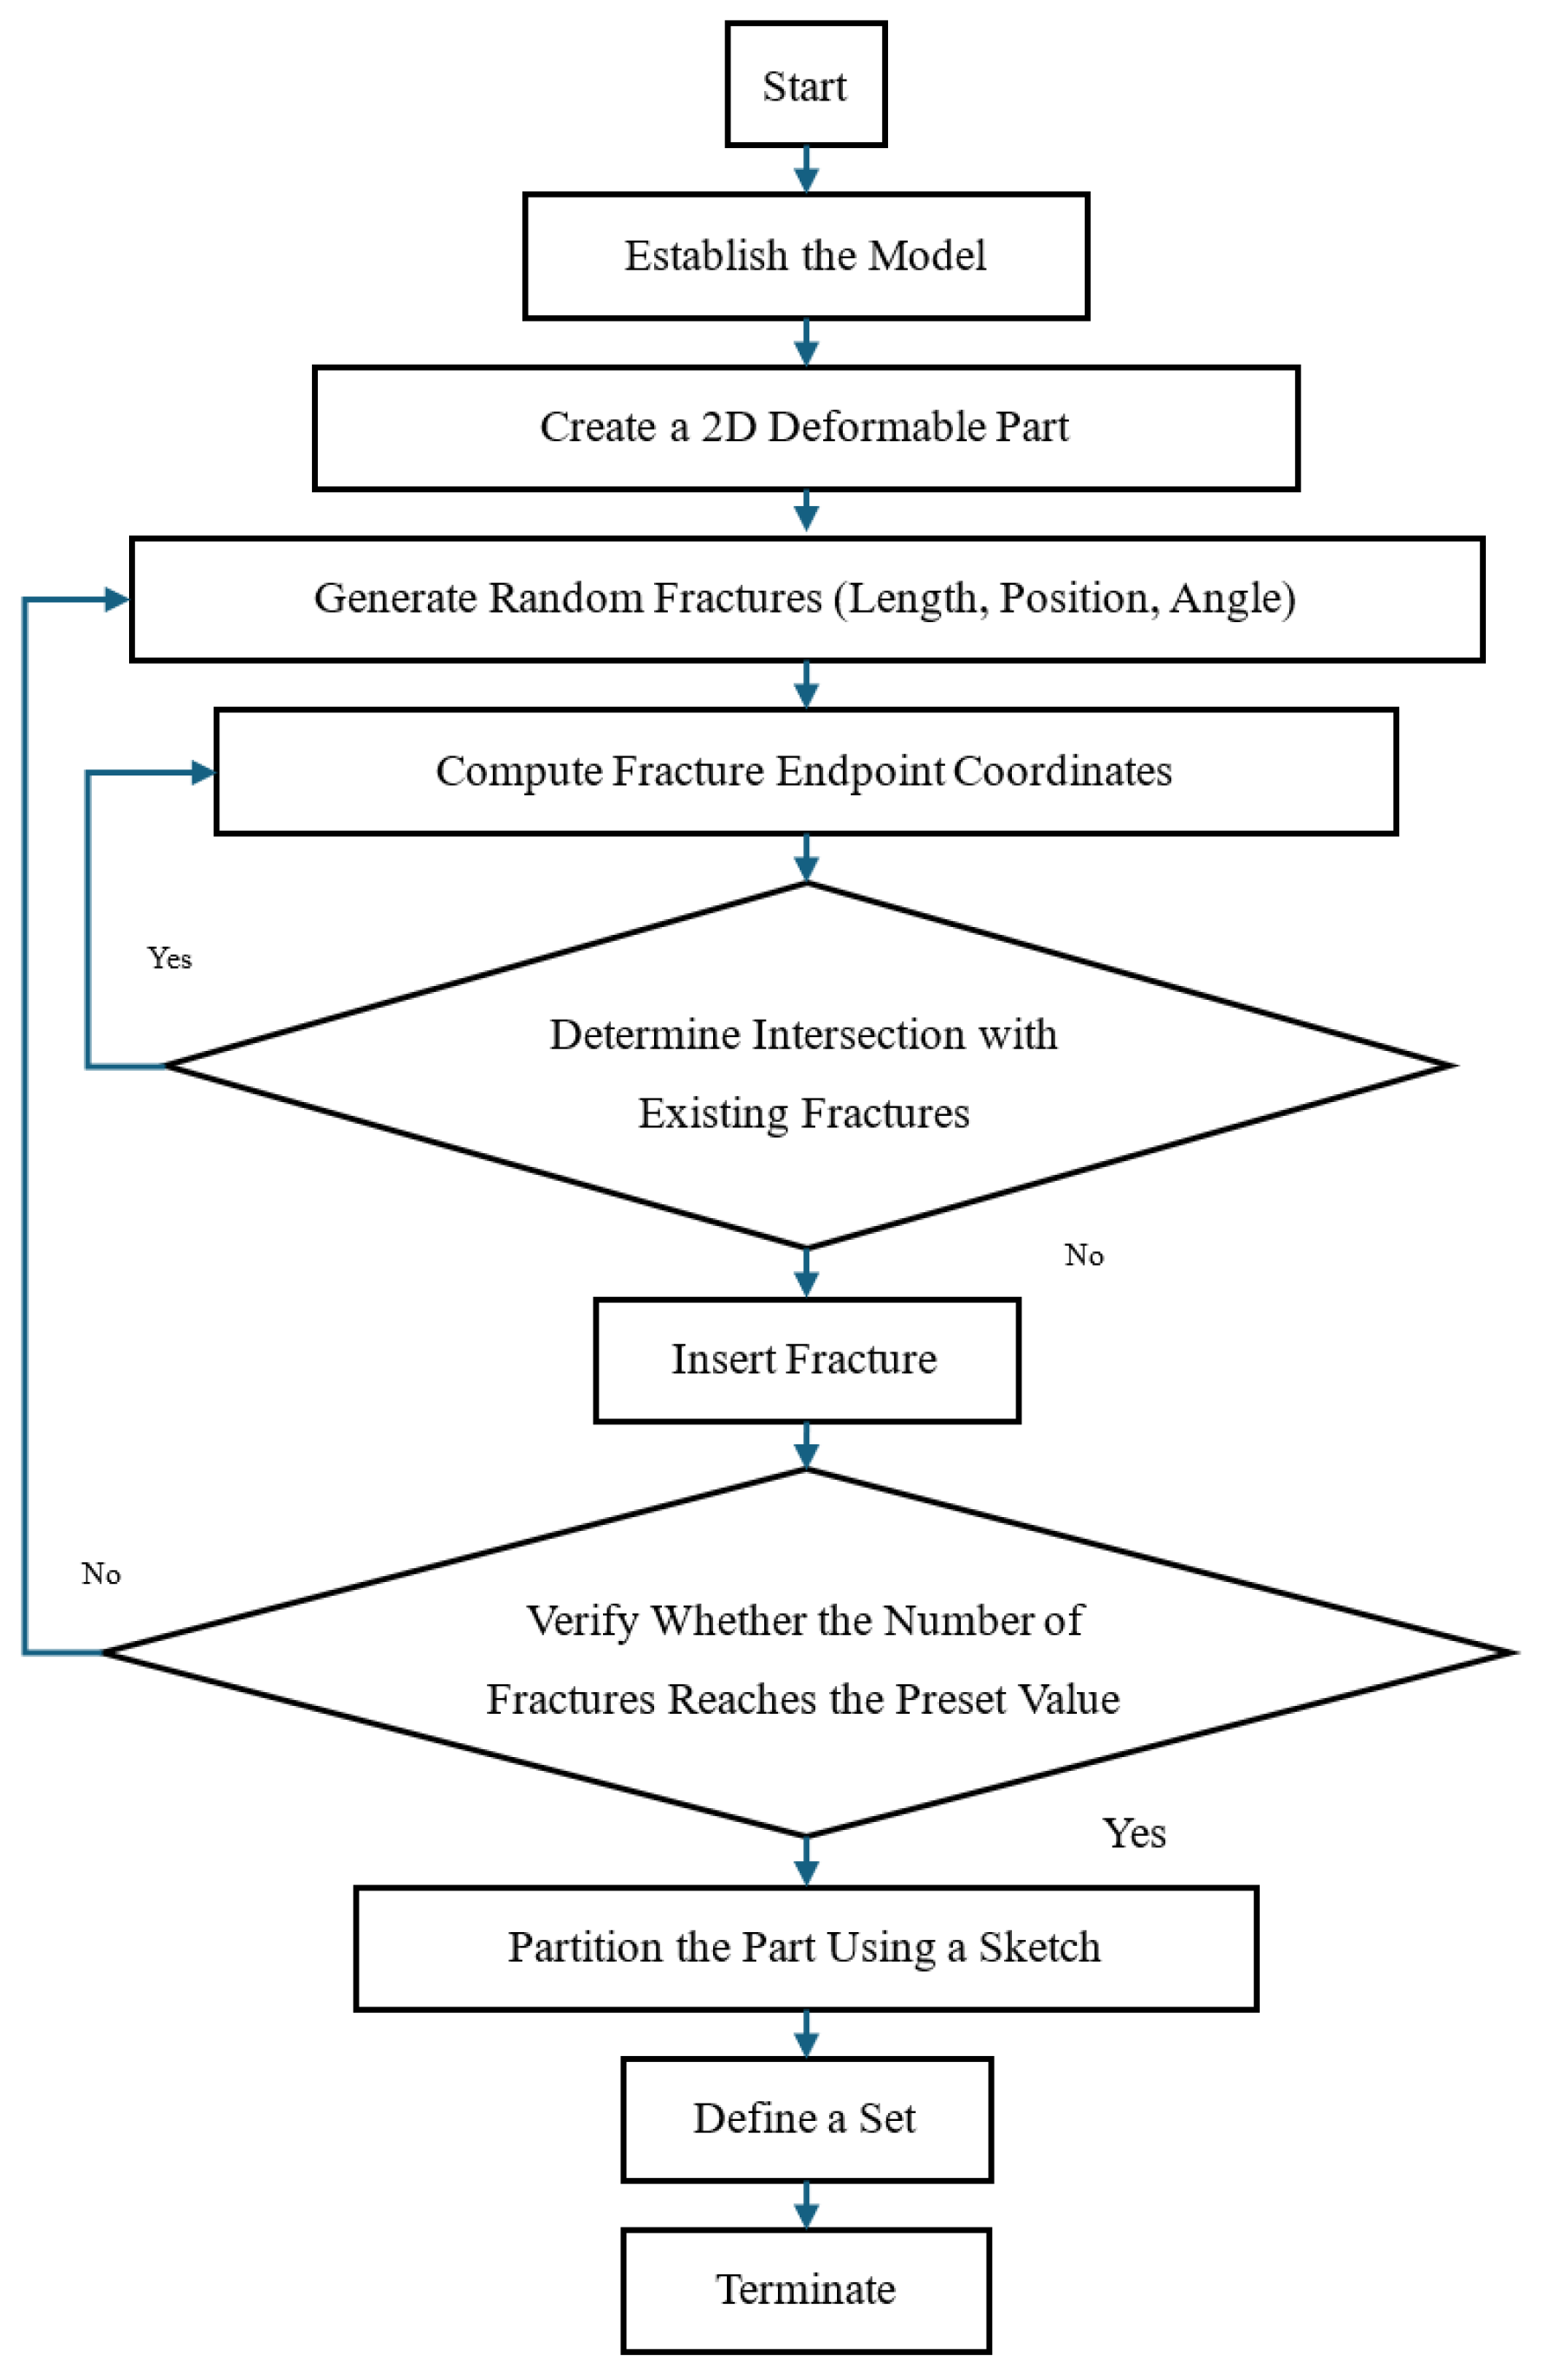
2.1. Mechanism of Natural Fracture Generation

The Monte Carlo method can be introduced to construct a probabilistic statistical model for the geometric parameters of microcracks. By employing stochastic simulation techniques and conducting Monte Carlo simulations with a large number of samples, the evolution path of rock failure under the interaction between microcracks and macroscopic fractures can be explored.
In this study, a uniform distribution is used to generate and characterize the geometric parameters of microcracks, such as position, angle, and length. The corresponding probability density function of the uniform distribution is shown in Equation (1):
G x = 0       , x < 0 x m n m       , m x n 1       , x > n
In this equation, m and n take 0 and 1, respectively.
The distribution functions   G 1 X , G X ,   ,   G n X   are mutually independent.
To describe the positions of randomly generated microcracks, a specific region for microcrack generation is defined. This region is assumed to be a rectangle with a length of d 1 and a width of   d 2 , with its center set as the coordinate origin, as illustrated by the yellow area in Figure 1.
The orientation angle of randomly generated microcracks is expressed as follows:
O r = θ · G 3 x
The crack length of randomly generated microcracks is expressed as follows:
O d = d m a x · G 4 x
In the equation,   d m a x   represents the maximum controlled length of the crack.
The geometric parameters of the random microcracks, including position, angle, and length, can be described by the above equations. These parameters remain mutually independent, and the random generation of each geometric parameter can simulate the distribution of microcracks in the rock [24].
The continental shale oil reservoir is characterized by a large number of natural fractures, which directly influence the propagation path of hydraulic fractures and, consequently, affect the fracture network morphology and reservoir stimulation efficiency. Therefore, these natural fractures must be fully considered when studying the fracturing process in continental shale oil reservoirs.
In this study, a subroutine developed in open-source programming tool is used to generate four sets of random natural fractures in the model, with both fracture length and position being randomly determined. The specific parameters of the natural fractures are provided in Table 1. Figure 2 illustrates the detailed process for generating the natural fractures, while Figure 3 shows the distribution of the four sets of randomly generated natural fractures.
A total of 400 natural fractures are designed in the geometric model, divided into 4 groups, with 100 fractures in each group. These fractures are uniformly distributed in the model according to the allocation pattern shown in Table 1. The specific fracture distribution is illustrated in Figure 2.

2.2. Fundamentals and Establishment of Numerical Models

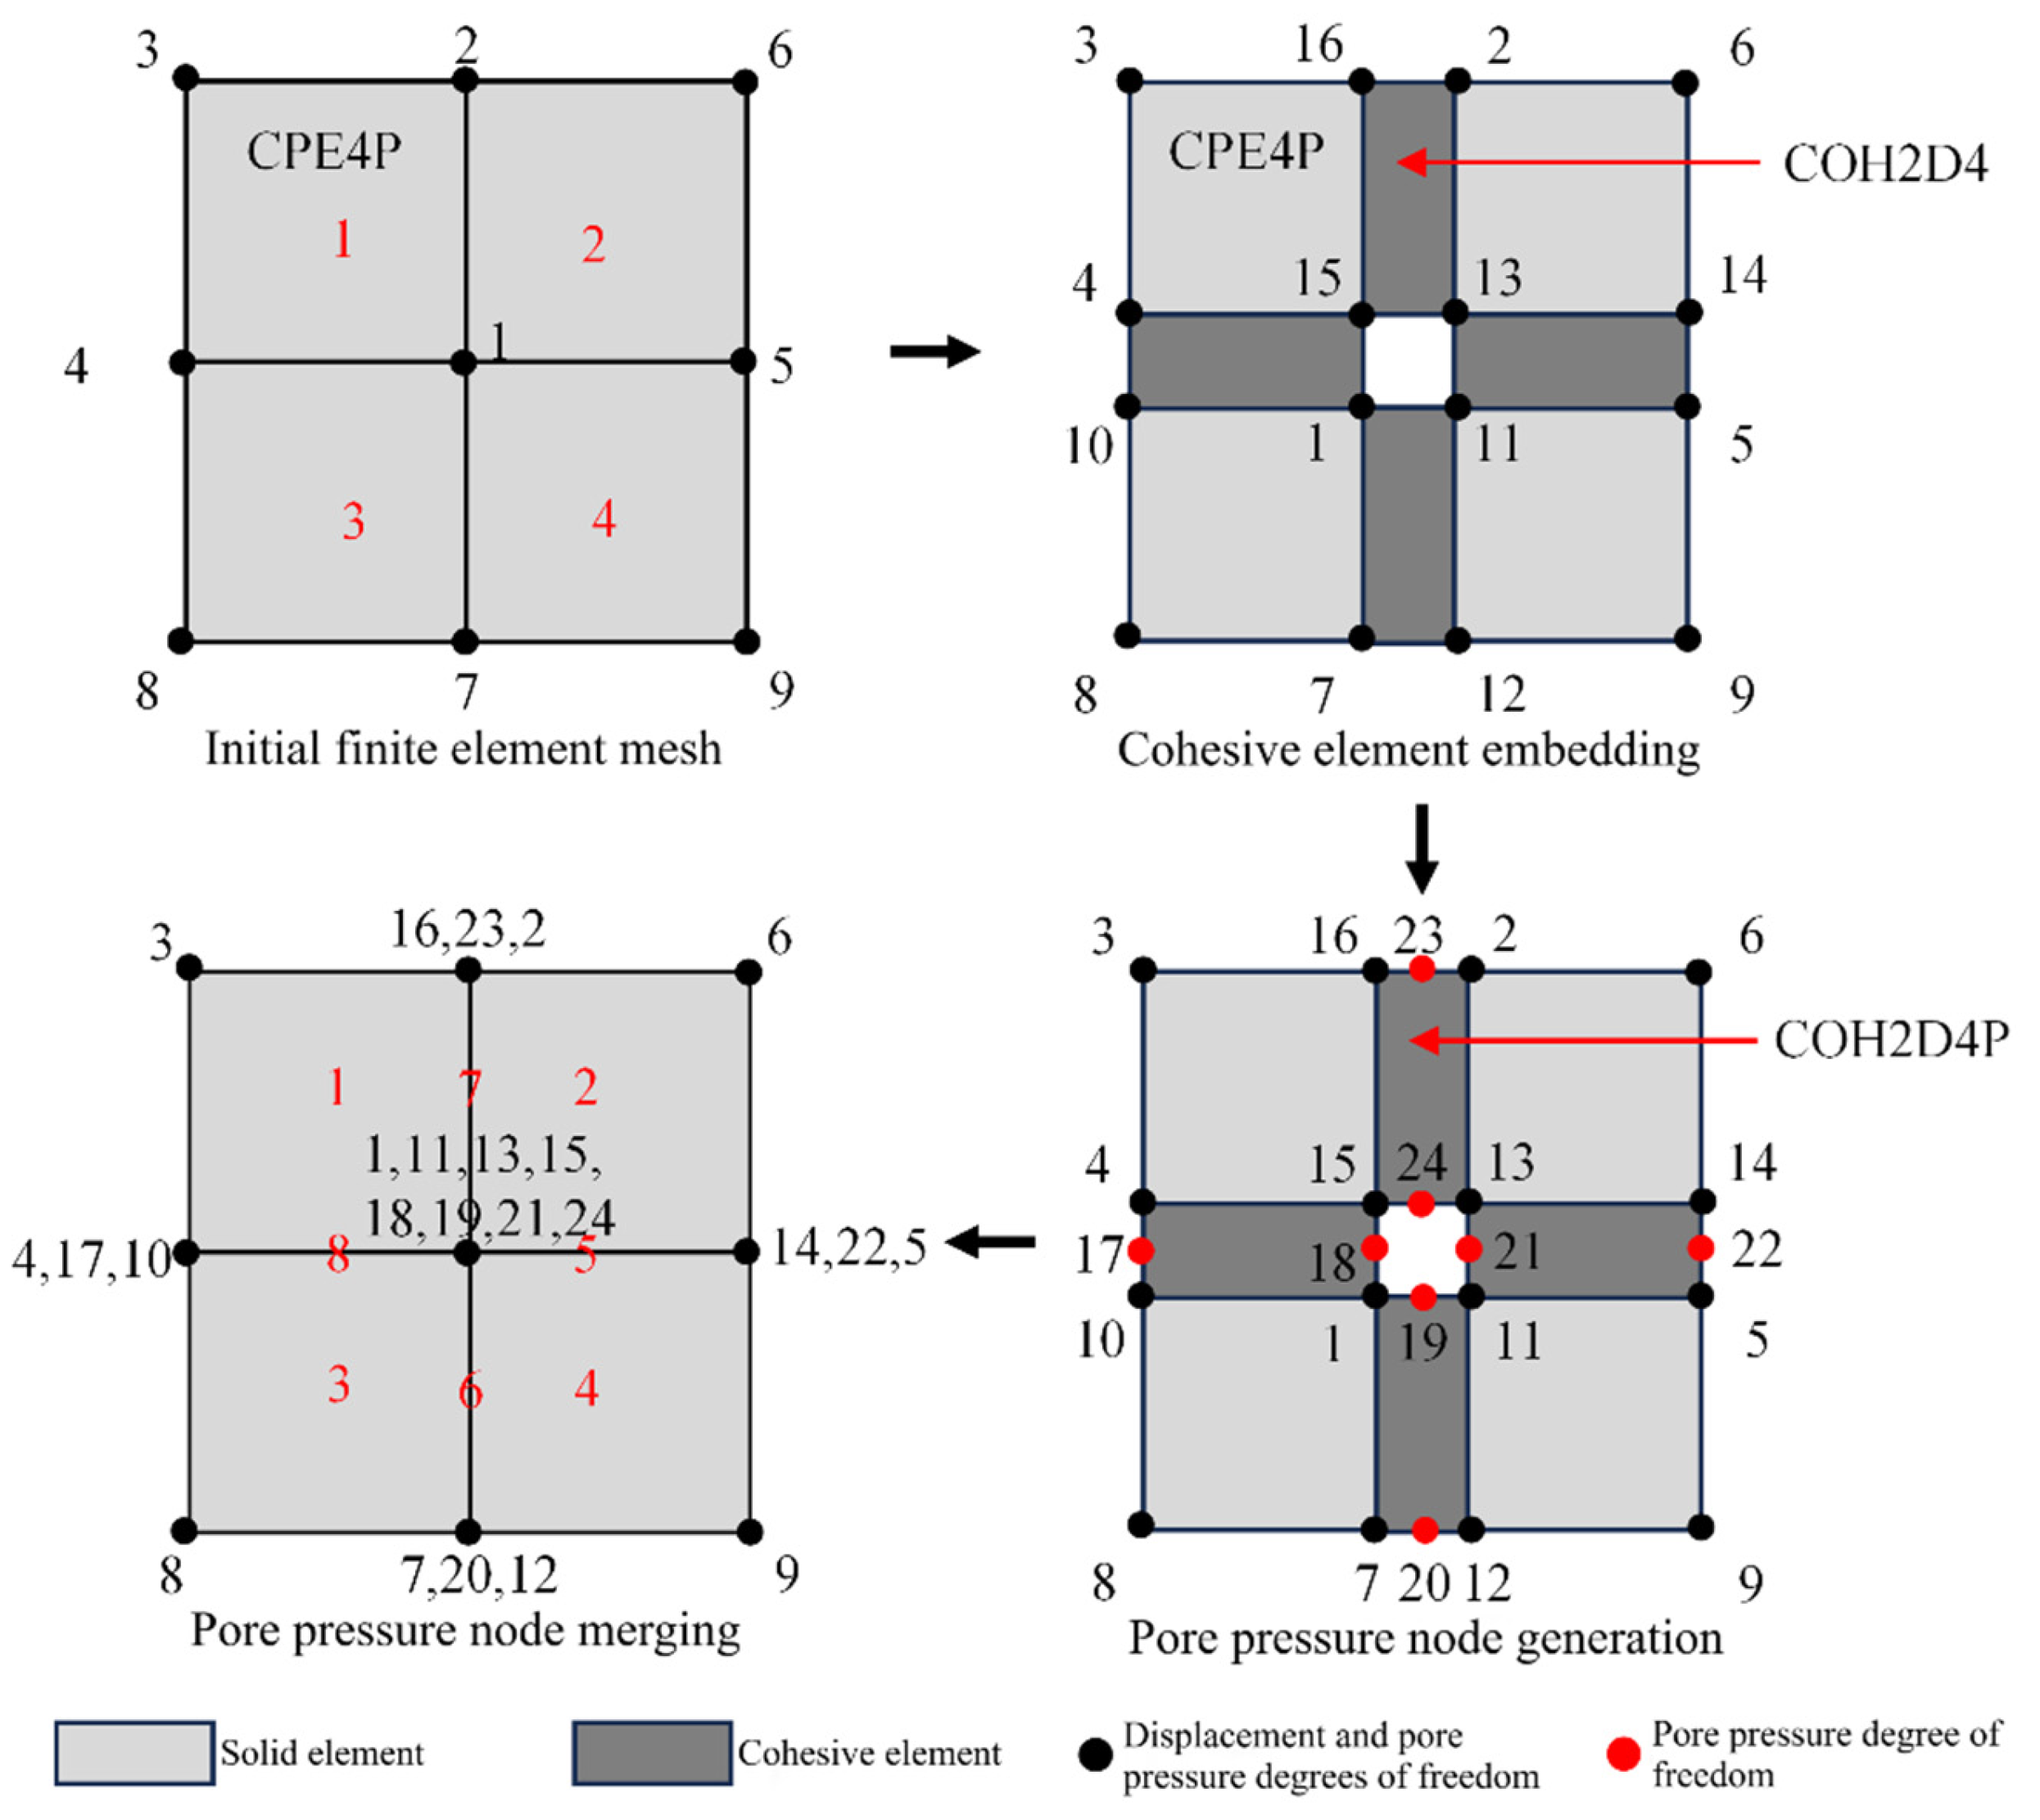
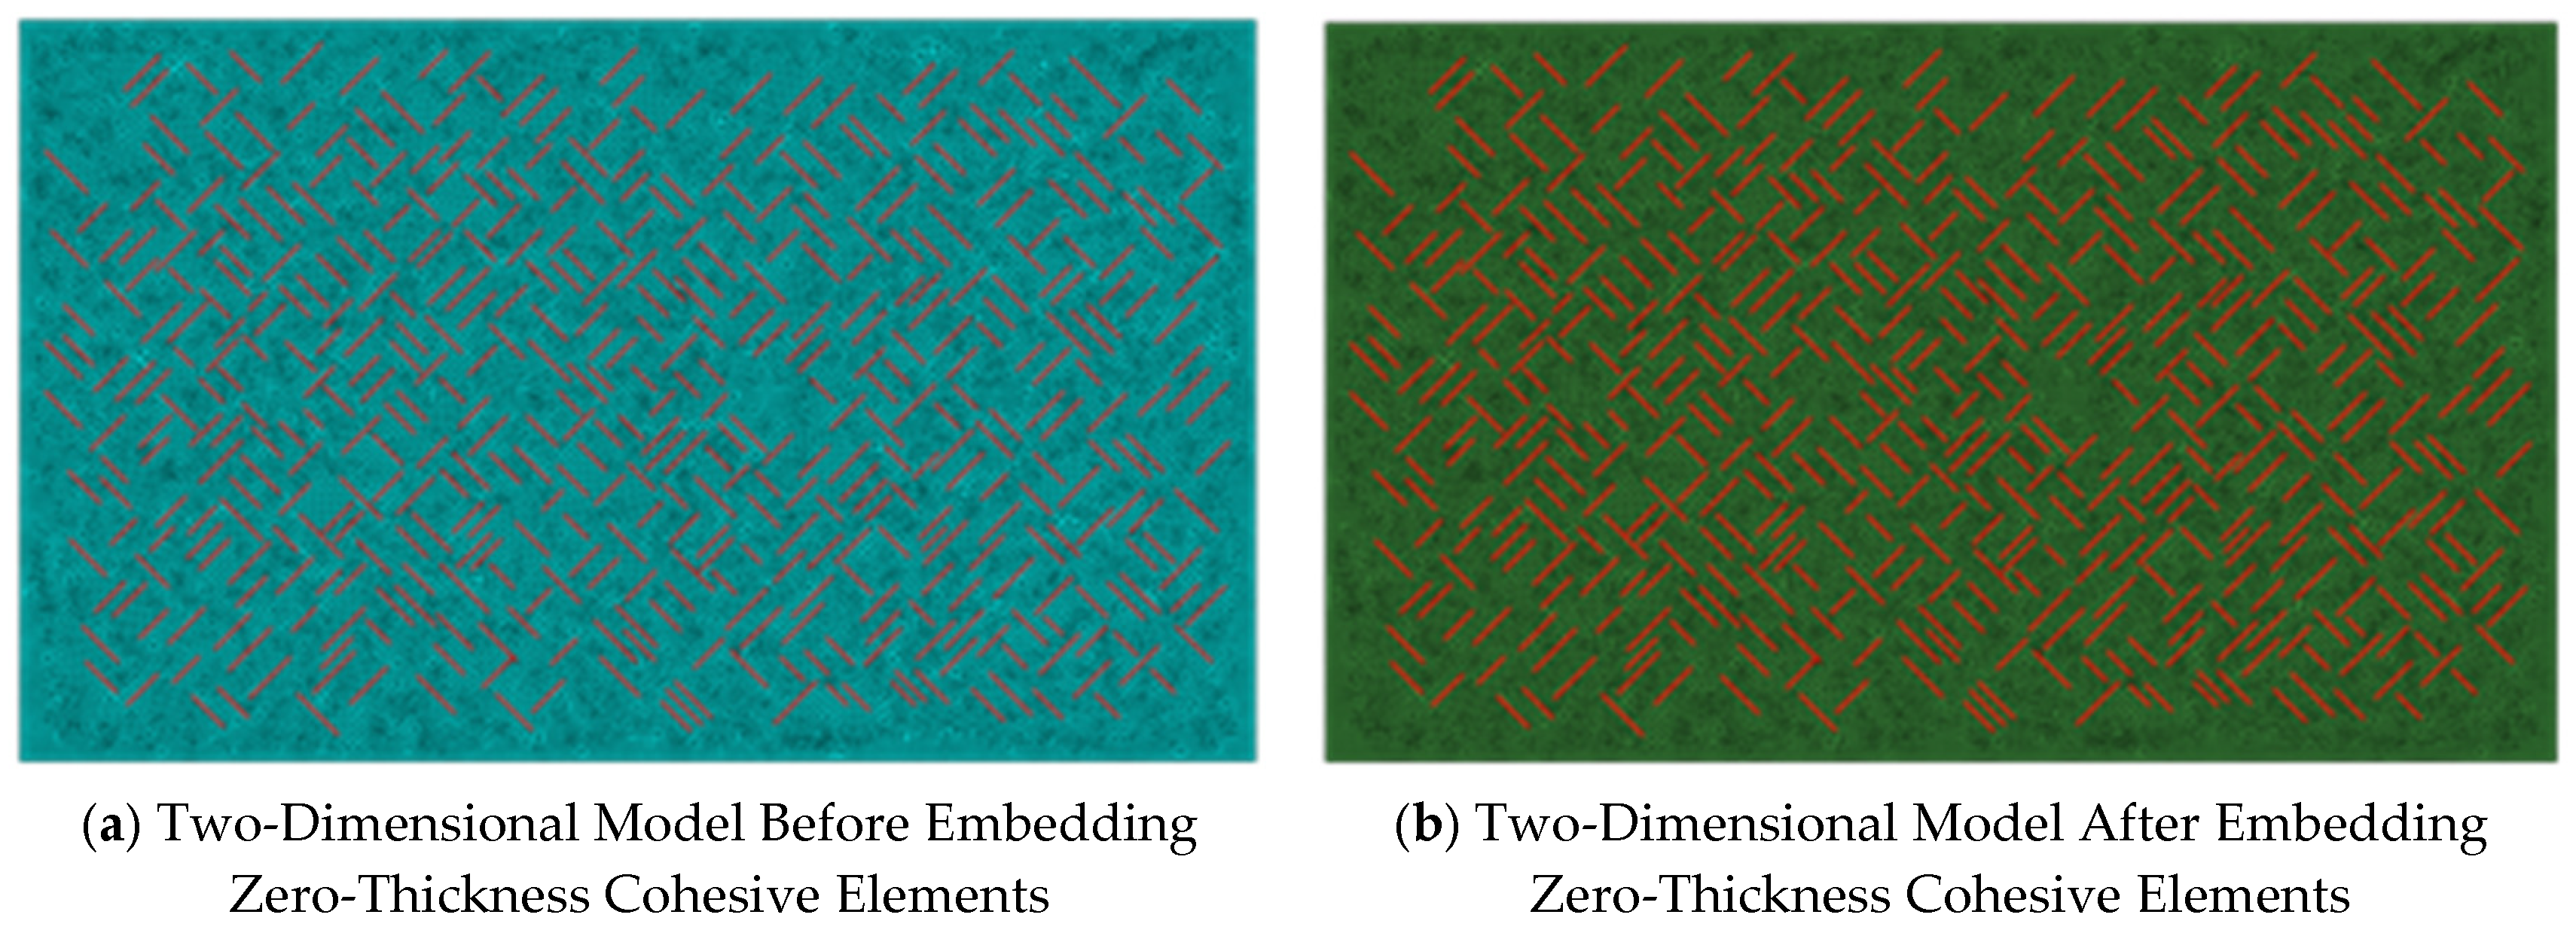
2.2.1. Principle and Method of Globally Embedding Zero-Thickness Cohesive Elements

To more realistically simulate the arbitrary expansion of fractures, zero-thickness cohesive elements with pore pressure nodes are introduced. These cohesive elements are embedded at the boundaries of each solid element [25].
The global embedding of cohesive elements involves splitting the finite element mesh nodes and then embedding the zero-thickness cohesive elements at the boundaries of each solid element. This process mainly includes discretizing the finite element mesh, inserting cohesive elements, generating pore pressure nodes, and merging common nodes. Figure 4 illustrates the process of globally embedding zero-thickness cohesive elements, with the specific steps outlined as follows [26]:
(1)
Extract the information of all model elements and nodes. By rearranging the sequence of the element nodes, ensure that each element does not share nodes with other elements. The sequence follows the right-hand rule. If there are n solid elements, there will be 4n nodes.
(2)
Discretize the finite element mesh. Assume that the model consists of n CPE4P elements. Redefine the 4n nodes, and after discretization, set the coordinates of the newly generated nodes equal to the coordinates of the original nodes to ensure that the thickness of the embedded cohesive elements is zero.
(3)
Search for any two elements and determine whether they share two pairs of nodes with identical positions. If they do, embed a zero-thickness cohesive element (COH2D4) between each pair of CPE4P elements. If not, no embedding is needed.
(4)
Generate pore pressure nodes. To ensure fluid flow between the newly generated interface surfaces, an additional pore pressure node is added at the center of the interface between each adjacent element. At this point, the cohesive element is COH2D4P.
(5)
Merge seepage nodes at intersecting points. By merging nodes, the fluid flow can be transmitted smoothly through the shared pore pressure nodes to the surrounding cohesive pore pressure elements.

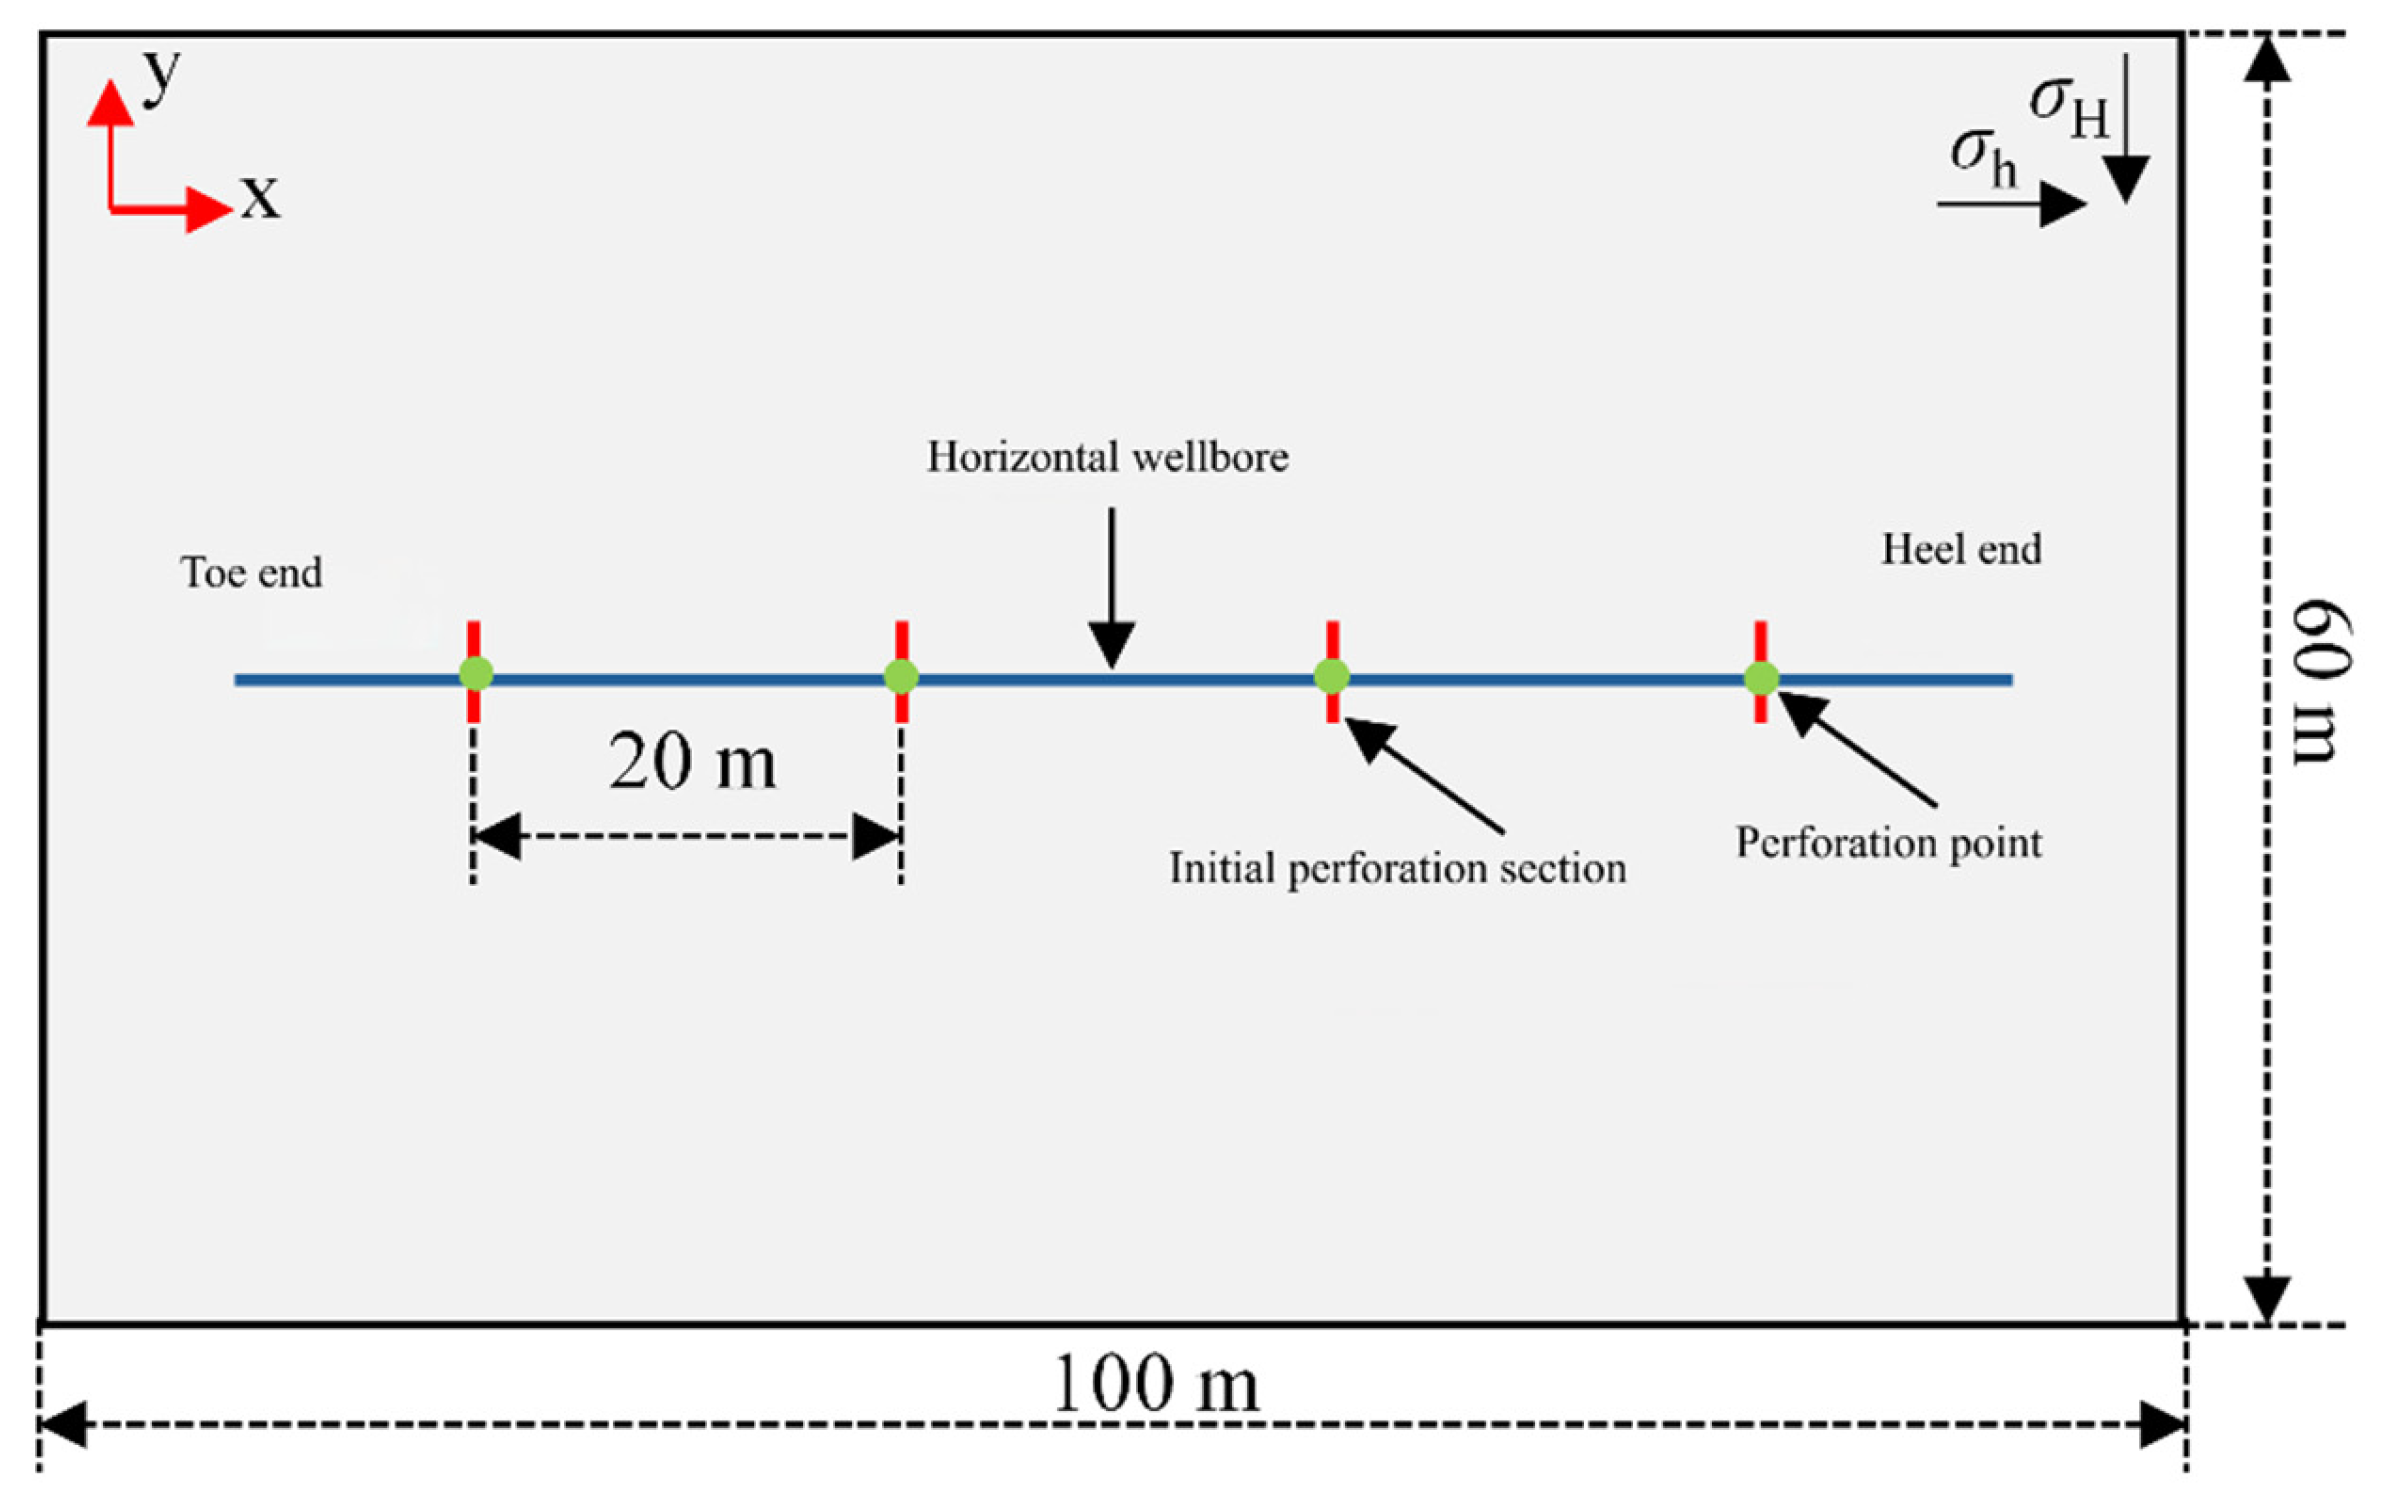
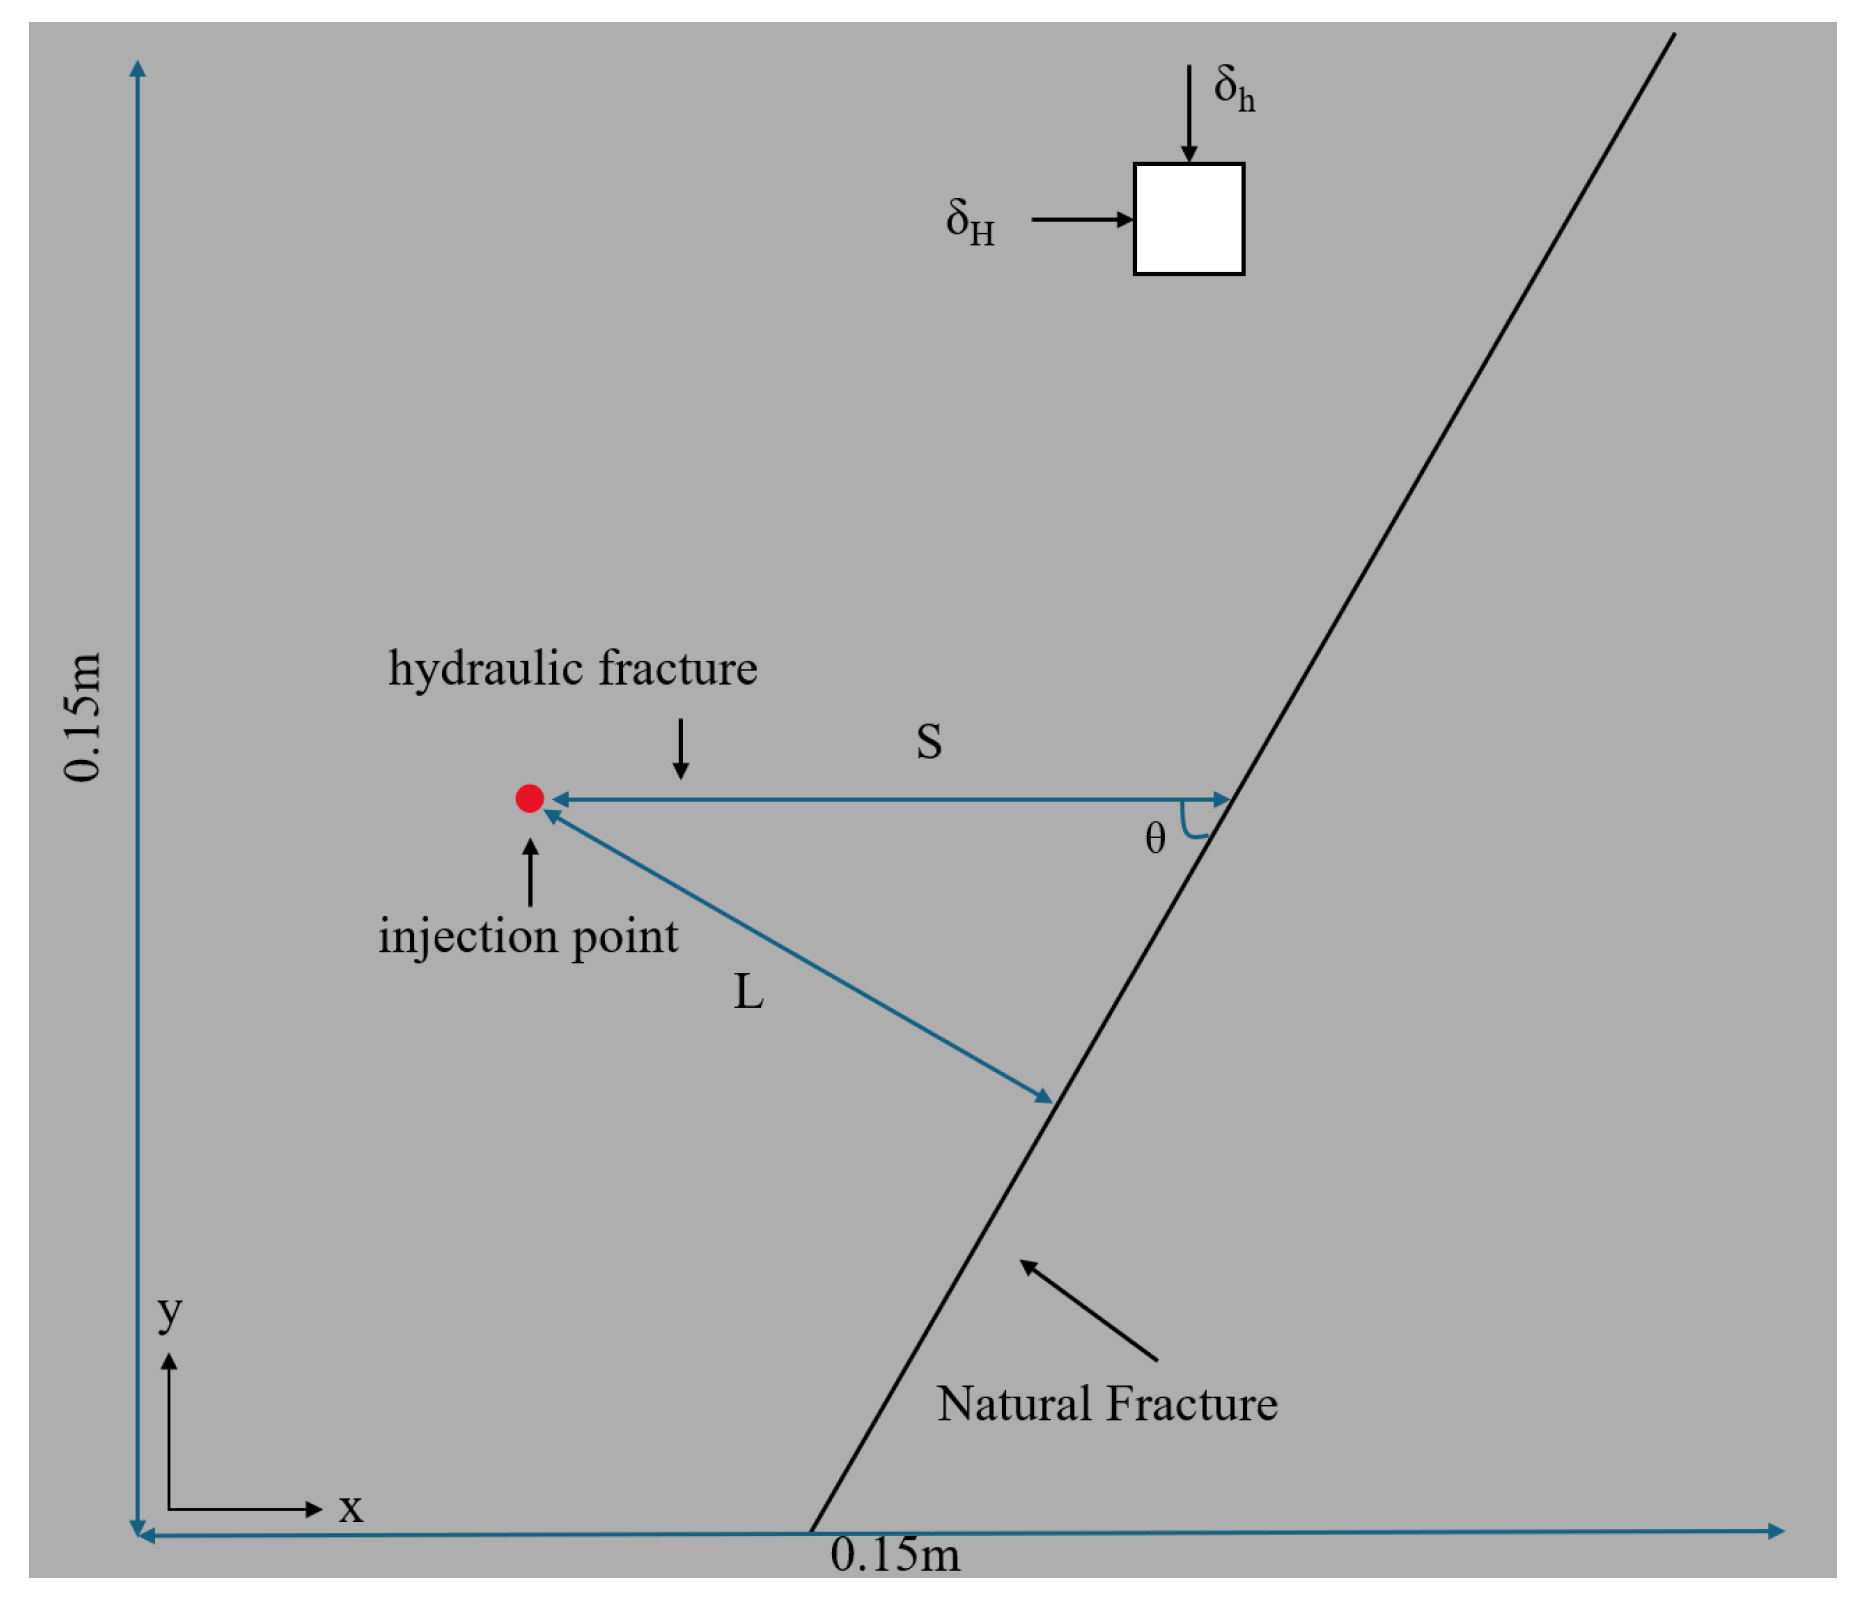
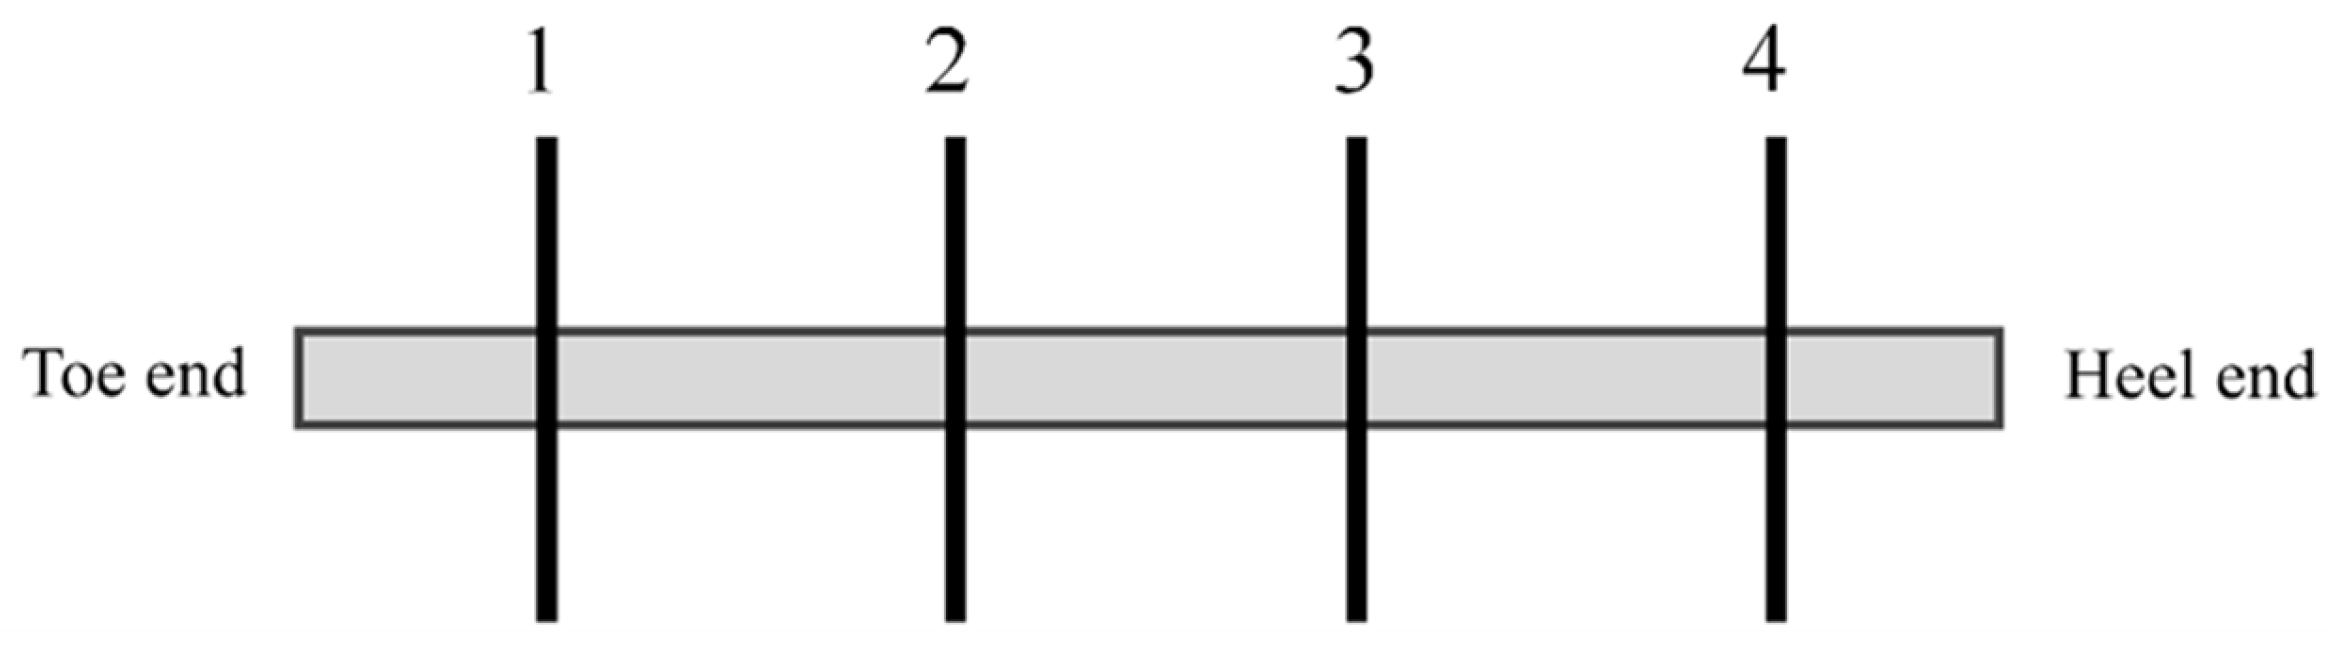
2.2.2. Establishment of the Numerical Model

Based on the finite element method, a 4-stage horizontal well fracturing model is established for a 100 × 60 m2 reservoir with a stage spacing of 20 m. A structured grid is applied to discretize the reservoir model, with a mesh size of 0.5 m. The finite element grid is then discretized and embedded with zero-thickness cohesive elements. The viscous elements undergo loading, damage, stiffness degradation, and cracking, and the limitation that cohesive elements can only crack along fixed paths is removed. This allows for simulating the random expansion of hydraulic fractures. The coupled solid–fluid element CPE4P is used to model the porous medium of the continental shale oil reservoir, with deformation occurring in a plane strain state.
In this model, the transverse direction is set as the direction of the minimum horizontal principal stress, while the longitudinal direction corresponds to the maximum horizontal principal stress. The perforation direction is parallel to the maximum horizontal principal stress direction, with an initial perforation length of 2 m. The natural fracture and hydraulic fracture element types are COH2D4P. The geometric model is shown in Figure 5, and Figure 6 illustrates the two-dimensional model before and after embedding the zero-thickness cohesive elements. Hydraulic fractures extend in a linear two-wing pattern parallel to the maximum horizontal principal stress direction. It is assumed that the reservoir is an isotropic, linear elastic, saturated porous medium, with fracturing fluid considered as an incompressible Newtonian fluid, and fluid loss on the fracture surface is taken into account.

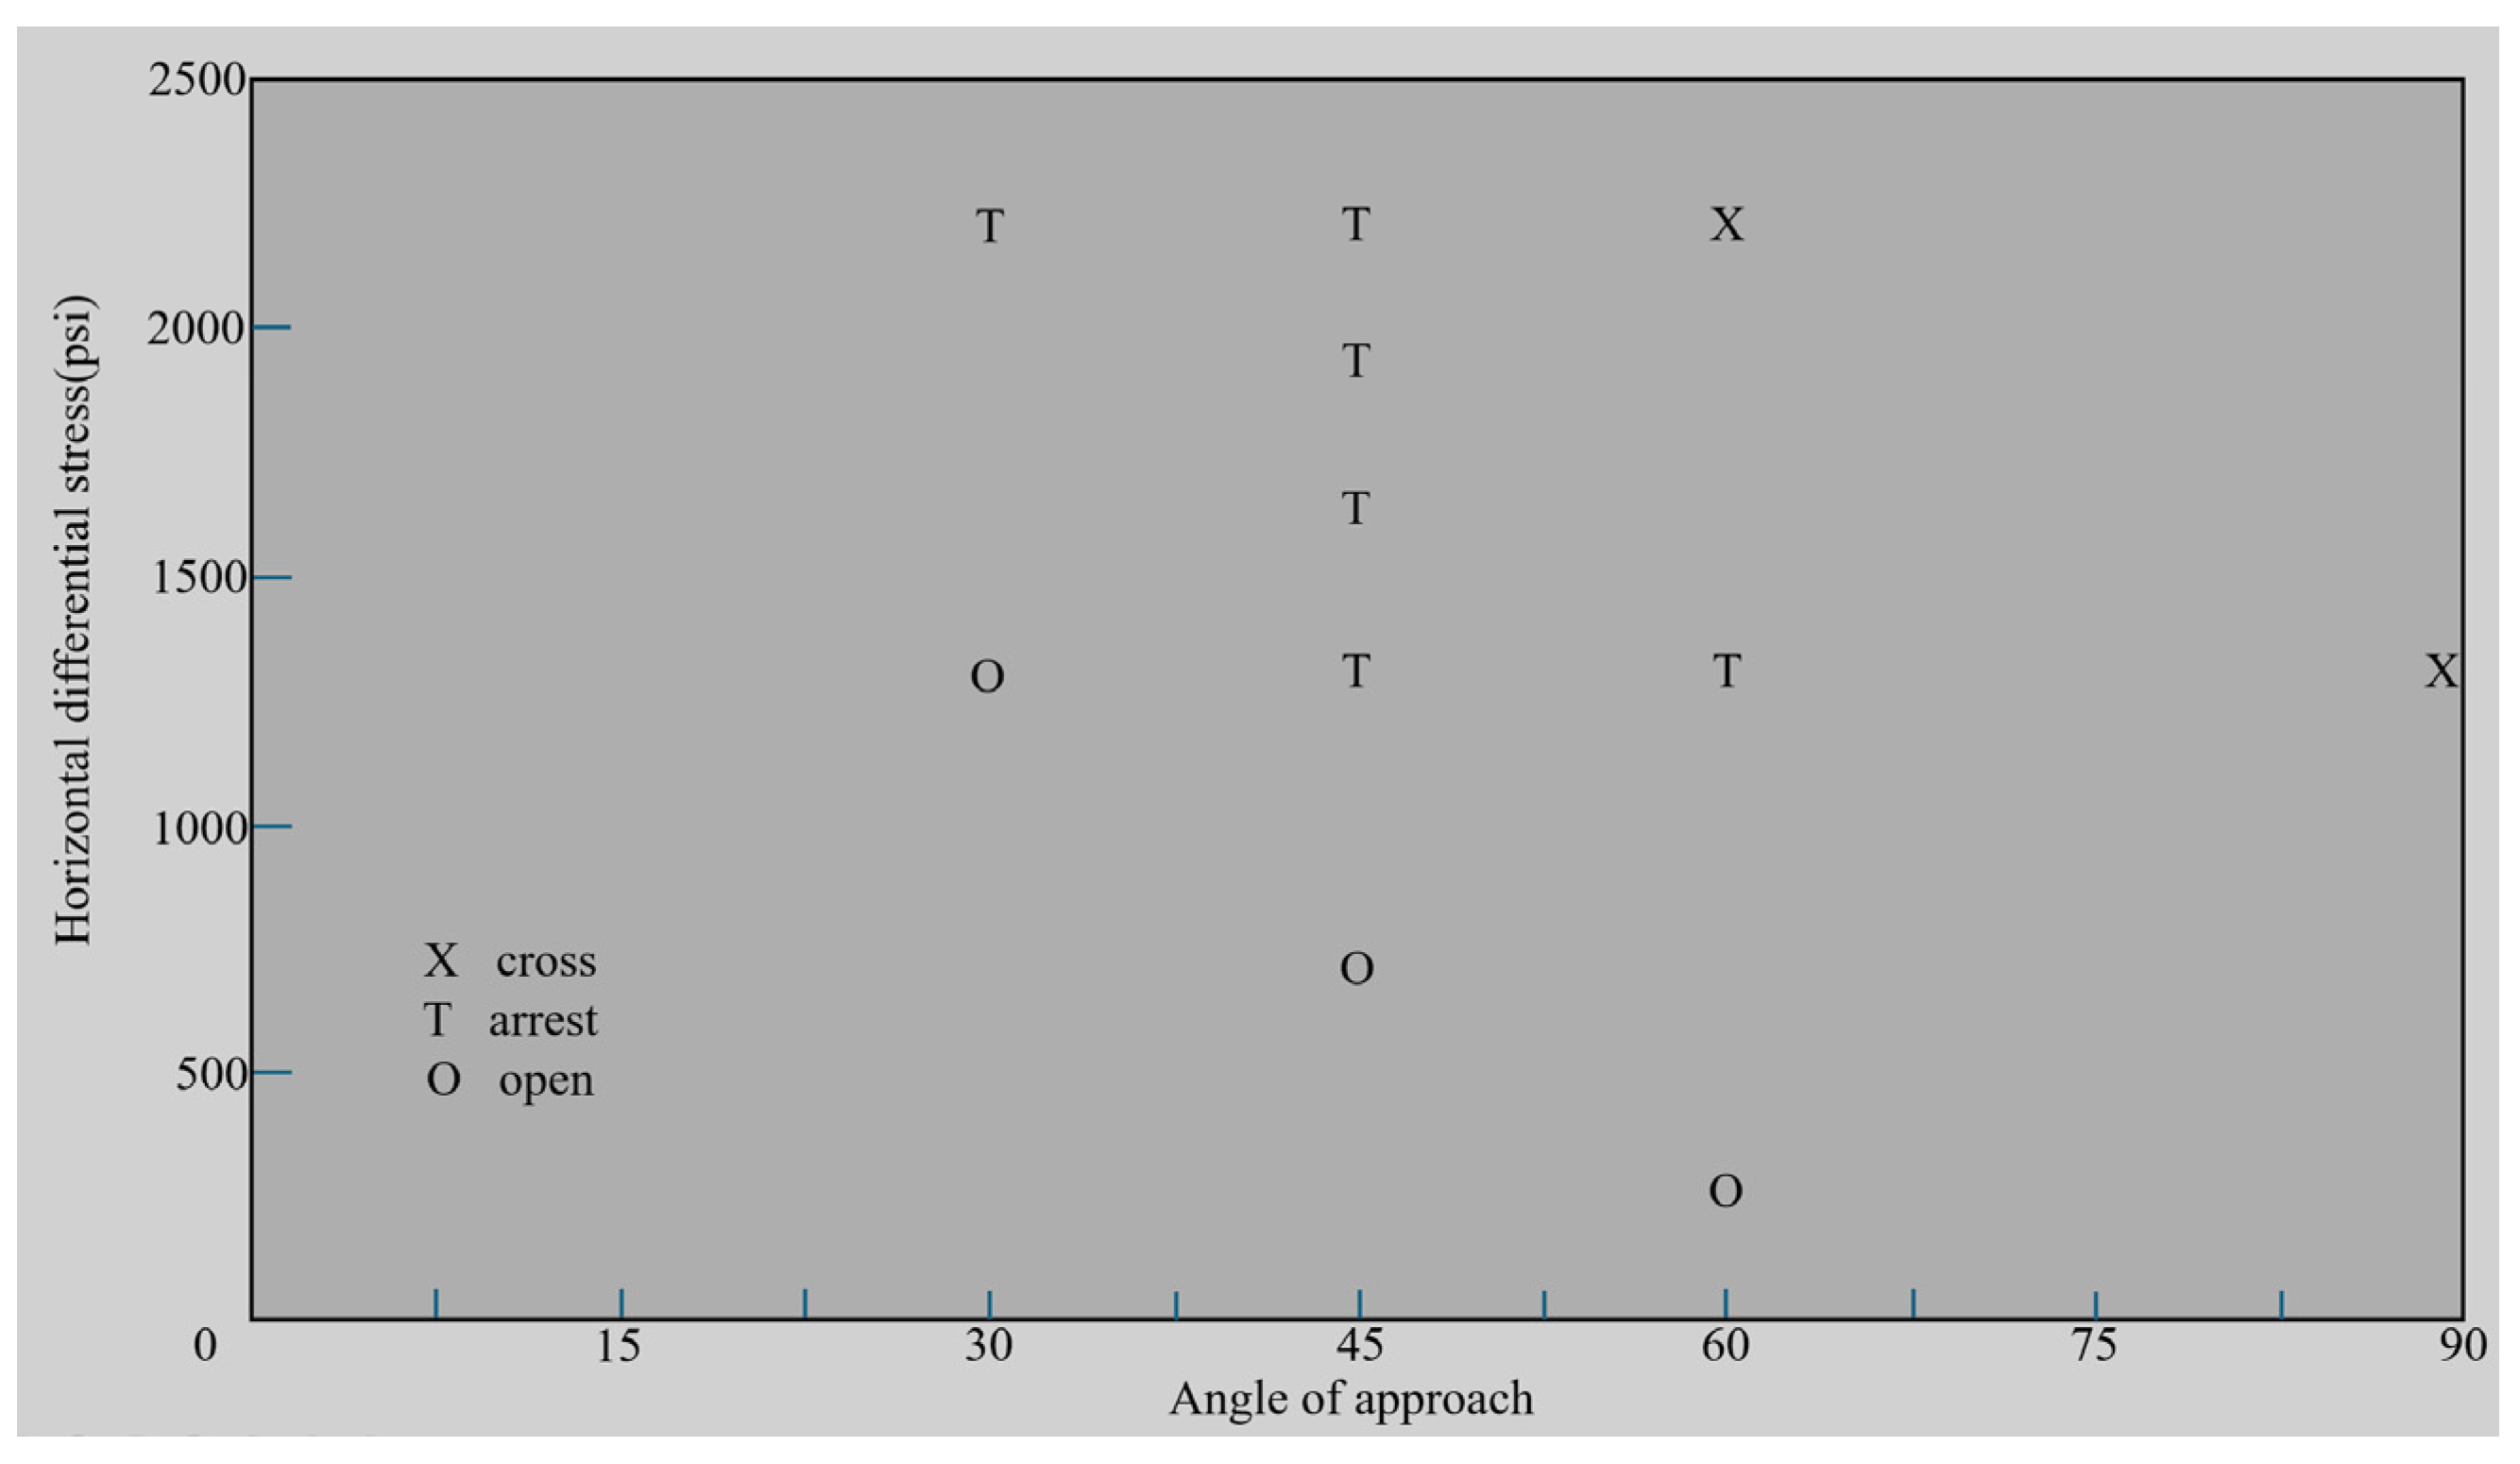
2.2.3. Numerical Model Validation

A numerical model was established on the basis of Blanton′s [27] indoor experiments as well as Zhang′s experiments [28], and compared with the experimental results to verify the correctness of the numerical model of fluid–solid coupling for fracturing extension of horizontal wells with natural fracture clusters in segmented sequential fracturing. The numerical simulation schematic is shown in Figure 7. The model size is 0.15 m × 0.15 m. The maximum and minimum horizontal principal stresses σH and y-axis are applied in the x-axis and y-axis directions, respectively, and the distance from the injection point to the fracturing preset natural fracture meets the requirement of S = L/sin θ. The figure shows the approximate angle of θ = L/sin θ, i.e., the distance from the injection point to the fractured preset natural fracture.
Figure 8 shows the numerical simulation results for an approximate angle θ = 60° and a horizontal stress difference Sd of 2 MPa. The natural fracture is opened, and the hydraulic fracture continues to expand along the natural fracture surface, with an obvious stress concentration at the intersection point. Overall, the numerical simulation results in this paper are in good agreement with the experimental results of Blanton shown in Figure 9, indicating that it is feasible to establish a fluid–solid coupling numerical model of fracture expansion to study the interaction law between hydraulic fracturing and natural fractures in segmented sequential fracturing horizontal wells enriched with natural fracture clusters.

2.3. Model Parameters

The Young′s modulus of the 7th Long Formation continental shale in the Ordos Basin is obtained as 18 GPa through uniaxial compression tests, with a Poisson′s ratio of 0.14. Other parameters of the continental shale oil reservoir in the model are determined through literature research [29,30]. These parameters are detailed in Table 2.

2.4. Boundary Condition Setup

In the model, boundary conditions with normal displacement set to zero are applied in the x and y directions to simulate the influence of the reservoir′s surrounding rock. Additionally, based on the actual geological conditions of the reservoir, an initial effective stress field and pore pressure field are applied to the model. The model parameters are provided in Table 2. After completing the fracturing of each section, the next section is fractured, with a total of 4 sections. The injection duration of the fracturing fluid is 40 s, and the pressure relief time is 5 s.
The sequential fracturing is performed from the toe section to the heel section of the horizontal well. This method is the most common on-site fracturing technique due to the ease of installing the packer and the simplicity of the process. Figure 10 illustrates the sequential fracturing process used in this simulation, with the numbers in the figure indicating the fracturing order. The numerical simulation scheme is set as the baseline group, according to Table 2.

3. Numerical Simulation Study of Fracture Evolution in Horizontal Well Staged Fracturing

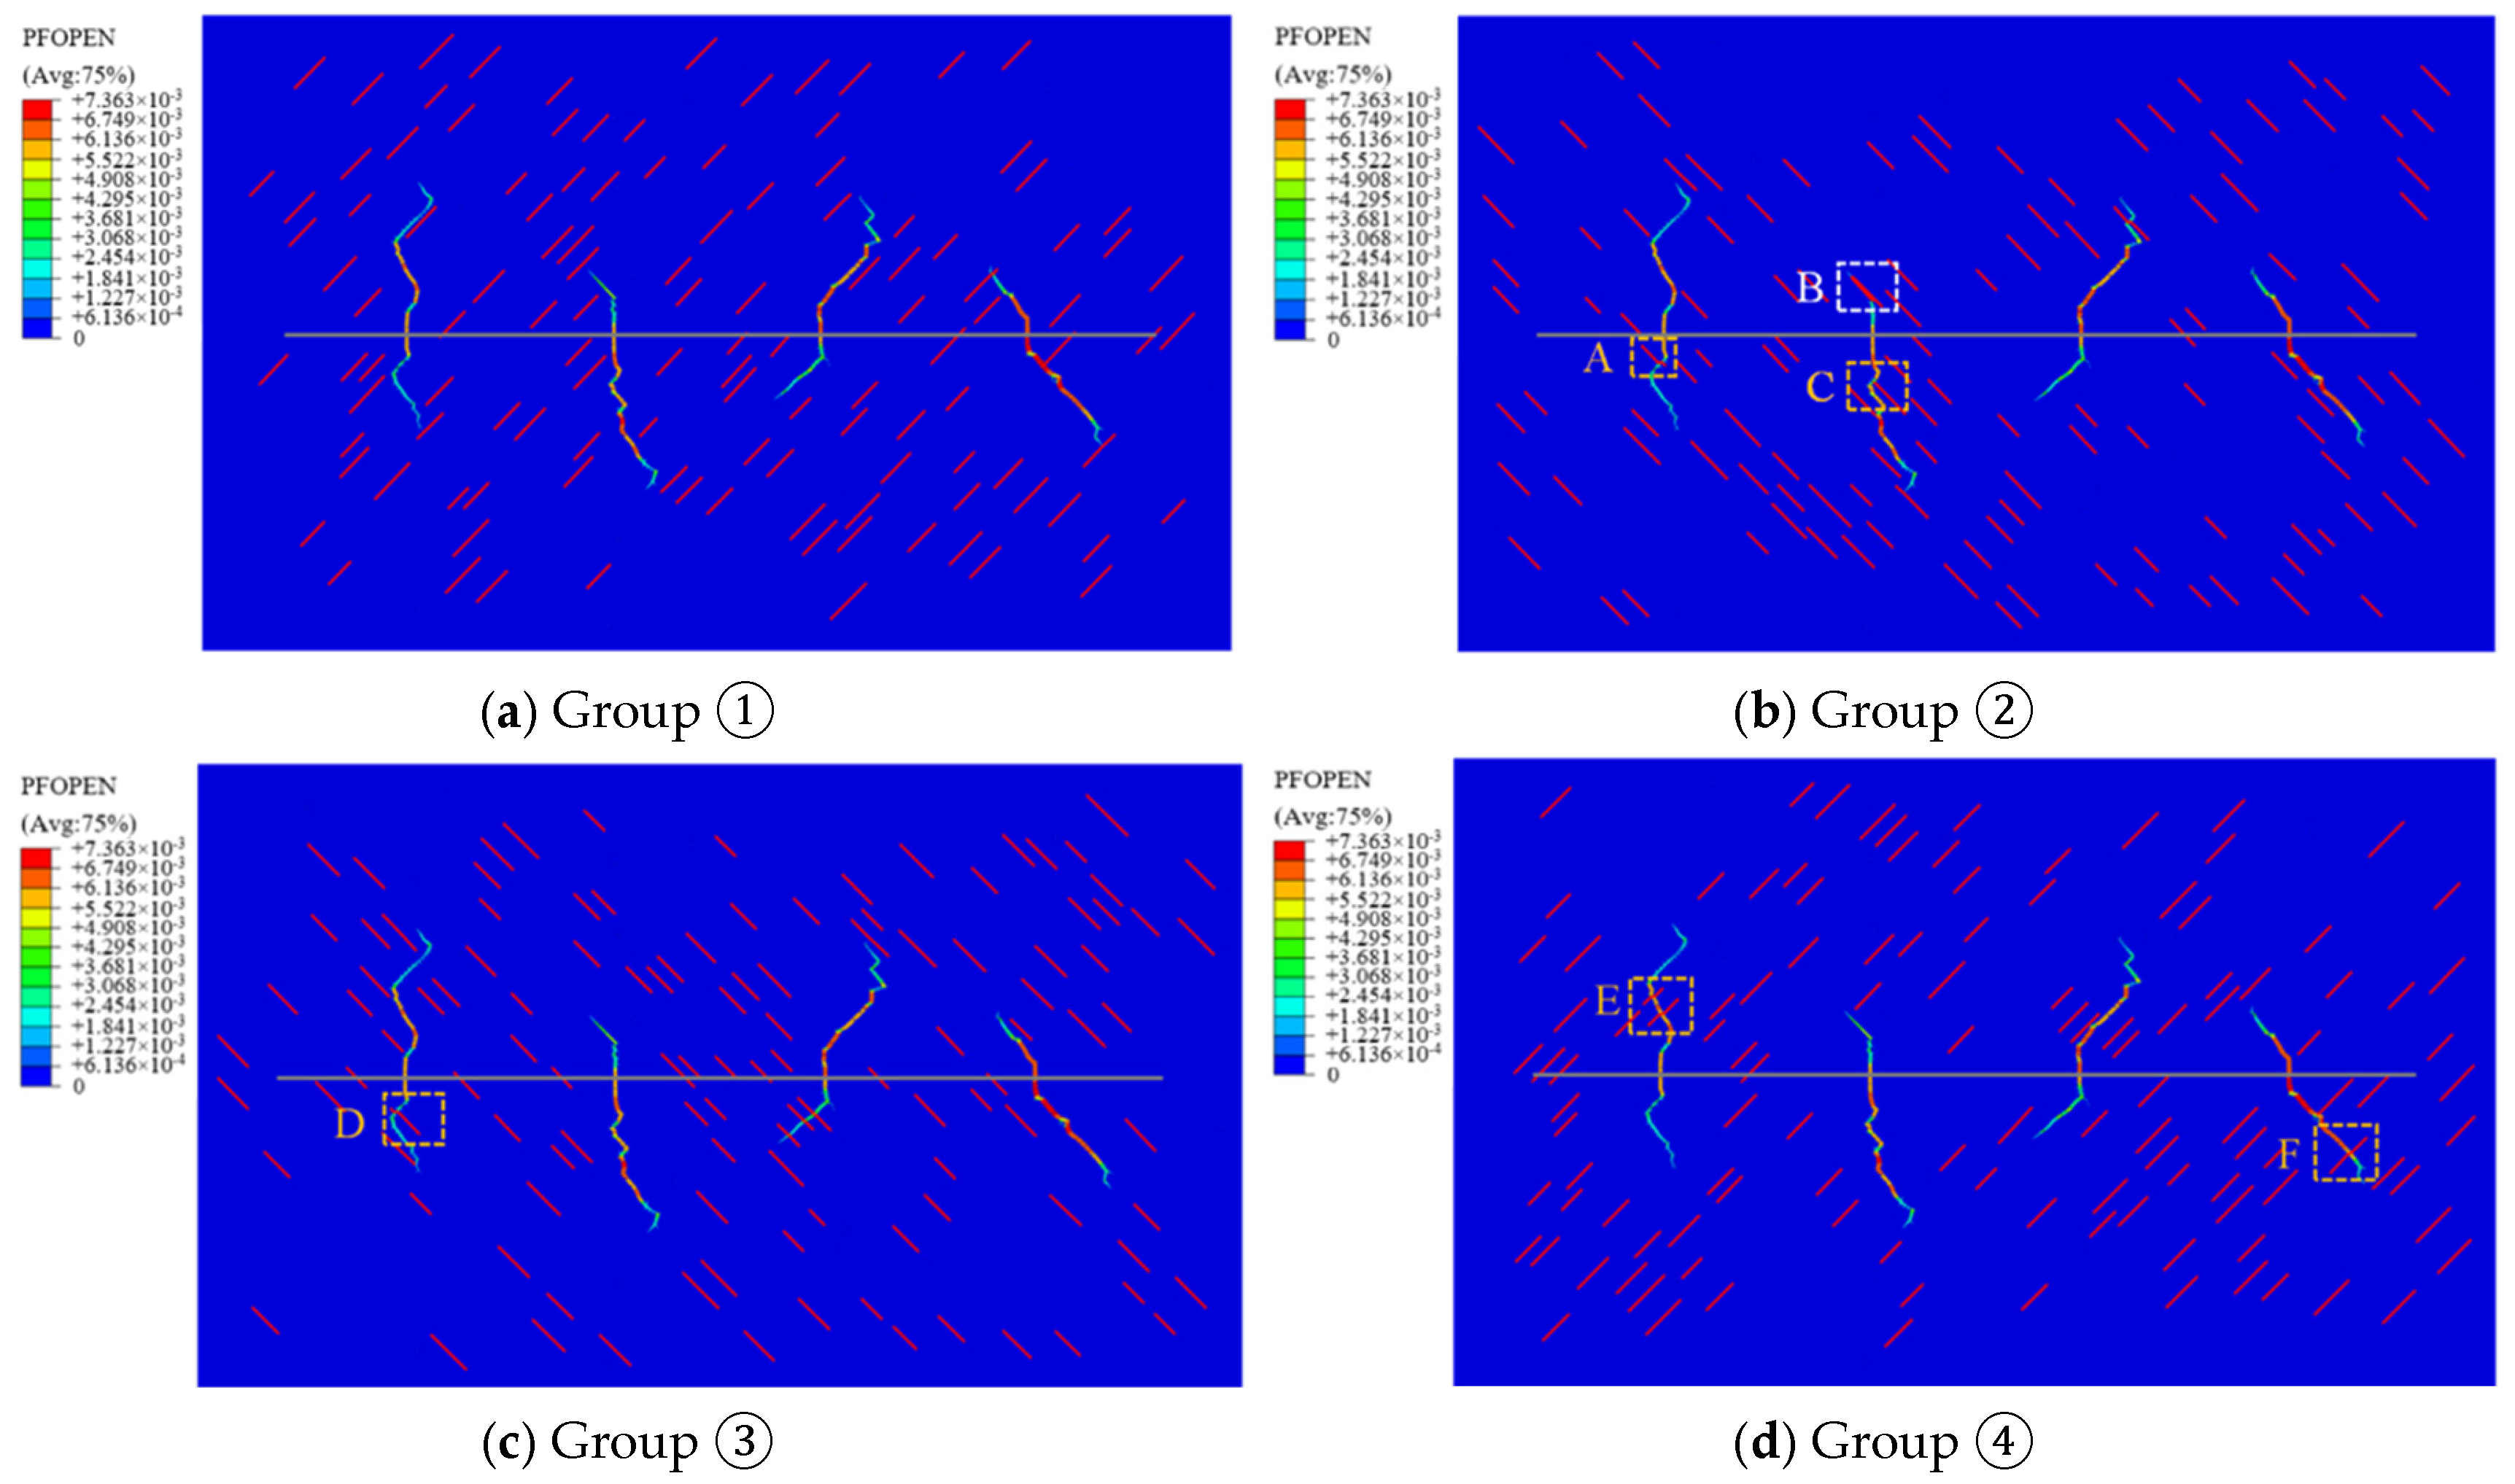
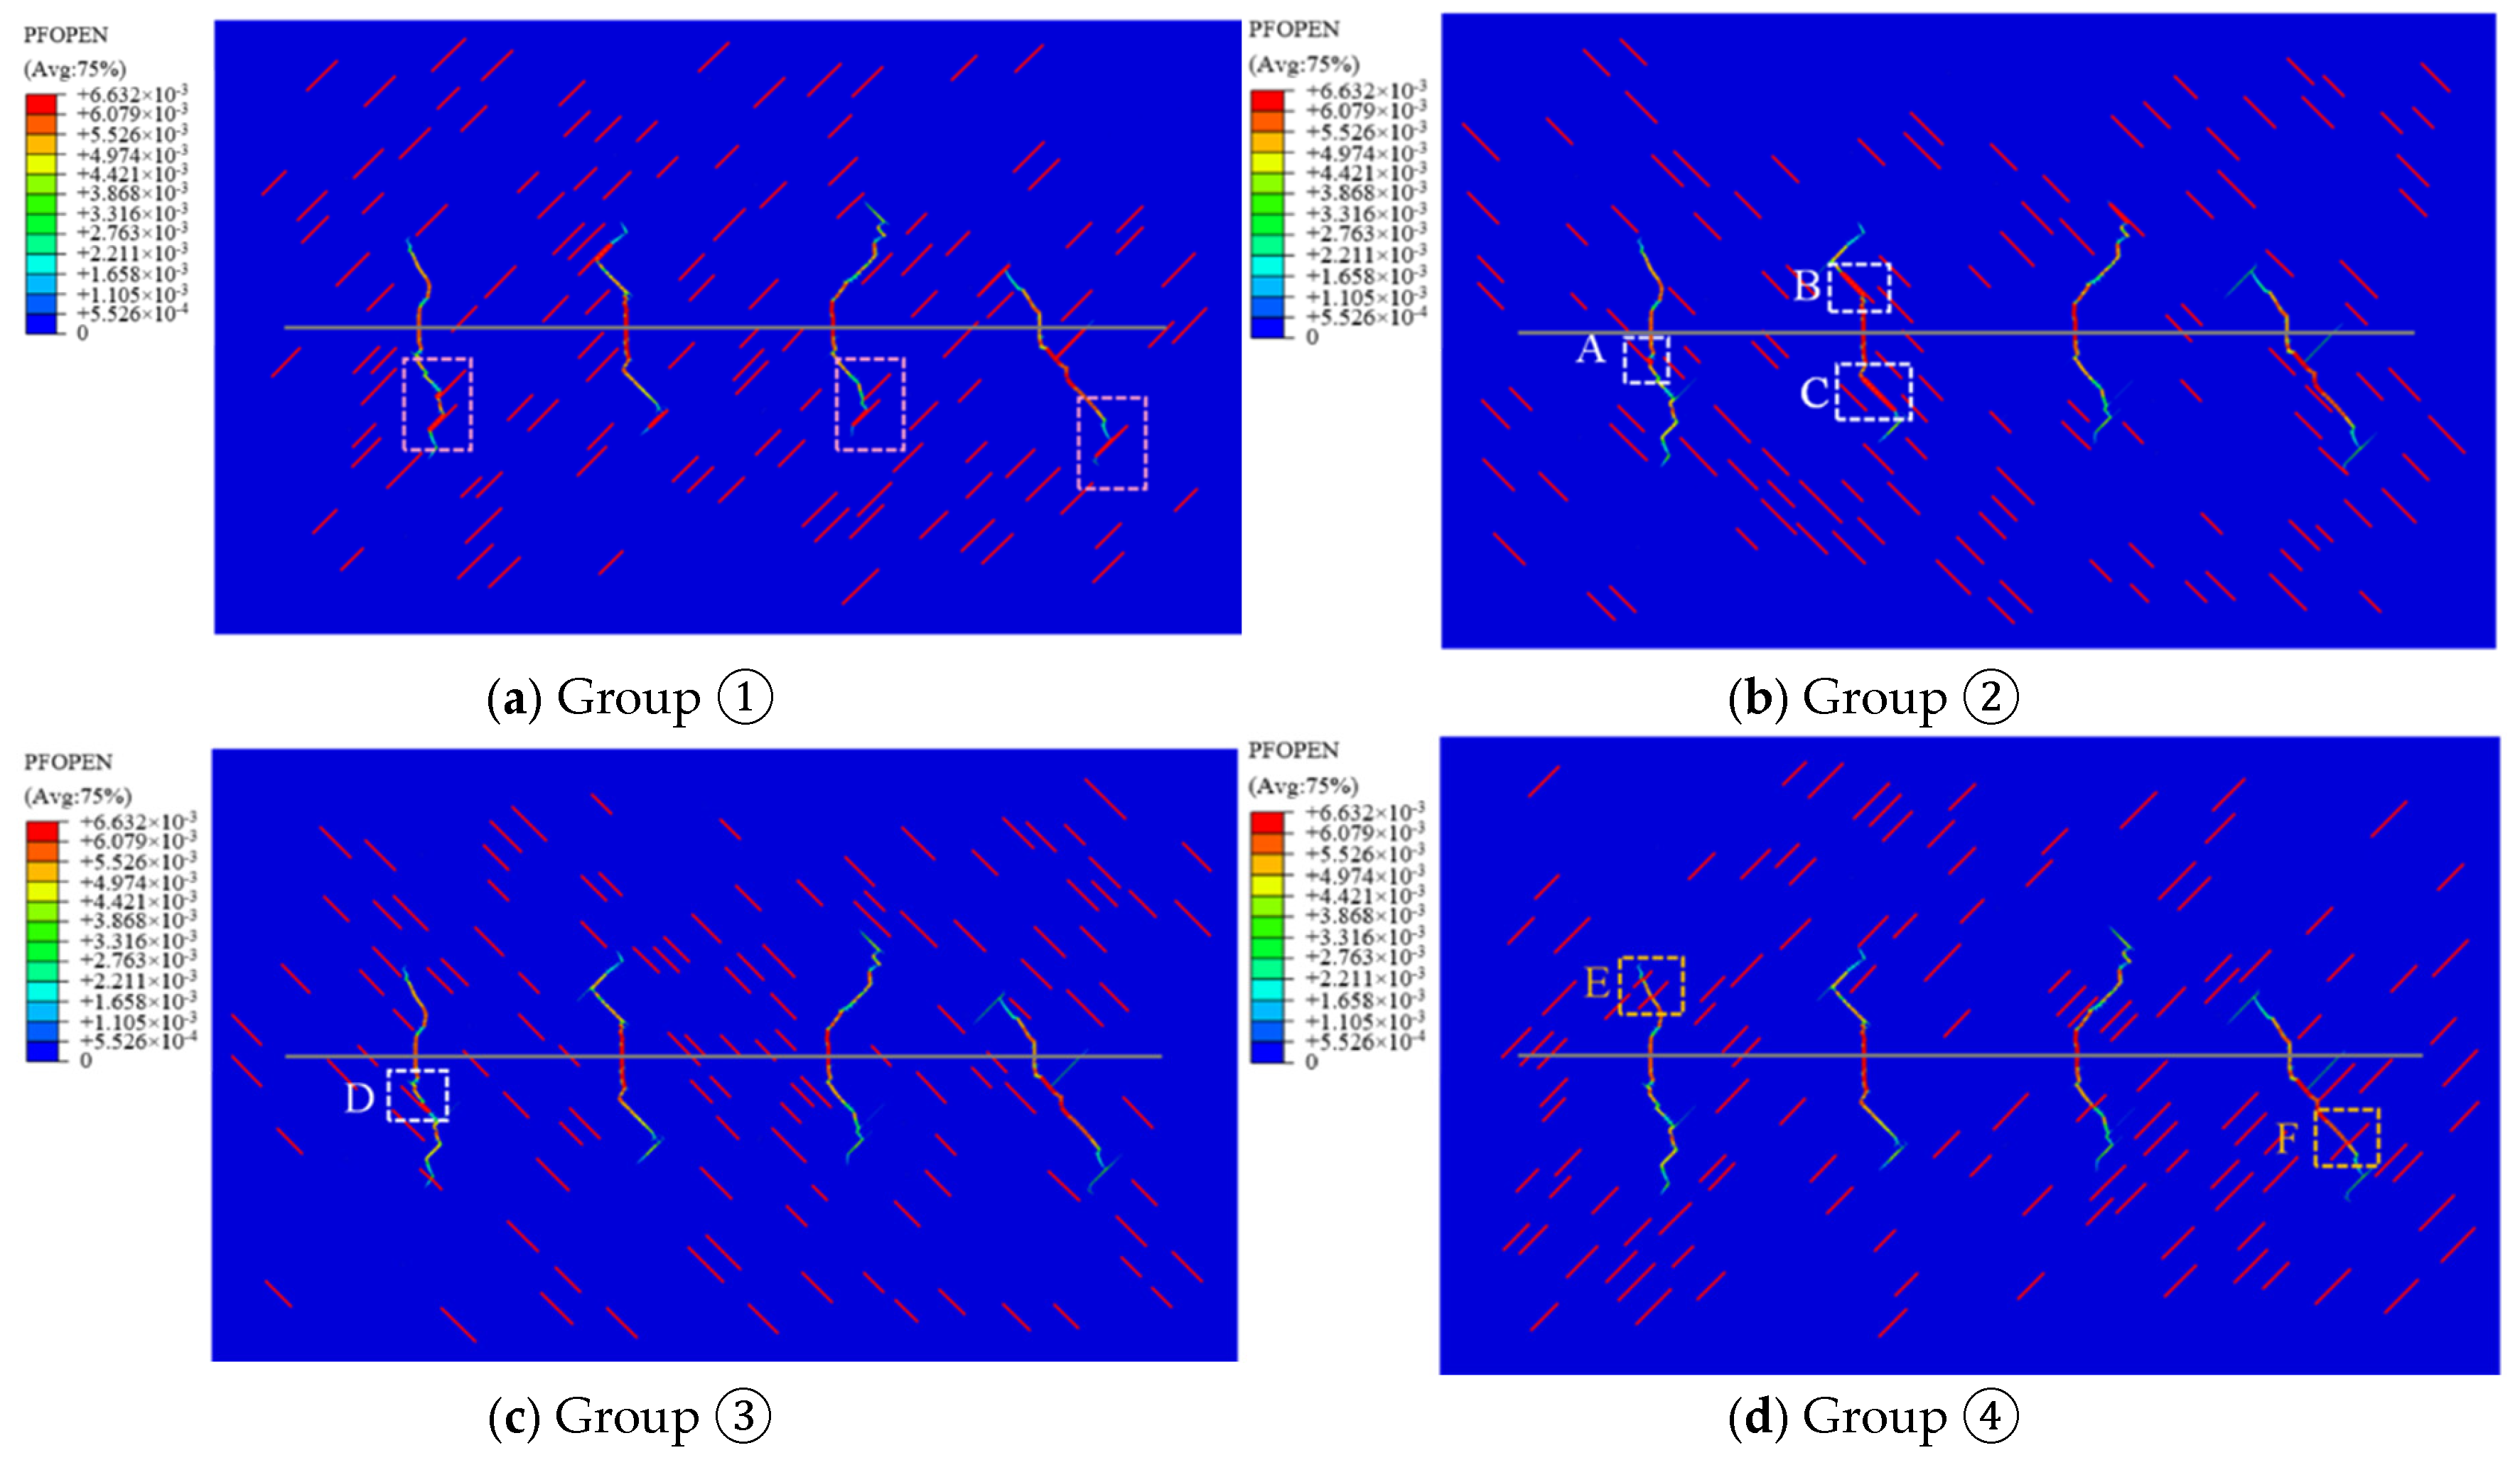
3.1. Evolution Mechanism of Fracture Network Under Different Natural Fracture Cementation Strength

Through secondary development in Python, the cementation strength of each set of natural fractures can be individually set. The cementation strength coefficient, α, which is the ratio of the cementation strength of natural fractures to the cementation strength of the rock matrix, is defined [31]. The natural fracture cementation strength can be determined by defining the cementation strength coefficient. Three simulations were performed: #1: In this case, the cementation strength coefficient of the four sets of natural fractures is 0.4, simulating the fracture network evolution under weak cementation of natural fractures. #2: In this case, the cementation strength coefficient of the four sets of natural fractures is 0.9, simulating the fracture network evolution under strong cementation of natural fractures. #3: In this case, the cementation strength coefficients of the four sets of natural fractures are 0.1, 0.4, 0.7, and 0.9, simulating the fracture network evolution under random cementation strength.
Figure 10, Figure 11 and Figure 12 show the results of the interaction between hydraulic fractures and natural fractures under weak cementation, strong cementation, and random cementation strength conditions, respectively. Six fixed observation areas on the model, labeled A to F, were selected for analysis. The communication between hydraulic fractures and natural fractures in these observation areas under different cementation strengths is compared. In Figure 10, the interaction results for areas A to F show communication with six natural fractures. In Figure 11, the interaction results for areas A to F show communication with one natural fracture, while five natural fractures remain uncommunicated. In Figure 12, the interaction results for areas A to F show communication with four natural fractures, while two natural fractures remain uncommunicated. For easier observation, the white box areas in the figures represent hydraulic fractures communicating with natural fractures, while the yellow box areas represent hydraulic fractures not communicating with natural fractures. The communication rate of natural fractures (the ratio of the number of natural fractures that communicated to the total number of natural fractures) was calculated for simulations #1, #2, and #3. The communication rates for #1, #2, and #3 were 5.25%, 0.25%, and 3.00%, respectively. It can be observed that natural fractures with weak cementation strength are more easily communicated, becoming pathways for hydraulic fracture propagation. In contrast, natural fractures with high cementation strength are more difficult to open, and hydraulic fractures are more likely to bypass natural fractures and propagate through other paths.
As shown in Figure 11, Figure 12 and Figure 13, when the cementation strength coefficient (α) is 0.4, the fracture network has a higher degree of tortuosity, and compared to the case where α is 0.9, the fracture network is more complex with a longer total fracture length. On the other hand, when α is 0.9, the fracture network is simpler, and the total fracture length is shorter. The pink boxes in the figures highlight the deflection results of natural fractures interacting with hydraulic fractures when the cementation strength is weaker. In summary, the lower cementation strength of natural fractures is conducive to the formation of complex fracture networks. Therefore, in reservoir stimulation, it is essential to fully consider the impact of natural fracture cementation strength on fracturing effectiveness to develop a reasonable construction plan.

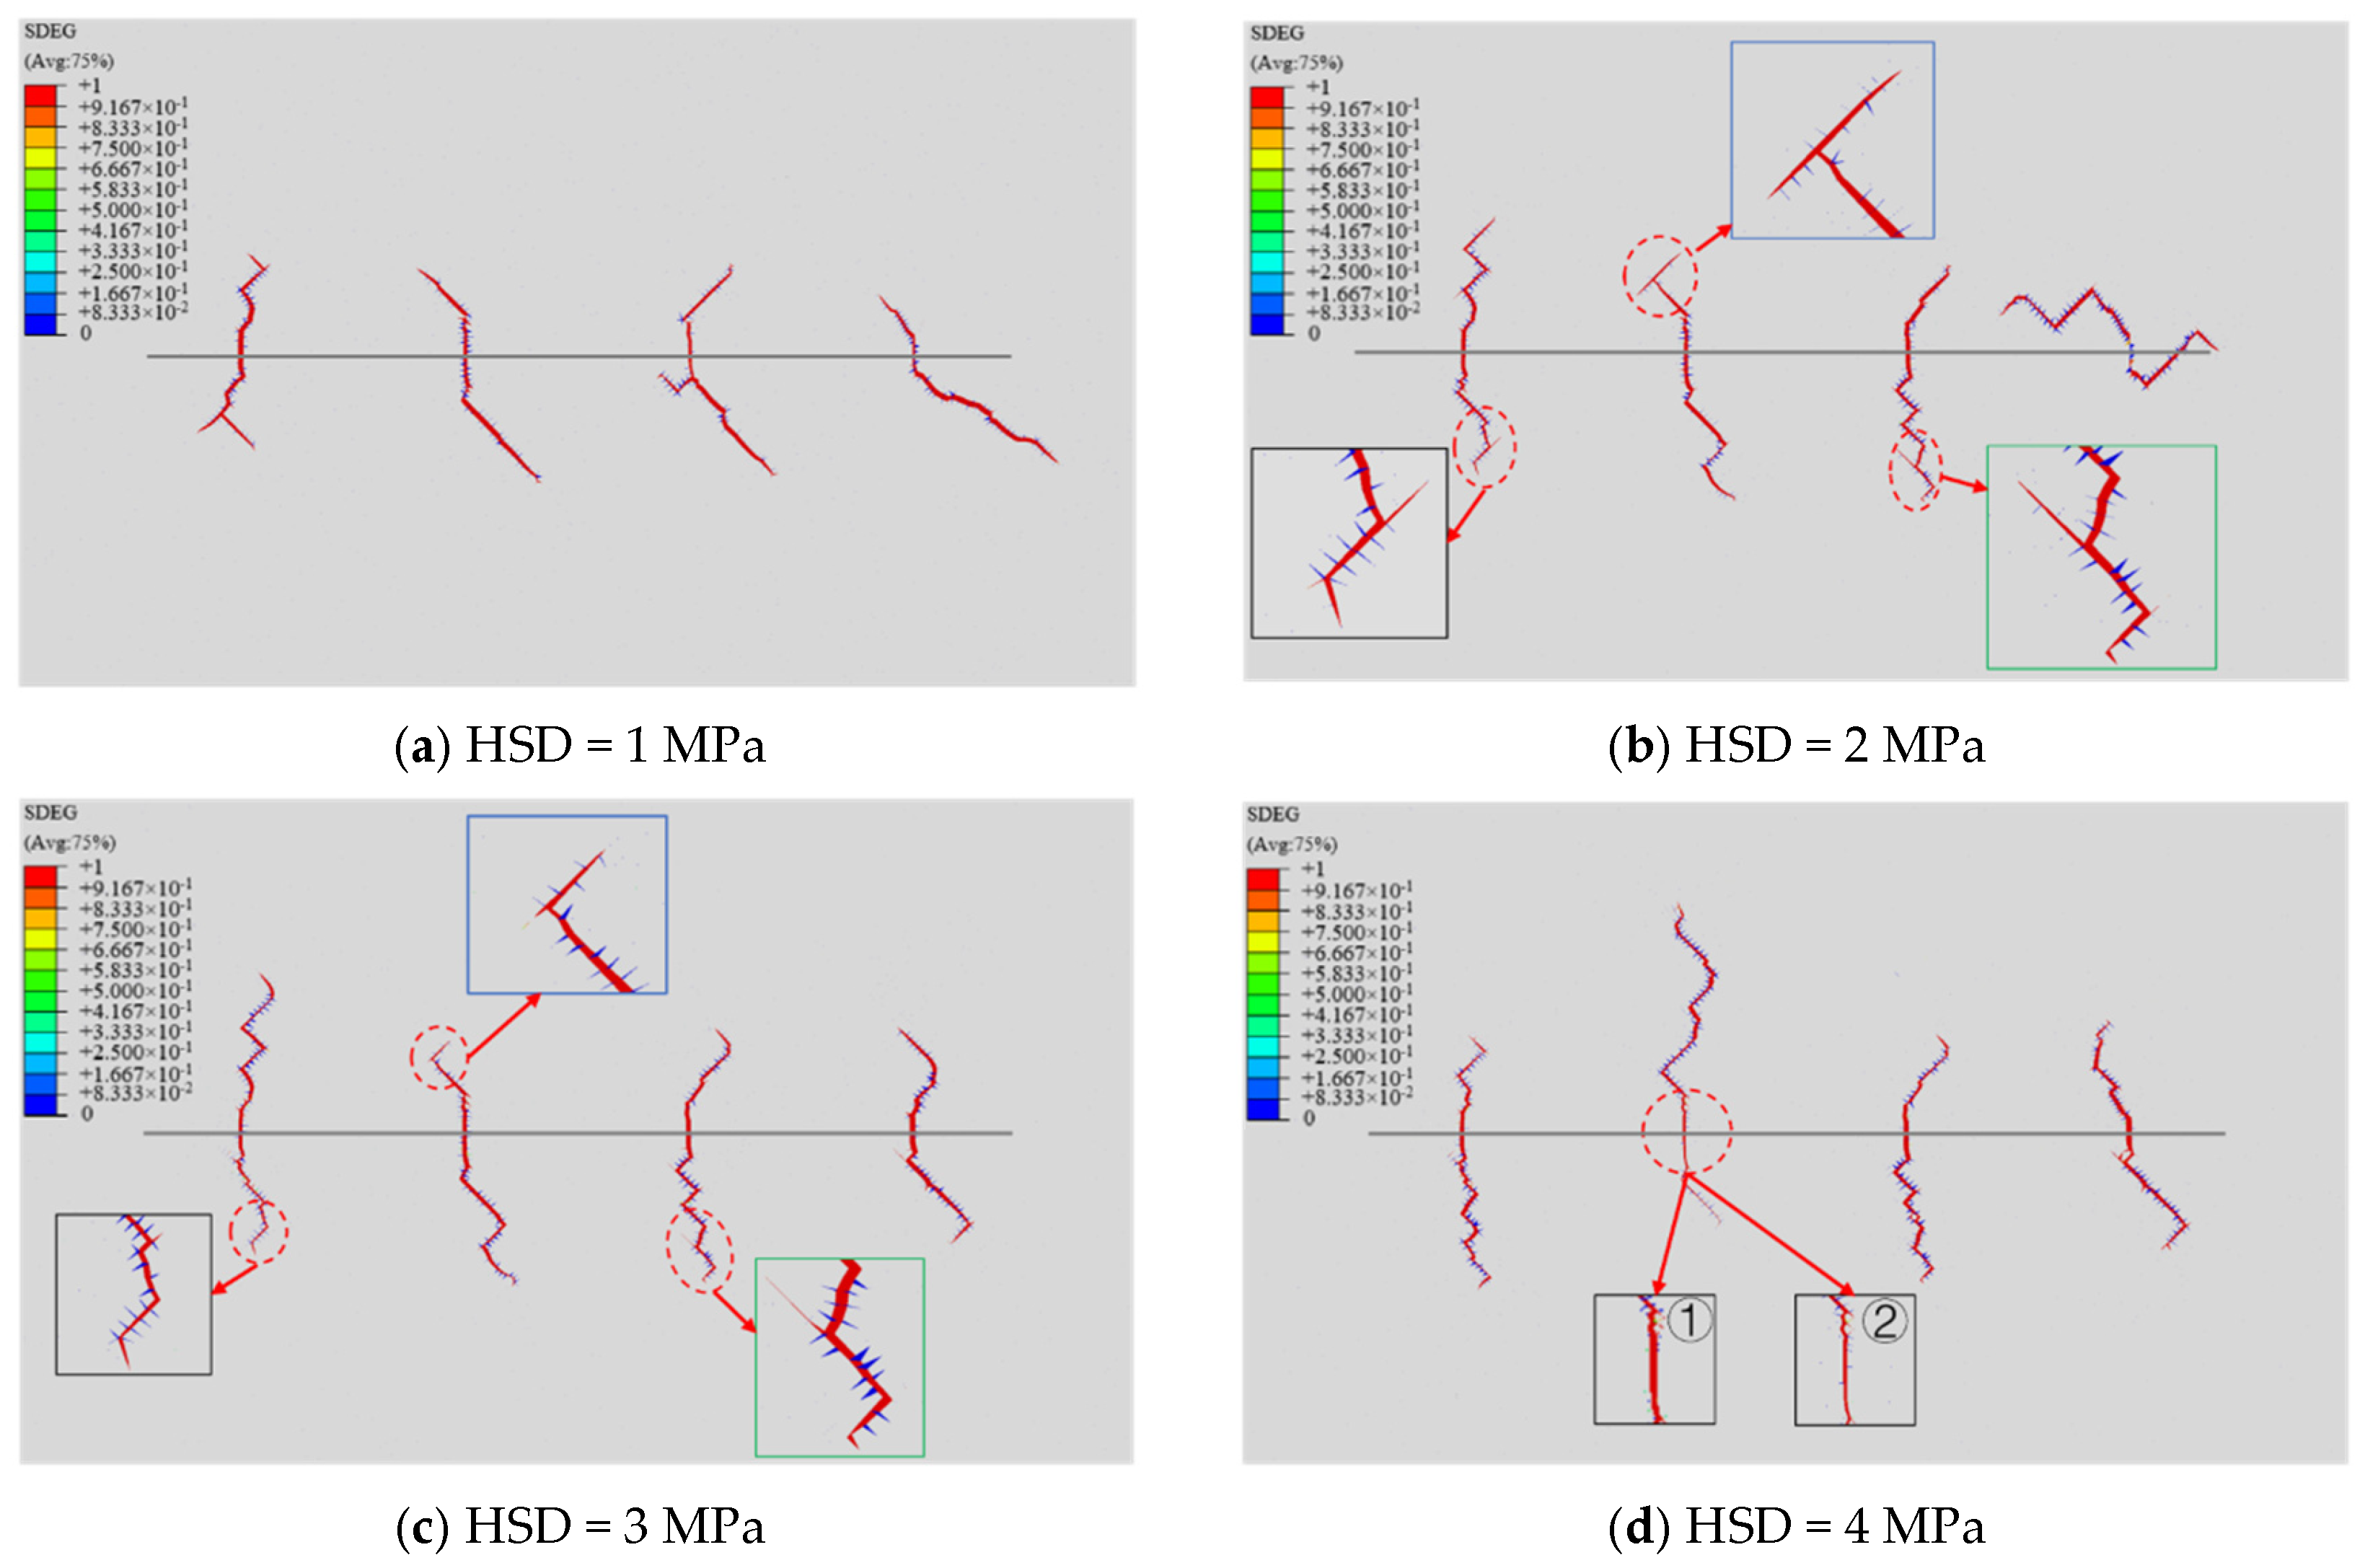
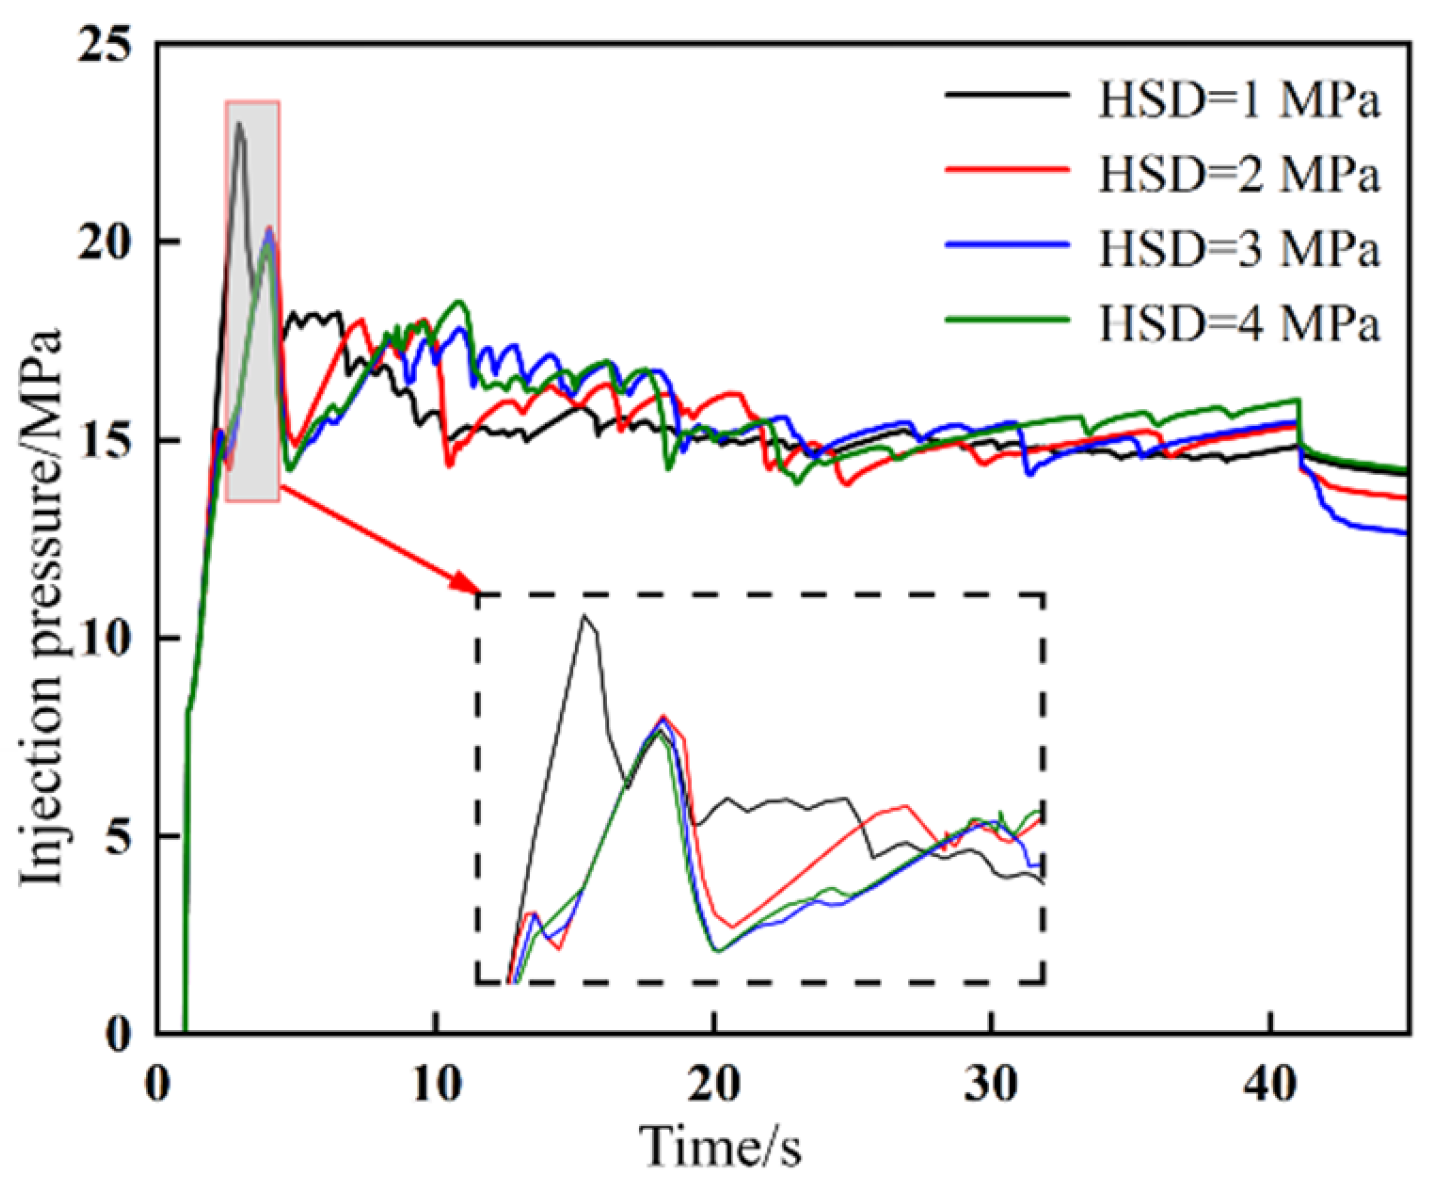
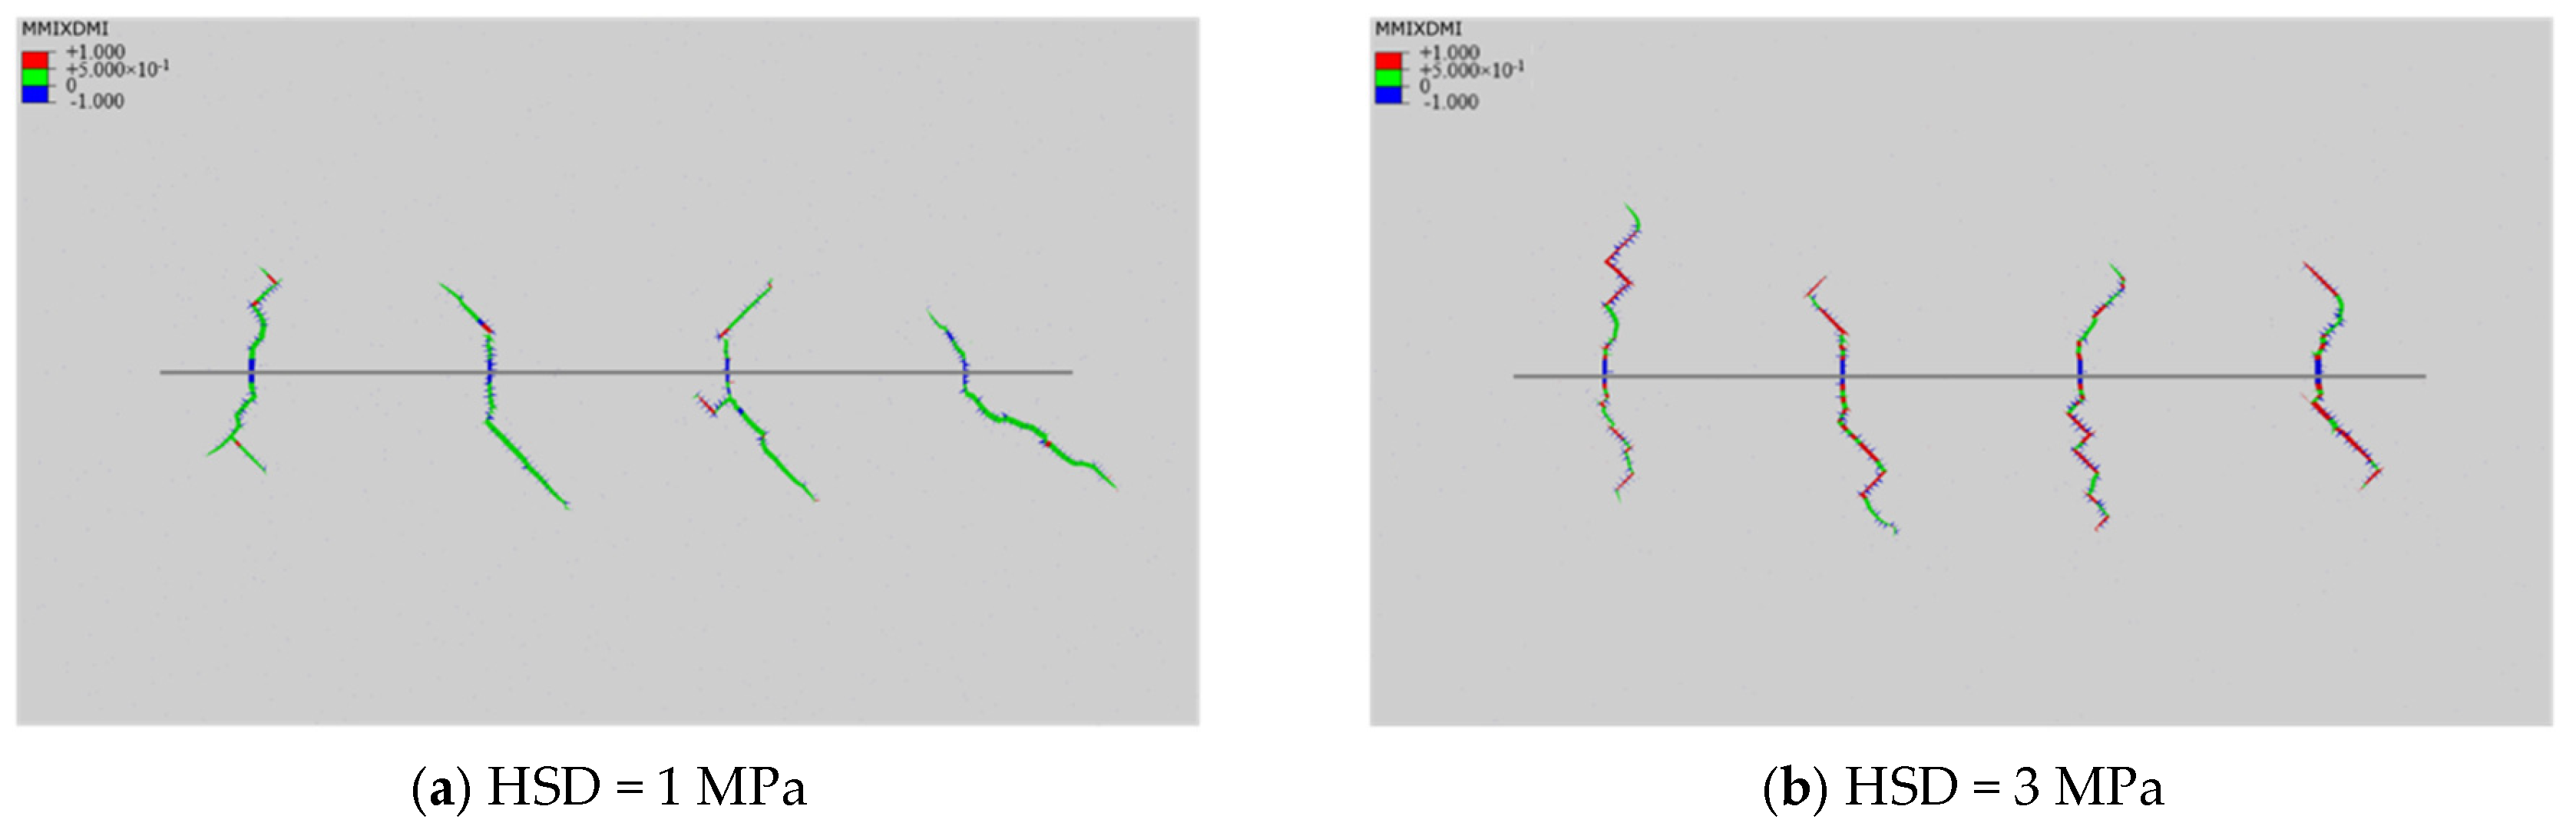
3.2. The Fracture Network Evolution Mechanism Under Different Horizontal Stress Differences

The horizontal stress difference (HSD) in shale reservoirs plays a crucial role in determining whether a complex fracture network can form during the fracturing process. Keeping other key parameters constant, the minimum horizontal principal stress is set at 8 MPa. Based on this, the maximum horizontal principal stress is adjusted to simulate the fracture network evolution under different horizontal stress differences, with specific values of 1 MPa, 2 MPa, 3 MPa, and 4 MPa.
From the simulation results (see Figure 14), it can be observed that when the horizontal stress difference (HSD) is 1 MPa, the influence of natural fractures on the fracture network’s expansion trajectory is more noticeable, causing the fracture initiation and expansion directions to be more random. As a result, the fracture network shape is difficult to predict, and a small number of branching fractures appear within the network. When the horizontal stress difference increases to 2 MPa, the first three fractures align with the direction of the maximum horizontal principal stress. The stress difference is still relatively small, and the fourth hydraulic fracture is significantly influenced by the natural fracture network. Its expansion direction does not align with the maximum horizontal principal stress. Although the other three fractures are more curved, they do not form branching fractures, and the overall fracture shape is relatively simple—long and narrow. When the horizontal stress difference increases to 3 MPa, the first three hydraulic fractures are similar to those seen at 2 MPa, but the overall fracture length is slightly longer. The network′s general orientation aligns with the maximum horizontal principal stress. Comparing Figure 14b,c with the same colored boxes, it can be observed that when the stress difference is smaller, the hydraulic fractures first connect with the side of the natural fractures that form an obtuse angle, then continue expanding along the other side. More extension occurs along the weaker natural fractures. When the horizontal stress difference is larger, hydraulic fractures only communicate with the side of the natural fractures that form the obtuse angle. When the horizontal stress difference reaches 4 MPa, the overall fracture network length increases. In Figure 14d, comparing the black boxes, ① represents the fracture width at the initial expansion stage, while ② shows the fracture width at a later stage. It can be seen that the fracture width significantly narrows.
In summary, when the horizontal stress difference is smaller, hydraulic fractures are more likely to communicate with natural fractures. As the horizontal stress difference increases, the normal stress on the natural fracture faces increases, making it harder to initiate natural fractures. However, as the stress difference increases, the fractures extend more along the direction parallel to the maximum horizontal stress, leading to an overall increase in fracture length.
Figure 15 presents the injection pressure curves for the first-stage fracture during staged fracturing under varying horizontal in situ stress differentials. The results demonstrate that lower stress differentials correlate with higher peak injection pressures. This phenomenon arises because hydraulic fracture propagation must overcome the confining effect of the minimum horizontal principal stress. Larger stress differentials reduce the required energy to counteract this confinement, enabling more efficient fluid penetration and fracture extension, thereby producing elongated, narrow fractures. Conversely, smaller stress differentials intensify the resistance to fracture initiation, necessitating greater fluid volumes to overcome confinement, which increases fluid accumulation within fractures and elevates injection pressures, resulting in shorter but wider fracture geometries. Asymmetric fracture morphologies emerge due to heterogeneous confining stresses in surrounding formations. Post-processing routines extract fracture length and width parameters for quantitative analysis (Figure 16). The total fracture length increases by 29.92% as the stress differential rises from 1 MPa to 4 MPa, while the average width decreases by 11.88%. Notably, the length growth rate diminishes between 2 and 3 MPa due to reduced activation of interconnected natural fractures, though the primary fracture aligned with σHmax continues propagating. These findings conclusively establish a positive correlation between horizontal stress differentials and total fracture length.
The magnitude of horizontal in situ stress differential fundamentally governs rock failure mechanisms, predominantly dictating whether shear or tensile failure modes prevail. The failure mode of cohesive elements can be identified through the field output variable MMIXDMI, where MMIXDMI = −1 indicates intact cohesive elements (rendered blue in visualization), MMIXDMI = 0–0.5 corresponds to mixed-mode failure dominated by tensile rupture, and MMIXDMI = 0.5–1 represents mixed-mode failure with shear failure predominance.
As evidenced in Figure 17, fracture systems under smaller horizontal stress differentials exhibit tensile-dominated mixed failure mechanisms, while increased stress differentials promote shear-dominated failure patterns.
Young′s modulus (E), a critical parameter characterizing rock mechanical properties, exerts a significant influence on fracture network complexity. Holding other key parameters constant, simulations were conducted at Young′s modulus values of 16 GPa, 18 GPa, 21 GPa, and 24 GPa to investigate their impact on fracture network evolution.
Figure 18 demonstrates pronounced Young′s modulus dependence: increasing modulus correlates with enhanced fracture length and tortuosity, indicating a positive relationship between rock stiffness and fracture complexity. A higher Young′s modulus promotes intricate network development. Quantitative analysis of total fracture length and average aperture (Figure 19) reveals that elevating Young′s modulus from 16 GPa to 24 GPa increases total length by 57.68% while reducing average width by 29.51%. These results conclusively establish that an elevated Young′s modulus favors complex fracture network formation during hydraulic fracturing.

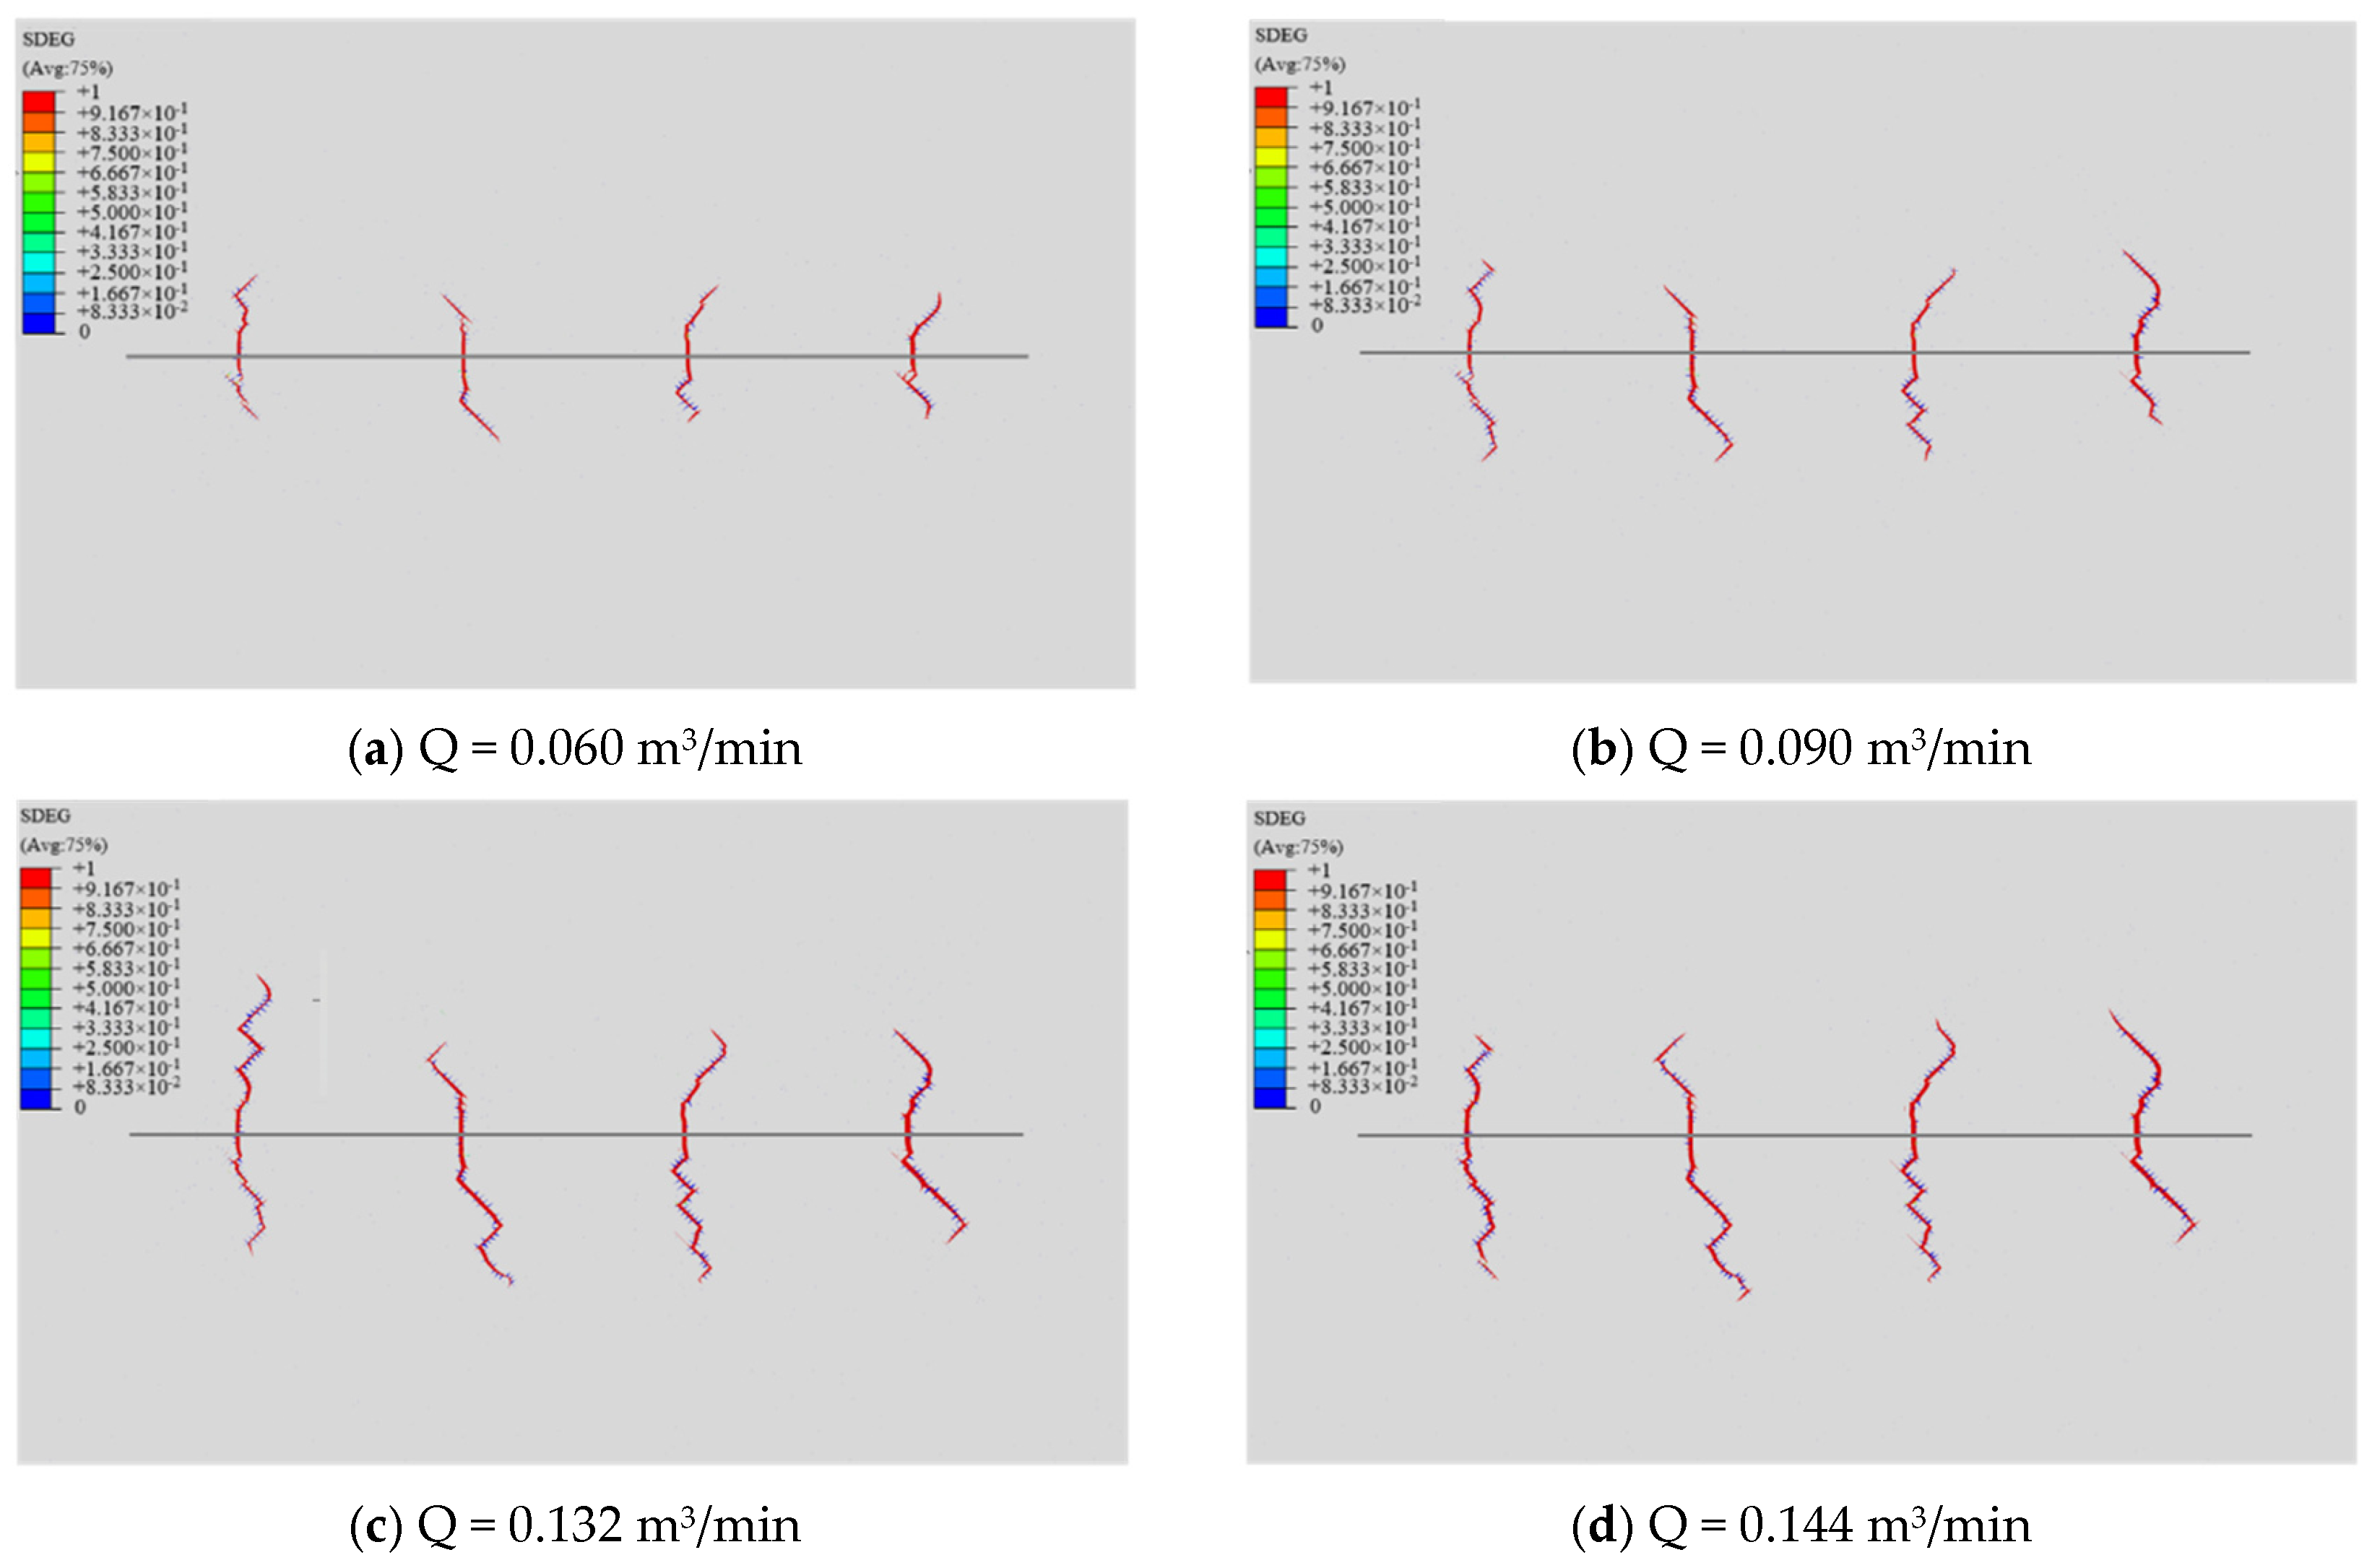
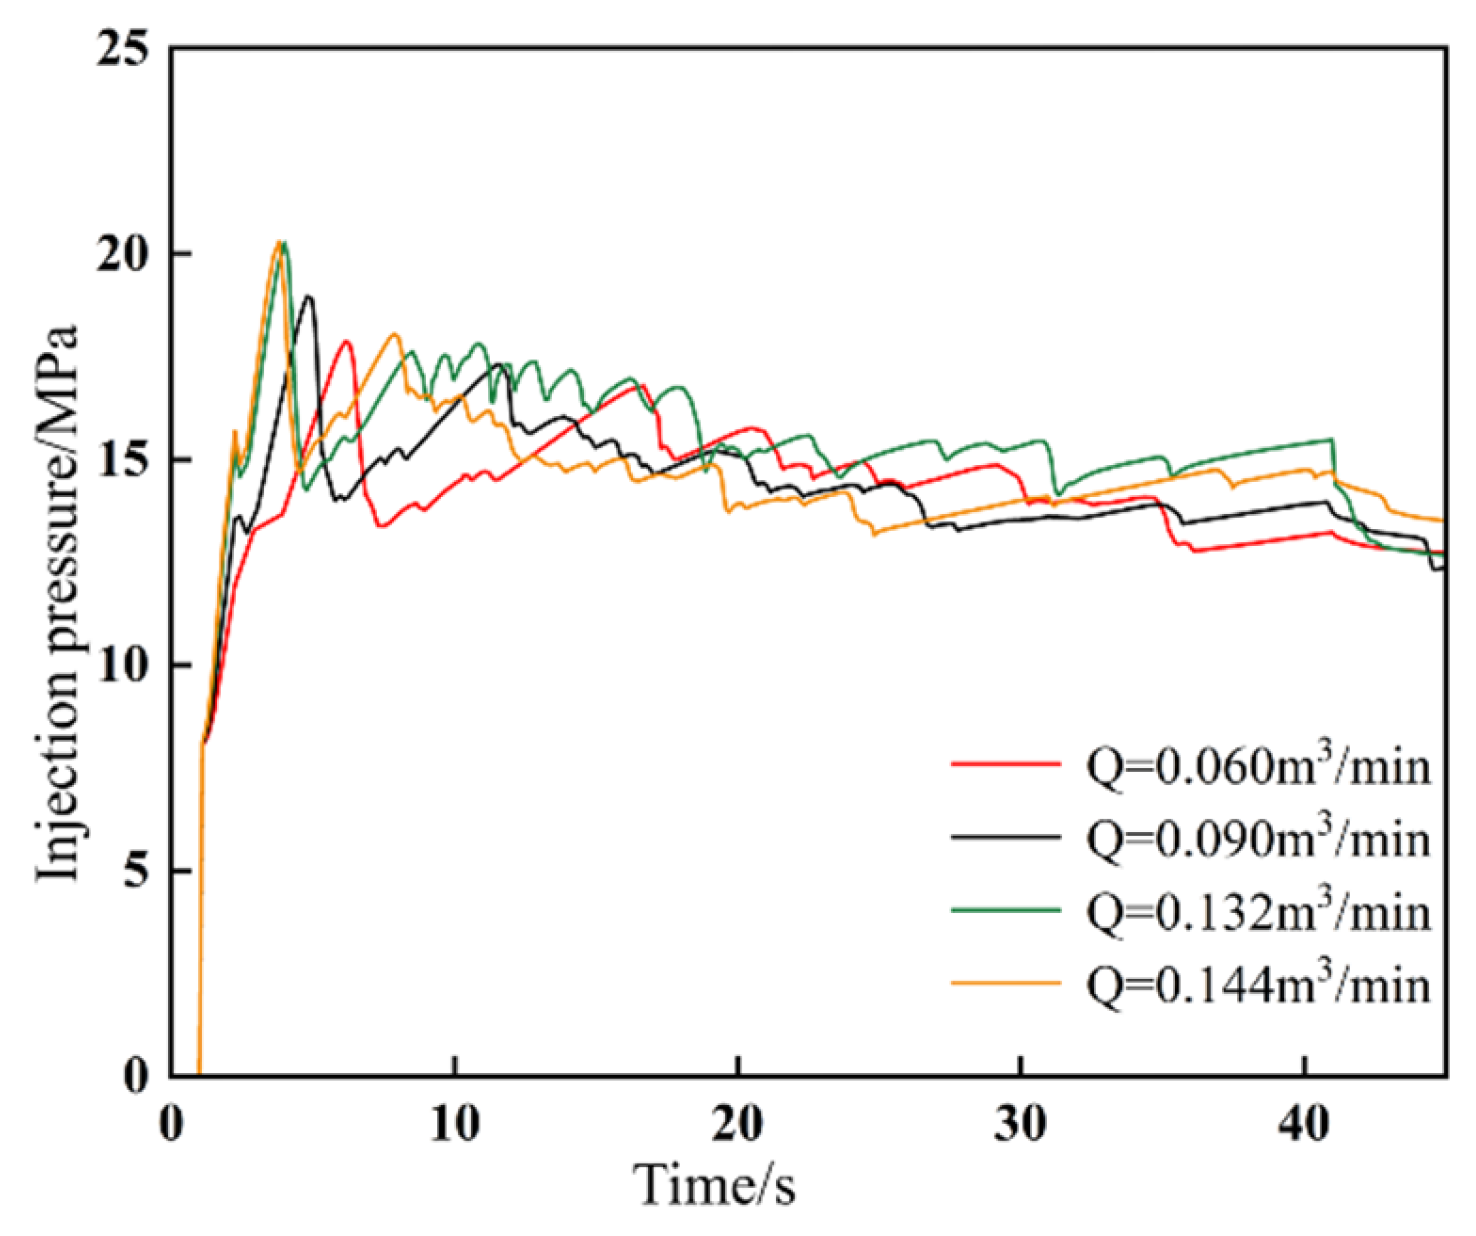
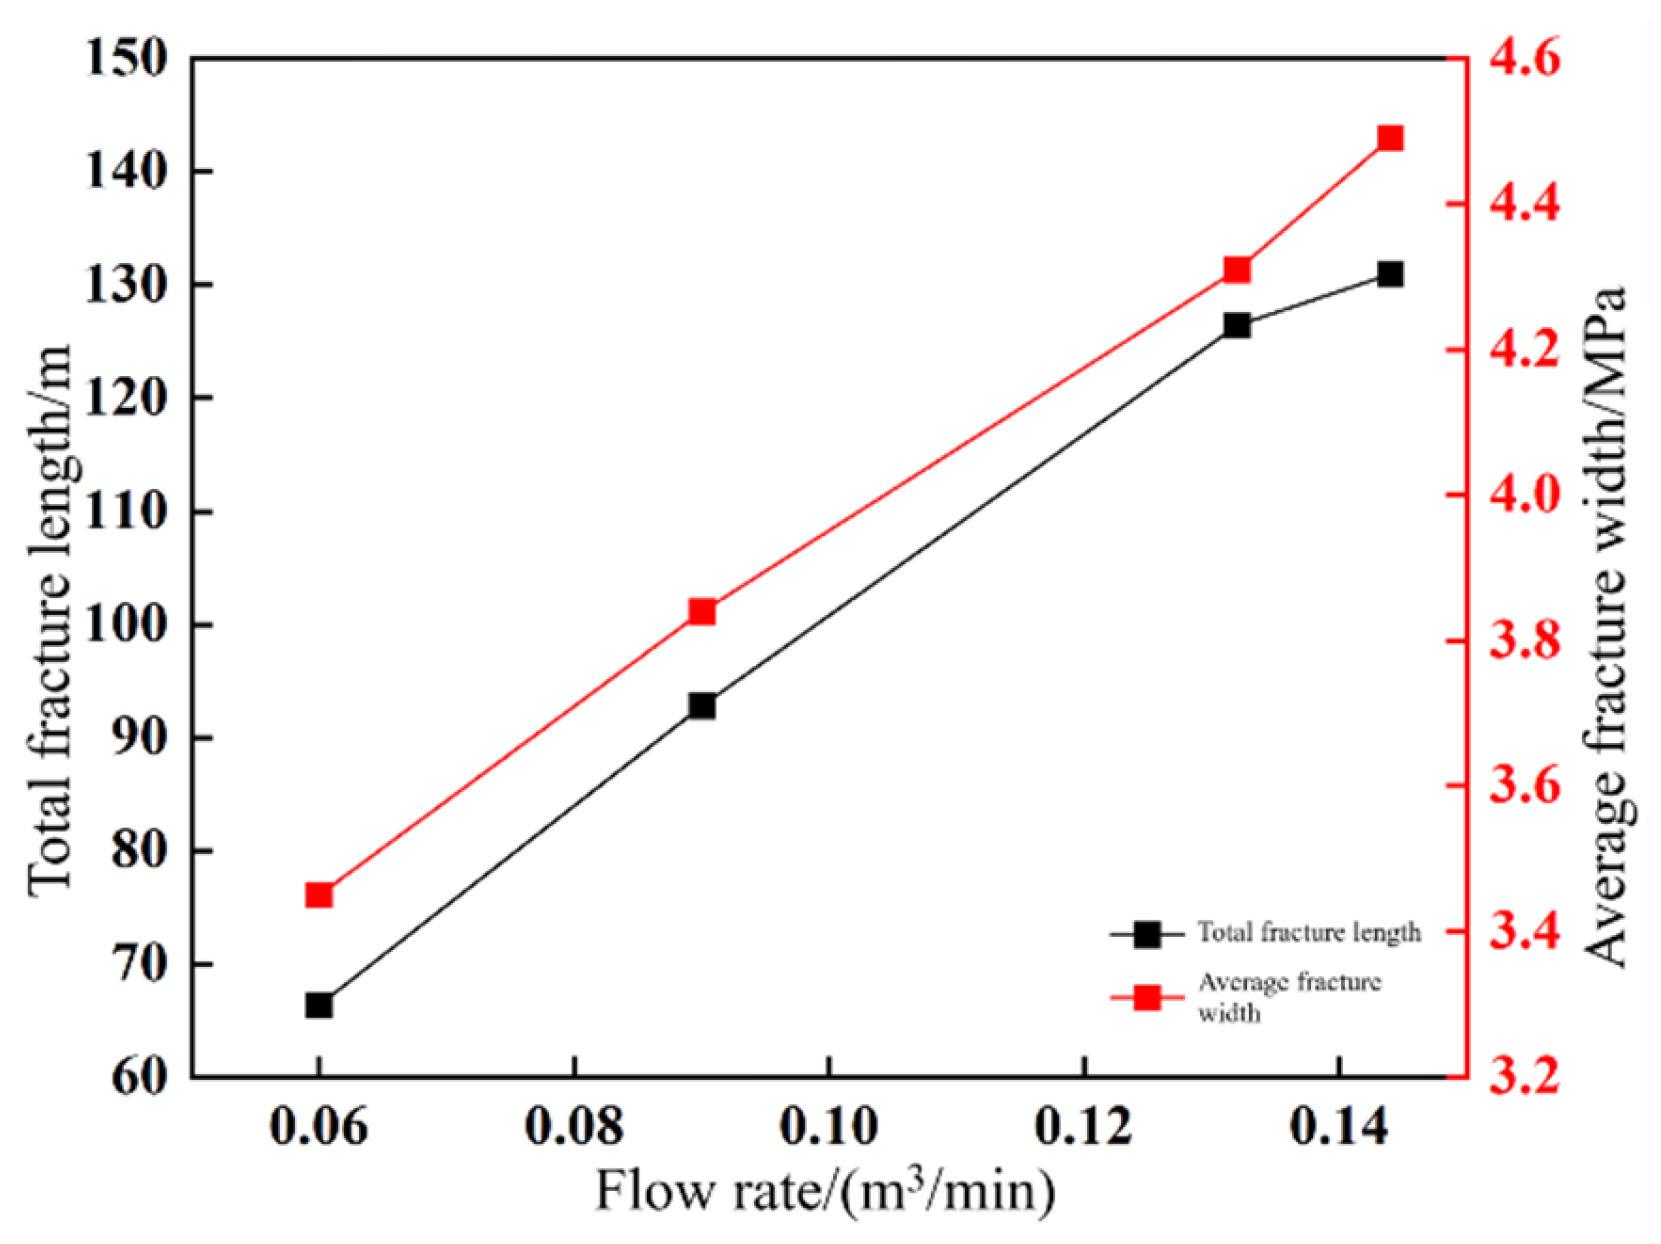
3.3. Fracture Network Evolution Mechanism Under Different Fracturing Fluid Displacement Rates

The injection rate (Q), a controllable operational parameter during hydraulic fracturing operations, significantly influences fracture propagation patterns by regulating the energy available for fracture extension. Maintaining constant geomechanical parameters, simulations were conducted at injection rates of 0.060 m3/min, 0.090 m3/min, 0.132 m3/min, and 0.144 m3/min to investigate fracture network evolution. As demonstrated in Figure 20, distinct fracture morphologies emerge under varying injection rates. With increasing injection rates, the fracture networks exhibit enhanced complexity and substantial length expansion. This trend arises from elevated fluid energy input promoting multi-branch fracturing and overcoming formation resistance.
Figure 21 illustrates the injection pressure curves for the first fracture during sequential fracturing under varying injection rates. The results demonstrate that higher injection rates reduce the time required to attain breakdown pressure while increasing both peak injection pressure and the sustained pressure for fracture propagation.
Figure 22 presents the total fracture length and average aperture under different injection rates. Increasing injection rates enhance both parameters, with total length growing from 66.36 m to 126.45 m (90.55% increase) and average aperture expanding from 3.45 mm to 4.31 mm (24.93% increase) as rates rise from 0.060 m3/min to 0.132 m3/min. This trend arises because elevated injection rates promote greater activation of natural fractures and more extensive propagation of primary fractures along the σHmax direction. Consequently, increased injection rates significantly improve stimulated reservoir volume (SRV) through enhanced fracture dimensions.

4. Discussion

This study conducts an in-depth investigation into fracture interference mechanisms and complex fracture network formation during staged fracturing of continental shale oil horizontal wells. A fluid–solid coupling numerical model simulating fracture propagation in sequentially fractured horizontal wells with natural fracture clusters was developed using a Python-based subroutine incorporating globally embedded zero-thickness cohesive elements. This model successfully captures hydraulic–natural fracture interactions and systematically analyzes competitive interference mechanisms under varying conditions of natural fracture cementation strength, horizontal in situ stress differentials, Young′s modulus, and fracturing fluid injection rates, yielding significant scientific insights.

5. Conclusions

This study establishes a fluid–solid coupling numerical model for fracture propagation in staged sequential fracturing of horizontal wells with natural fracture clusters, investigating competitive fracture interference mechanisms under varying conditions of natural fracture cementation strength, horizontal in situ stress differentials, Young′s modulus, and injection rates. Key conclusions are summarized as follows:
  • Natural fracture cementation strength: Weakly cemented natural fractures exhibit higher activation potential. Increasing the cementation strength coefficient from 0.4 to 0.9 reduces natural fracture communication probability by 5.0% and significantly decreases hydraulic fracture tortuosity.
  • Horizontal in situ stress differentials (Δσ): Higher stress differentials amplify normal stress on natural fractures, increasing fracture initiation resistance and promoting elongated, narrow fractures. Optimal production occurs at Δσ = 4 MPa, where fracture networks balance length-width ratios for maximized drainage efficiency.
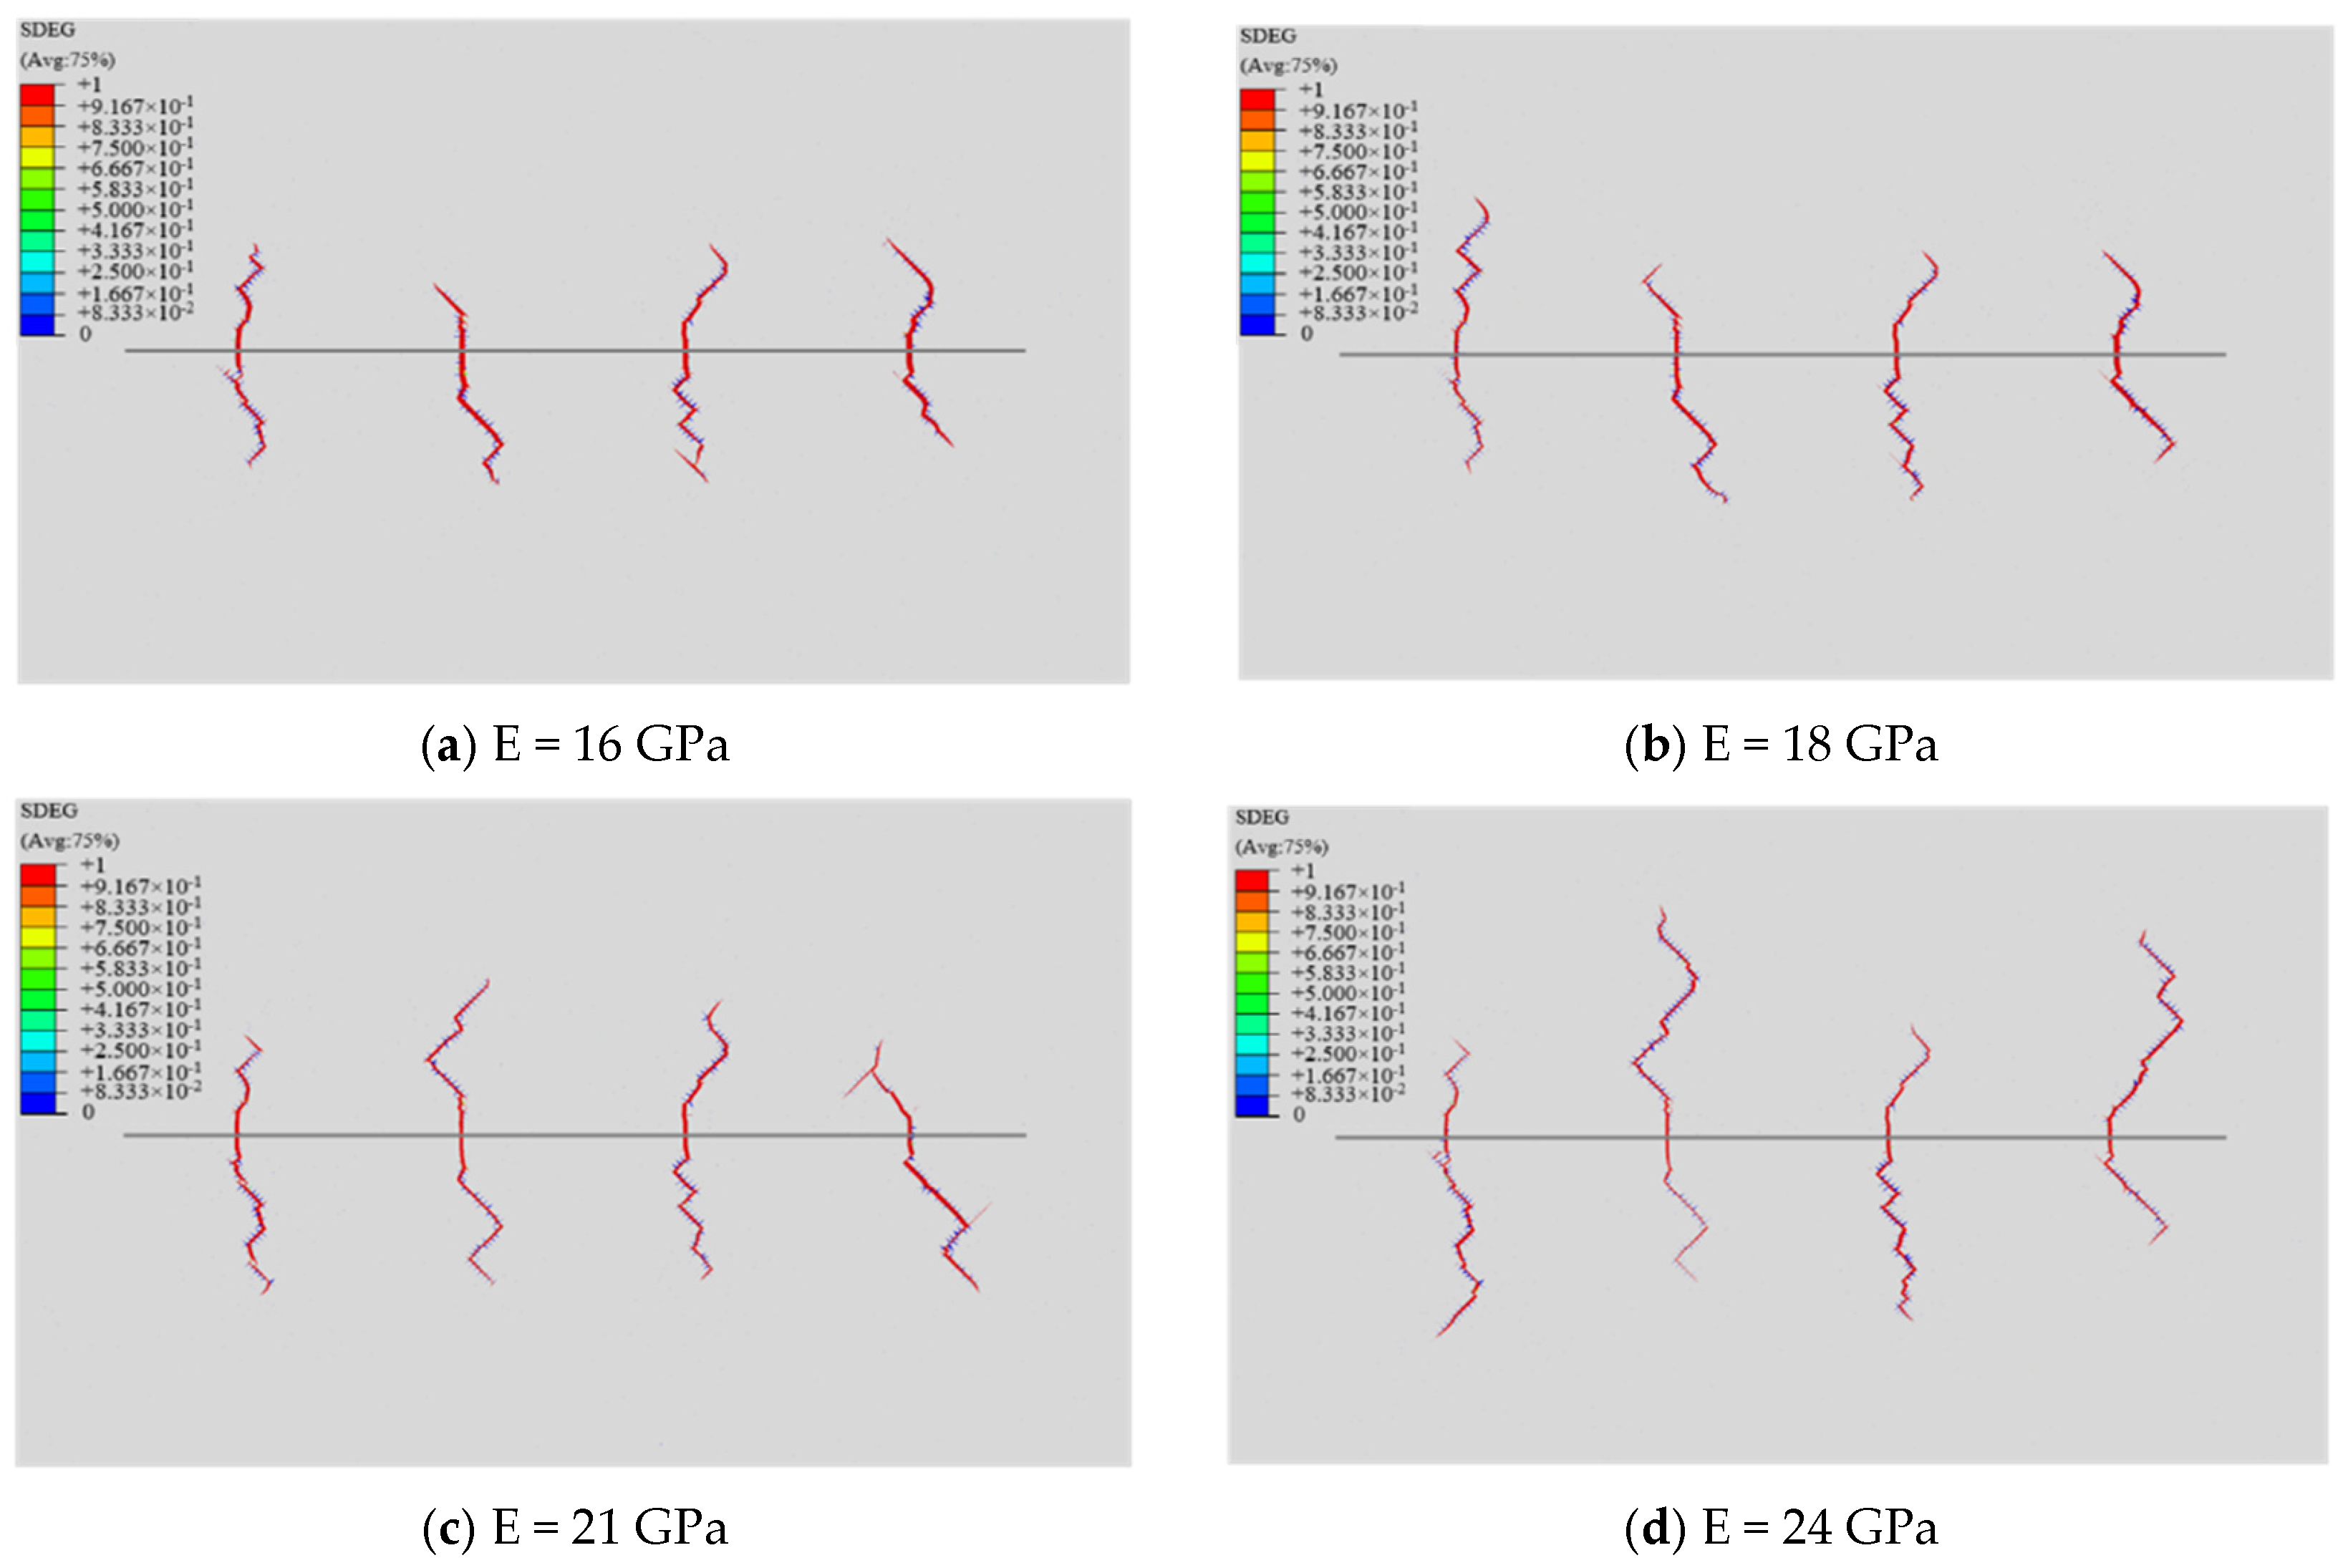
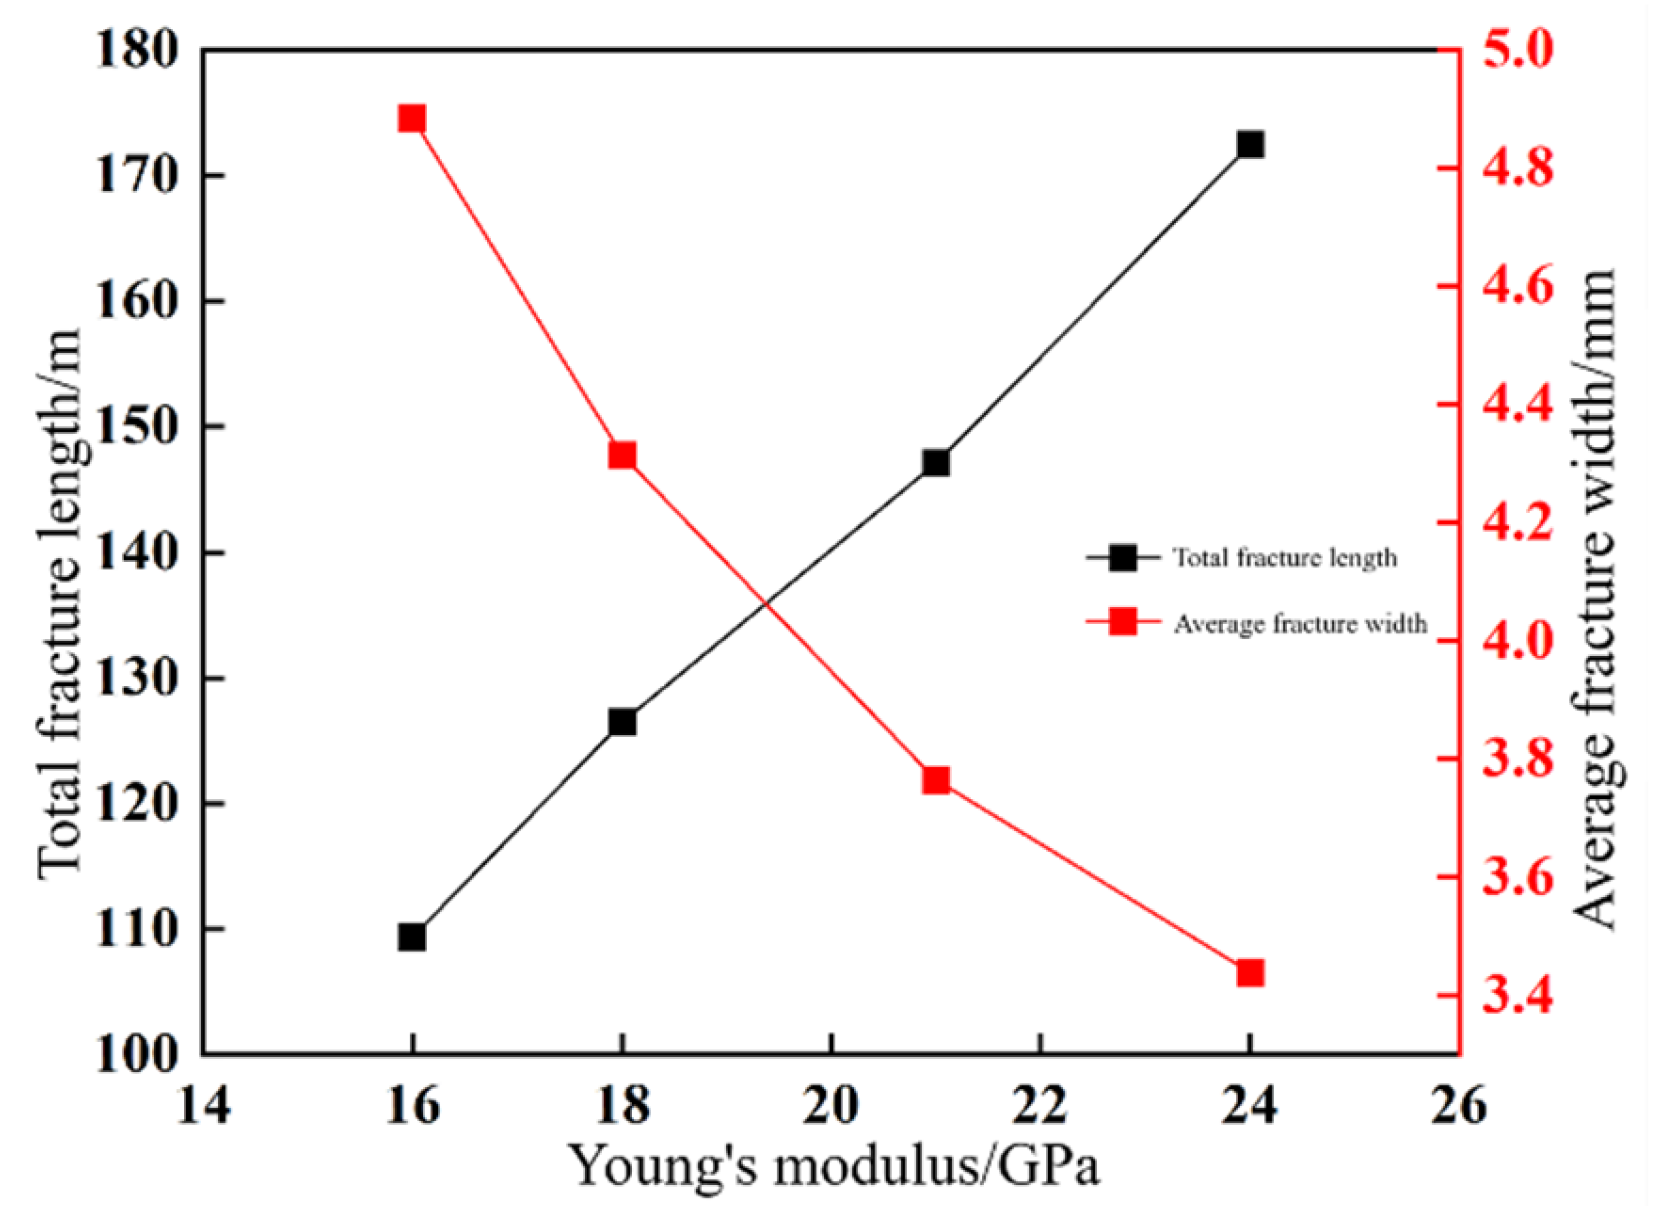
  • Young′s modulus (E): Young′s modulus critically governs fracture network complexity. Increasing E from 16 GPa to 24 GPa enhances total fracture length by 57.7% and tortuosity by 33.2%, achieving peak cumulative production at E = 24 GPa due to optimized stimulated reservoir volume (SRV).
  • Injection rate (Q): Elevated injection rates (0.060 → 0.144 m3/min) enhance energy delivery for fracture propagation, increasing total length by 90.6% and network complexity by 41.5%. Higher rates reduce breakdown pressure attainment time by 38%, improving operational efficiency.
Future research should prioritize the following:
  • When simulating multiple fracture intersections using globally embedded zero-thickness cohesive elements, the fluid distribution and mass balance within fracture networks become critically intricate, making hydraulic fracturing models challenging to achieve accurate and stable convergence. Therefore, the next phase of research should focus on developing efficient numerical algorithms and fluid partitioning strategies to enhance model performance and computational robustness;
  • Future studies should develop multiphysics-coupled models integrating thermodynamic and stochastic bedding effects. Specifically, a novel numerical simulation framework should be established to address thermal–hydraulic–mechanical coupling mechanisms in shale reservoirs, incorporating formation thermal stress evolution, heterogeneous bedding interface distributions, and stochastic geological characteristics;
  • Continental shale formations contain multi-scale impurities and pore structures beyond natural fractures, whose distinct structural features influence hydraulic fracture propagation. Subsequent investigations should therefore conduct comprehensive research on the mechanical interactions between these multi-scale heterogeneities and fracture development dynamics.

Author Contributions

Methodology, J.C.; software, Z.L.; formal analysis, D.G.; investigation, X.C. and D.G.; data curation, W.S.; writing—original draft, S.L. All authors have read and agreed to the published version of the manuscript.

Funding

This research was funded by National Natural Science Foundation of China (NSFC) project No. 52274040: evolution mechanism and effectiveness evaluation of fracture network produced by volume fracturing with tighter clusters in continental shale oil reservoirs.

Data Availability Statement

The data presented in this study are available on request from the corresponding author.

Acknowledgments

We would like to express our gratitude to all colleagues and collaborators who have contributed to this study, both directly and indirectly.

Conflicts of Interest

Author Ziyan Li was employed by the PetroChina. The remaining authors declare that the research was conducted in the absence of any commercial or financial relationships that could be construed as a potential conflict of interest.

References

  1. Ding, Y.T. Domestic Oil and Gas Production Equivalent to Exceed 400 Million Tons for the First Time in 2024; Tongfang Knowledge Network (Beijing) Technology Co., Ltd.: Beijing, China, 2025; p. 002. [Google Scholar] [CrossRef]
  2. Jia, C.Z.; Wang, Z.G.; Jiang, L.; Zhao, W. Research Progress and Scientific Challenges in Shale Oil Exploration and Development in China. World Pet. Ind. 2024, 31, 1–11. [Google Scholar] [CrossRef]
  3. Chen, B.; Barboza, B.R.; Sun, Y.; Bai, J.; Thomas, H.R. A Review of Hydraulic Fracturing Simulation. Arch. Comput. Methods Eng. 2022, 29, 1–58. [Google Scholar] [CrossRef]
  4. Barati, R.; Liang, J.T. A Review of Fracturing Fluid Systems Used for Hydraulic Fracturing of Oil and Gas Wells. J. Appl. Polym. Sci. 2014, 131, 318–323. [Google Scholar] [CrossRef]
  5. Osiptsov, A.A. Fluid Mechanics of Hydraulic Fracturing: A Review. J. Pet. Sci. Eng. 2017, 156, 513–535. [Google Scholar] [CrossRef]
  6. Zhang, J.; Lian, L.; Wang, P.; Li, G.; Liu, Z.; Zou, G.; Tian, L.; Huang, X. Application of Hydraulic Fracture Propagation and Production Simulation Technology for Multi-Stage Optimization—A Case Study from Unconventional Reservoir. In Proceedings of the SPE EOR Conference at Oil and Gas West Asia, Muscat, Oman, 16–18 April 2024; p. D031S036R005. [Google Scholar]
  7. Huang, L.; Liao, X.; Fan, M.; Wu, S.; Tan, P.; Yang, L. Experimental and Numerical Simulation Technique for Hydraulic Fracturing of Shale Formations. Adv. Geo-Energy Res. 2024, 13, 83–88. [Google Scholar] [CrossRef]
  8. Guo, X.; Yu, Z. Experimental and Numerical Simulation Study on Hydraulic Fracture Propagation Law of Coal Seam. Pet. Sci. Technol. 2024, 42, 2063–2085. [Google Scholar] [CrossRef]
  9. Yu, H.; Xu, W.; Li, B.; Huang, H.; Micheal, M.; Wang, Q.; Huang, M.; Meng, S.; Liu, H.; Wu, H. Hydraulic Fracturing and Enhanced Recovery in Shale Reservoirs: Theoretical Analysis to Engineering Applications. Energy Fuels 2023, 37, 42. [Google Scholar] [CrossRef]
  10. Li, G.Y. Improved Water Security for China’s Efforts to Build Itself into a Stronger Country and Rejuvenate the Chinese Nation on All Fronts by Pursuing Chinese Modernization—Speech at the 2024 National Water Conservancy Work Conference. Water Resour. Dev. Res. 2024, 24, 1–10. [Google Scholar] [CrossRef]
  11. Li, G.Y. Thoroughly Implemented the Spirit of the 20th National Congress of the Communist Party of China and Solidly Promoted the High-Quality Development of Water Conservancy in the New Stage Speech at the National Water Conservancy Work Conference in 2023. Water Resour. Dev. Res. 2023, 23, 1–11. [Google Scholar] [CrossRef]
  12. Wu, F.C. Effectiveness, Scientific and Technological Support, and Prospects for Water Pollution Control and Management in China. Water Resour. Dev. Res. 2023, 23, 1–8. [Google Scholar] [CrossRef]
  13. Zhu, D.; Zhang, L.; Song, X.; Lian, H.; Niu, D. Propagation Mechanism of the Hydraulic Fracture in Layered-Fractured-Plastic Formations. Int. J. Fract. 2023, 241, 189–210. [Google Scholar] [CrossRef]
  14. Wang, H.; Xiao, P.; Zhou, D.; Wang, Q. Numerical Modeling of the Interaction of Cemented Natural Fractures and Hydraulic Fractures. Sci. Rep. 2024, 14, 32050. [Google Scholar] [CrossRef] [PubMed]
  15. Shi, S.; Wang, M.; Tang, W.; Pan, Y.; Jin, H.; He, J.; Hou, L.; Xie, B.; Chen, X.; Lv, Z. Study of Stress Field Induced by Natural Fracture and Its Influence on Hydraulic Fracture Propagation. J. Pet. Explor. Prod. Technol. 2024, 14, 1085–1099. [Google Scholar] [CrossRef]
  16. Fu, H.; Huang, L.; Hou, B.; Weng, D.; Guan, B.; Zhong, T.; Zhao, Y. Experimental and Numerical Investigation on Interaction Mechanism Between Hydraulic Fracture and Natural Fracture. Rock Mech. Rock Eng. 2024, 57, 10571–10582. [Google Scholar] [CrossRef]
  17. Yan, C.; Zheng, H.; Sun, G.; Ge, X. Combined finite-discrete element method for simulation of hydraulic fracturing. Rock Mech. Rock Eng. 2016, 49, 1389–1410. [Google Scholar] [CrossRef]
  18. Yan, C.Z.; Zheng, H. FDEM-flow 3D: A 3D hydro-mechanical coupled model considering the pore seepage of rock matrix for simulating three-dimensional hydraulic fracturing. Comput. Geotech. 2017, 81, 212–228. [Google Scholar] [CrossRef]
  19. Nguyen, V.P.; Lian, H.; Rabczuk, T.; Bordas, S. Modelling hydraulic fractures in porous media using flow cohesive interface elements. Eng. Geol. 2017, 225, 68–82. [Google Scholar] [CrossRef]
  20. Duan, G.; Mou, J.; Liu, Z.; Han, L.; Cui, H. Study on the Induced Effect of Bedding Weakness in Deep Shale Gas Reservoir on Hydraulic Fractures Propagation. Front. Energy Res. 2024, 12, 1392298. [Google Scholar] [CrossRef]
  21. Jiang, M.; Wei, Y.; Li, T.; Dong, K. Influence of Horizontal Multi-Bedding on Hydraulic Fracture Propagation in Shale Reservoirs. Processes 2023, 11, 2846. [Google Scholar] [CrossRef]
  22. Ma, Y.; Li, J. Utilization Law of Shale Gas in Hydraulic Fracturing with the Changning-Weyuan Block in China as an Example. Phys. Fluids 2024, 36, 102020. [Google Scholar] [CrossRef]
  23. Kukharova, T.; Maltsev, P.; Novozhilov, I. Development of a Control System for Pressure Distribution During Gas Production in a Structurally Complex Field. Appl. Syst. Innov. 2025, 8, 51. [Google Scholar] [CrossRef]
  24. Zhao, Y.G.; Zhang, X.Y.; Li, Z.; Wang, Z.L.; Shen, L.F. Study on the Influence of Stochastic Microcracks on Macroscopic Crack Propagation in Rocks. Eng. Mech. 2024, 41, 103–115. [Google Scholar]
  25. Li, J.; Zhai, W.B.; Chen, C.W.; Liu, G.H.; Zhou, Y.C. Research on Stochastic Propagation Method of Hydraulic Fractures Based on Zero-Thickness Cohesive Elements. Rock Soil Mech. 2021, 42, 265–279. [Google Scholar] [CrossRef]
  26. Li, Z.Y.; Lin, T.; Ouyang, W. Numerical Simulation of Staged Fracturing in Horizontal Wells. Yunnan Chem. Technol. 2024, 51, 125–128+131. [Google Scholar]
  27. Blanton, T.L. An experimental study of interaction between hydraulically induced and pre-existing fractures. In Proceedings of the SPE Unconventional Gas Recovery Symposium, Pittsburgh, PA, USA, 16–18 May 1982; p. SPE-10847-MS. [Google Scholar]
  28. Zhang, H.Y. Evolution Mechanisms of Intensive Volume Fracturing-Induced Fracture Networks in Continental Shale Oil Reservoirs. Master’s Thesis, Xi’an Shiyou University, Xi’an, China, 2023. [Google Scholar] [CrossRef]
  29. Wang, Q.; Zhao, J.Z.; Hu, Y.Q.; Zhao, C.N.; Fu, C.H. Morphology and Activation Mechanisms of Hydraulic Fracture Networks in Shale. J. Southwest Pet. Univ. (Nat. Sci. Ed.) 2022, 44, 71–86. [Google Scholar]
  30. He, M.Q. Fracture Propagation Behavior and Microscopic Mechanisms of CO2 Fracturing in Shale Reservoirs. Ph.D. Thesis, China University of Petroleum (Beijing), Beijing, China, 2022; pp. 40–42. [Google Scholar]
  31. Cai, X. Cohesive Zone Modeling of Fluid-Solid Coupling Considering Complex Hydraulic Fracture Morphologies. Ph.D. Thesis, China University of Petroleum (East China), Qingdao, China, 2021; pp. 55–63. [Google Scholar]
Figure 1. Schematic diagram of the microcrack region.
Energies 18 02862 g001
Figure 2. Process flow for generating random natural fractures.
Energies 18 02862 g002
Figure 3. Natural fracture distribution (red fractures represent the selected fractures for this group).
Energies 18 02862 g003
Figure 4. Process of embedding zero-thickness cohesive elements.
Energies 18 02862 g004
Figure 5. Geometric model.
Energies 18 02862 g005
Figure 6. Mesh discretization.
Energies 18 02862 g006
Figure 7. Geometric modeling of crack intersections.
Energies 18 02862 g007
Figure 8. Numerical simulation grid for crack intersection.
Energies 18 02862 g008
Figure 9. Blanton′s experimental findings.
Energies 18 02862 g009
Figure 10. Sequential fracturing process.
Energies 18 02862 g010
Figure 11. Interaction results between natural fractures and hydraulic fractures for each group when the cementation strength ratio of natural fractures is 0.4 in Simulation #1.
Energies 18 02862 g011
Figure 12. Interaction results between natural fractures and hydraulic fractures for each group when the cementation strength ratio of natural fractures is 0.9 in Simulation #2.
Energies 18 02862 g012
Figure 13. Interaction results between natural fractures and hydraulic fractures for each group when the cementation strength ratio of natural fractures is random in Simulation #3.
Energies 18 02862 g013
Figure 14. Fracture network morphology under different levels of stress differential.
Energies 18 02862 g014
Figure 15. Injection pressure of the first fracture under different horizontal stress differences.
Energies 18 02862 g015
Figure 16. Total fracture length and average fracture width under different horizontal stress differences.
Energies 18 02862 g016
Figure 17. Fracture network evolution mechanism under different horizontal Young′s moduli.
Energies 18 02862 g017
Figure 18. Fracture network morphology under different Young′s moduli.
Energies 18 02862 g018
Figure 19. Total fracture length and average fracture width under different Young′s moduli.
Energies 18 02862 g019
Figure 20. Fracture network morphology under different fracturing fluid displacement rates.
Energies 18 02862 g020
Figure 21. Injection pressure of the first fracture under different displacement rates.
Energies 18 02862 g021
Figure 22. Total fracture length and average fracture width under different displacement rates.
Energies 18 02862 g022
Table 1. Natural fracture parameters.
Number of GroupsLength/mAngle/°Quantity/Fracture Count
3–545°100
3–5−45°100
3–5−45°100
3–545°100
Table 2. Basic model parameters.
NameParameterUnitValue
Injection ParametersFracturing Fluid ViscosityPa·s0.001
Fracturing Fluid Injection Ratem3/min0.132
Injection Times40
In situ stress fieldMaximum Horizontal Principal StressPa11 × 106
Minimum Horizontal Principal StressPa8 × 106
MatrixYoung’s ModulusGPa18
Poisson’s Ratio/0.14
Initial Porosity/0.1
Pore PressureMPa20
Permeability Coefficientm/s1 × 10−7
Rock Cohesion ZoneBedrock Tensile StrengthPa8 × 106
Rock Shear StrengthPa2 × 107
Bedrock Tensile Fracture EnergyN/m2000
Bedrock Shear Fracture EnergyN/m4500
Disclaimer/Publisher’s Note: The statements, opinions and data contained in all publications are solely those of the individual author(s) and contributor(s) and not of MDPI and/or the editor(s). MDPI and/or the editor(s) disclaim responsibility for any injury to people or property resulting from any ideas, methods, instructions or products referred to in the content.

