Article

Investigating the Effect of Thermal Pretreatment on Chalcopyrite Grinding for Comminution Energy Reduction

by
Kaveh Asgari
* and
Qingqing Huang
*
Department of Mining Engineering, West Virginia University, 1374 Evansdale Drive, 365 Mineral Resources Building, Morgantown, WV 26506, USA
*
Authors to whom correspondence should be addressed.
Energies 2025, 18(11), 2989; https://doi.org/10.3390/en18112989
Submission received: 18 March 2025 / Revised: 14 May 2025 / Accepted: 27 May 2025 / Published: 5 June 2025
(This article belongs to the Special Issue Clean Utilization and Conversion Technologies of Coal)

Abstract

:
This study investigates the effect of thermal pretreatment on the grindability and energy efficiency of chalcopyrite ore using a ball mill, employing Box–Behnken design and statistical analysis to optimize key grinding parameters. The research utilized scanning electron microscopy (SEM), X-ray diffraction (XRD), and thermogravimetric analysis (TGA) to assess the structural changes in the ore after pretreatment at 300 °C and 600 °C. These analyses revealed significant modifications in the chalcopyrite structure, including reduced crystallinity, formation of new phases (such as oxides), and the development of microcracks, which contributed to improved grinding performance. Statistical analysis of the results showed that thermal pretreatment reduced specific energy consumption by approximately 10% and enhanced the particle size reduction (P80). The Box–Behnken design was used to optimize the mill speed and ball filling ratio, further improving energy efficiency. Results showed that reducing the mill speed decreased energy consumption while maintaining an optimal P80, whereas increasing the ball filling ratio reduced energy usage but resulted in a coarser product. Overall, this study demonstrated that thermal pretreatment, combined with optimized milling parameters through statistical design, can significantly enhance energy efficiency and grinding performance in chalcopyrite ore processing, offering practical solutions for industrial mineral processing.

1. Introduction

The mining industry faces significant challenges related to energy consumption, environmental impact, and operational costs. Among the various stages of mineral processing, comminution is regarded as the most energy-intensive, accounting for up to 50% of the total energy expenditure in mining operations [1]. Ball mills, which are widely used for ore grinding, play a critical role in this process. However, traditional ball milling techniques are inherently energy-inefficient, consuming vast amounts of electricity to break down ores into finer particles. This inefficiency has driven researchers and industry professionals to seek innovative methods for reducing energy consumption while maintaining or improving grinding performance. Chalcopyrite (CuFeS2), one of the most important copper sulfide minerals, is frequently processed through ball milling to achieve the desired liberation for downstream separation processes, such as flotation. However, its complex crystalline structure and associated hardness make its grinding particularly energy-intensive, necessitating the development of novel strategies to enhance efficiency [2]. One of the conventional approaches for reducing energy consumption in ball mills involves optimizing operational parameters, such as ball size, ball filling ratio, mill speed, and pulp density. These factors directly influence the mill’s efficiency by affecting the impact forces between grinding media and the ore [3]. Additionally, pretreatment techniques, such as crushing and pre-screening to reduce the feed size, have been widely used to minimize energy consumption in subsequent grinding stages [1]. However, while these methods offer incremental improvements, they often fail to address the fundamental limitations of the ball milling process, particularly for harder ores like chalcopyrite.
In recent years, there has been a growing interest in the use of thermal pretreatment methods, such as microwave and conventional heating, to improve the grindability of ores and reduce energy consumption. Thermal pretreatment works by inducing thermal stresses within the mineral structure, which leads to microfractures and a reduction in ore hardness. Microwave-assisted comminution, in particular, has shown promising results in selectively heating mineral phases like chalcopyrite, which have high dielectric constants [4]. When exposed to microwave energy, chalcopyrite absorbs the radiation more efficiently than surrounding gangue minerals, leading to differential expansion and the formation of internal cracks. These microcracks weaken the mineral structure, making it easier to grind and significantly reducing the energy required to achieve the desired particle size [5]. By weakening the crystalline structure of chalcopyrite, microwave pretreatment has the potential to not only reduce energy consumption but also enhance mineral liberation, thereby improving downstream recovery processes, such as flotation. Several studies have explored the impact of microwave-assisted comminution on various ores, including chalcopyrite. Amankwah et al. (2005) [5] demonstrated that microwave-treated chalcopyrite exhibited a reduction in the work index, indicating that less energy was required to grind the ore to the target size. Similarly, Kingman et al. (2000) [4] found that microwave pretreatment could significantly improve the liberation of valuable minerals, which is critical for enhancing the efficiency of separation processes. Thermal pretreatment has also been studied for other ore types, such as ilmenite [6], gold ores [7], and iron ore [8], demonstrating improved grindability and energy savings. For example, Manouchehri et al. (2008) [6] reported that thermal treatment improved the flotation performance and energy efficiency of ilmenite ore. In another study, Tavares et al. (2010) [7] showed that microwave pretreatment could enhance the liberation of gold-bearing minerals in refractory ores, resulting in higher gold recovery. Moreover, Karamanev et al. (1996) [8] found that thermally pretreated iron ores displayed increased reactivity and fragmentation behavior, leading to more efficient grinding in downstream processing. These findings suggest that thermal pretreatment, and specifically microwave-assisted grinding, could play a pivotal role in reducing the energy footprint of ball milling operations. Despite the potential benefits of thermal pretreatment, there is still a need for further research to fully understand the interactions between thermal exposure and grinding performance. Key variables, such as the intensity and duration of the thermal treatment, the ball filling ratio, and mill speed, must be carefully optimized to maximize energy savings and ensure efficient grinding. Additionally, the integration of these variables into advanced experimental designs, such as the Box–Behnken design, provides a systematic approach to evaluating the effects of multiple factors on energy consumption and particle size distribution [9]. This design of experiments (DoE) approach allows researchers to assess the combined influence of variables and identify optimal operating conditions for thermal pretreatment and ball milling. The importance of reducing energy consumption in comminution goes beyond operational cost savings. In the context of global efforts to reduce greenhouse gas emissions and achieve more sustainable mining practices, improving the energy efficiency of mineral processing has become a critical priority. According to Tavares et al. (2012) [10], comminution is responsible for a significant portion of a mine’s carbon footprint, and reducing energy usage in this area could have substantial environmental benefits. By lowering the energy required for ore grinding, thermal pretreatment techniques, such as microwave irradiation, contribute to more sustainable mining practices while also reducing costs associated with electricity consumption and equipment wear. As a whole, although various thermal pretreatment techniques, such as microwave irradiation, have shown potential in enhancing ore grindability and reducing energy consumption, their practical application in industrial settings remains limited. In many cases, microwave-based methods were not fully optimized for different ore types, and their scalability and cost-effectiveness pose significant challenges. Additionally, the operational parameters—such as exposure time, intensity, and ore mineralogy—were not always systematically evaluated, resulting in inconsistent outcomes. On the other hand, several alternative pretreatment approaches involving chemical reagents or additives have raised environmental and safety concerns due to their toxicity and potential for generating hazardous byproducts. These limitations underscore the need for an effective, scalable, and environmentally responsible pretreatment method that can be seamlessly integrated into existing comminution circuits. Therefore, developing a comprehensive approach that considers the combined effects of thermal pretreatment with key operational grinding parameters—using accurate energy measurements and a statistically robust design—is essential to advancing both the efficiency and sustainability of mineral processing practices.
Although thermal pretreatment has been recognized as a potential method to improve mineral grinding, its effect on the energy efficiency of chalcopyrite grinding has not been systematically evaluated using accurate, real-time energy measurements. Most previous studies lacked precise quantification of energy consumption and did not consider the combined influence of key grinding parameters. Therefore, this study aims to address this gap by accurately measuring the specific energy consumption through torque, rotational speed, voltage, and current data, and by systematically analyzing the effects of thermal pretreatment along with ball filling ratio and mill speed using a Box–Behnken design. The findings offer reliable insights into optimizing grinding processes for enhanced energy efficiency in sulfide ore processing.
2. Materials and Methods

2.1. Sample Preparation

A bulk chalcopyrite ore sample was obtained from a copper mine located in Utah. To prepare the sample for grinding tests, the ore underwent a series of size reduction steps. Initially, the coarse chalcopyrite sample was crushed in stages. The first stage of crushing was carried out using a jaw crusher to reduce the sample to a manageable size. Following this, the jaw crusher product was passed through a roll crusher to further reduce the particle size. After the second crushing stage, the product was sieved using a 3-mesh sieve (7090 microns). The material passing through the sieve (underflow) was collected as the primary feed for the subsequent grinding tests, while the oversized material was recirculated back for re-crushing to ensure the desired size range was achieved. This process was repeated until a sufficient quantity of the underflow material was obtained.

2.2. Sample Characterization Techniques

The chemical composition of the chalcopyrite ore was determined using inductively coupled plasma mass spectrometry (ICP-MS). This method provided a detailed breakdown of the elemental composition, particularly focusing on copper (Cu), iron (Fe), and sulfur (S) content, which are crucial components in chalcopyrite mineralogy. Particle size distribution of the feed material was determined using standard sieving analysis. The 80% passing size (F80) was determined by subjecting the sample to a range of sieve sizes with an order of square roots. This information helped design and optimize the grinding process for energy reduction studies.

2.3. Thermal Pretreatment

Thermal pretreatment was carried out using a furnace capable of reaching temperatures up to 1000 °C at a ramp rate of 30 °C/min. One kilogram of samples was pretreated at two different temperatures: 300 °C and 600 °C, respectively, each for 1 h. Ceramic crucibles, capable of withstanding high temperatures, were used as sample holders. Additionally, the furnace interior was lined with a combination of refractory materials designed to endure the extreme temperatures generated during heating processes, minimize heat loss, and ensure consistent and efficient heating of the samples. After each pretreatment cycle, the sample was allowed to cool down to room temperature before being used in the designated tests to maintain consistent conditions throughout the experiments. Within this range of temperatures, chalcopyrite undergoes structural changes and partial breakdown, leading to the formation of microcracks that enhance grindability. Moreover, heating in this interval has been shown to alter mineral properties without causing complete melting or oxidation, making it suitable for subsequent grinding and flotation processes [11,12,13]. By choosing two representative temperatures—one closer to the onset of decomposition and one higher—we aimed to assess the impact of thermal exposure on grinding performance and energy efficiency.

2.4. Grinding Stage

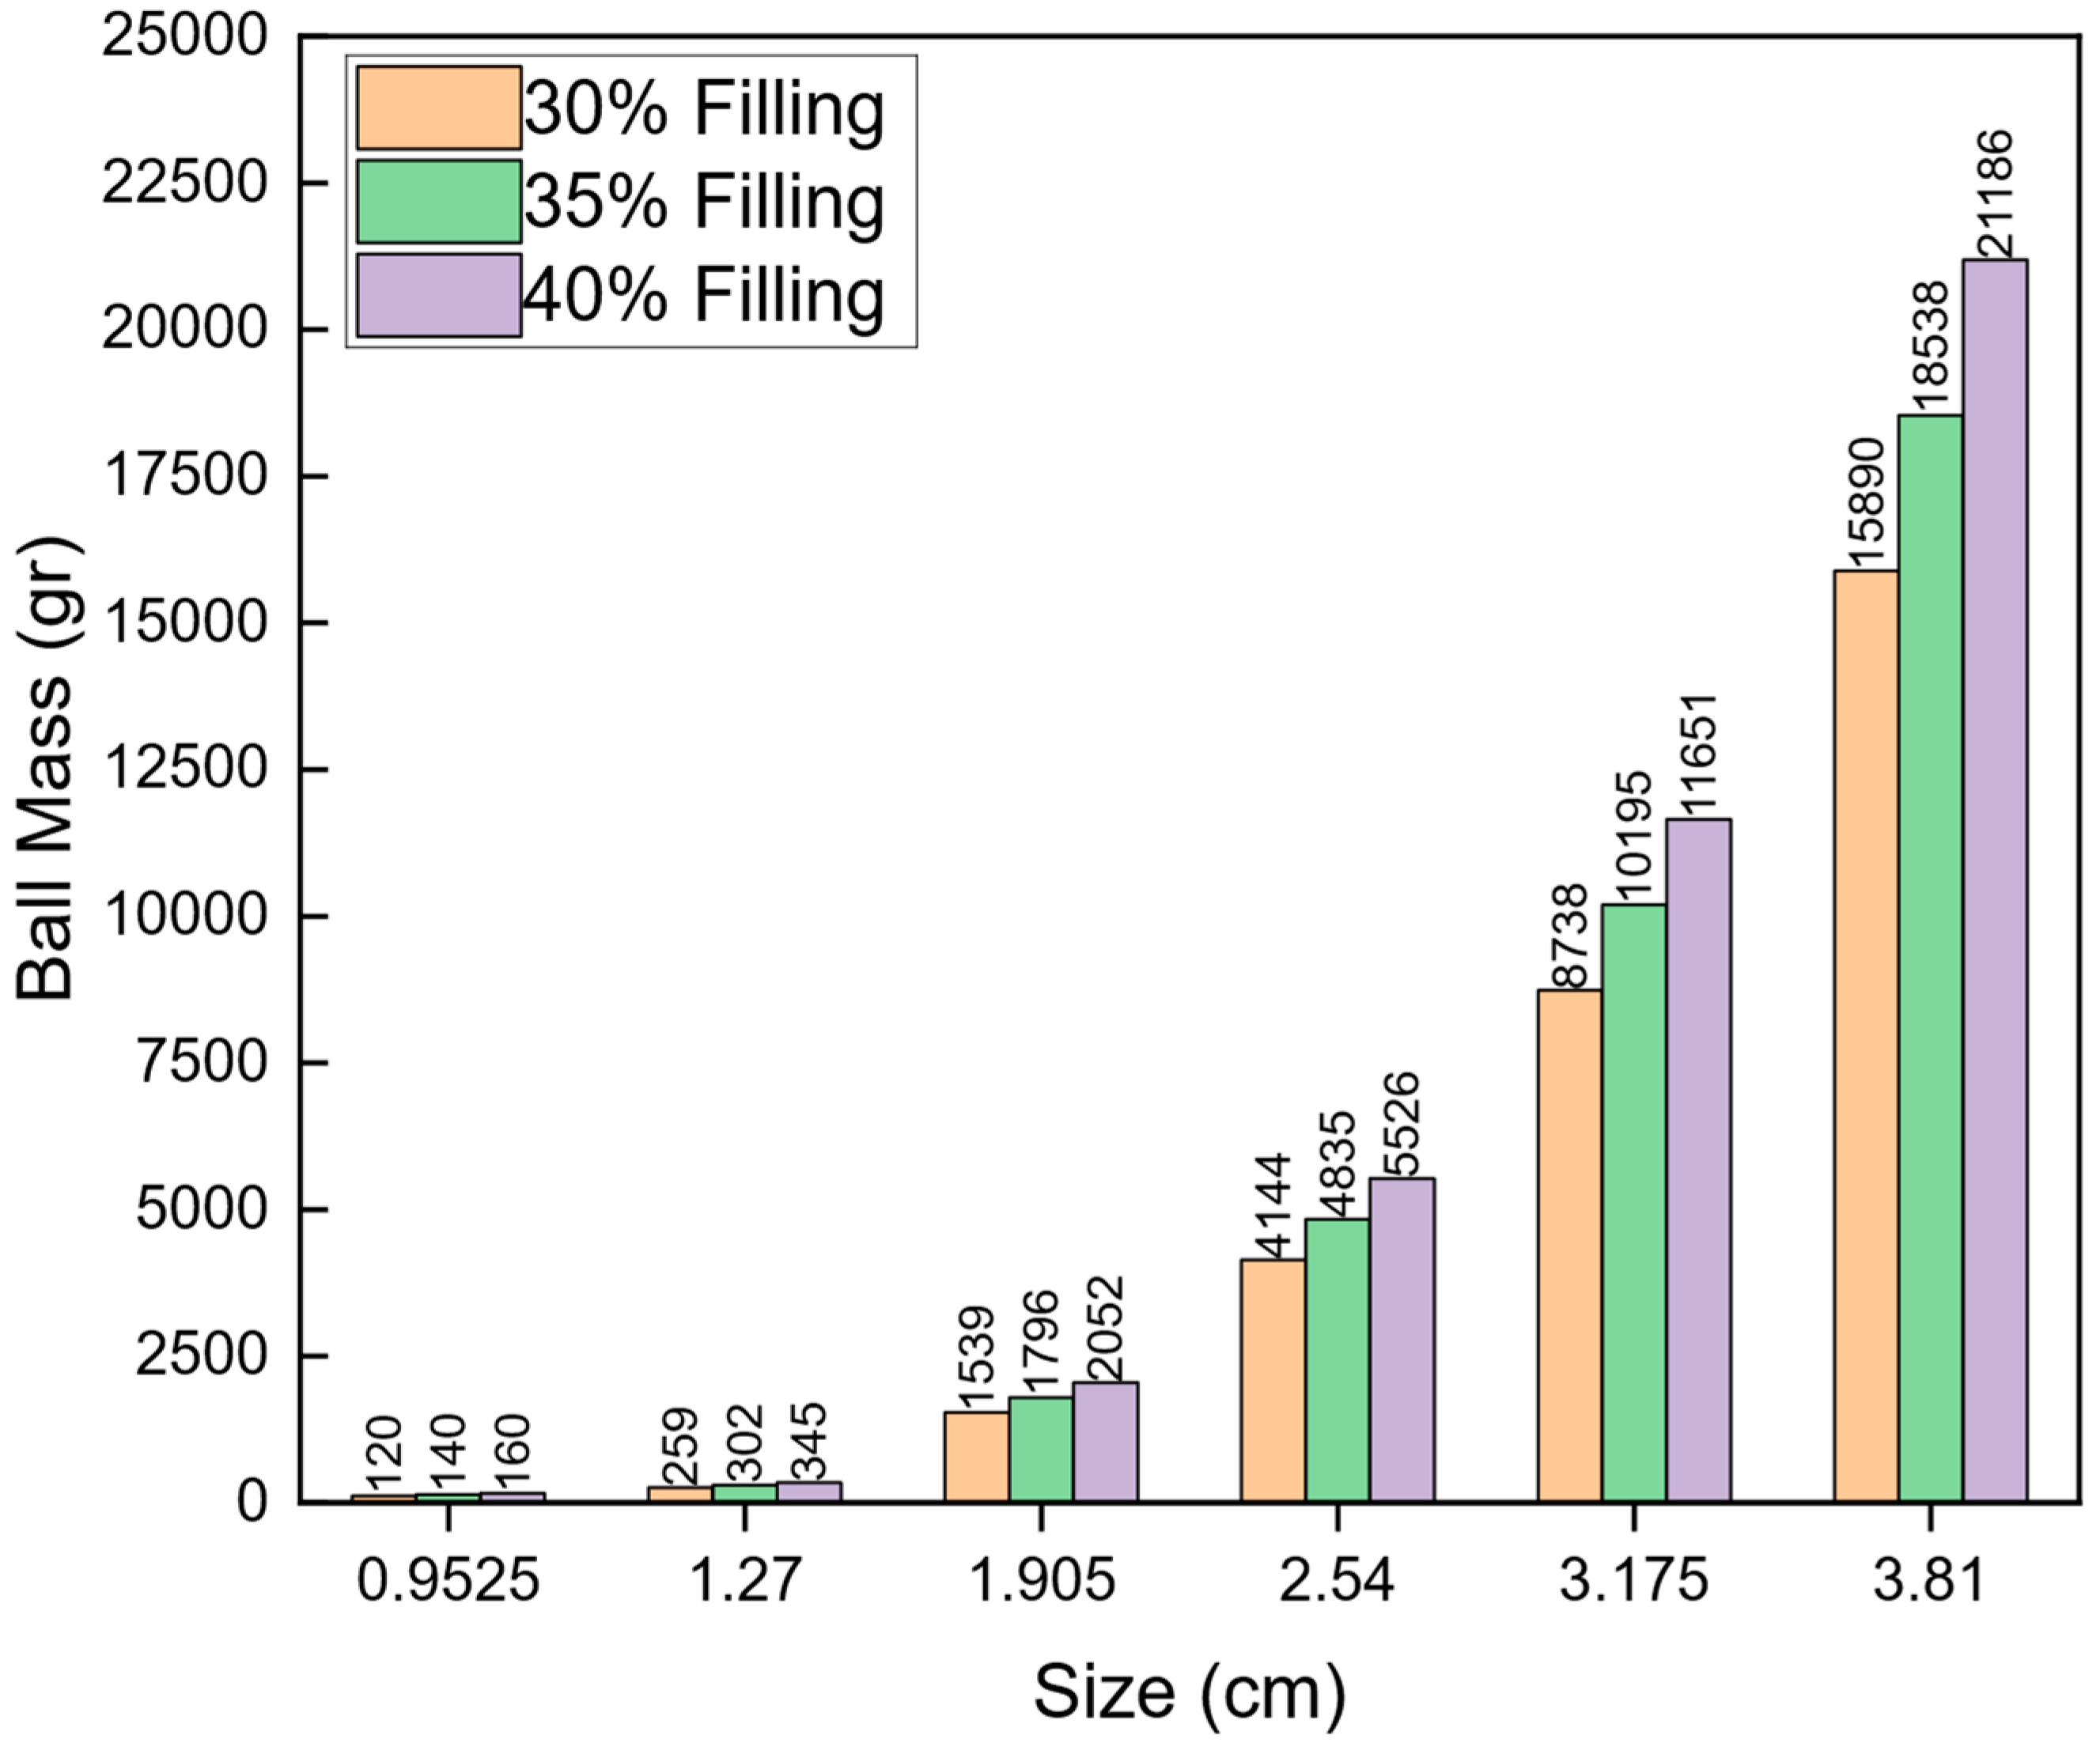
The grinding tests were conducted using a ball mill with an effective volume of approximately 13 L. The mill was loaded with stainless steel 440 cc spherical media, serving as the grinding media. To ensure efficient grinding and to determine the optimal ball size distribution, a standard ball distribution method was employed. For each ball filling ratio, the distribution and total mass of the grinding media were adjusted, as shown in Figure 1.
The mill was equipped with lifters to enhance the grinding efficiency. These lifters were designed to promote a cascading motion of the media and material, ensuring that the grinding media were properly lifted and dropped during the mill’s rotation. This mechanism helps prevent excessive sliding, which can reduce grinding efficiency, and promotes an impact-driven grinding process, allowing for better particle size reduction of the chalcopyrite.

2.5. Energy Measurements

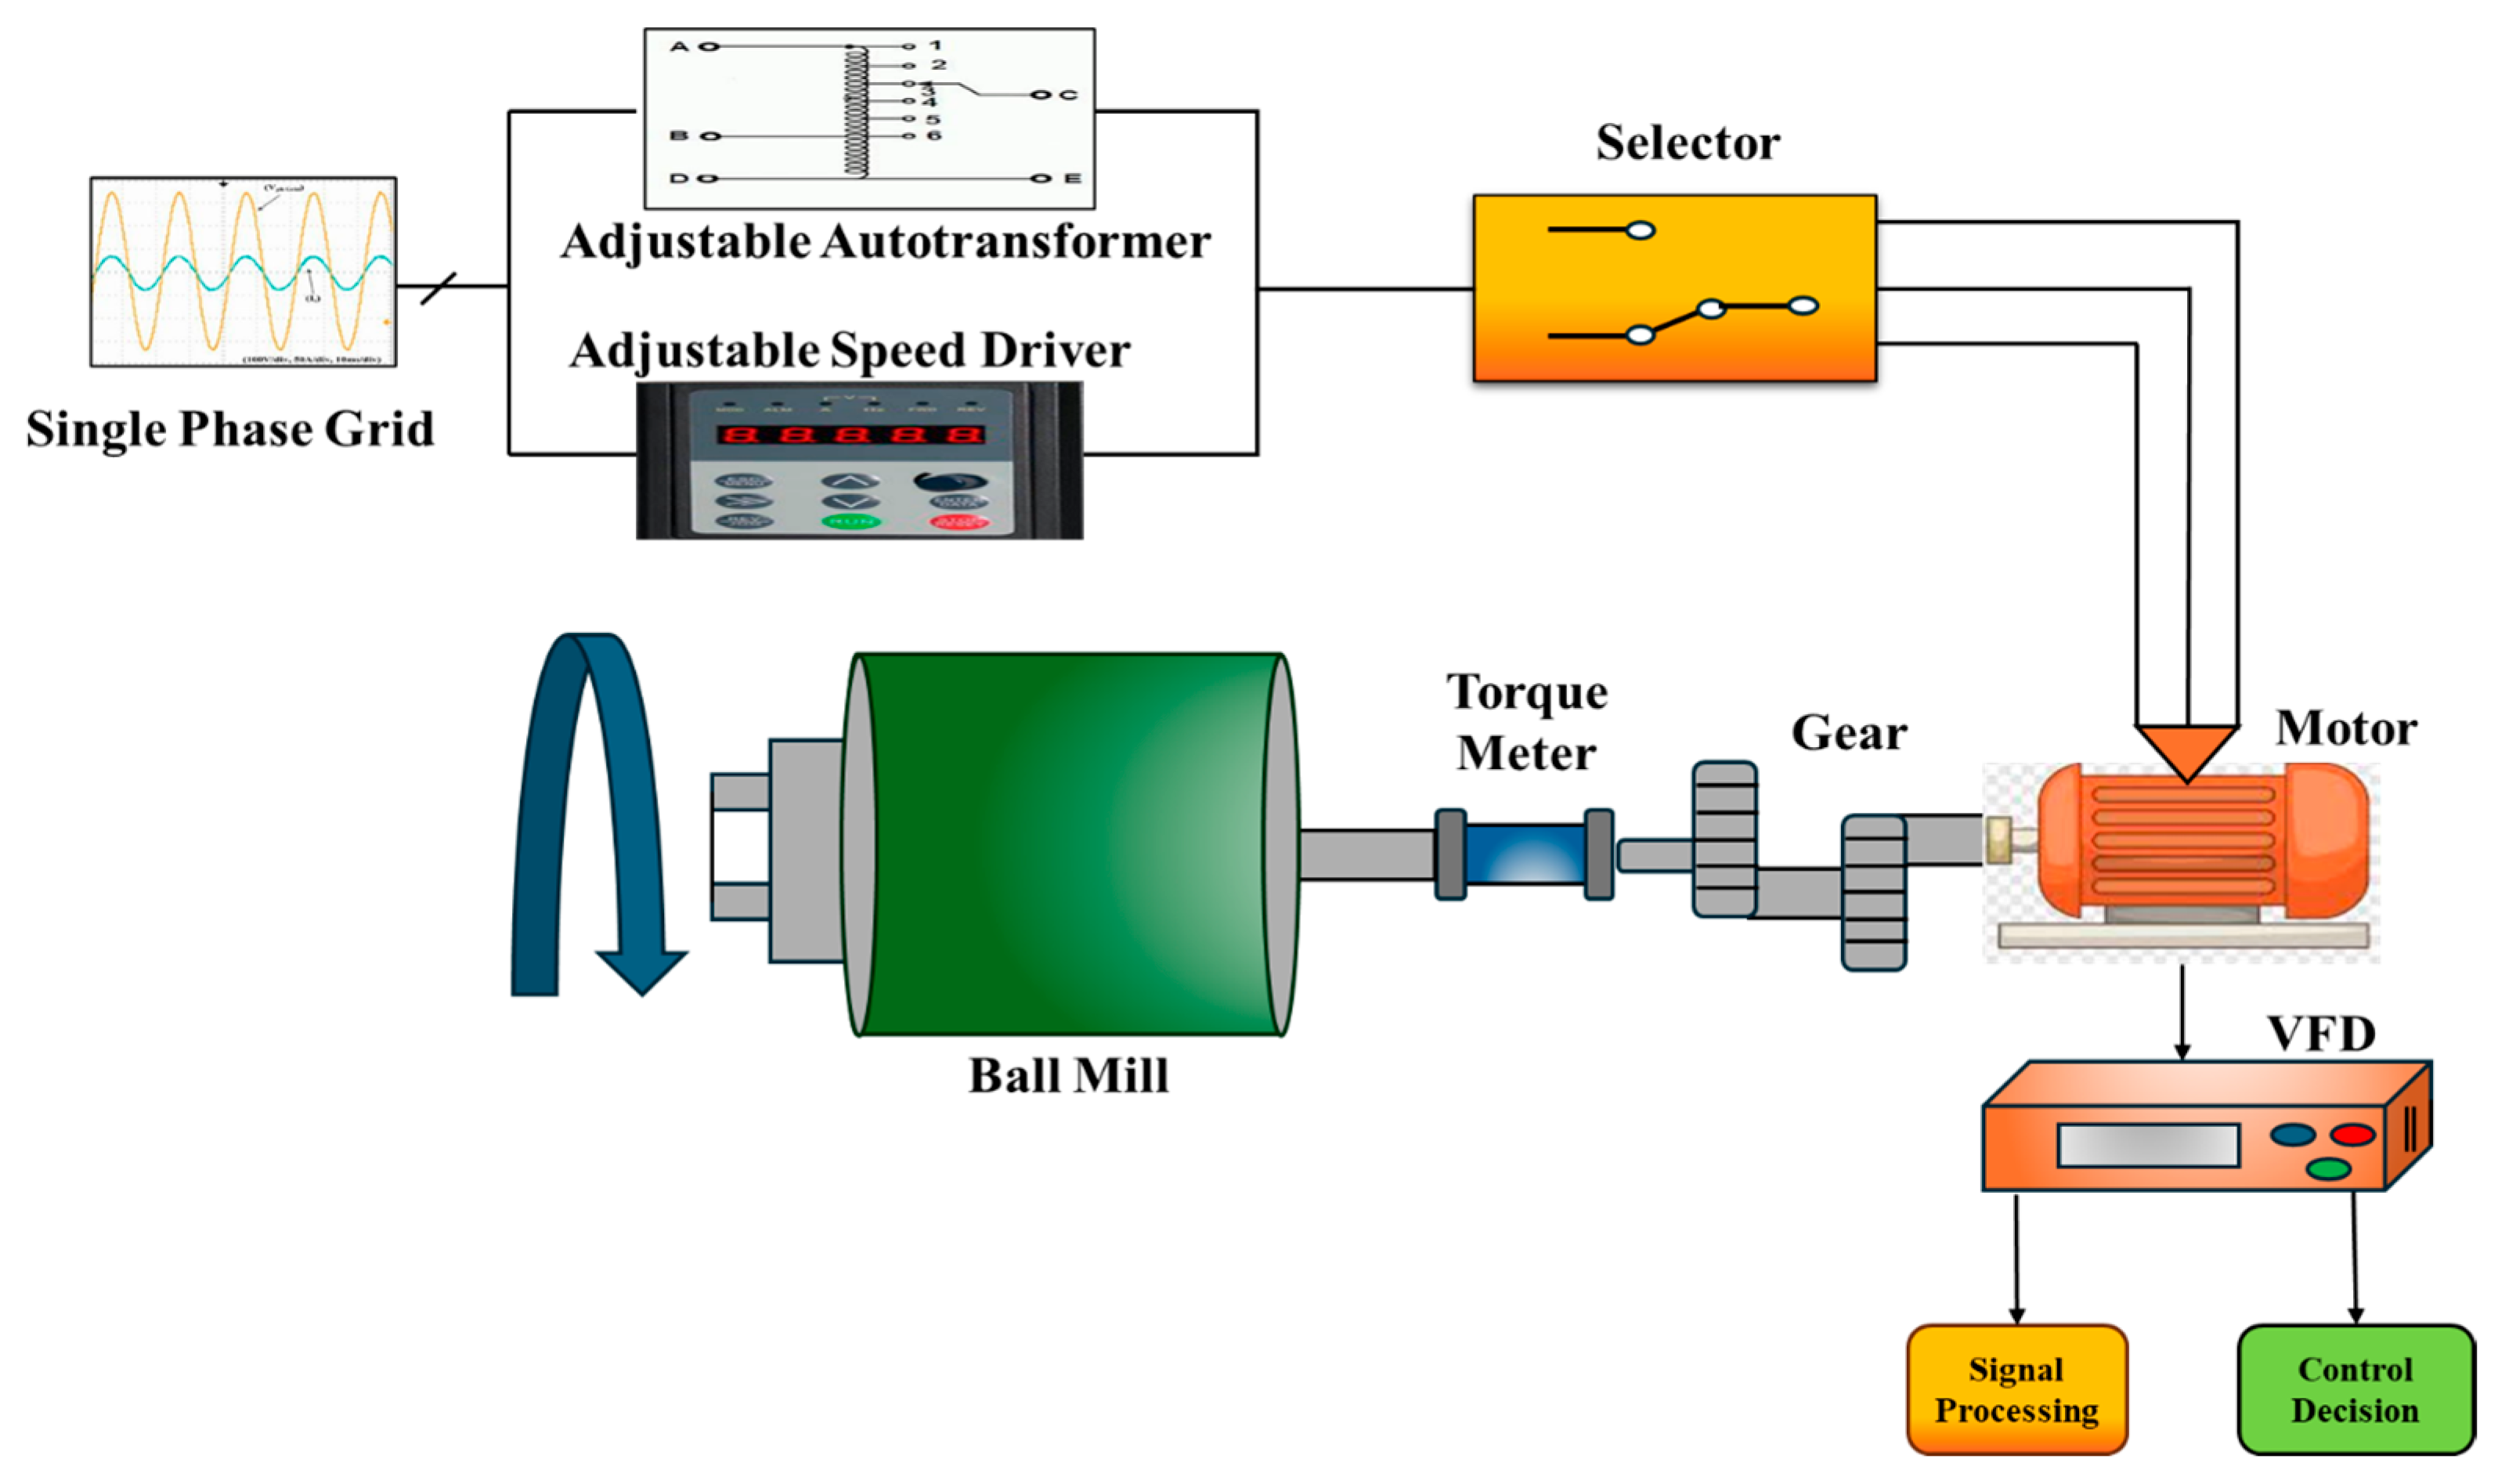
To accurately measure the energy consumption during the grinding process, the ball mill was equipped with both a torque meter and a variable frequency drive (VFD). The torque meter provided real-time data on the mill’s torque and rotational speed, while the VFD allowed monitoring of the voltage and current (amperage) supplied to the motor (Figure 2). These real-time measurements of torque, speed, voltage, and current were critical for determining the mill’s power consumption.
Torque and speed method: Using the torque (T(t)) and speed (ω(t)) data from the torque meter, the instantaneous power (P(t)) consumed by the mill was calculated. The torque was measured in pound-inches (lb-in), and the speed in revolutions per minute (rpm). To calculate power in horsepower, Equation (1) was used:
P t = T ( t ) × N t 63,025
where:
  • P(t) is the instantaneous power at time t (in horsepower),
  • T(t) the torque at time t (in lb-in),
  • N(t) is the rotational speed at time t (in rpm),
  • 63,025 is a constant used to convert the torque and speed data to horsepower.
Voltage and current method: In addition to the torque and speed method, the power consumption was also calculated directly from the electrical parameters provided by the VFD. The instantaneous electrical power (Pelec(t)) supplied to the mill was calculated using Equation (2):
P e l e c t = V ( t ) × I t 745.9668 × η
where:
  • V(t) is the voltage at time t (in volts),
  • I(t) is the current at time t (in amperes),
  • The constant 745.9668 is used to convert the result from watts to horsepower,
  • η is the motor efficiency, equal to 95%.
Both methods for calculating power consumption—the torque and speed method and the voltage and current method—were applied, and the results were found to be consistent and accurate across all experiments. This validated the accuracy of the measurements and provided reliable data for further energy analysis.
After determining the real-time power consumption, the specific energy (SE) consumption was calculated by integrating the power over the total grinding time and dividing it by the mass of the material in the mill (Equation (3)):
E s p e c i f i c = 0 t P t d t m p o w d e r
where:
  • Especific is the SE consumption (kWh/ton),
  • P(t) is the power consumption at time t,
  • mpowder is the mass of the material being ground.
Additionally, it is important to note that before each test, the ball mill was operated under ‘no-load’ conditions for the same duration as the grinding tests. This no-load power draw reflects the energy required to rotate the shaft and should be subtracted to accurately calculate the SE required for particle size reduction.
Due to the large amount of data generated during the experiments, the initial calculations using Excel were found to be imprecise. To improve accuracy, a custom MATLAB R2025a code was developed to handle the data, providing the highest possible precision in calculating SE consumption. This MATLAB approach allowed for more reliable integration of power over time and resulted in accurate energy consumption values for each grinding test.

2.6. Design of Experiments

The Box–Behnken design (BBD), a response surface methodology (RSM), was selected for this study due to its efficiency in optimizing processes involving multiple variables while requiring fewer experimental runs compared to full factorial or central composite designs. This feature is particularly valuable when experiments are time-consuming or resource-intensive, as in the case of grinding tests. The BBD avoids extreme combinations of variables, enhancing the safety and feasibility of tests involving thermal pretreatment. It also ensures the rotatability of the design, which improves prediction accuracy across the experimental space. In this study, the BBD was used to model the effects of three key parameters—ball filling ratio, fraction of critical speed, and thermal pretreatment—on two critical responses: SE consumption and product P80. The design includes factorial and center points to fit a second-order polynomial model, allowing for the estimation of main, interaction, and quadratic effects. Model adequacy and statistical assumptions, including normality of residuals, constant variance (homoscedasticity), and lack of significant lack-of-fit, were tested using diagnostic plots and ANOVA, confirming the validity of the model. The detailed parameter levels are shown in Table 1.
Finally, 15 different tests were designed using the Box–Behnken design to investigate the effect of the mentioned parameters on two intended results. These parameters were carefully selected to represent key variables from different functional categories affecting grinding performance. Specifically, we included one factor related to the grinding media (ball filling ratio), one related to mill operational conditions (mill speed), and one related to material characteristics (thermal pretreatment). These factors are known to directly or indirectly influence energy consumption and product fineness (P80). Table 2 shows the randomized design tests.

2.7. SEM, XRD, and TGA Analyses

Sample characterization was also conducted using scanning electron microscopy (SEM) and X-ray diffraction (XRD) analyses to provide in-depth information on the chalcopyrite ore before and after thermal treatment. The SEM analysis was carried out with a Hitachi S-4700 scanning electron microscope at 5 kV voltage and 12 mm working distance. Prior to SEM analyses, samples were subjected to sputtering using Denton Desk V Sputter (Denton Vacuum, LLC, Morretown, USA) and Carbon Coater (Denton Vacuum, LLC, Morretown, NJ, USA) to prevent charging and improve imaging quality. The XRD analysis was conducted using the Panalytical X’pert Pro Diffractometer (Malern Panalytial Inc, Westborough, MA, USA) to detect the mineralogical compositions of various samples. The thermogravimetric analysis (TGA) was performed on chalcopyrite ore using a LECO furnace device (LECO Coporation, St Joseph, MO, USA) to evaluate its thermal stability and decomposition behavior. The sample was subjected to controlled heating while weight loss was continuously monitored as a function of temperature. This analysis aimed to identify key thermal events, such as moisture loss, volatile release, and decomposition of the ore. The data obtained from TGA are crucial for understanding the thermal characteristics of chalcopyrite and optimizing its subsequent processing steps.

3. Results and Discussion

3.1. Sample Characterization

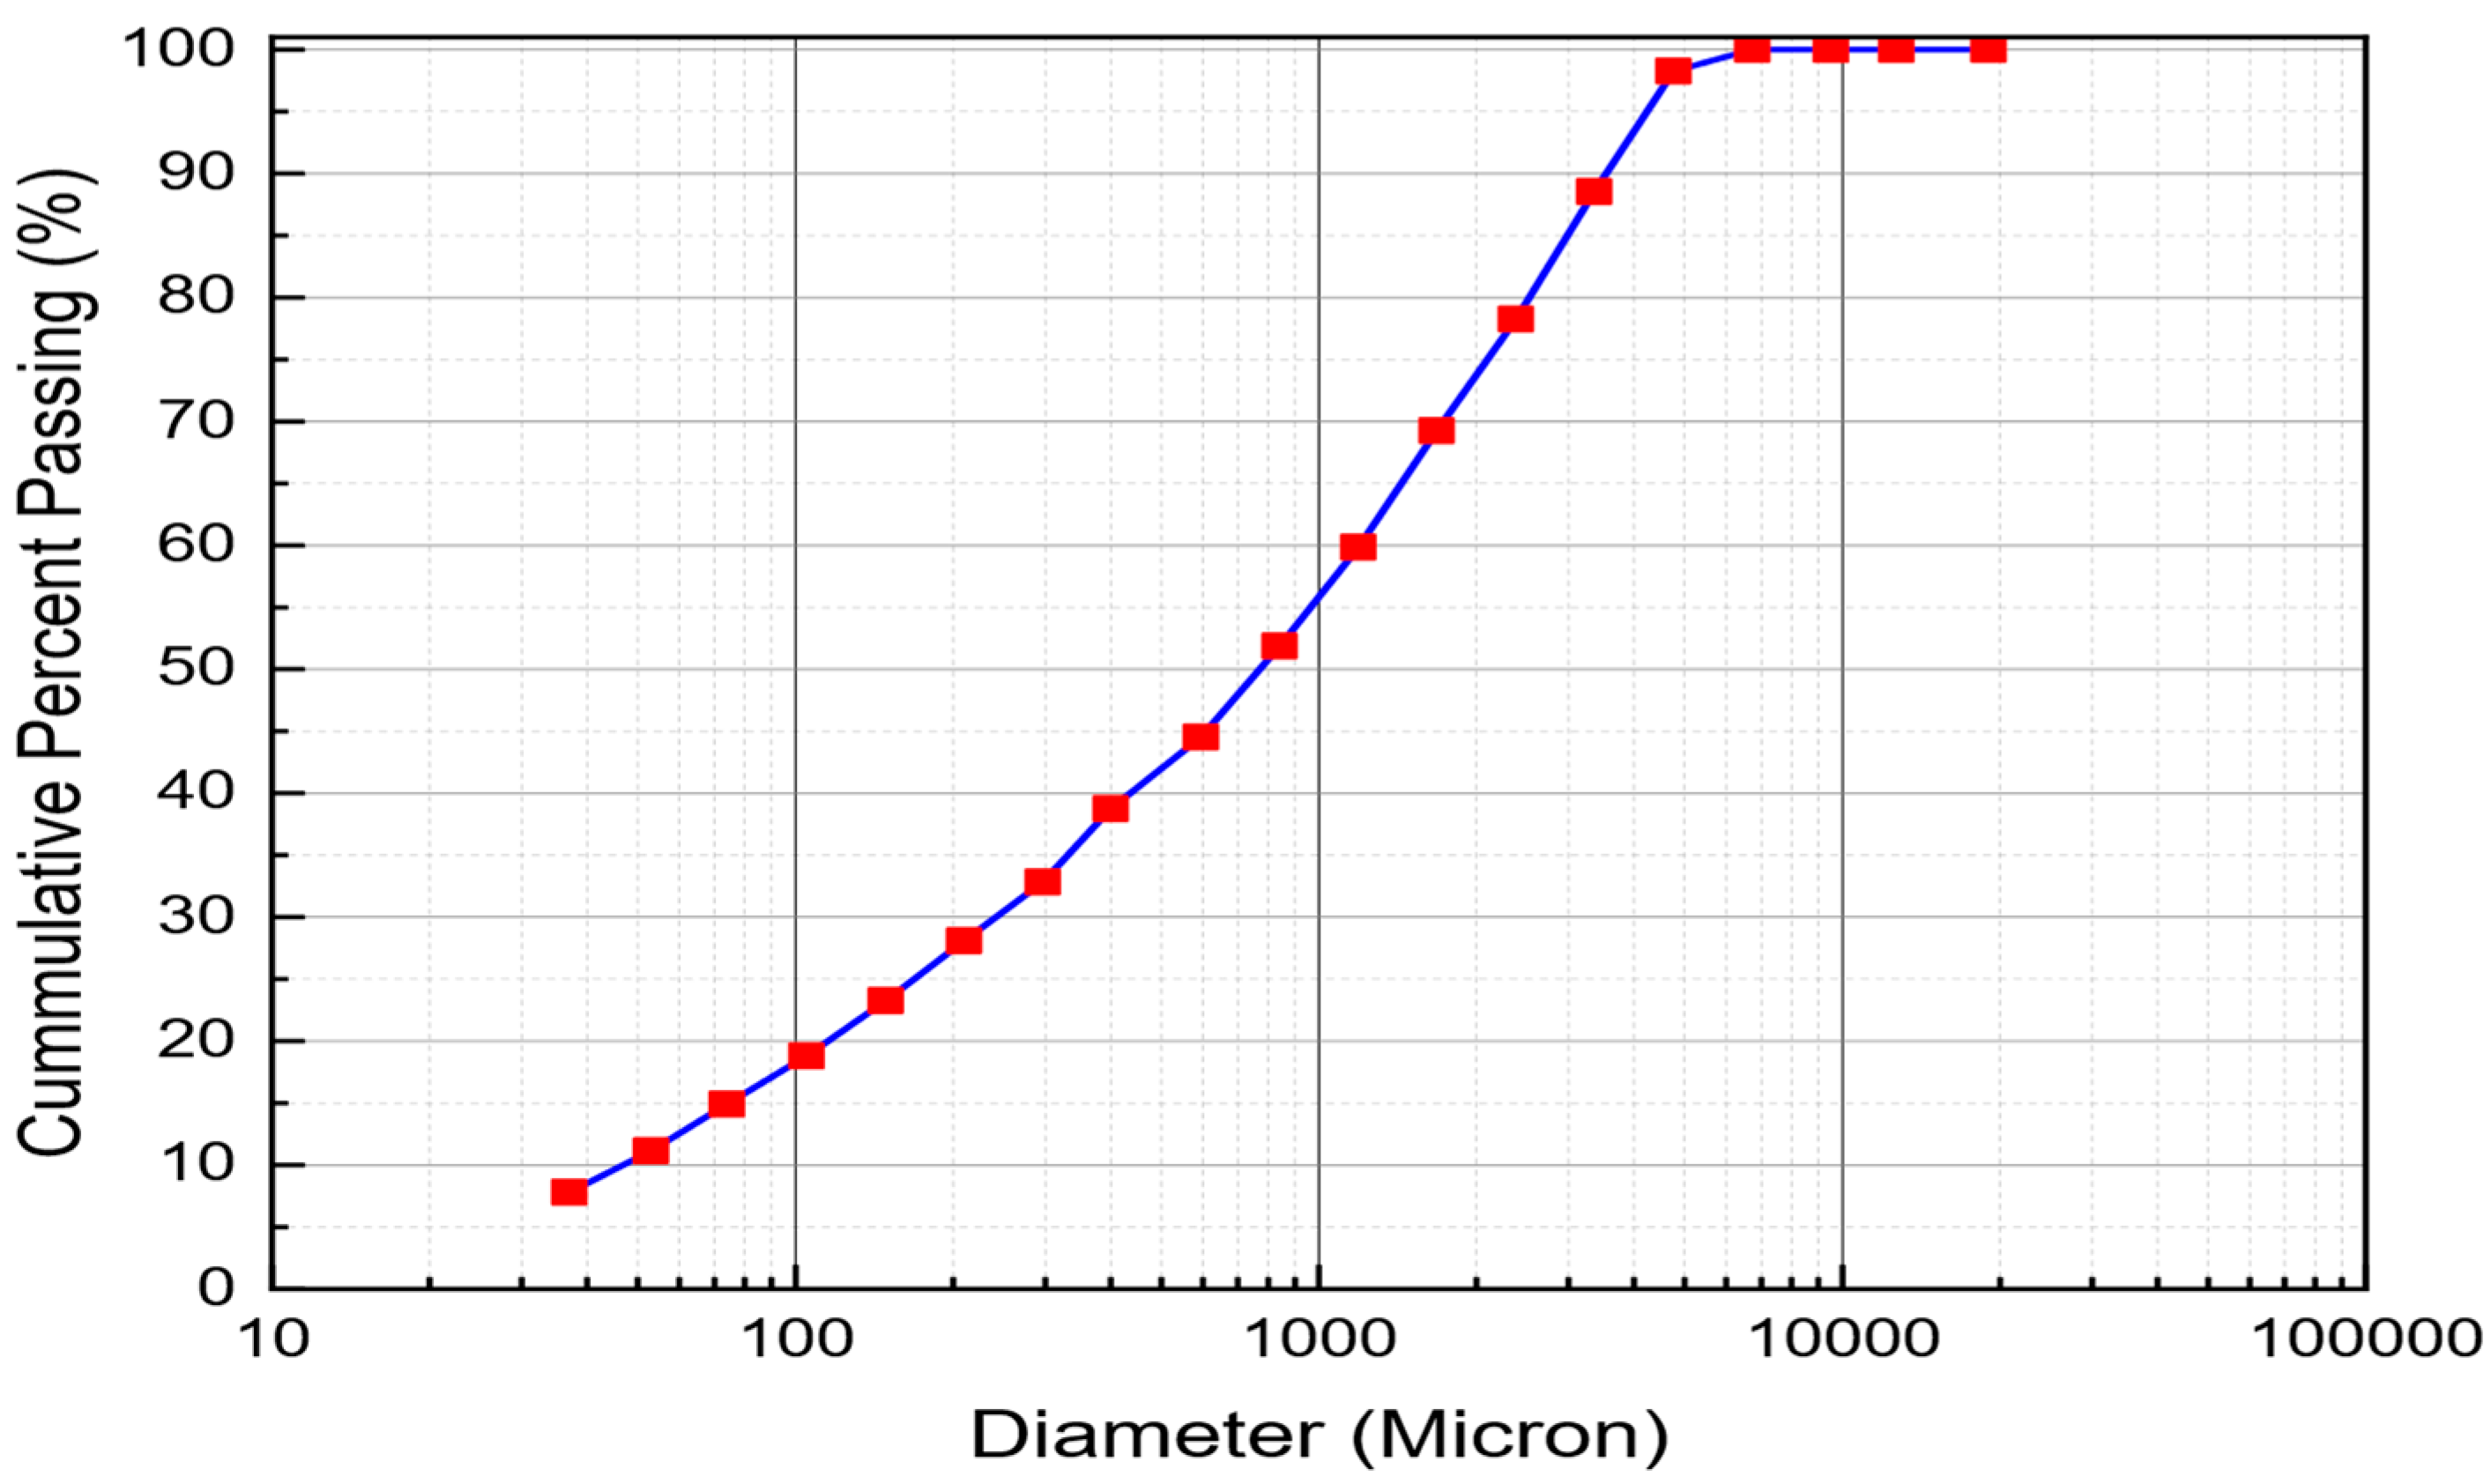
The chalcopyrite ore was first microwave digested with aqua regia, followed by ICP-MS analyses to determine its elemental composition. As shown in Table 3, the analysis revealed that copper (Cu), a primary component of chalcopyrite, was present at an average concentration of 8147.09 ppm, which is significant due to copper’s economic value and its role in metallurgical processes. Additionally, elements such as iron (Fe), silicon (Si), and aluminum (Al) were detected in considerable amounts, reflecting the complex mineral composition of the ore. Trace elements, including molybdenum and cerium (Ce), were also present, indicating the presence of rare and industrially important metals. The data from ICP-MS provide valuable insight into the elemental composition of the chalcopyrite ore and its potential processing strategies. Besides, the F80 of the chalcopyrite ore sample, representing the particle size at which 80% of the material passes through the sieve, was determined using the wet sieving technique. This method ensures accurate measurement of particle size distribution by preventing agglomeration and providing consistent results. The F80 was found to be approximately 2546 microns, as depicted in Figure 3.

3.2. Ball Mill Grinding Tests

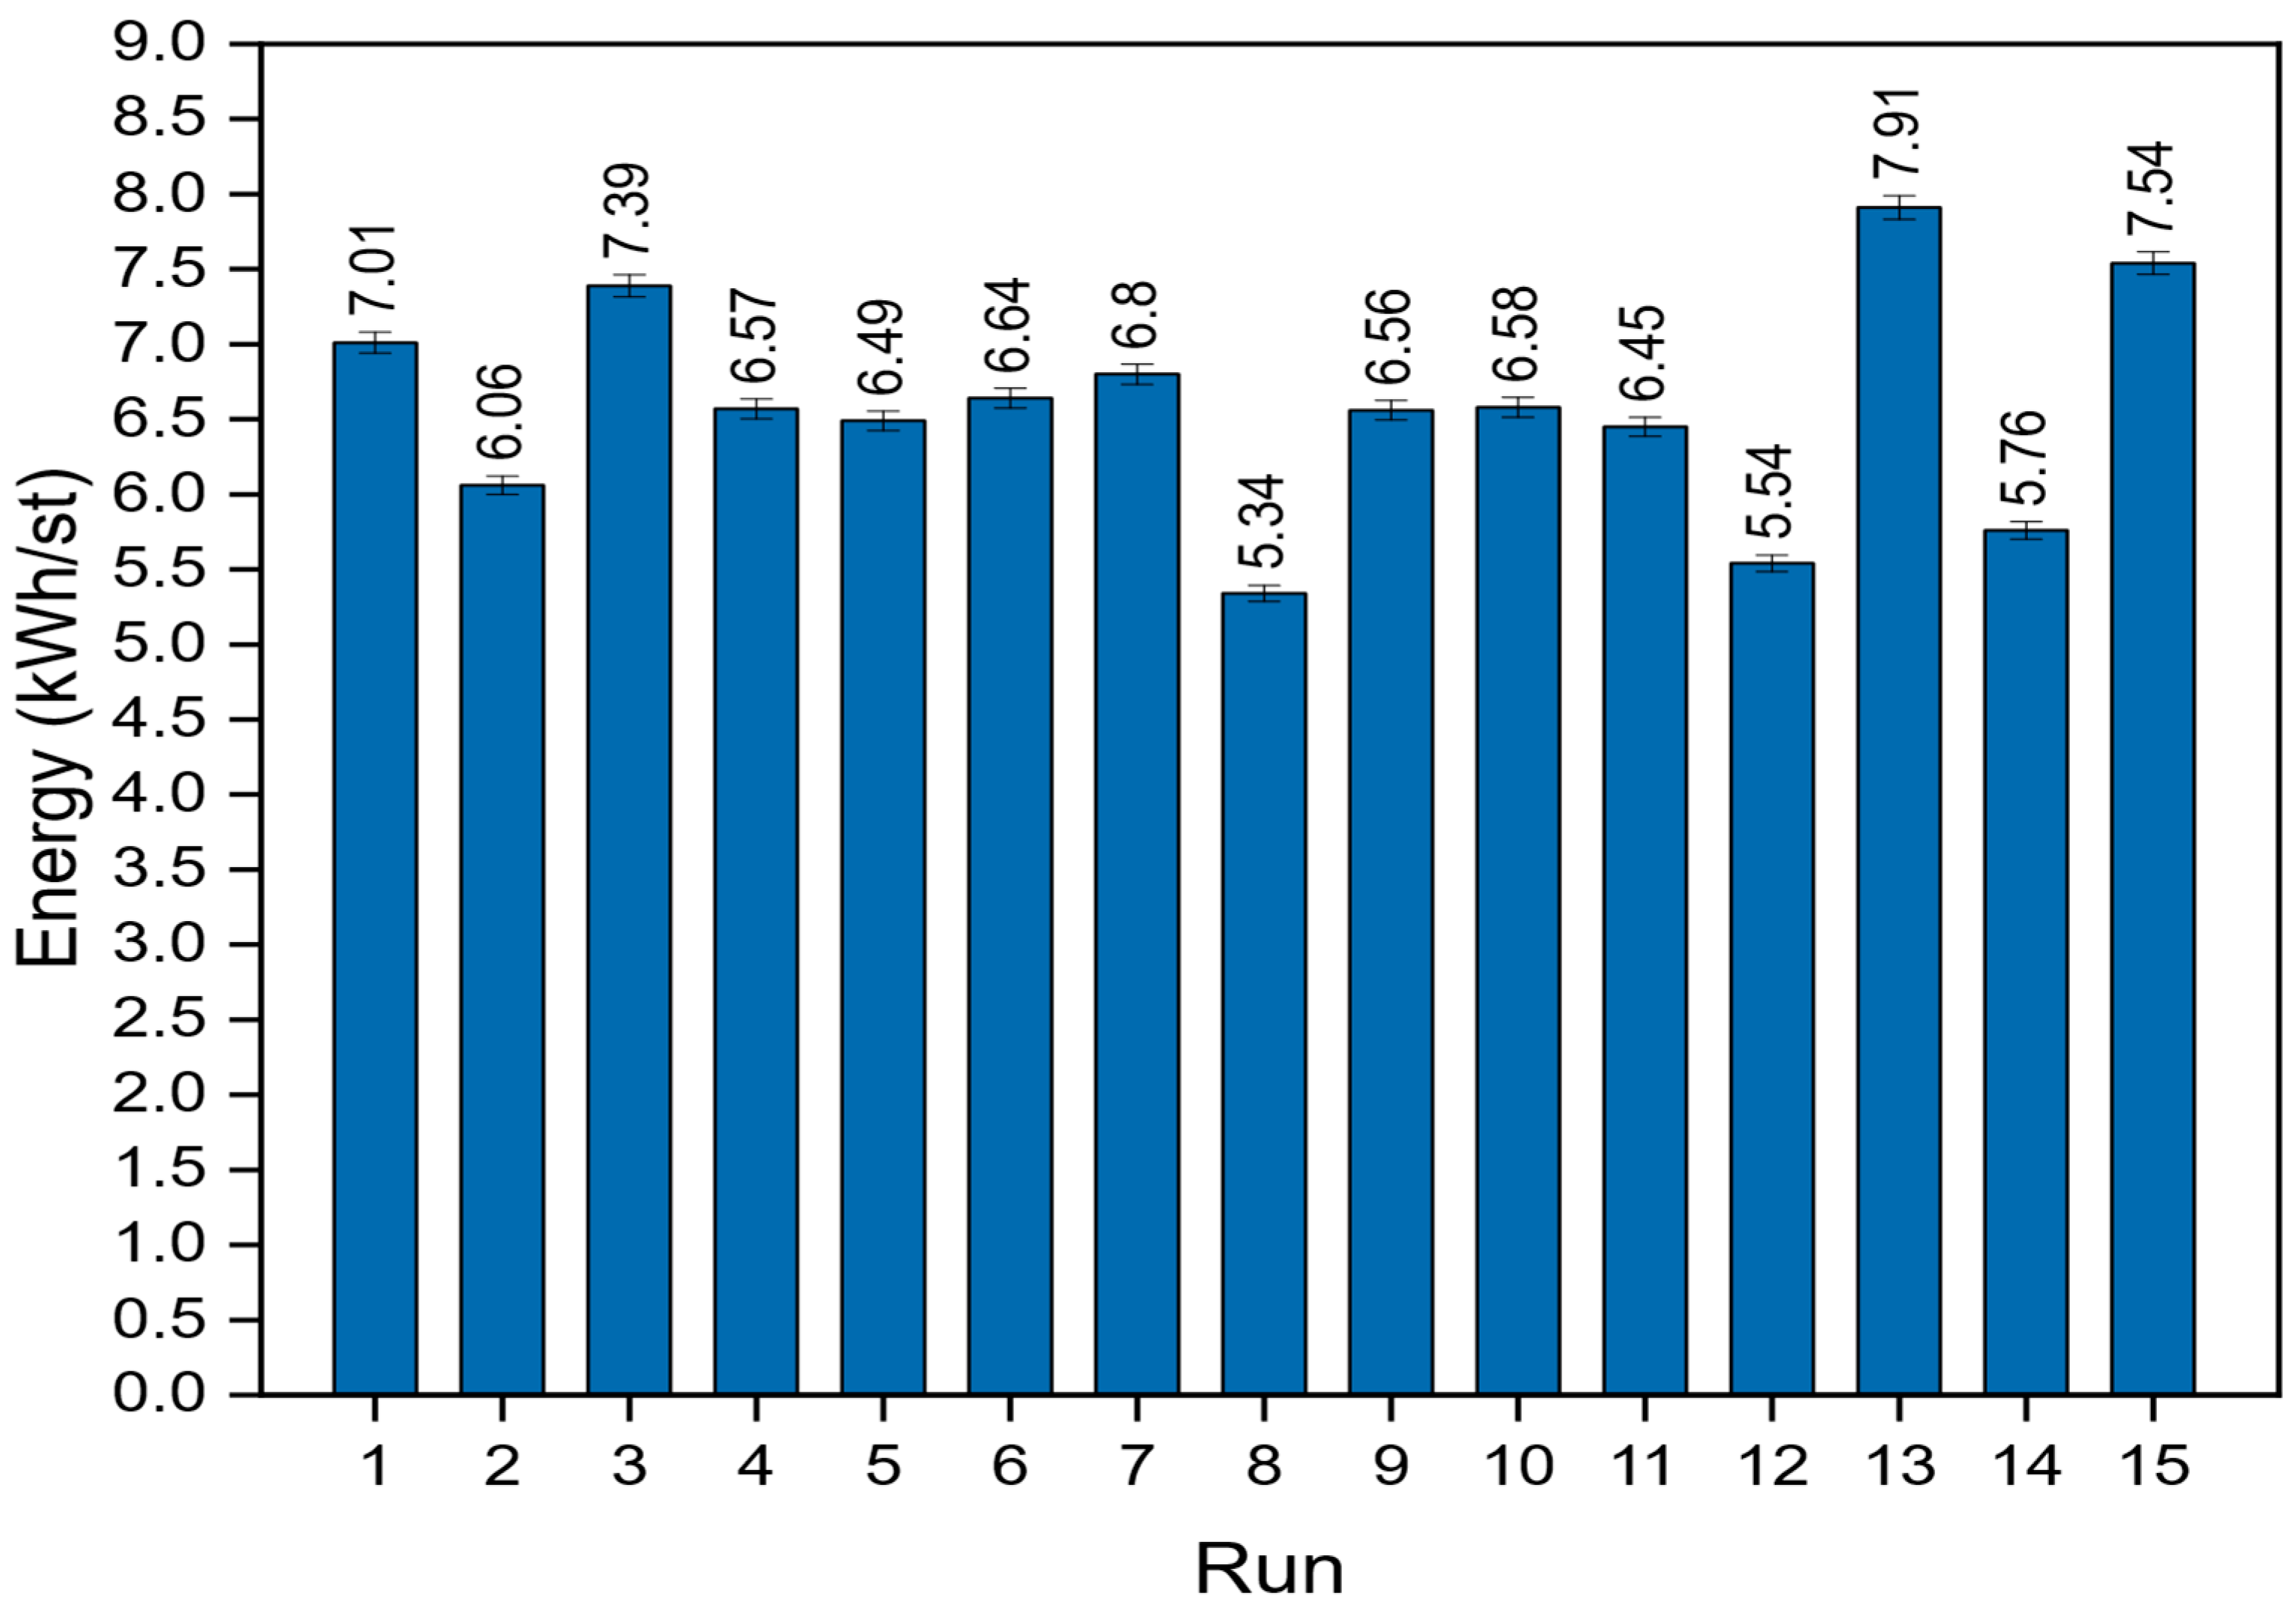
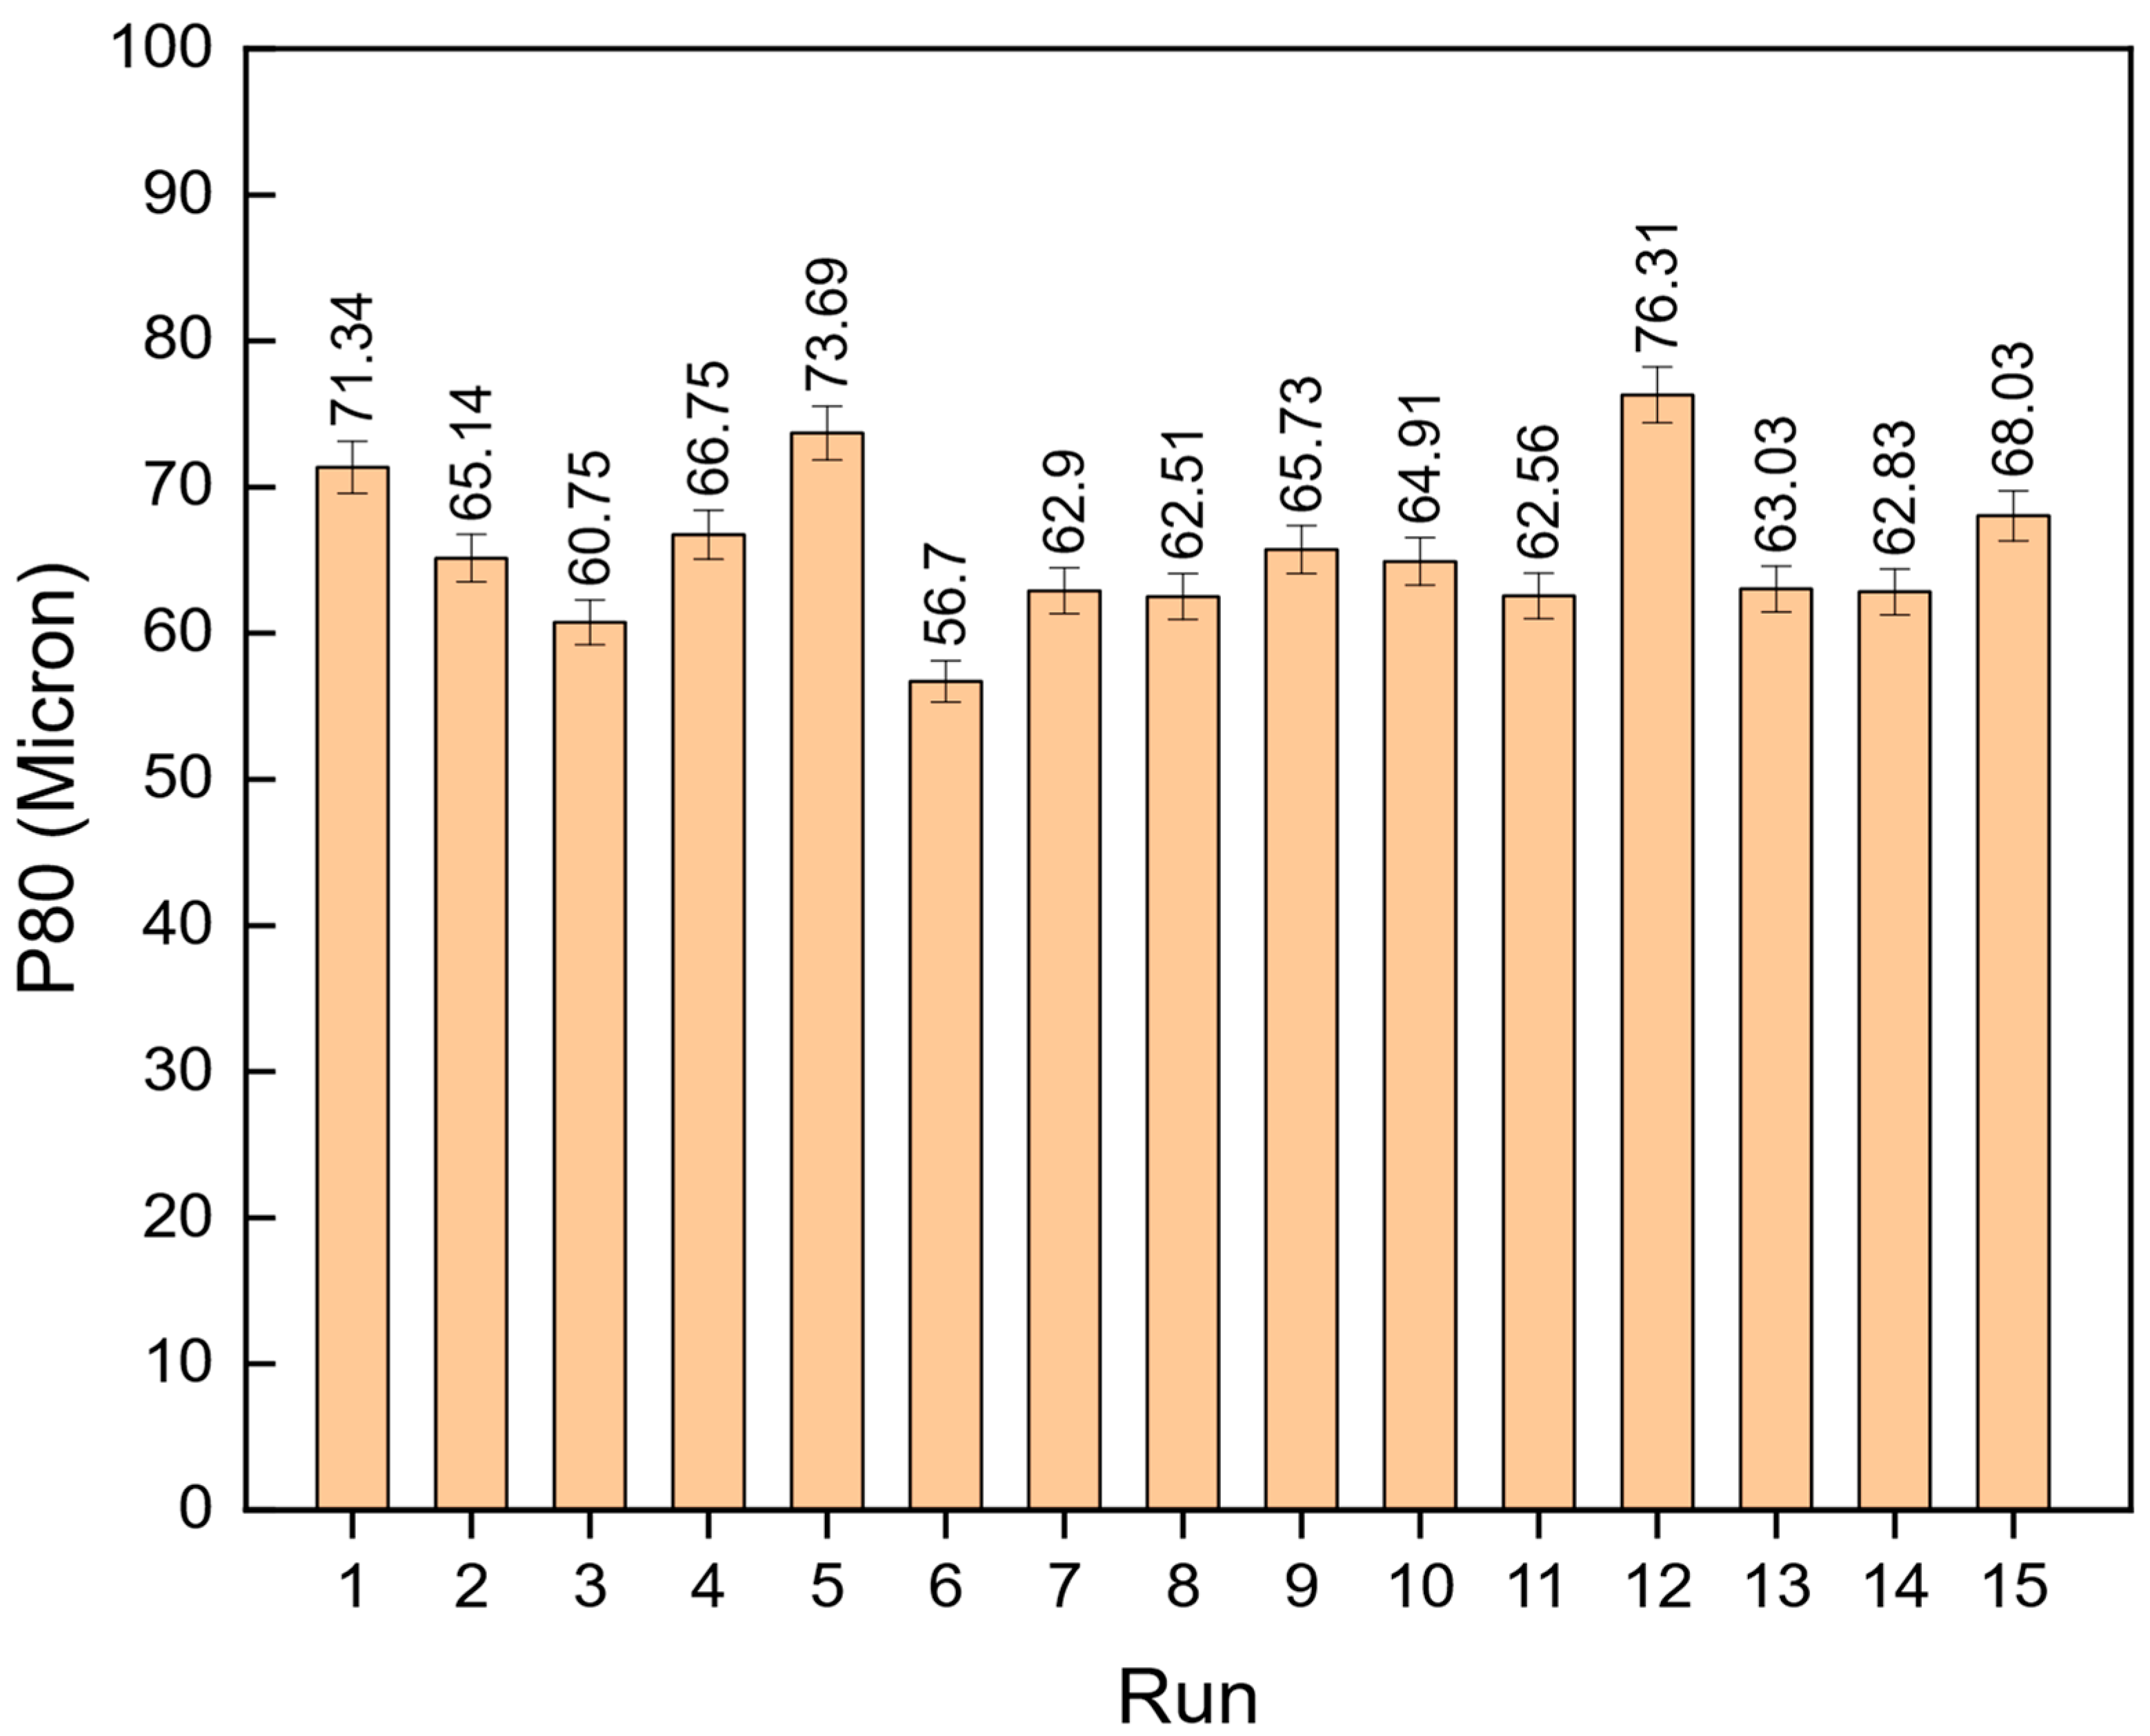
All 15 laboratory ball mill grinding tests were completed following the tests designed using the Box–Behnken design. The ground product P80 and the SE value of each test were measured and are shown in Table 4. As seen, there was a variation in the product particle size and comminution energy consumption with a change in the input operating parameters, including thermal pretreatment temperature, grinding media, ore mass, and mill speed. As seen, the product P80 varied from 56 to 73 microns, while the SE value fluctuated between 5.34 kWh/st and 7.91 kWh/st.

3.3. SE Consumption and Product P80

As detailed in Section 2, power consumption was measured in real time during each 30 min test using both a torque meter and a variable frequency drive (VFD). The data collected from these devices were then processed using MATLAB software to calculate the SE consumption. Each test produced a SE value based on the adjusted parameters, as shown in Figure 4. This approach ensured accurate real-time monitoring and analysis of energy consumption during the grinding process.
The product P80 was another key result obtained using a wet sieving technique by a series of square roots of two sieves. This sieving technique helps minimize errors, particularly clogging in finer sieves, ensuring more accurate size distribution measurements. Figure 5 presents the results of the product P80 for the various test runs. As shown, the product P80 was influenced by changes in the experimental parameters, highlighting the impact of operational adjustments on the final particle size.

3.4. Statistical Analysis

As previously mentioned, the Box–Behnken design was employed for designing experiments and examining the effects of the specified parameters on two target outcomes: product P80 and SE consumption. The initial phase of analyzing how operating factors affect grinding responses involved developing a parametric model that could accurately predict the desired response within the established high and low levels of the factors. After constructing the initial model, the parameters were examined to detect any anomalous data, facilitating the optimization of the model for the best fit. This process resulted in the creation of nonlinear prediction models for grinding responses, such as SE consumption (Equation (4)) and product P80 (Equation (5)), derived from the experimental results of the grinding tests:
E n e r g y   C o n s u m p t i o n = 6.57 + 0.73 × A + 0.44 × B + 0.36 × C + 0.002 × A B + 0.005 × A C + 0.004 × B C + 0.011 × A 2 + 0.14 × B 2 + ( 0.14 × C 2 )
P 80 = 65.54 + ( 0.15 × A ) + ( 5.14 × B + ( 2.83 × C ) + ( 1.36 × A B ) + ( 0.62 × A C ) + ( 1.70 × B C )
where factors are presented in coded form, and Table 5 shows the definition of each code. Due to the high value of the marginal probability value (p < 0.05) of parameters and Fisher’s F-test, the recommended prediction models were all deemed significant.
The impact of operating parameters on grinding responses was evaluated using the analysis of variance (ANOVA) method. Results from the ANOVA for SE and product P80 are provided in Table 6 and Table 7, respectively. As can be seen, the suggested model for SE was a quadratic model, while for product P80, the 2FI model was suggested. According to these results and the p-values less than 0.05, it was evident that all operating factors significantly affected SE consumption. In the case of product P80, only ball filling and thermal pretreatment showed a significant effect, and speed variation did not impact product P80 much.
The Model F-value of 10,622.79 implies the model was significant. There was only a 0.01% chance that an F-value this large could occur due to noise. The p-values less than 0.0500 indicated that the model terms were significant. In this case, A, B, C, B2, and C2 were significant model terms.
The Model F-value of 5.84 implies the model was significant. There was only a 1.30% chance that an F-value this large could occur due to noise. The p-values less than 0.0500 indicated that the model terms were significant. B and C were significant model terms in this case.

3.4.1. Effects on SE

As previously mentioned, three parameters were investigated, including the ball filling ratio, critical speed ratio, and thermal pretreatment. The ball filling ratio was considered at three levels: 30%, 35%, and 40% of the mill volume. The ball filling ratio had a two-sided effect on energy consumption. On one hand, increasing the ball filling ratio increased the mass of media in the mill, thereby increasing the SE consumption [14,15]. On the other hand, it also increased the mass of the powder since a constant ball-to-ore ratio of 20 was used throughout the tests, which affected energy consumption. According to Equation (3), the SE consumption was inversely proportional to the powder mass. As the powder mass increased, the denominator became larger, thus reducing the value of SE consumption. This suggests that increasing the powder mass, while keeping the grinding time constant, will result in lower SE consumption per unit mass of powder [16,17].
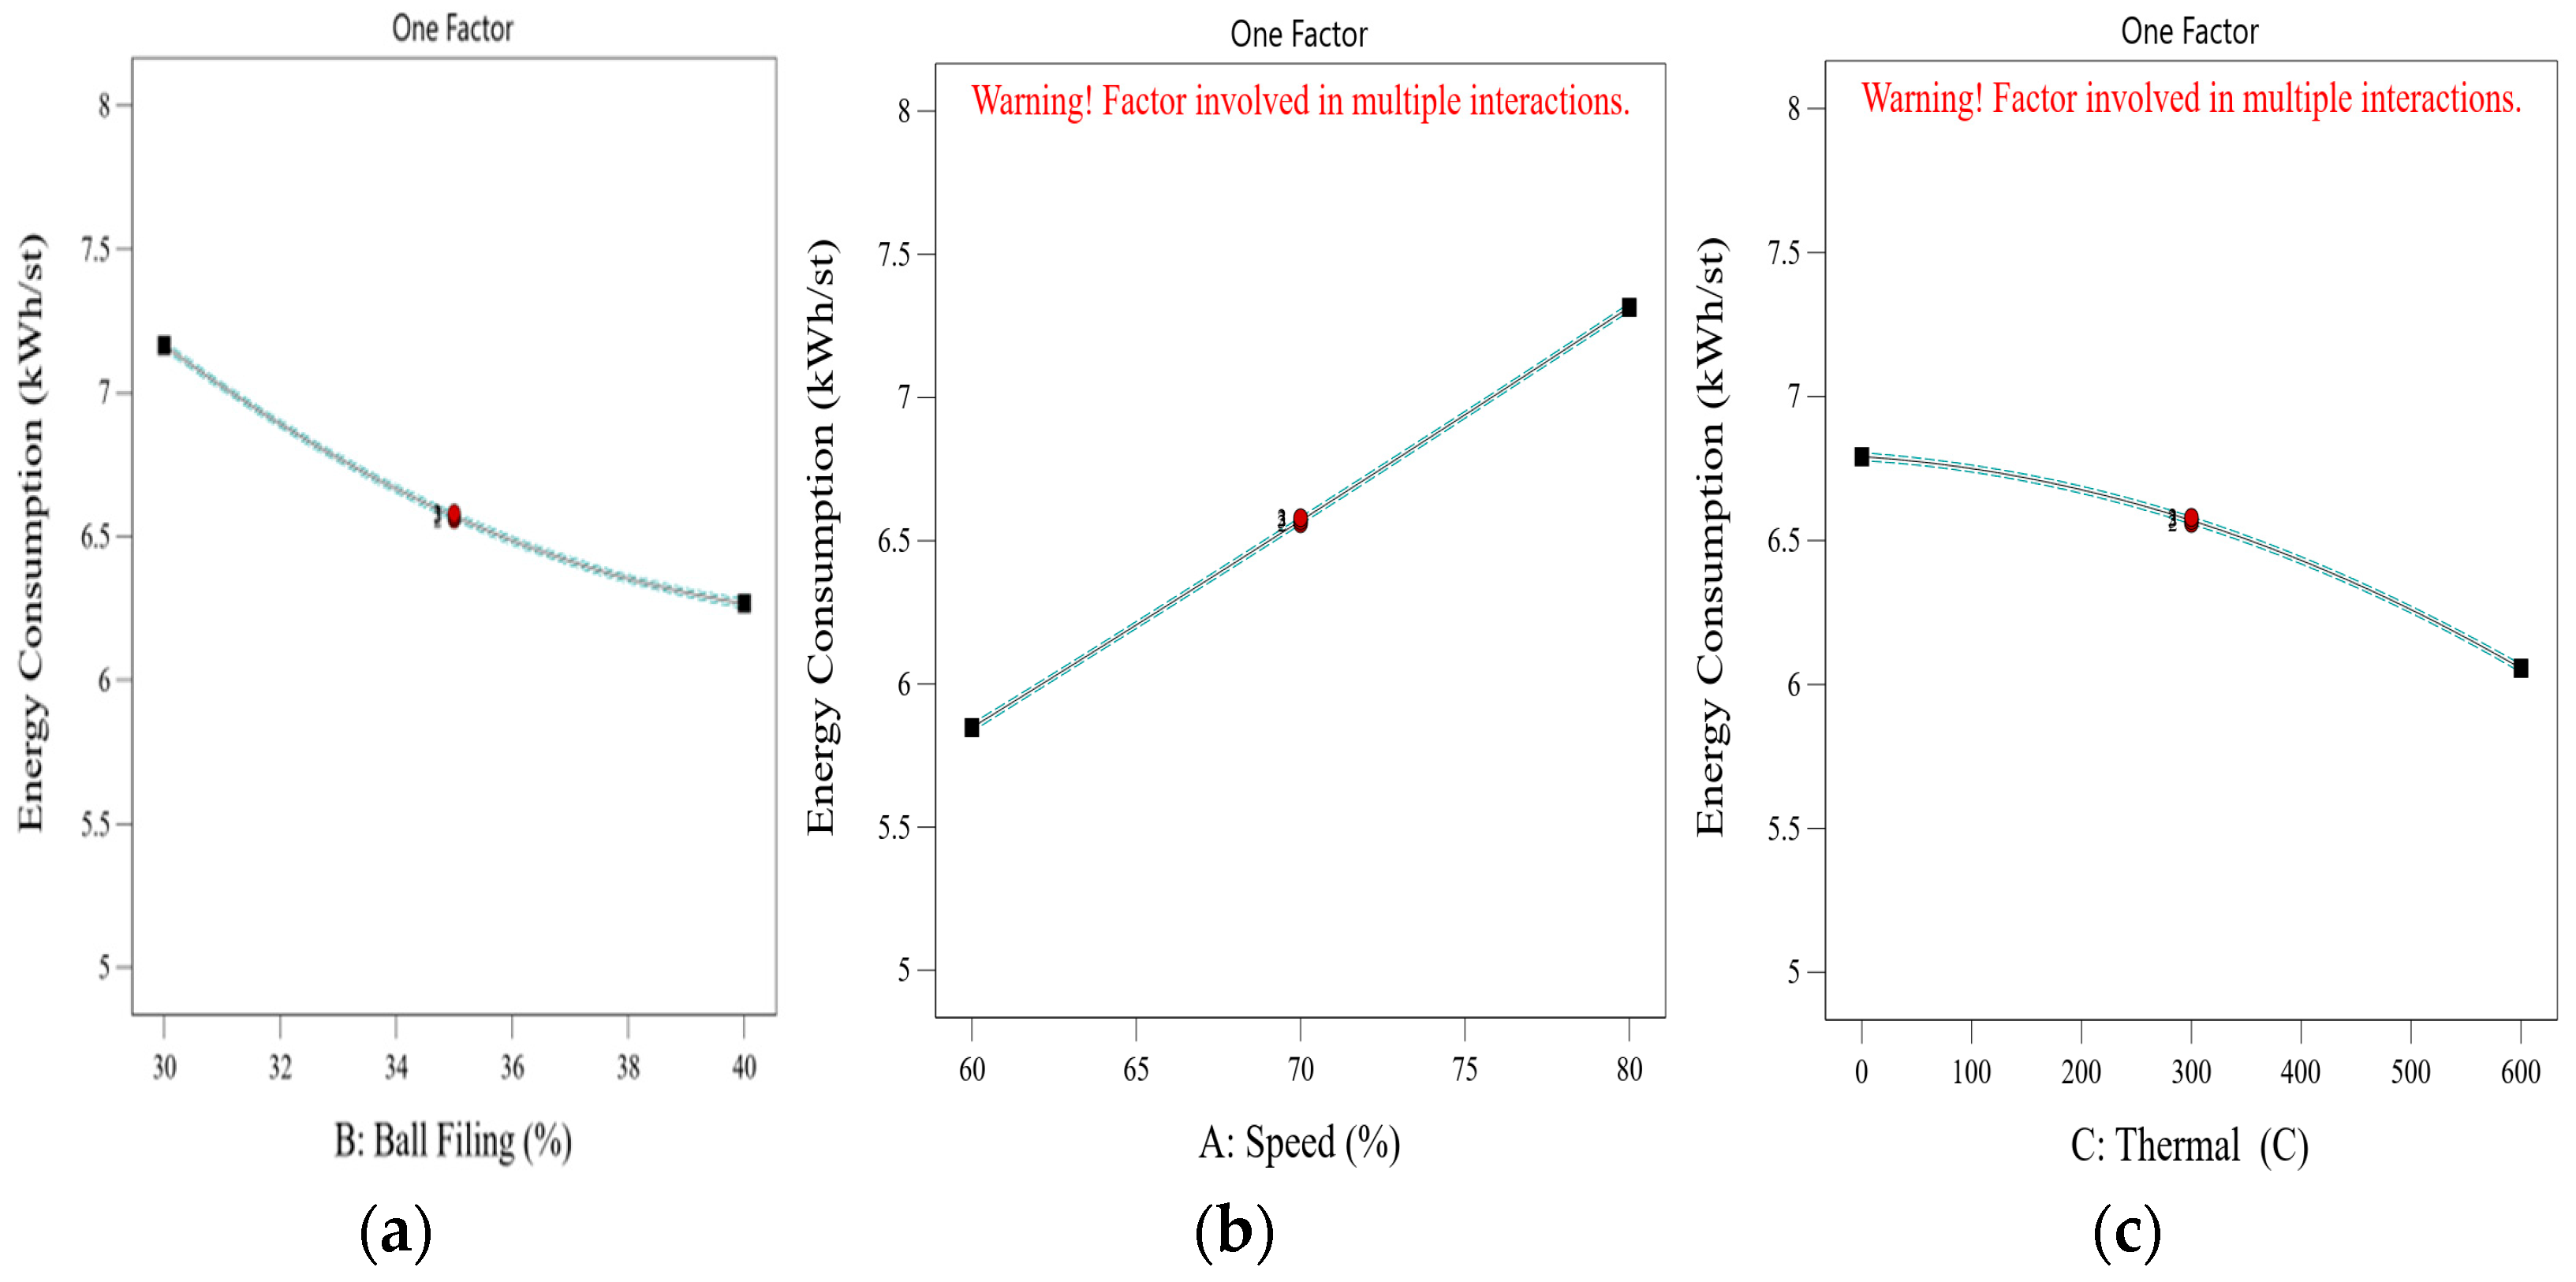
Figure 6a illustrates the effect of ball filling on SE consumption. As shown in Figure 6, increasing the ball filling ratio decreased energy consumption. This indicates that the mass of the powder played a more significant role than the change in media mass within the mill. However, the decrease in energy consumption became less significant when the ball filling ratio changed from 35% to 40%.
The next parameter investigated was the fraction of critical speed. Generally, SE consumption is a function of power and speed, directly proportional to the mill’s speed. By increasing the fraction of critical speed, the mill speed increased [18,19]. As shown in Figure 6b, this increase in mill speed led to higher energy consumption. Points are showing the first, last and average values of each result.
Thermal pretreatment was a novel aspect of this investigation. As illustrated in Figure 6c, increasing the pretreatment temperature from room temperature to 300 °C and 600 °C resulted in a significant reduction in grinding energy consumption. Figure 7 provides a comparison of energy consumption over time for runs 2 and 8, which were conducted under identical operating conditions of 60% speed and 35% ball filling. The key difference between the two runs is that run 2 utilized the raw chalcopyrite sample, while run 8 employed the chalcopyrite ore pretreated at 600 °C. The results clearly demonstrated the effectiveness of thermal pretreatment in reducing energy requirements during the grinding process.
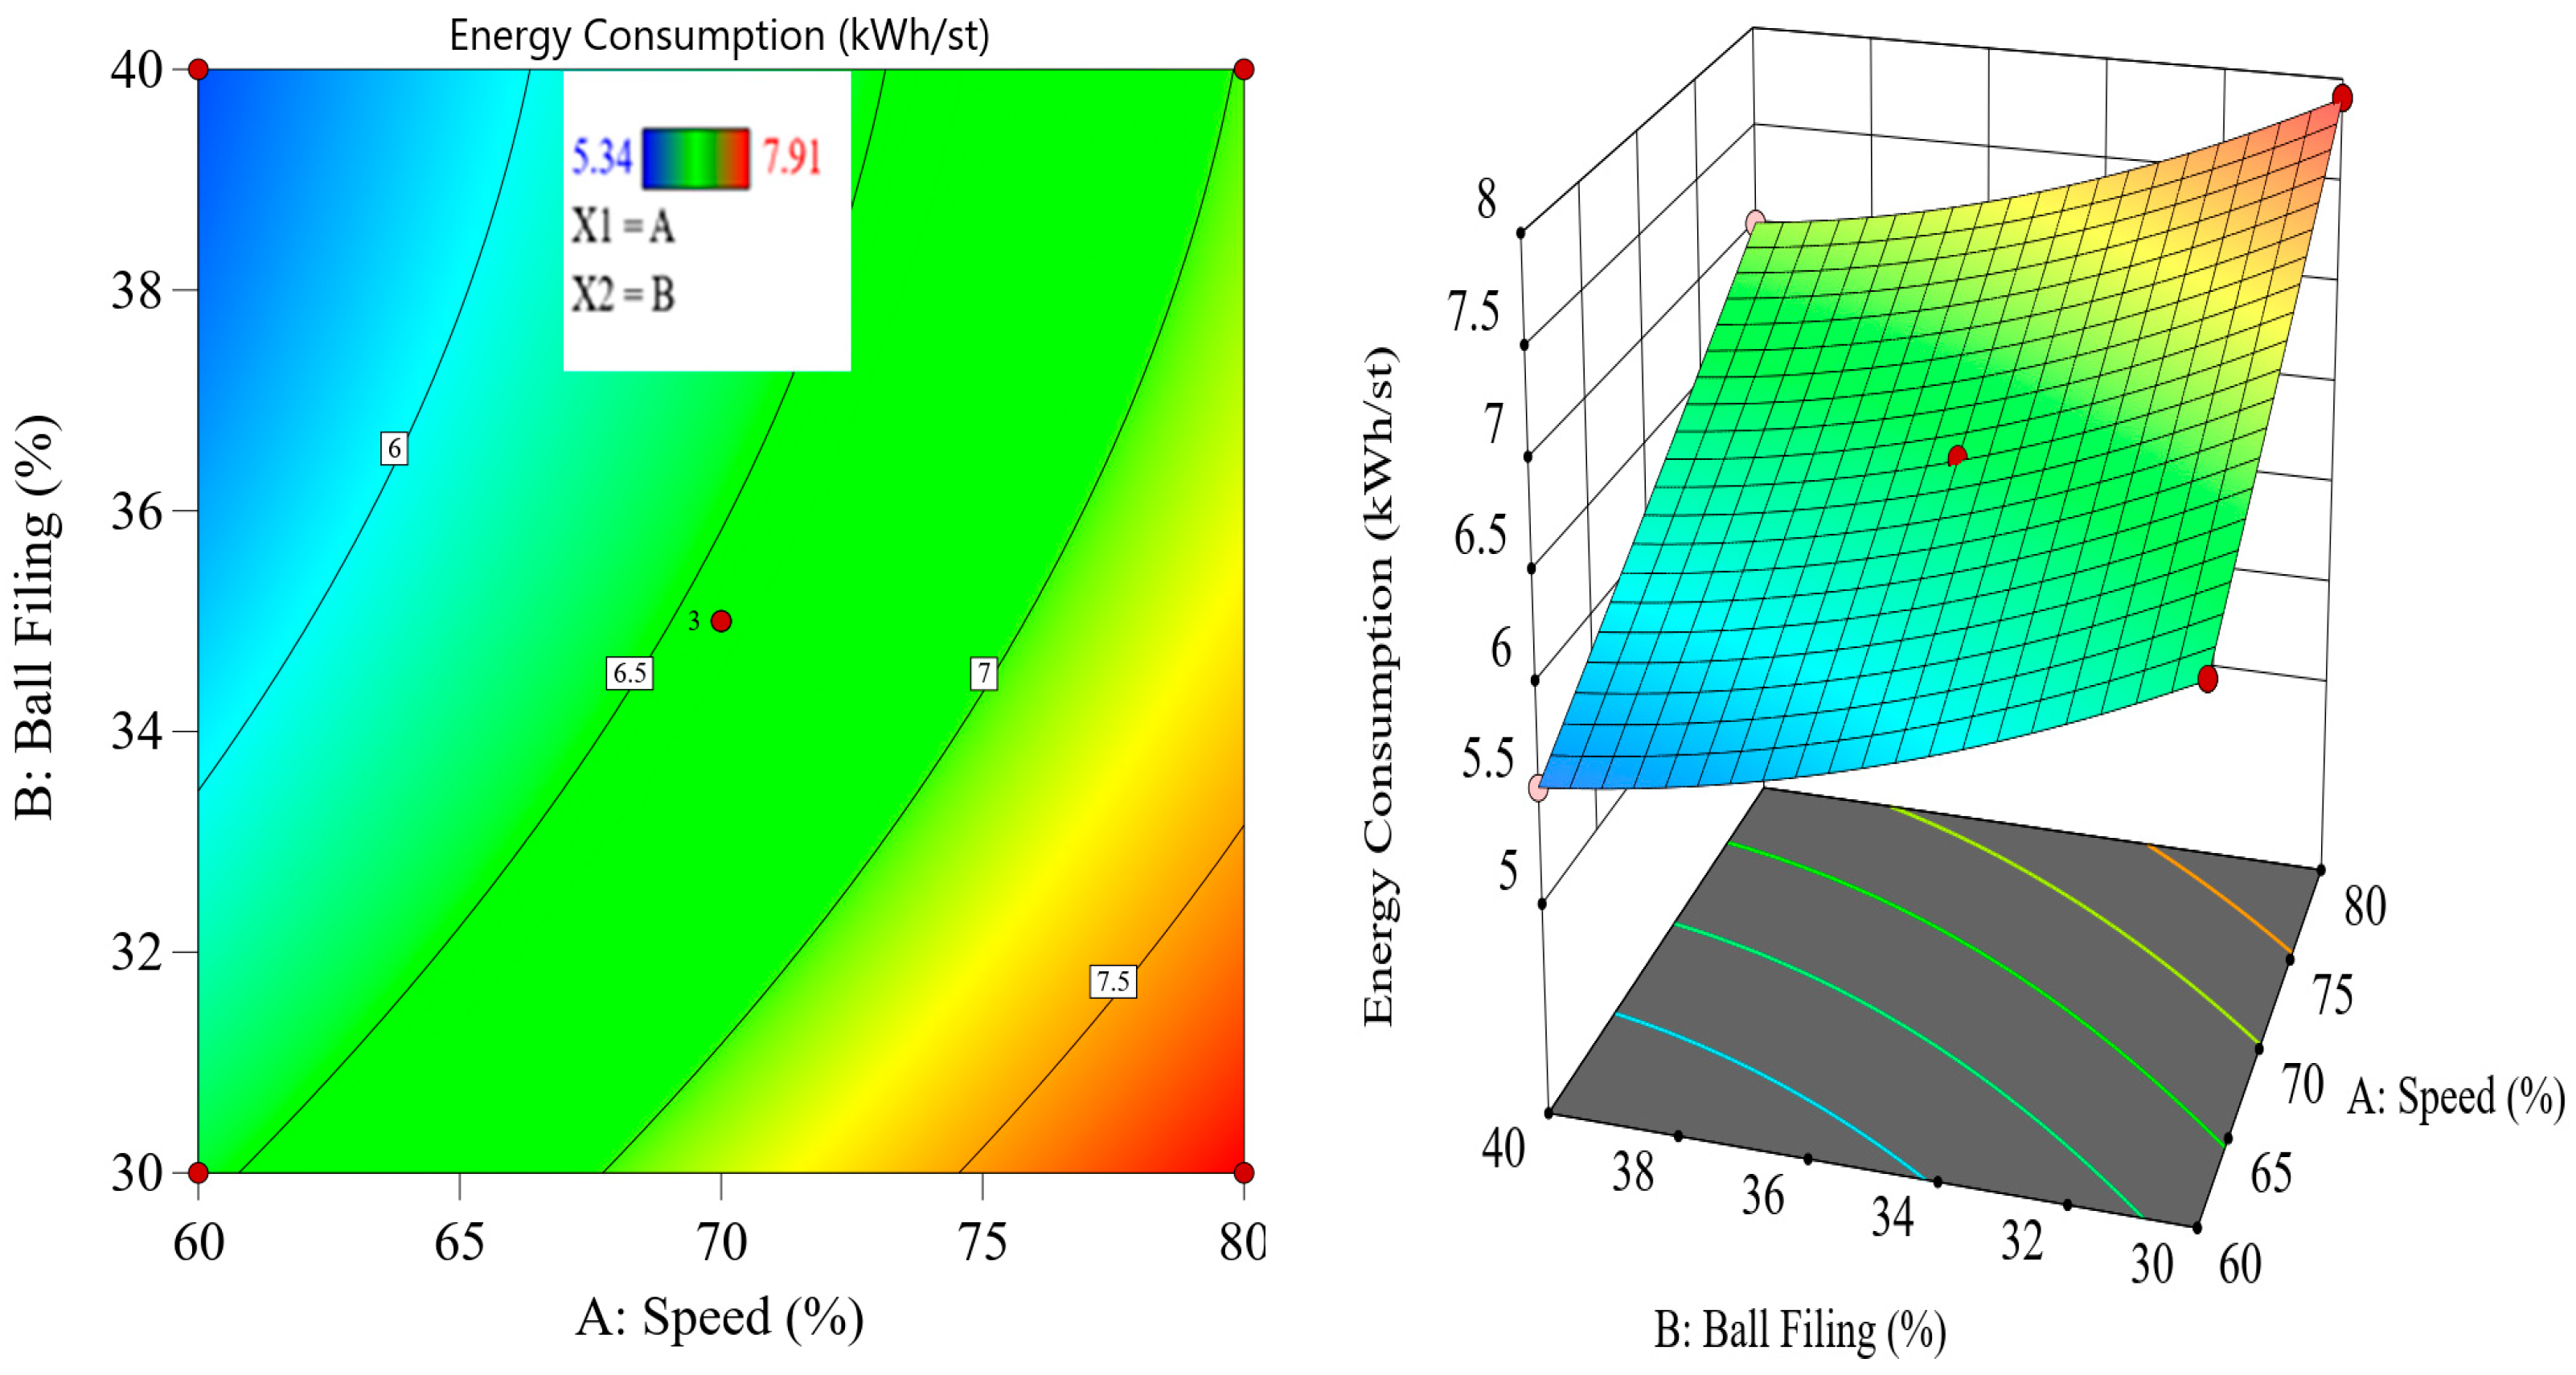
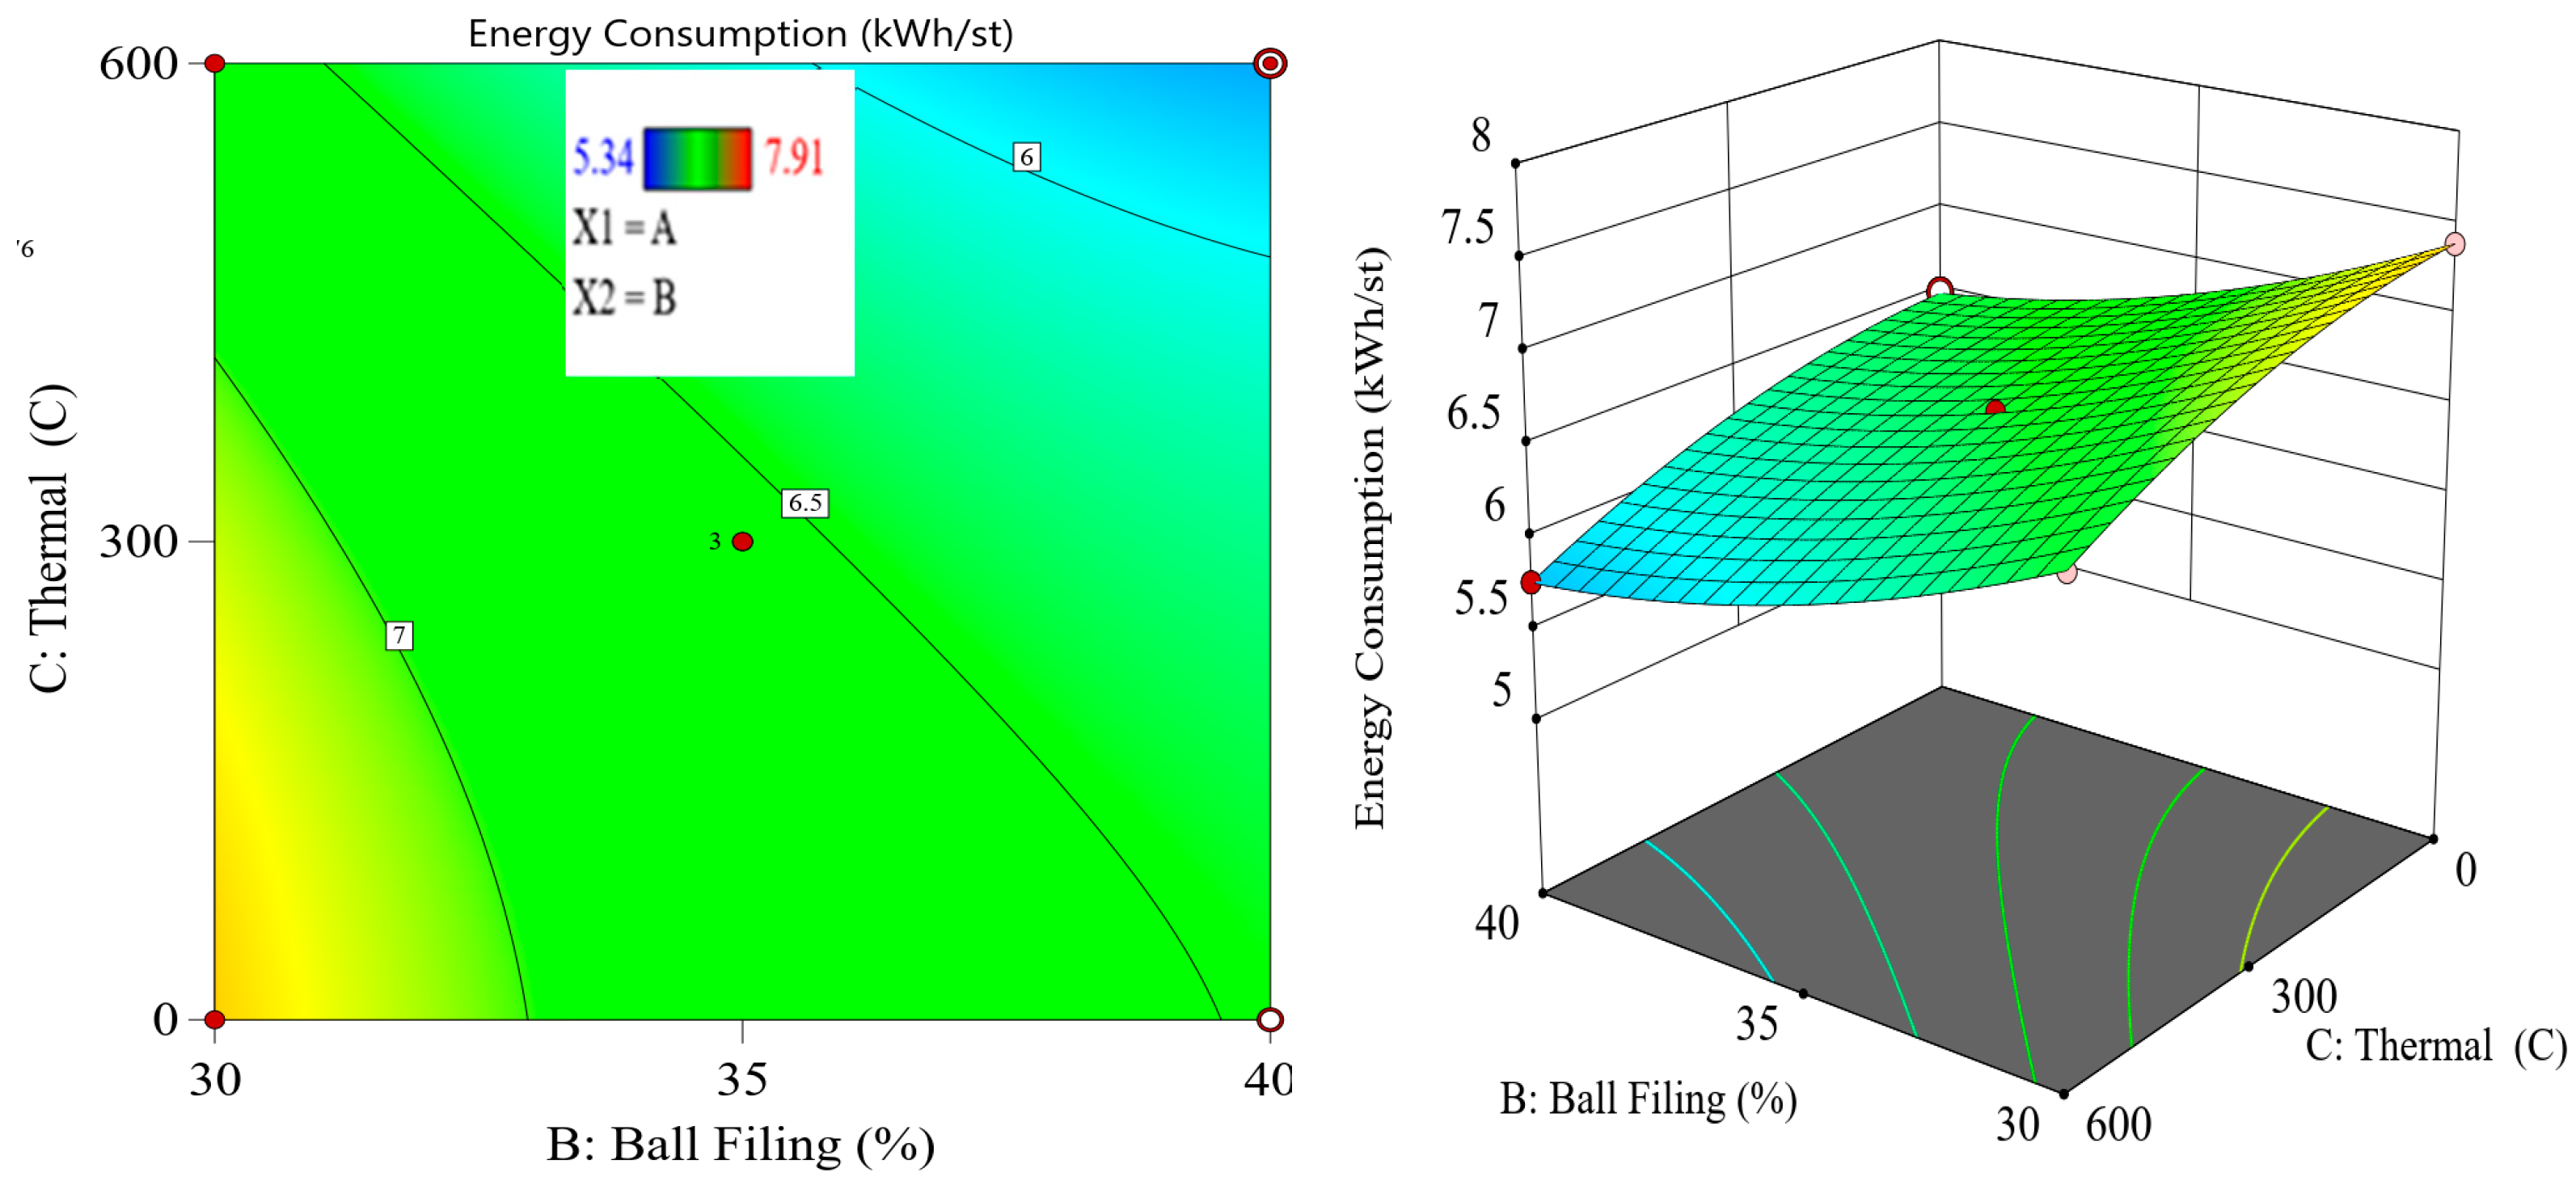
As seen in Table 4, after thermal pretreatment, energy consumption for chalcopyrite grinding was significantly reduced. It is interesting to note that the reduction in power draw over time (Figure 7) was more pronounced after pretreatment. The reduction in energy consumption after thermal pretreatment of chalcopyrite can be attributed to several factors. Thermal pretreatment can induce microfractures in the ore, increasing its brittleness and making it easier to break during grinding, which reduces the energy required for comminution [20]. Additionally, heating can alter the hardness of minerals, making them softer and less resistant to breakage, further contributing to reduced energy demand [21]. Thermal pretreatment can also lower the viscosity of the material, allowing it to flow more easily within the mill, thereby reducing the power draw during grinding [22], explaining the significant reduction of energy in grinding after pretreatment. Finally, the partial decomposition of chalcopyrite’s sulfide structure at high temperatures can make the material more friable, thus lowering the energy consumption [23]. These combined effects explain the observed 8–10% reduction in energy consumption during grinding after thermal pretreatment. In addition, contour and 3D plots illustrating the interaction effects of two parameters while keeping the third parameter at its middle level are provided in Figure 8, Figure 9 and Figure 10.

3.4.2. Effects on Product P80

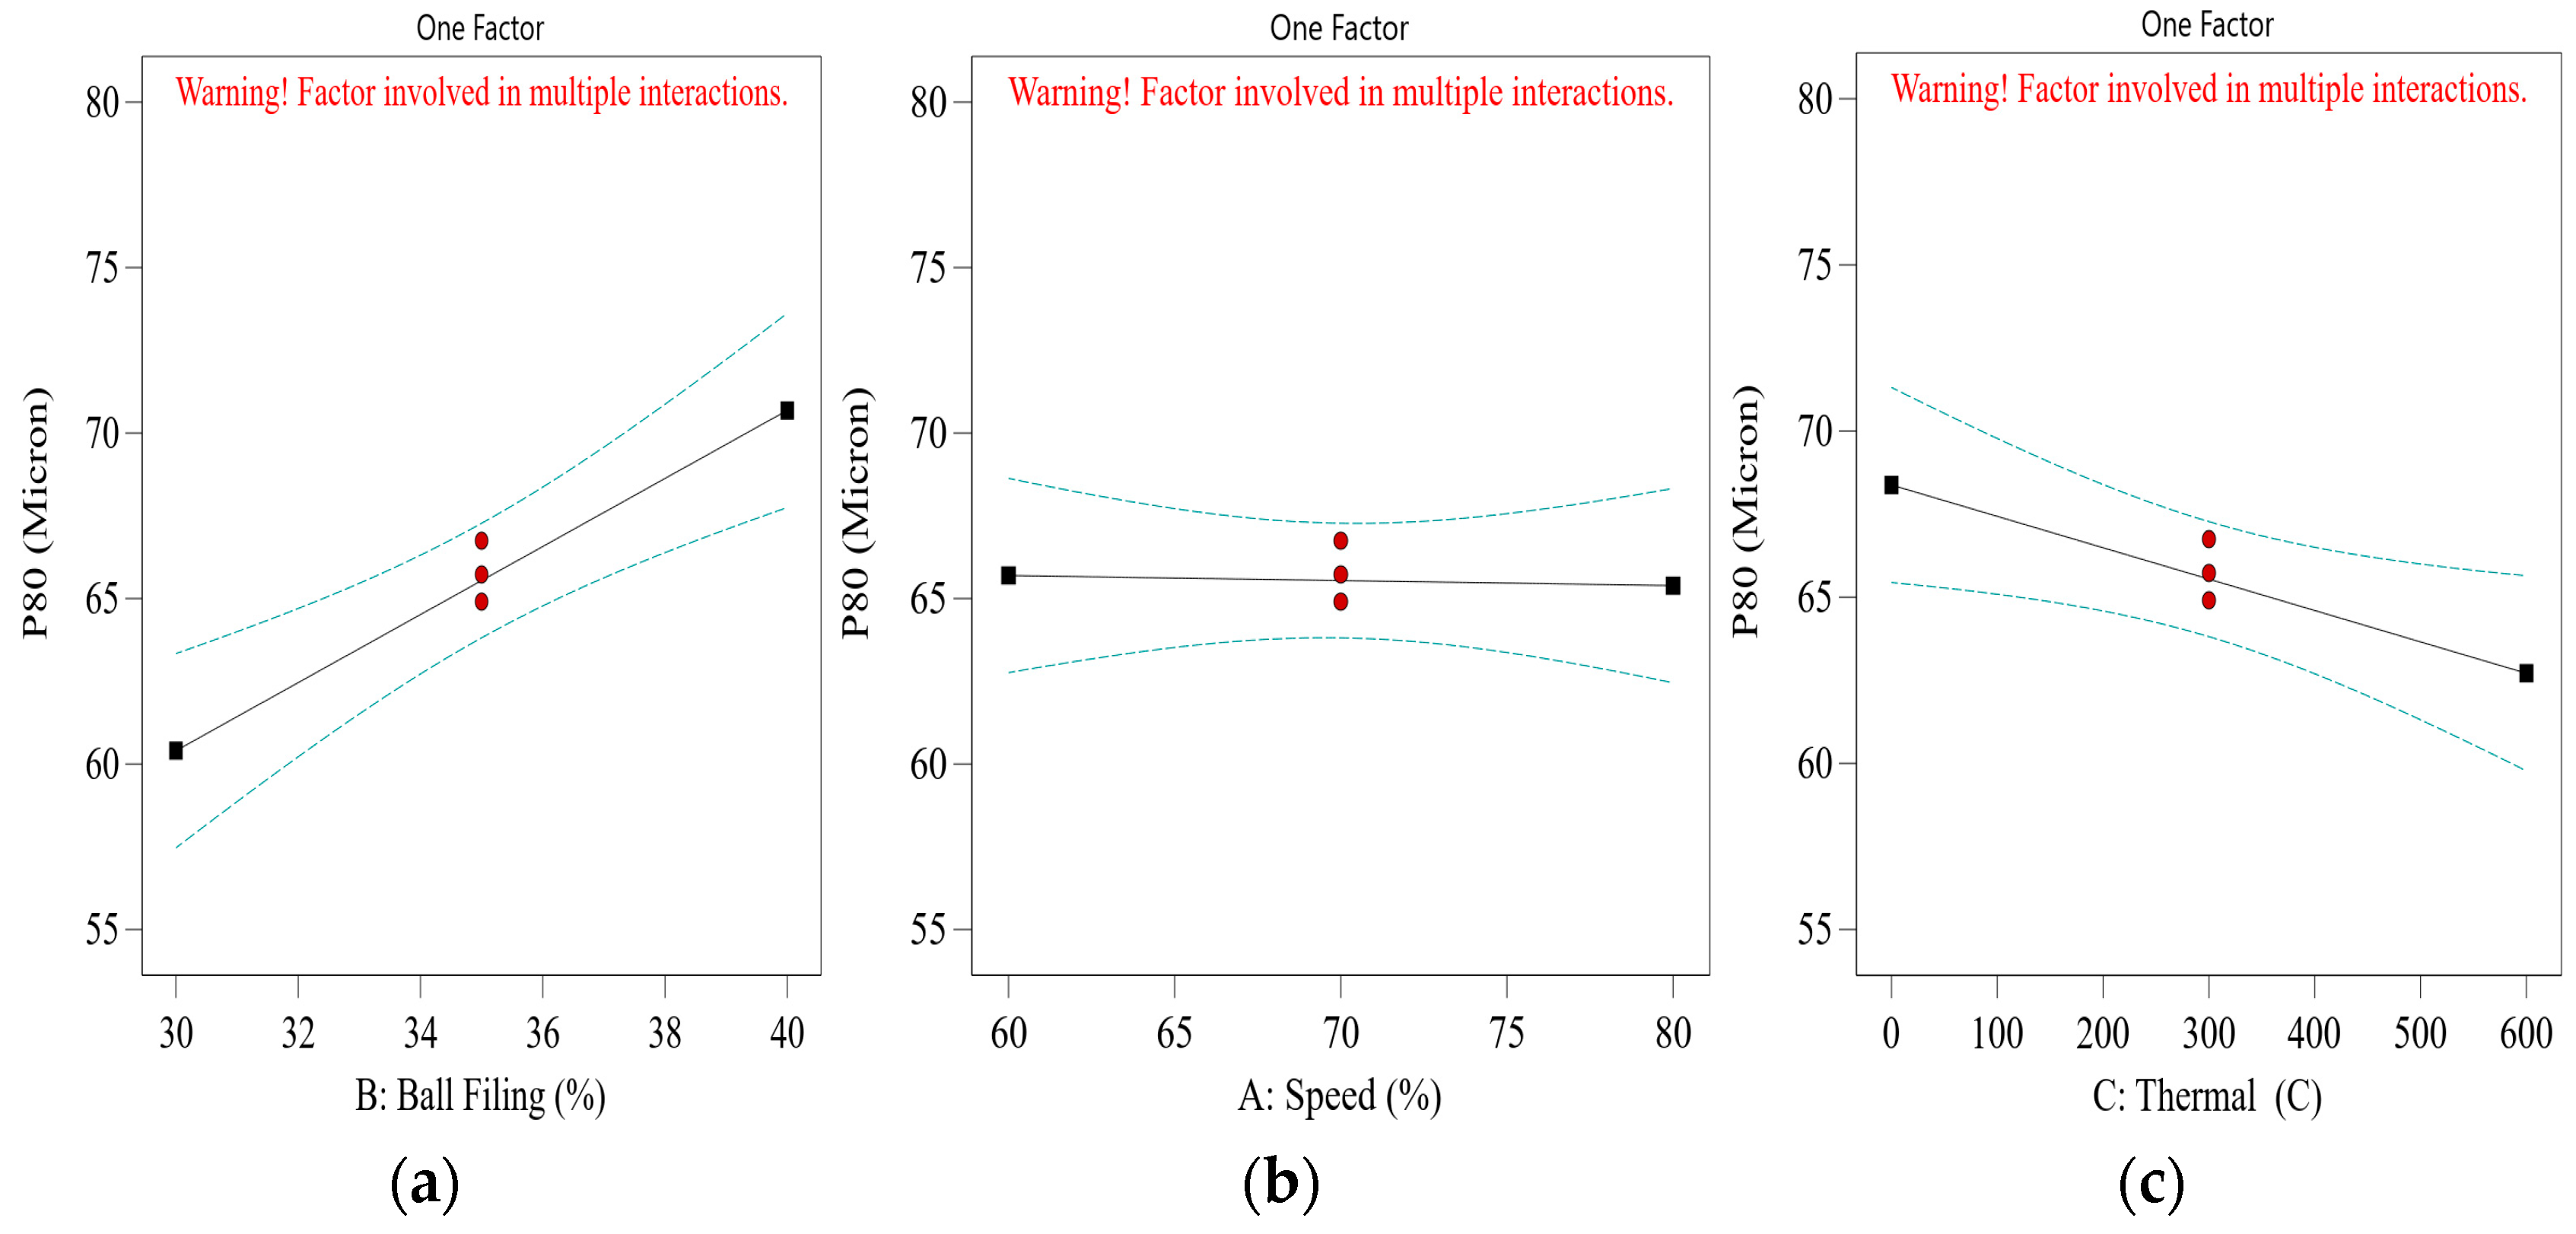
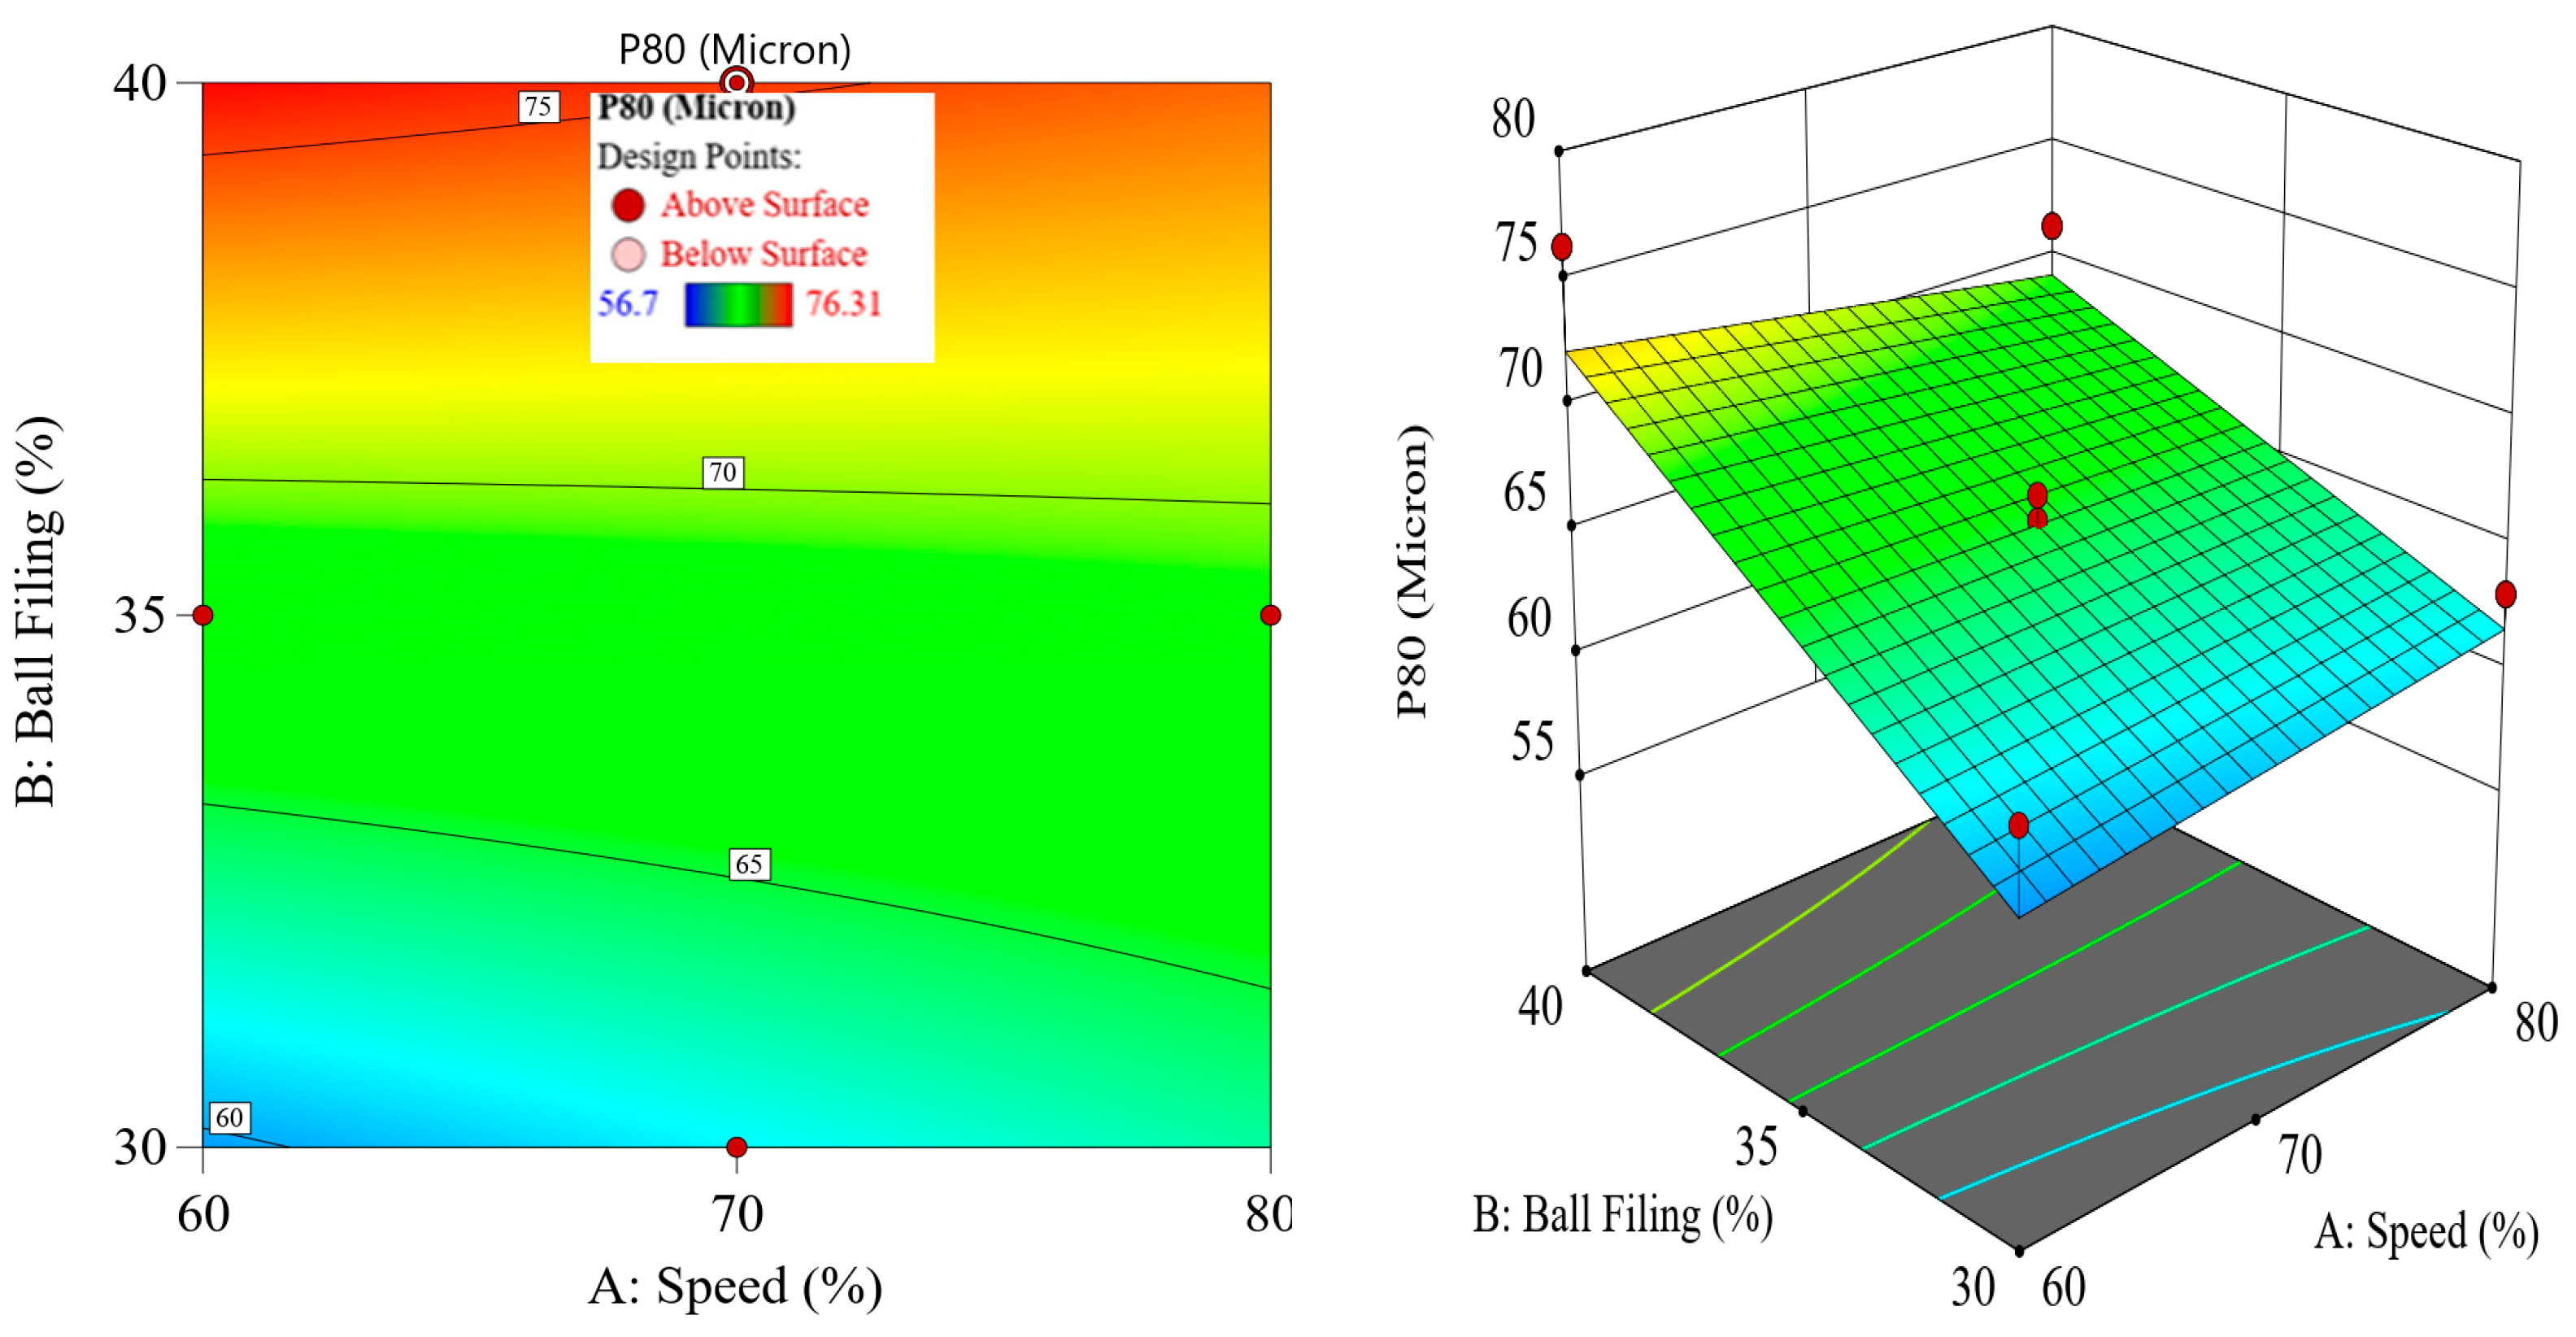
As can be seen in Figure 11a, by reducing ball filling from 40% to 35% and 30%, product P80 was reduced. This can be attributed to the better cascading movement with lower ball filing, which makes the grinding more efficient and corresponds well with previous studies [24].
Figure 11b illustrates the effect of mill speed on product P80. Dos are showg hig and ow level values, and dash lines are error bars. As shown, changes in mill speed did not significantly affect product P80, which is also supported by the ANOVA. However, based on the retained mass in each size fraction for the two tests conducted under the same conditions: 35% ball filling and without thermal treatment (Figure 12), lower speeds tended to produce finer particles, while higher speeds were more effective for crushing coarser particles. Additionally, the effect of mill speed might be more pronounced if the feed size were coarser, highlighting the influence of mill speed more effectively.
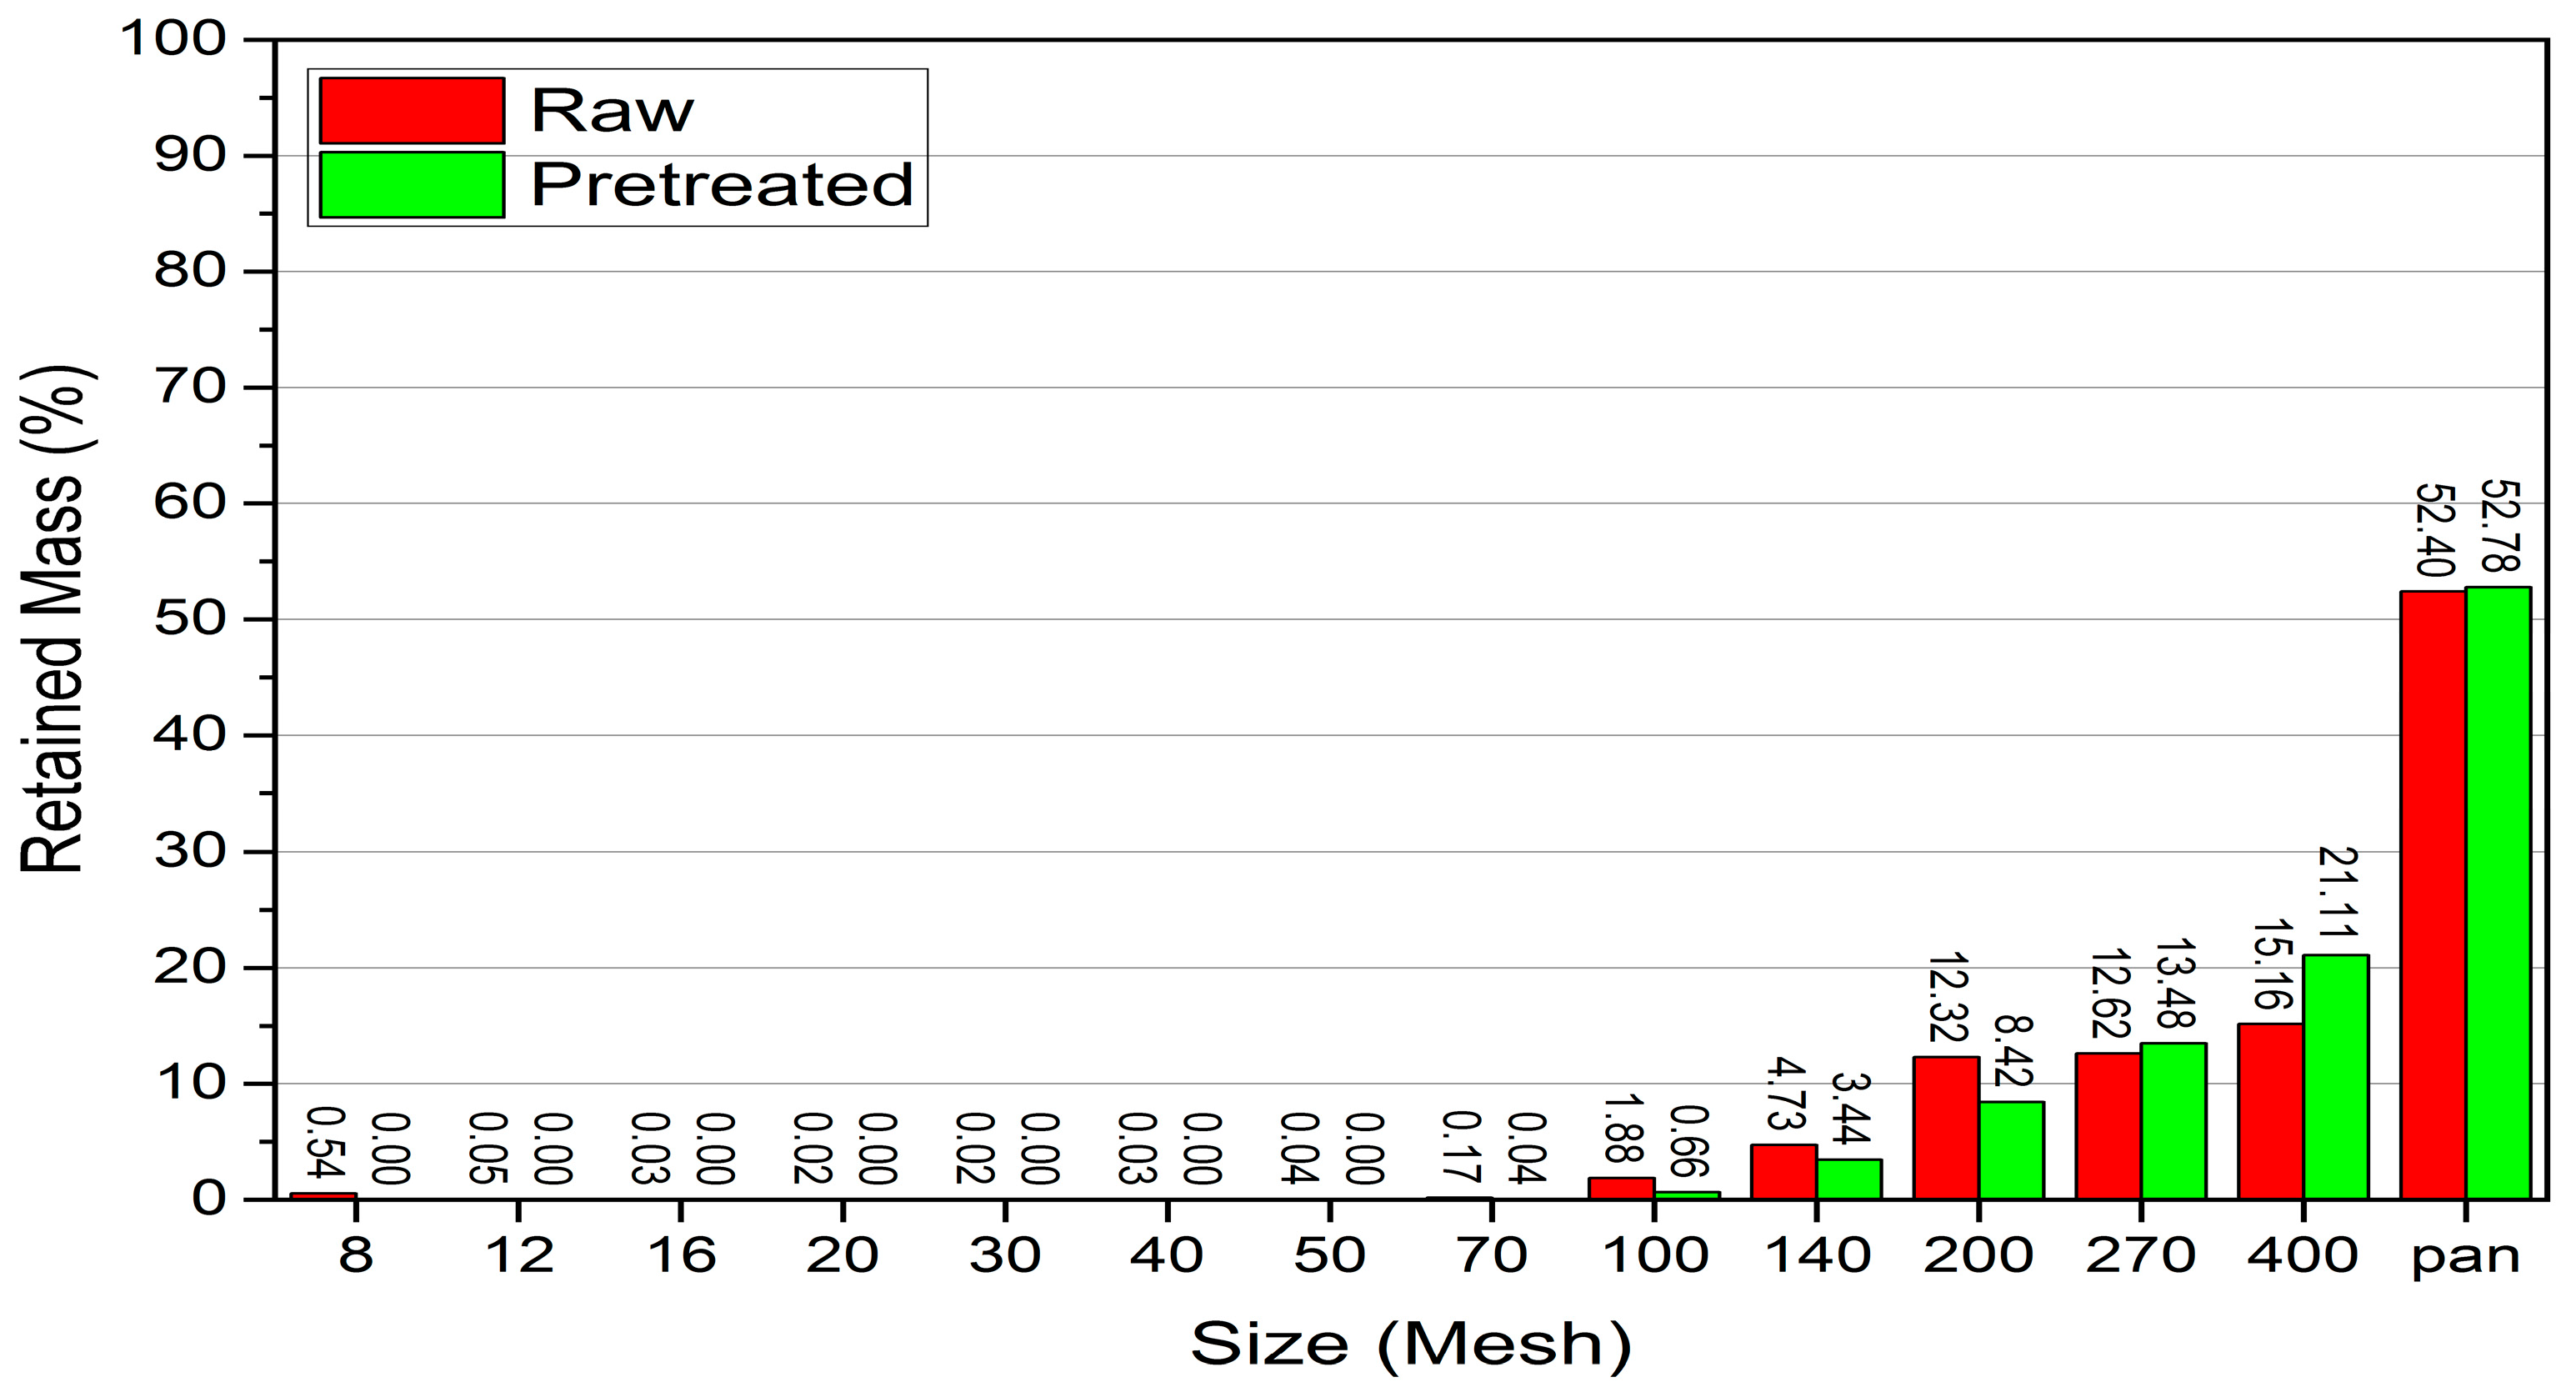
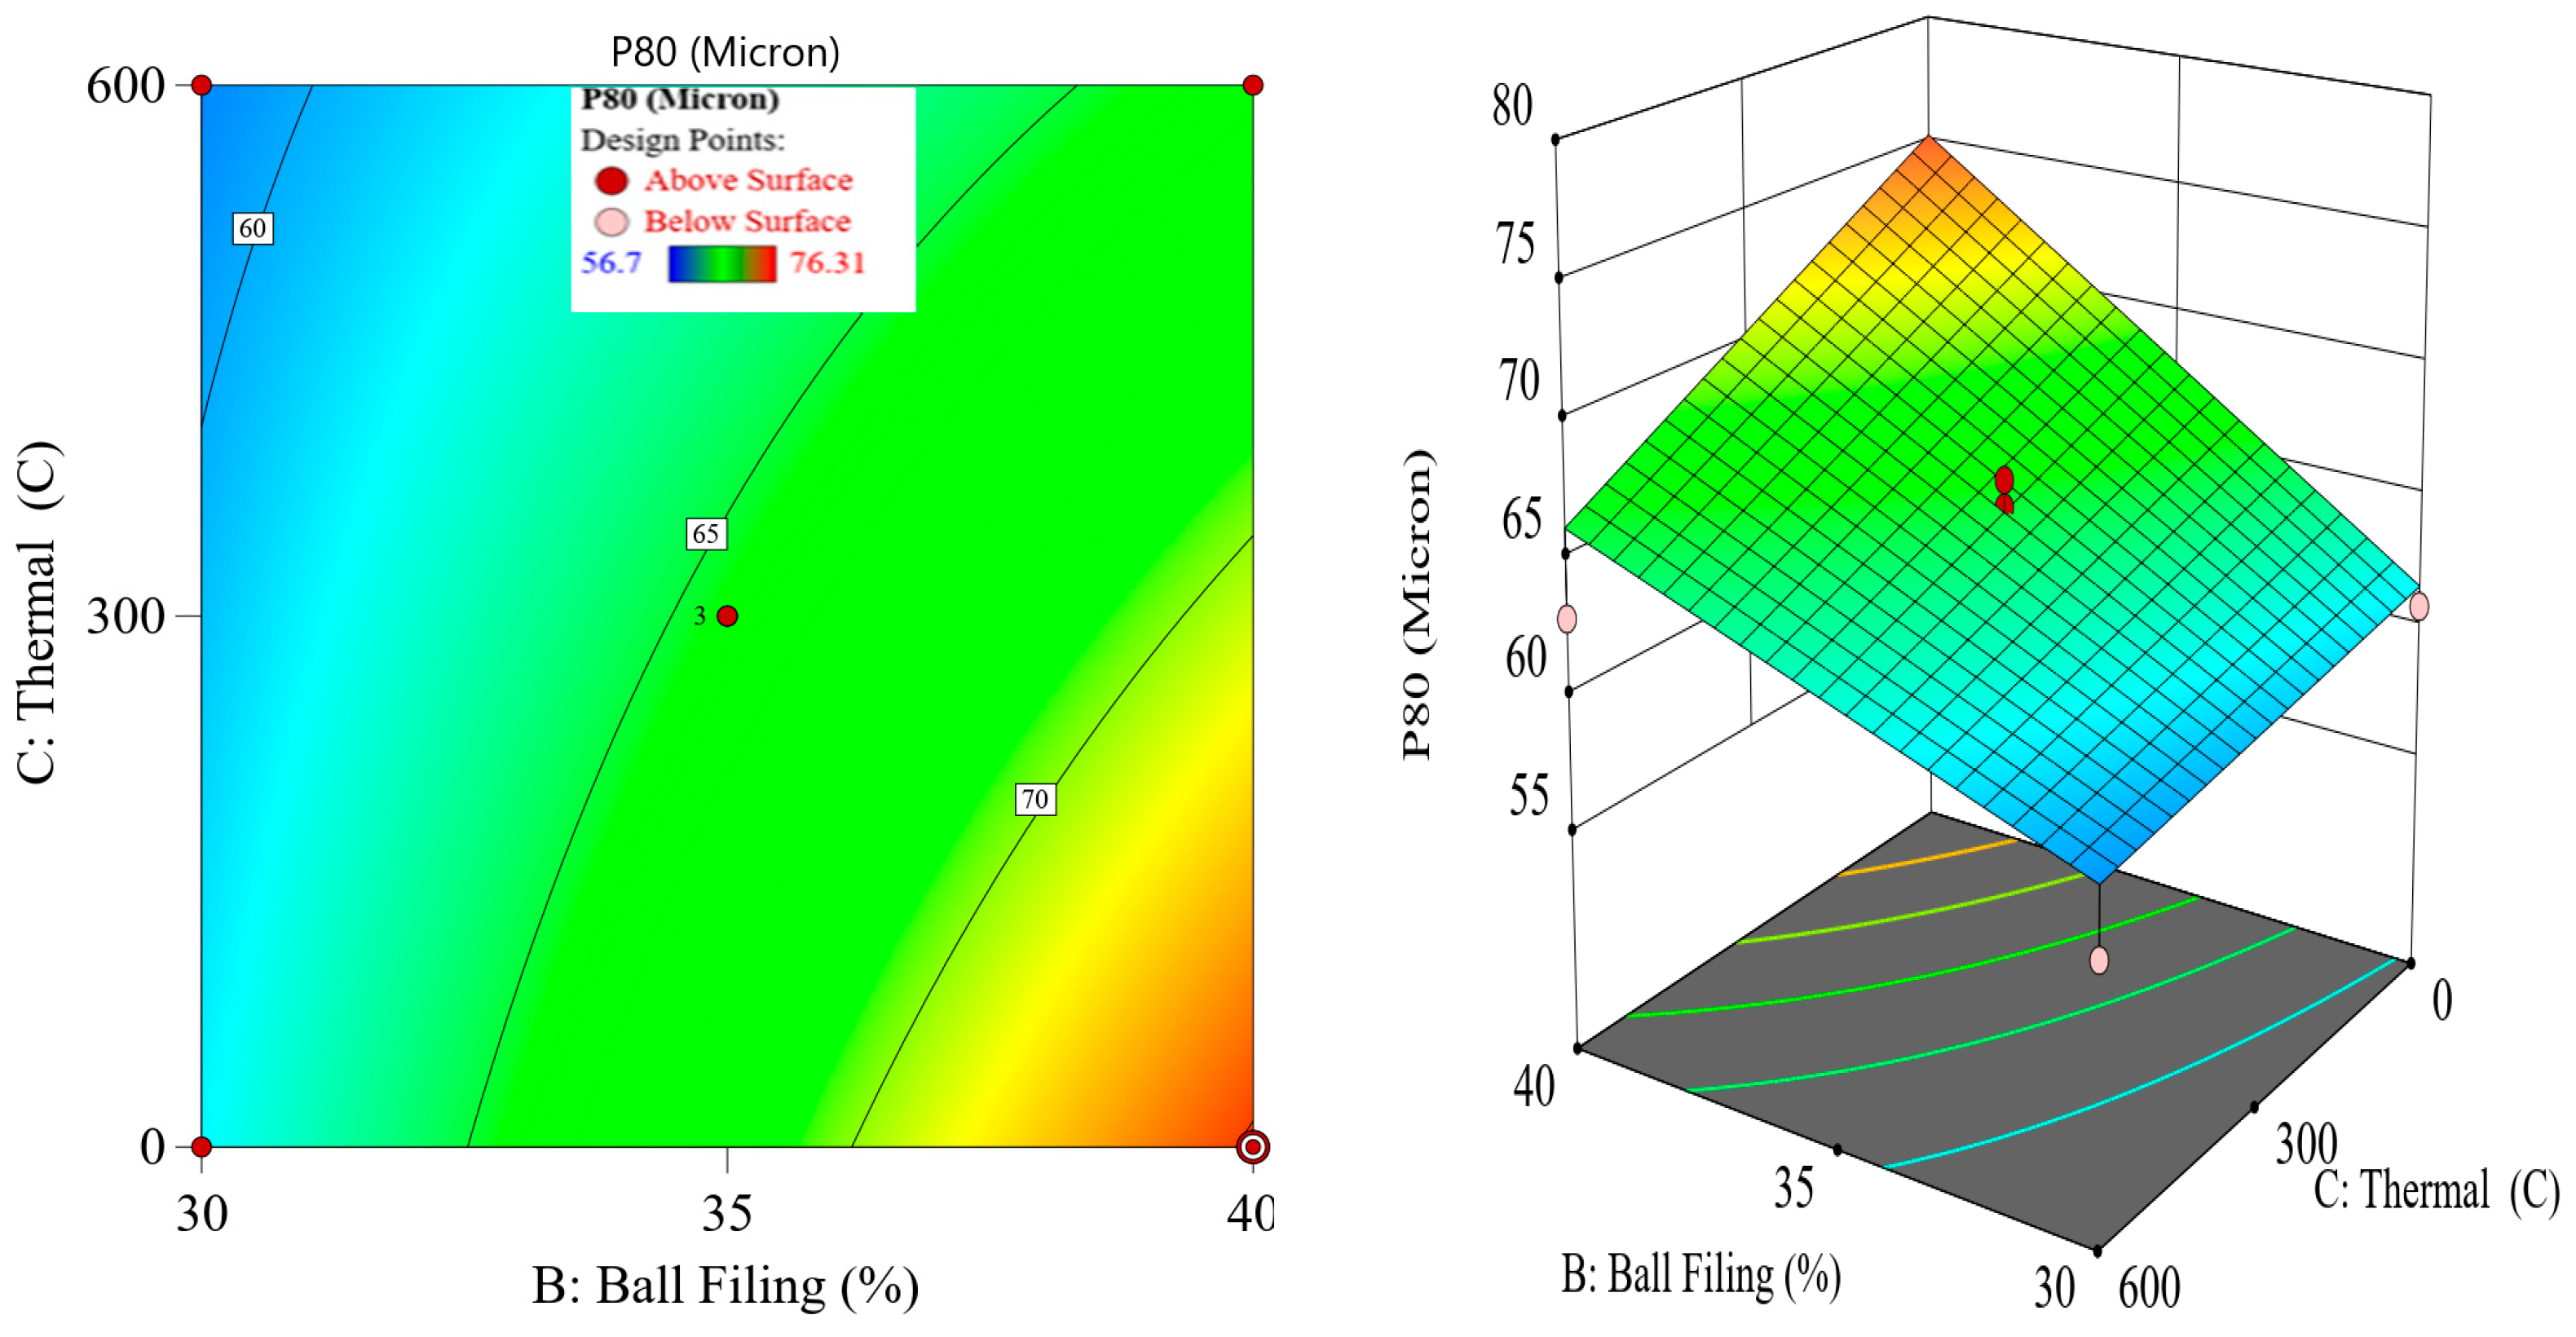
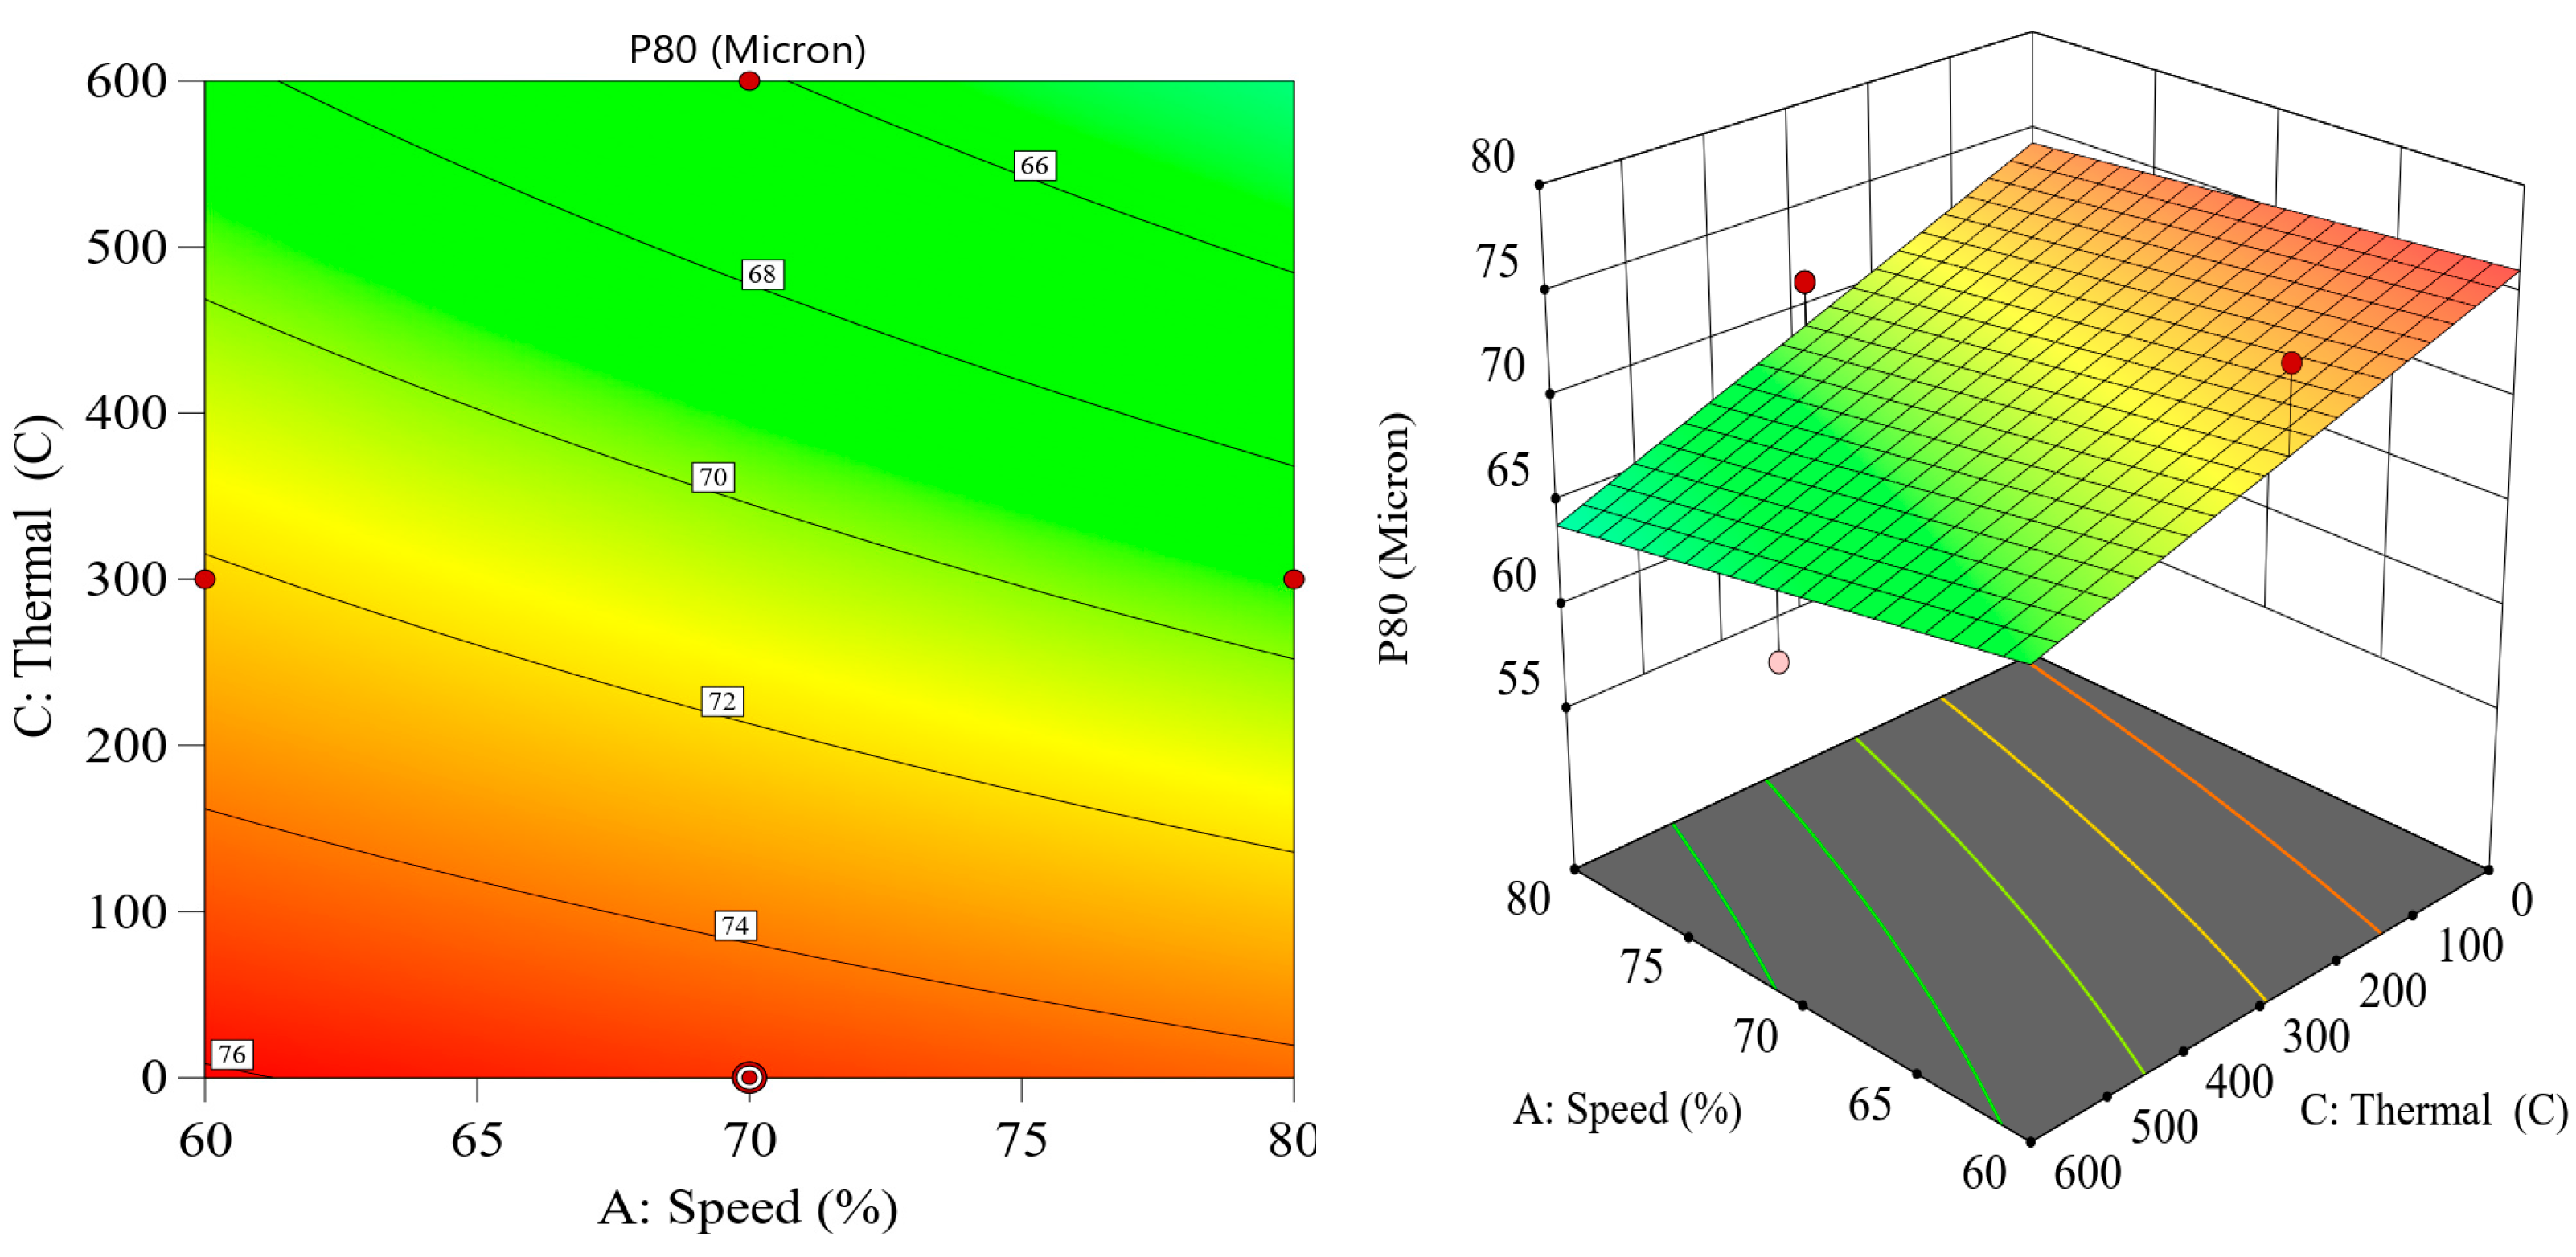
Finally, the effect of thermal pretreatment was investigated on product P80. As seen in Figure 11c, by increasing the temperature from room temperature to 300 °C and 600 °C, product P80 was decreased, indicating the efficiency of thermal pretreatment on chalcopyrite grinding and the production of finer particles. Figure 13 shows retained materials in different sizes fractions for runs 5 and 14 conducted at 70% of critical speed and 40% ball filling. However, thermal pretreatment at 600 °C was applied to run 14, while run 5 used raw chalcopyrite ore without any treatment. The coarse size fractions noticeably disappeared when the feed was pretreated at 600 °C, as opposed to the raw materials. This phenomenon indicates a preferred effect of thermal pretreatment on coarse particles, which can be attributed to the fact that the coarser the particles were, the easier they formed cracks. Additionally, it is evident that as particles became finer, their grindability and the efficiency of different pretreatment methods decreased [25]. Therefore, it is more beneficial to apply thermal pretreatment to coarser particles. The energy reduction with thermal treatment was approximately 10% compared to the tests conducted under the same conditions but without any treatment. However, it is important to note that the magnitude of energy savings was highly dependent on several factors, including ore mineralogy, thermal treatment duration, and the calibration of the mill’s operational parameters. In our study, the controlled conditions and targeted temperature range were chosen to balance energy efficiency with ore integrity, resulting in a 10% energy reduction that is consistent with, or slightly lower than, the upper range reported in similar settings [4,5]. This suggests that while significant improvements in energy consumption are achievable, the extent of these improvements is strongly influenced by the specific characteristics of the ore and the experimental design. Future work may explore a broader range of pretreatment intensities and durations to further enhance energy savings. Specifically, we analyzed the furnace specifications and power usage during the experiments to estimate the actual energy input required for thermal pretreatment. Our findings showed that the furnace operated at approximately 20% of its rated power, primarily due to its effective insulation that significantly reduced continuous energy demand. As a result, we estimated that the energy consumed during thermal pretreatment constituted only about 1–2% of the total grinding energy. This highlights the process’s energy efficiency, which was notably better than initially perceived. Contour and 3D plots showing the interaction effects of the chosen parameters can be seen in Figure 14, Figure 15 and Figure 16.

3.5. Interpretation of Thermal Pretreatment Effect on Grinding

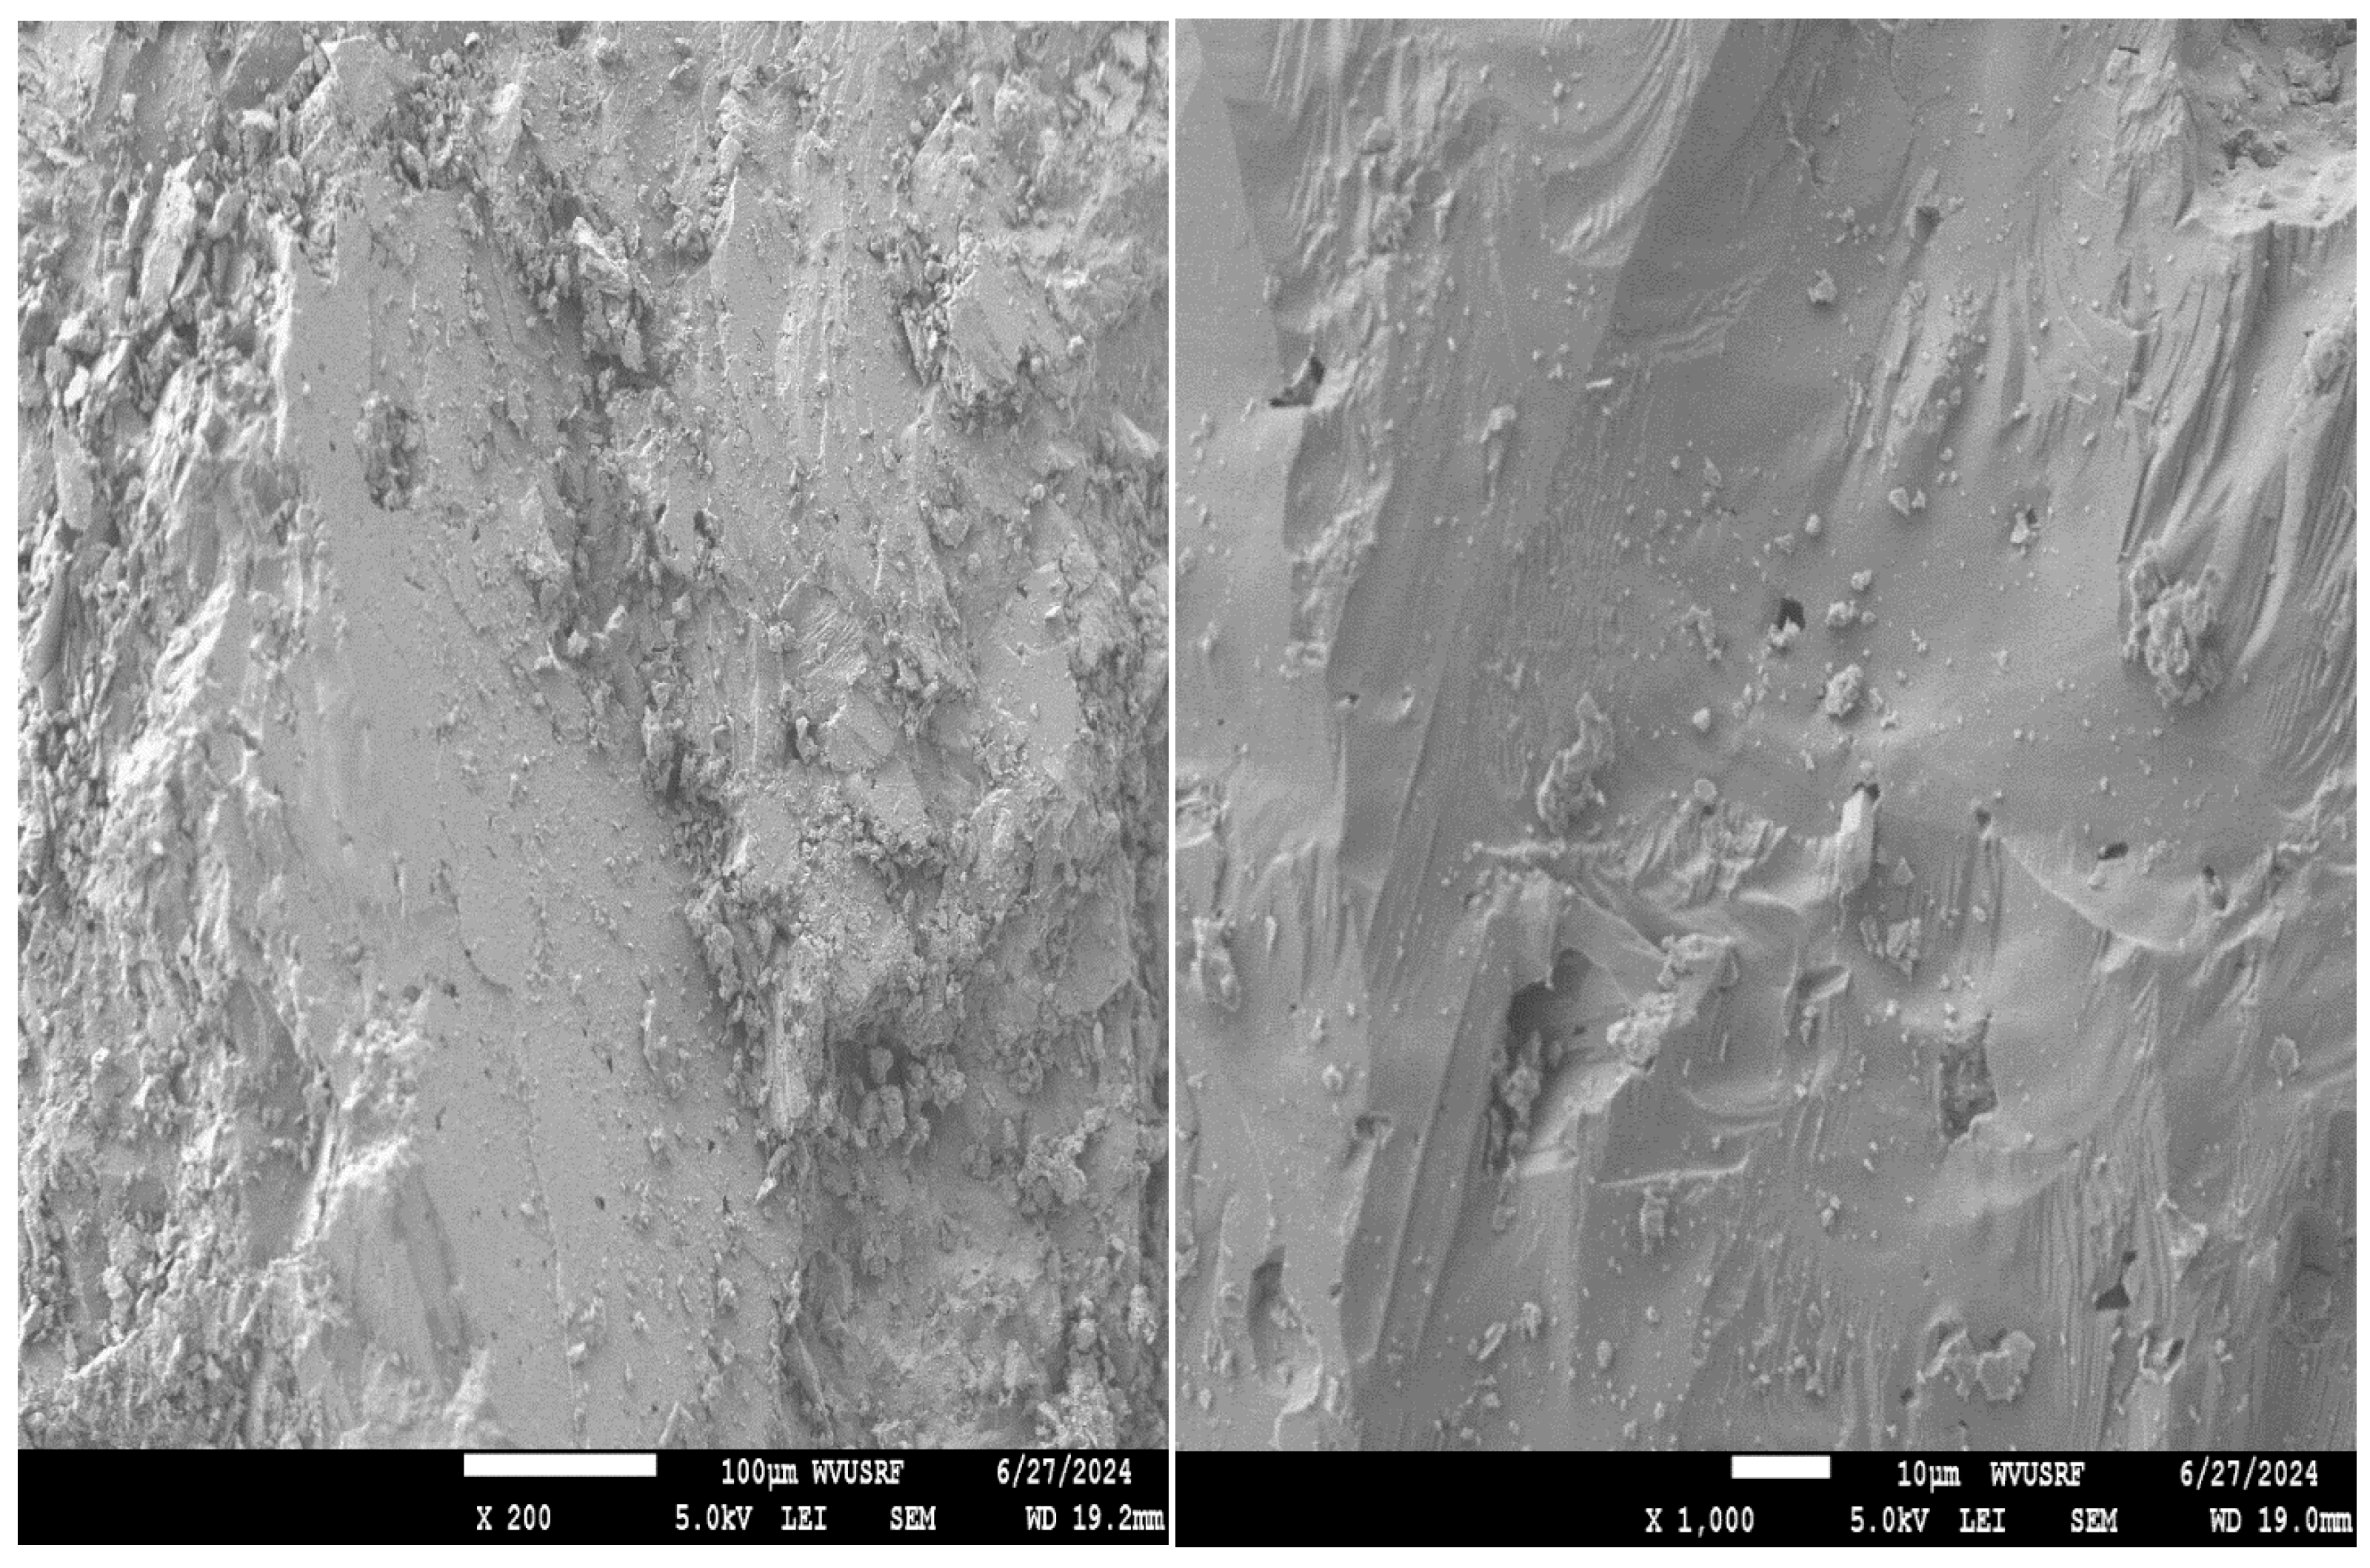
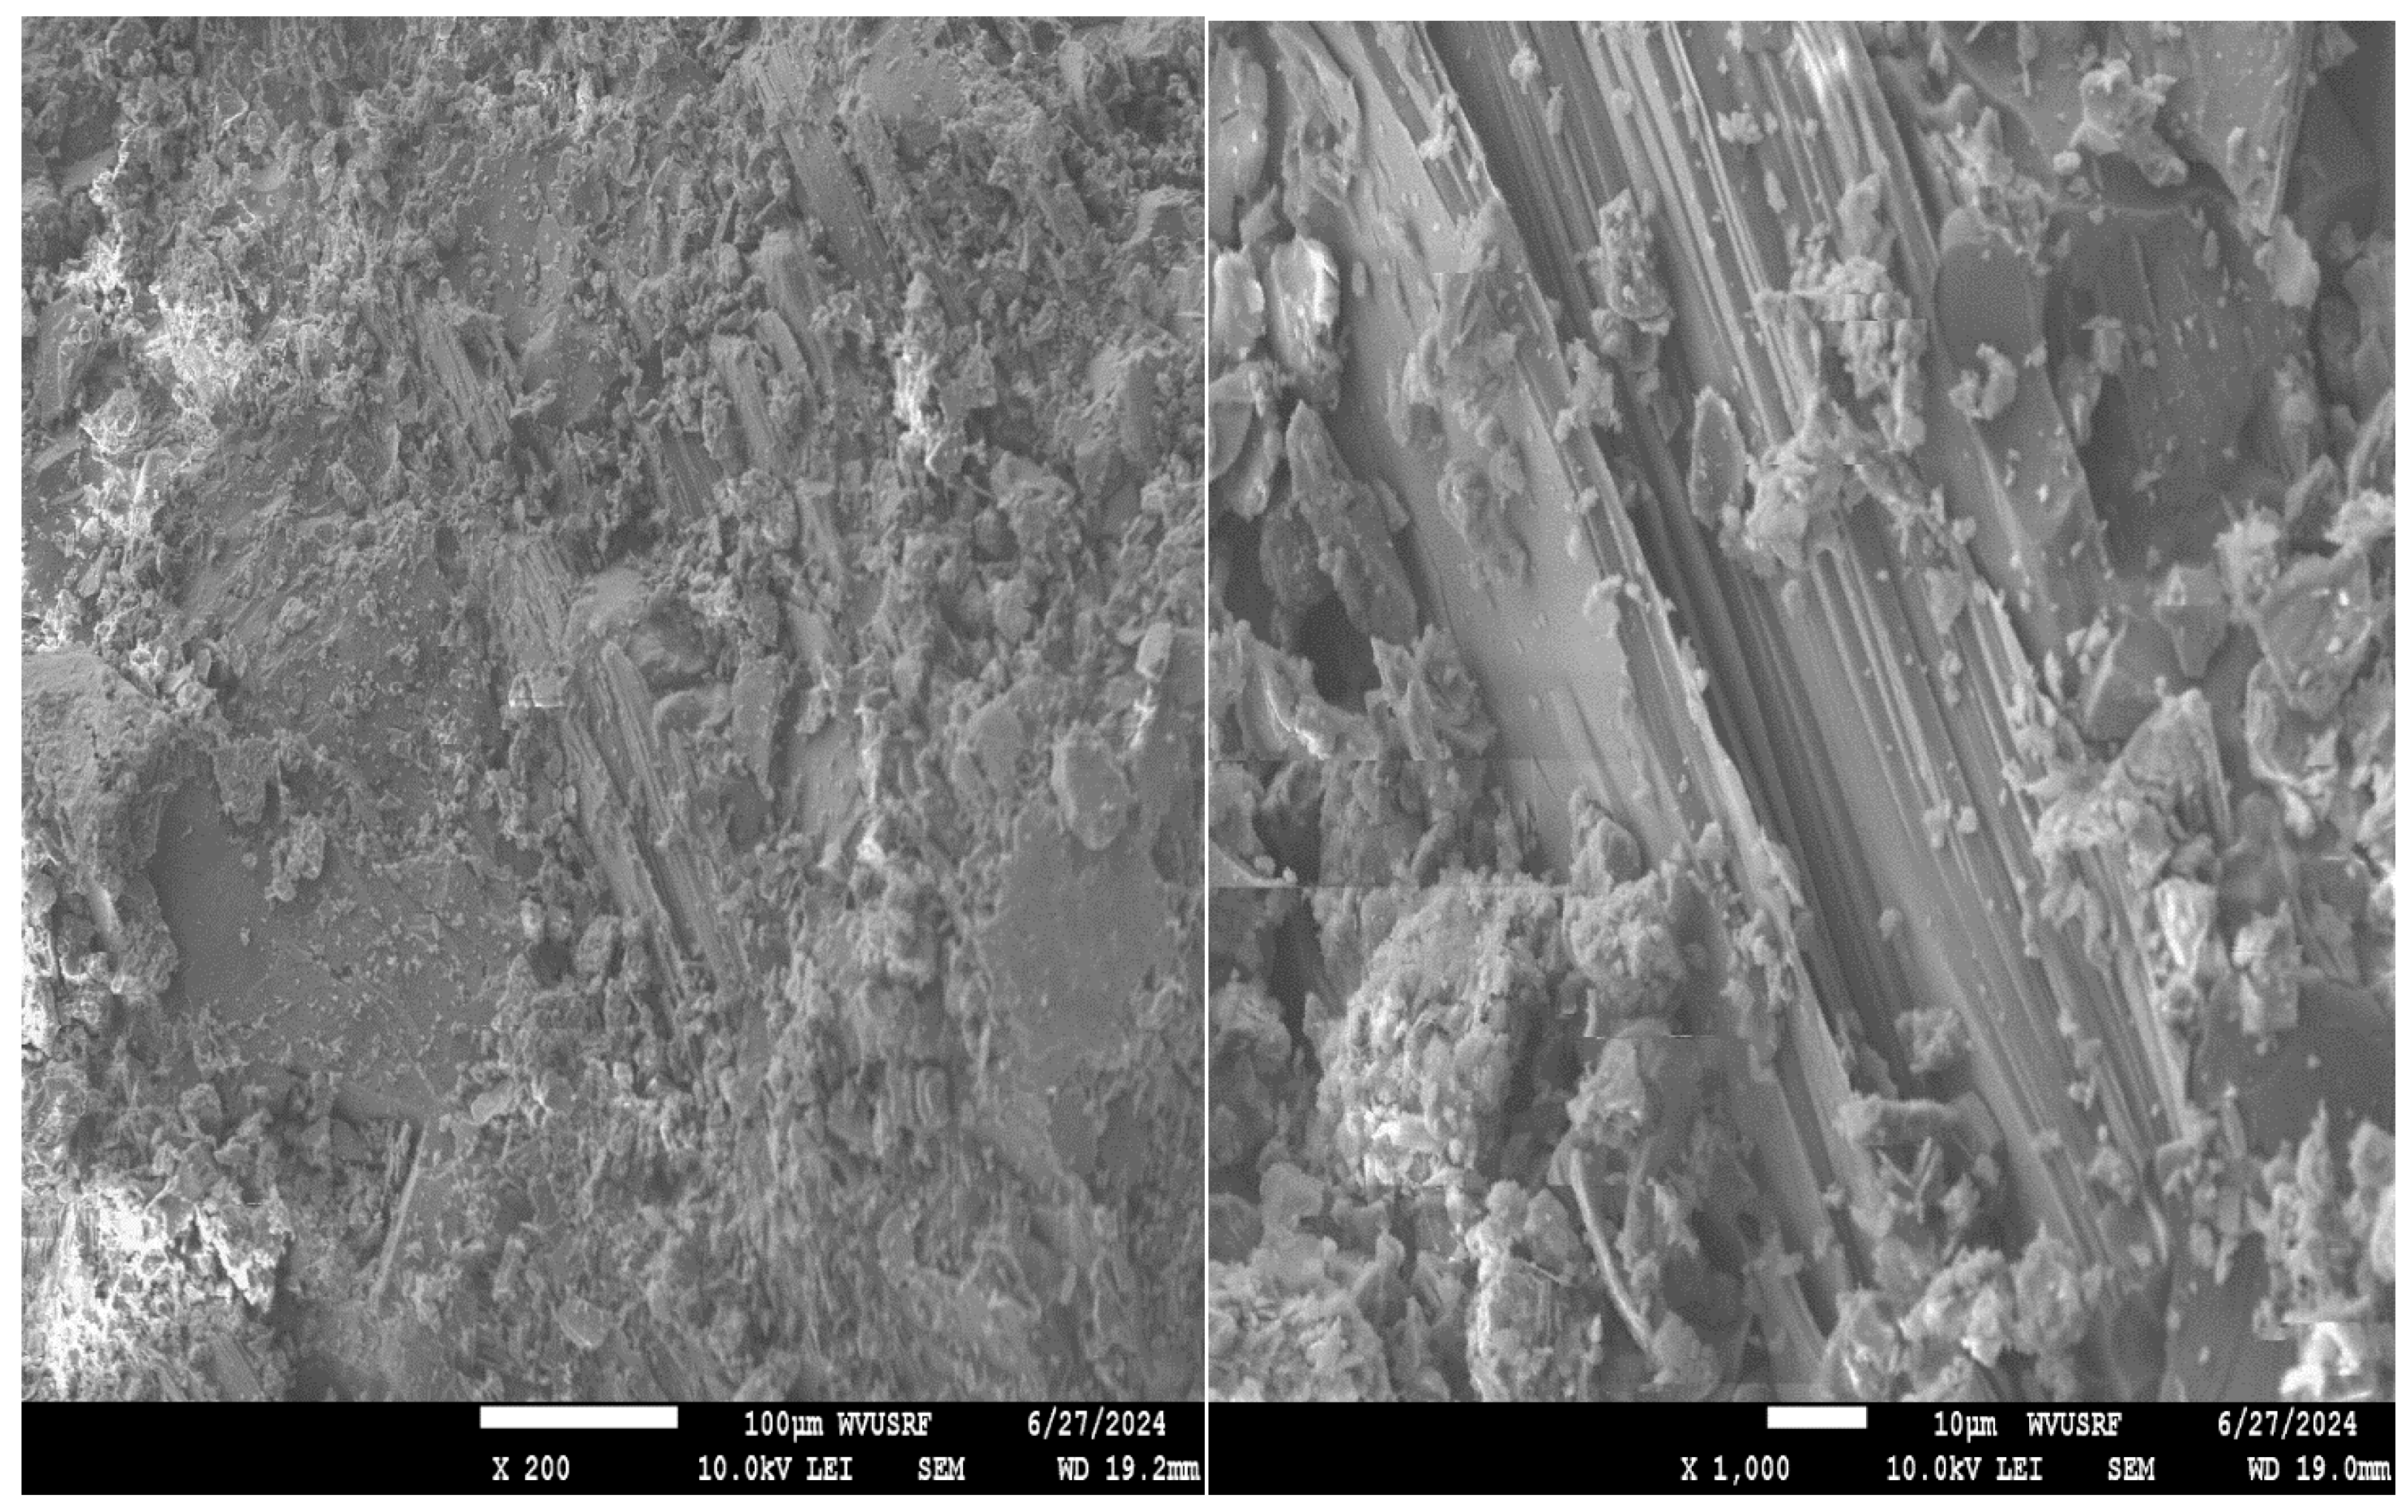
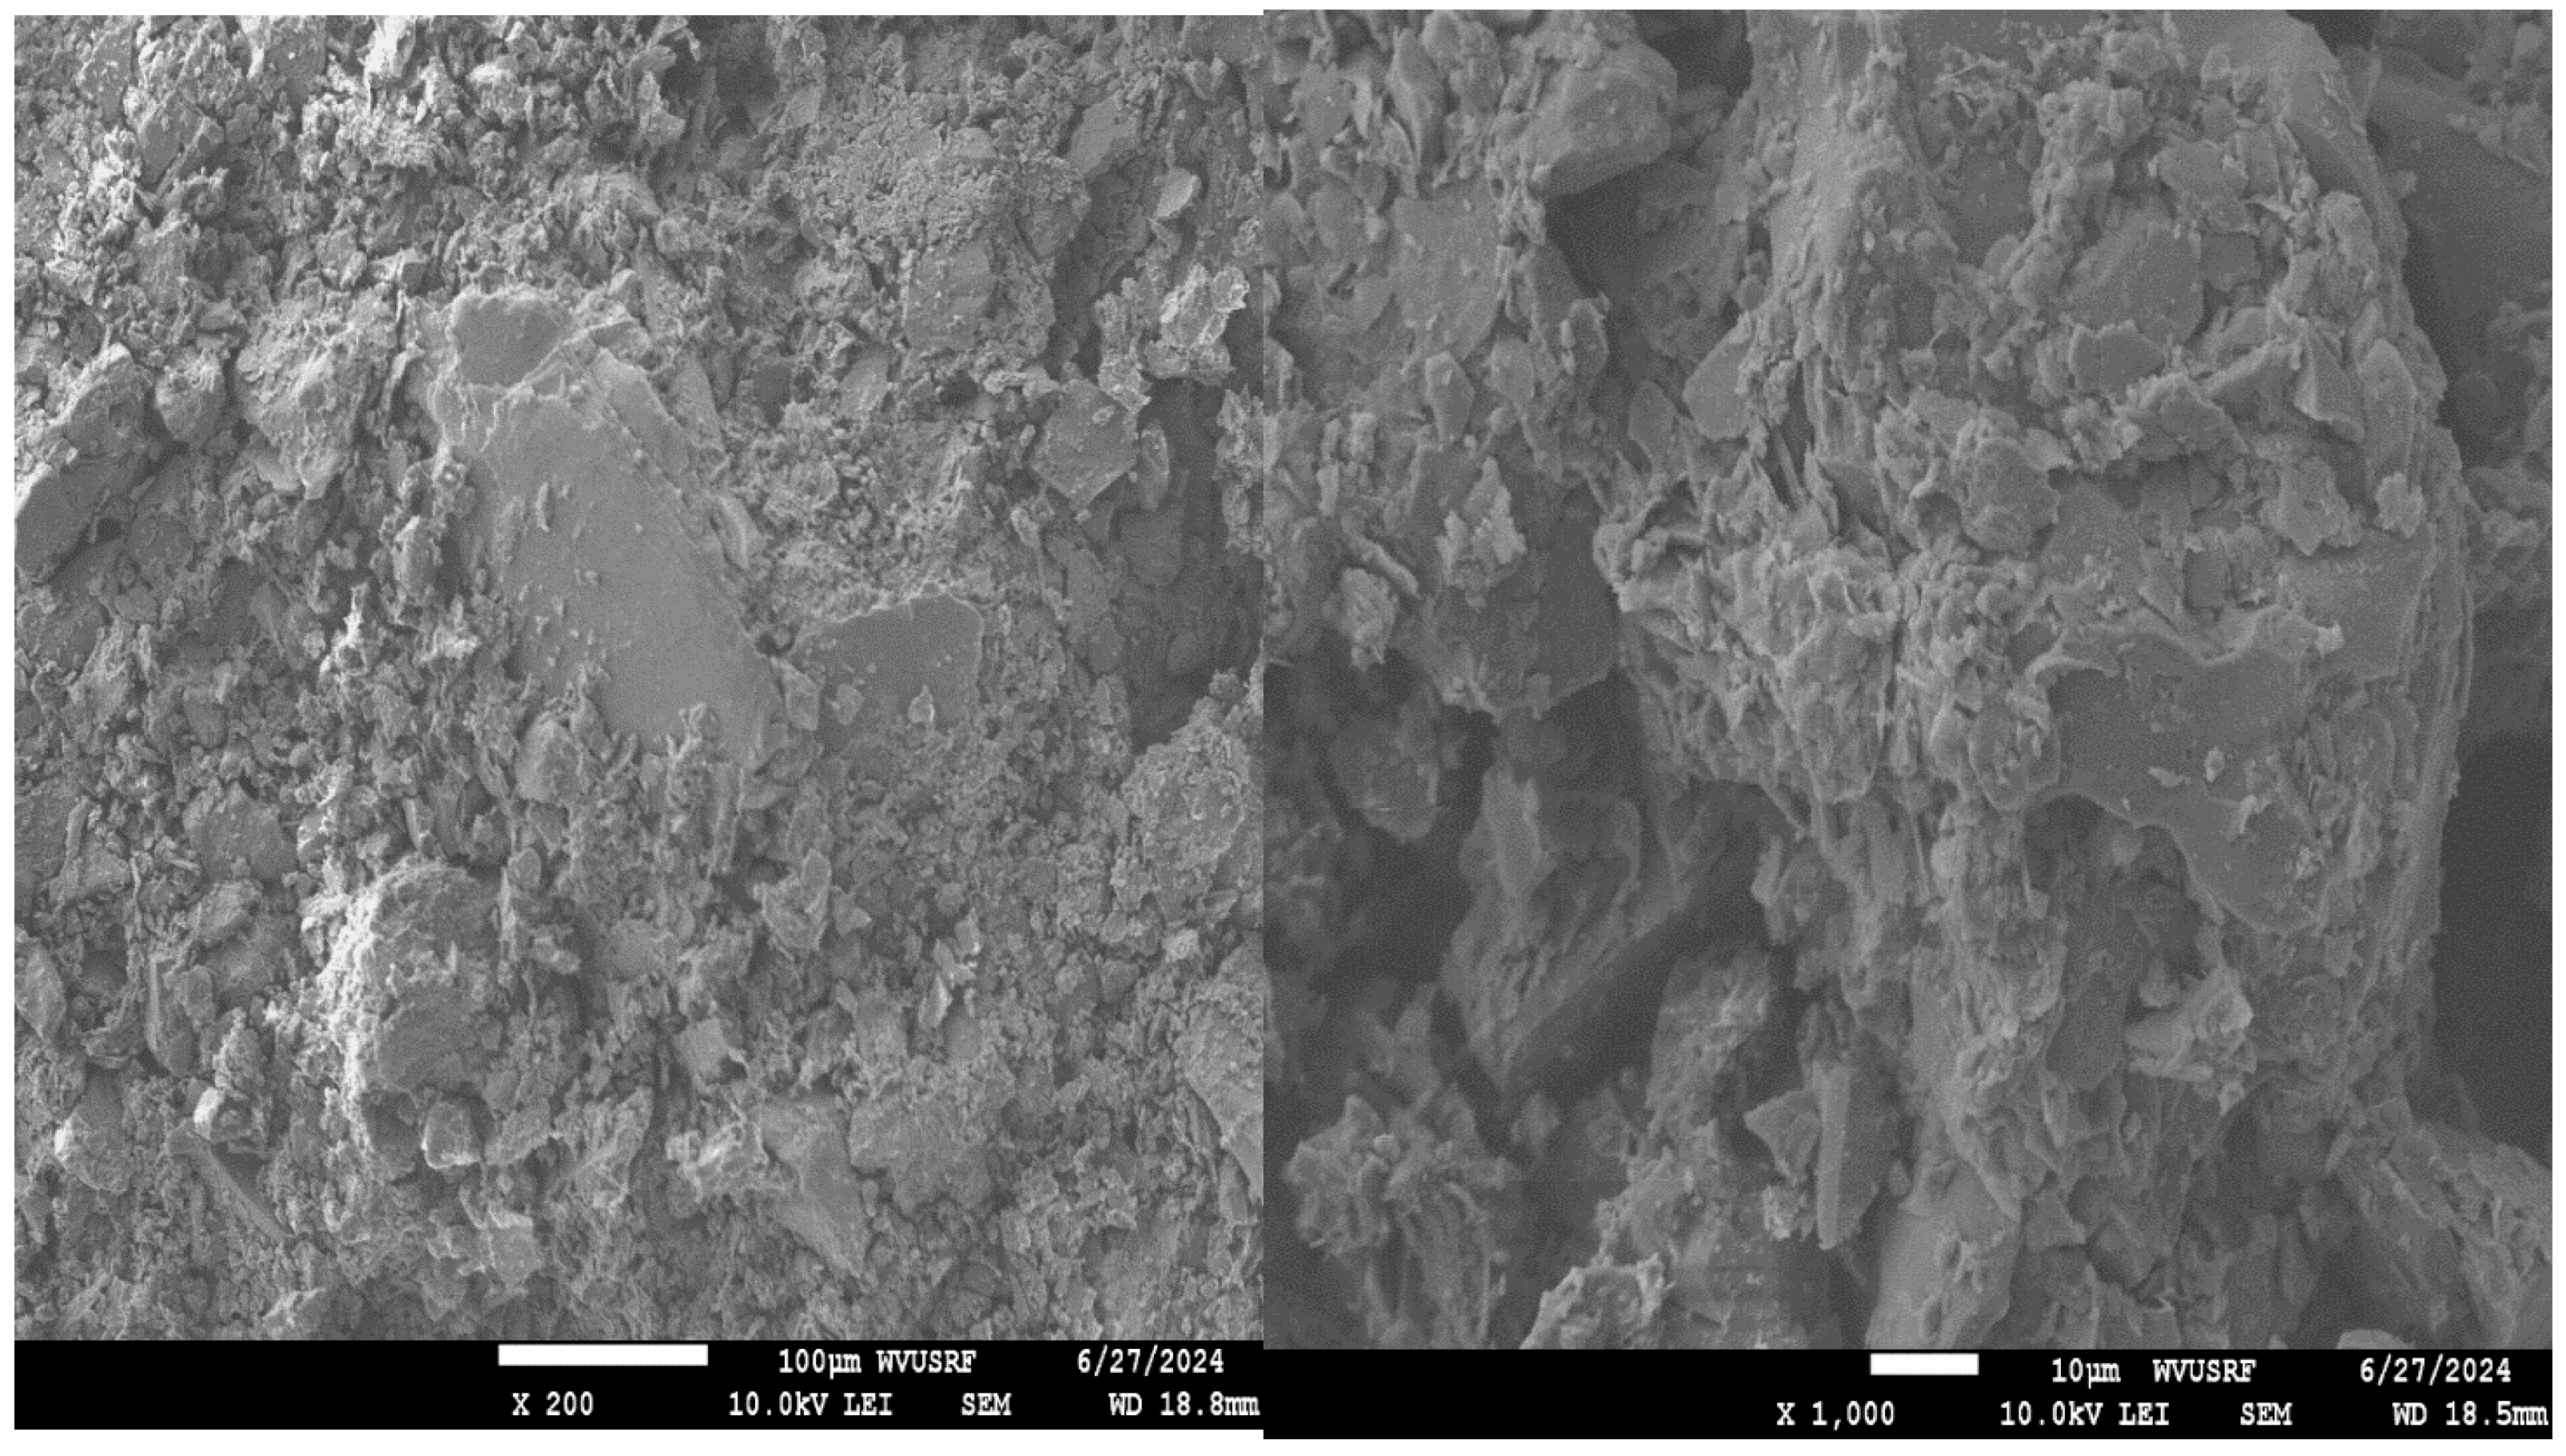
As discussed in previous sections, thermal pretreatment increased grinding efficiency by reducing energy consumption and product P80, which was proven by the statistical and experimental analyses. To examine the reason behind this improvement, analytical analyses were also conducted to investigate the surface and compound characteristics of the chalcopyrite ore before and after thermal pretreatment. Scanning electron microscopy (SEM) analysis was first conducted to study the surface morphologies. Three representative samples were used in SEM analyses: one raw sample and two samples pretreated in a muffle furnace at 300 °C and 600 °C, respectively. Figure 17, Figure 18 and Figure 19 show the SEM analysis results for raw and pretreated samples at 300 °C and 600 °C, separately. All images were captured in different magnifications to evaluate the samples at various scales and distances.
Thermal pretreatment enhanced the grindability of minerals by inducing thermal stresses, which led to the formation of microcracks and structural weaknesses within the particles. At around 300 °C, initial cracking and surface roughness started to develop, which lowered the energy required for subsequent grinding. When the temperature was increased to 600 °C, these effects became more pronounced, with a substantial increase in the number of microcracks and surface roughness. This promoted a further reduction in grinding resistance. Studies have demonstrated that thermal pretreatment significantly decreases the mechanical strength of rocks and minerals by causing structural damage, phase transformations, and fracture propagation at grain boundaries, especially due to the anisotropic nature of minerals [20,26]. The stress concentrations along grain boundaries result in fractures that make the material more susceptible to breakage during grinding [27]. Higher temperatures intensify these effects, improving the material’s grindability, which was evident in the SEM images obtained in this study. This method was effective because it created numerous points of weakness, leading to more efficient breakage of particles. Hence, higher thermal pretreatment temperatures generally improved grinding efficiency, as supported by similar findings in previous studies [28,29].
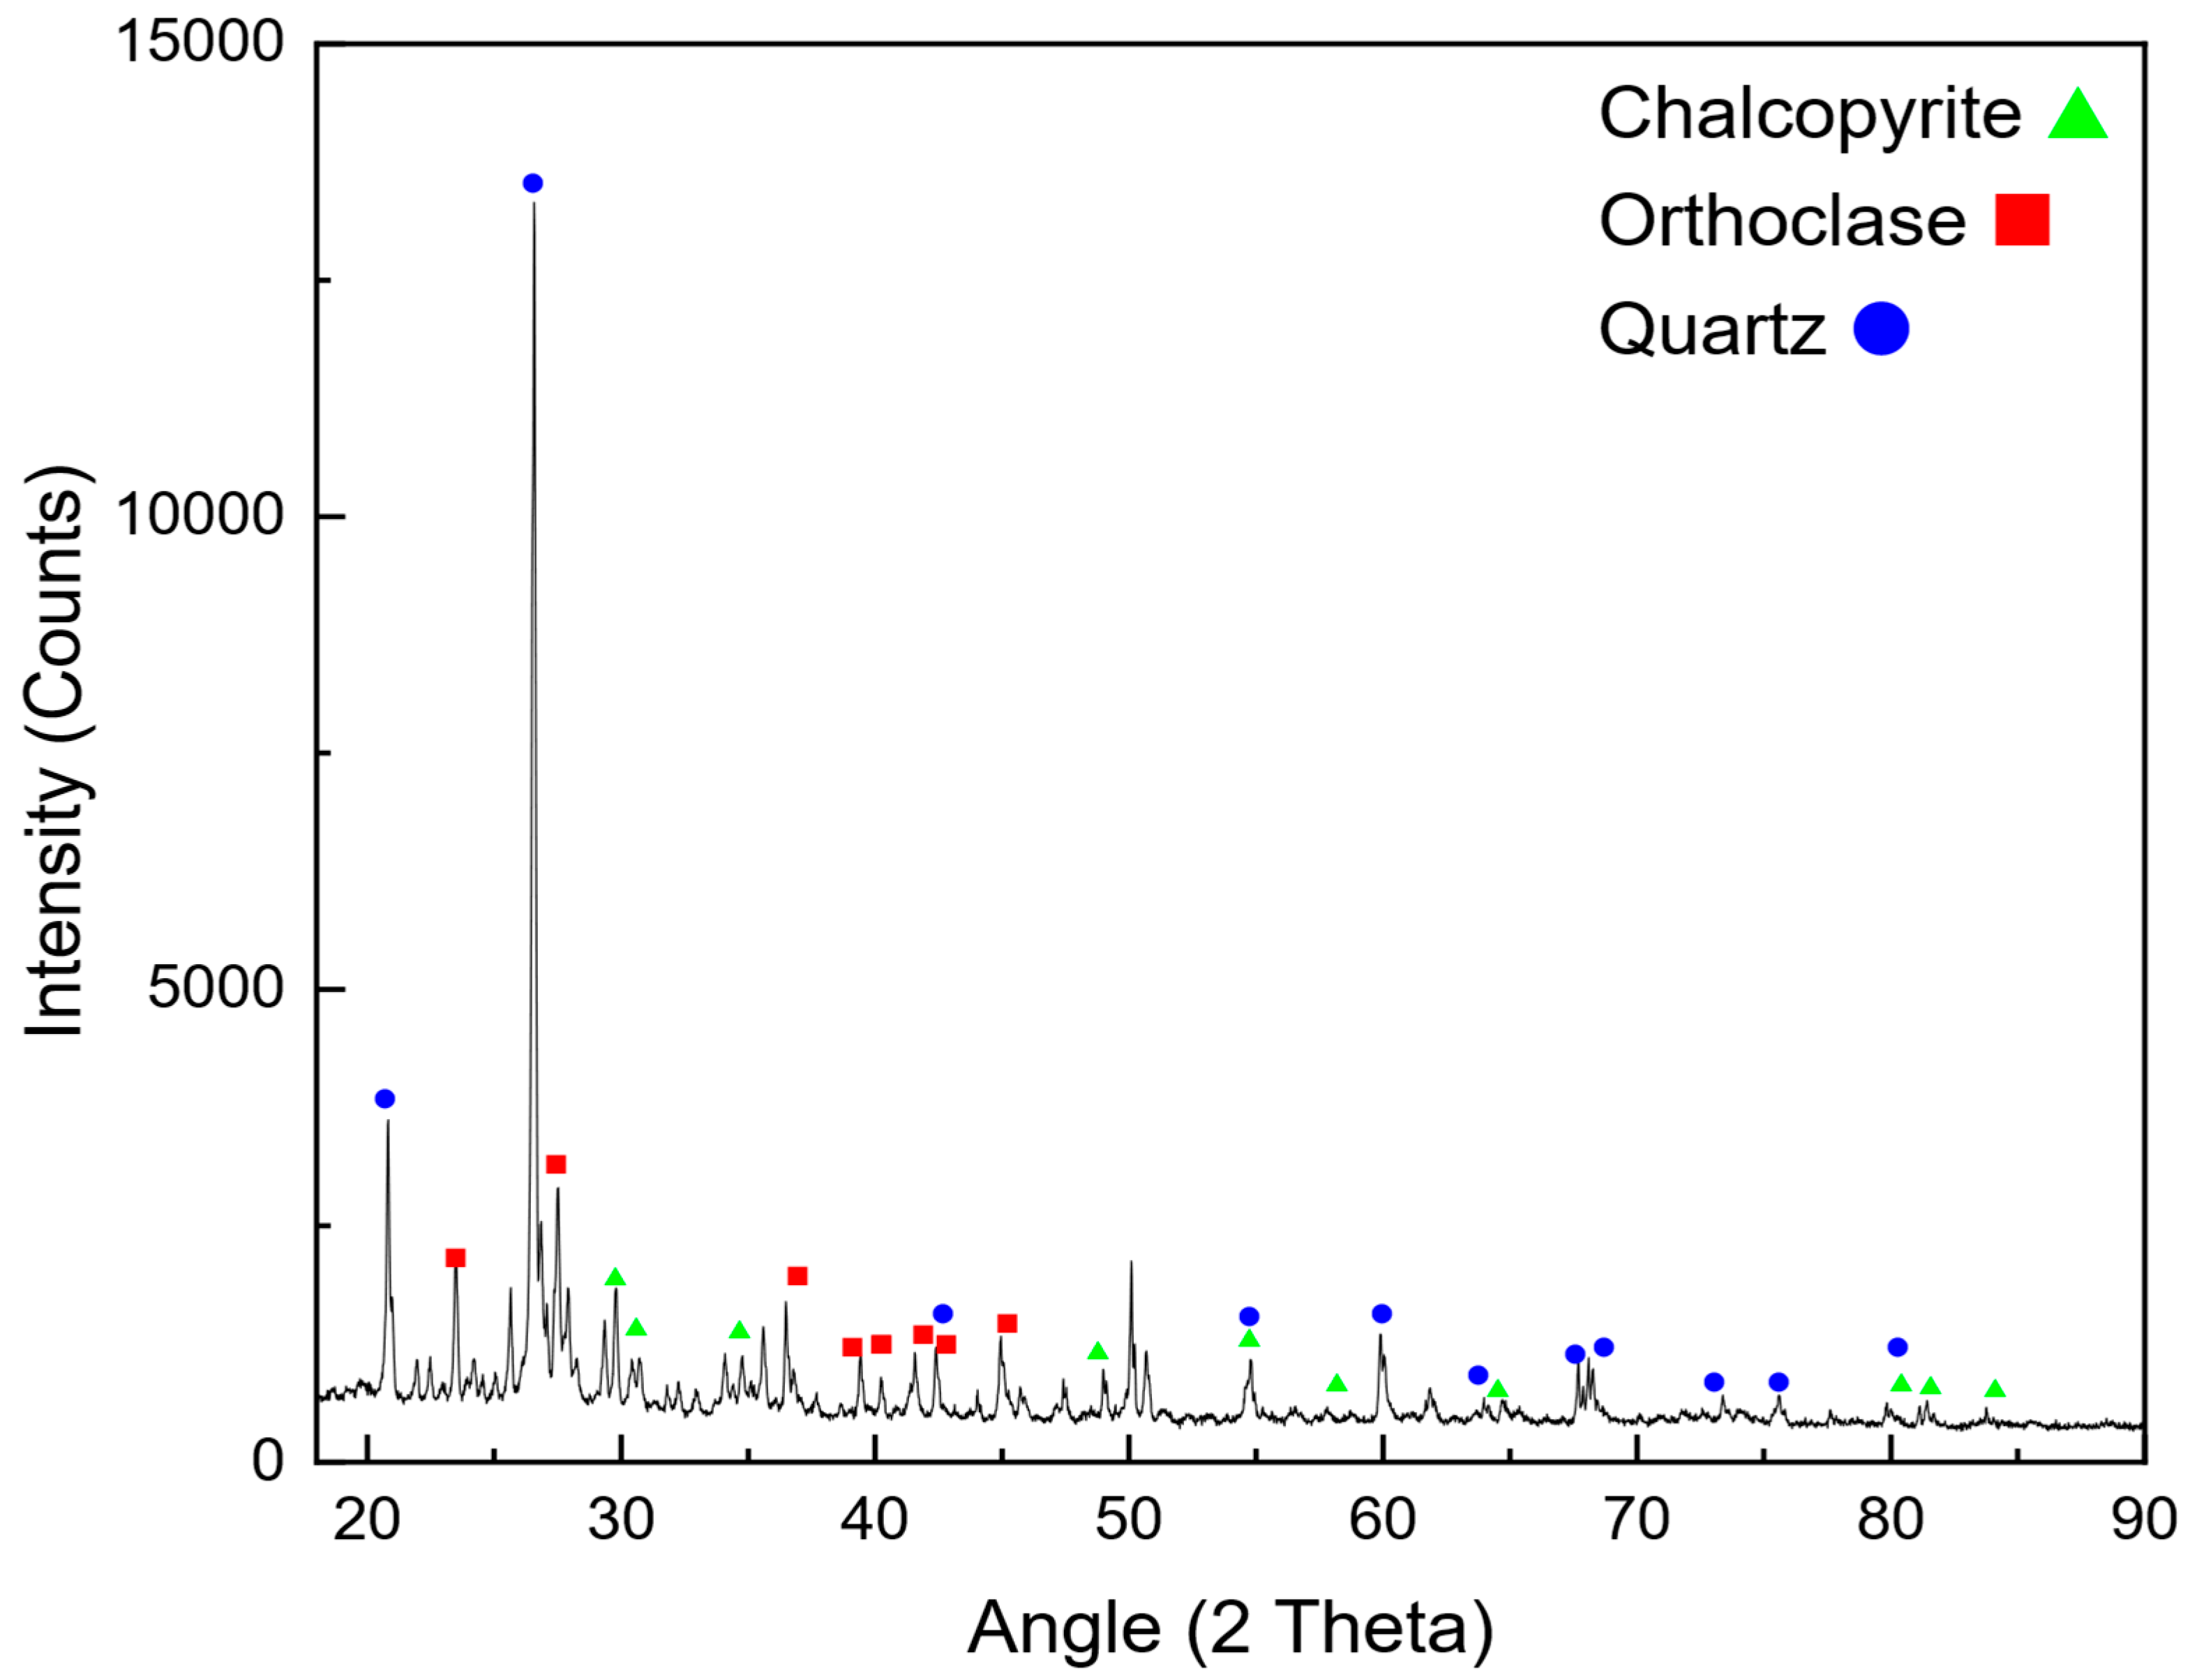
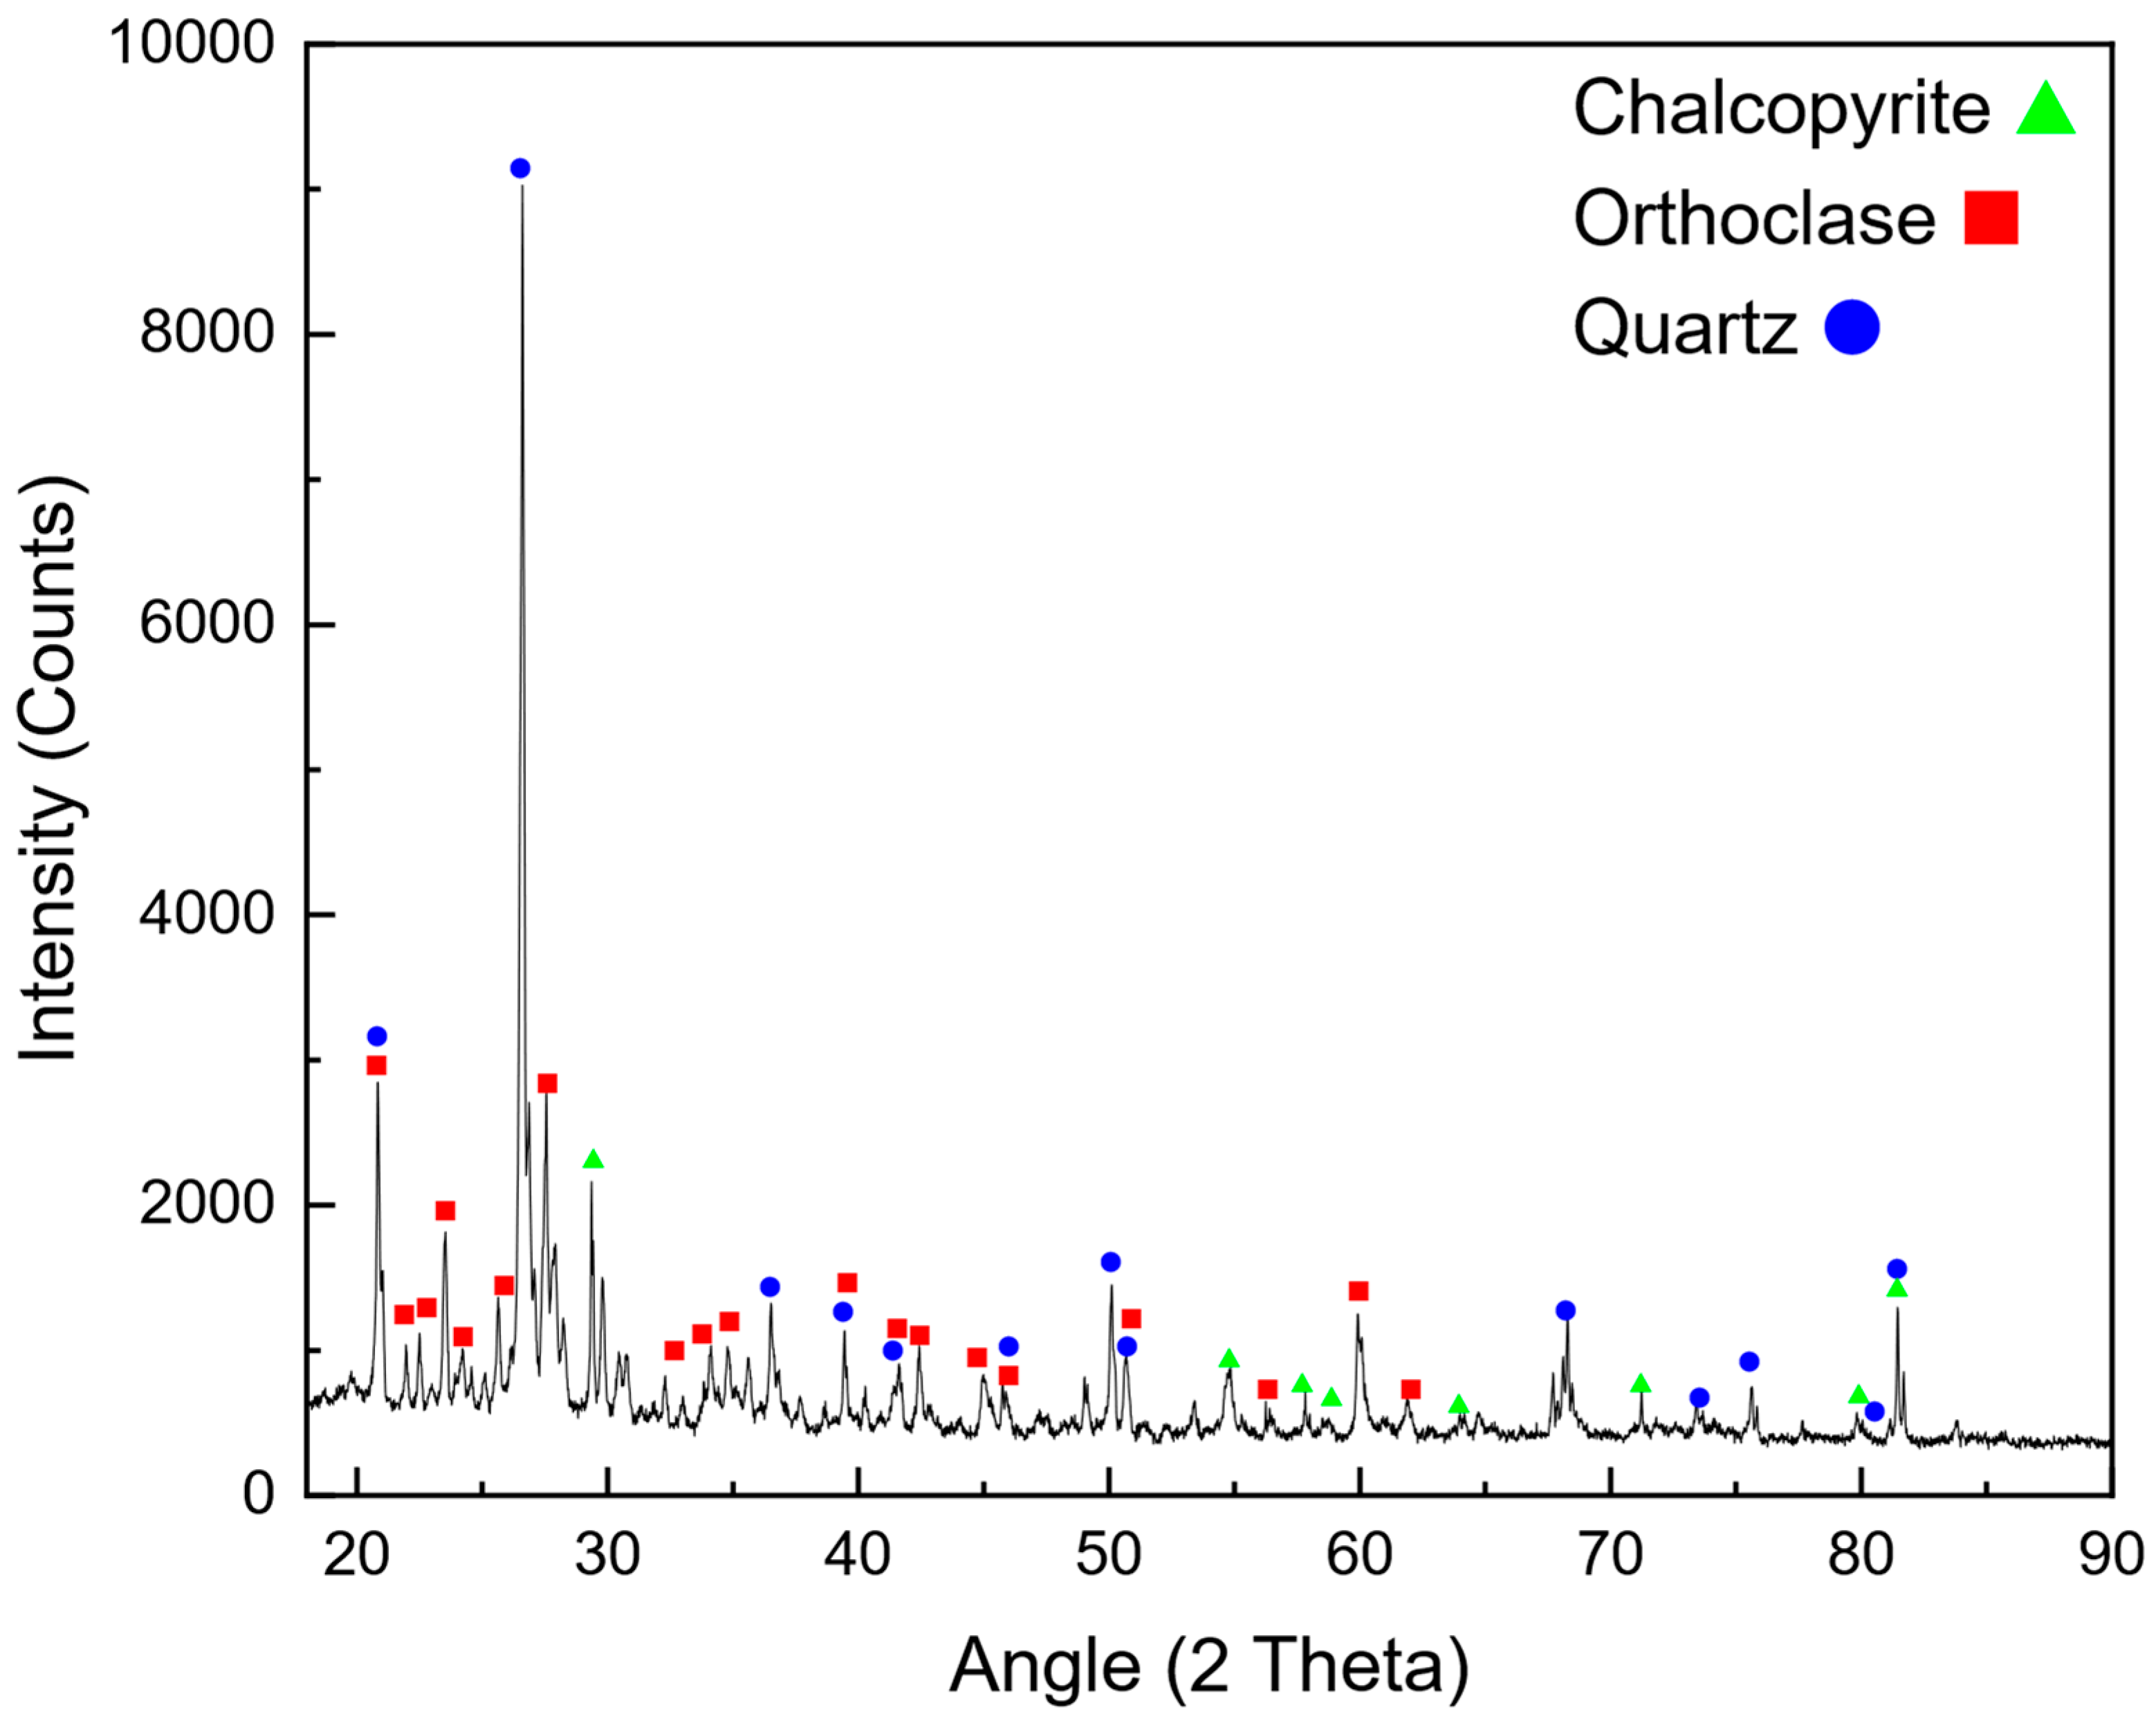
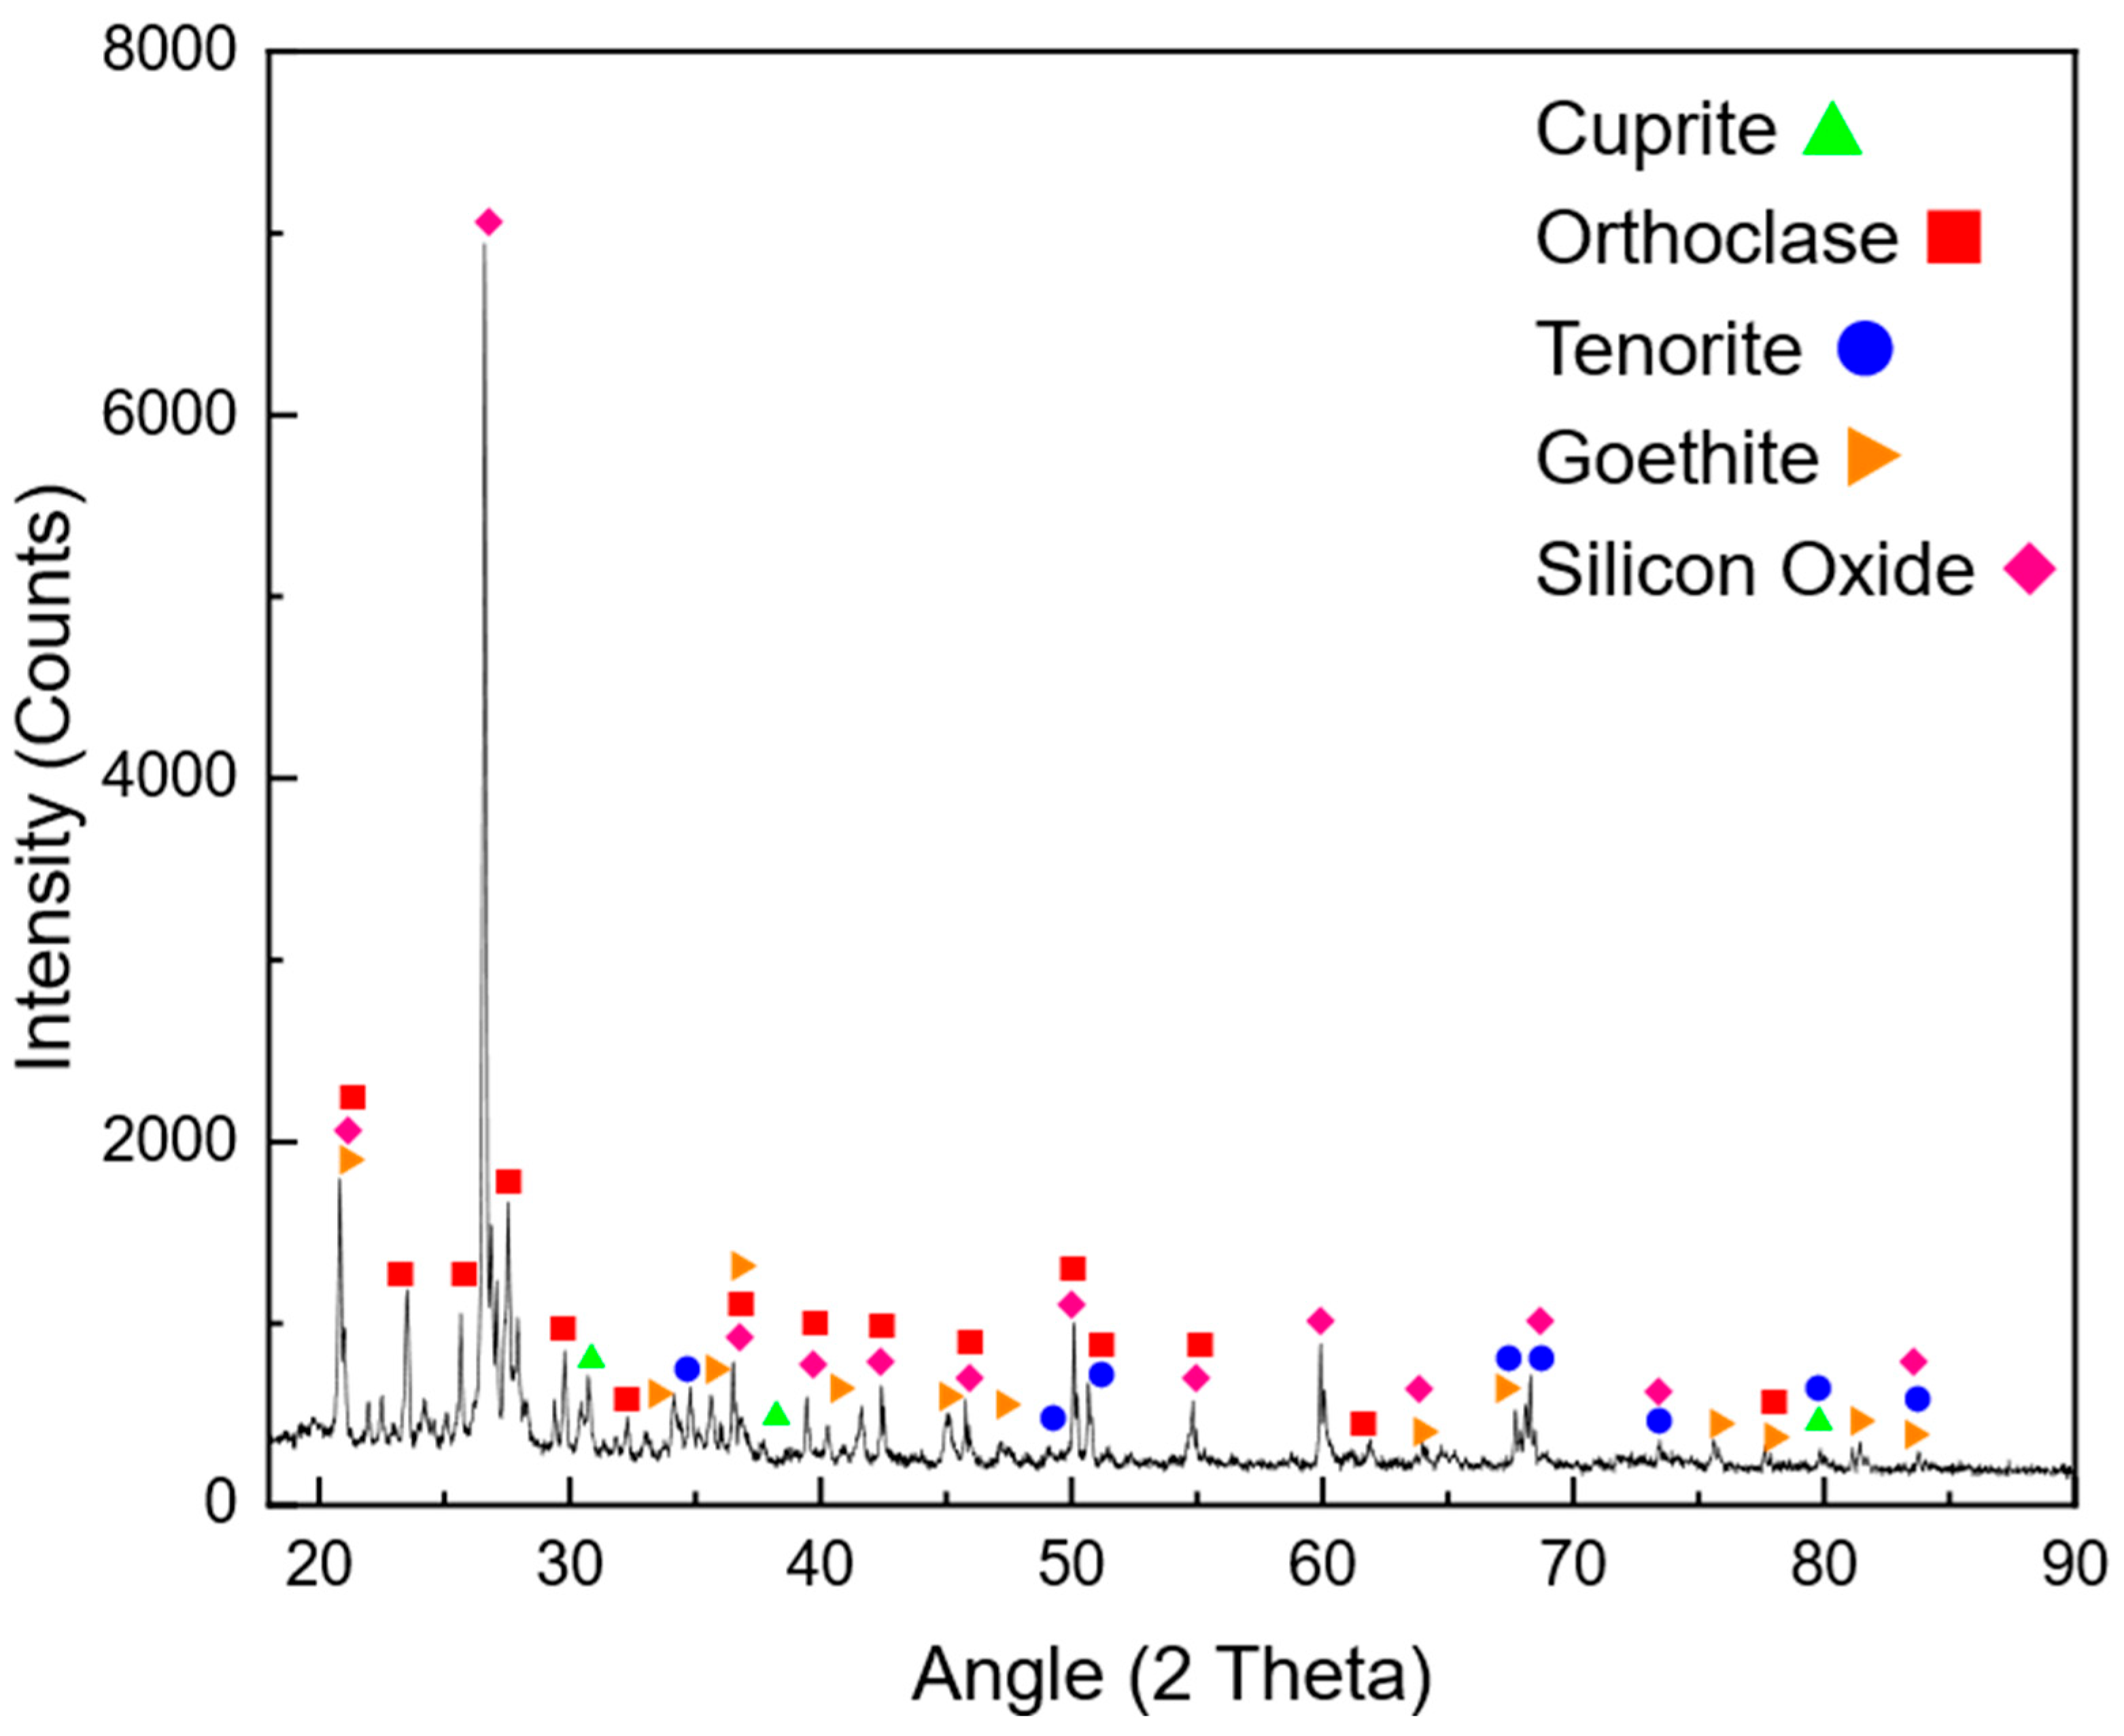
Another analysis conducted to examine the effect of thermal pretreatment on chalcopyrite samples before and after pretreatment was X-ray diffraction (XRD) analysis. Figure 20, Figure 21 and Figure 22 show the XRD diffraction patterns of the raw sample and the samples pretreated at 300 °C and 600 °C, respectively. As seen in the XRD results, the intensity of all peaks was significantly reduced after pretreatment. This downward shift in XRD peak intensity after thermal pretreatment can be attributed to several interconnected factors. High temperatures can lead to decreased crystallinity as the lattice structure becomes less ordered, resulting in more diffuse and less intense diffraction peaks [30]. This occurs because X-ray diffraction relies on the regular arrangement of atoms in a crystal to produce sharp and intense peaks. As crystallinity decreases, the diffraction becomes weaker and more spread out [31].
Thermal treatment also induces phase transformations in chalcopyrite. At elevated temperatures, chalcopyrite (CuFeS2) may decompose or react to form other phases, such as copper oxides (Cu2O and CuO) and iron oxides (e.g., FeO(OH)), as shown in Figure 22. The formation of these new phases, which have different diffraction patterns, causes the original chalcopyrite peaks to decrease in intensity [32]. Additionally, partial decomposition of chalcopyrite at high temperatures can result in the formation of lower sulfides or oxides, further reducing the quantity of chalcopyrite in the sample and thereby decreasing the intensity of its characteristic peaks [33]. Another significant factor is particle size reduction due to sintering or melting during thermal treatment. Smaller particles produce broader and less intense XRD peaks due to their increased surface area and the presence of more defects [34]. High temperatures also introduce thermal stresses and defects, such as dislocations and vacancies in the crystal structure, which scatter X-rays non-coherently, reducing the overall peak intensity [31]. Surface oxidation may also occur during thermal treatment, especially in an oxidative environment. The formation of an oxide layer on the surface of chalcopyrite particles attenuates the X-ray signal, leading to a reduction in peak intensities. Surface oxidation alters the surface composition and affects the diffraction characteristics [35].
In summary, the decrease in XRD peak intensity after thermal pretreatment of chalcopyrite was due to a combination of decreased crystallinity, phase transformations, thermal decomposition, particle size reduction, introduction of defects, and surface oxidation. These effects collectively reduced the intensity of the XRD peaks, reflecting the structural and compositional changes induced by high-temperature treatment. Understanding these mechanisms is crucial for interpreting the effects of thermal treatment and optimizing processes in materials science and mineralogy.
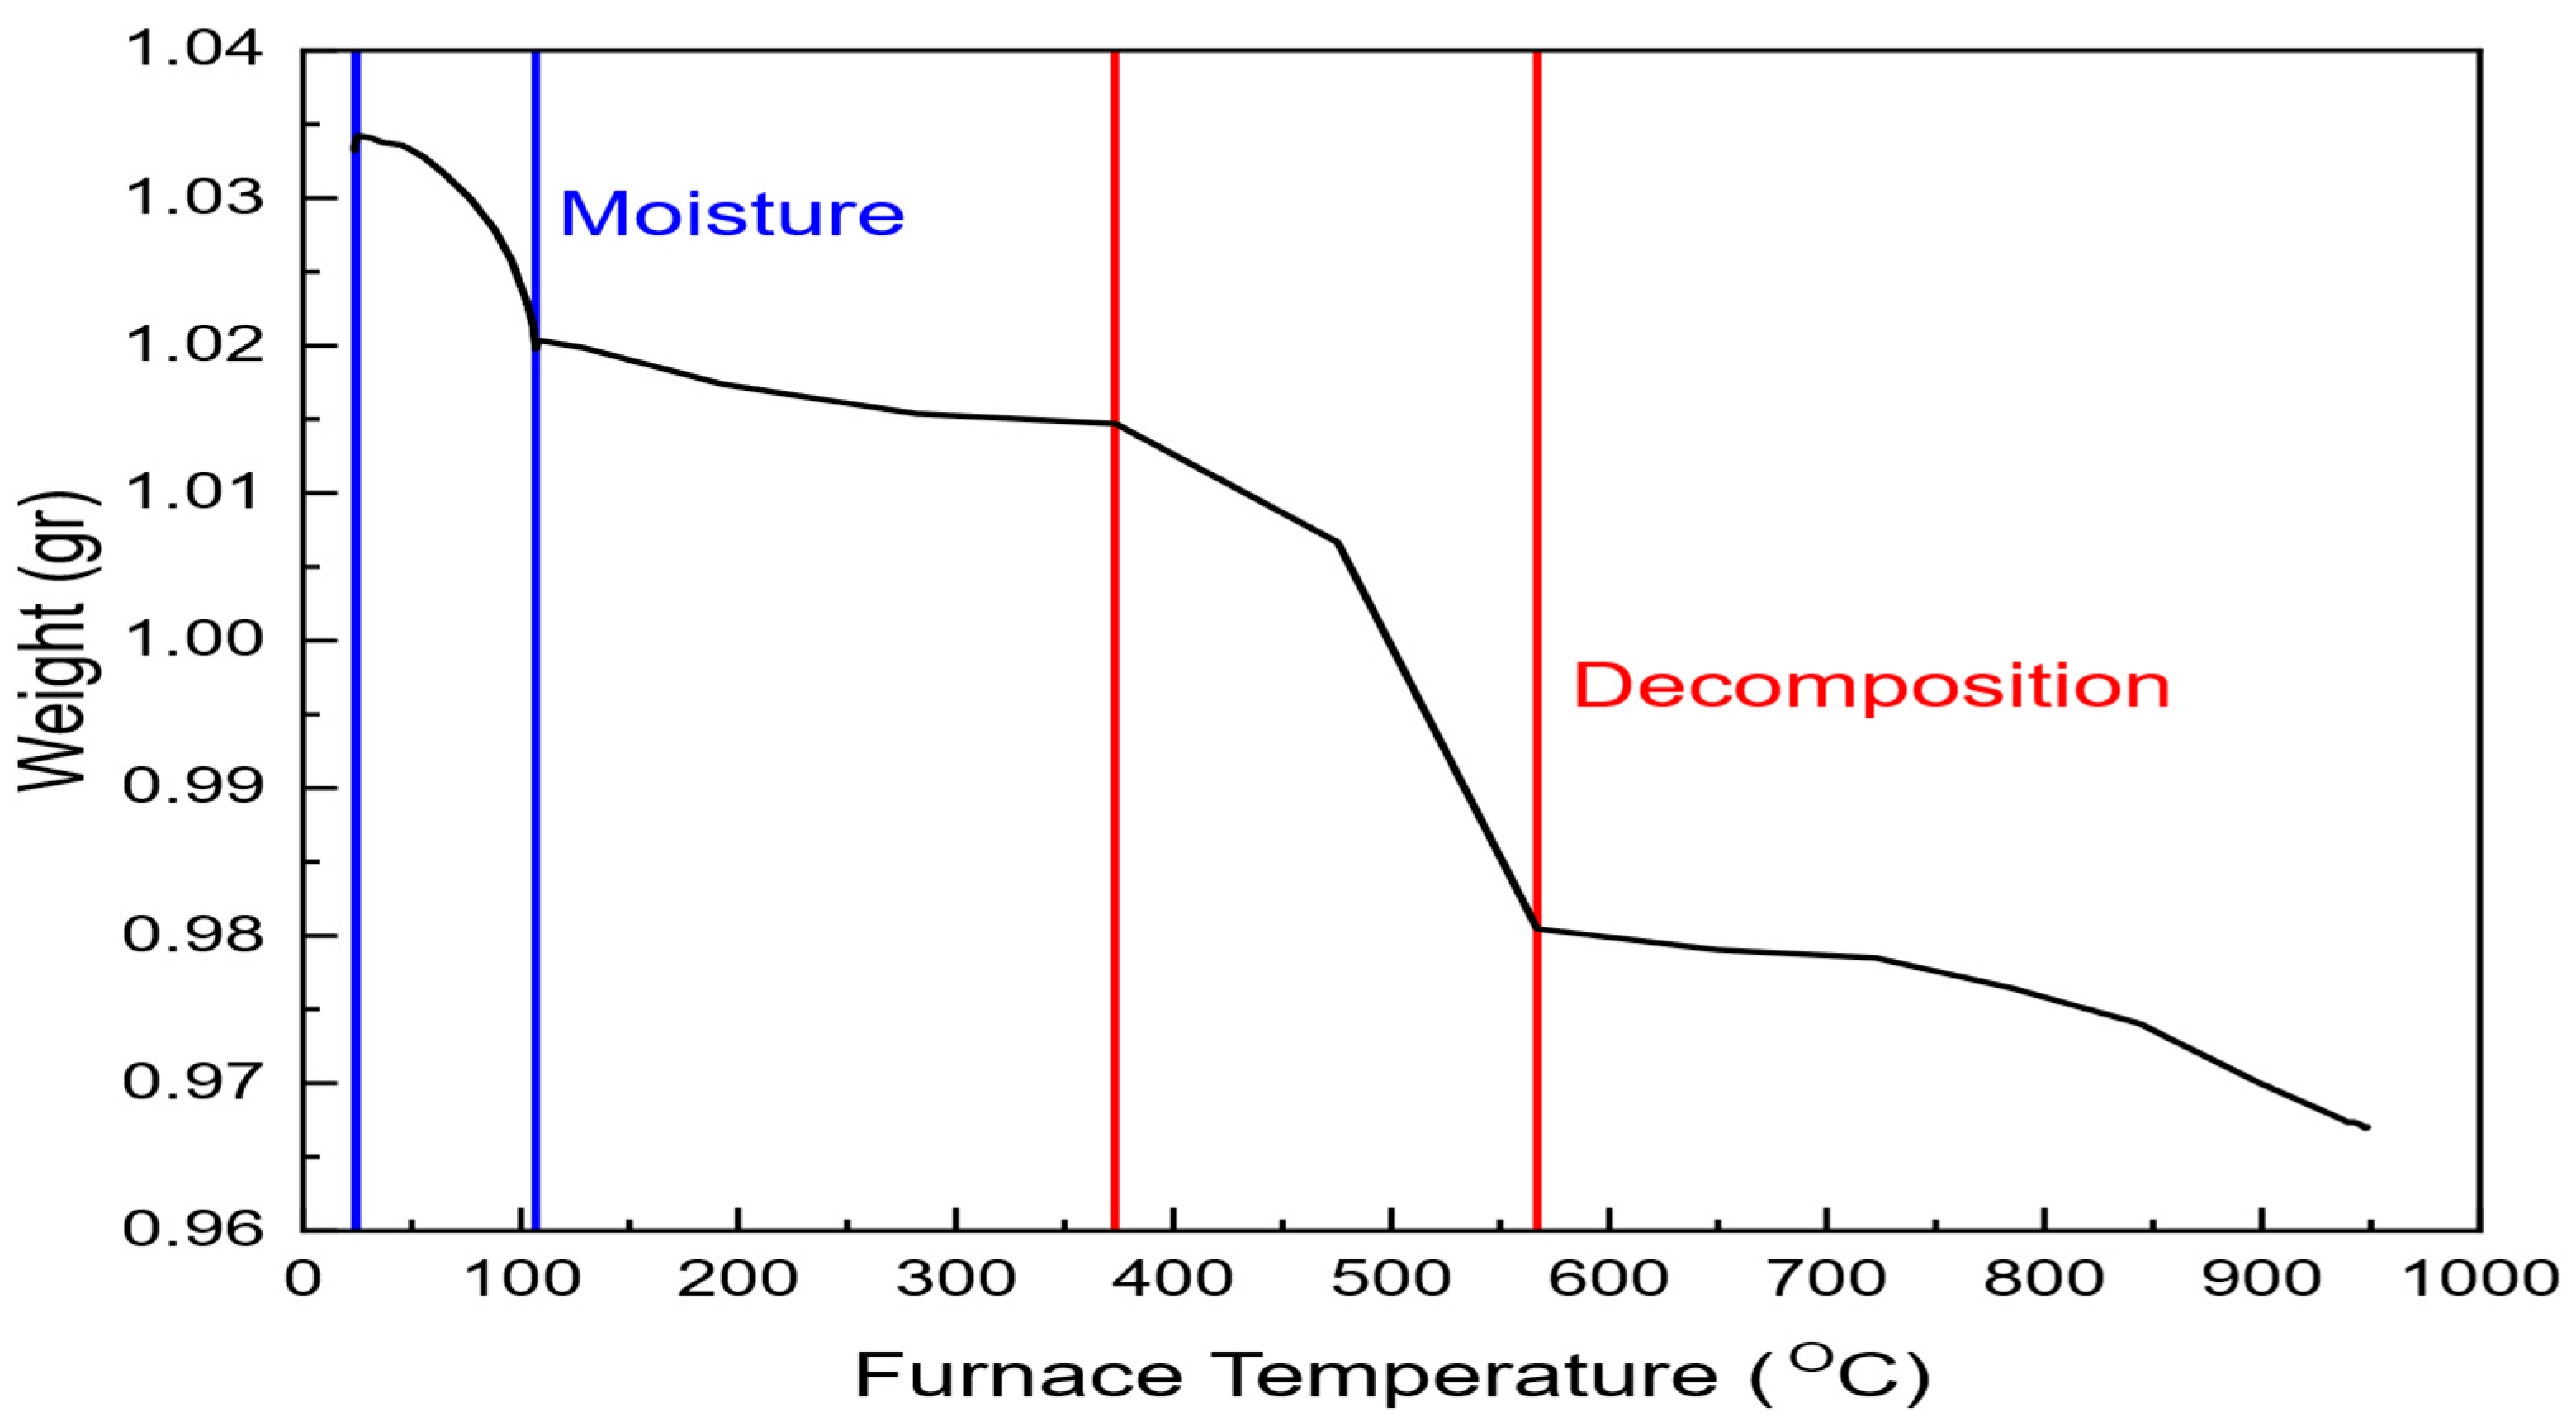
The thermogravimetric analysis (TGA) of the chalcopyrite sample, as shown in Figure 23, highlighted two significant mass loss stages during heating. The first stage occurred between room temperature and approximately 150 °C, which corresponds to the removal of moisture and adsorbed water from the sample. This is a typical behavior for sulfide minerals, where surface moisture evaporates at relatively low temperatures [30]. The second stage, occurring between 300 °C and 600 °C, represented the thermal decomposition of the mineral, leading to the release of volatile components and the formation of metal oxides, such as copper oxides and iron oxides [28]. This decomposition phase indicated structural transformations within chalcopyrite, which can reduce crystallinity and alter the mineral’s physical properties, as corroborated by the XRD analysis. The reduction in mass beyond 600 °C was linked to further decomposition of residual sulfides, consistent with the findings in previous studies of sulfide minerals [20]. Understanding these thermal events is crucial for optimizing thermal pretreatment processes to enhance the efficiency of grinding and energy consumption.

4. Conclusions

This research demonstrated that thermal pretreatment is an effective method for enhancing the grindability of chalcopyrite ore, improving both energy efficiency and grinding performance. By applying thermal pretreatment at 300 °C and 600 °C, the structural integrity of the chalcopyrite ore was compromised, leading to the formation of microcracks and phase transformations, as confirmed by TGA, XRD, and SEM analyses. These changes resulted in a significant reduction of approximately 10% in energy consumption during grinding, while also improving the grindability of the ore by reducing the particle size (P80).
Furthermore, optimization of grinding parameters, including the mill speed and ball filling ratio, demonstrated additional avenues for energy savings. Reducing the mill speed was found to lower energy consumption without negatively impacting the particle size, while increasing the ball filling ratio reduced energy consumption but resulted in a coarser final product. The SEM analysis provided visual confirmation of the microcrack formation and changes in surface morphology that contributed to the observed improvements in grindability.
In conclusion, the combination of thermal pretreatment and optimized grinding parameters presents an effective strategy for reducing energy consumption and improving grinding efficiency in chalcopyrite ore processing. These findings are highly relevant for industrial mineral processing, offering practical solutions for minimizing energy usage while maintaining product quality and operational efficiency.
Author Contributions

Conceptualization, K.A. and Q.H.; Methodology, K.A.; Software, K.A.; Validation, K.A. and Q.H.; Formal analysis, K.A.; Investigation, K.A.; Resources, Q.H.; Writing—review & editing, K.A.; Visualization, K.A.; Supervision, Q.H.; Project administration, Q.H.; Funding acquisition, Q.H. All authors have read and agreed to the published version of the manuscript.

Funding

The study that was supported by the Department of Energy Advanced Research Project Agency—Energy, under Award Number DE-AR0001713.

Data Availability Statement

The original contributions presented in the study are included in the article, further inquiries can be directed to the corresponding author.

Acknowledgments

The findings presented in this manuscript were based on a study that was supported by the Department of Energy Advanced Research Project Agency—Energy, under Award Number DE-AR0001713.

Conflicts of Interest

The authors declare no conflict of interest.

References

  1. Napier-Munn, T.; Morrell, S.; Morrison, R.D.; Kojovic, T. Mineral Comminution Circuits: Their Operation and Optimization; Julius Kruttschnitt Mineral Research Centre: Indooroopilly, Australia, 1999. [Google Scholar]
  2. Powell, M.S.; McBride, W.J. A comprehensive strategy to improve energy efficiency in grinding circuits. Miner. Eng. 2012, 24, 899–909. [Google Scholar]
  3. Matsanga, N.; Nheta, W.; Chimwani, N. A Review of the Grinding Media in Ball Mills for Mineral Processing. Minerals 2023, 13, 1373. [Google Scholar] [CrossRef]
  4. Kingman, S.W.; Rowson, N.A.; Bradshaw, S.M.; Jia, D. The influence of microwave pretreatment on grinding and liberation of minerals in a microwave-sensitive ore. Miner. Eng. 2000, 13, 1219–1230. [Google Scholar] [CrossRef]
  5. Amankwah, R.K.; Pickles, C.A.; Yen, W.T. Microwave treatment of metal sulfide concentrates. Miner. Eng. 2005, 18, 659–669. [Google Scholar]
  6. Manouchehri, H.R.; Hall, R.; Parreira, J. The effect of thermal treatment on flotation performance of ilmenite ore. Miner. Eng. 2008, 21, 180–186. [Google Scholar]
  7. Tavares, L.M.; Kingman, S.W.; Payne, R. Enhancing gold recovery from refractory ores via microwave treatment. Miner. Eng. 2010, 23, 247–251. [Google Scholar]
  8. Karamanev, D.G.; Nikolov, L.N. Thermal pretreatment of iron ore for improved fragmentation and reactivity. Int. J. Miner. Process. 1996, 47, 89–98. [Google Scholar]
  9. Box, G.E.; Behnken, D.W. Some new three-level designs for the study of quantitative variables. Technometrics 1960, 2, 455–475. [Google Scholar] [CrossRef]
  10. Tavares, L.M.; de Souza, R.T. Energy savings in comminution through microwave pre-treatment of ores. Miner. Eng. 2012, 29, 63–72. [Google Scholar]
  11. Watling, H.R. The bioleaching of sulphide minerals with emphasis on copper sulphides—A review. Hydrometallurgy 2006, 84, 81–108. [Google Scholar] [CrossRef]
  12. Abraitis, P.K.; Pattrick, R.A.D.; Vaughan, D.J. Variations in the compositional, textural and electrical properties of natural pyrite: A review. Int. J. Miner. Process. 2004, 74, 41–59. [Google Scholar] [CrossRef]
  13. Gotor, F.J.; Rodríguez, M.A.; Rojas, T.C.; Levenfeld, B. Thermal behaviour of natural chalcopyrite. Thermochim. Acta 2000, 365, 159–168. [Google Scholar]
  14. Asgari, K.; Huang, Q.; Honaker, R.; Sabolsky, E. Investigating the Effect of Microwave Pretreatment on Bastnasite Grinding for Comminution Energy Reduction and Rare Earth Recovery. Processes 2024, 12, 2468. [Google Scholar] [CrossRef]
  15. Austin, L.G.; Luckie, P.T. Methods for Determination of Breakage Distribution Parameters. Miner. Process. Extr. Metall. Rev. 1971, 6, 105–123. [Google Scholar] [CrossRef]
  16. Morrell, S. An alternative energy-size relationship to that proposed by Bond for the design and optimization of grinding circuits. Int. J. Miner. Process. 2004, 74, S133–S141. [Google Scholar] [CrossRef]
  17. Tavares, L.M. Energy consumption in comminution: Modelling and its application to ball mills. Miner. Eng. 2007, 20, 937–947. [Google Scholar]
  18. Morrell, S. Power draw of wet tumbling mills and its relationship to charge dynamics. Miner. Eng. 1996, 9, 77–91. [Google Scholar]
  19. Gupta, A.; Yan, D.S. Mineral Processing Design and Operation: An Introduction; Elsevier: Amsterdam, The Netherlands, 2016. [Google Scholar]
  20. Kingman, S.W.; Rowson, N.A. Microwave treatment of minerals—A review. Miner. Eng. 1998, 11, 1081–1087. [Google Scholar] [CrossRef]
  21. Zhang, X.; Lavernia, E.J. Thermal cycling and microstructure evolution in metallic alloys. Mater. Sci. Eng. A 1996, 206, 289–304. [Google Scholar]
  22. Wills, B.A.; Finch, J.A. Wills’ Mineral Processing Technology: An Introduction to the Practical Aspects of Ore Treatment and Mineral Recovery, 8th ed.; Butterworth-Heinemann: Oxford, UK, 2015. [Google Scholar]
  23. Schwartz, W.F. Habashi, Chalcopyrite, its Chemistry and Metallurgy. XI + 165 S., 90 Abb., 24 Tab. New York 1978. McGraw Hill. $ 22.00. Z. Für Allg. Mikrobiol. 1980, 20, 231. [Google Scholar] [CrossRef]
  24. Ball Charge Design & Management. Available online: https://www.cementequipment.org/main-category/cement-grinding-main-category/process-training-ball-mill/ (accessed on 10 January 2024).
  25. Kumar, A.; Sahu, R.; Tripathy, S.K. Energy-Efficient Advanced Ultrafine Grinding of Particles Using Stirred Mills—A Review. Energies 2023, 16, 5277. [Google Scholar] [CrossRef]
  26. Adewuyi, S.O.; Ahmed, H.A.M. Grinding Behaviour of Microwave-Irradiated Mining Waste. Energies 2021, 14, 3991. [Google Scholar] [CrossRef]
  27. Rao, R.; Veeresh, M.B.; Banerjee, G.N. Effect of thermal pretreatment on grindability and upgradation of bauxite for refractory applications. In Proceedings of the TMS Annual Meeting, Light Metals: Proceedings of Sessions; Warrendale, PA, USA, 28 February 2002, pp. 205–208.
  28. Adewuyi, S.O.; Ahmed, H.A.M.; Ahmed, H.M.A. Methods of Ore Pretreatment for Comminution Energy Reduction. Minerals 2020, 10, 423. [Google Scholar] [CrossRef]
  29. Tavares, L.; King, R.P. Single-particle fracture under impact loading. Int. J. Miner. Process. 1998, 54, 1–28. [Google Scholar] [CrossRef]
  30. Mitchell, R.H.; Gunter, W.D. Deformation and recrystallization of chalcopyrite. Mineral. Mag. 2013, 77, 1201–1217. [Google Scholar]
  31. Cullity, B.D.; Stock, S.R. Elements of X-Ray Diffraction, 3rd ed.; Prentice-Hall: Upper Saddle River, NJ, USA, 2001. [Google Scholar]
  32. Koleini, S.M.J.; Abdollahy, M.; Noaparast, M. The effect of thermal treatment on chalcopyrite flotation. Int. J. Miner. Process. 2011, 98, 56–62. [Google Scholar]
  33. Aminian, H.; Fornalczyk, A.; Lipinski, K. Thermal behavior of chalcopyrite at elevated temperatures. J. Min. Sci. 2012, 48, 826–834. [Google Scholar]
  34. Klug, H.P.; Alexander, L.E. X-Ray Diffraction Procedures for Polycrystalline and Amorphous Materials, 2nd ed.; Wiley-Interscience: Hoboken, NJ, USA, 1974. [Google Scholar]
  35. Shahverdi, A.; Aslani, M.A.A.; Rashchi, F. Surface modification of chalcopyrite by thermal pretreatment. Miner. Eng. 2015, 79, 44–51. [Google Scholar]
Figure 1. Ball size distribution associated with each ball filling ratio.
Energies 18 02989 g001
Figure 2. Schematic of the ball mill and energy consumption circuit.
Energies 18 02989 g002
Figure 3. Chalcopyrite ball mill feed particle size distribution.
Energies 18 02989 g003
Figure 4. Energy consumption of performed runs.
Energies 18 02989 g004
Figure 5. Product P80 of performed runs.
Energies 18 02989 g005
Figure 6. Main effect plot of (a) ball filling, (b) speed, and (c) temperature for SE consumption.
Energies 18 02989 g006
Figure 7. Comparison of power consumption for samples with and without thermal pretreatment.
Energies 18 02989 g007
Figure 8. Contour and 3D plots for ball filling and speed effects on energy consumption.
Energies 18 02989 g008
Figure 9. Contour and 3D plots for ball filling and thermal effects on energy consumption.
Energies 18 02989 g009
Figure 10. Contour and 3D plots for speed and thermal effects on energy consumption.
Energies 18 02989 g010
Figure 11. Main effect plot of (a) ball filling, (b) mill speed, and (c) temperature for product P80.
Energies 18 02989 g011
Figure 12. Retained mass in different size fractions for different mill speeds (run 2 vs. run 15).
Energies 18 02989 g012
Figure 13. Retained mass in different size fractions for different thermal pretreatments (raw sample in run 5 vs. pretreated in run 14, both at 70% of critical speed and 40% ball filling).
Energies 18 02989 g013
Figure 14. Contour and 3D plots for ball filling and speed effects on product P80.
Energies 18 02989 g014
Figure 15. Contour and 3D plots for ball filling and thermal effects on product P80.
Energies 18 02989 g015
Figure 16. Contour and 3D plots for speed and thermal effects on product P80.
Energies 18 02989 g016
Figure 17. SEM images of raw chalcopyrite ore without any thermal treatment.
Energies 18 02989 g017
Figure 18. SEM images of a pretreated sample at 300 °C.
Energies 18 02989 g018
Figure 19. SEM images of a pretreated sample at 600 °C.
Energies 18 02989 g019
Figure 20. XRD analysis of raw chalcopyrite.
Energies 18 02989 g020
Figure 21. XRD analysis of pretreated chalcopyrite at 300 °C.
Energies 18 02989 g021
Figure 22. XRD analysis of pretreated chalcopyrite at 600 °C.
Energies 18 02989 g022
Figure 23. TGA results of chalcopyrite ore.
Energies 18 02989 g023
Table 1. Experimental parameters for ball mill grinding tests.
ParameterUnitValueValueValue
Ball Filling Ratio%303540
Media Massgr30,69035,80540,920
Solid Massg153417902046
Pretreatment Temp.°C0300600
Critical Speed%607080
Feed Size, F80microns254625462546
Water Massg657767876
Table 2. Developed tests based on the Box–Behnken design.
Factor 1Factor 2Factor 3
RunA: SpeedB: Ball FilingC: Thermal
%%°C
18040300
260350
370300
47035300
570400
67030600
78035600
86035600
97035300
107035300
116030300
126040300
138030300
147040600
1580350
Table 3. Elemental composition of the chalcopyrite sample using the ICP-MS technique.
ElementsConcentration (%)ElementsConcentration (PPM)
Test 1Test 2AverageTest 1Test 2Average
Al4.024.374.20Mo467.55281.47374.51
Si18.6317.7018.18Mn85.8088.8687.33
Cu0.800.850.81
Fe2.542.642.60
Table 4. Results of chalcopyrite grinding tests.
Factor 1Factor 2Factor 3Response 1Response 2
RunA: SpeedB: Ball FilingC: ThermalEnergy ConsumptionP80
%%°CkWh/stMicron
180403007.0171.34
2603506.0665.14
3703007.3960.75
470353006.5766.75
5704006.4973.69
670306006.6456.7
780356006.8062.9
860356005.3462.51
970353006.5665.73
1070353006.5864.91
1160303006.4562.56
1260403005.5476.31
1380303007.9163.03
1470406005.7662.83
15803507.5468.03
Table 5. Definition of the codes in the predictive models.
CodeFactor
ASpeed
BBall Filling
CThermal Pretreatment
Table 6. Results of analysis of variance for the SE input.
SourceSum of SquaresdfMean SquareF-Valuep-Value
Model7.1790.796710,622.79<0.0001significant
A—Speed4.3114.3157,428.17<0.0001
B—Ball Filing1.6111.6121,480.17<0.0001
C—Thermal1.0811.0814,406.00<0.0001
AB0.000010.00000.33330.5887
AC0.000110.00011.330.3004
BC0.000110.00011.330.3004
A20.000510.00056.230.0547
B20.079010.07901053.00<0.0001
C20.079010.07901053.00<0.0001
Residual0.000450.0001
Lack of Fit0.000230.00010.58330.6812not significant
Pure Error0.000220.0001
Cor. Total7.1714
Table 7. Results of analysis of variance for the product P80.
SourceSum of SquaresdfMean SquareF-Valuep-Value
Model296.44649.415.840.0130significant
A—Speed0.186110.18610.02200.8857
B—Ball Filing211.461211.4625.010.0011
C—Thermal64.24164.247.600.0248
AB7.4017.400.87510.3769
AC1.5611.560.18480.6786
BC11.59111.591.370.2753
Residual67.6488.45
Lack of Fit65.94610.9912.930.0735not significant
Pure Error1.7020.8497
Cor. Total364.0814
Disclaimer/Publisher’s Note: The statements, opinions and data contained in all publications are solely those of the individual author(s) and contributor(s) and not of MDPI and/or the editor(s). MDPI and/or the editor(s) disclaim responsibility for any injury to people or property resulting from any ideas, methods, instructions or products referred to in the content.