
Wind Turbine Surface Crack Detection Based on YOLOv5l-GCB


 ,
,
Abstract
1. Introduction
2. Wind Turbine Tower Surface Crack Detection Model
2.1. YOLOv5l Target Detection Model
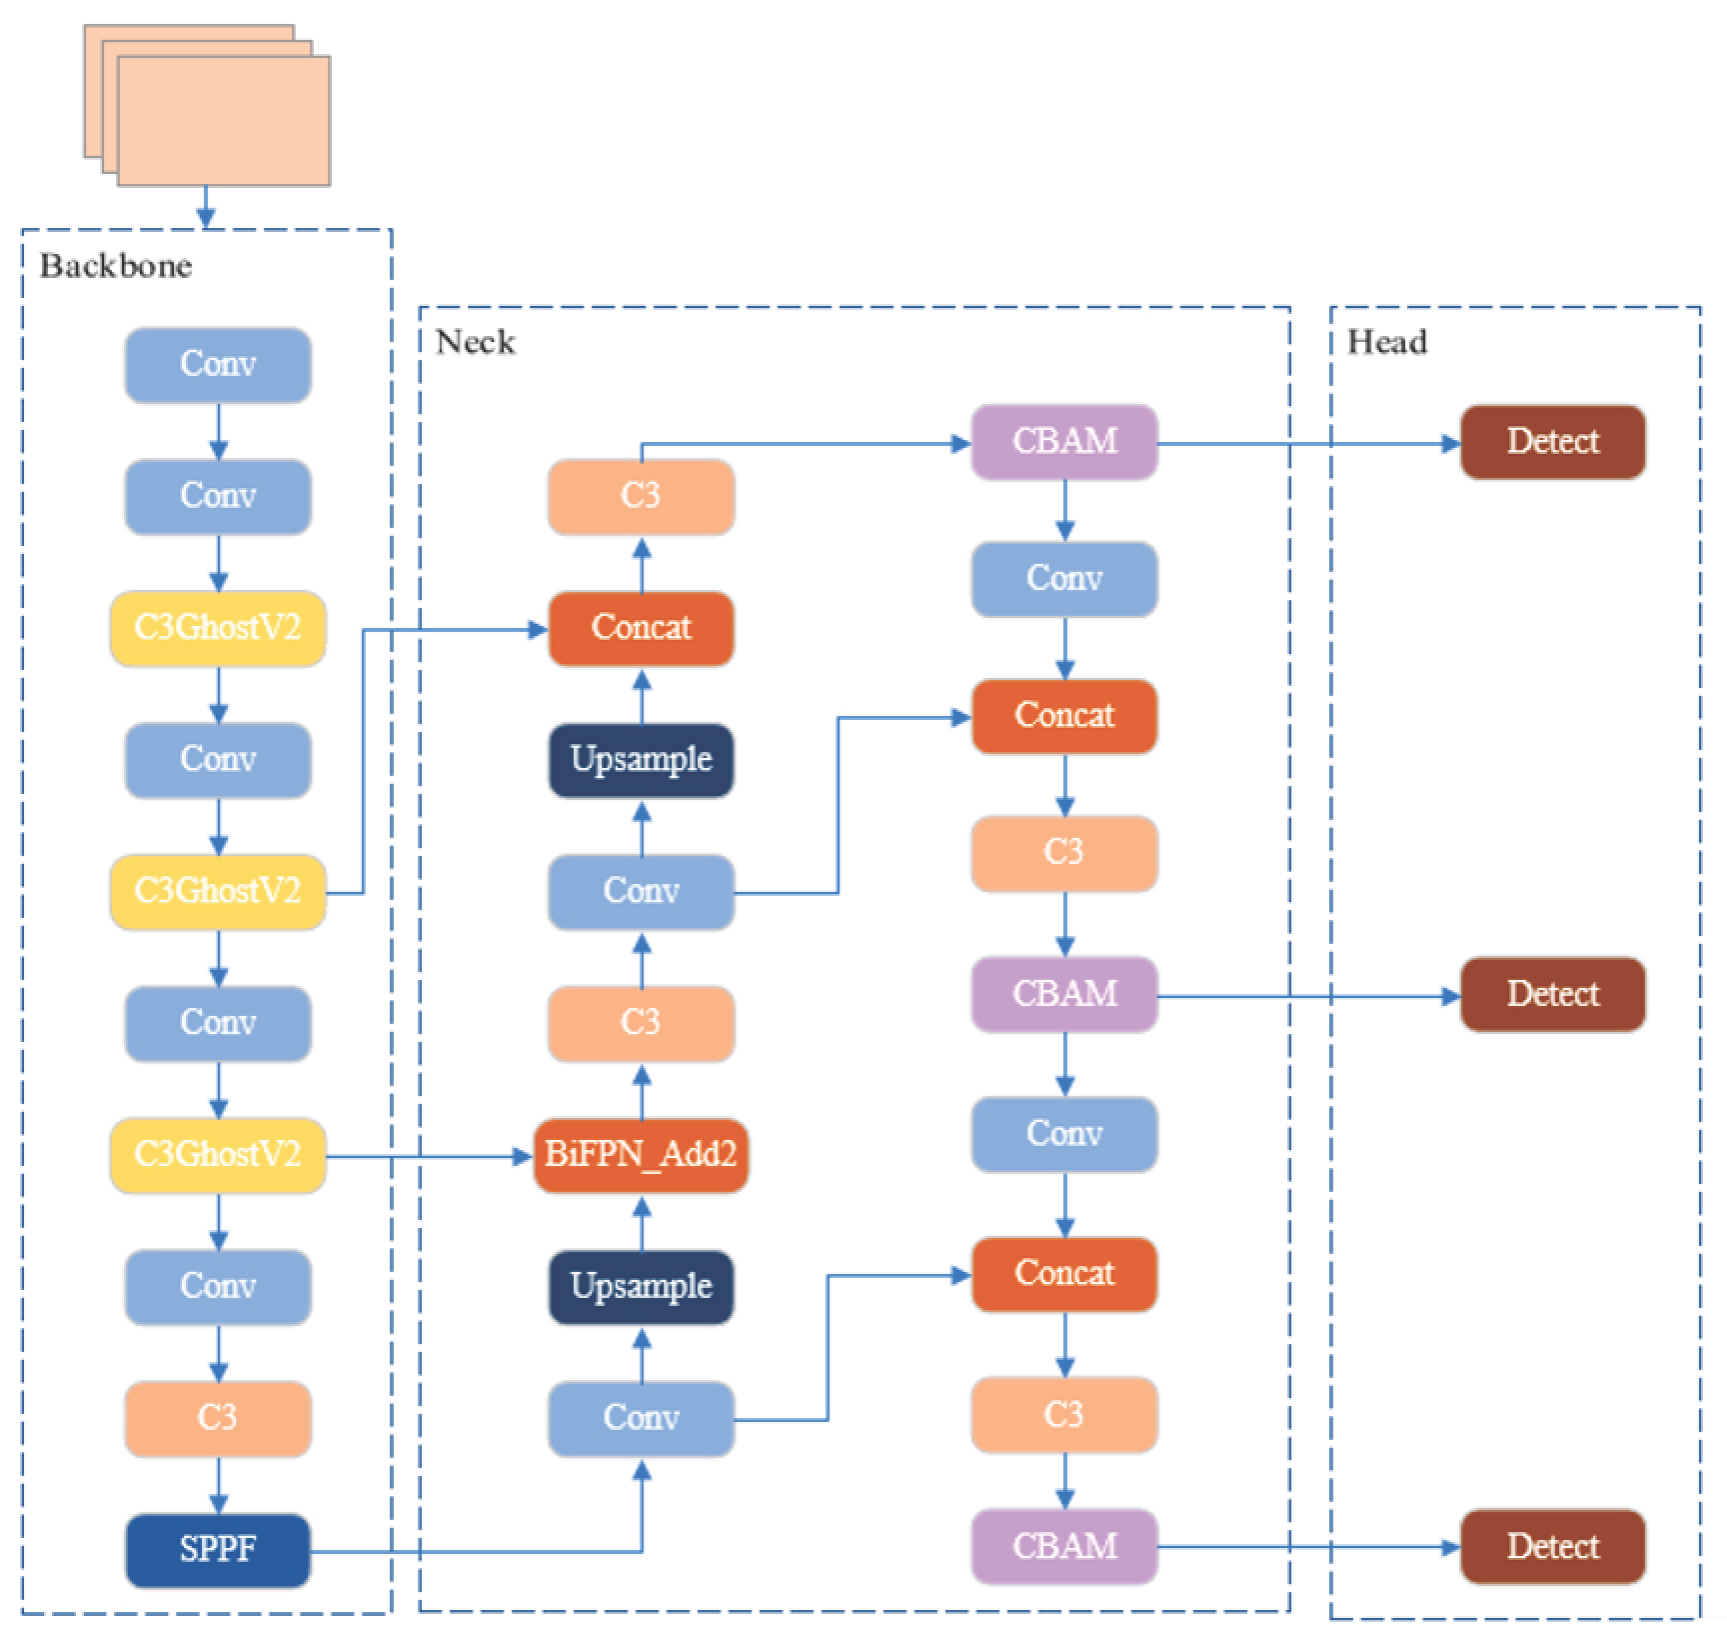
2.2. YOLOv5l-GCB Target Detection Model
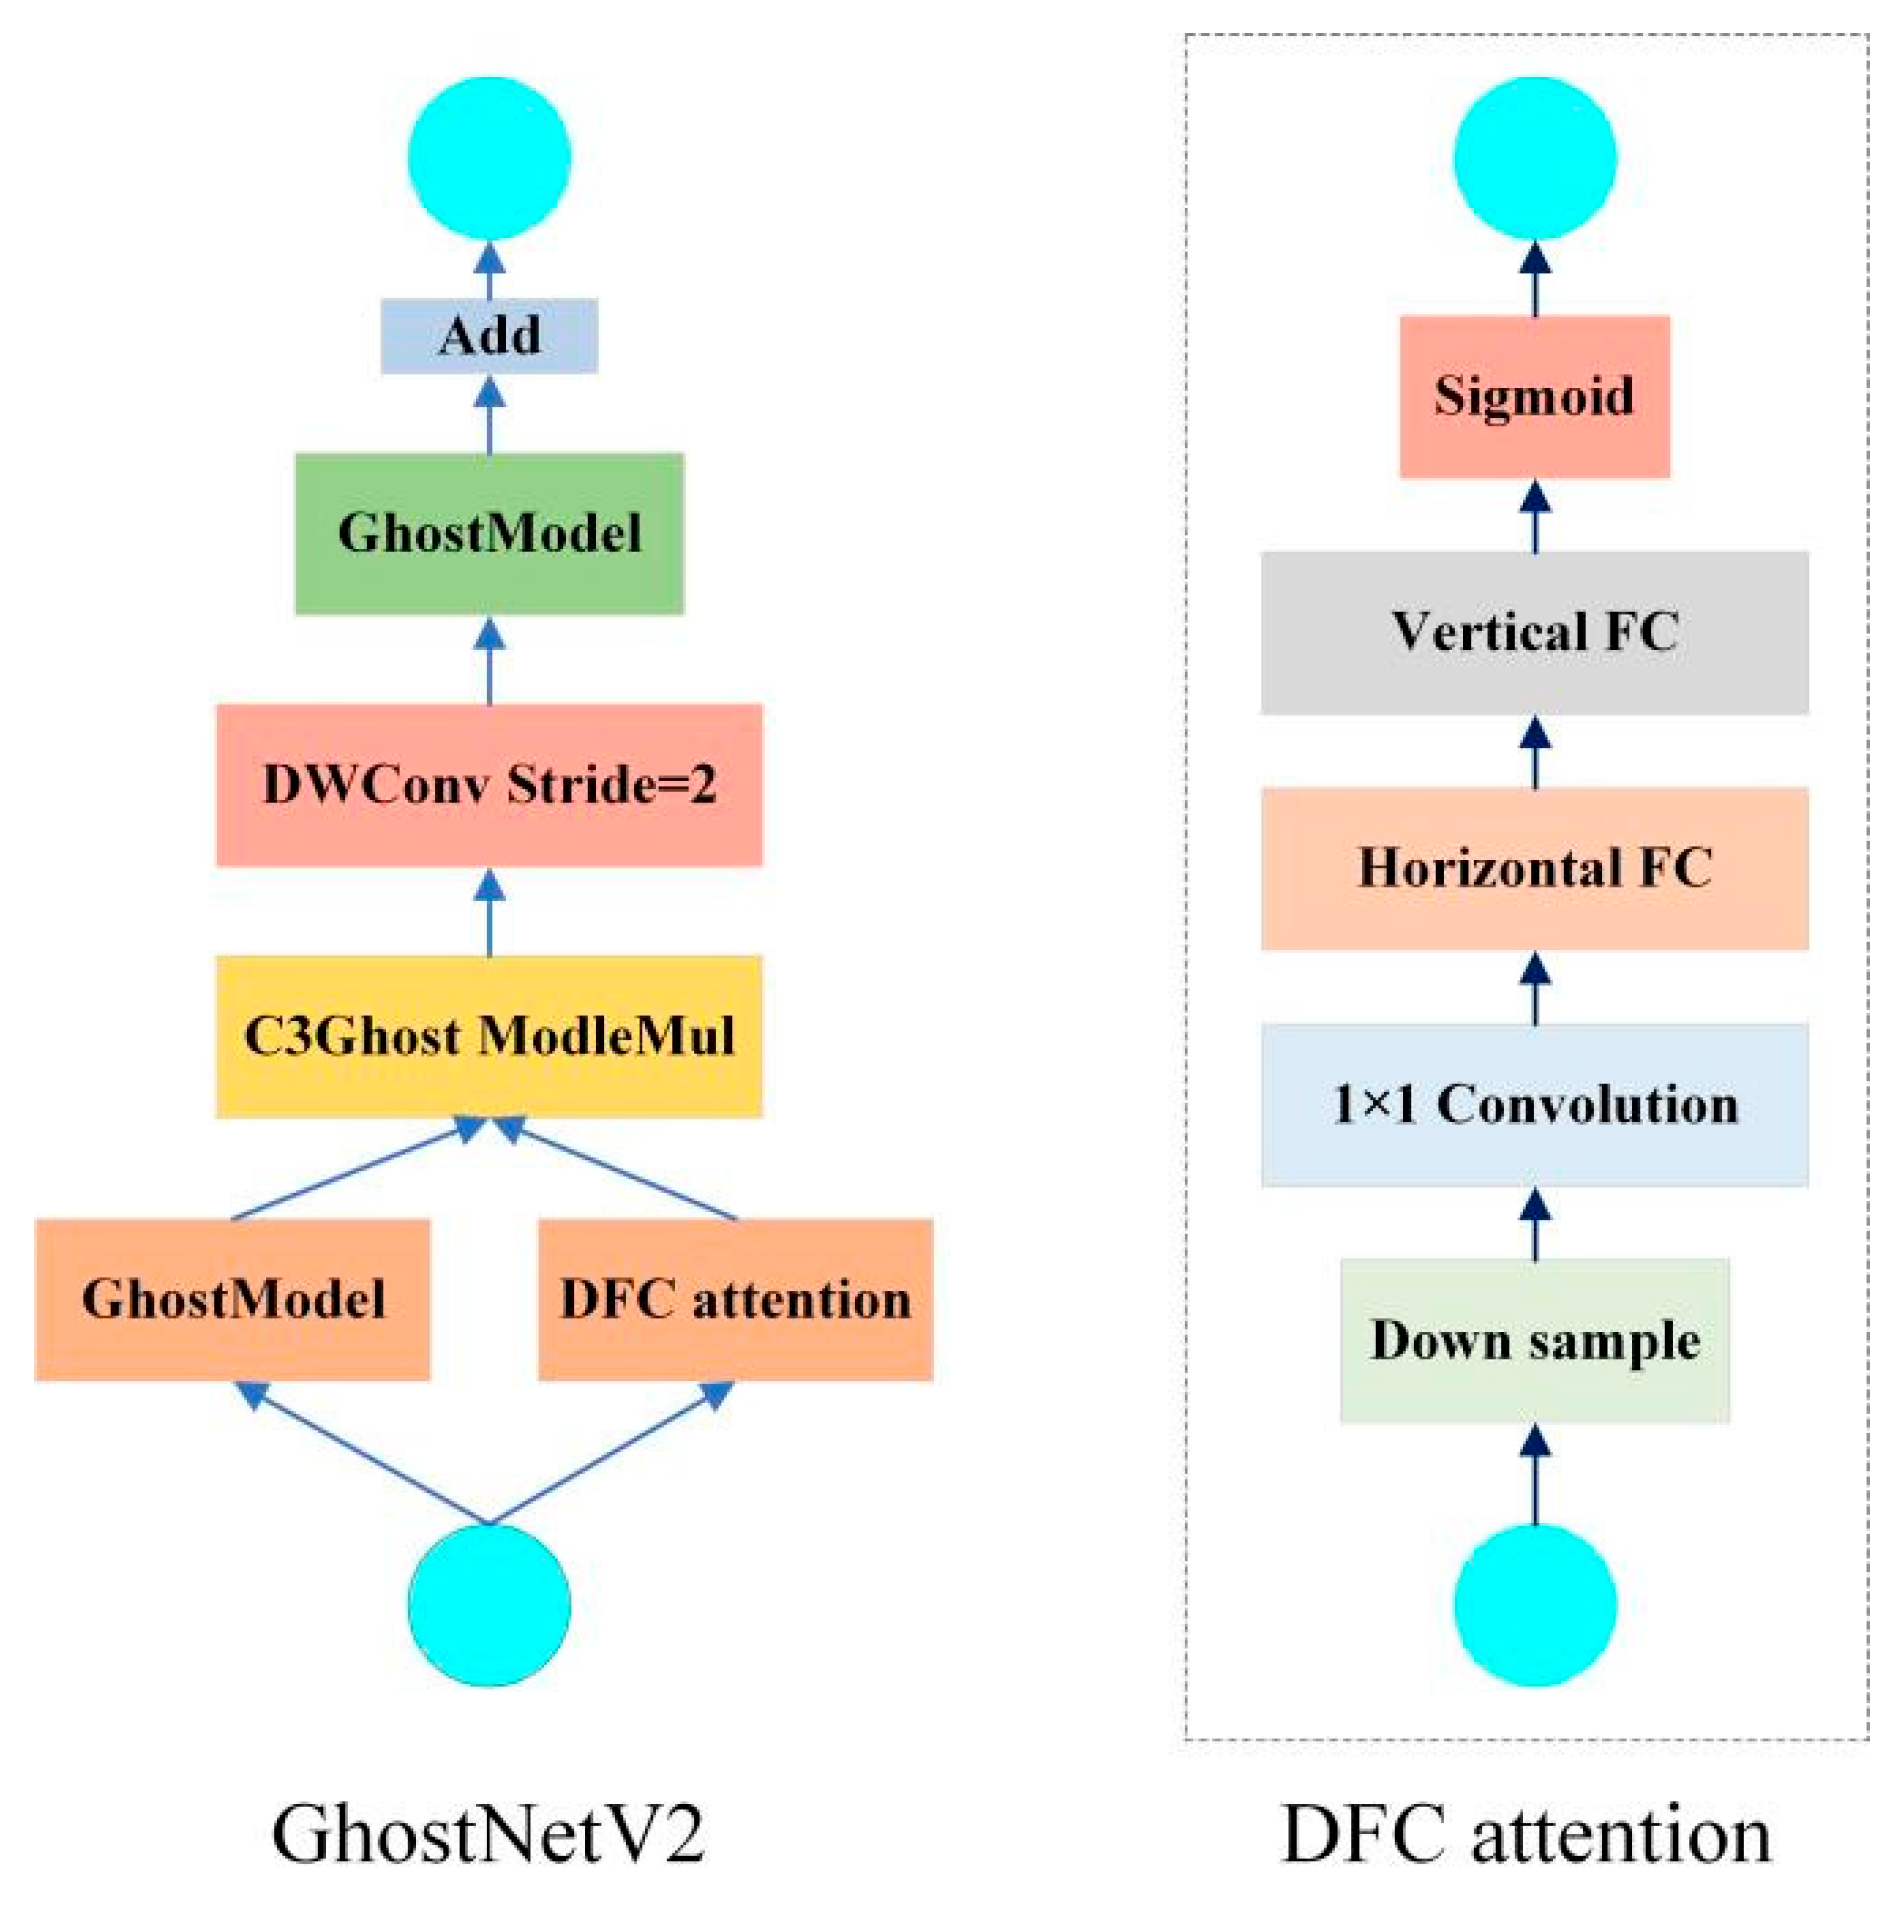
2.2.1. GhostNetV2
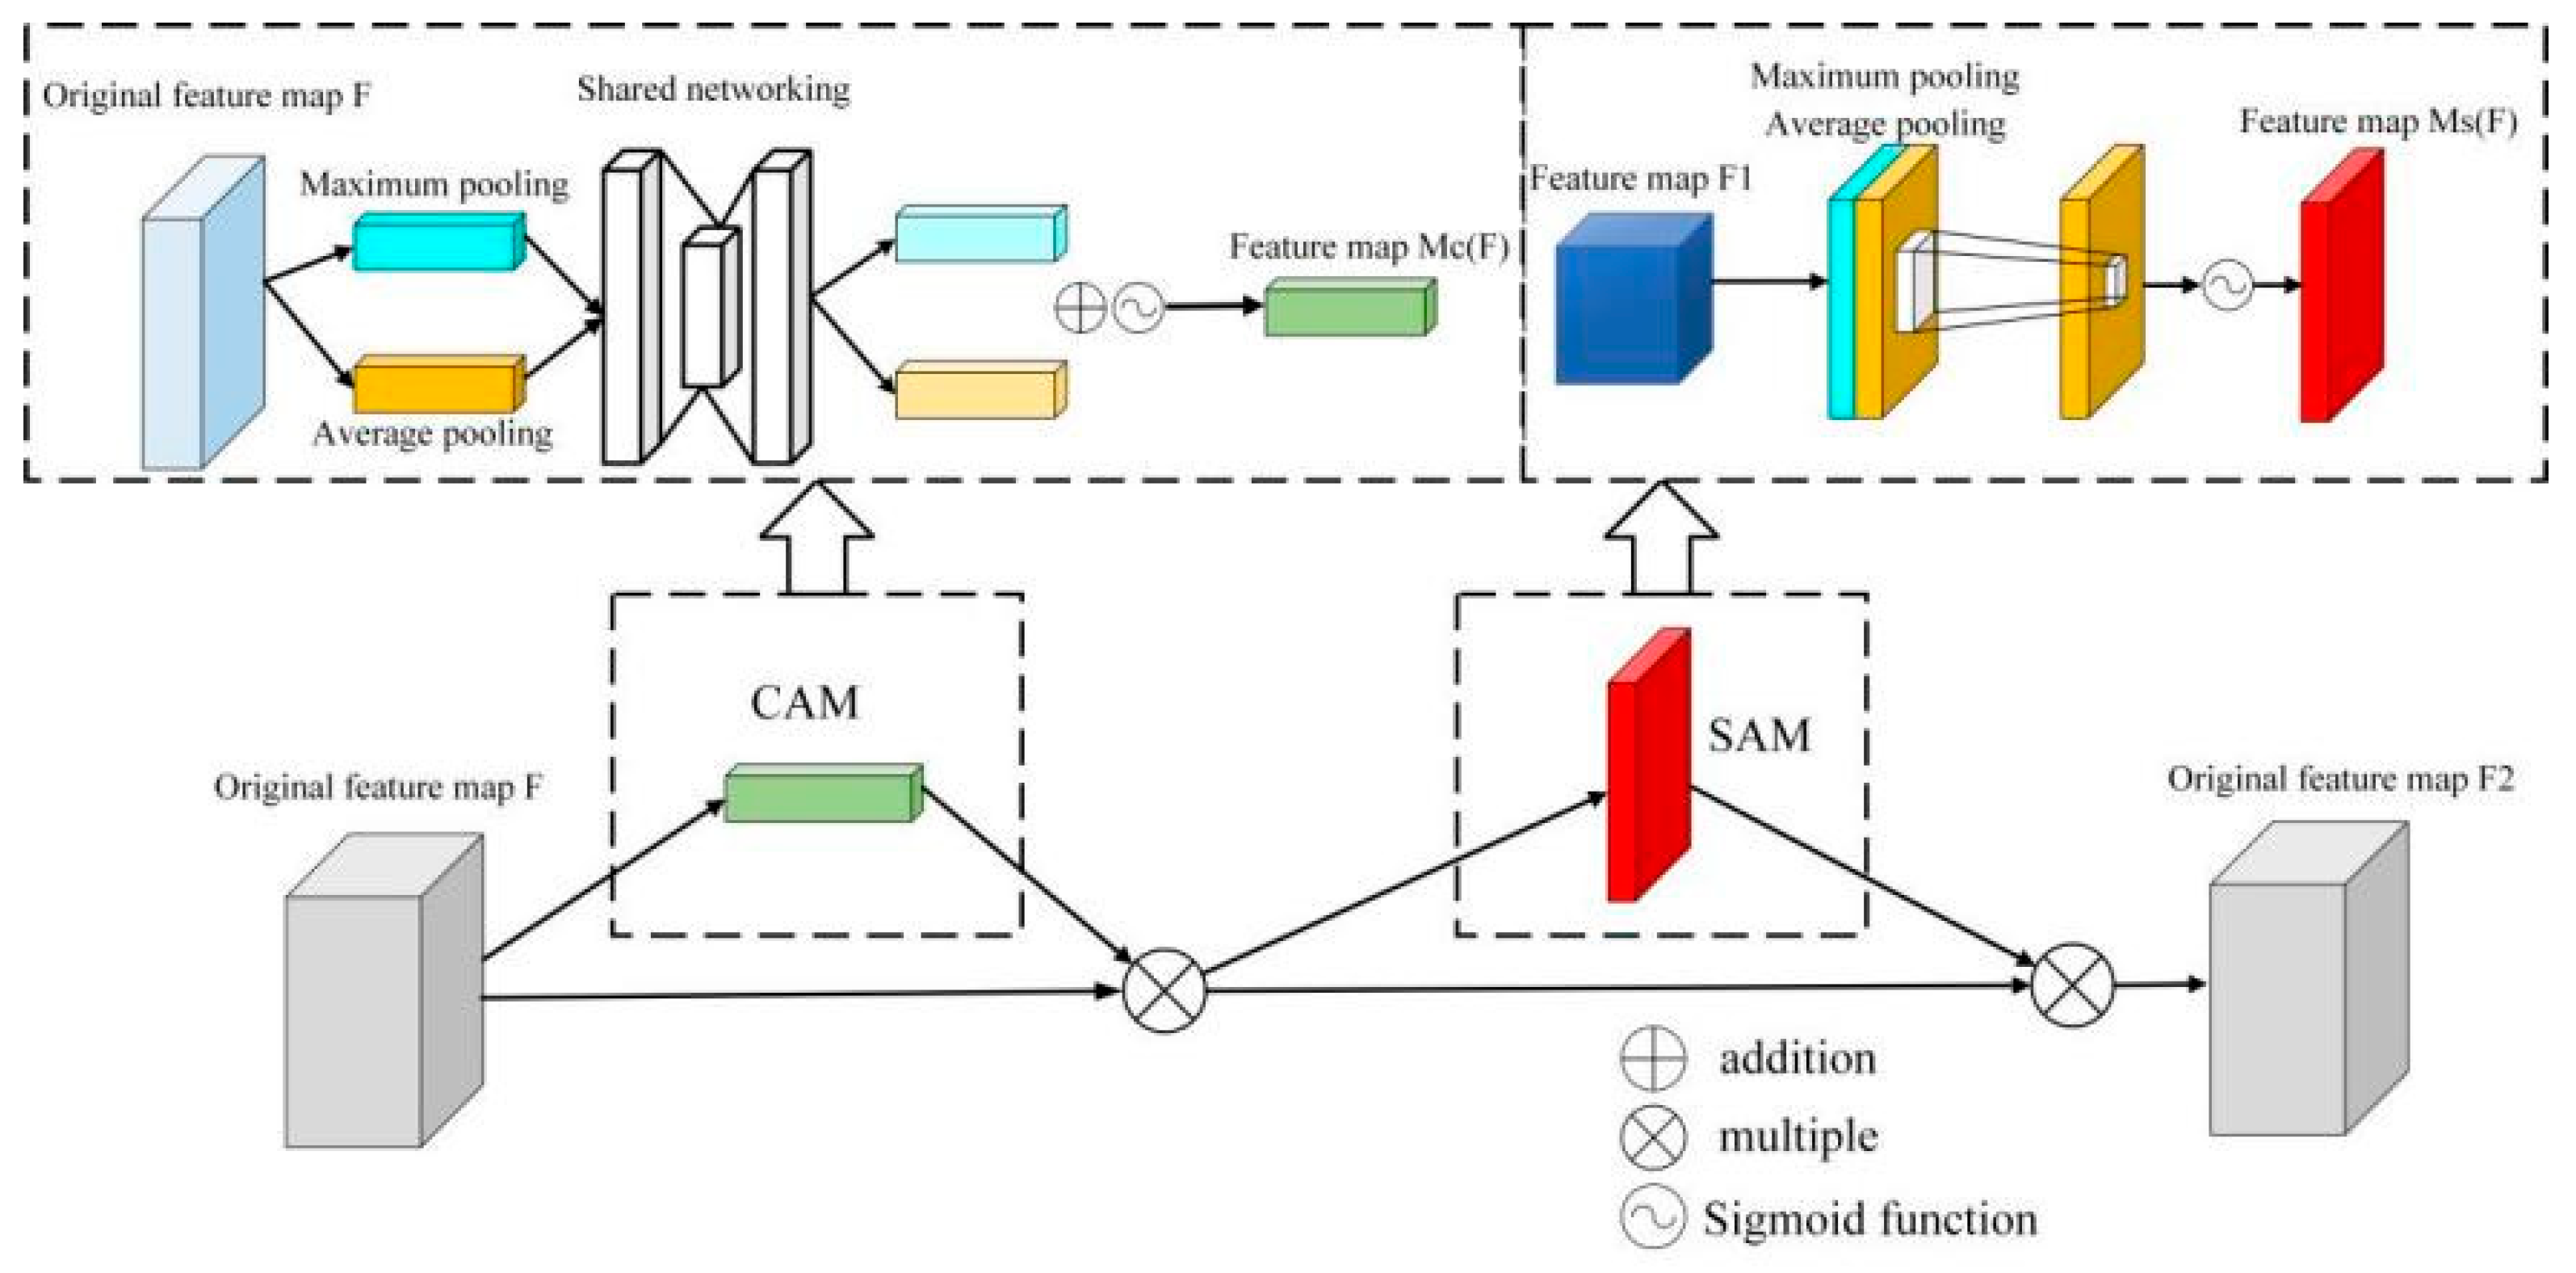
2.2.2. CBAM
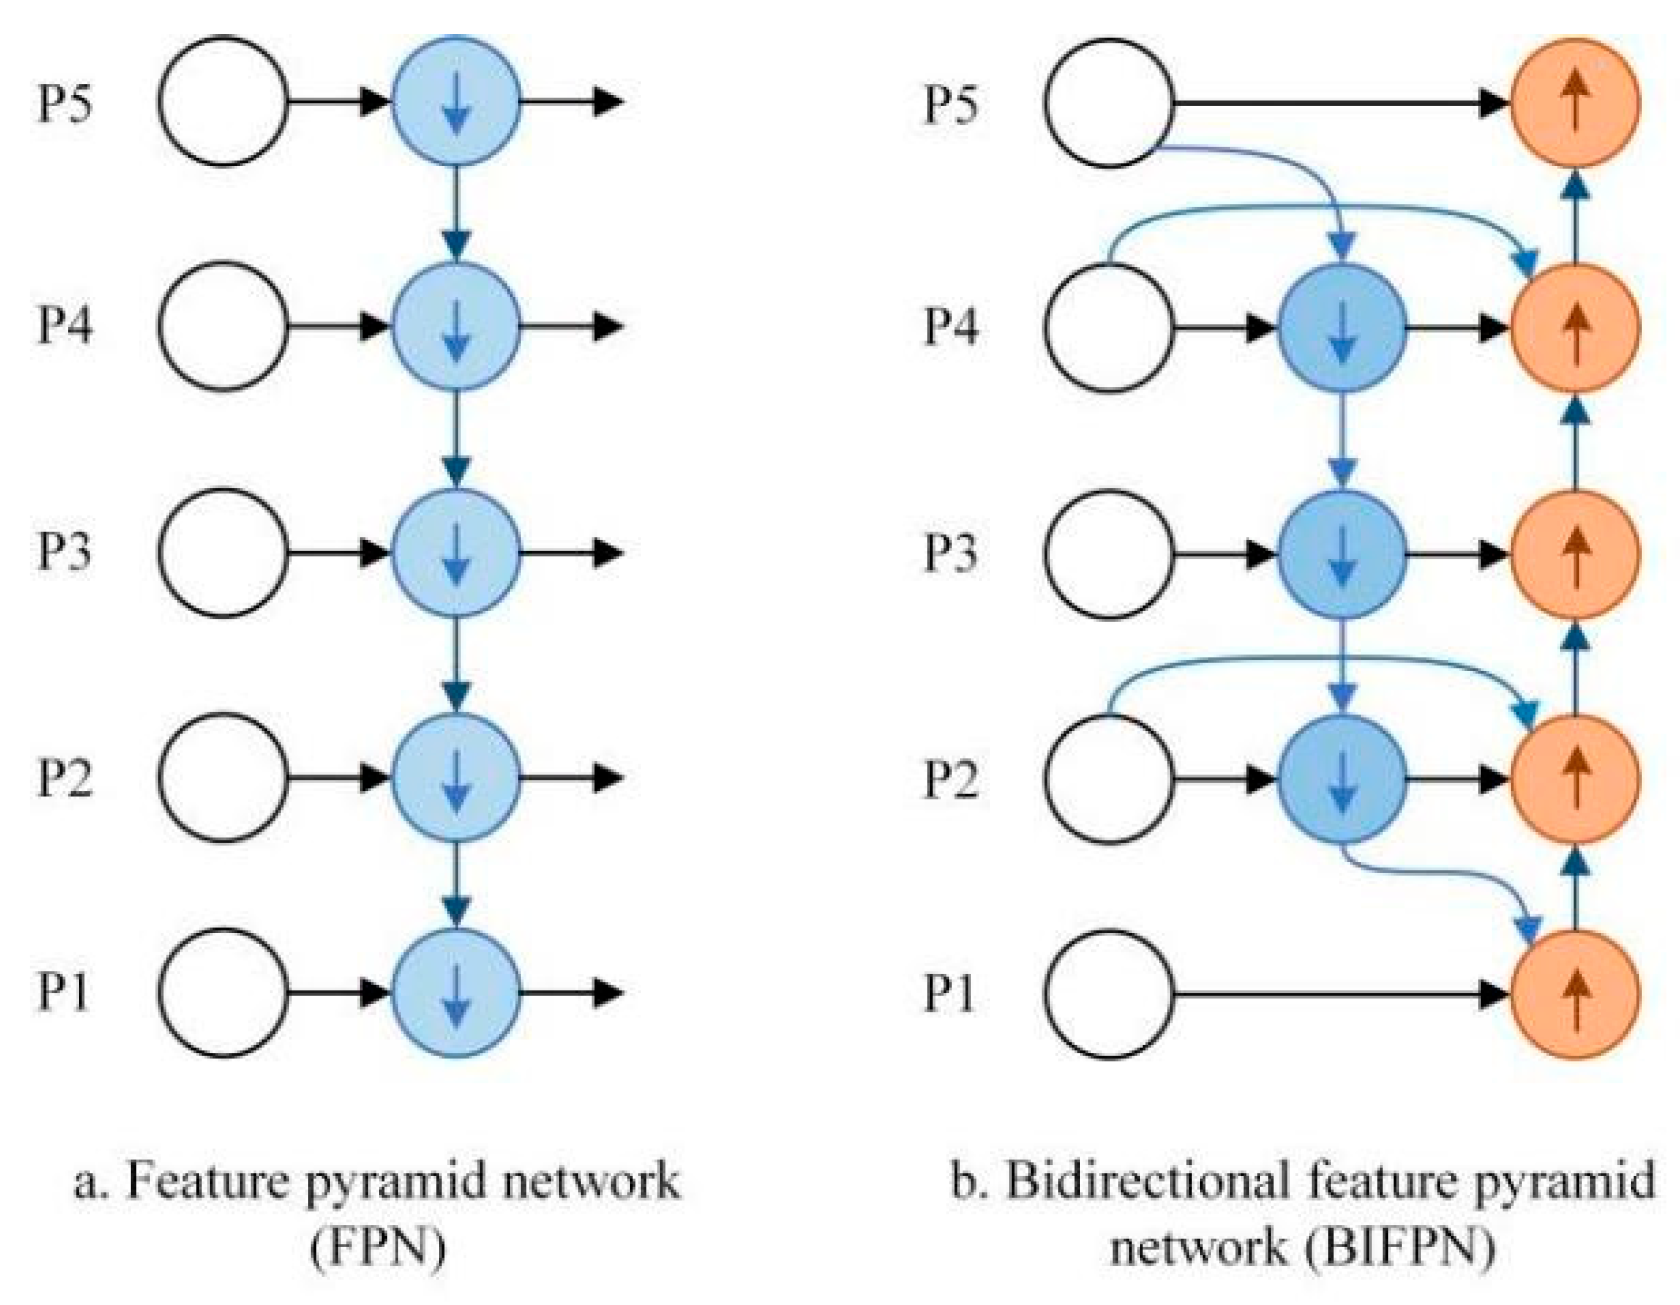
2.2.3. BiFPN Bidirectional Pyramids
3. Experiments and Results
3.1. Dataset
3.2. Experimental Platforms and Evaluation Indicators
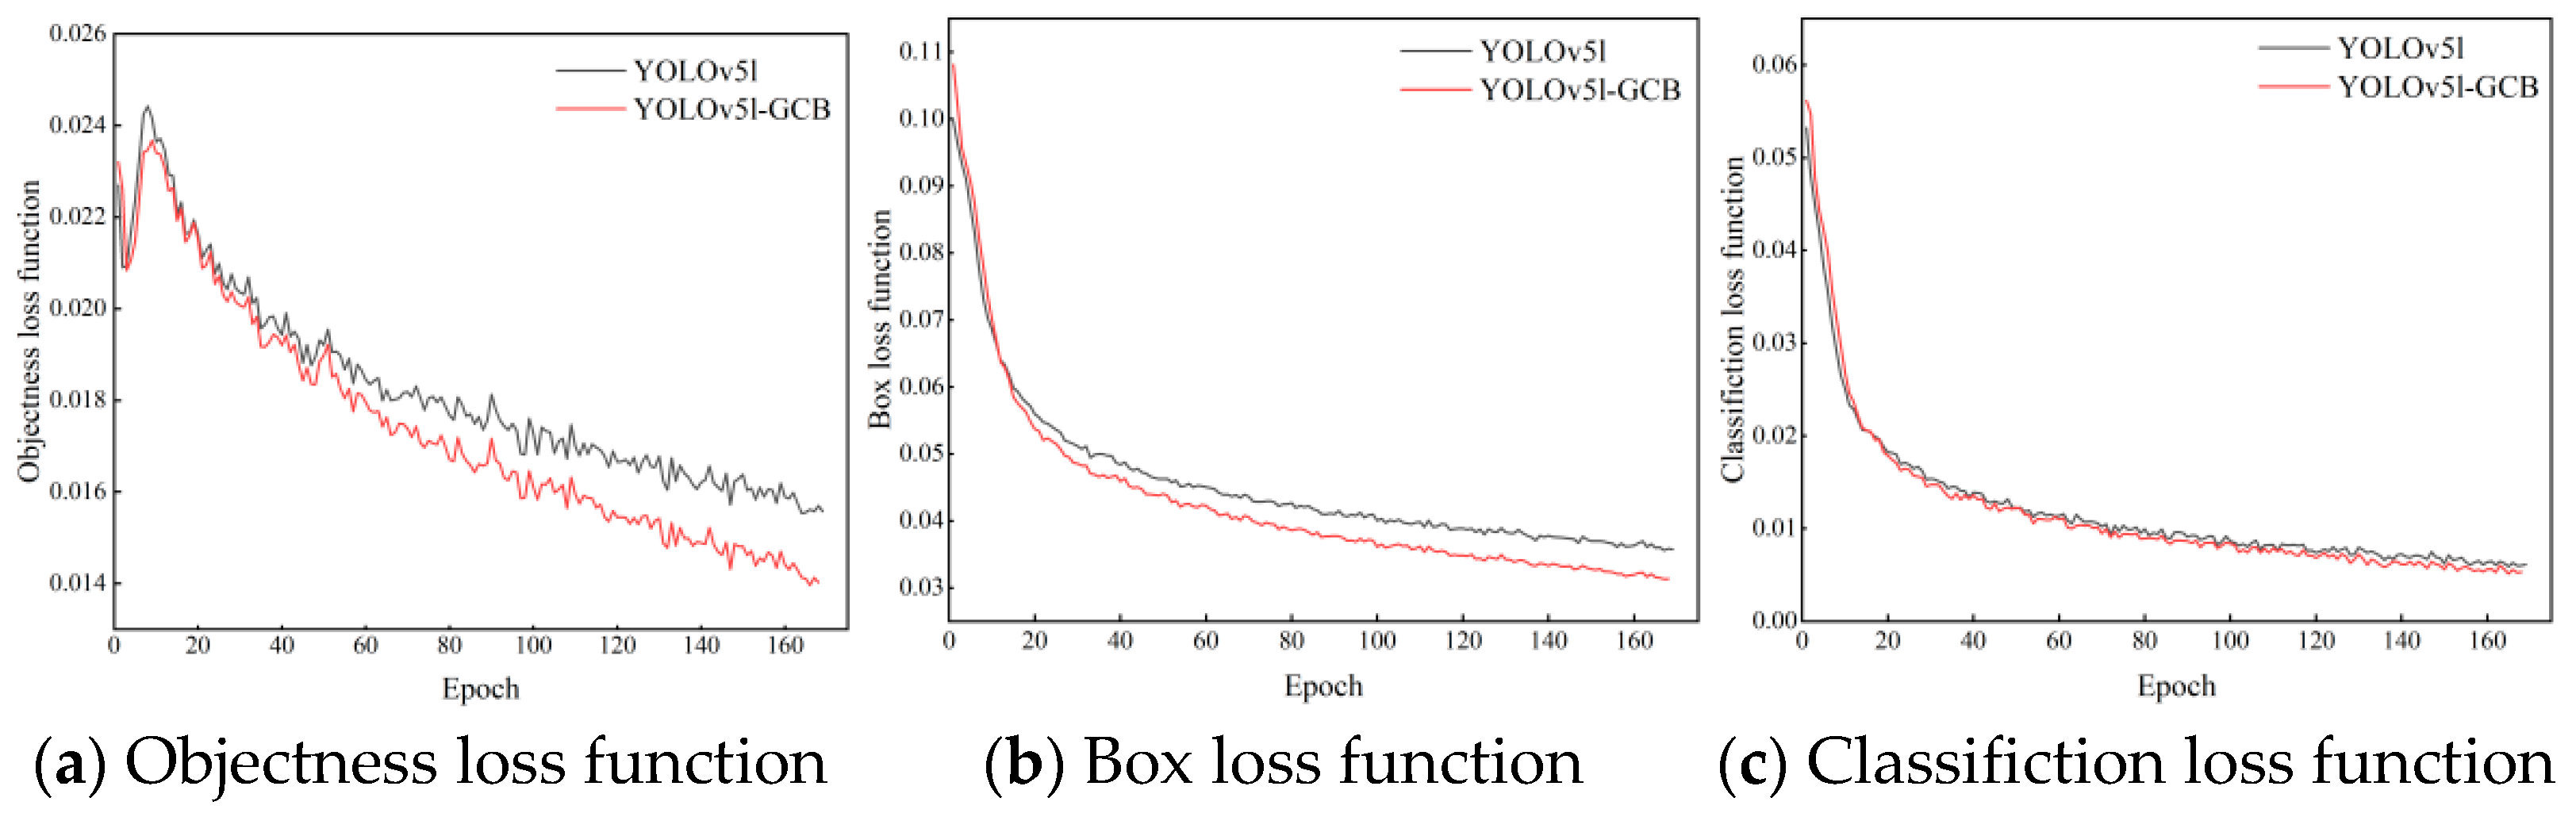
3.3. Training Results
3.4. Ablation Experiments
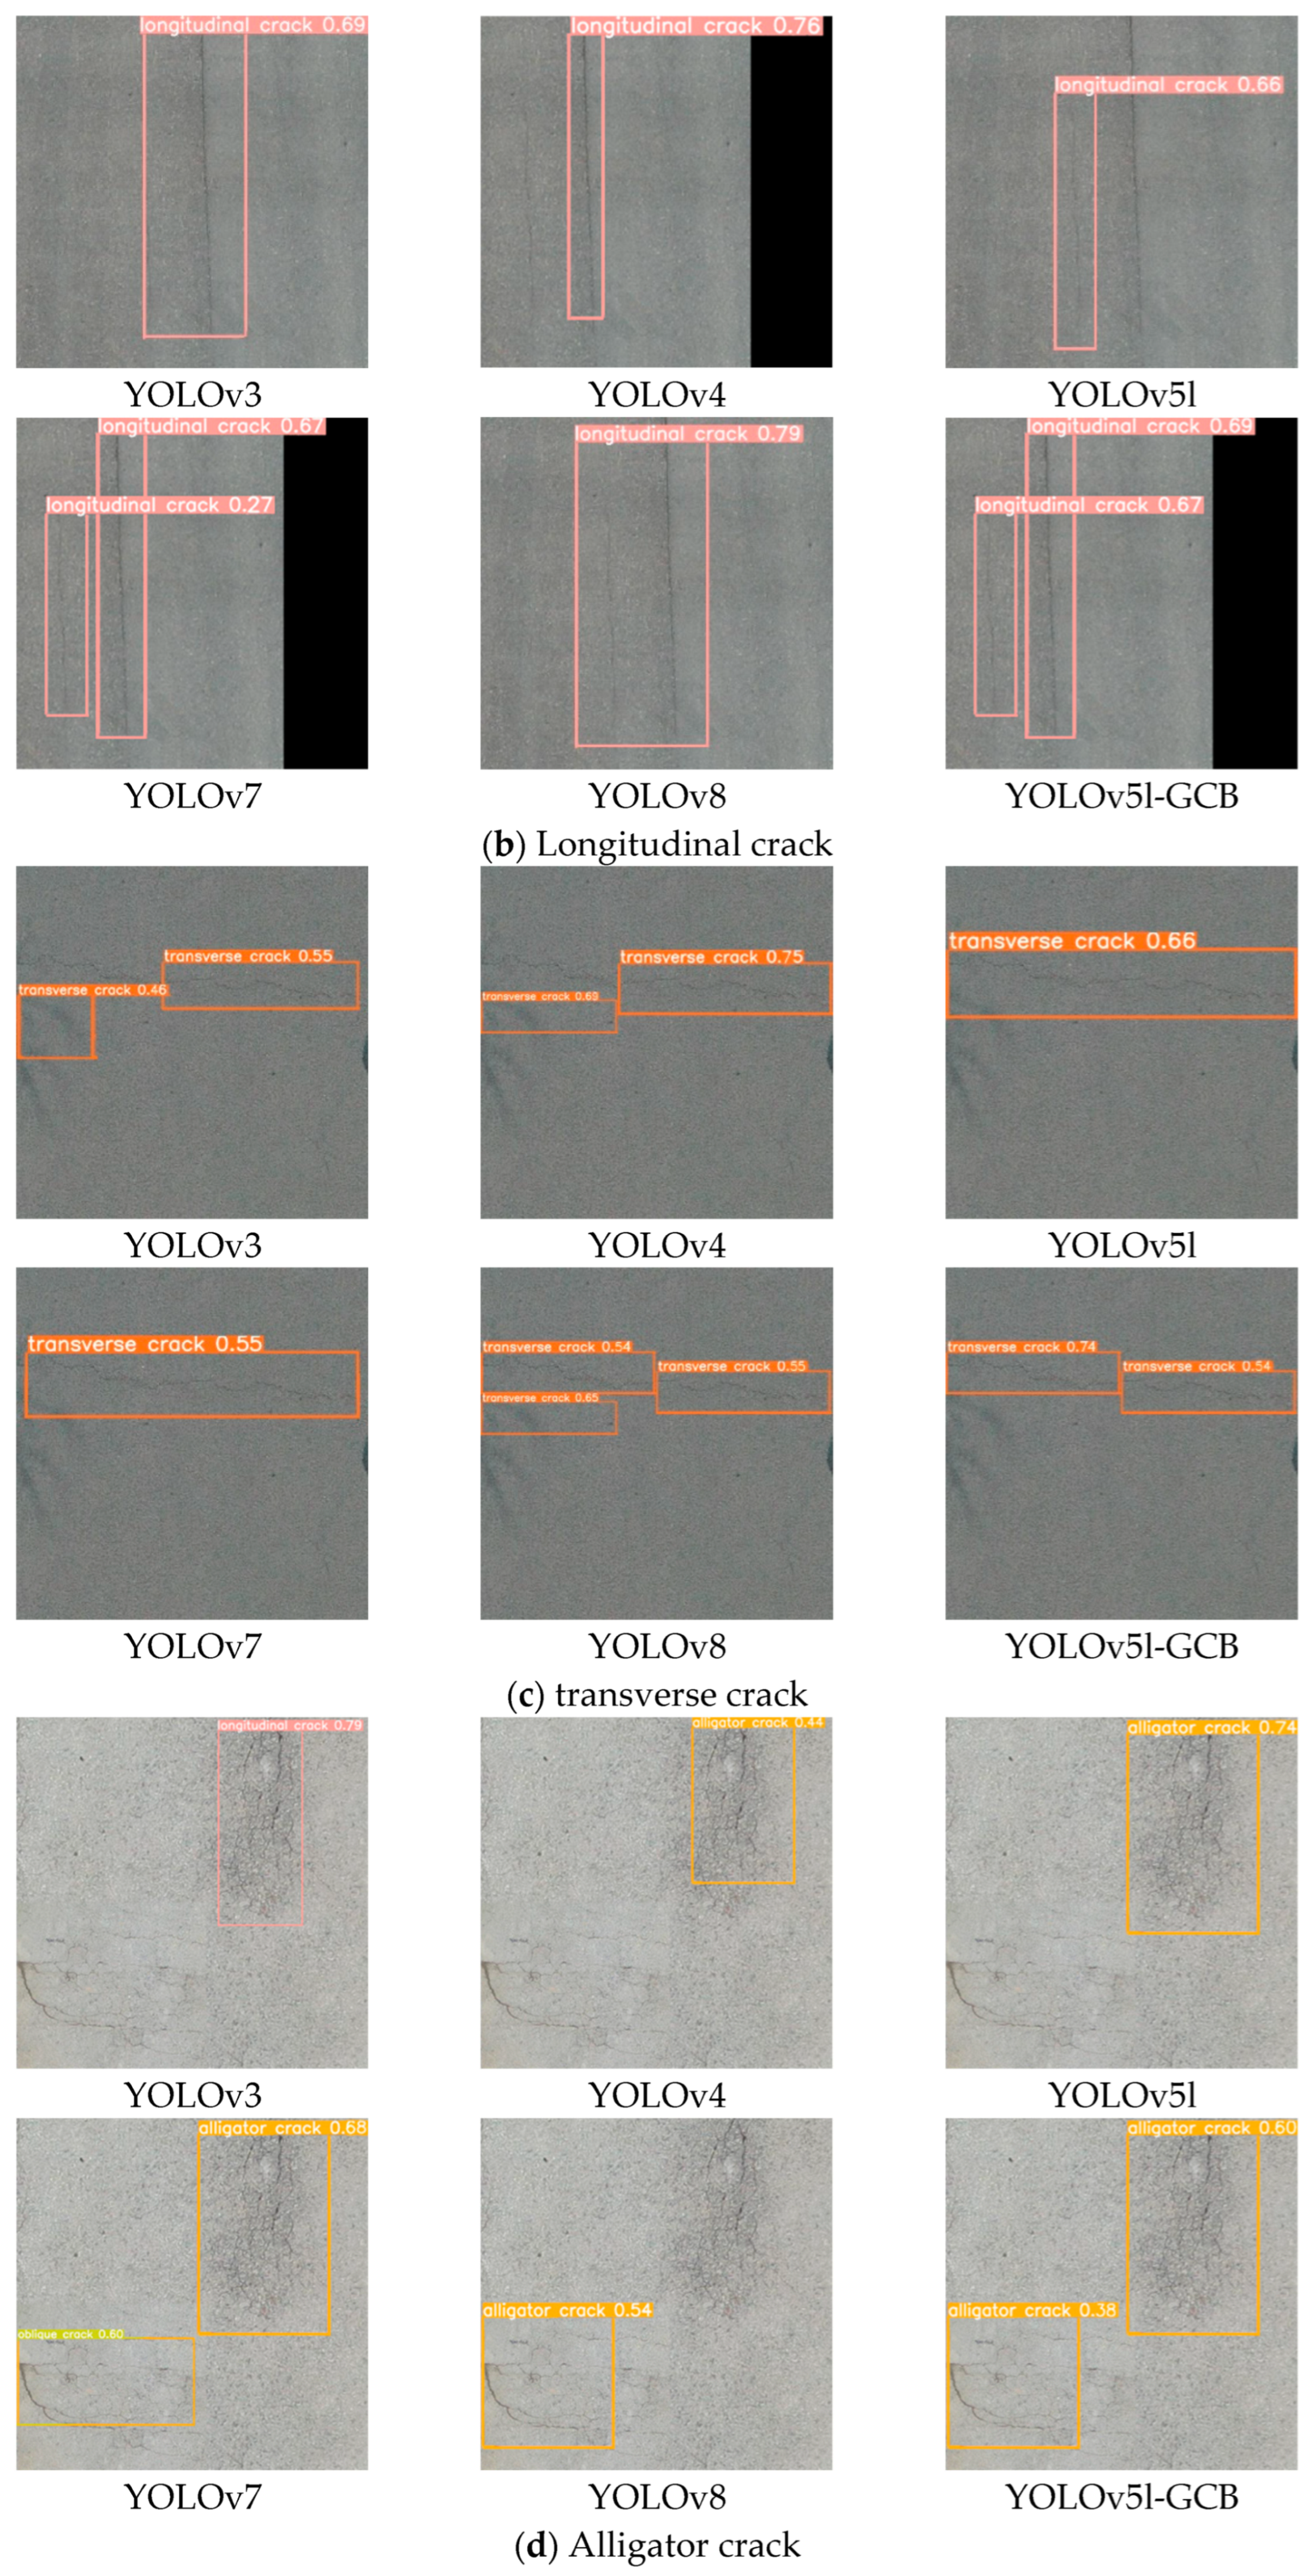
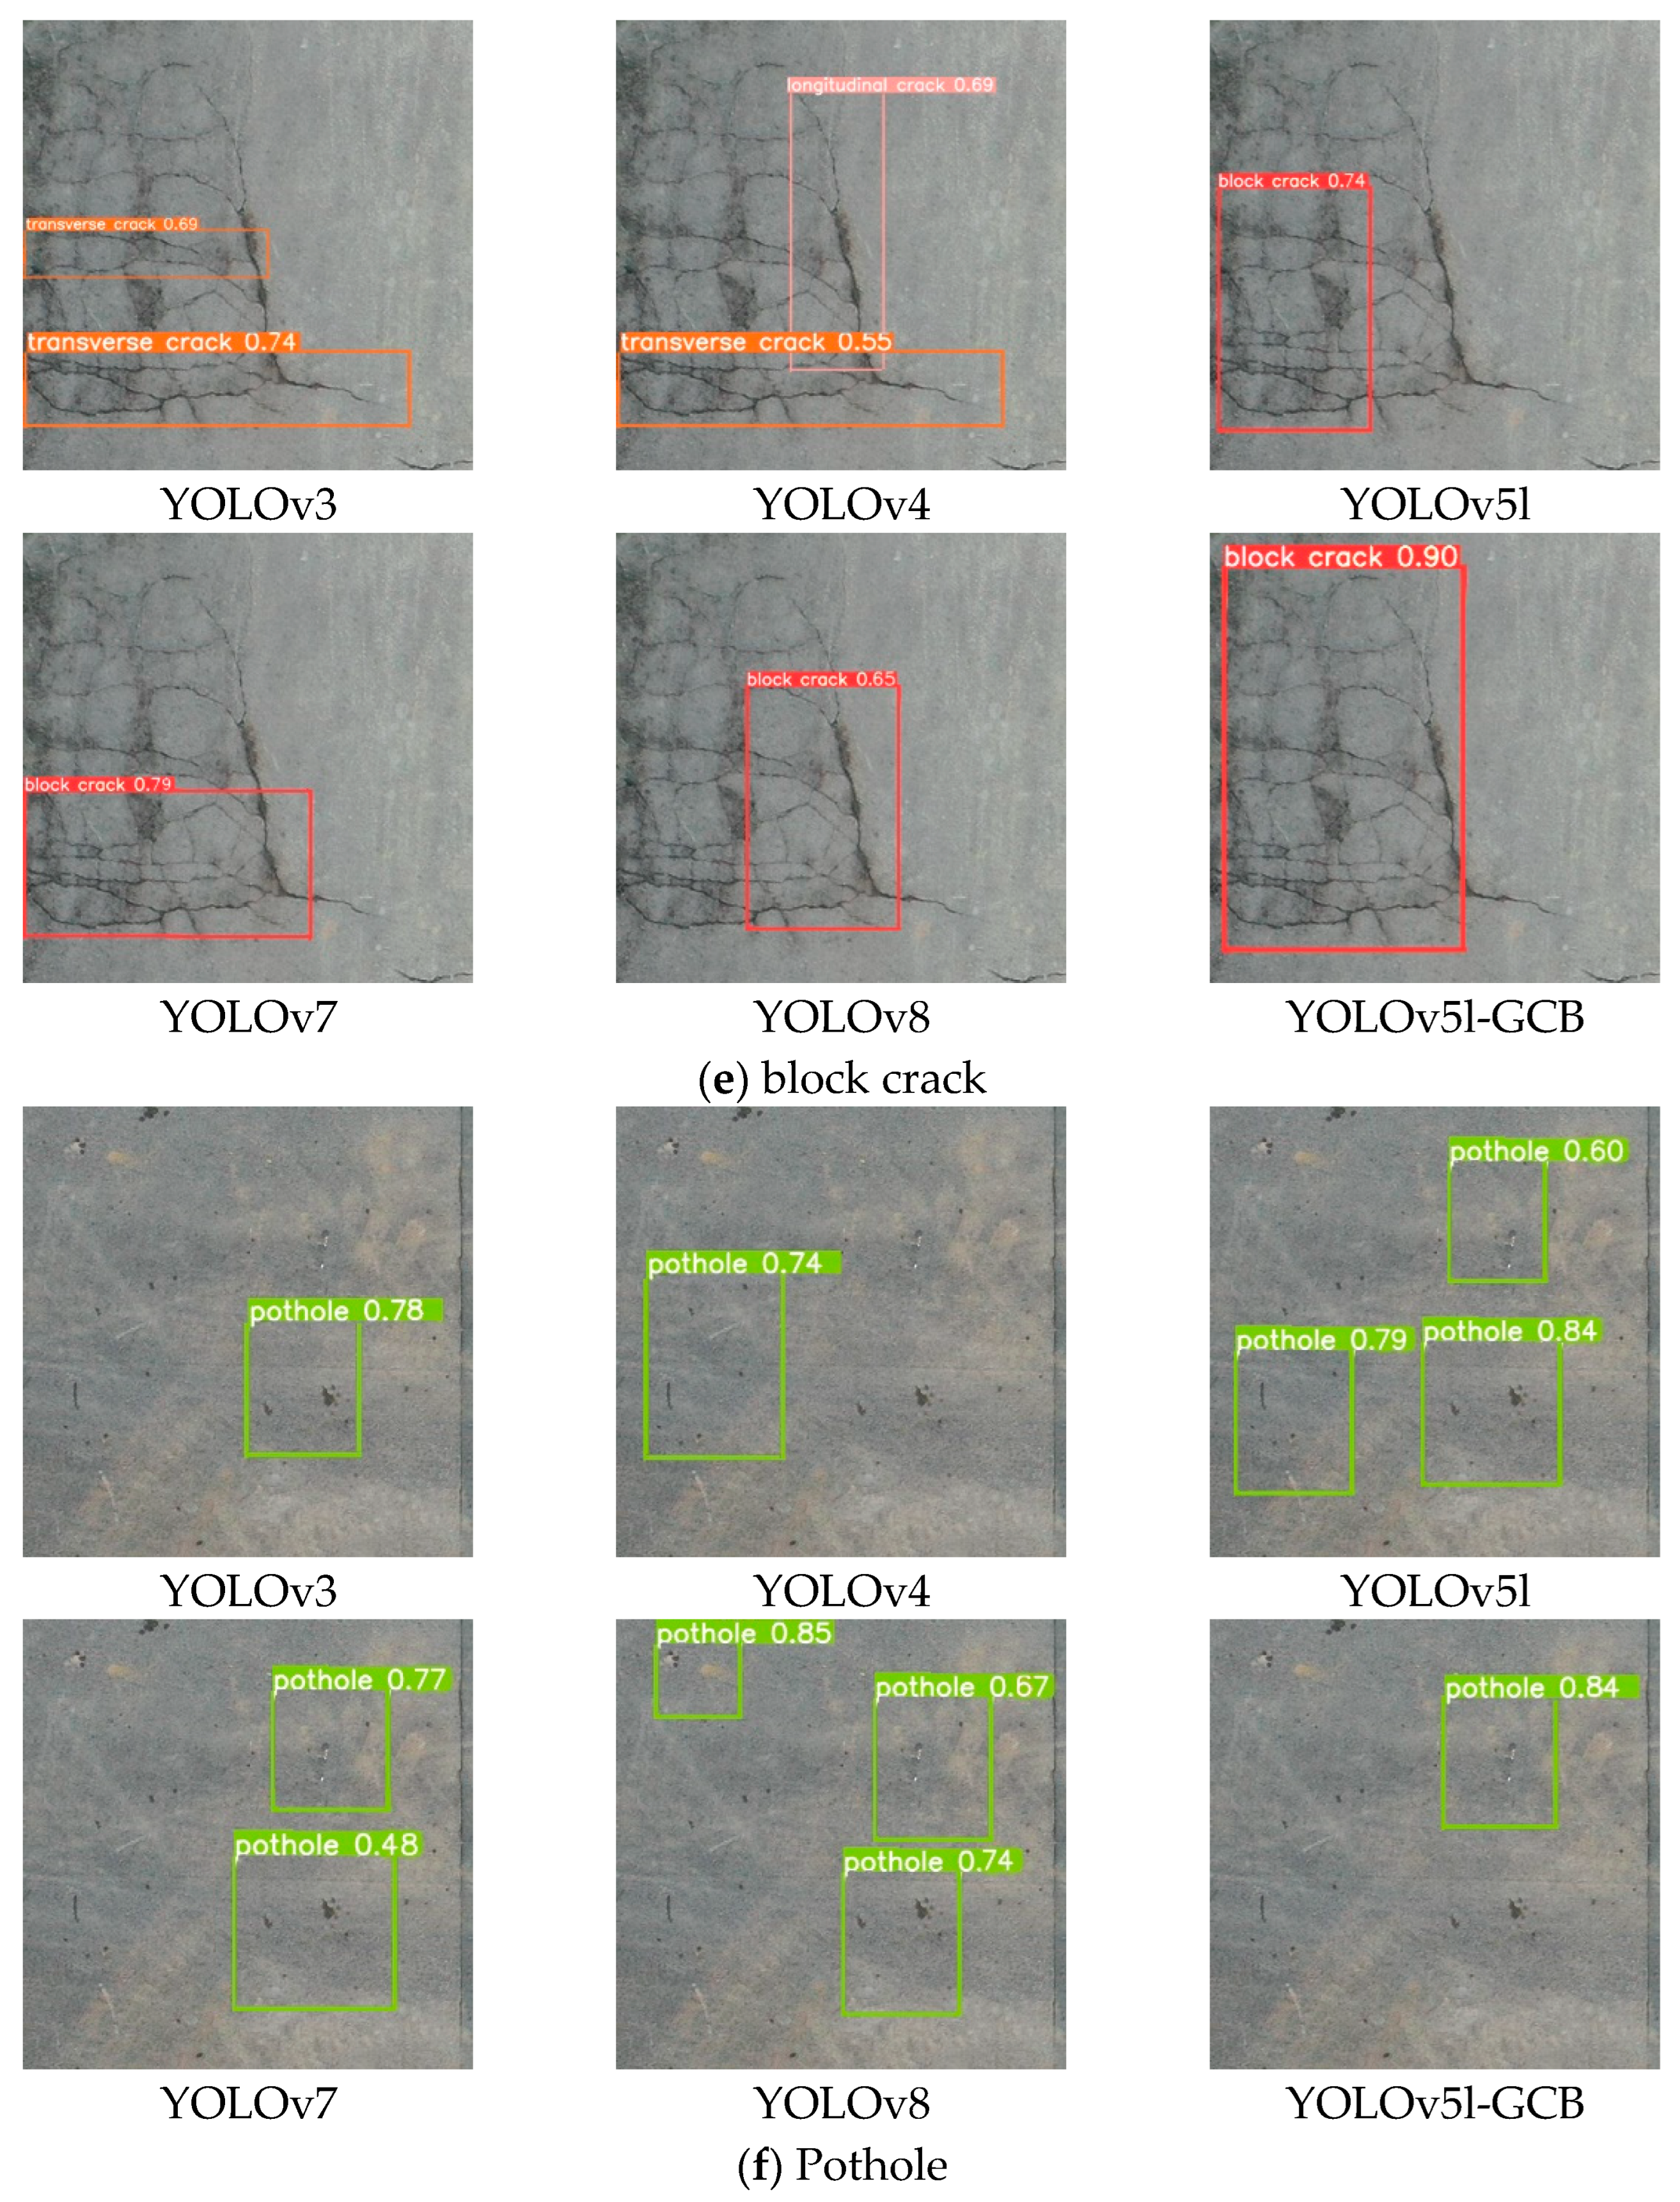
3.5. Comparison Results of Different Model Detection
4. Conclusions
- (1)
- A wind turbine tower surface crack detection model, YOLOv5l-GCB, is proposed, which simplifies the model’s complexity and enhances the inference speed by introducing GhostNetV2 into the backbone of YOLOv5l to realize lightweighting of the backbone, includes the CBAM to enhance the model’s attention to the target region, and introduces the BiFPN to improve the detection accuracy of the model under complex scenarios, with ablation experiments conducted to confirm the viability of the above improvement measures.
- (2)
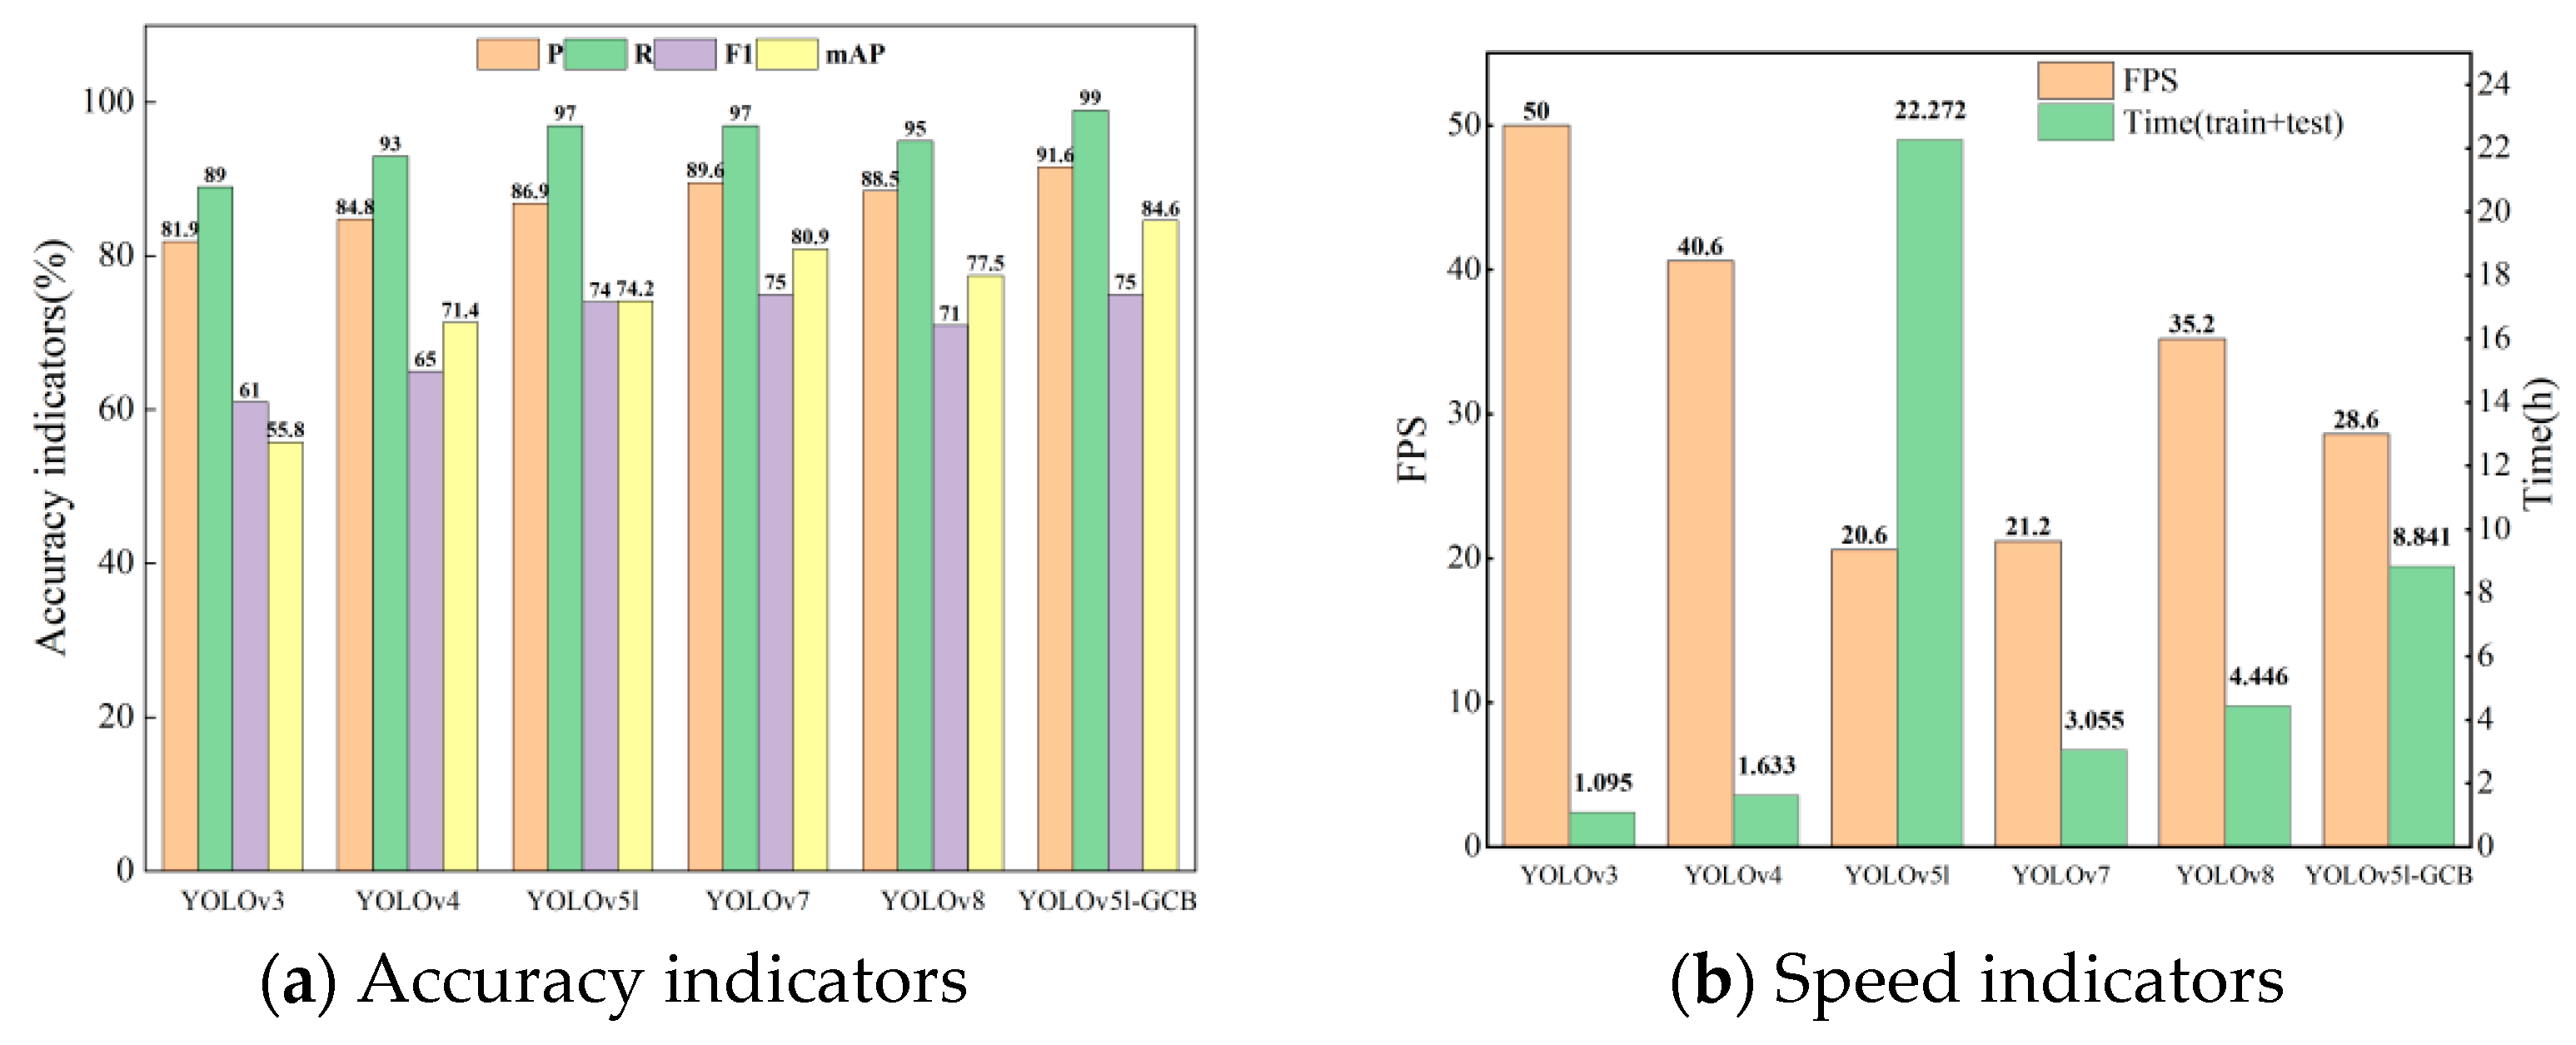
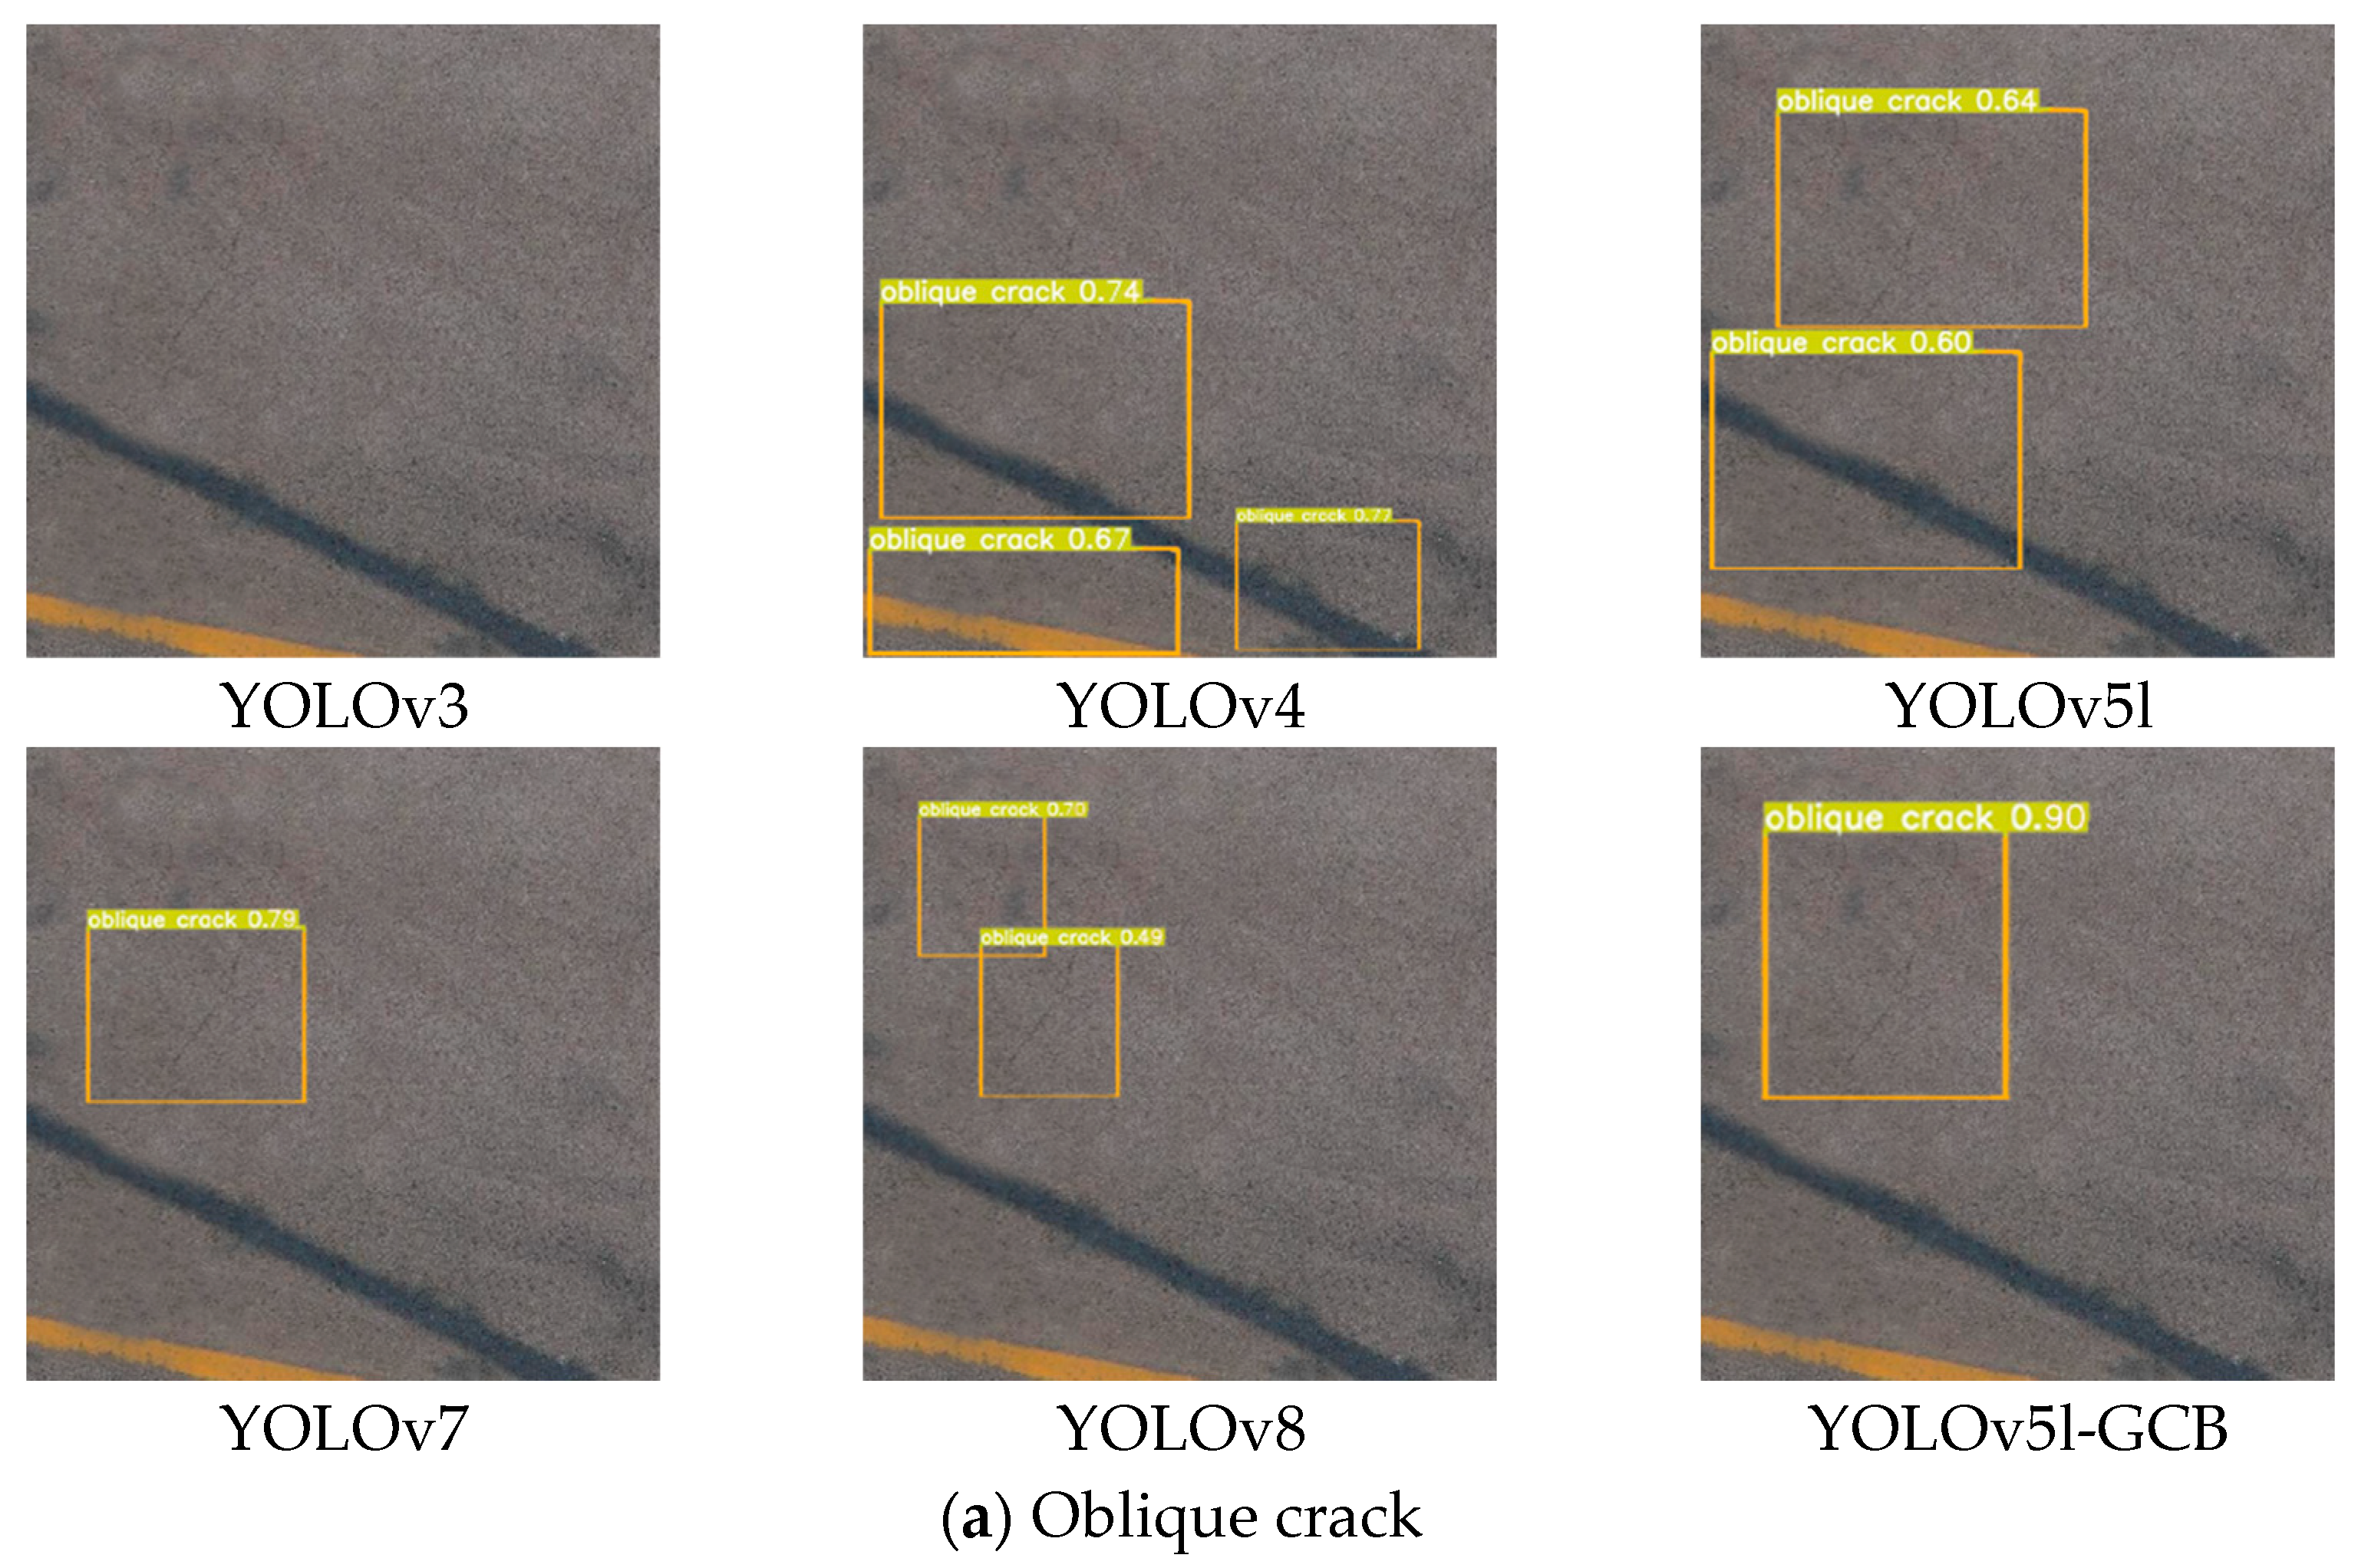
- The values of YOLOv5l-GCB precision, recall, F1 score, and mean average precision reached 91.6%, 99.0%, 75.0%, and 84.6%, which improved by 4.7%, 2%, 1%, and 10.4% compared to YOLOv5l. The detection speed is improved to 28 sheets per second, and the training and testing time is saved by 60%; it has a certain superiority compared to the other commonly used lightweight detection models, such as YOLOv3, YOLOv4, YOLOv5l, YOLOv7, and YOLOv8.
- (3)
- YOLOv5l-GCB provides a new way of thinking for the precise classification of surface cracks in concrete structures. In the practical application of the project, an unmanned aerial vehicle could be used to detect the surface cracks of wind turbine towers in real time to complete the precise location and classification of cracks, so as to take corresponding reinforcement measures according to the development of the cracks and prevent the problem before it occurs.
- (4)
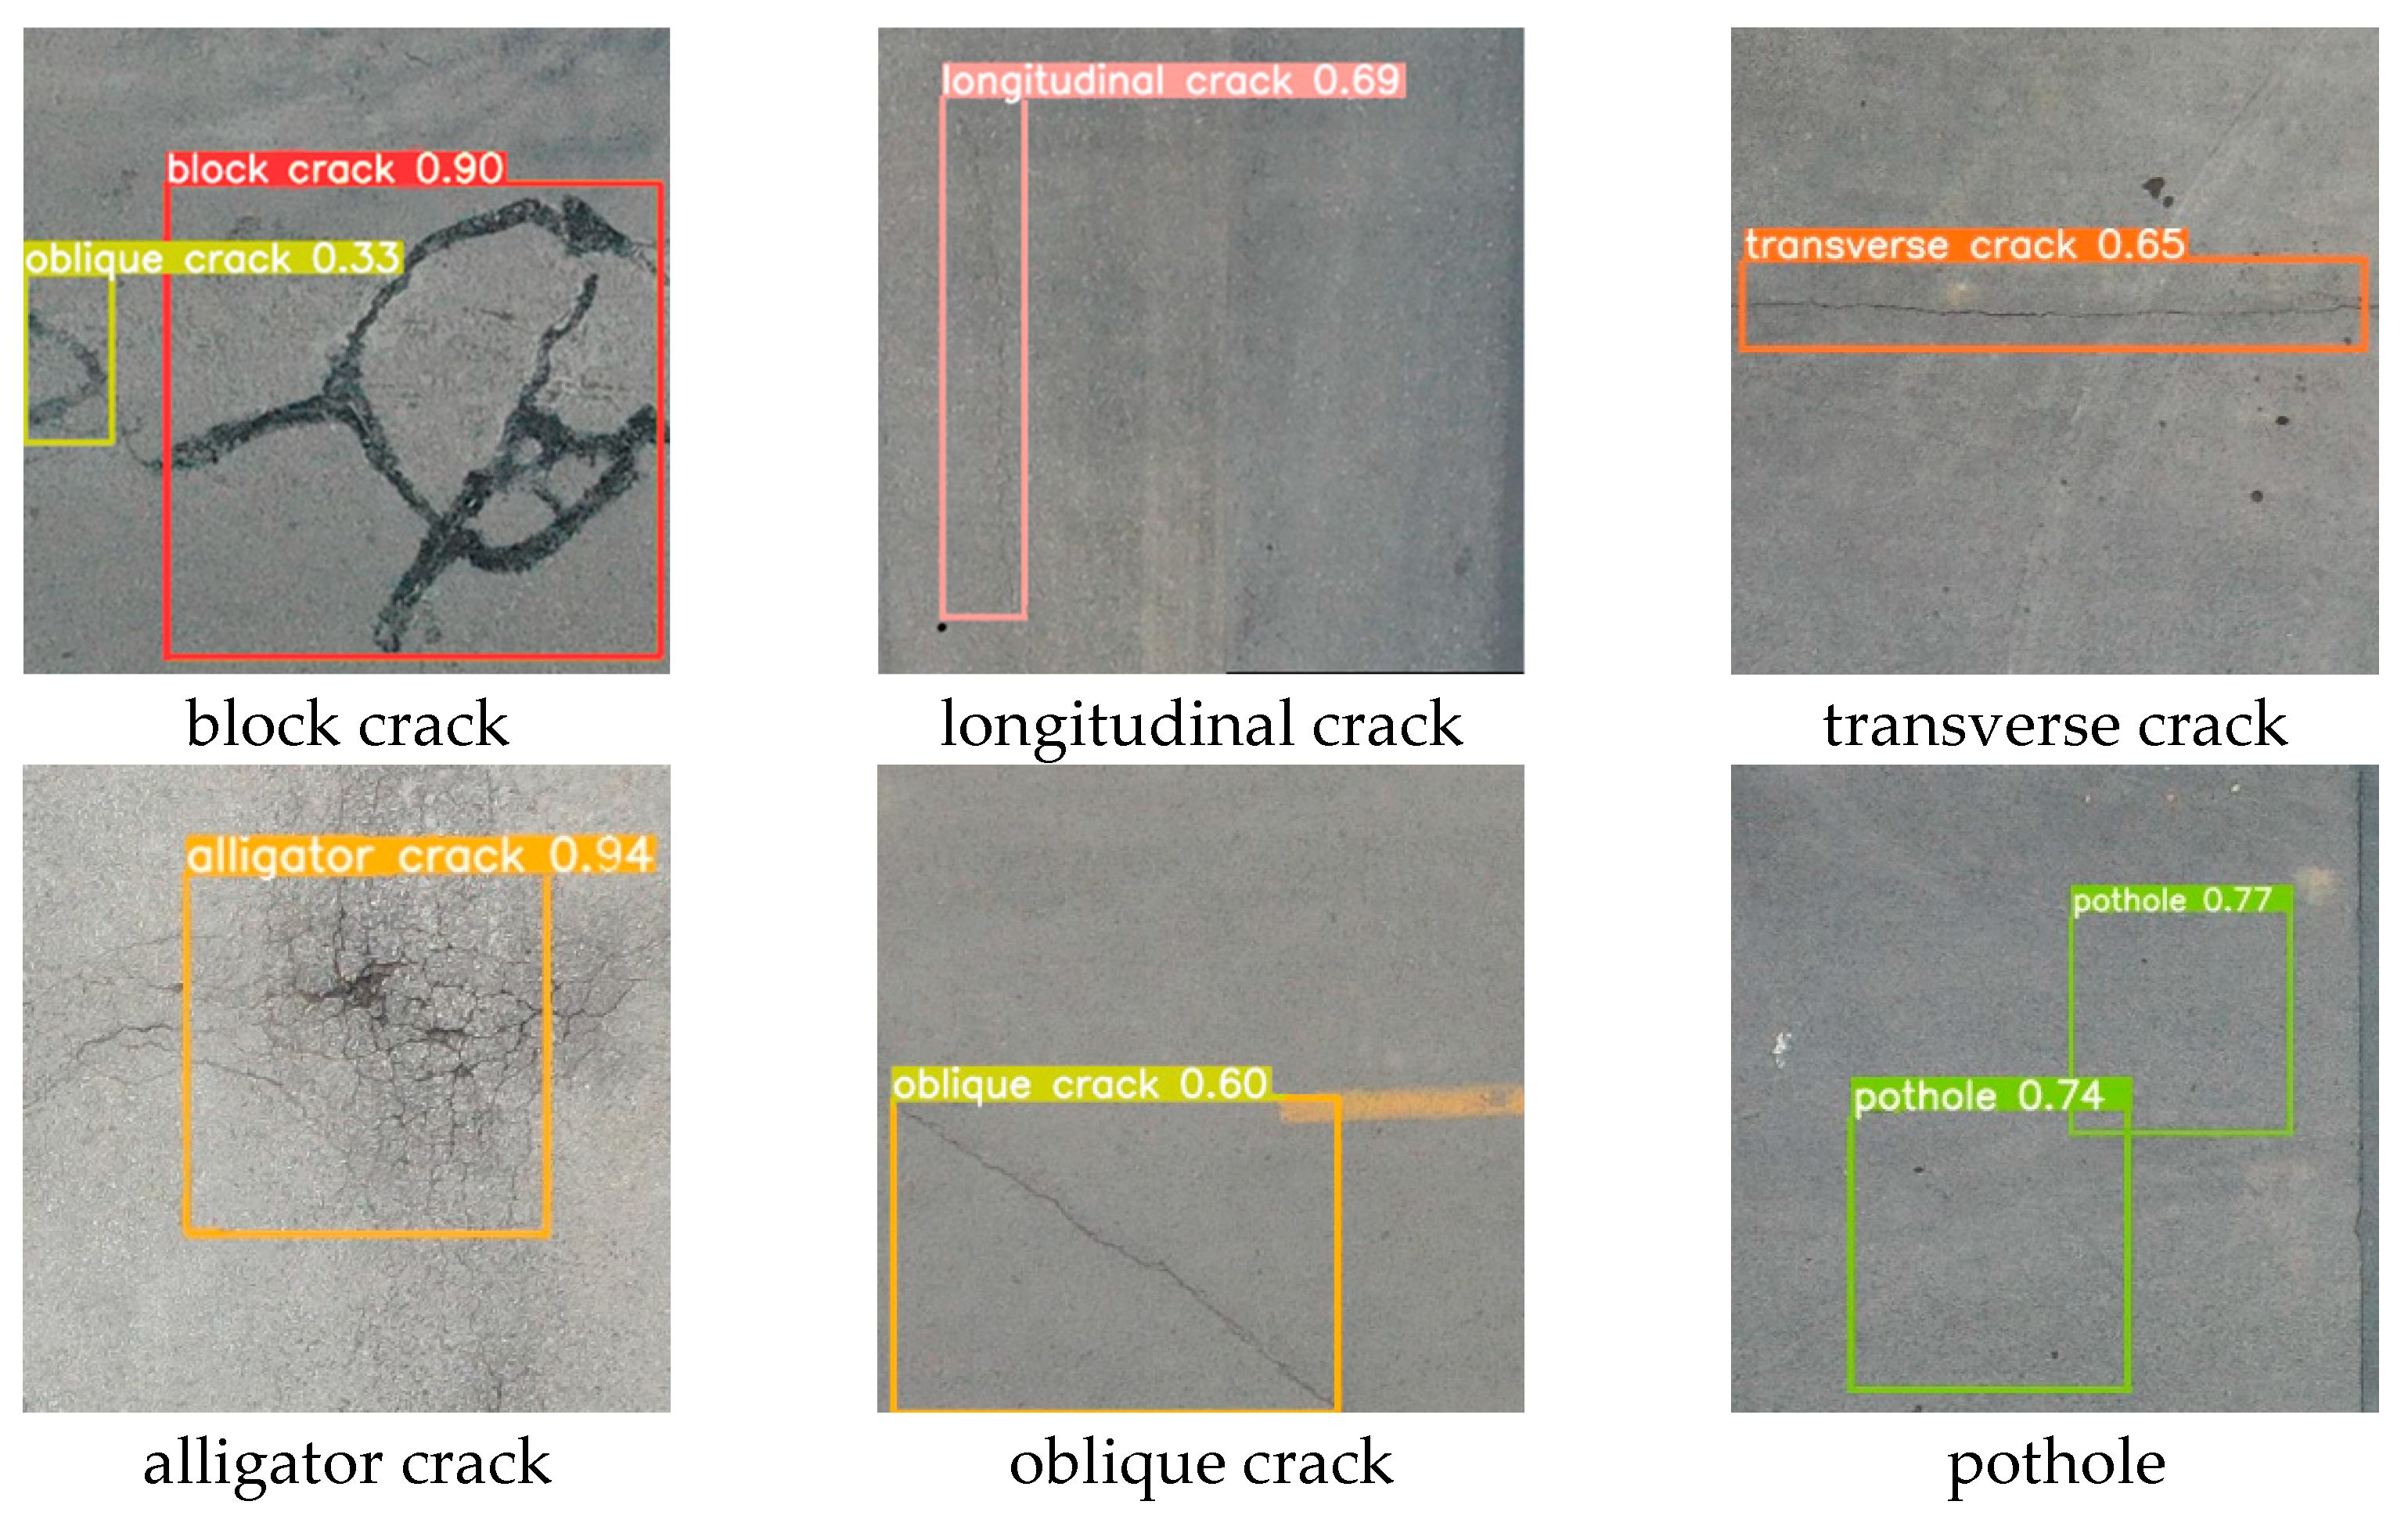
- YOLOv5l-GCB has shown good results in detecting a wide range of cracks (block cracks, longitudinal cracks, transverse cracks, alligator cracks, oblique cracks, and potholes) under normal weather conditions, but the robustness of its detection performance under different weather conditions (e.g., rainy and snowy) has not been verified, which will be a clear direction for the next research.
Author Contributions
Funding
Data Availability Statement
Conflicts of Interest
References
- Kim, H.; Lee, J.; Ahn, E.; Cho, S.; Shin, M.; Sim, S.-H. Concrete crack identification using a UAV incorporating hybrid image processing. Sensors 2017, 17, 2052. [Google Scholar] [CrossRef] [PubMed]
- Grosse, C.U.; Finck, F. Quantitative evaluation of fracture processes in concrete using signal-based acoustic emission techniques. Cem. Concr. Compos. 2006, 28, 330–336. [Google Scholar] [CrossRef]
- Ibrahim, M.E. Nondestructive testing and structural health monitoring of marine composite structures. In Marine Applications of Advanced Fibre-Reinforced Composites; Woodhead Publishing: Sawston, UK, 2016; pp. 147–183. [Google Scholar]
- Özcebe, A.G.; Tiganescu, A.; Ozer, E.; Negulescu, C.; Galiana-Merino, J.J.; Tubaldi, E.; Toma-Danila, D.; Molina, S.; Kharazian, A.; Bozzoni, F.; et al. Raspberry shake-based rapid structural identification of existing buildings subject to earthquake ground motion: The case study of Bucharest. Sensors 2022, 22, 4787. [Google Scholar] [CrossRef]
- Abdelkader, E.M.; Zayed, T.; Faris, N. Synthesized evaluation of reinforced concrete bridge defects, their non-destructive inspection and analysis methods: A systematic review and bibliometric analysis of the past three decades. Buildings 2023, 13, 800. [Google Scholar] [CrossRef]
- Zhao, M.; Nie, Z.; Wang, K.; Liu, P.; Zhang, X. Nonlinear ultrasonic test of concrete cubes with induced crack. Ultrasonics 2019, 97, 1–10. [Google Scholar] [CrossRef]
- Watanabe, T.; Trang, H.T.H.; Harada, K.; Hashimoto, C. Evaluation of corrosion-induced crack and rebar corrosion by ultrasonic testing. Constr. Build. Mater. 2014, 67, 197–201. [Google Scholar] [CrossRef]
- Wang, D.; Ma, Y.; Kang, M.; Ju, Y.; Zeng, C. Durability of reactive powder concrete containing mineral admixtures in seawater erosion environment. Constr. Build. Mater. 2021, 306, 124863. [Google Scholar] [CrossRef]
- Farhidzadeh, A.; Dehghan-Niri, E.; Salamone, S.; Luna, B.; Whittaker, A. Monitoring crack propagation in reinforced concrete shear walls by acoustic emission. J. Struct. Eng. 2013, 139, 04013010. [Google Scholar] [CrossRef]
- Gupta, P.; Dixit, M. Image-based crack detection approaches: A comprehensive survey. Multimed. Tools Appl. 2022, 81, 40181–40229. [Google Scholar] [CrossRef]
- Golding, V.P.; Gharineiat, Z.; Munawar, H.S.; Ullah, F. Crack detection in concrete structures using deep learning. Sustainability 2022, 14, 8117. [Google Scholar] [CrossRef]
- Lee, J.; Kim, H.-S.; Kim, N.; Ryu, E.-M.; Kang, J.-W. Learning to detect cracks on damaged concrete surfaces using two-branched convolutional neural network. Sensors 2019, 19, 4796. [Google Scholar] [CrossRef] [PubMed]
- Dung, C.V. Autonomous concrete crack detection using deep fully convolutional neural network. Autom. Constr. 2019, 99, 52–58. [Google Scholar] [CrossRef]
- Yang, Y.; Yang, H.; Fan, Z.; Mu, Z. Crack Propagation Law of Reinforced Concrete Beams. Appl. Sci. 2024, 14, 409. [Google Scholar] [CrossRef]
- Sarhadi, A.; Ravanshadnia, M.; Monirabbasi, A.; Ghanbari, M. Using an improved U-Net++ with a T-Max-Avg-Pooling layer as a rapid approach for concrete crack detection. Front. Built Environ. 2024, 10, 1485774. [Google Scholar] [CrossRef]
- Wu, J.; Liu, C. VQ-VAE-2 based unsupervised algorithm for detecting concrete structural apparent cracks. Mater. Today Commun. 2025, 44, 112075. [Google Scholar] [CrossRef]
- Song, F.; Wang, D.; Dai, L.; Yang, X. Concrete bridge crack semantic segmentation method based on improved DeepLabV3+. In Proceedings of the 2024 IEEE 13th Data Driven Control and Learning Systems Conference (DDCLS), Kaifeng, China, 17–19 May 2024; IEEE: Piscataway, NJ, USA; pp. 1293–1298. [Google Scholar]
- Wang, R.; Zhou, X.; Liu, Y.; Liu, D.; Lu, Y.; Su, M. Identification of the surface cracks of concrete based on resnet-18 depth residual network. Appl. Sci. 2024, 14, 3142. [Google Scholar] [CrossRef]
- Gu, H.; Zhu, K.; Strauss, A.; Shi, Y.; Sumarac, D.; Cao, M. Rapid and Accurate Identification of Concrete Surface Cracks via a Lightweight & Efficient YOLOv3 Algorithm. Struct. Durab. Health Monit. SDHM 2024, 18, 363–380. [Google Scholar]
- Yao, G.; Sun, Y.; Wong, M.; Lv, X. A real-time detection method for concrete surface cracks based on improved YOLOv4. Symmetry 2021, 13, 1716. [Google Scholar] [CrossRef]
- Liu, Y.; Zhou, T.; Xu, J.; Hong, Y.; Pu, Q.; Wen, X. Rotating target detection method of concrete bridge crack based on YOLO v5. Appl. Sci. 2023, 13, 11118. [Google Scholar] [CrossRef]
- Ye, G.; Qu, J.; Tao, J.; Dai, W.; Mao, Y.; Jin, Q. Autonomous surface crack identification of concrete structures based on the YOLOv7 algorithm. J. Build. Eng. 2023, 73, 106688. [Google Scholar] [CrossRef]
- Dong, X.; Liu, Y.; Dai, J. Concrete Surface Crack Detection Algorithm Based on Improved YOLOv8. Sensors 2024, 24, 5252. [Google Scholar] [CrossRef] [PubMed]
- Howard, A.G.; Zhu, M.; Chen, B.; Kalenichenko, D.; Wang, W.; Weyand, T.; Andreetto, M.; Adam, H. Mobilenets: Efficient convolutional neural networks for mobile vision applications. arXiv 2017, arXiv:1704.04861. [Google Scholar]
- Zhang, X.; Zhou, X.; Lin, M.; Sun, J. Shufflenet: An extremely efficient convolutional neural network for mobile devices. In Proceedings of the IEEE Conference on Computer Vision and Pattern Recognition, Nashville, TN, USA, 11–15 June 2018; pp. 6848–6856. [Google Scholar]
- Han, K.; Wang, Y.; Tian, Q.; Guo, J.; Xu, C.; Xu, C. Ghostnet: More features from cheap operations. In Proceedings of the IEEE/CVF Conference on Computer Vision and Pattern Recognition, Seattle, WA, USA, 13–19 June 2020; pp. 1580–1589. [Google Scholar]
- Sandler, M.; Howard, A.; Zhu, M.; Zhmoginov, A.; Chen, L. Mobilenetv2: Inverted residuals and linear bottlenecks. In Proceedings of the IEEE Conference on Computer Vision and Pattern Recognition, Salt Lake, UT, USA, 18–22 June 2018; pp. 4510–4520. [Google Scholar]
- Lei, Y.; Yao, Z.; He, D. Automatic detection and counting of urediniospores of Puccinia striiformis f. sp. tritici using spore traps and image processing. Sci. Rep. 2018, 8, 13647. [Google Scholar] [CrossRef] [PubMed]
- Zhao, Y.; Liu, S.; Hu, Z.; Bai, Y.; Shen, C.; Shi, X. Separate degree based Otsu and signed similarity driven level set for segmenting and counting anthrax spores. Comput. Electron. Agric. 2020, 169, 105230. [Google Scholar] [CrossRef]
- Ma, X.; Li, Y.; Yang, Z.; Li, S.; Li, Y. Lightweight network for millimeter-level concrete crack detection with dense feature connection and dual attention. J. Build. Eng. 2024, 94, 109821. [Google Scholar] [CrossRef]
- Woo, S.; Park, J.; Lee, J.Y.; Kweon, I.S. Cbam: Convolutional block attention module. In Proceedings of the European Conference on Computer Vision (ECCV), Munich, Germany, 8–14 September 2018; pp. 3–19. [Google Scholar]
- Lin, T.Y.; Dollár, P.; Girshick, R.; He, K.; Hariharan, B.; Belongie, S. Feature pyramid networks for object detection. In Proceedings of the IEEE Conference on Computer Vision and Pattern Recognition, Honolulu, HI, USA, 21–26 July 2017; pp. 2117–2125. [Google Scholar]
- Everingham, M.; Van Gool, L.; Williams, C.K.; Winn, J.; Zisserman, A. The Pascal Visual Object Classes (VOC) Challenge. Int. J. Comput. Vis. 2010, 88, 303–338. [Google Scholar] [CrossRef]
- Sohaib, M.; Jamil, S.; Kim, J.M. An ensemble approach for robust automated crack detection and segmentation in concrete structures. Sensors 2024, 24, 257. [Google Scholar] [CrossRef]
- Yu, H.; Yang, S.; Zhu, S. Parallel Restarted SGD with Faster Convergence and Less Communication: Demystifying Why Model Averaging Works for Deep Learning. Proc. AAAI Conf. Artif. Intell. 2019, 33, 5693–5700. [Google Scholar] [CrossRef]

| Model | Params/×106 | FLOPS/×109 | Precision P/% |
|---|---|---|---|
| YOLOv5n | 2.67 | 7.7 | 80.6 |
| YOLOv5s | 7.25 | 22.4 | 86.3 |
| YOLOv5m | 18.60 | 64.2 | 88.2 |
| YOLOv5l | 44.10 | 107.5 | 91.4 |
| YOLOv5x | 92.20 | 189.1 | 91.6 |
| Configuration | Specific Parameters |
|---|---|
| CPU | Intel (R) Core (TM) i7-9750H@2.60GHz (Intel, Santa Clara, CA, USA) |
| GPU | NVIDIA GeForce RTX2060 (NVIDIA, Santa Clara, CA, USA) |
| Computer Memory | 16G |
| Operating System | Windows 10 (64-bit) |
| Software Framework | Python 3.7 + Pytorch 1.8.2 |
| GPU Acceleration Library | CUDA12.6 + cuDNN8.0.5 |
| Hyper-Parameters | Value |
|---|---|
| Input image size | 640 × 640 pixels |
| Batch-size | 4 |
| Workers | 4 |
| Epoch | 300 |
| Momentum factor | 0.937 |
| Initial learning rate | 0.01 |
| Weight decay coefficient | 0.0005 |
| Learning rate adjustment strategies | cosine annealing |
| Optimization algorithm | stochastic gradient descent (SGD) [35] |
| Evaluation Indicators | Significance |
|---|---|
| Precision (P) | P is the proportion of correct predictions that are positive to all predictions that are positive, and it represents the degree of prediction accuracy in positive sample results. |
| Recall (R) | R is the true positive rate to all actual positive cases. |
| F1-score (F1) | The F1-score considers both P and R in a combined manner. |
| Mean average precision (mAP) | The curve in which P is plotted as the vertical coordinate and R on the horizontal axis is referred to as the P-R curve. The region beneath the curve denotes the average precision (AP) for the category, and the ratio of AP to crack type is the mean average precision (mAP). |
| Frames per second (FPS) | The quantity of images that the model processes per second is denoted by the term FPS; a higher FPS indicates a more rapid detection capability of the model. |
| GhostNetV2 | CBAM | BiFPN | P/% | R/% | mAP/% | FPS |
|---|---|---|---|---|---|---|
| × | × | × | 86.9 | 97.0 | 74.2 | 20.6 |
| √ | × | × | 87.2 | 97.0 | 79.7 | 26.2 |
| × | √ | × | 87.5 | 98.0 | 77.6 | 28.0 |
| × | × | √ | 87.8 | 98.0 | 77.2 | 27.8 |
| √ | √ | √ | 91.6 | 99.0 | 84.6 | 28.6 |
Disclaimer/Publisher’s Note: The statements, opinions and data contained in all publications are solely those of the individual author(s) and contributor(s) and not of MDPI and/or the editor(s). MDPI and/or the editor(s) disclaim responsibility for any injury to people or property resulting from any ideas, methods, instructions or products referred to in the content. |
© 2025 by the authors. Licensee MDPI, Basel, Switzerland. This article is an open access article distributed under the terms and conditions of the Creative Commons Attribution (CC BY) license (https://creativecommons.org/licenses/by/4.0/).
Share and Cite
Hu, F.; Leng, X.; Ma, C.; Sun, G.; Wang, D.; Liu, D.; Zhang, Z. Wind Turbine Surface Crack Detection Based on YOLOv5l-GCB. Energies 2025, 18, 2775. https://doi.org/10.3390/en18112775
Hu F, Leng X, Ma C, Sun G, Wang D, Liu D, Zhang Z. Wind Turbine Surface Crack Detection Based on YOLOv5l-GCB. Energies. 2025; 18(11):2775. https://doi.org/10.3390/en18112775
Chicago/Turabian StyleHu, Feng, Xiaohui Leng, Chao Ma, Guoming Sun, Dehong Wang, Duanxuan Liu, and Zixuan Zhang. 2025. "Wind Turbine Surface Crack Detection Based on YOLOv5l-GCB" Energies 18, no. 11: 2775. https://doi.org/10.3390/en18112775
APA StyleHu, F., Leng, X., Ma, C., Sun, G., Wang, D., Liu, D., & Zhang, Z. (2025). Wind Turbine Surface Crack Detection Based on YOLOv5l-GCB. Energies, 18(11), 2775. https://doi.org/10.3390/en18112775