1. Introduction
In order to achieve the Paris-aligned climate goals and reduce greenhouse gas emissions, a transformation in the mobility and transport sector is necessary. Already, it can be observed that E-mobility gains importance [
1]. One main challenge associated with E-mobility is the charging infrastructure. While users expect charging to be convenient, reliable, and fast, the charge point operator (CPO) focuses on the return-on-investment (ROI), and the grid operator needs to ensure the stability of the grid.
The increasing adoption of electric vehicles (EVs) has also elevated the role of public charging infrastructure. According to the International Energy Agency [
2], public charging solutions are expected to play a key role in the global EV ecosystem, complementing home and fleet charging options by addressing the needs of EV users in urban and high-traffic environments. Recently, many solutions have been proposed that take into account the different stakeholders. Smart charging and bi-directional charging strategies are becoming increasingly important in fleet management and home use cases. In public and semi-public environments, there is a growing interest in concepts that utilise battery storage to reduce the need for grid reinforcement while still providing high charging power and, consequently, fast charging. Nevertheless, the issue persists: although a stationary battery-supported charging solution offers flexibility to the grid, it does not provide the same flexibility to the users. This is because, in the event that all the charging ports are occupied, the user will be unable to charge or will have to return at a later time.
The deployment of mobile charging robots, such as the GINI robot presented by Wessel et al. [
3], offers several key advantages over stationary solutions. Mobile robots provide flexibility in charging location, potentially increasing user satisfaction by reducing wait times and better utilising charging infrastructure. They can also help distribute the load more evenly by charging their own batteries during off-peak times and using that stored energy during peak times, reducing strain on the grid. However, mobile charging robots come with higher initial investment and operational costs compared to stationary solutions. While they can increase revenue by serving more vehicles, the higher costs need to be considered to determine their overall financial viability. Detailed simulations are necessary to evaluate the potential of these charging solutions, including modelling of the charging solution, grid connection, power flows, user behaviour, and smart charging strategies.
The following section presents an overview of publications that incorporate modelling of charging points. In many publications, simulation models have been setup, either to evaluate potentials of a specific application, verify a control strategy, find an optimal design and sizing or train an RL agent. Sandhu et al. [
4] describes a model for evaluating the potential of smart charging and Vehicle-to-Grid (V2G) charging strategies for an EV fleet. Self-consumption increase is considered as well as market integration of the EVs by participating into balancing services such as frequency containment reserve (FCR) and automatic frequency restoration reserve (aFRR).
Dorokhova et al. [
5] model a microgrid containing a building, one charging point, an EV and the grid connection point. Based on this model, different optimisation strategies are compared with regard to how well a target SOC of the EV is reached and the level of self-consumption. The main focus is on reinforcement learning based algorithms, which are compared with rule-based and optimisation-based approaches.
For the application of reinforcement learning, many approaches for EV charging management can be found. Chu et al. [
6] target the fleet management problem in a residential community containing PV and additional energy storage. The phenomenon of range anxiety experienced by electric vehicle (EV) users when charging their vehicles is subjected to a modelling process. Similarly, Fang et al. [
7] model a microgrid with renewable energies. The objective is to optimise the energy cost. For that, access of the microgrids to an auction-based market is modelled. The problem is solved by a multi-agent reinforcement learning (MARL) approach. Jiang et al. [
8] looks at a single parking lot, with EV arrival times derived from historical data. A combination of a data-based learning and an RL approach is used to smoothen the load at the parking lot. Lee et al. [
9] use a non-parametric density function to model the usage pattern of a charger at a specific location. The model is used for a deep reinforcement learning approach targeting real-time charging and discharging control. The authors conclude that the combination of deep reinforcement learning with data-driven approaches to reflect the characteristics of a charging location are very effective.
While the aforementioned publications build a separate model for their use case, Liu et al. [
10] use the SUMO framework [
11] and combine it with OpenAI Gym [
12]. The paper focuses on an electric vehicle fleet management problem and leverages multi-agent reinforcement learning to solve it.
Examining algorithms for charging management or evaluating the potential of new charging paradigms, such as V2G, is one use case for a charging point model. Another present research field is evaluating different charging point configurations, considering Battery Energy Storage System (BESS). BESS specifically refers to a stationary battery storage in this context.
Rafi and Bauman [
13] provide a comprehensive overview of DC fast charging in conjunction with BESS as well as other energy storage options. They present various topologies and elucidate their respective advantages. Bartolucci et al. [
14] and Datta et al. [
15] analyze the integration of PV and BESS into electric vehicle charging stations. While Bartolucci et al. [
14] target the coupling of the design and sizing, Datta et al. [
15] rather focus on the control aspect. Similarly, Engelhardt et al. [
16] develops an EMS algorithm for the coordination between BESS, PV, and EVSEs and validate the efficiency with the Monte Carlo simulation in different scenarios. Another publication focuses on the sizing of battery storage for a charging hub, so a larger battery supported high power charging points [
17].
BESS are attractive, because they offer additional flexibility with regard to the time of production and consumption of electricity at a charging point. This idea is taken even further with mobile charging stations that contain BESS. Afshar et al. [
18] classifies mobile charging stations into three categories: truck mobile charging stations, portable charging, and vehicle-to-vehicle power transfer. The truck mobile charging stations (TMCS) are further classified into four sub-categories. One of them are the battery-integrated TMCS, which are equipped with an energy storage system and can visit EVs at a requested location. Wang et al. [
19] describe a concept of Single-Port and Multi-Port Vans, that would fall into this category. In contrast to that, the work presented by Zhang et al. [
20] would fall in the battery-less TMCS, where only the charging stations are transported as mobile units.
Afshar et al. [
21] set up an optimisation model to determine the optimal mixture of charging solutions. Stationary fast charging stations and mobile charging stations are considered for this purpose. Other publications focus on optimal routing for mobile charging stations [
22] or the optimal placement [
23,
24].
Afshar et al. [
18] further presents robot-like TMCS, which are useful at places with high demand and short distances between parking lots. These mobile charging robots have gained interest in the recent years and concepts as well as prototype products have been presented for example by Kong [
25], Walzel et al. [
26], Ulrich [
27] and Volkswagen Group [
28]. Wessel et al. [
3] present a prototype of a mobile charging robot, named GINI. Battery capacities and power limits are provided. These will be taken as a reference for the studies performed in this work.
The advent of a more sophisticated and comprehensive array of charging solutions has rendered open frameworks that facilitate the selection, sizing, and testing of operating strategies a necessity. While many models exist for the power and energy system [
29], the focus is often more on a bigger scale. Open-source models have been presented that focus on modelling of electricity markets such as the ones presented by Bussar et al. [
30], Schimeczek et al. [
31] and Hirth et al. [
32]. Others are supporting planning of the transmission grid, especially with regard to renewable energy sources [
33,
34,
35]. Moreover, there are models that take into account the interrelationships between different energy sectors [
36,
37]. Although these models provide valuable contributions, with regard to modelling, simulating, and developing control strategies, for charging point level energy systems, they do not seem suitable.
Recently, advanced open-source models have been developed for modelling charging points. In
Table 1 a comprehensive summary that highlights their specific focus is given. Examining the most recently presented models, Cording and Thakur [
38] present a model for training reinforcement learning strategies for EV fleets, while Orfanoudakis et al. [
39] propose a framework specifically designed for V2G strategies using RL. Additionally, Balogun et al. [
40] address the design and optimisation of electric vehicle charging infrastructure with their EV-EcoSim model. In contrast to existing tools (e.g., EV-EcoSim), our framework uniquely combines spatial modelling of mobile chargers (GINIs), battery storage, and grid constraints in a modular, RL-compatible design. This fills a critical gap in assessing flexible and mobile charging configurations at parking-lot scale.
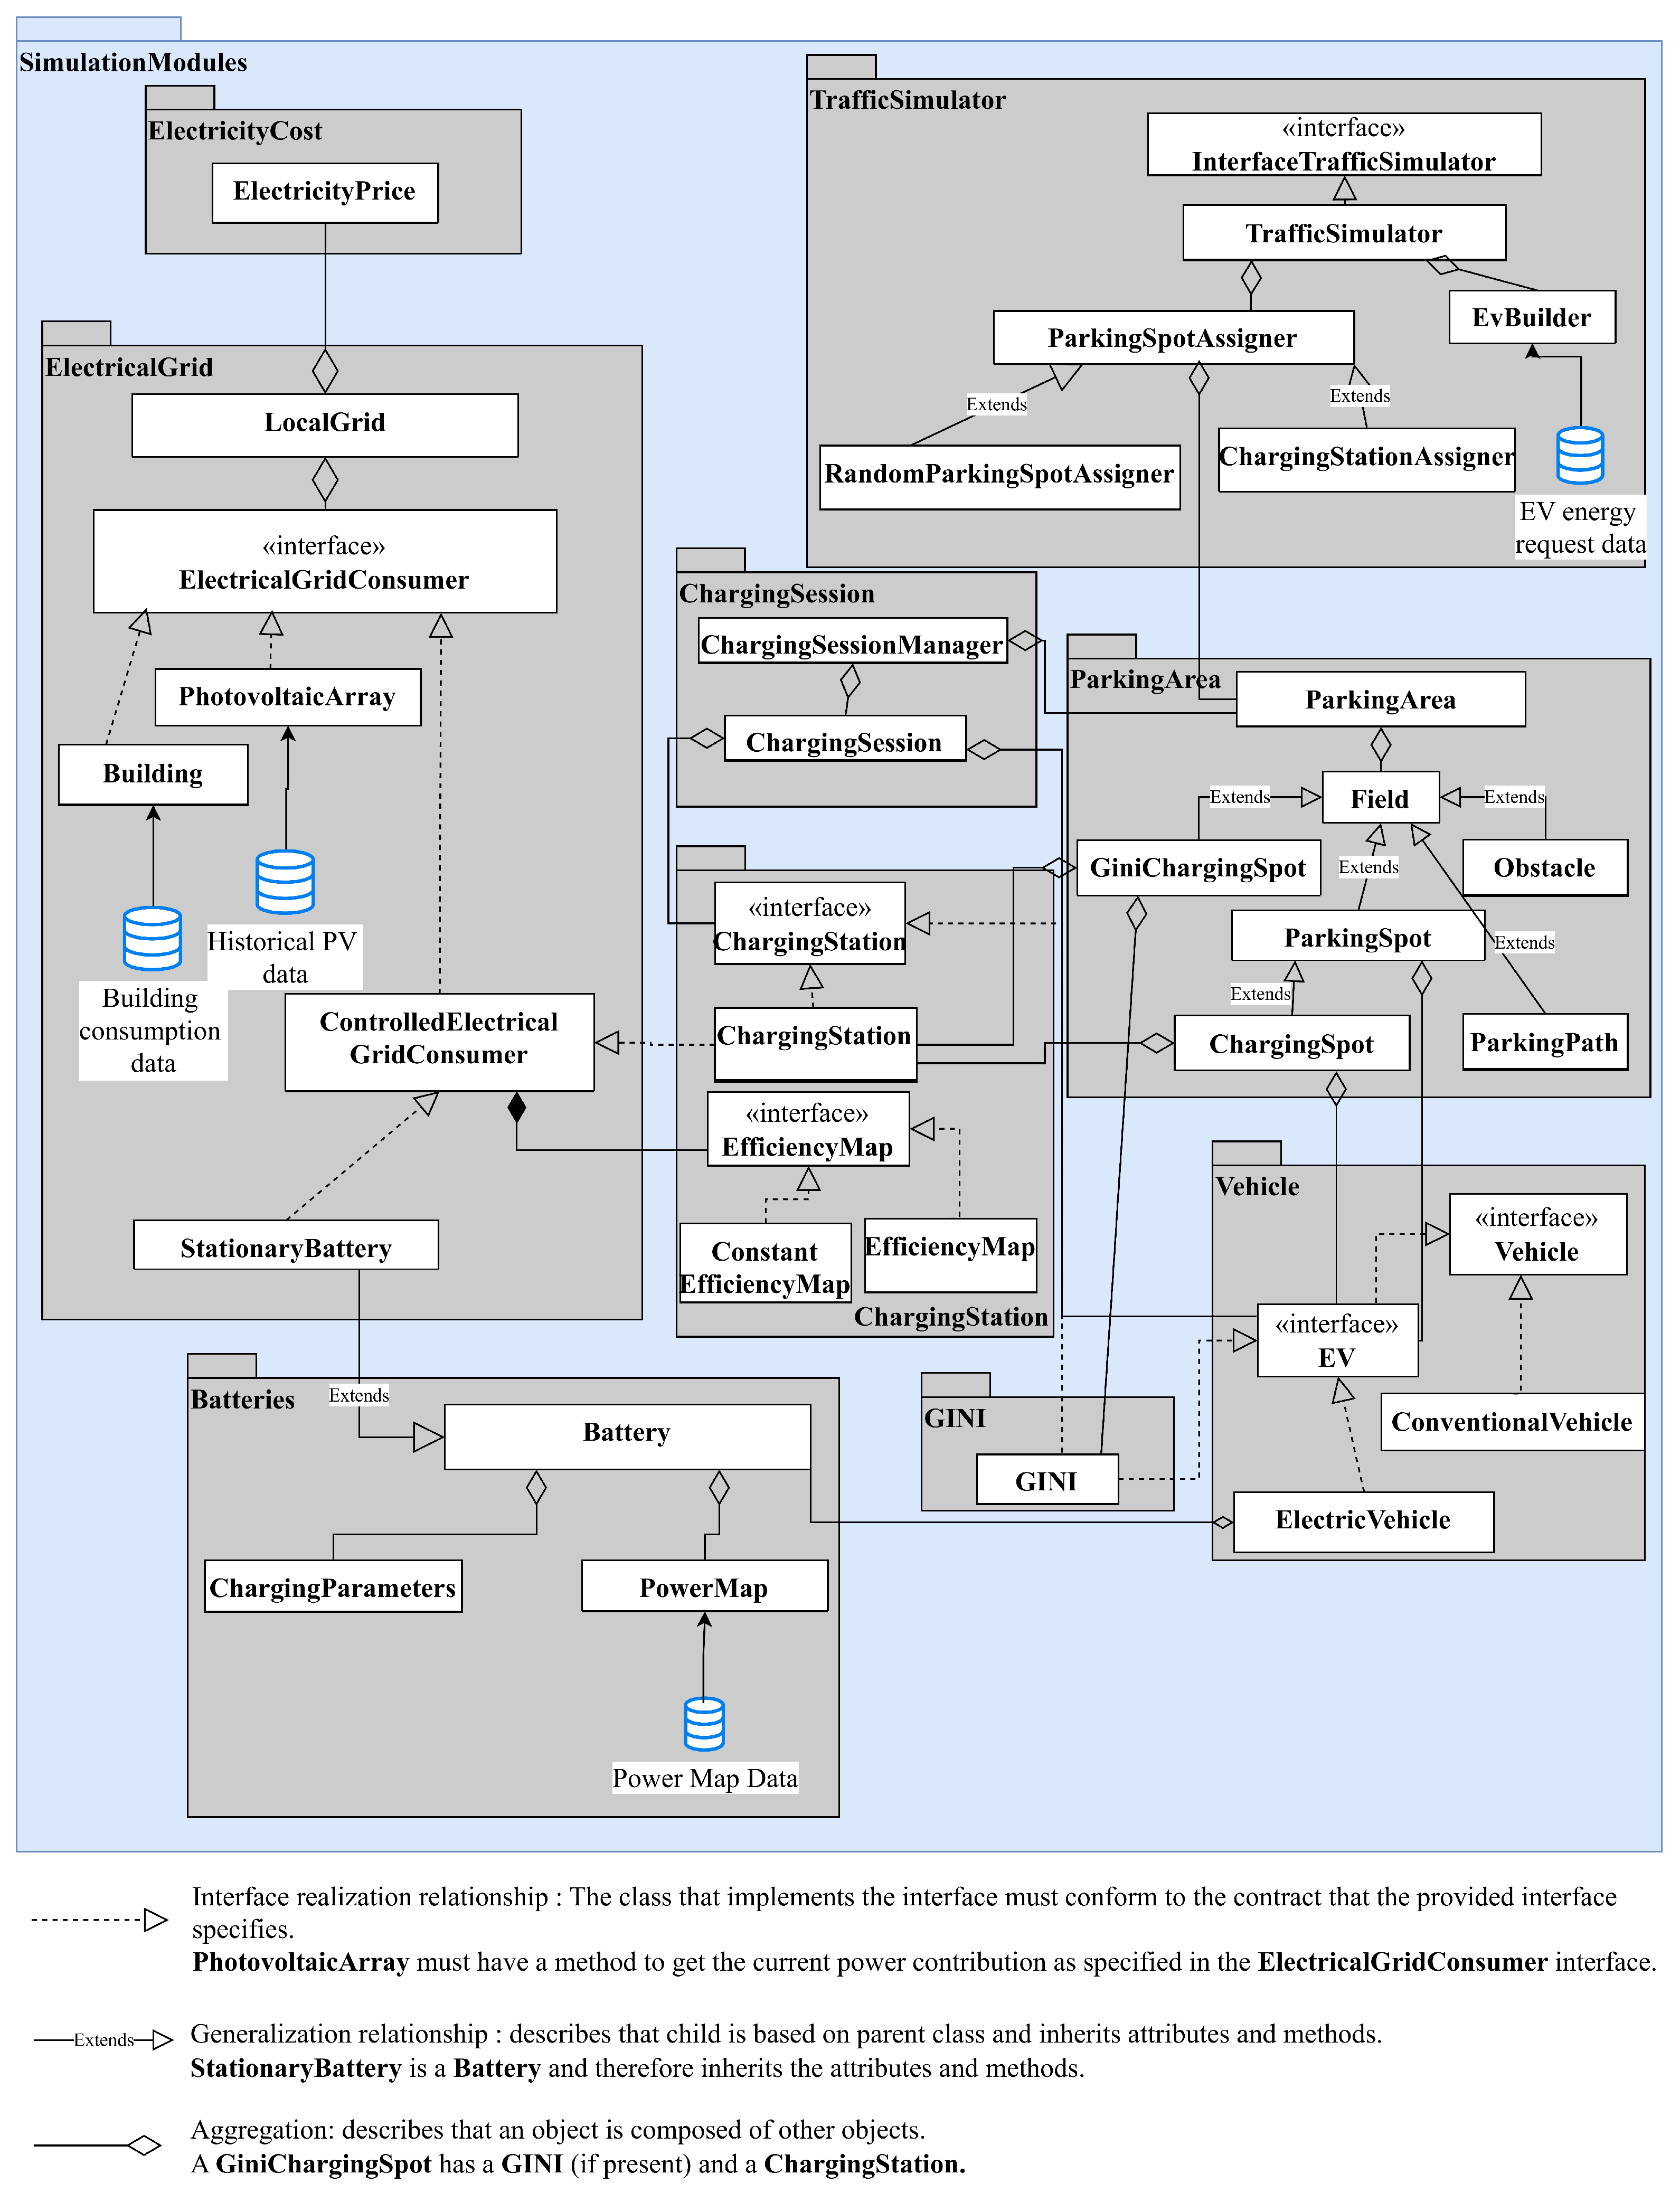
As presented, there is a lot of research examining charging management and new charging strategies for different charging points. Often, these include buildings, PV, and a grid connection. The concept of combining charging solutions with BESS is becoming increasingly prominent in research, with investigations extending to include mobile charging robots. In order to facilitate the research in this area, this work presents an open-source framework for the modelling of charging points. The contributions can be described as follows:
An open-source library for modelling of charging points is presented, that allows for spatial resolution and hence the modelling of mobile charging robots.
The integration of (smart) charging strategies and their interaction with the simulation environment is elaborated and shown for a rule-based strategy, which is compatible for charging points with BESS and/or mobile charging robots.
An exemplary study of different charging point configurations considering BESS, mobile charging robots and grid limitations, respectively, is conducted.
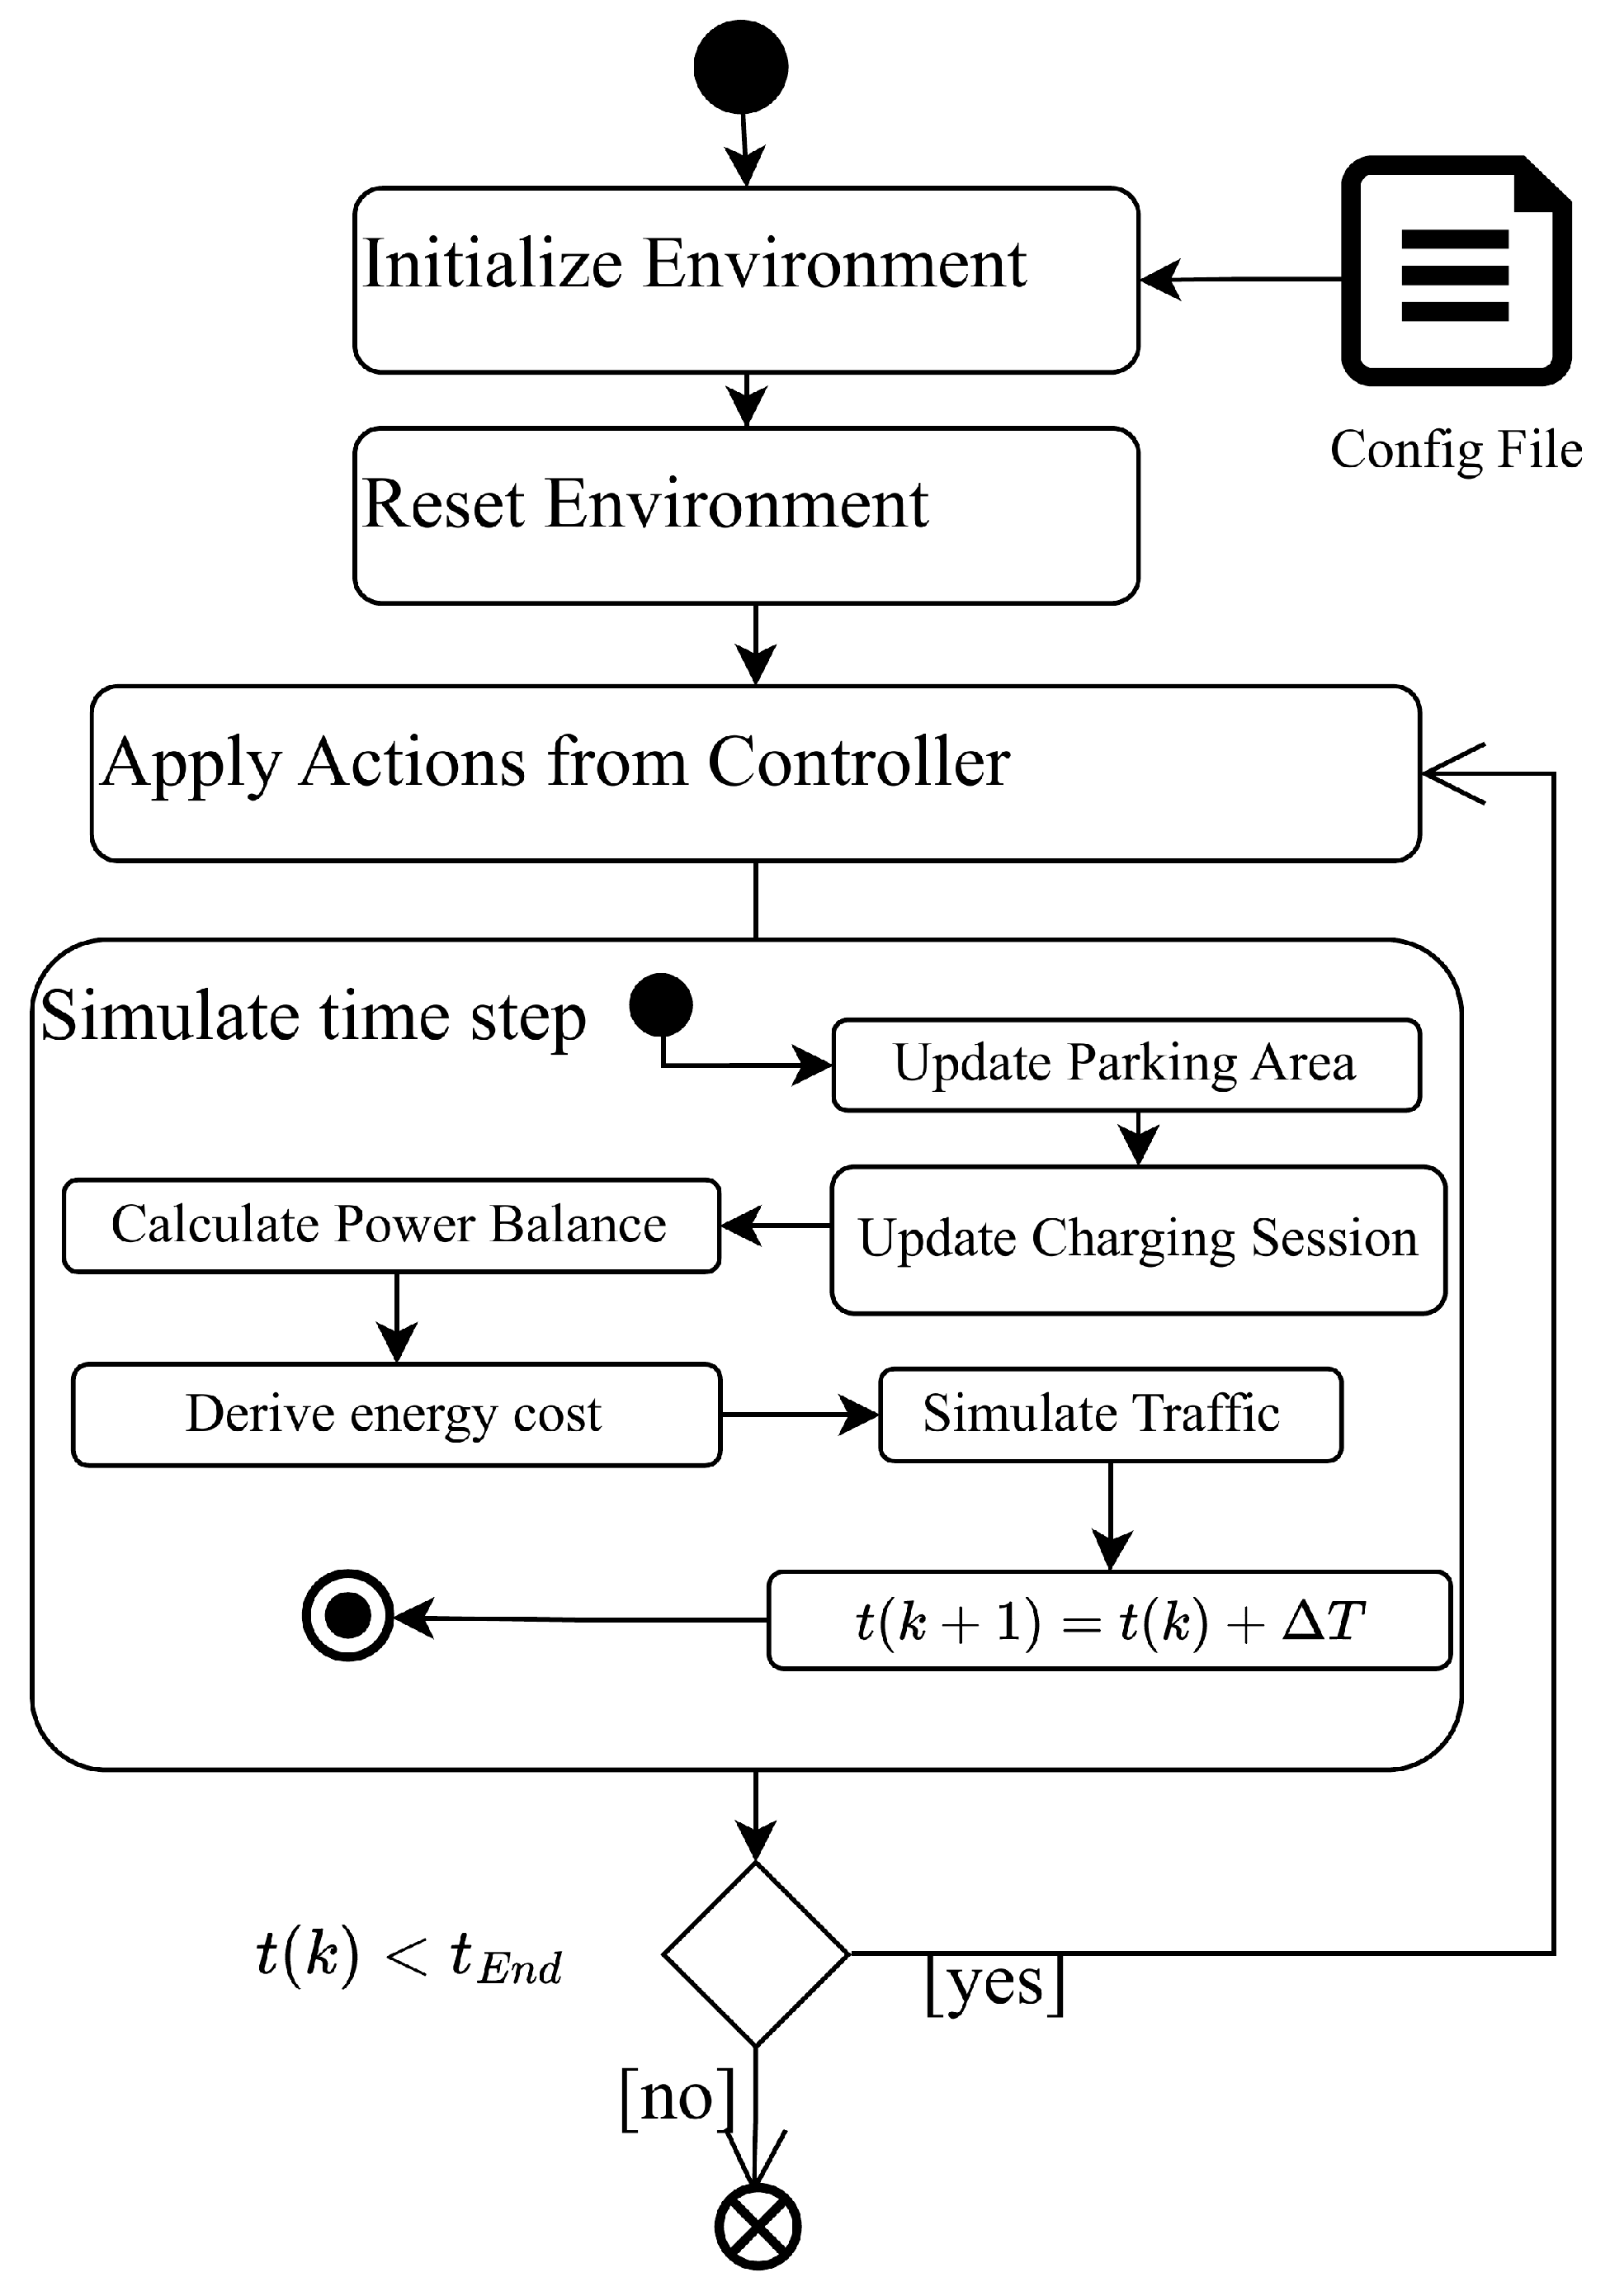
3. Results
This section will provide exemplary results generated with the model presented in
Section 2. In particular, the charging concept with a fleet of GINI robots shall be compared to concepts with solely fast chargers and a concept integrating a BESS.
The overarching use case is that of a supermarket with installed charging infrastructure. This use case has been selected as one example satisfying the requirements set out in International Energy Agency [
2] of chargers in publicly accessible areas, which also enable the adoption of EVs outside urban and suburban areas. This use case means in general that relatively short staying times are expected. The arrival times are sampled from the traffic simulator model as presented in
Section 2.1.9. The expectation for the number of EVs to arrive per day is set to 48 (two per hour). Further, many supermarkets nowadays have a rooftop PV, which has been integrated in the environment. For all scenarios, a selling price for charged energy
has been set to 0.5 €/kWh. In the scenarios, that include GINI robots (Scenario 2, 3, 5), the charging stations can only be used by the GINIs. In these scenarios, the EVs park at a randomly assigned parking field and wait for a GINI. In the event of power being fed back into the grid, it is assumed that there will be no remuneration for it.
In
Table 4, the most important parameters of the configuration are listed. It is important to note that these results do not represent a detailed study on the optimal charging solution for a specific location, but should rather highlight how the model can be used to compare different solutions. For all runs, a summer day with the solar irradiance data and electricity prices from the 2 June 2022 is assumed.
Importantly, the profit values presented in the following scenarios reflect only operational margins-revenue from charging EVs minus cost for buying energy. Capital expenditures (e.g., BESS and GINI purchase), maintenance costs, and battery degradation effects are not included. These aspects are essential for a full techno-economic analysis and should be evaluated in future site-specific studies.
In the following, the results from the different scenarios are presented and a short comparison summary of the results is provided afterwards (
Section 3.7).
3.1. Scenario 1
In the first scenario, the grid limit
is set to
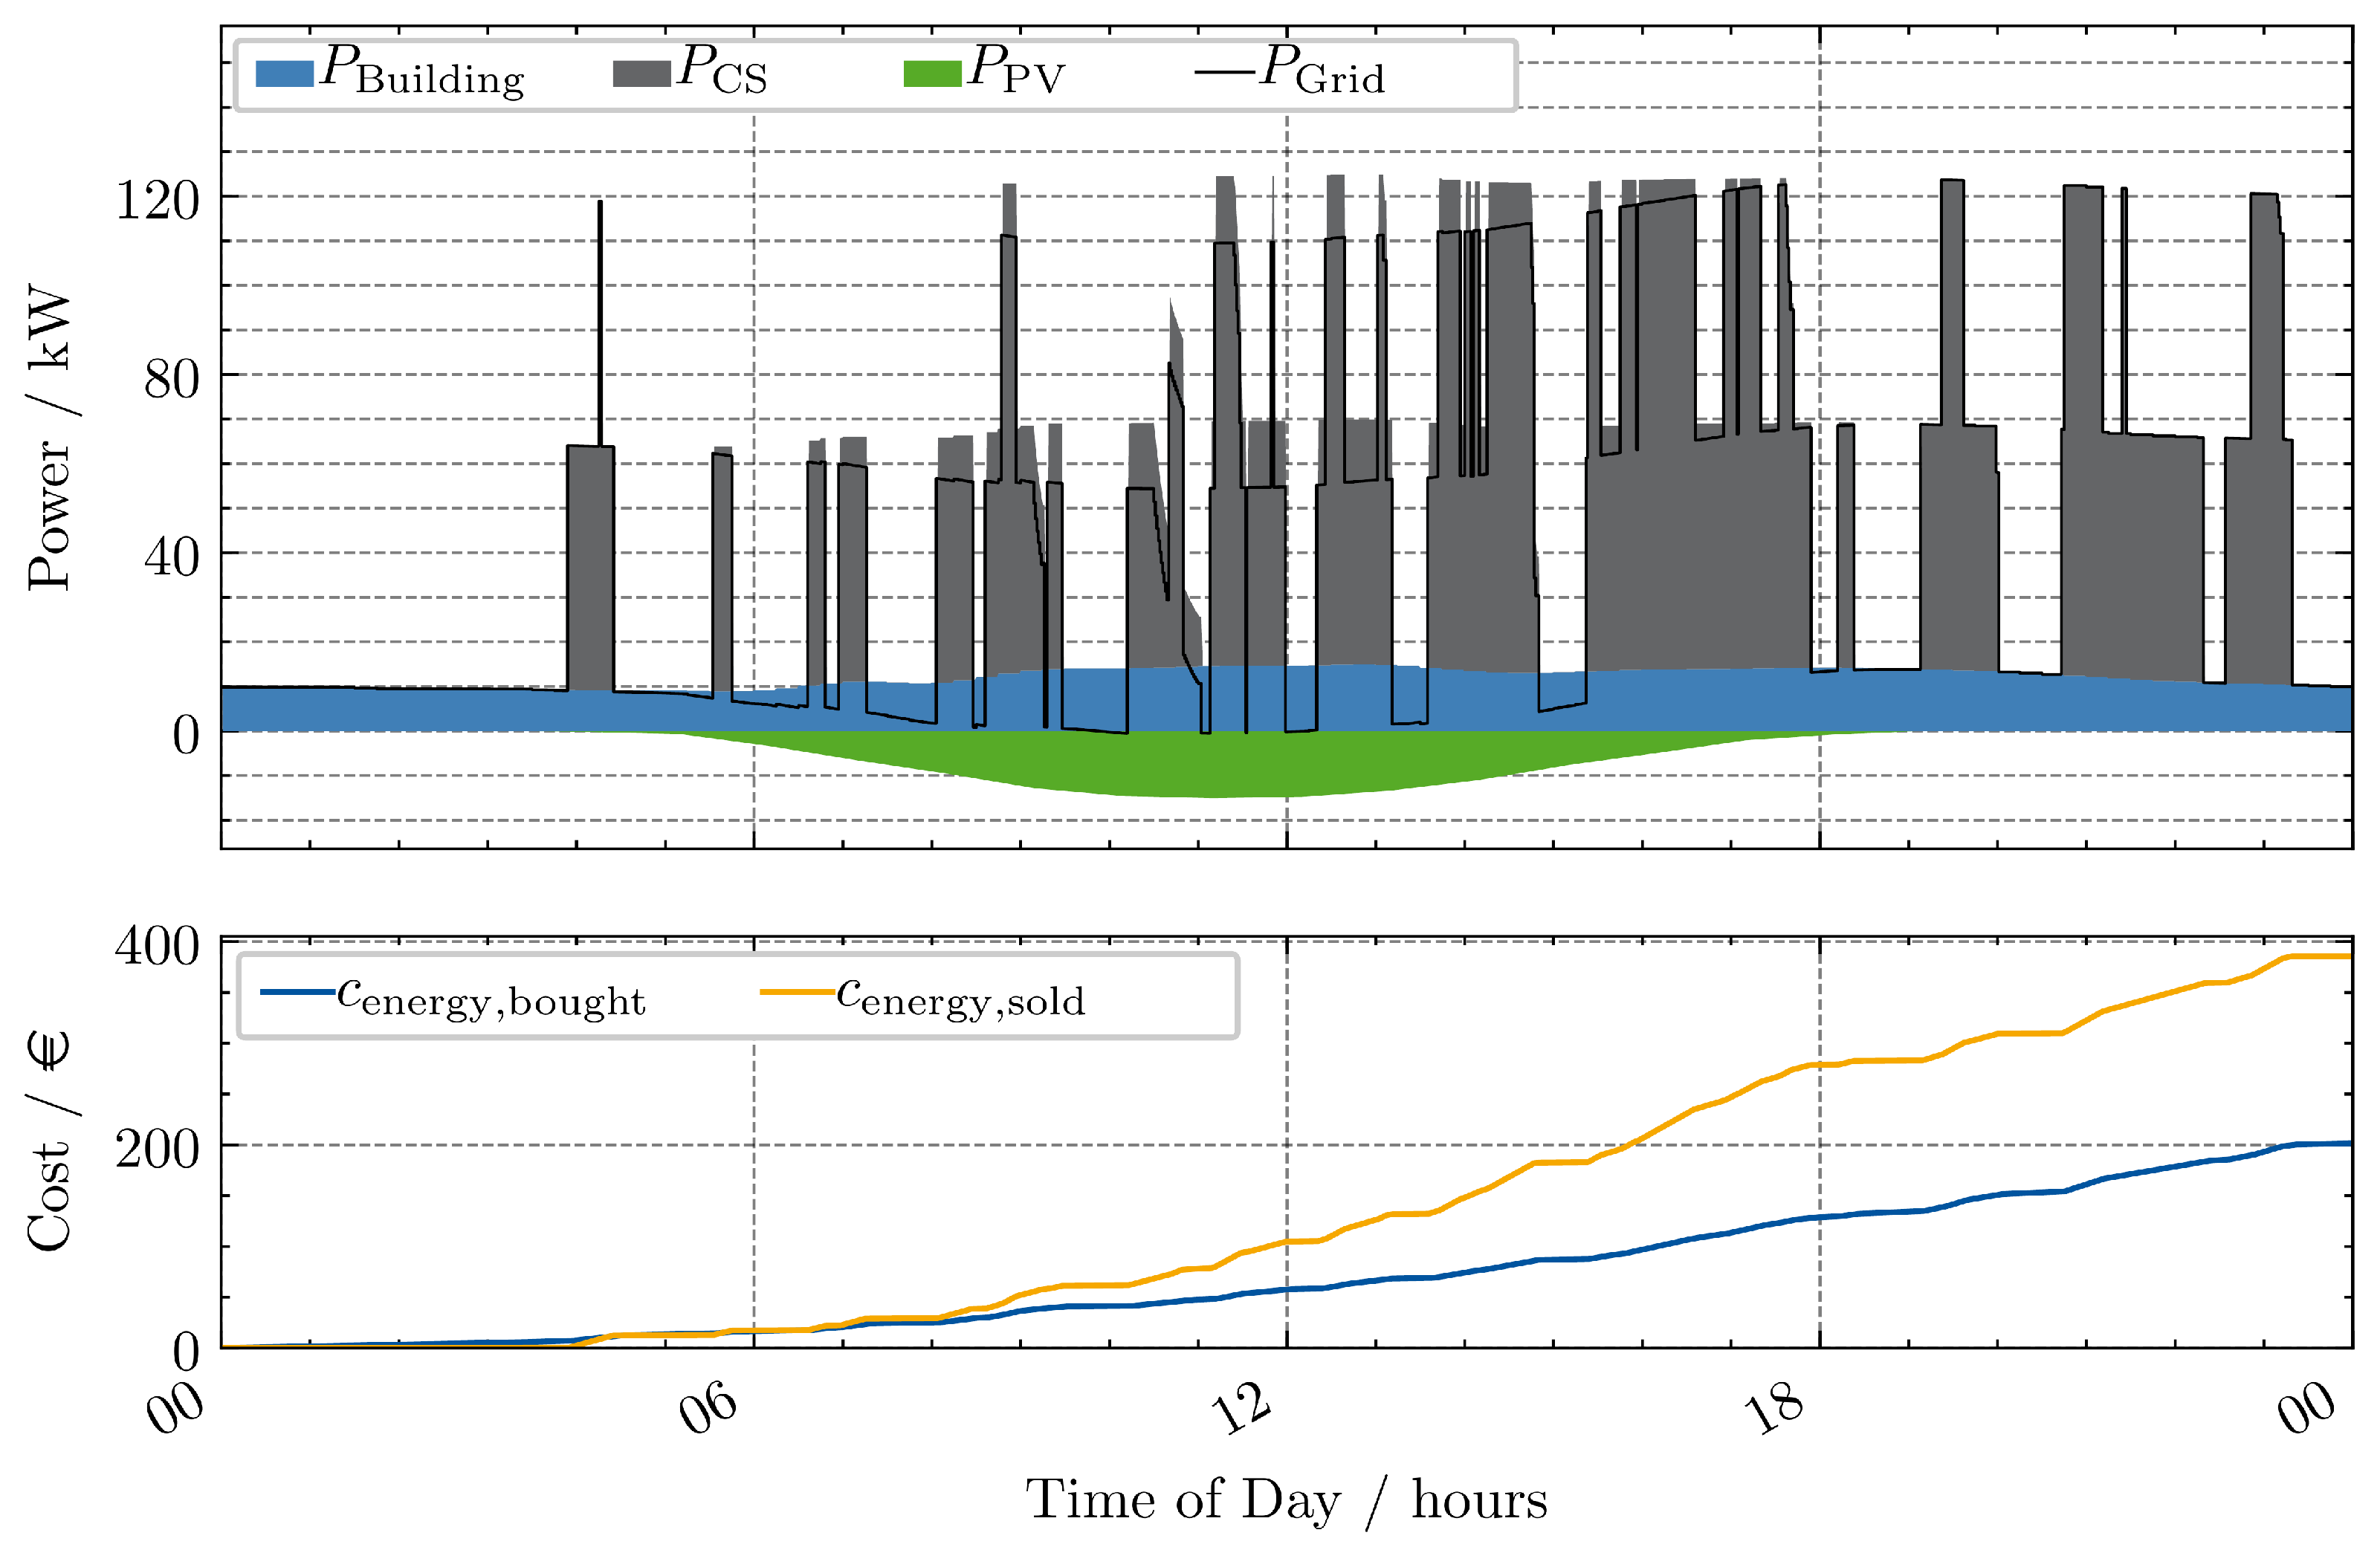
, which cannot be reached with the consumers installed. Therefore, this limit is practically irrelevant for the scenario. The power trajectory and cost are shown in
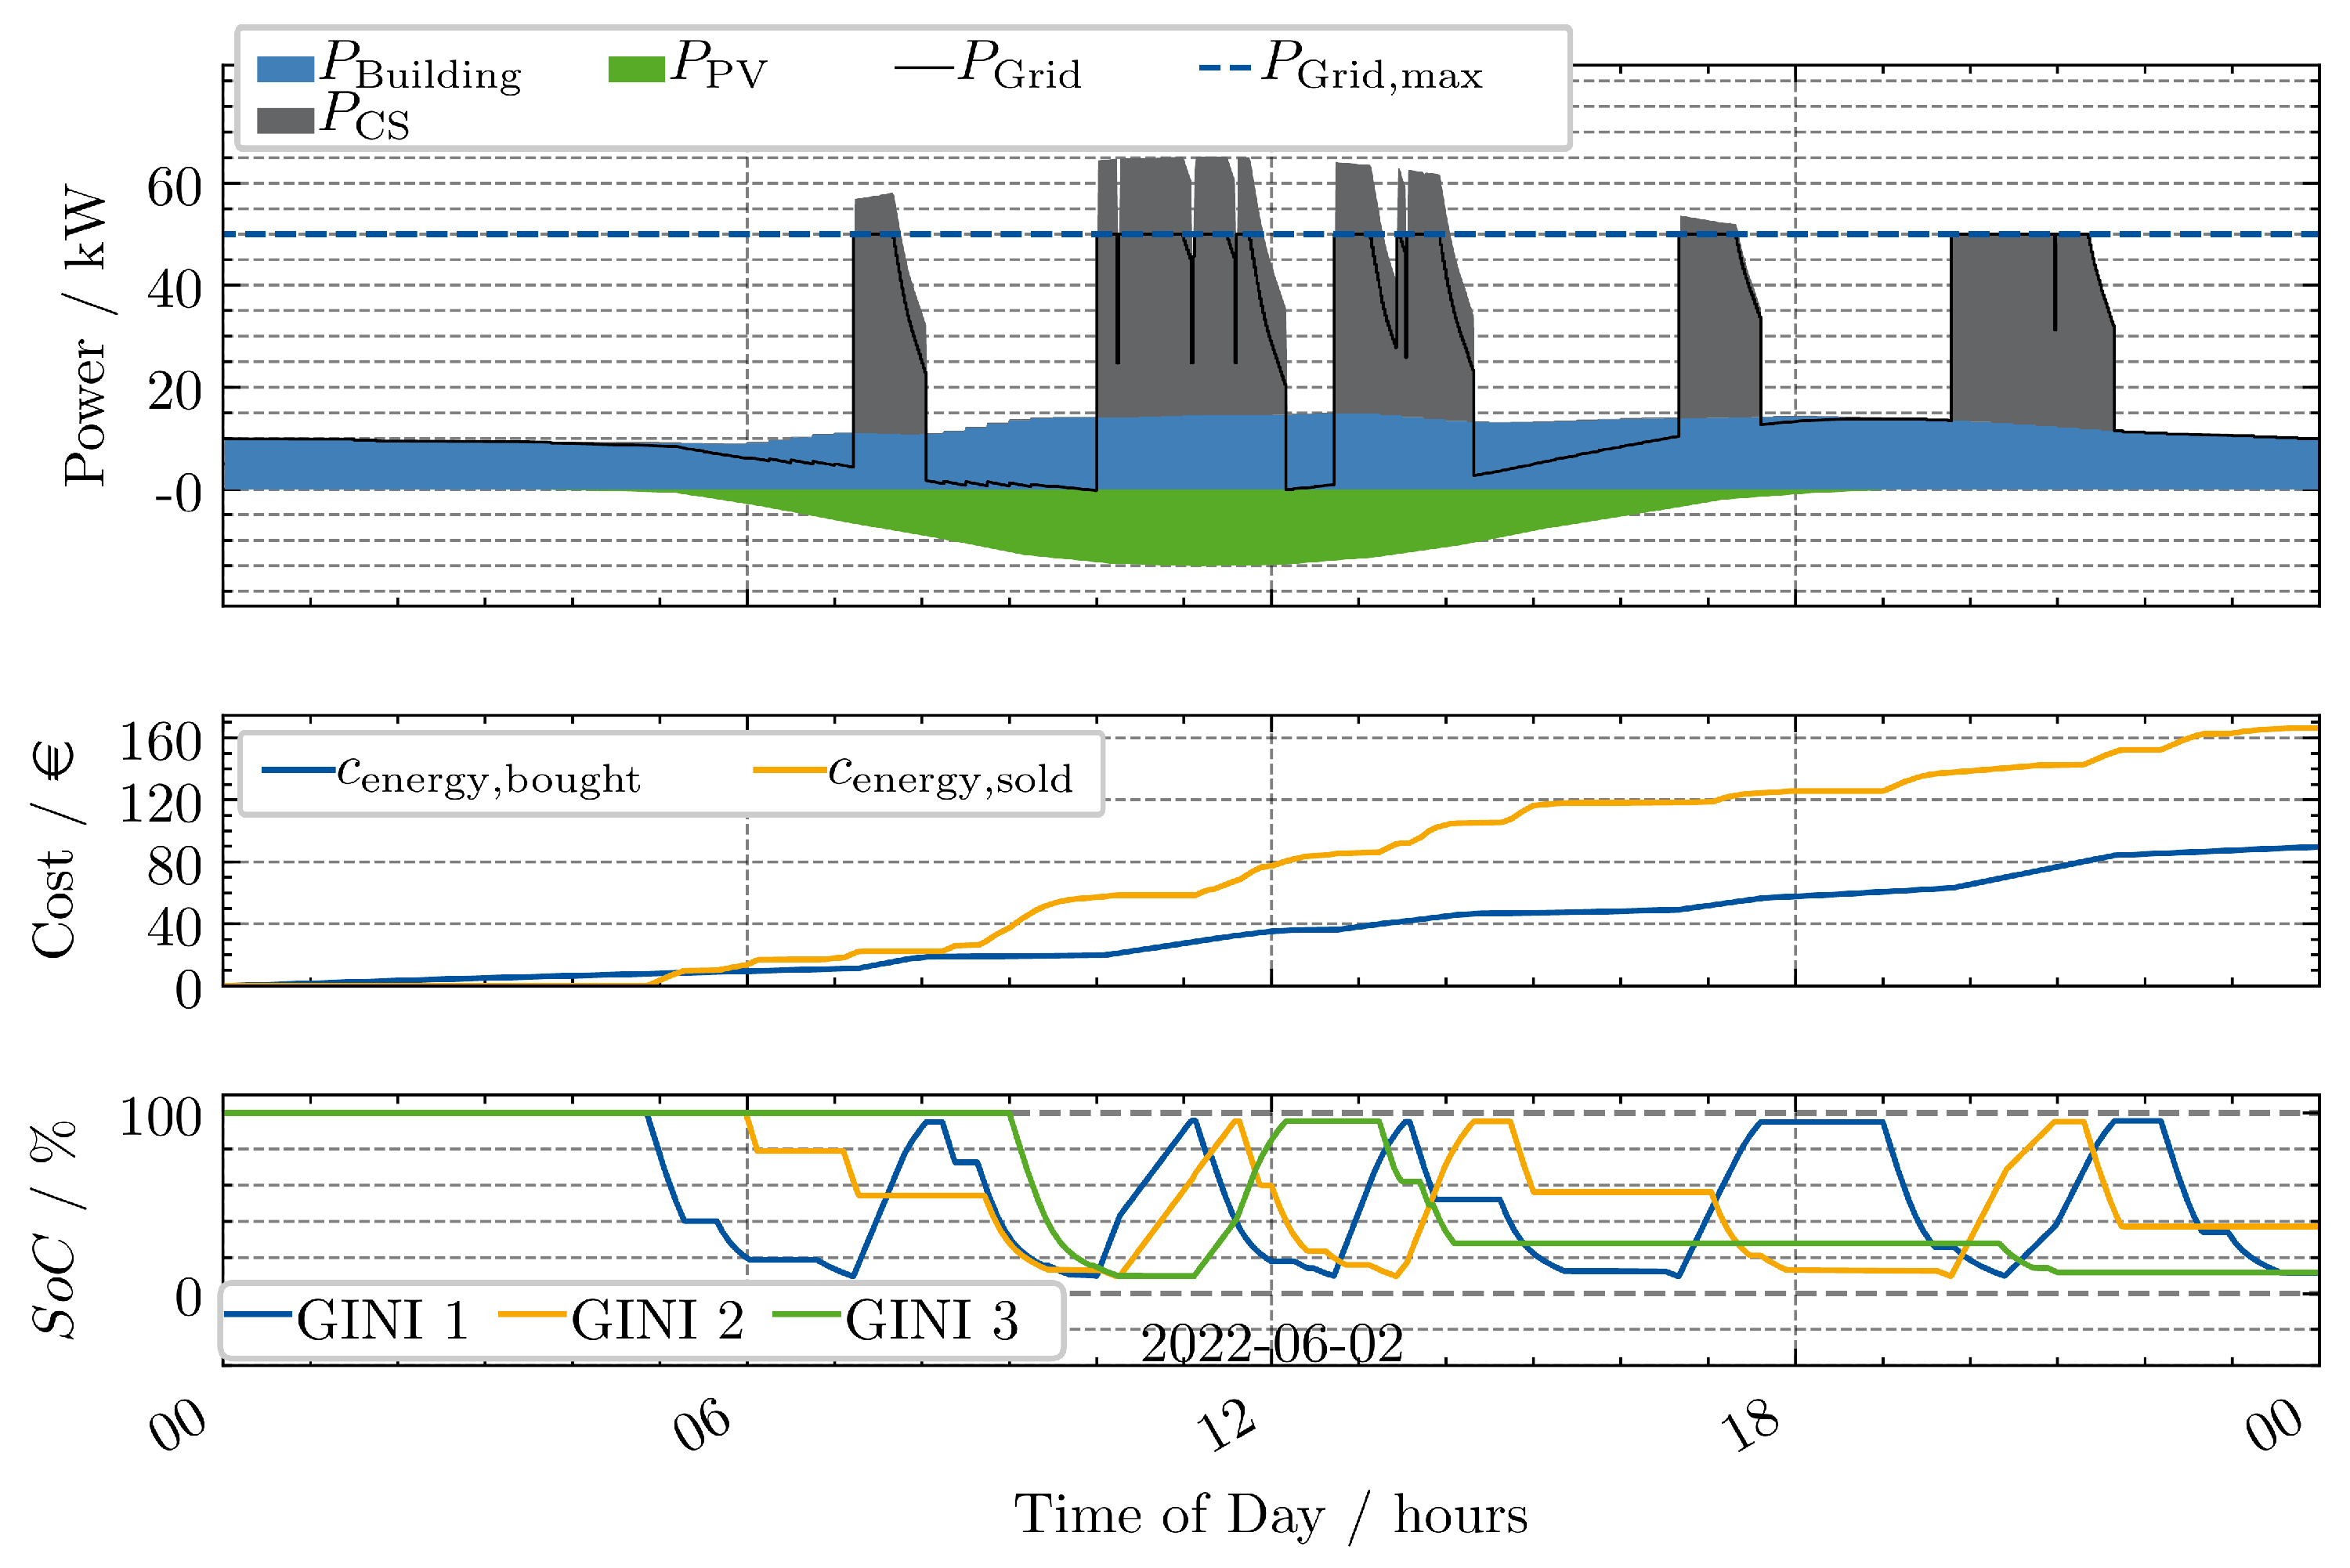
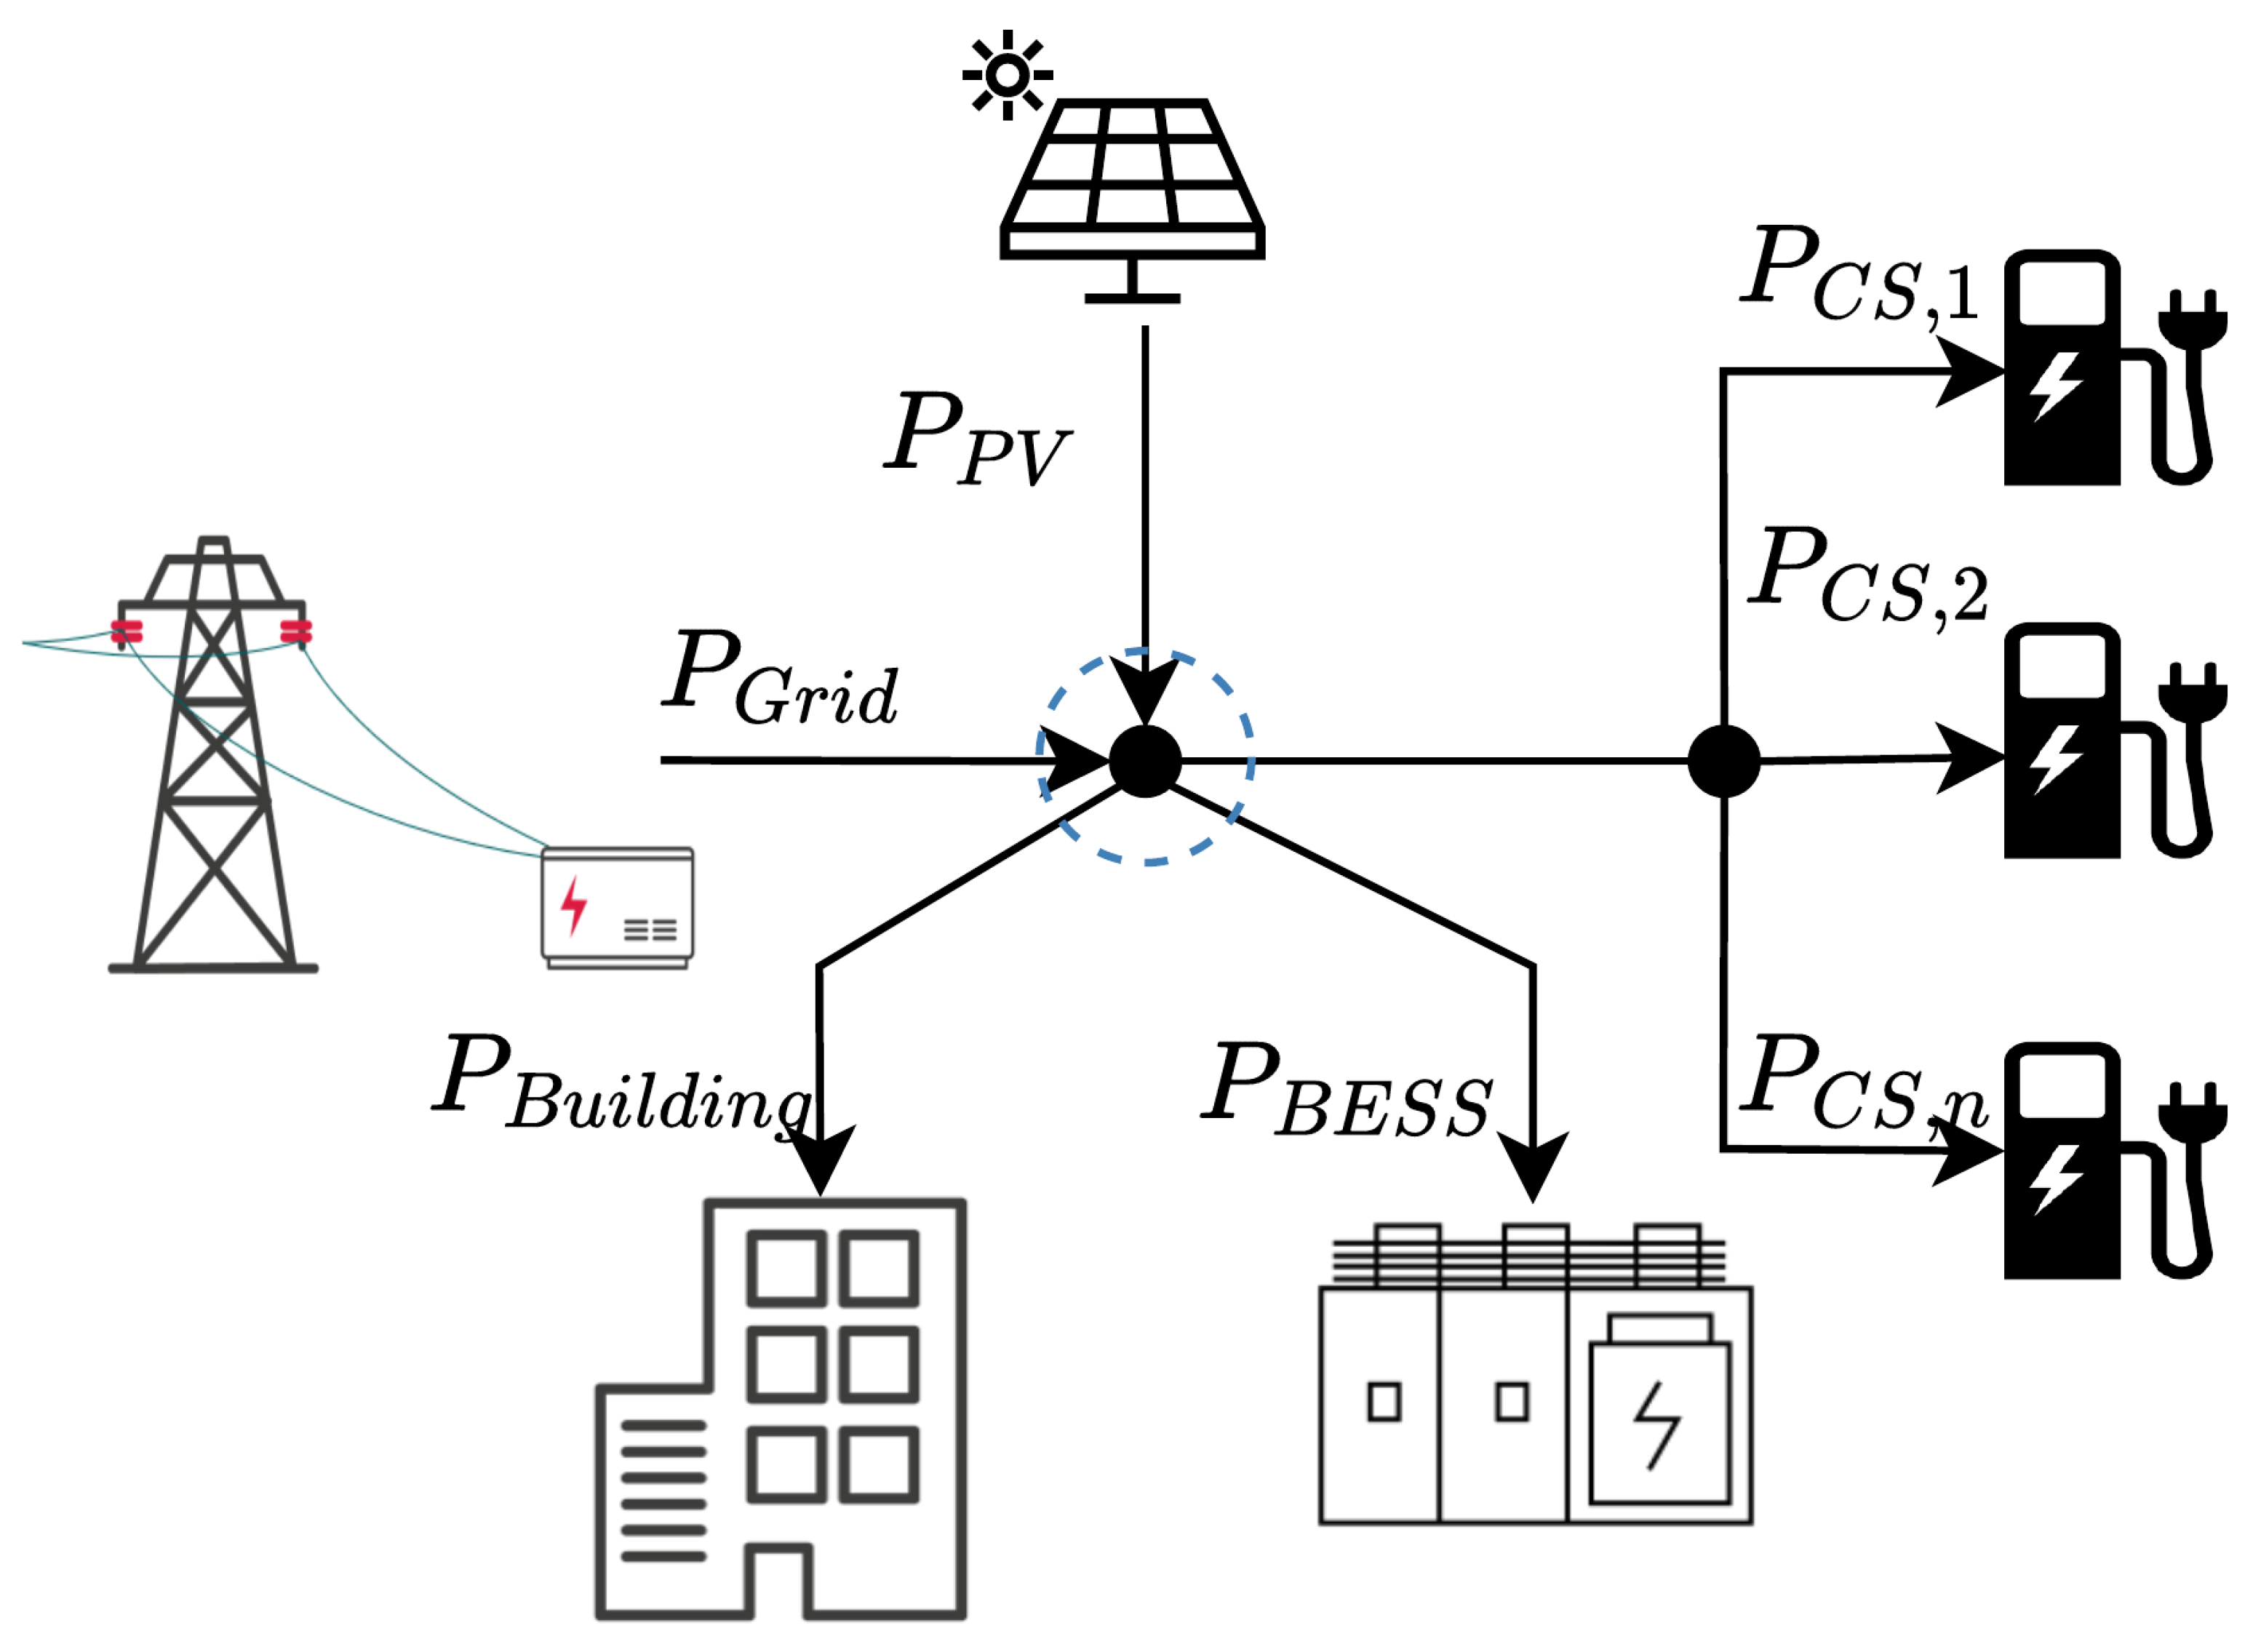
Figure 6. In the upper graph, the PV power is depicted as negative and the building and CS power as positive in the stacked form. The resulting power drawn from the grid is depicted as a line. If
is negative, it means that power is fed back into the grid. In the bottom graph the accumulated cost and revenue are shown. The difference is the profit, only considering the operational expenses in regard to energy cost. In cases, where GINIs are present, the revenue results from the GINIs charging EVs. In cases only with CSs, the revenue results from the EVs charging at the CSs. As there is no storage system (GINI or BESS) in this scenario, no SoC is shown.
As most EVs can charge with maximum power above the limit of the CS up to a high SoC, two distinct power levels can be observed in the top graph. If one EV is charging at the parking area it results in a grid power of around 60 kW and if there are two it is around 120 kW. The full magnitude also depends on the building and PV power at the respective time step. Although, compared to the high charging powers these are almost negligible in the configured scenarios.
Especially in the afternoon hours, where often both CSs are occupied by an EV, the revenue increases much steeper compared to the cost, due to the spread between buying and selling price.
Figure 6.
Scenario 1: Two fast chargers and no power limit; Profit €184.27 (Cost: €201.575-Revenue: €385.85).
Figure 6.
Scenario 1: Two fast chargers and no power limit; Profit €184.27 (Cost: €201.575-Revenue: €385.85).
3.2. Scenario 2
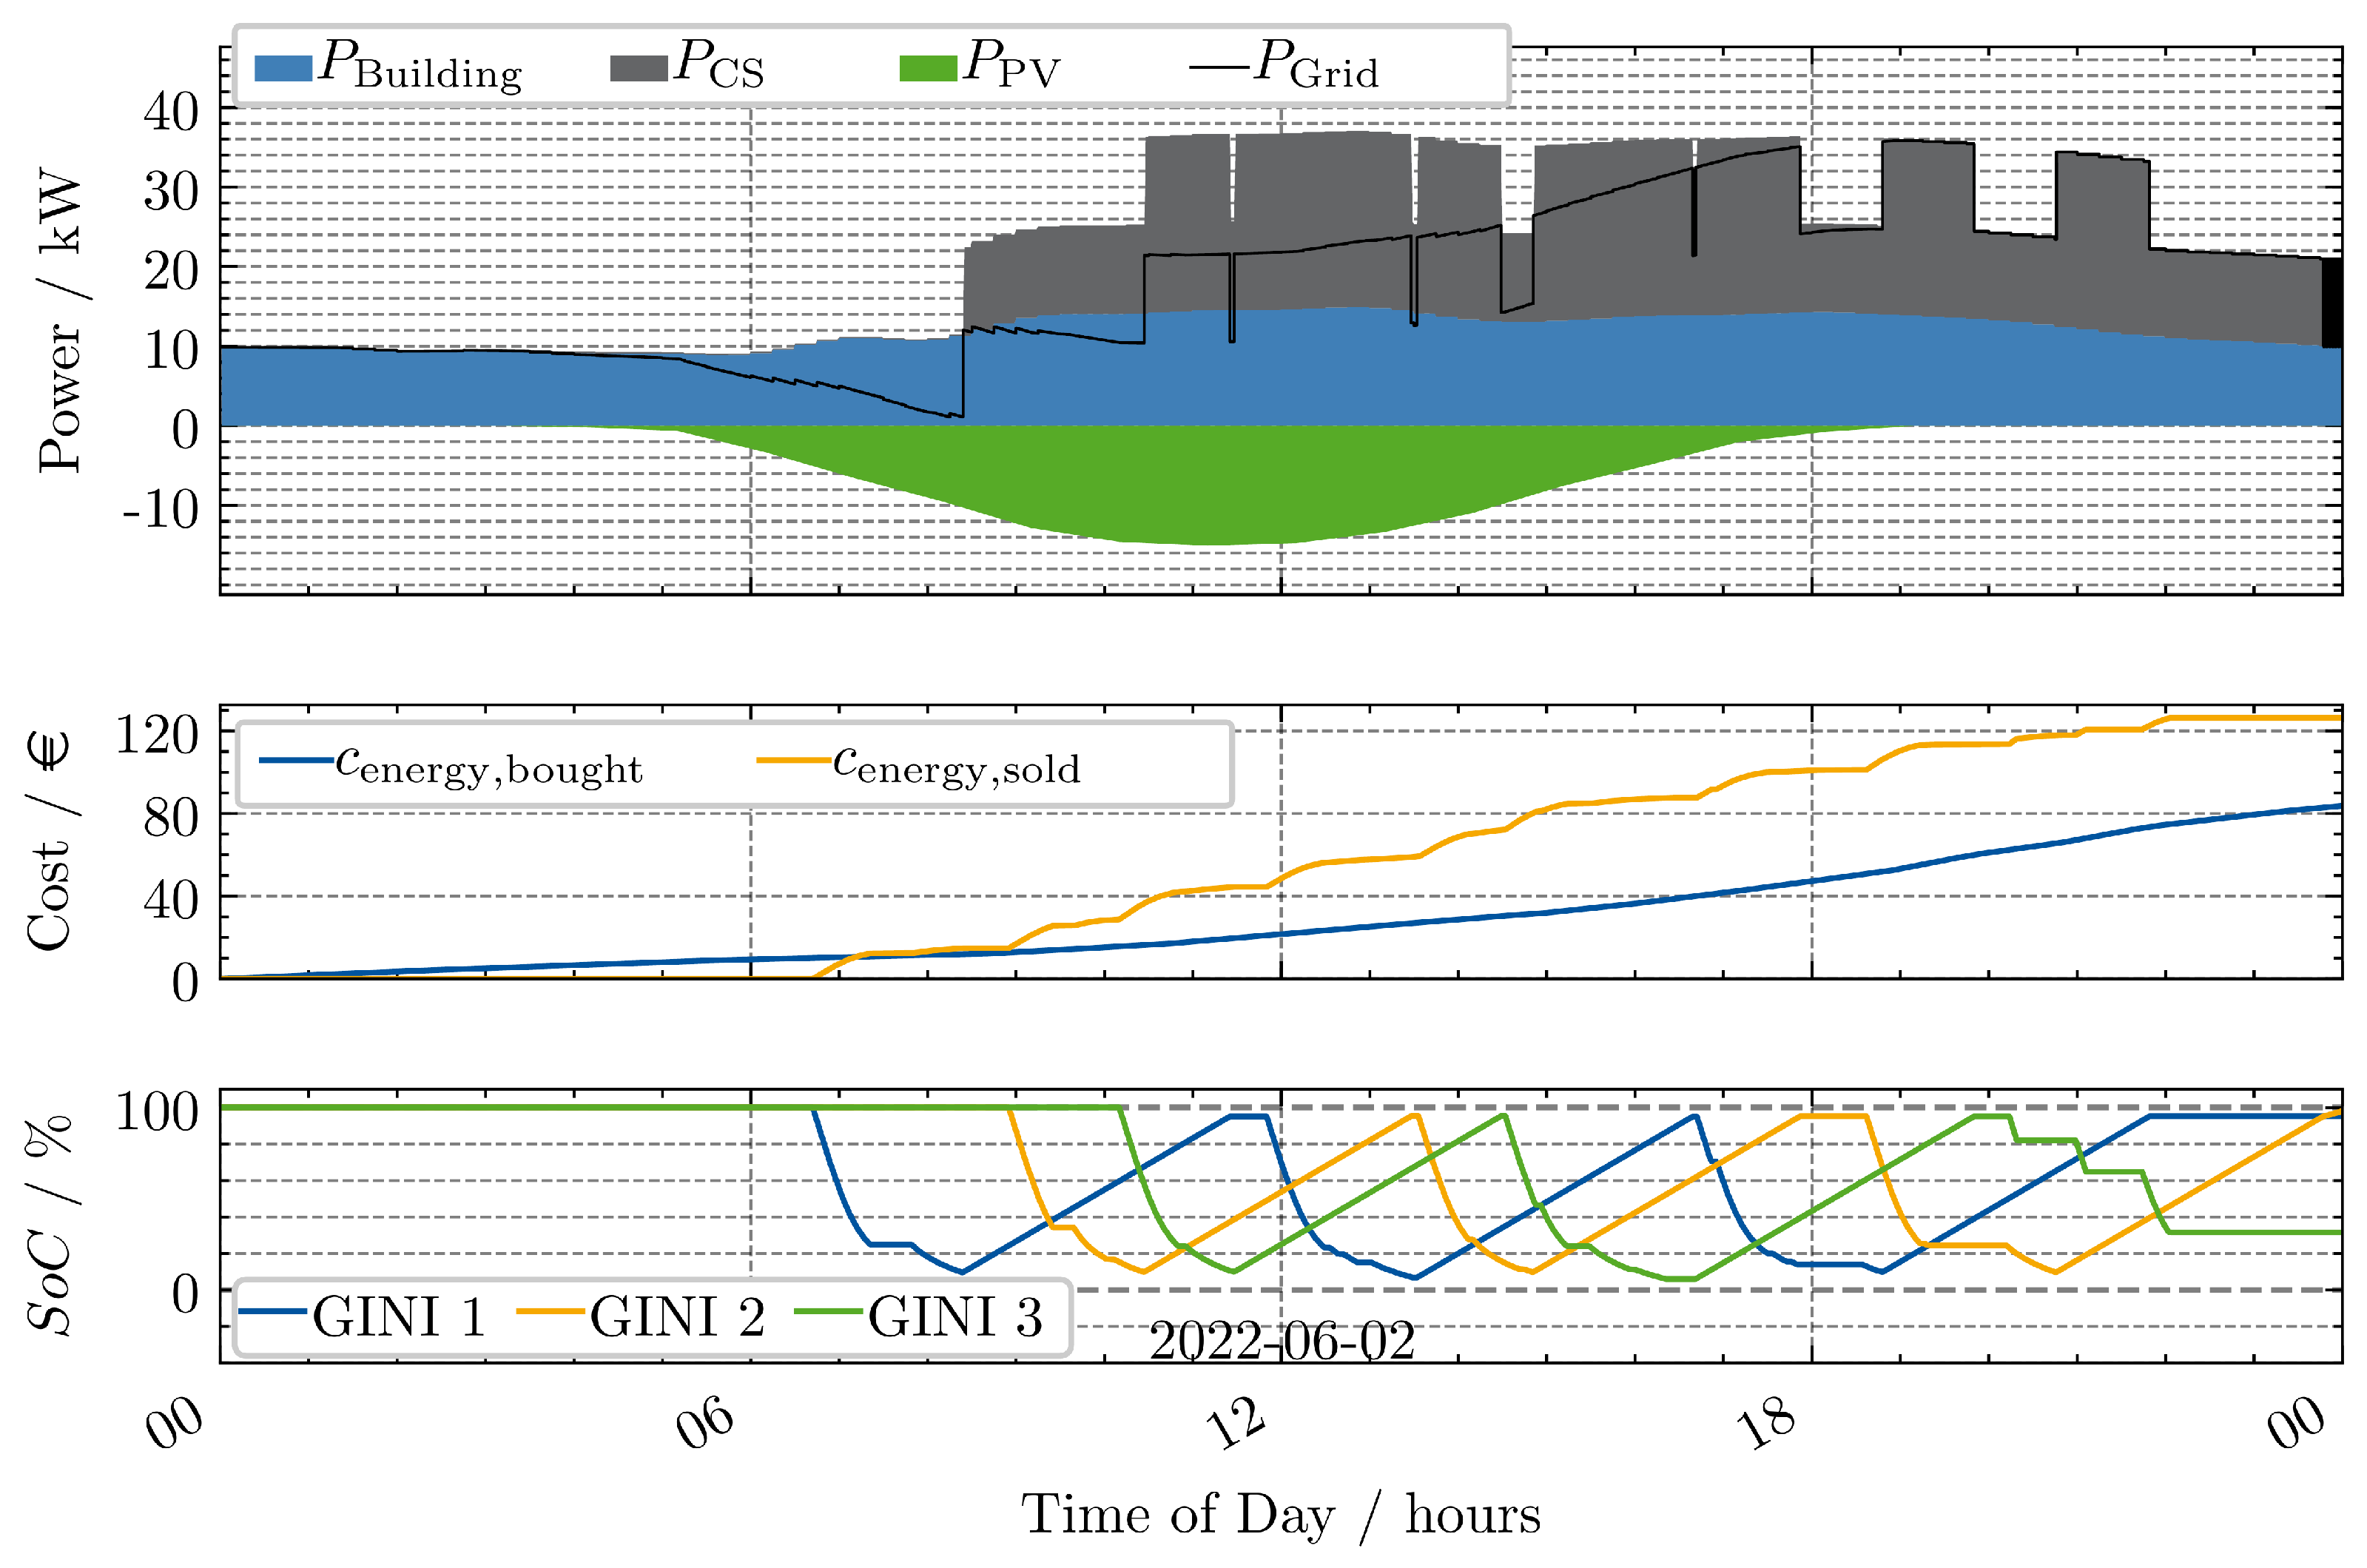
In the second scenario, three GINIs are introduced into the environment and charged on two slow chargers with 11 kW. The SoC of the batteries integrated in the GINIs are shown in
Figure 7 in addition to the cost and the power trajectories, that have already been introduced for the first scenario.
In the bottom graph, it can be seen that GINI 1 and GINI 2 recharged three times and the third GINI recharges two times and end the day with a SoC of around 50%. It becomes evident that the grid load is much lower compared to scenario 1. Instead of reaching more than 120 kW, only around 35 kW peak grid power is observed. This is due to the significantly lower charging power of the CSs in this scenario. Consequently, it results in lower revenue and hence lower profit, as the number of EVs the GINIs can service, depends on the recharging time (see
Table 5).
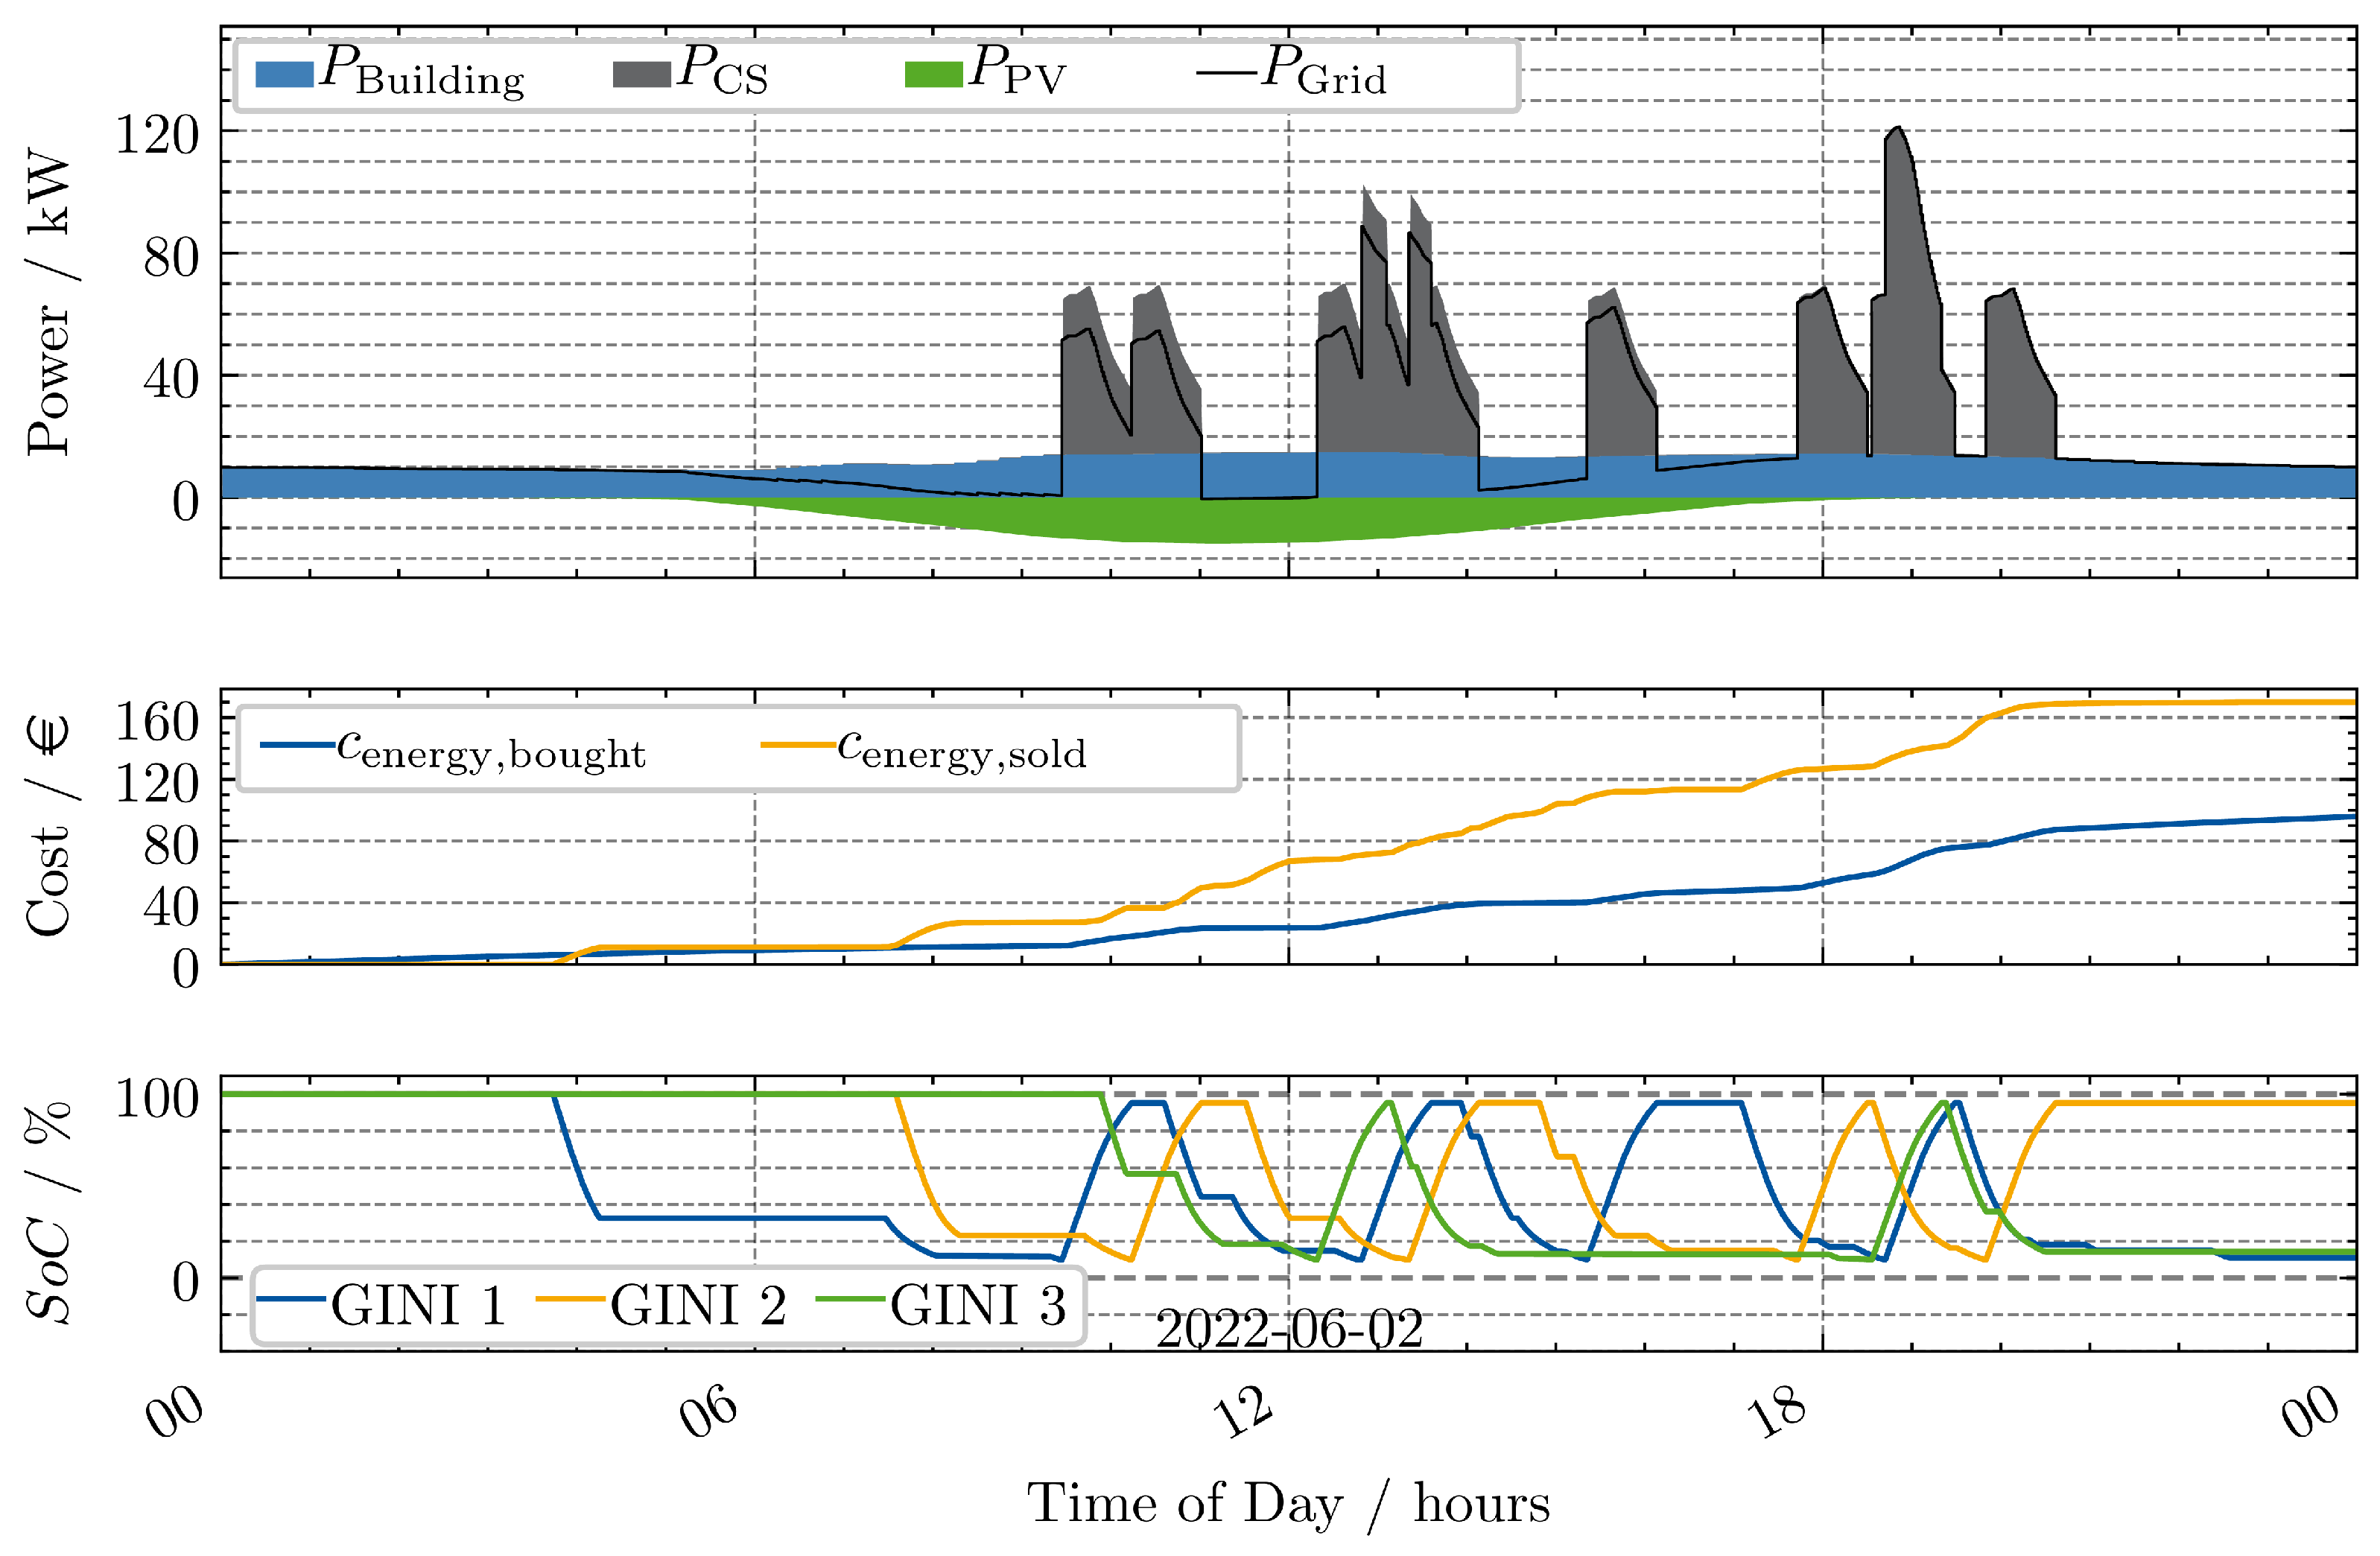
3.3. Scenario 3
Scenario 3 presents a combination of Scenario 1 and 2. The same number of GINIs is used, but with the same configuration of charging stations from Scenario 1 (see
Figure 8).
The results show that the GINIs are able to charge more often compared to Scenario 2. The peak load is higher compared to Scenario 2, but still lower in comparison to Scenario 1. Accordingly, the profit is higher compared to Scenario 2, but still significantly lower compared to Scenario 1 as highlighted in
Table 5. It can be observed that at high SoCs the charging power is reduced. This indicates recharging to 100% SoC might not be the most profitable strategy. Additionally, in many cases, the energy of the GINIs battery is only sufficient for a single EV. In particular, the cost of travelling to and from an electric vehicle (EV) and then back to the charging station (CS) to recharge, followed by travelling to the next EV, can be significant, especially for large parking spots. This cost could be reduced by using battery sizes that allow for servicing multiple EVs and potentially only a single recharging throughout the day, with the main recharging occurring during the night.
Table 5.
Summary of key metrics for all scenarios (single-day simulations).
Table 5.
Summary of key metrics for all scenarios (single-day simulations).
| Scenario | Profit/ | Cost/ | Revenue/ | EVs Arrived | EVs Fully Charged | Charged Energy/kWh | Avg. kWh/EV |
|---|
| 1 | 184.27 | 201.58 | 385.85 | 56 | 19 | 771.70 | 13.80 |
| 2 | 42.44 | 83.78 | 126.22 | 40 | 7 | 252.44 | 6.31 |
| 3 | 74.16 | 95.87 | 170.03 | 43 | 7 | 340.06 | 7.90 |
| 4 | 89.85 | 126.27 | 216.11 | 45 | 7 | 422.85 | 9.40 |
| 5 | 76.50 | 89.72 | 166.21 | 43 | 3 | 332.23 | 7.73 |
| 6 | 138.13 | 172.08 | 310.21 | 54 | 11 | 620.42 | 11.49 |
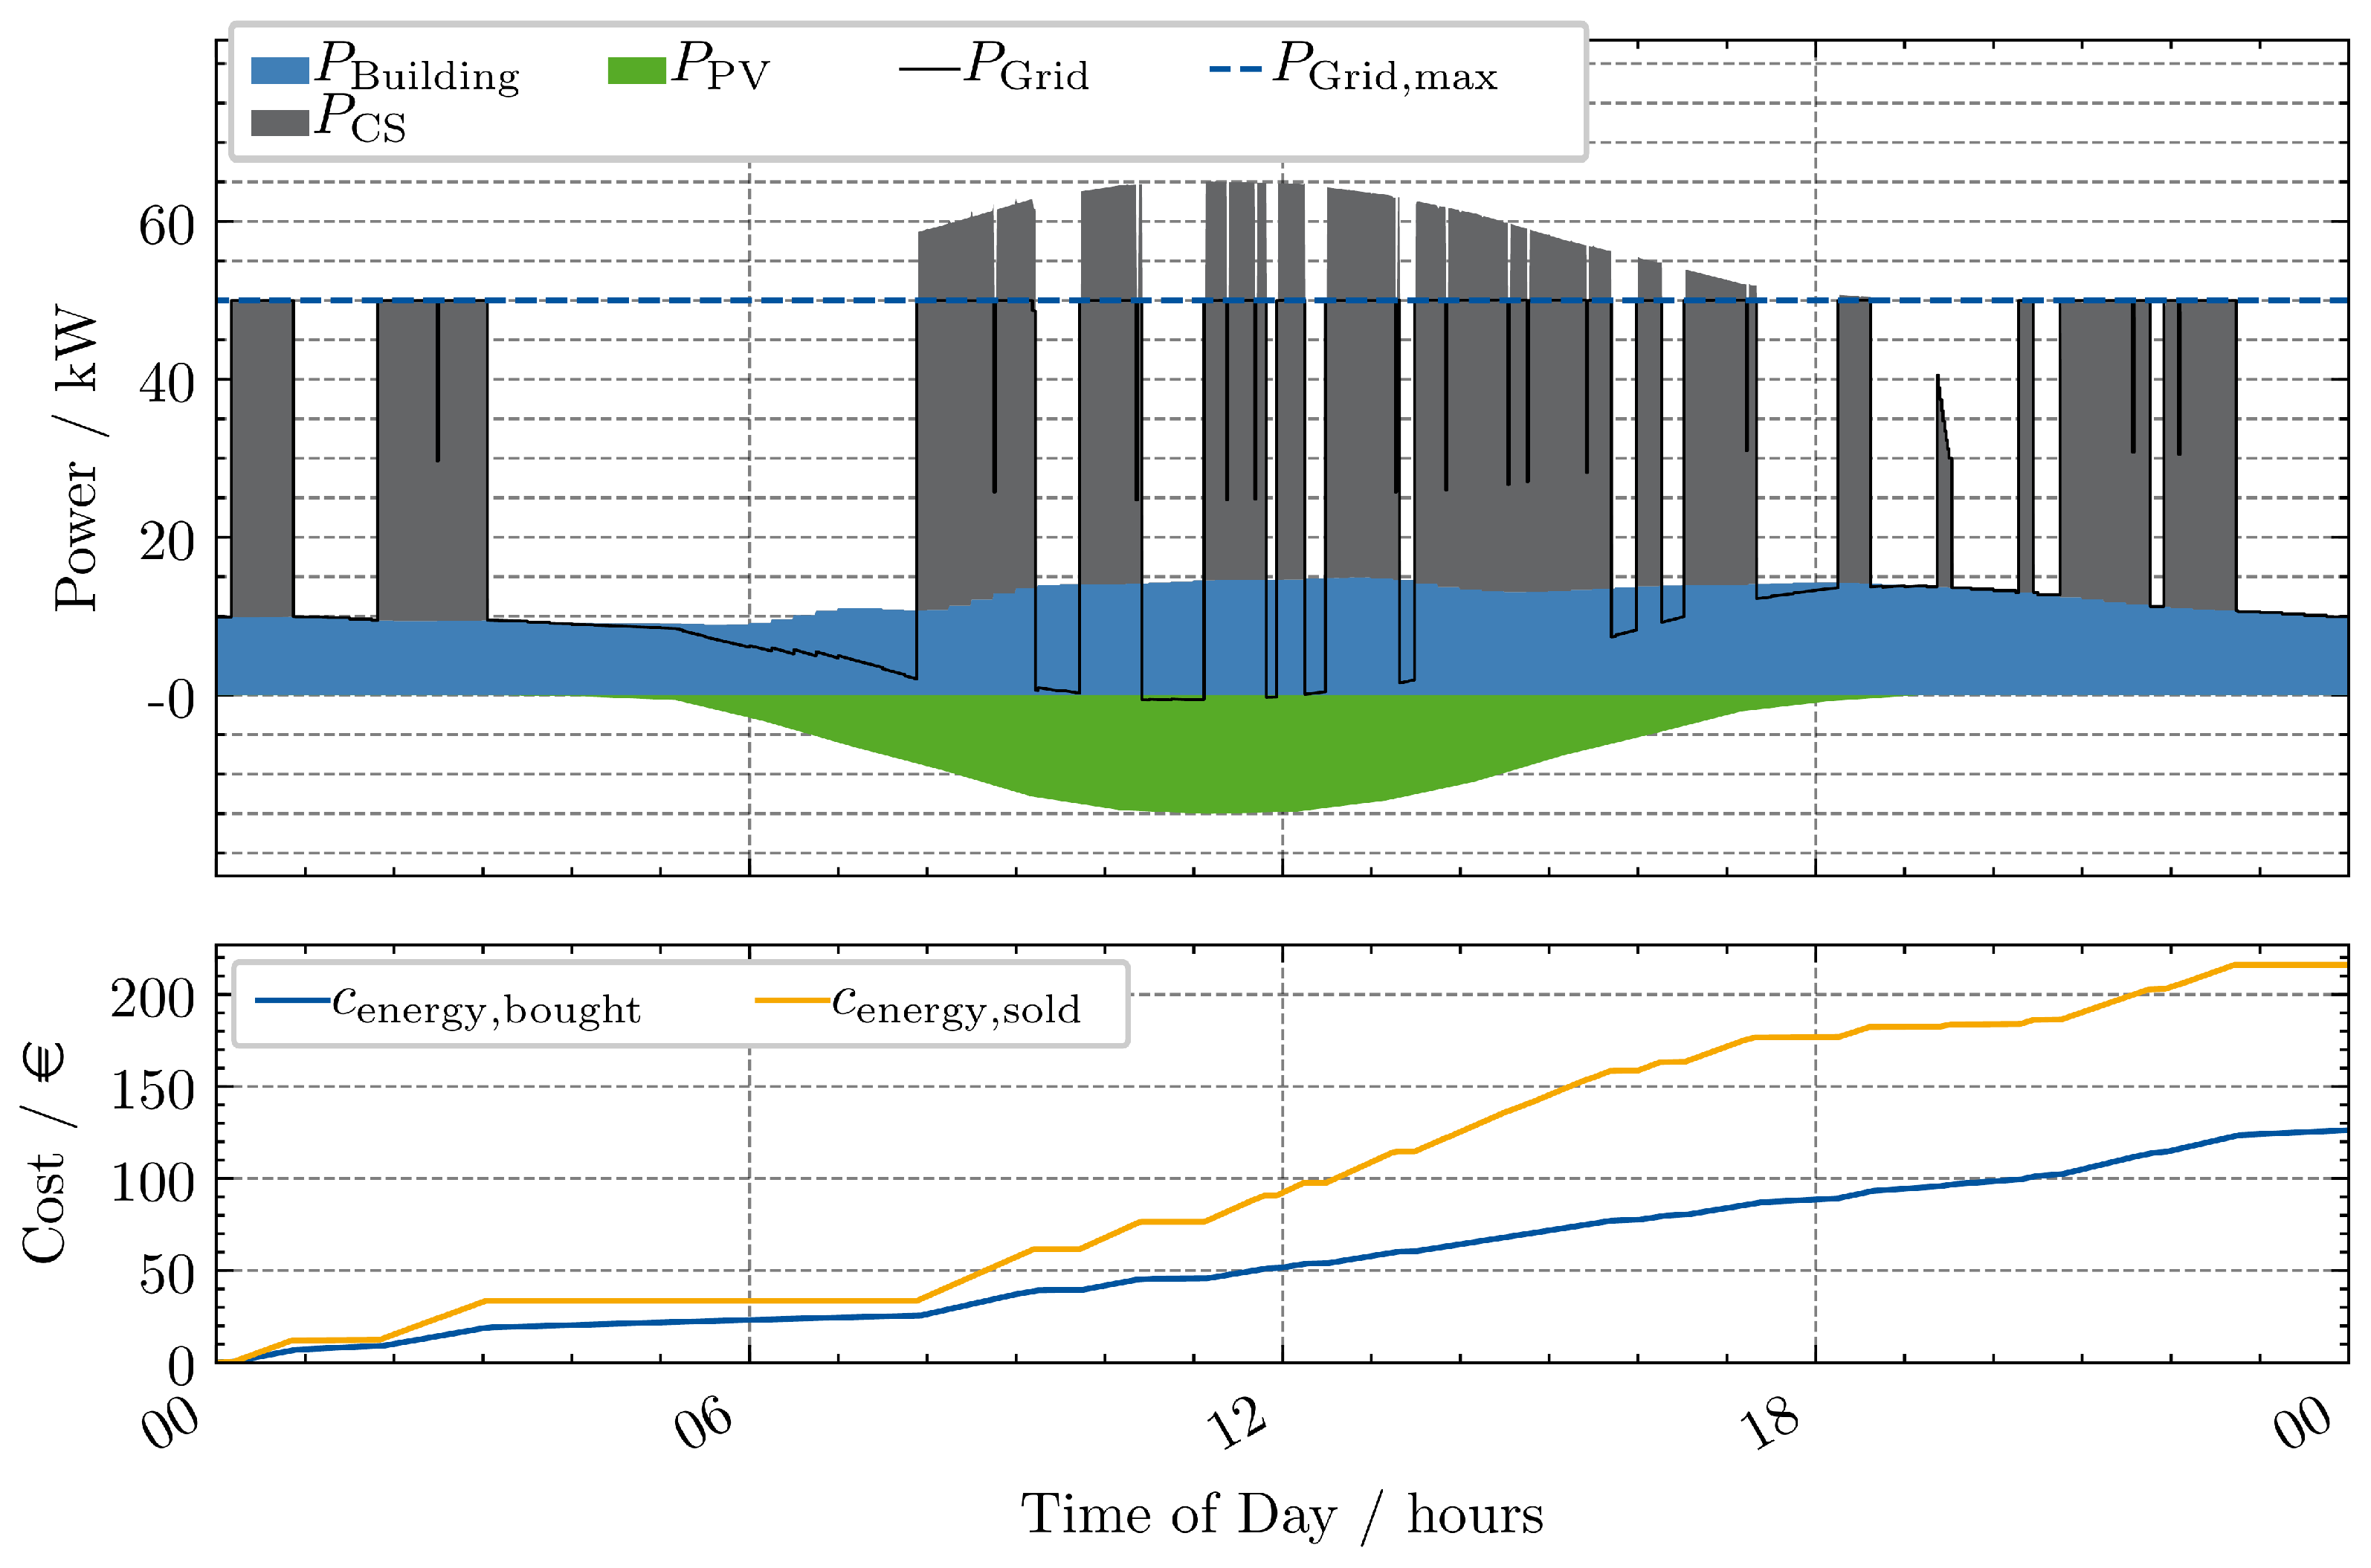
3.4. Scenario 4
Scenario 4 and the following introduce a power limit
. In practice, the grid connection is frequently insufficient, to handle the maximum charging power of all CSs installed in combination with the building load. Hence, charging management solutions, which curtail the CS power are used. This is simulated within Scenario 4 and the results are shown in
Figure 9.
As depicted in the upper graph, the power limit is effective in reducing the peak load. In cases where the power limit is reached, the charging power of all CSs is equally reduced. As a result profit is reduced significantly compared to Scenario 1, but still exceeds the profit of Scenario 3.
3.5. Scenario 5
Scenario 5 introduces a power limit
to the setup from Scenario 3. The resulting power, cost, and SoC trajectories are shown in
Figure 10.
The power limit is effective in reducing the peak load. This is also visible in the SoC trajectories of the GINIs. For example, at 10:00 the GINIs are not able to charge with full power, as the power limit is reached, resulting in a more flat increase in SoC for GINI 1. Interestingly, the profit stays quite stable compared to Scenario 3.
The lower sensitivity to a maximum grid power limit can be explained with the temporal seperated recharging and charging of EVs and the starting SoC of 100% for the GINIs.
A limitation that can be observed is that there are times where the power limit is not reached, but the GINIs are not recharging. This is due to the simple rule-based control strategy. This can for example be observed in the afternoon after 15:00.
Figure 10.
Scenario 5: Two fast chargers, three GINIs and grid limitation; Profit €76.50 (Cost: €89.72-Revenue: €166.21).
Figure 10.
Scenario 5: Two fast chargers, three GINIs and grid limitation; Profit €76.50 (Cost: €89.72-Revenue: €166.21).
3.6. Scenario 6
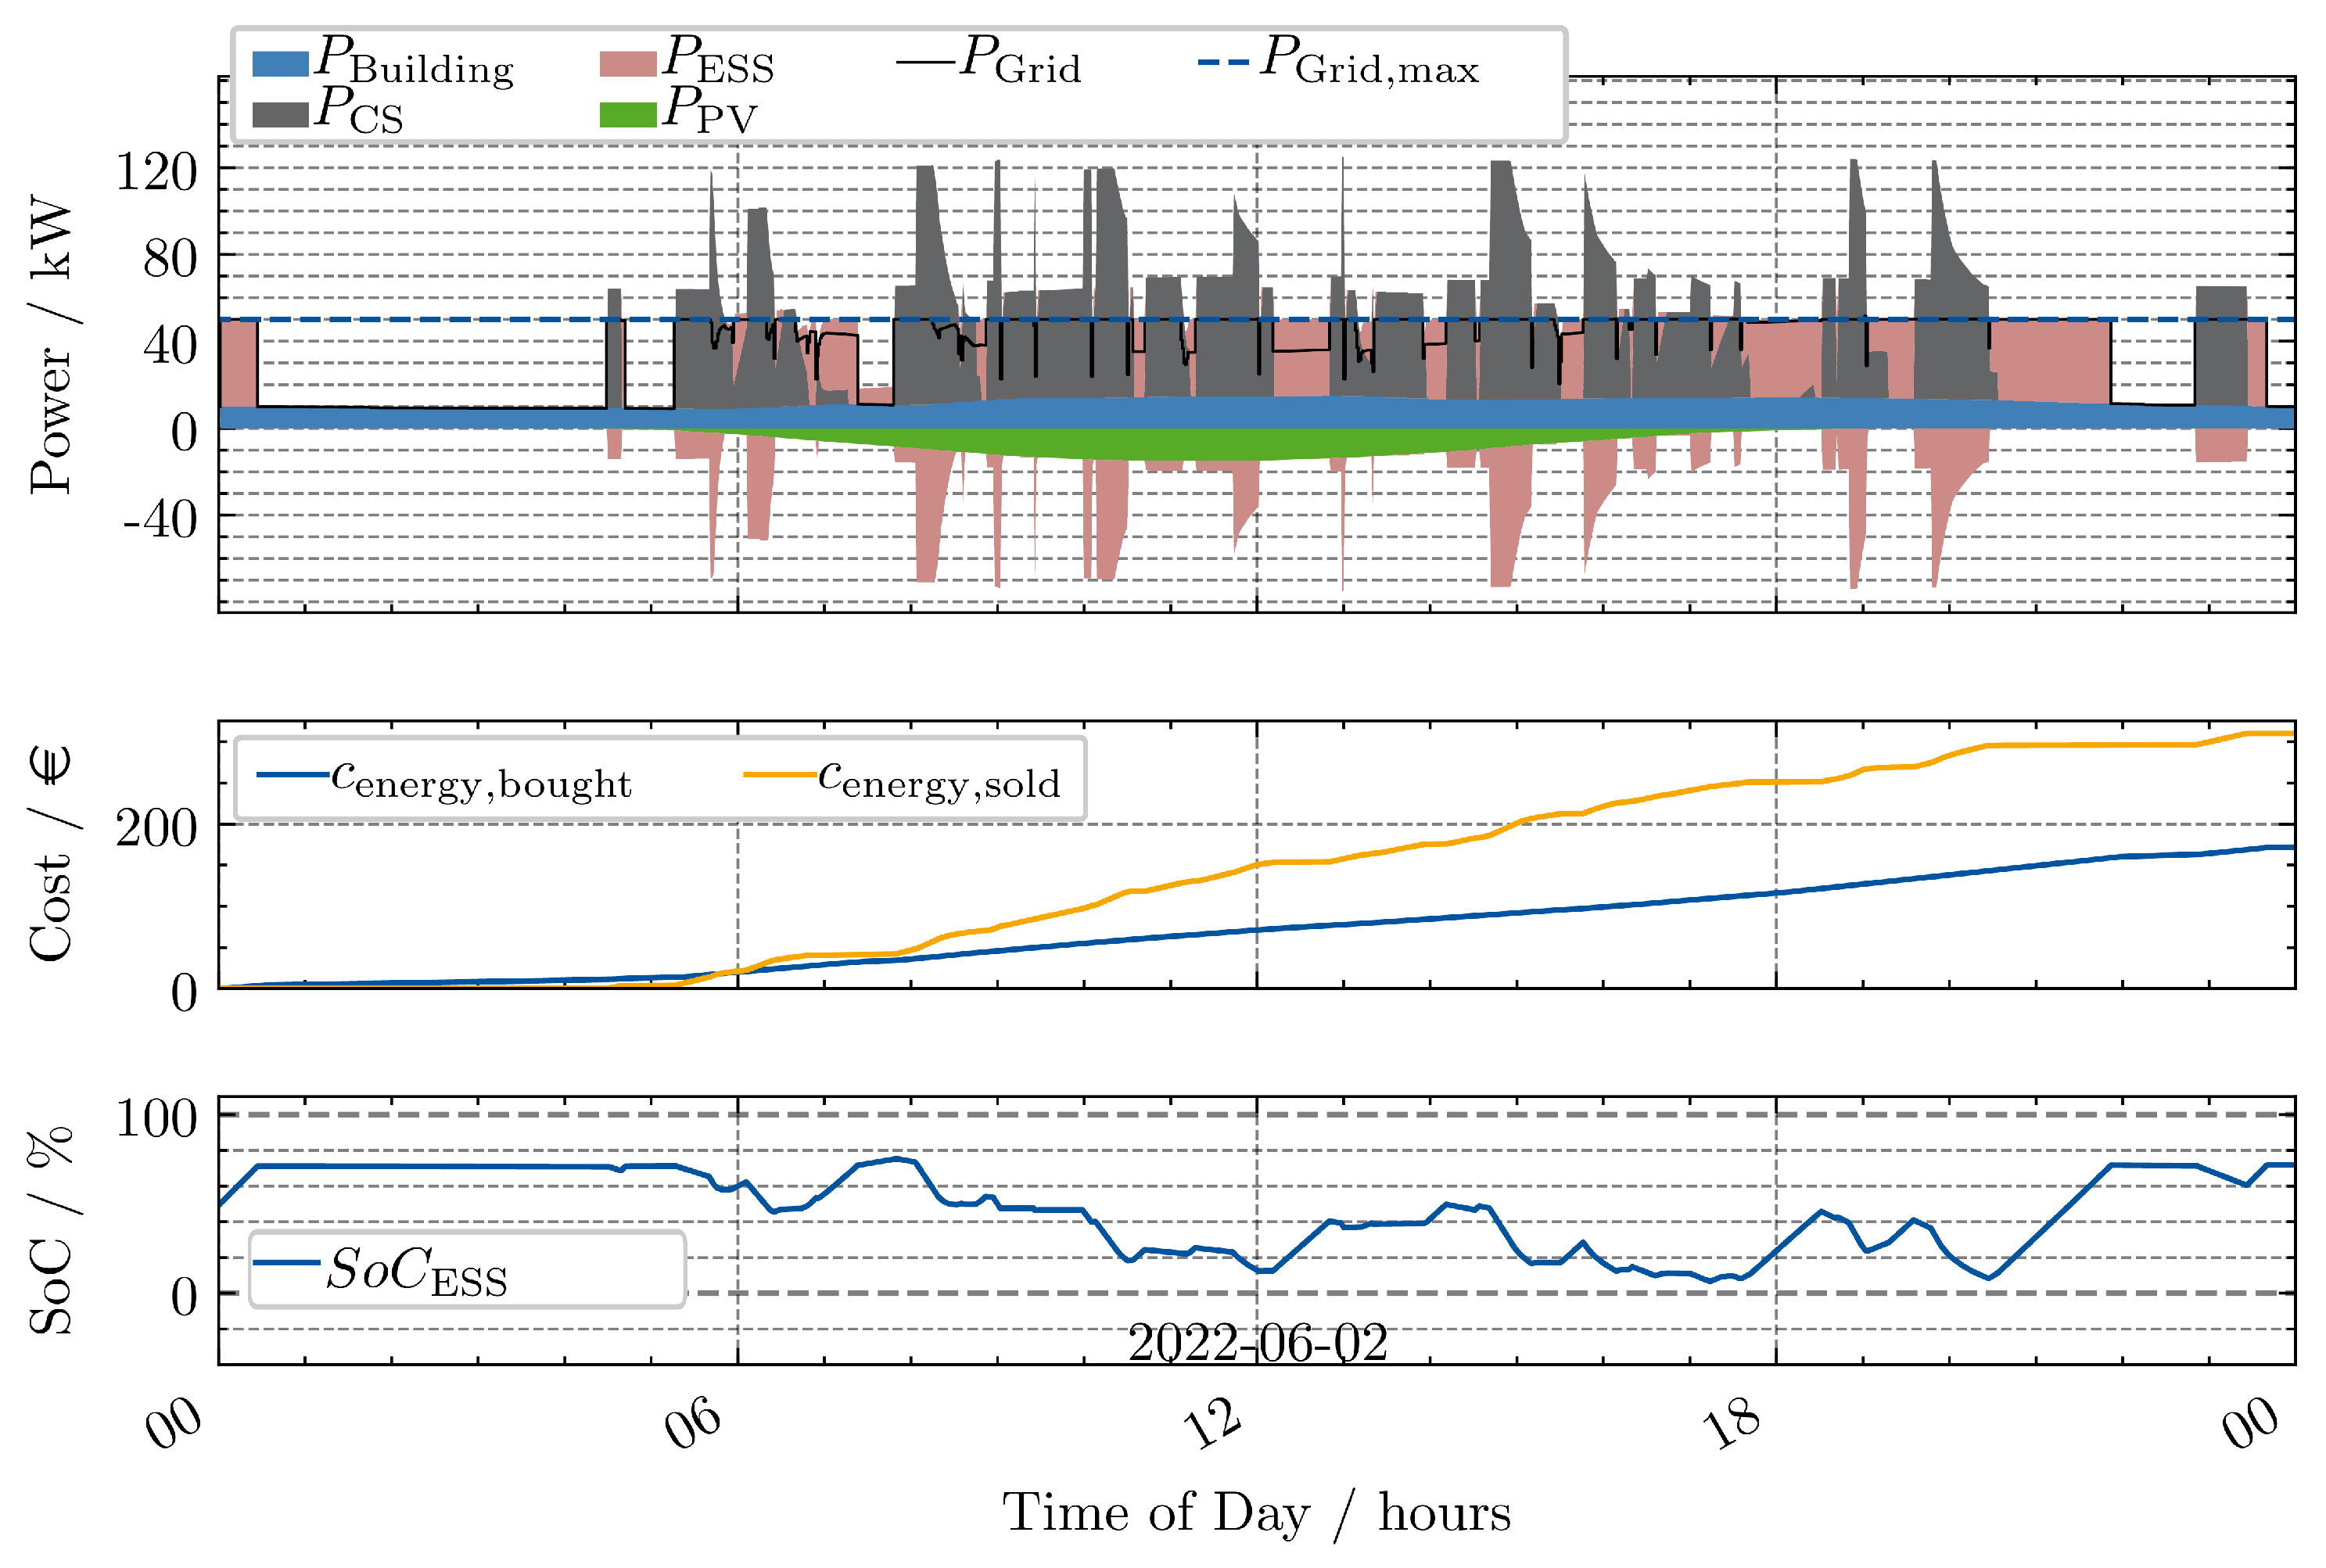
While with a load management system it is ensured that the power limit of the grid connection is not exceeded, the installation of a BESS can support high power charging in peak times, if the storage is recharged in off-peak times. Scenario 6 introduces a BESS with a capacity of 80 kWh to the setup from Scenario 5. The resulting power, cost, and SoC trajectories are shown in
Figure 11.
In addition to the previous scenarios, is shown in the top graph. Discharging of the BESS is depicted in the negative part of the y-axis and charging in the positive. The BESS has an SoC of 50% at the beginning of the simulation run. During the first couple of minutes, the BESS charges with the maximum permissible power to not exceed the grid limit. The BESS only charges to 70% due to the configured thresholds for the different operating strategies. Similar behaviourcan be observed at the end of the day, after 20:00. Throughout the day, the BESS mainly charges during times, where no EVs are charging, e.g., at 12:15, or 17:45. The BESS allows for higher charging power by discharging during times, where the grid power is already high, e.g., at 10:00.
3.7. Comparison Single-Day Simulations
Table 5 summarises the key operational results for all simulated scenarios over a single day. Scenario 1 achieves the highest profit, driven by unconstrained access to grid power and fast charging capabilities. In contrast, Scenario 2 yields the lowest profit due to the limited charging power of the 11 kW chargers, which significantly reduces the number of EVs that can be serviced by the GINIs.
The addition of fast chargers in Scenario 3 improves GINI utilisation and profit compared to Scenario 2, though the logistical overhead and limited battery capacity of the GINIs still constrain performance relative to stationary CSs. Introducing a 50 kW grid constraint in Scenario 4 reduces profit compared to Scenario 1 but remains higher than GINI-based setups, highlighting the impact of power availability on throughput and revenue.
Scenario 5, which combines GINIs and a grid constraint, achieves a profit similar to Scenario 3, indicating that the GINIs’ temporal flexibility can partially mitigate grid limitations. Scenario 6 demonstrates that integrating a BESS allows for substantial profit recovery despite the grid constraint, nearly closing the gap to the unconstrained Scenario 1.
Overall, the comparison underscores the importance of available charging power. Although, the results indicate that a BESS can help maintaining high operational margins, with less available power at the grid connection point. GINI-based systems offer flexibility but require careful coordination and likely benefit from larger battery capacities or optimised dispatch strategies to reach their full potential.
3.8. Seasonal Analysis
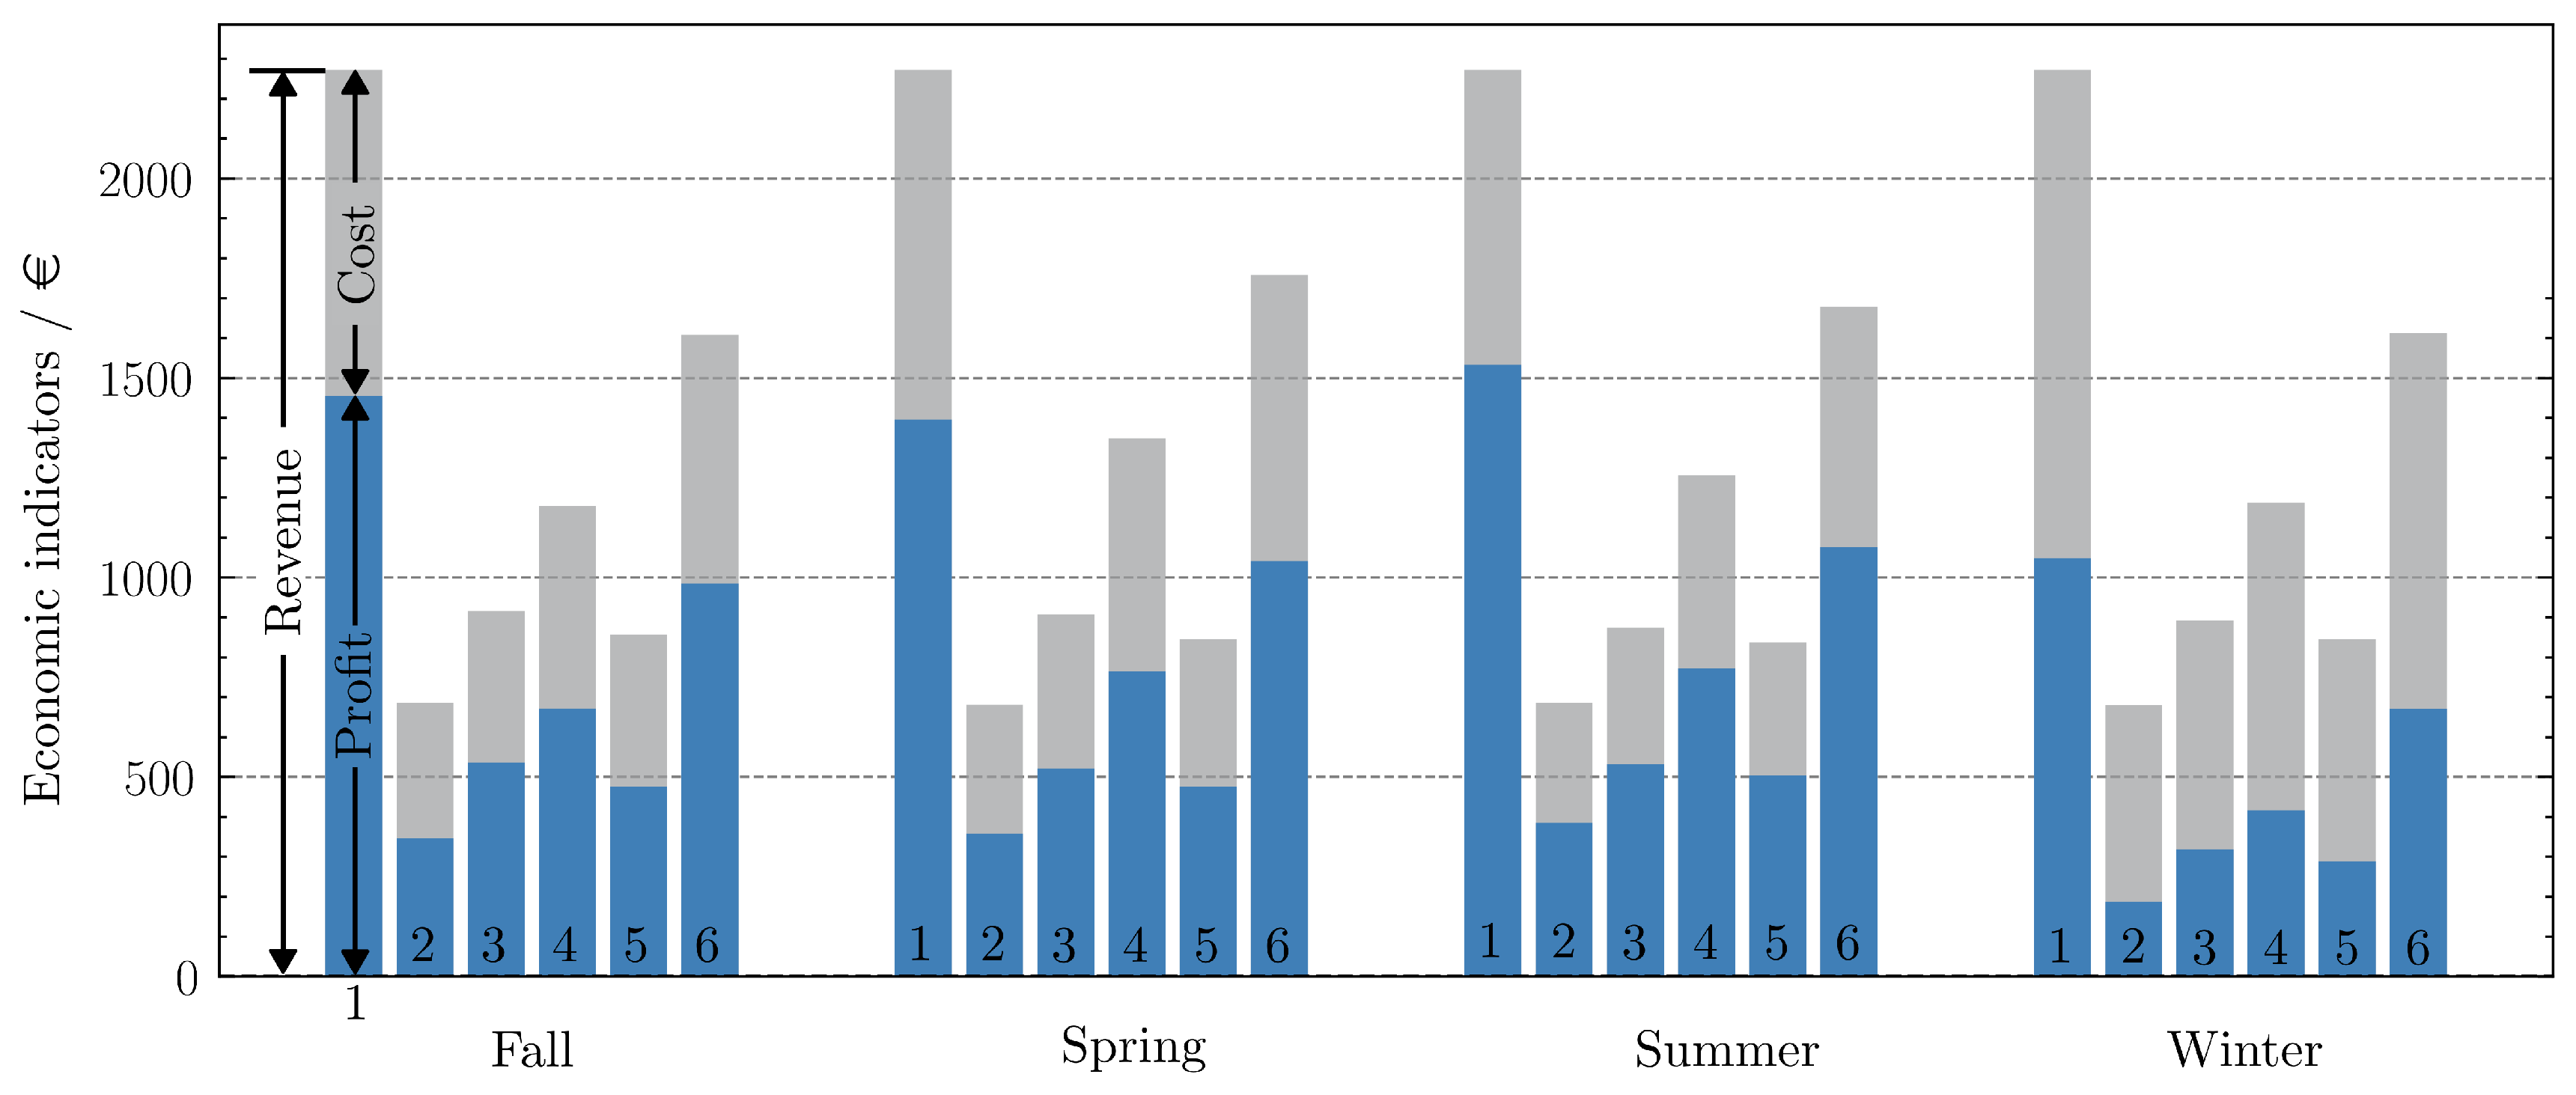
While the previous results primarily served to illustrate the capabilities of the simulation environment under specific daily conditions, this section aims to assess the sensitivity of different charging point layout scenarios to seasonal variations. To this end, the marginal operational profit is analysed over four representative weeks, one for each season of the year. The same EV arrival scheme is used across all runs to ensure comparability. The time frames selected for each season are as follows:
Winter: 2023-01-19 00:00 to 2023-01-25 24:00
Spring: 2023-04-03 00:00 to 2023-04-09 24:00
Summer: 2023-08-14 00:00 to 2023-08-20 24:00
Fall: 2023-10-16 00:00 to 2023-10-22 24:00
Overall, the ranking of profit across the scenarios remains consistent across all seasons. Scenario 1 yields the highest profit, followed by scenarios 6 and 4. Scenarios 3, 5, and 2 show the lowest profits, with scenario 2 performing significantly worse due to the limited charging power of its charging stations (CSs). Notably, the overall revenue from EV charging in scenario 1 remains constant across all seasons. This results from the use of a fixed EV model in all simulations, with consistent EV-specific parameters, arrival times, and dwell durations.
The high profit in scenario 1 is primarily attributed to the high charging power available at the CSs and the absence of a grid connection constraint requiring peak shaving. Among all 24 runs, the summer scenario of scenario 1 achieves the highest profit, exceeding €1500. When a weaker grid connection is introduced in scenario 4, profit decreases significantly across all seasons. The addition of a BESS in scenario 6 improves profitability compared to scenario 4, although it does not match the profit levels of scenario 1 without grid constraints. This observation is in accordance with the findings from the single-day simulations.
Figure 12.
Seasonal comparison of marginal operational profit across all charging point layout scenarios.
Figure 12.
Seasonal comparison of marginal operational profit across all charging point layout scenarios.
As observed in single-day simulations, adding a grid constraint in the scenario with GINIs and fast chargers (scenario 5, based on scenario 3) does not lead to a significant profit reduction. This can be explained by the flexibility of the GINIs, which can recharge at times when grid power availability is higher and thus are less impacted by peak limitations. While the GINI-based scenarios (3 and 5) offer greater flexibility, their overall revenue remains lower compared to scenarios with stationary CSs. This can be attributed to two main factors:
the operational overhead of recharging and moving the GINIs, which can be significant, especially in larger parking areas.
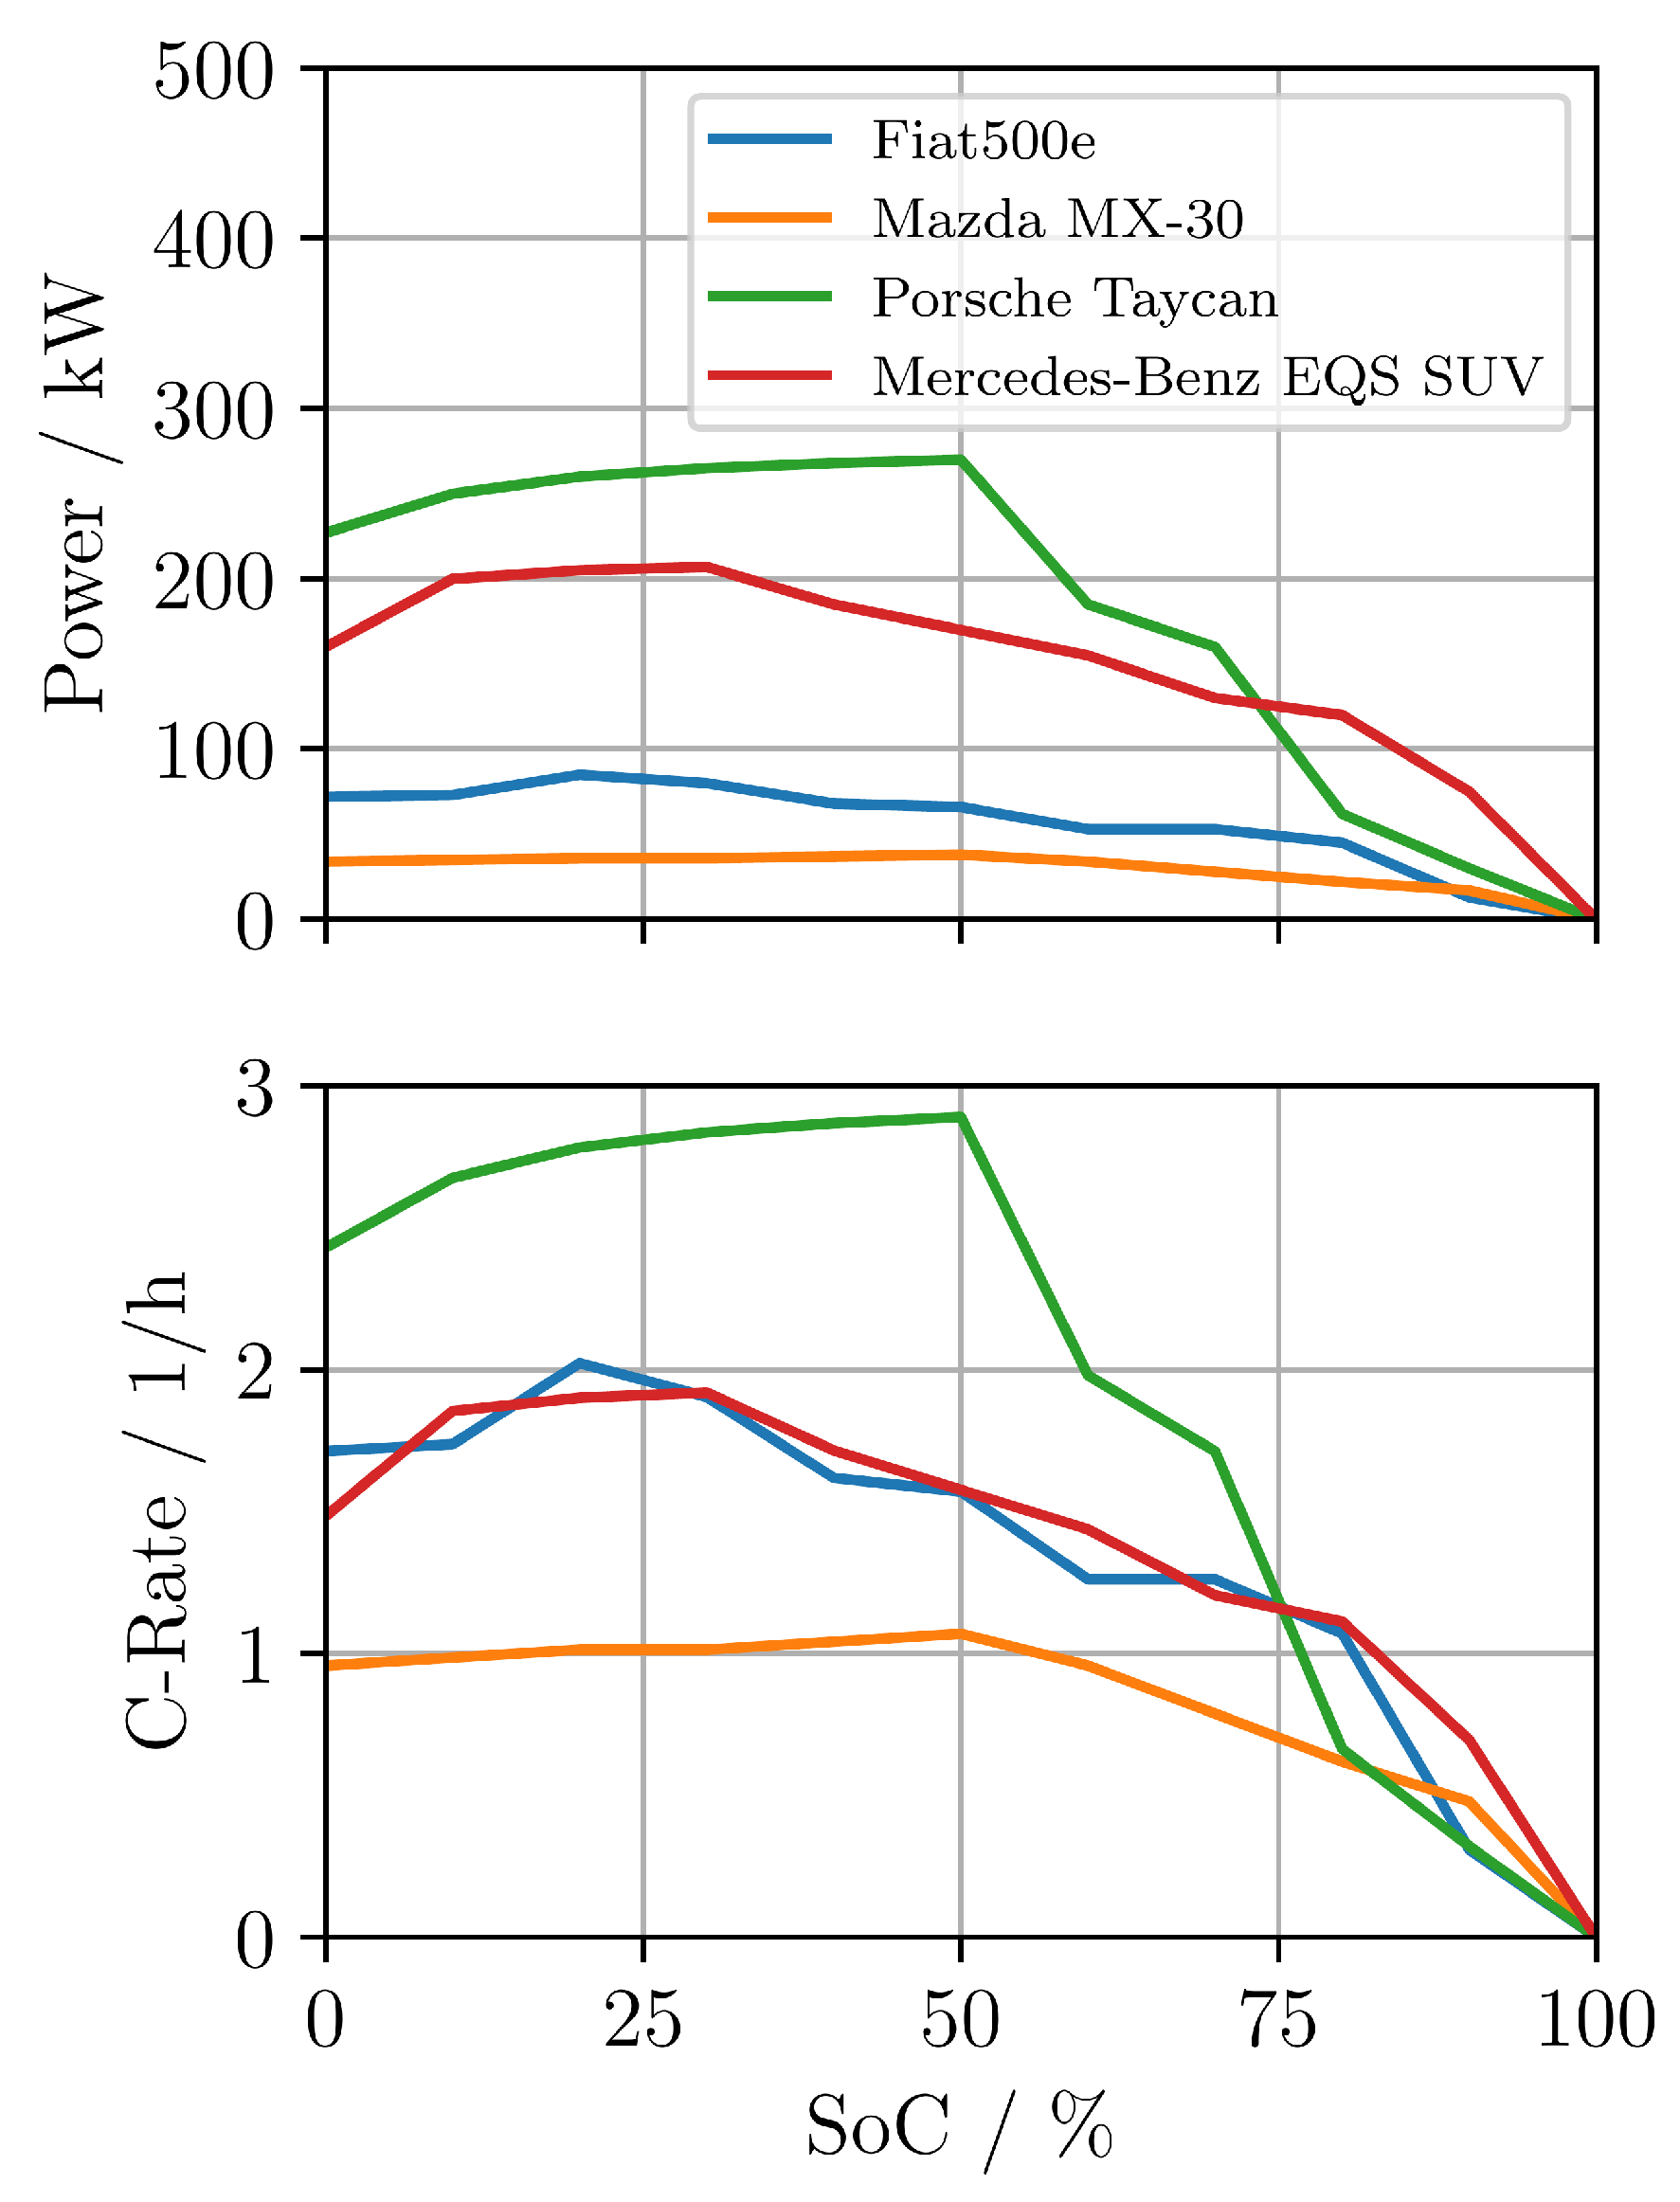
the comparably small battery capacity of the GINIs, which not only limits the number of EVs that can be serviced before recharging but also results to lower charging power as the power capability depends on the C-rate and hence the battery capacity.
4. Discussion
In the preceding
Section 3, the capability of the presented simulation framework to analyze different charging scenarios has been demonstrated. The findings are discussed in this section. Special attention is paid to the integration of mobile charging robots (GINIs) into the charging locations. Further, the limitations and possible extensions to the simulation model and the performed study are presented. Lastly, the practical implications of the results are discussed and the impact of capital costs is highlighted.
4.1. Discussion of Results
In general, reducing the maximum grid power limit leads to a decrease in profit. As this is expected, the main focus is on how different charging concepts can mitigate this disadvantage. Under the highlighted scenarios with grid limitation, Scenario 6 shows the most promising results by integrating a BESS. The decrease in profit is significantly lower compared to the scenarios with GINIs and the one only with CSs. This is due to the BESS being able to store energy during off-peak times and discharge it during peak times. This allows for higher charging power during peak times, while still not exceeding the grid limit. While the GINIs have the theoretical potential to store energy during off-peak times and discharge it during peak times, the results demonstrate that, in the given configuration, they are unable to fully exploit this potential. The causes of this include an operating strategy that is not optimal, a battery energy capacity that necessitates numerous recharging sessions during the day, and a comparably large parking area that causes long travelling durations. It is encouraging to note that the profit margin with GINIs remains stable despite the grid limit (compare
Section 3.3 and
Section 3.5).
In general, maintaining a low level of power consumption from the main grid is crucial for grid stability. This is particularly important in scenarios where grid expansion cannot keep up with the increasing number of EVs, as described by the European Network of Transmission System Operators for Electricity [
59].
4.2. Model Limitations and Possible Extensions
With regard to the limitations of the simulation framework, several simplifying assumptions should be explicitly acknowledged. Most notably, the energy selling price is fixed at €0.50 per kWh across all scenarios, while the purchase price varies dynamically based on day-ahead electricity market data. This fixed pricing strategy does not account for time-of-use tariffs or user-specific pricing models, which could significantly affect revenue.
Additionally, the model does not incorporate the effects of temperature on battery performance and charging efficiency. These factors can significantly influence the operational performance of BESS, GINIs, and EVs. Particularly extreme temperatures can lead to lower charging power and increased auxiliary consumption for cooling or heating the battery system. The incorporation of a temperature-dependent behaviour into the battery model has the potential to enhance the relevance of the simulation model, particularly in regions and seasons characterised by extreme temperature conditions. Therefore, future work should consider integrating temperature effects into the simulation framework.
Furthermore, the simulation excludes capital expenditures and operational costs, such as investment, maintenance, and battery degradation. Hence, it only focuses on operational margins not a full techno-economic study.
In
Section 2.1.3, we assume that all charging losses occur at the CS, abstracting from whether AC or DC charging is used. This simplification facilitates an efficient and generalizable energy flow model between CS and EV. However, it does not capture the nuanced loss mechanisms of different charging technologies. As part of future work, this assumption could be revisited through a sensitivity analysis using more detailed, mode-specific efficiency models. If significant sensitivity to charging mode or power level is observed, extending the current map-based model to include differentiated loss models may improve accuracy.
With regard to profit optimisation, especially regarding BESS and GINI scenarios, considering the dynamic price more explicitly or investigating electricity market products such as demand side management or frequency balancing is another field that could be explored based on the simulation framework.
4.3. Practical Implications
The analysis suggests that GINIs could become economically viable in situations where flexible charging is required but grid expansion is infeasible or prohibitively expensive. For instance, GINIs may provide value at locations with high EV turnover, spatially distributed charging needs, and limited grid access. However, profitability depends heavily on efficient routing and charging strategies. It has been shown that with the battery configuration used in the first prototypes (35 kWh and maximum of roughly 1.5 C), the operational margins fall behind other concepts.
Optimised battery sizing appears critical. Larger batteries may reduce the need for frequent recharging trips and allow faster recharging of GINIs themselves as well as EVs. In Germany, in public charging sessions, the average amount of energy charged can be estimated to around 20 kWh for AC charging and 40 kWh for DC charging [
57]. Hence, integrating batteries with a capacity of 80 kWh or more could be beneficial and guarantee multiple charging sessions before the GINI needs to recharge. Furthermore, a larger battery would allow for higher charging power at the same C-rate. With high performance battery systems with adequate cooling, even higher C-rates could allow for even more profitable operation, but with increased capital cost.
4.4. Impact of Capital Costs
Although a techno-economic analysis is beyond the scope of this work, some qualitative conclusions can be drawn. As demonstrated in the report by Wessel et al. [
3], the architecture of a mobile charging robot is intricate and sophisticated, necessitating substantial investment. High CAPEX associated with GINIs due to high performance battery systems and demanding robotic functions might offset operational profits unless high utilisation rates or additional revenue streams (e.g., grid services) are achieved. Further, sophisticated operating strategies and adequate battery sizing, as discussed in the previous section, are essential. In contrast, expansion of conventional charging infrastructure may require costly grid enhancements. Similarly, the installation of BESS necessitates a substantial initial investment. Depending on the circumstances, numerous fast chargers may be required to meet user expectations. The central question is whether the multiplicative capabilities of mobile charging robots (sequential EV charging and staggered recharging at shared stations) can economically justify their higher investment costs compared to a system based on BESS and multiple fast chargers.
In order to provide a rigorous response to this question, future research should incorporate techno-economic modelling approaches such as net present value (NPV), total cost of ownership (TCO) analysis, and scenario-based sensitivity studies. The utilisation of these tools would facilitate the quantification of trade-offs between capital investment, operational performance, and long-term cost efficiency, thereby supporting evidence-based investment decisions.


