Abstract
The increasing demand for the real-time monitoring of engine oil quality has driven the development of novel diagnostic methods. Traditional techniques primarily rely on physicochemical assessments, which, while effective, are often time consuming and require specialized laboratory equipment. This study explores the feasibility of using electrical property measurements to assess engine oil quality, offering a potential alternative for rapid, cost-effective diagnostics. A proprietary measurement system utilizing two innovative sensors—rectangular and concentric—was employed to evaluate the electrical characteristics of five commercially available synthetic engine oils. Key parameters, including impedance (|Z|), phase shift angle (θ), conductance (G), susceptance (B), parallel equivalent capacitance (Cp), and quality factor (Q), were measured across a frequency range of 100 Hz to 1.2 MHz. These results were correlated with conventional physicochemical parameters, specifically viscosity and infrared spectroscopy data, to determine the reliability and accuracy of electrical diagnostics in assessing oil degradation and quality variations. The findings indicate a correlation between selected electrical parameters and traditional laboratory measurements, particularly within the 1 kHz to 10 kHz frequency range, where the measurement repeatability was the highest. The study also identifies key challenges associated with sensor sensitivity to environmental factors and provides insights into optimizing the measurement process. The results contribute to the ongoing development of alternative, real-time oil condition monitoring techniques, potentially improving the reliability of automotive and industrial lubrication systems.
1. Introduction
The real-time monitoring of engine oil quality has become increasingly important due to stringent demands in industrial maintenance, operational efficiency, and environmental sustainability. Lubricants not only reduce friction and wear but also serve as vital diagnostic mediums by reflecting the operational status and degradation of machinery components [1,2,3]. Traditional approaches to oil condition assessment rely heavily on laboratory-based methods such as FTIR spectroscopy, viscosity analysis, and elemental composition via spectrometry [4,5]. While these techniques provide robust and well-established information, they are time-consuming, costly, and impractical for continuous, in situ monitoring.
Recent advances in sensor technologies have led to the development of online diagnostic systems capable of evaluating various oil characteristics in real time. Among the most promising are impedance spectroscopy-based sensors, which can assess changes in oil chemistry and structure without sample preparation [6,7,8,9]. Conductometric sensors [10], capacitive configurations [11], microacoustic resonators [12], microwave cavity resonators [13], and triboelectric or electrostatic detectors [14,15] have all been proposed as complementary techniques to monitor the degradation, contamination, and remaining useful life of engine oils.
For instance, Soleimani et al. (2014) demonstrated the utility of impedance spectroscopy in detecting base oil oxidation and correlating it with viscosity and acid number [8]. Similarly, Latif and Dickert (2011) explored conductometric polymer-based sensors for tracking acidic degradation products in used oils [9,16]. These findings are echoed by Heredia-Cancino et al. (2020), who designed a permittivity sensor using recycled aluminum, validating its readings against FTIR data [7,17]. Moreover, advanced data analytics, such as artificial neural networks and fuzzy logic, have been applied to enhance the interpretability and reliability of sensor data for lubricant quality assessment [18,19,20].
Additional progress includes the use of inductive [21] and impedance debris sensors, as shown by Zhang et al. (2022), Ma et al. (2020), and Wu et al. (2021), to detect metallic wear particles based on their size, material, and frequency response [10,17,22,23]. Other studies, such as those by Du et al. (2015) and Sun (2021), highlight the use of on-board sensors for aging detection using permittivity and viscosity as key indicators, while Pourramezan et al. (2023) explored the application of soft computing models—particularly machine learning algorithms—for predictive estimation of lubricant viscosity based on multi-parameter oil analysis [24,25,26]. Furthermore, interdisciplinary methods integrating machine learning [1], dielectric spectroscopy [2], and impedance-based moisture detection (Macioszek et al., 2019) [4] have collectively expanded the capabilities of condition monitoring systems.
Despite this progress, a persistent challenge remains: correlating these electrical and dielectric parameters with standard physicochemical properties such as viscosity, oxidation level, and additive composition. Only a limited number of studies, such as those by Delgado et al. (2015) [27] and Soleimani et al. (2014) [8], directly attempt to bridge this gap. Furthermore, the majority of sensor applications focus on detecting degradation in used oils, often neglecting the equally important classification and assessment of fresh oils of varying chemical composition and performance class [28,29,30].
In the present study, the possibility of using electrical parameters for diagnosing engine oil quality was evaluated. To this end, a custom-built measurement system and two innovative sensors—rectangular and concentric—were employed. Five synthetic engine oils were analyzed by measuring a range of electrical properties, including, among others, impedance modulus (|Z|), phase shift angle (θ), conductance (G), susceptance (B), parallel equivalent capacitance (Cp), and quality factor (Q), across a broad frequency range from 100 Hz to 1.2 MHz.
In contrast to conventional dielectric spectroscopy, which typically centers on complex permittivity and requires high-frequency instrumentation, the proposed approach captures a broader spectrum of electrical responses—both resistive and capacitive—across a moderate frequency range. This enhances diagnostic sensitivity to polar additives and oxidation by-products while remaining feasible for in situ deployment. Notably, impedance spectroscopy has been shown to effectively detect oxidation-related changes and polar molecule formation, even at relatively low frequencies, owing to its sensitivity to both real and imaginary components of permittivity [31]. Furthermore, triboelectric sensors, though promising for dynamic systems, are less effective for fresh oil characterization due to their low signal levels and susceptibility to noise and flow conditions [32]. Compared to these approaches, the present method offers a more balanced compromise between measurement repeatability, equipment simplicity, and correlation with standard oil quality indicators, thereby reinforcing its potential for practical real-time monitoring.
Building upon the above findings, this study introduces a holistic correlation framework that links electrical responses to standard rheological and FTIR spectral characteristics. By analyzing fresh, compositionally diverse oils—rather than degraded samples alone—it addresses the often-overlooked variability introduced by additives, base stock types, and viscosity classes. The inclusion of both resistive and capacitive sensor configurations further enhances the reliability of measurements, especially in the diagnostically stable 1 kHz to 10 kHz frequency range. The results provide new insight into the sensitivity of specific electrical parameters to chemical group presence (e.g., esters, phosphates), molecular polarity, and viscosity behavior.
Altogether, this integrated approach aims to advance the real-time, in situ oil monitoring toward a predictive and classification-oriented methodology, which is potentially applicable to embedded automotive systems, industrial machinery, and marine diagnostics.
2. Materials and Methods
2.1. Research Material
The study included five synthetic engine oils sourced from a single distributor. Among the analyzed products were oils from European brands—TotalEnergies SE (Courbevoie, France) and Motul S.A. (Aubervilliers, France)—as well as from Polish manufacturers—ORLEN Oil Sp. z o.o. (Gdańsk, Poland) and Flukar Sp. z o.o. (Katowice, Poland), the latter producing the Revline brand. The tested oils were divided into two groups based on base oil composition: synthetic (Total, Motul 5W30, Motul 0W30) and hydrocracked (HC) oils (Orlen, Revline). Despite four of the five oils belonging to the same SAE viscosity grade (5W30), considerable variation was observed in the dynamic viscosity and viscosity index, which could influence their electrical properties. Notably, Motul 0W30 exhibited the lowest dynamic viscosity and the highest viscosity index (186), indicating greater thermal stability across a broad temperature range.
In terms of quality classifications, the oils were also categorized according to ACEA standards: Total, Orlen, and Revline were rated C3, indicating compatibility with engines equipped with diesel particulate filters (DPFs), while both Motul oils were rated A5/B5 and designed for low-viscosity, fuel-efficient engines. Differences were also found in API classifications: Total was rated SM/CF, Orlen and Revline were classified as SN, and both Motul oils had the lower SL/CF rating. The diversity of the tested oils in terms of base oil type was a key selection criterion, as it directly affects the dielectric behavior and electrical conductivity of the lubricants. This division was further complemented by differences in the total base number (TBN)—with Motul oils exhibiting the highest values (10.2 and 10.1 mg KOH/g), indicating greater capacity for neutralizing acidic combustion by-products, while Total showed the lowest value (7 mg KOH/g).
Significant variation was also noted in flash point temperature, which reflects oil resistance to oxidation and evaporation. Orlen demonstrated the highest thermal stability (240 °C), whereas Revline had the lowest (220 °C). At 100 °C, the kinematic viscosities of Total, Orlen, and Revline were similar (approximately 12 mm2/s), while both Motul oils exhibited lower values (10.1 and 10.4 mm2/s), suggesting reduced internal resistance and improved energy efficiency. This approach to oil selection enabled an evaluation of which physicochemical properties are most relevant to electrical behavior and how differences in base oil type, TBN, or viscosity influence the suitability of oils for alternative diagnostic methods (Table 1).

Table 1.
Oil manufacturer datasheet.
2.2. Research Methodology
The electrical parameters of the tested engine oils were measured over a frequency range from 100 Hz to 1.2 MHz using an alternating voltage of 200 mV. The measurements were carried out using a precision LCR meter (model E4980A, Agilent, Colorado Springs, CO, USA) and two custom-designed sensors developed at the University of Warmia and Mazury in Olsztyn—currently the only research institution in Poland (and one of the few globally) systematically exploring the diagnostic potential of electrical properties for assessing the quality and technical authenticity of materials, particularly fluids. Prior to testing, line compensation was applied, the measuring cell was electrically profiled, and the selected test frequencies were based on preliminary studies and the capabilities of the measuring system. Cable compensation (for 1 m leads connecting the LCR meter to the test cells) was performed using the internal function of the instrument.
The capacitance of the cell was estimated based on its physical dimensions (94 × 24.5 × 8 mm), yielding a value of approximately 2.6 pF. The sample volume required for each test was around 180 cm3, and measurements were performed at approximately 20 °C. Following several preliminary measurement series and taking into account the accuracy of the E4980A meter, the final frequencies selected for analysis were 100 Hz, 200 Hz, 300 Hz, 400 Hz, 500 Hz, 1 kHz, 2 kHz, 3 kHz, 4 kHz, 5 kHz, 10 kHz, 15 kHz, 100 kHz, 500 kHz, and 1.2 MHz.
The following electrical parameters were analyzed: impedance modulus (|Z|), phase shift angle (θ), conductance (G), susceptance (B), resistance (R), reactance (X), parallel equivalent capacitance (Cp), series equivalent capacitance (Cs), parallel equivalent resistance (Rp), series equivalent resistance (Rs), loss angle tangent (tg δ), and quality factor (Q). The frequency response characteristics for all five tested oils were presented for each parameter. The values reflect the average of two consistent readings with a deviation not exceeding 1%; measurements exceeding this threshold were excluded. To avoid electrolysis and polarization effects at the oil–electrode interface, all tests were conducted at frequencies above 100 Hz. The influence of the electrical double-layer phenomenon at the electrode–fluid interface was assumed to be negligible and was not considered significant for the study’s objectives.
The engine oil samples were poured into glass containers (measuring cells) equipped with two parallel plate electrodes. The electrodes, made of acid-resistant stainless steel, were mounted in tight contact with the opposing larger internal walls of each container. The prepared samples were then transferred to a climatic chamber (Memmert ICP 500, GmbH + Co. KG, D-91126 Schwabach, Germany). After reaching the target temperature of 20 ± 0.1 °C, the containers were placed inside a metal bath vessel with a water jacket connected to a thermostat (PolyScience, Niles, IL, USA) to prevent any uncontrolled fluctuations in sample temperature. Subsequently, the electrical conductivity and capacitance parameters mentioned above were measured using the test system illustrated in Figure 1.
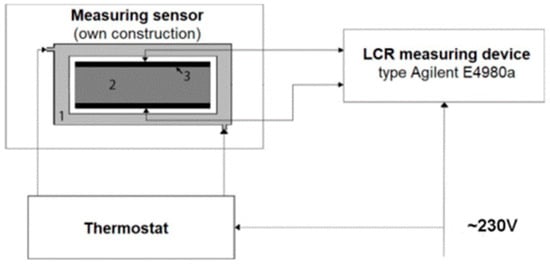
Figure 1.
Diagram of the measurement system for testing electrical properties of engine oil. (1)—water jacket; (2)—sample; (3)—glass container with electrodes (measuring cell).
The kinematic viscosity of the tested engine oils was determined using a Stabinger SVM 3000 viscometer (manufactured by Anton Paar GmbH, Graz, Austria), which enables high-precision measurements across a broad temperature range. The instrument operates on the principle of rotational viscosity measurement, in which a cylindrical rotor rotates within the oil sample under shear forces, and the resulting resistance allows for the calculation of kinematic viscosity. Measurements were carried out at two standard temperatures—40 °C and 100 °C—in accordance with ASTM D7042 [33], enabling the calculation of the viscosity index (VI). In addition to kinematic viscosity, the device also provided dynamic viscosity, density at 40 °C and 100 °C, and density-related parameters including API gravity, API density, and API specific gravity (all referenced to 15 °C). The analysis of this extended set of physicochemical parameters allowed for a more comprehensive rheological characterization of the oils and contributed to the evaluation of their potential relationship with electrical properties.
The chemical characteristics of the engine oils were determined using Fourier-transform infrared spectroscopy (FTIR) with a Thermo Scientific Nicolet i10 spectrometer (Thermo Fisher Scientific Inc., Waltham, MA, USA). Spectra were recorded in the wavenumber range of 4000–650 cm⁻1 using a zinc selenide (ZnSe) transmission cell, which allowed for precise analysis of the chemical composition of the samples. Key absorption bands were identified, corresponding to hydrocarbon (C–H) and ester (C=O) bonds, as well as additive components such as antioxidants and detergents. The FTIR analysis enabled the assessment of differences in chemical composition among the tested oils and their potential impact on the measured electrical properties.
3. Results
3.1. FTIR
FTIR spectroscopy enabled the comparison of the chemical composition of the tested oils by analyzing their absorption bands. The obtained spectra revealed significant differences in key regions, indicating a varied content of additives and base oil components across the tested products (Figure 2 and Figure 3).
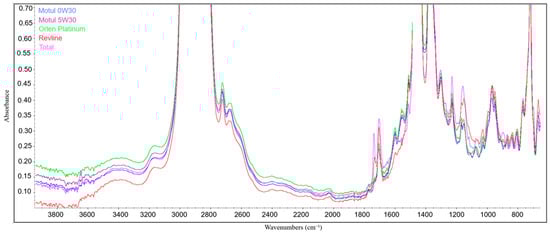
Figure 2.
FTIR spectra of selected engine oils (650–4000 cm⁻1).
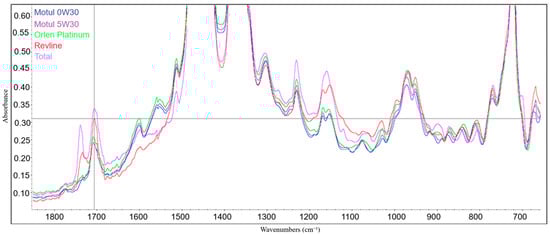
Figure 3.
FTIR spectra of selected engine oils—functional region detail (650–1800 cm⁻1).
In the region around 3650 cm⁻1, corresponding to the presence of antioxidant additives (e.g., phenols or aromatic amines), a distinct absorbance signal (0.057 A/0.1 mm) was observed exclusively for the Total oil, indicating a higher content of antioxidant compounds compared to the remaining oils, all of which showed absorbance values of 0.000 A/0.1 mm. In the key region at 1738 cm⁻1, associated with the presence of carbonyl groups (C=O) characteristic of esters and lubricating additives, Total exhibited the highest signal (0.109 A/0.1 mm), followed by Revline (0.060 A/0.1 mm), while the lowest absorbance was recorded for Orlen (0.014 A/0.1 mm), Motul 5W30 (0.005 A/0.1 mm), and Motul 0W30 (0.011 A/0.1 mm). This may indicate a higher ester content in the formulation of Total and Revline compared to the other products. A similar trend was observed in the 1708 cm⁻1 band, which is also characteristic of carbonyl stretching vibrations. Total (0.151 A/0.1 mm) and Revline (0.144 A/0.1 mm) showed the highest absorption, while Orlen (0.111 A/0.1 mm) was slightly lower, and both Motul oils had the lowest values (0.100 and 0.097 A/0.1 mm, respectively). This may suggest a lower ester content or fewer performance additives in the Motul formulations. Notably, the spectra for Motul 5W30 and Motul 0W30 almost entirely overlapped, suggesting a highly similar chemical composition. This implies that the differences between these oils likely stem from viscosity characteristics and production technologies rather than differences in additive packages or base oil composition. In the region around 1600 cm⁻1, associated with aromatic ring vibrations (C=C) linked to performance and antioxidant additives, Revline exhibited the lowest absorbance (0.020 A/0.1 mm), whereas the highest values were recorded for Orlen (0.057 A/0.1 mm), Motul 5W30 (0.053 A/0.1 mm), and Motul 0W30 (0.052 A/0.1 mm), with Total displaying an intermediate value (0.030 A/0.1 mm). The most pronounced difference occurred between Revline and the other samples, suggesting a lower content of stabilizers in this oil. At the 1515 cm⁻1 band, related to the presence of aromatic amines used as antioxidants, Total and Revline had the lowest absorbance (0.052 A/0.1 mm), while the highest value was recorded for Orlen (0.064 A/0.1 mm), with both Motul oils showing similar values (0.056 A/0.1 mm). In the 1230 cm⁻1 region, associated with anti-wear and detergent additives (e.g., phosphate esters), Total showed the highest absorbance (0.137 A/0.1 mm), Orlen reached 0.088 A/0.1 mm, and the remaining oils displayed comparable values (Revline 0.082, Motul 5W30 0.104, Motul 0W30 0.097 A/0.1 mm). Analysis of the 980 cm⁻1 band, linked to polar additives and certain synthetic components, showed the lowest absorbance for Motul 0W30 (0.155 A/0.1 mm), followed by Motul 5W30 (0.172 A/0.1 mm) and Total (0.169 A/0.1 mm), while the highest values were observed for Orlen (0.190 A/0.1 mm) and Revline (0.176 A/0.1 mm). The exact absorbance values for each spectral region are presented in Table 2. During analysis, a two-point reference baseline was applied, based on the minimum values from adjacent local minima, which enabled reliable and comparable results for all tested samples.
Table 2.
FTIR absorbance values for functional groups and additives in tested engine oils.
3.2. Viscosity
Analysis of the viscosity properties of the tested oils revealed significant differences in their rheological behavior, which may affect their suitability under various operating conditions. The viscosity index (VI), which defines the oil’s viscosity stability as a function of temperature, was the highest for Motul 0W30 (181.9), indicating its lowest sensitivity to temperature variations and good flowability at low temperatures. Revline (180.2) and Total (177.7) also showed high VI values. The lowest viscosity index was recorded for Orlen (171.7) (Table 3).
Table 3.
Physicochemical properties of the tested engine oils: viscosity, density, and API parameters.
The analysis of the kinematic viscosity of the tested oils revealed significant differences in their rheological behavior, which may affect their suitability for various operating conditions. The viscosity index, indicating the stability of oil viscosity with respect to temperature changes, was highest for Motul 0W30 (181.9), reflecting its minimal sensitivity to temperature fluctuations and good fluidity at low temperatures. Revline (180.2) and Total (177.7) also exhibited high VI values. The lowest viscosity index was recorded for Orlen (171.7).
In terms of kinematic viscosity at 40 °C, the highest value was observed for Total (66.9 mm2/s), while the lowest was recorded for Motul 0W30 (54.8 mm2/s), confirming its classification as a 0W30 oil and its improved flow properties at low temperatures. At 100 °C, Total again showed the highest kinematic viscosity (12.0 mm2/s), whereas Orlen had the lowest value (10.2 mm2/s), which may indicate its potentially lower resistance to degradation at elevated temperatures. Motul 5W30 and Motul 0W30 showed very similar viscosity values at both temperatures, suggesting comparable rheological performance.
Similar trends were observed for dynamic viscosity. At 40 °C, Total recorded the highest value (55.8 mPa·s), confirming its higher internal resistance, while Motul 0W30 had the lowest value (45.3 mPa·s), which was consistent with its lower kinematic viscosity and suggesting reduced internal friction. At 100 °C, the differences were less pronounced, but Total still exhibited the highest dynamic viscosity (9.6 mPa·s) and Orlen the lowest (8.1 mPa·s). These observations indicate that oils with higher dynamic viscosity may provide better lubrication film stability at elevated temperatures, while those with lower viscosity may contribute to reduced internal engine friction and potentially improved fuel efficiency.
The results confirmed that Motul 5W30 and Motul 0W30 share nearly identical viscosity characteristics, which aligns with previous FTIR observations showing almost overlapping absorbance spectra. This suggests that the differences between these oils are primarily due to viscosity-related properties rather than fundamental differences in chemical composition. Total, with the highest kinematic and dynamic viscosities, demonstrated superior rheological stability and potential for better engine protection at high temperatures. In contrast, Orlen, with the lowest viscosity values at 100 °C, may be more susceptible to performance changes during prolonged operation. Revline occupied an intermediate position, combining some of the characteristics of both groups. These findings confirm that variations in rheology may significantly influence the operational performance of engine oils and will be further compared with the results of electrical property analysis.
3.3. Permittivity
The electrical parameters of engine oils were measured at selected frequencies ranging from 100 Hz to 1.2 MHz using two types of sensors: flat and concentric. The results obtained for five tested oils enabled the evaluation of their dielectric and conductive properties, revealing significant differences in the behavior of individual samples in an electric field.
The measurements recorded in the frequency range of 1000 Hz to 10,000 Hz exhibited the highest repeatability; therefore, comparative analyses of the tested sensors were conducted specifically within this frequency interval. It should be noted that measurements at frequencies of 20–300 Hz and 2 MHz were characterized by very low repeatability. This observation is justified from a metrological perspective, as measurements near the boundaries of the operating range are typically associated with the highest uncertainty. For the intermediate ranges—400–900 Hz and 15 kHz–1.5 MHz—moderate repeatability was achieved. Accordingly, the defined optimal frequency range (1000–10,000 Hz) may be extended to include 400–900 Hz and 15 kHz–1.5 MHz.
In the first stage of analysis, parameters describing impedance and capacitive properties were considered, including |Z| (kΩ)—the impedance modulus, a key indicator of dielectric behavior; R (kΩ)—the real component of impedance, representing resistive properties; X (kΩ)—the imaginary component of impedance, related to capacitive or inductive effects; theta (rad)—the phase shift angle, directly related to R and X; and Q—the quality factor, expressing the ratio of stored to dissipated energy, which is also linked to impedance and the phase shift angle.
In the second stage, parameters associated with conductivity were analyzed: G (nS)—conductance, describing the oil’s ability to transport electrical charge; and B (nS)—susceptance, the imaginary part of admittance, associated with capacitive properties.
The third group included parameters related to capacitance and the loss model: Cp (pF)—parallel equivalent capacitance, representing the ability to store electrical charge; Cs (pF)—series equivalent capacitance, which is analogous to Cp but based on a different equivalent circuit; Rp (kΩ)—parallel equivalent resistance, indicating energy losses in the parallel model; and Rs (kΩ)—series equivalent resistance, describing losses in the series model.
The final parameter characterized was the loss angle tangent (tg delta), representing the ratio of energy dissipated to energy stored, which is directly associated with Q and the phase shift angle theta.
Within the analyzed frequency range, |Z| values decreased as frequency increased, which is consistent with the behavior of dielectric materials (Figure 4).
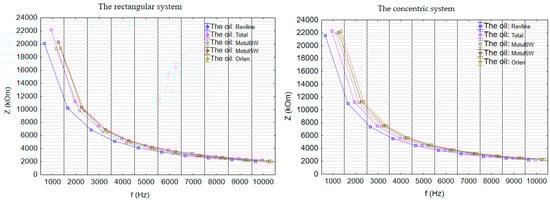
Figure 4.
Impedance modulus (|Z|), kΩ, parallel plate and concentric systems.
The highest impedance values were recorded for Total oil, indicating its superior dielectric properties. In contrast, Platinum and Motul 0W30 exhibited the lowest values, suggesting a reduced ability to suppress electrical conduction. These observations are based on measurements obtained using the flat sensor, as the variation in the concentric configuration was minimal.
In both measurement setups, the highest resistance (R) values were observed for Motul 5W30 and Motul 0W30, indicating their superior dielectric properties (Figure 5). In all cases, Total exhibited significantly lower resistance, confirming its greater tendency for electrical conduction. Revline and Platinum showed intermediate values with Revline demonstrating slightly higher conductivity at elevated frequencies. A consistent ranking of oils in terms of resistance was maintained across both configurations, supporting the reliability of the results. Absolute resistance values were higher in the concentric system at lower frequencies, whereas the flat sensor provided better differentiation between samples at higher frequencies due to differences in sensor geometry.
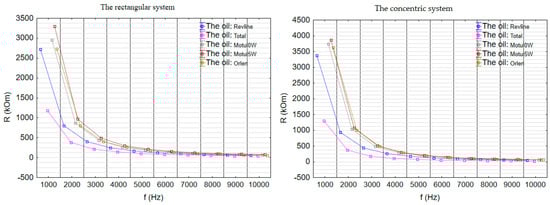
Figure 5.
Resistance (R), kΩ, parallel-plate and concentric systems.
The reactance (X) values for the tested oils were negative across the entire frequency range, indicating their predominantly capacitive character (Figure 6). At lower frequencies, Motul 0W30 and Platinum exhibited higher absolute X values compared to Motul 5W30, with these differences becoming even more pronounced at higher frequencies. Total consistently demonstrated the lowest absolute reactance values in both configurations, suggesting a less pronounced of its capacitive nature. In the flat sensor setup, differences between Motul oils, Platinum, and Total were more evident, whereas in the concentric system, the results across samples were more uniform. This suggests that the concentric sensor configuration is less sensitive to subtle variations in the dielectric composition of the oils.
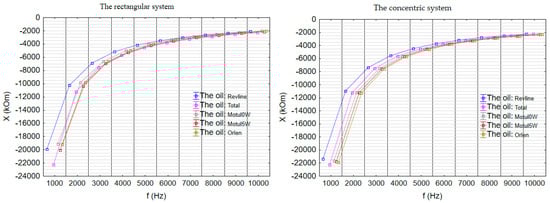
Figure 6.
Reactance (X), kΩ, parallel-plate and concentric systems.
The phase shift angle (θ) values for all tested oils were negative across the entire frequency range, confirming the predominantly capacitive nature of the samples (Figure 7). The highest (least negative) values were recorded for Motul 5W30 and Motul 0W30, indicating their more ideal dielectric behavior. Revline and Platinum exhibited intermediate values, while Total showed the most negative δ angles, suggesting a greater contribution of the resistive component. Differences between the samples were clearly observable in both the flat and concentric sensor configurations. The decreasing trend of θ values with increasing frequency was consistent with the typical behavior of capacitive systems.
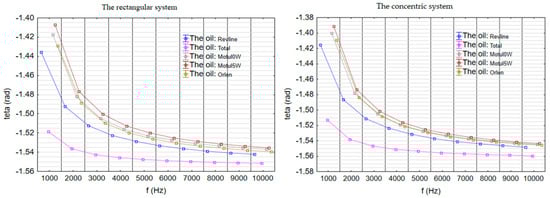
Figure 7.
Phase shift angle (θ), rad, parallel-plate and concentric systems.
The quality factor (Q) values increased with rising frequency for all tested oils; however, the growth dynamics varied significantly (Figure 8). The lowest Q values were recorded for Motul 5W30 and Motul 0W30, followed by higher values for Platinum and Revline, while Total distinctly stood out with the highest Q values. In the flat sensor configuration, the Q values of Total were nearly twice as high as those of the other samples, whereas in the concentric configuration, it reached values almost three times higher. Notably, in the concentric setup, differences between Total and the other oils were relatively small at lower frequencies; however, from around 4000 Hz, the Q factor for Total increased markedly faster, showing a parabolic trend. This behavior indicates specific dielectric properties of Total, particularly under higher-frequency electric fields.
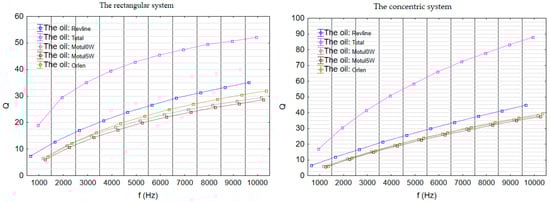
Figure 8.
Quality factor (Q), parallel-plate and concentric systems.
To summarize the first group of electrical parameters, the analysis of impedance-related and capacitive characteristics revealed that Motul 5W30 and Motul 0W30 exhibited the highest values of impedance modulus (|Z|), resistance (R), and reactance (X), along with the lowest conductivity, clearly confirming their superior dielectric properties. These oils also showed the least negative phase shift angles (θ), indicating a strongly capacitive nature. Despite having moderate values of |Z| and R, Total stood out with the most negative phase angle and the highest quality factor (Q), especially in the concentric configuration, where its Q values increased nearly three times faster than those of the other oils. Revline and Orlen obtained the lowest values of impedance, resistance, and reactance, which indicates higher conductivity and inferior dielectric properties; additionally, they were characterized by greater energy losses, which was reflected in their lower Q factors. Consistent trends between oils were observed in both the flat and concentric configurations, although the differences were more pronounced at higher frequencies in the concentric system, particularly for Total oil.
The second stage of the analysis focused on parameters related to the electrical conductivity of the tested samples, specifically conductance (G, nS), representing the oil’s ability to transport electric charges, and susceptance (B, nS), corresponding to the capacitive properties in the imaginary component of admittance. These parameters provide a detailed evaluation of the conduction tendencies and dielectric response of the oils under an alternating electric field, complementing the earlier impedance-based characterization.
The analysis of conductance (G) revealed clear differences between the tested oils (Figure 9). In both measurement configurations (flat and concentric), Total consistently exhibited the lowest G values, confirming its superior dielectric properties in terms of electrical conductivity. The remaining oils—Platinum, Revline, and both Motul 5W30 and 0W30—showed higher conductance values, which were relatively similar to each other and increased with frequency. In the flat sensor configuration, the differences between the oils were more pronounced, whereas in the concentric system, the increase in G was more gradual. Motul 0W30 and 5W30 displayed slightly higher conductivity than Platinum and Revline, while Total maintained the lowest levels across all frequencies. This behavior indicates that conductance analysis can serve as an effective tool for the early identification of oils with better dielectric properties and for distinguishing products with higher concentrations of polar compounds.
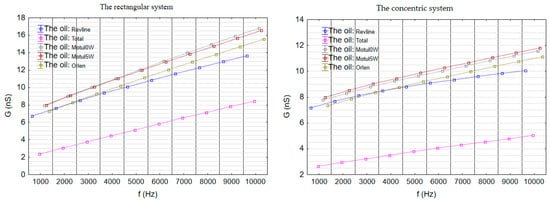
Figure 9.
Conductance (G), nS, parallel-plate and concentric systems.
The analysis of susceptance (B) showed that for most oils—Motul 5W30, Motul 0W30, Platinum, and Revline—the values increased systematically with frequency and remained relatively close to each other (Figure 10). However, the behavior of Total oil differed depending on the measurement configuration. In the flat sensor system, Total exhibited clearly the lowest B values across the entire frequency range, and as frequency increased, its curve diverged further from the profiles of the other oils, indicating a distinct dielectric response. In contrast, in the concentric configuration, Total showed B values at low frequencies (e.g., 1000 Hz) that were comparable to those of the other oils—excluding Revline—but at higher frequencies (above 7000 Hz), its increase in susceptance became more similar to that of Revline. These differences suggest unique polarization characteristics of Total and emphasize that the choice of measurement setup influences the sensitivity to subtle differences between oil samples. Therefore, the B parameter may serve as a useful indicator in oil quality control, enabling the detection of variations in the content of polar additives in engine oils.
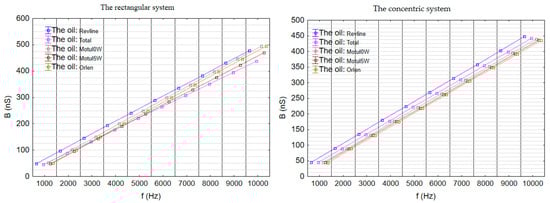
Figure 10.
Susceptance (B), nS, parallel-plate and concentric systems.
The next stage of the analysis considered parameters directly related to capacitive properties and dielectric losses: Cp (pF)—parallel equivalent capacitance, Cs (pF)—series equivalent capacitance, Rp (kΩ)—parallel equivalent resistance, and Rs (kΩ)—series equivalent resistance. These parameters describe the oils’ ability to store electrical charge and the level of energy dissipation, which were assessed within two different equivalent circuit models: parallel and series. Due to the close physical relationship between these parameters and the similarity in how their results are interpreted, a joint discussion is warranted, while emphasizing the differences stemming from the selected equivalent circuit model.
The analysis of Cp and Cs parameters revealed distinct differences between the measurement systems (Figure 11 and Figure 12). In the case of parallel equivalent capacitance (Cp), Total exhibited the lowest values in the flat electrode setup, clearly below the other oils, indicating a reduced ability to store electric charge. However, in the concentric setup, the lowest Cp values were recorded for Motul 5W and Platinum, while Total was closer to Motul 0W, suggesting that the concentric system reflects the dielectric structure of these oils differently.
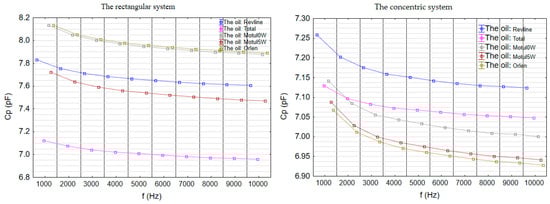
Figure 11.
Parallel equivalent capacitance (Cp), pF, parallel-plate and concentric systems.
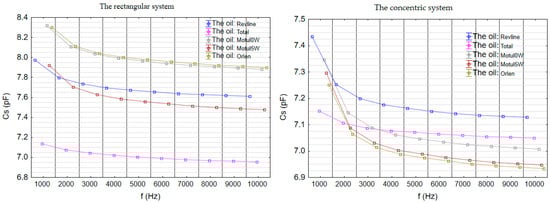
Figure 12.
Series equivalent capacitance (Cs), pF, parallel-plate and concentric systems.
For series equivalent capacitance (Cs), the divergence between the flat and concentric configurations was more pronounced. While Total again had the lowest Cs values in the flat system, in the concentric system—especially at higher frequencies (above 4000 Hz)—its values exceeded those of the other oils except for Revline. A key distinction was the rate of change: Total displayed the smoothest Cs variation across frequencies, whereas the other oils showed abrupt increases, particularly between 1000 and 2000 Hz. This behavior indicates that Total’s dielectric structure is more stable and less sensitive to changing test conditions, which may point to a different additive composition or base oil formulation compared to the samples of other oils.
The analysis of the parallel equivalent resistance parameter (Rp) revealed that values in the flat sensor configuration were consistently higher than those in the concentric setup for all tested oils across the entire frequency range (Figure 13). This indicates lower energy losses recorded in the flat configuration. In both systems, a systematic decrease in Rp was observed with increasing frequency with more pronounced changes in the concentric setup.
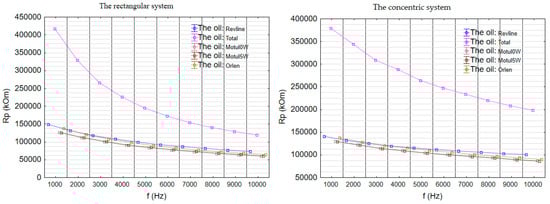
Figure 13.
Parallel equivalent resistance (Rp), kΩ, parallel-plate and concentric systems.
Total stood out particularly in the lower frequency range (e.g., 1000–3000 Hz), where it exhibited significantly higher Rp values compared to the other oils—especially in the flat system, where the differences were most apparent. As the frequency increased, these differences gradually diminished, and the Rp values for Total converged with those of the remaining oils. The other oils (Platinum, Revline, Motul 5W, Motul 0W) showed more compact and comparable Rp values starting from lower frequencies, indicating similar levels of energy dissipation under those conditions.
In the case of Rs (series equivalent resistance), a systematic decrease in values was observed with increasing frequency in both measurement configurations (Figure 14). Rs values in the flat sensor setup were generally lower than those in the concentric configuration, indicating reduced energy losses in the flat arrangement. Differences between the oils were clearly visible in both systems. Although not always distinctly apparent on the graphs, a substantial difference in Rs between the oils with the highest and lowest values persisted even at higher frequencies. For instance, in the concentric configuration at 10,000 Hz, Total exhibited an Rs of approximately 25 kΩ, while Motul 5W remained around 60 kΩ. This indicates a sustained disparity in series losses between the tested oils despite the increase in frequency.
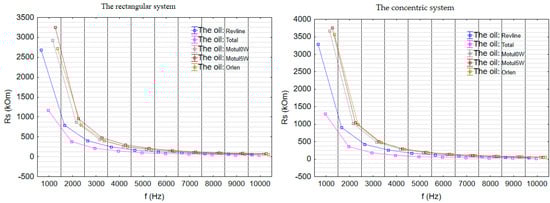
Figure 14.
Series equivalent resistance (Rs), kΩ, parallel-plate and concentric systems.
The final parameter characterized in this study is the dissipation factor (tg δ), which defines the ratio of energy lost to energy stored in the system (Figure 15). This parameter is directly linked to the quality factor (Q) and the phase shift angle (θ), providing additional insight into the dielectric loss behavior of the tested oils.
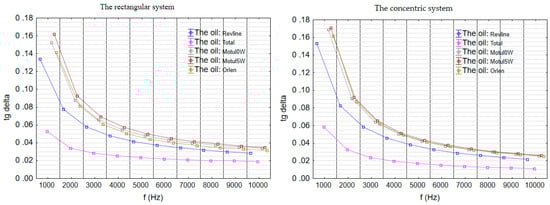
Figure 15.
Loss angle tangent (tg δ), –, parallel-plate and concentric systems.
The loss angle tangent (tg δ) for all tested oils exhibited a clear decreasing trend with increasing frequency in both the flat and concentric sensors measurement configurations. Total differed significantly from the other oils, showing the lowest tg δ values across the entire frequency range, indicating minimal energy losses and a more ideal dielectric behavior. Motul 5W and Motul 0W displayed the highest tg δ values, particularly at low frequencies, while Platinum and Revline occupied intermediate positions.
Differences between the configurations were minor: tg δ values in the concentric setup were slightly lower than in the flat one, although the order of oils with respect to dielectric losses remained consistent. It is worth noting that the largest differences between the oils were observed at the lowest frequency (1000 Hz), whereas at higher frequencies (above 7000 Hz), tg δ values stabilized and converged, with Total consistently maintaining the lowest level of losses.
3.4. Relationship Between Electrical and Physicochemical Properties of Oils
In the next stage, a comparative analysis was conducted between the FTIR spectral results and the electrical parameters of the tested engine oils. The goal was to assess the relationship between the presence of polar groups in the chemical structure of the oils and their dielectric and conductive properties. Particular attention was given to FTIR spectral regions characteristic of polar functional groups, including the range of 1730–1750 cm⁻1 corresponding to carbonyl (C=O) bonds in esters and carboxylic acids, and the region of 1250–1300 cm⁻1, which is associated with phosphate (P=O) bonds typical of detergent and anti-wear additives. Additionally, the region of 1000–1100 cm⁻1 was considered, where absorption bands related to oxygen-containing bonds (C–O–C, P–O–C) may occur. The intensity of absorption in these regions allows for a qualitative assessment of the presence of polar compounds, which significantly influence the electrical conductivity and dielectric properties of the oils. Simultaneously, key physicochemical parameters such as kinematic and dynamic viscosity at 40 °C and 100 °C were analyzed, as these can indirectly affect electrical measurements. Oils with higher viscosity may limit the charge mobility and alter their response to alternating electric fields, potentially impacting conductivity, phase angle, or dielectric loss. Therefore, in the following sections, correlations between viscosity parameters and the electrical properties of the tested samples were also examined.
In the FTIR spectra, Total oil exhibited a distinct peak around 1740 cm⁻1, corresponding to the presence of carbonyl (C=O) groups, while the absorption profile around 1520 cm⁻1 remained relatively flat. In this regard, Total behaved similarly to Revline, which also showed a strong signal at 1740 cm⁻1 and no significant features at 1520 cm⁻1. The remaining three oils (Motul 5W30, Motul 0W30, and Platinum/Orlen) demonstrated a comparable behavior with a less pronounced peak at 1740 cm⁻1 and a different spectral pattern in the mid-infrared region. In the area near 1150 cm⁻1, related to phosphate groups (P=O), both Total and Revline showed notably higher absorbance values than the other three oils, which presented similar and lower levels. In terms of viscosity, Total and Revline also showed the highest kinematic and dynamic viscosity values, while Motul 5W30, Motul 0W30, and Platinum/Orlen had comparably lower values. A similar pattern was observed in the electrical parameters, particularly for conductivity (G) and dielectric loss angle tangent (tg δ), where Total exhibited slightly lower values than Revline, and the other three oils displayed similar, even lower values for these parameters. This confirms the differentiation observed in both the FTIR spectra and viscosity measurements.
The correlation analysis between the physicochemical parameters and the electrical properties of the tested engine oils revealed a consistent relationship between chemical structure, rheological behavior, and the response to an alternating electric field (Table 4). Total and Revline oils, which exhibited distinct peaks in the FTIR spectra at 1740 cm⁻1 (carbonyl groups) and 1150 cm⁻1 (phosphate groups), showed higher viscosity values and simultaneously displayed increased electrical conductivity (G) and higher dielectric loss tangent (tg δ). This indicates a greater content of polar chemical additives. In contrast, Motul 5W30, Motul 0W30, and Platinum/Orlen oils, which had weaker absorption in spectral regions associated with polar compounds, were characterized by lower viscosity, reduced conductivity, and lower dielectric losses, confirming their more dielectric nature. The obtained results demonstrate that electrical properties—particularly conductivity and loss tangent—can serve as sensitive indicators of engine oil quality, correlating both with chemical composition and rheological performance.
Table 4.
The correlation analysis between the physicochemical parameters and the electrical properties.
4. Conclusions
The conducted study demonstrated that the measurement of electrical parameters provides valuable insights into the quality and structural characteristics of fresh engine oils. Among the tested samples, two distinct groups emerged: Total and Revline exhibited similar behavior in both FTIR spectra and viscosity parameters, which correlated with their higher electrical conductivity and greater dielectric losses. In contrast, Motul 5W30, Motul 0W30, and Platinum showed lower polarization in FTIR spectra, lower viscosity values, and significantly better dielectric properties, which were confirmed by their higher impedance and lower conductivity. These findings indicate that electrical parameters are sensitive to both the chemical composition and rheological properties of tested oils.
Electrical parameters such as conductivity, susceptance, and dielectric loss tangent proved especially useful in distinguishing samples of oils based on the content of polar compounds. Total showed the most stable changes in capacitance and resistance across the tested frequency range, suggesting a more uniform dielectric structure. Differences between the flat and concentric sensor measurements revealed that sensor geometry affects sensitivity—particularly at lower frequencies, where the flat sensor provided better sample differentiation. Regardless of sensor type, Total consistently exhibited the lowest dielectric losses, confirming its distinct chemical characteristics.
The correlation analysis between physicochemical properties and electrical parameters confirmed a strong relationship between the presence of polar groups (identified by FTIR), viscosity levels, and the electrical response of the oils. Oils with higher ester and phosphate additive content were characterized by increased energy losses and higher conductivity. In contrast, oils with lower polarity showed superior dielectric properties and a lower loss tangent. These results highlight the potential of using electrical parameters as a rapid and non-destructive tool for assessing the quality of fresh engine oils.
Limitations
The present study was conducted on five fresh engine oils, which limits the generalizability of the results. Used oils, due to chemical and structural changes occurring during operation—such as oxidation, additive depletion, and contamination—may exhibit substantially different electrical properties and correlations compared to fresh oils. The aim here was to establish baseline dielectric behavior linked to composition, particularly the influence of viscosity grade and additive formulation. Future work will therefore extend this analysis to include artificially aged and in-service oils to explore degradation dynamics and evaluate the method’s diagnostic value under realistic operating conditions, as suggested in recent studies on thermally and chemically stressed lubricants [34,35].
Author Contributions
Conceptualization, A.W. and R.Ż.; methodology, A.W.; software, A.W.; validation, A.W. and R.Ż.; formal analysis, A.W. and R.Ż.; investigation, A.W. and R.Ż.; resources, A.W. and R.Ż.; data curation, A.W. and R.Ż.; writing—original draft preparation, A.W.; writing—review and editing, A.W. and R.Ż.; visualization, A.W. and R.Ż.; supervision, A.W.; project administration, A.W.; funding acquisition, A.W. All authors have read and agreed to the published version of the manuscript.
Funding
The publication was funded through grants implemented at the Cracow University of Economics.
Data Availability Statement
The original contributions presented in this study are included in the article. Further inquiries can be directed to the corresponding author.
Conflicts of Interest
The authors declare no conflicts of interest.
References
- Urban, A.; Zhe, J. A Microsensor Array for Diesel Engine Lubricant Monitoring Using Deep Learning with Stochastic Global Optimization. Sens. Actuators A Phys. 2022, 343, 113671. [Google Scholar] [CrossRef]
- Altıntaş, O.; Aksoy, M.; Ünal, E.; Akgöl, O.; Karaaslan, M. Artificial Neural Network Approach for Locomotive Maintenance by Monitoring Dielectric Properties of Engine Lubricant. Measurement 2019, 145, 678–686. [Google Scholar] [CrossRef]
- Duchowski, J.K.; Mannebach, H. A Novel Approach to Predictive Maintenance: A Portable, Multi-Component Mems Sensor for on-Line Monitoring of Fluid Condition in Hydraulic and Lubricating Systems. Tribol. Trans. 2006, 49, 545–553. [Google Scholar] [CrossRef]
- Macioszek, Ł.; Włodarczak, S.; Rybski, R. Mineral Oil Moisture Measurement with the Use of Impedance Spectroscopy. IET Sci. Meas. Technol. 2019, 13, 1158–1162. [Google Scholar] [CrossRef]
- Nissar, A.; Hanief, M.; Mir, F.Q. Condition Monitoring of Used Engine Oil by FTIR Spectroscopy—A Review. In Proceedings of the Lecture Notes in Mechanical Engineering; Springer: Singapore, 2022. [Google Scholar]
- Pfeiffer, P.; Ronai, B.; Vorlaufer, G.; Dörr, N.; Filzmoser, P. Weighted LASSO Variable Selection for the Analysis of FTIR Spectra Applied to the Prediction of Engine Oil Degradation. Chemom. Intell. Lab. Syst. 2022, 228, 104617. [Google Scholar] [CrossRef]
- Heredia-Cancino, J.; Carrillo-Torres, R.; Munguía-Aguilar, H.; Álvarez-Ramos, M. An Innovative Method to Reduce Oil Waste Using a Sensor Made of Recycled Material to Evaluate Engine Oil Life in Automotive Workshops. Environ. Sci. Pollut. Res. 2020, 27, 28104–28112. [Google Scholar] [CrossRef]
- Soleimani, M.; Sophocleous, M.; Wang, L.; Atkinson, J.; Hosier, I.L.; Vaughan, A.S.; Taylor, R.I.; Wood, R.J.K. Base Oil Oxidation Detection Using Novel Chemical Sensors and Impedance Spectroscopy Measurements. Sens. Actuators B Chem. 2014, 99, 247–258. [Google Scholar] [CrossRef]
- Latif, U.; Dickert, F.L. Conductometric Sensors for Monitoring Degradation of Automotive Engine Oil. Sensors 2011, 11, 8611–8625. [Google Scholar] [CrossRef]
- Wu, X.; Zhang, Y.; Li, N.; Qian, Z.; Liu, D.; Qian, Z.; Zhang, C. A New Inductive Debris Sensor Based on Dual-Excitation Coils and Dual-Sensing Coils for Online Debris Monitoring. Sensors 2021, 21, 7556. [Google Scholar] [CrossRef]
- Wang, C.; Bai, C.; Yang, Z.; Zhang, H.; Li, W.; Wang, X.; Zheng, Y.; Ilerioluwa, L.; Sun, Y. Research on High Sensitivity Oil Debris Detection Sensor Using High Magnetic Permeability Material and Coil Mutual Inductance. Sensors 2022, 22, 1833. [Google Scholar] [CrossRef]
- Niedermayer, A.O.; Voglhuber-Brunnmaier, T.; Feichtinger, F.; Heinisch, M.; Jakoby, B. Online Condition Monitoring of Lubricating Oil Based on Resonant Measurement of Fluid Properties. In Proceedings of the Sensors and Measuring Systems, 19th ITG/GMA-Symposium, Nuremberg, Germany, 26–27 June 2018. [Google Scholar]
- Li, Z.; Meng, Z.; Fei, F.; Gibson, A. Microwave Cylindrical Cavity Resonator Sensor for Detection and Characterization of Contaminants in Lubricating Oil. IEEE Sens. J. 2022, 22, 22600–22609. [Google Scholar] [CrossRef]
- Raadnui, S.; Kleesuwan, S. Low-Cost Condition Monitoring Sensor for Used Oil Analysis. Wear 2005, 259, 1502–1506. [Google Scholar] [CrossRef]
- Schecklman, S.; Zurk, L. Terahertz Imaging of Thin Film Layers with Matched Field Processing. Sensors 2018, 18, 3547. [Google Scholar] [CrossRef]
- Zhang, H.; Shi, H.; Li, W.; Ma, L.; Zhao, X.; Xu, Z.; Wang, C.; Xie, Y.; Zhang, Y. A Novel Impedance Micro-sensor for Metal Debris Monitoring of Hydraulic Oil. Micromachines 2021, 12, 150. [Google Scholar] [CrossRef]
- Zhang, H.; Ma, L.; Shi, H.; Xie, Y.; Wang, C. A Method for Estimating the Composition and Size of Wear Debris in Lubricating Oil Based on the Joint Observation of Inductance and Resistance Signals: Theoretical Modeling and Experimental Verification. IEEE Trans. Instrum. Meas. 2022, 71, 9507409. [Google Scholar] [CrossRef]
- Niknafs, H.; Zarepour, G.R.; Faridkhah, M. Design of an Expert System Based on Fuzzy Logic for Real-Time Oil Condition Monitoring and Fault Diagnosis in Heavy-Duty Diesel Engines. Int. J. Qual. Eng. Technol. 2023, 9, 211–239. [Google Scholar] [CrossRef]
- Tanwar, M.; Raghavan, N. Lubricating Oil Remaining Useful Life Prediction Using Multi-Output Gaussian Process Regression. IEEE Access 2020, 8, 128897–128907. [Google Scholar] [CrossRef]
- Pan, Y.; Wu, T.; Jing, Y.; Wang, P. Multiattribute Modeling for Oil Condition Assessment Considering Uncertainties. IEEE Trans. Instrum. Meas. 2022, 71, 3509908. [Google Scholar] [CrossRef]
- Xie, Y.; Wang, S.; Zhang, S.; Zhang, H.; Shi, H. Dual Inductive-Capacitive Detection Cell: A Promising Tool for Distinguishing Mixed Metal Particles. IEEE Sens. J. 2023, 23, 21163–21171. [Google Scholar] [CrossRef]
- Ma, L.; Shi, H.; Zhang, H.; Li, G.; Shen, Y.; Zeng, N. High-Sensitivity Distinguishing and Detection Method for Wear Debris in Oil of Marine Machinery. Ocean Eng. 2020, 215, 107452. [Google Scholar] [CrossRef]
- Shi, H.; Zhang, H.; Ma, L.; Rogers, F.; Zhao, X.; Zeng, L. An Impedance Debris Sensor Based on a High-Gradient Magnetic Field for High Sensitivity and High Throughput. IEEE Trans. Ind. Electron. 2021, 68, 5376–5384. [Google Scholar] [CrossRef]
- Du, Y.; Wu, T.; Cheng, J. Age Detection of Lubricating Oil with On-Line Sensors. In Proceedings of the 2015 IEEE SENSORS, Busan, Republic of Korea, 1–4 November 2015. [Google Scholar]
- Sun, H.; Liu, Y.; Tan, J. Research on Testing Method of Oil Characteristic Based on Quartz Tuning Fork Sensor. Appl. Sci. 2021, 11, 5642. [Google Scholar] [CrossRef]
- Pourramezan, M.R.; Rohani, A.; Abbaspour-Fard, M.H. Unlocking the Potential of Soft Computing for Predicting Lubricant Elemental Spectroscopy. Lubricants 2023, 11, 382. [Google Scholar] [CrossRef]
- Delgado, E.; Aperador, W.; Hernández, A. Impedance Spectroscopy as a Tool for the Diagnosis of the State of Vegetable Oils Used as Lubricants. Int. J. Electrochem. Sci. 2015, 10, 8190–8199. [Google Scholar] [CrossRef]
- Zhang, E.; Liu, J.; Zhang, C.; Zheng, P.; Nakanishi, Y.; Wu, T. State-of-Art Review on Chemical Indicators for Monitoring the Aging Status of Oil-Immersed Transformer Paper Insulation. Energies 2023, 16, 1396. [Google Scholar] [CrossRef]
- Liskiewicz, T.; Sherrington, I.; Khan, T.; Liu, Y. Advances in Sensing for Real-Time Monitoring of Tribological Parameters. Tribol. Int. 2023, 189, 108965. [Google Scholar] [CrossRef]
- Gajewski, J.; Vališ, D. The Determination of Combustion Engine Condition and Reliability Using Oil Analysis by MLP and RBF Neural Networks. Tribol. Int. 2017, 115, 557–572. [Google Scholar] [CrossRef]
- Pérez, A.T.; Hadfield, M. Low-Cost Oil Quality Sensor Based on Changes in Complex Permittivity. Sensors 2011, 11, 10675–10690. [Google Scholar] [CrossRef]
- Zhu, X.; Zhong, C.; Zhe, J. Lubricating Oil Conditioning Sensors for Online Machine Health Monitoring—A Review. Tribol. Int. 2017, 109, 473–484. [Google Scholar] [CrossRef]
- ASTM D7042-21a; Standard Test Method for Dynamic Viscosity and Density of Liquids by Stabinger Viscometer (and the Calculation of Kinematic Viscosity). ASTM International: West Conshohocken, PA, USA, 2021.
- Qiu, Z.; Chen, R.; Gan, X.; Wu, C. Torsional Damper Design for Diesel Engine: Theory and Application. Phys. Scr. 2024, 99, 125214. [Google Scholar] [CrossRef]
- Zhang, X.; Zhu, Q.; Wang, S.; Ma, T.; Gao, S.; Kong, Y.; Han, Q.; Chu, F. Hybrid Triboelectric-Variable Reluctance Generator Assisted Wireless Intelligent Condition Monitoring of Aero-Engine Main Bearings. Nano Energy 2025, 136, 110721. [Google Scholar] [CrossRef]
Disclaimer/Publisher’s Note: The statements, opinions and data contained in all publications are solely those of the individual author(s) and contributor(s) and not of MDPI and/or the editor(s). MDPI and/or the editor(s) disclaim responsibility for any injury to people or property resulting from any ideas, methods, instructions or products referred to in the content. |
© 2025 by the authors. Licensee MDPI, Basel, Switzerland. This article is an open access article distributed under the terms and conditions of the Creative Commons Attribution (CC BY) license (https://creativecommons.org/licenses/by/4.0/).