Article

Real-Time Estimation Methods for the Frequency Support Function Based on a Virtual Wind Turbine

Department of Electrical Engineering, Kwangwoon University, Seoul 01897, Republic of Korea
*
Author to whom correspondence should be addressed.
Energies 2025, 18(11), 2774; https://doi.org/10.3390/en18112774
Submission received: 15 April 2025 / Revised: 23 May 2025 / Accepted: 24 May 2025 / Published: 27 May 2025

Abstract

:
With the increasing penetration of renewable energy sources, reduced system inertia and weakened frequency regulation capability have emerged as critical issues in power systems. As a result, wind turbines are now required to provide frequency support functions. To enable accurate analysis of the operational characteristics of wind turbines equipped with such control functions, this study proposes a virtual wind turbine model that estimates the operating point of a wind turbine in real-time under the assumption that frequency support functions are not performed. The proposed model is based on a turbine state observer that estimates wind speed and the power coefficient, and subsequently estimates generator power, generator speed, and blade pitch angle across various operating modes. Simulations were conducted under conditions with fluctuating wind speed and grid frequency, including MPPT, speed control, and pitch control operating regions. The accuracy of the proposed estimation model was evaluated, and the results demonstrated low estimation errors for key variables such as generator speed, power output, pitch angle, and wind speed across all conditions. These results quantitatively validate the robustness and applicability of the proposed model.

1. Introduction

With the increasing penetration of renewable energy sources into power systems, the share of conventional synchronous generators is decreasing, leading to a reduction in system inertia and a weakening of frequency regulation capability [1,2,3,4,5,6,7]. These changes degrade the dynamic response of the grid and may potentially cause frequency instability. Consequently, the demand for frequency support functions from wind turbines, which possess rotational inertia, is steadily growing to enhance system stability [8]. Wind turbines can contribute to frequency stabilization and increase effective grid inertia by controlling their active power output [9,10].
Representative control methods for active power control from wind turbines include power reserve control, synthetic inertia control, and frequency droop control [11,12,13,14,15,16,17,18]. Power reserve control secures a margin of available power by reducing turbine output (de-loading) and enables sustained frequency regulation. Frequency droop control adjusts the turbine’s active power proportionally to the grid frequency deviation, thereby mitigating frequency deviations. However, both methods require deviation from the maximum power point tracking (MPPT), resulting in reduced energy efficiency. Synthetic inertia control responds to system disturbances by releasing the stored kinetic energy (SKE) of the rotor, providing a rapid but short-duration frequency response. Once the rotor speed decreases after energy release, the turbine can no longer supply additional active power, which may lead to a secondary frequency drop [19]. These behaviors can affect both system stability and the continued ability of wind turbines to support the grid, thus necessitating careful analysis.
While numerous studies have explored various technical methods for wind turbines to address the reduction in system inertia due to higher wind penetration, comprehensive evaluations of how these support functions affect both turbine dynamics and system-level frequency response remain insufficient. Most prior works focused on turbine performance in specific control modes [20,21,22]. Some studies have modeled the impact of grid-connected wind turbines on system frequency response characteristics in stages to comprehensively assess grid integration performance [23]. Others have investigated how frequency support functions affect fatigue loads on wind turbines, along with the implications for their frequency regulation capability [24]. Evaluating the impact of active power control—an essential grid support function—is critical for establishing more reliable grid operation strategies. Accordingly, further research is needed on turbine dynamic behavior under various conditions, such as wind speed and frequency fluctuations.
This paper proposes a method for estimating the operating point of a wind turbine when the virtual wind turbine model, embedded in the wind turbine performing frequency support functions, does not execute the frequency support functions. To achieve this, a virtual wind turbine model embedded in the turbine controller is utilized. It incorporates a pre-defined power coefficient C p lookup table and numerical computation techniques to estimate generator speed and active power output, enabling comparison of operating point shifts due to the presence or absence of grid support.
Unlike previous studies that have focused only on MPPT operation [25], this work extends the estimation model to cover the full operational range of wind turbines, including high-speed control and pitch control modes. In previous studies, the proposed estimators operated only during MPPT control and, thus, failed to function properly in the high wind speed region where speed and pitch control are active. This study addresses such limitations by extending the operating range of the estimator beyond the MPPT region, enabling reliable estimation of the turbine’s operating point even in the entire operating range, able to normally estimate the operating point when the wind turbine does not perform the frequency support function.
The structure of this paper is as follows: Section 2 explains the sub-models of the Type 4B wind turbine system to which the proposed estimator is applied, along with the associated control strategies. Section 3 introduces the estimator model, consisting of a turbine state observer and a virtual wind turbine module. Section 4 presents simulation results in which the proposed estimator is implemented on a wind turbine operating under variable wind and frequency conditions, and the estimated operating point is compared to the actual output of a non-frequency-supporting turbine.

2. Type 4B Wind Turbine System Modeling
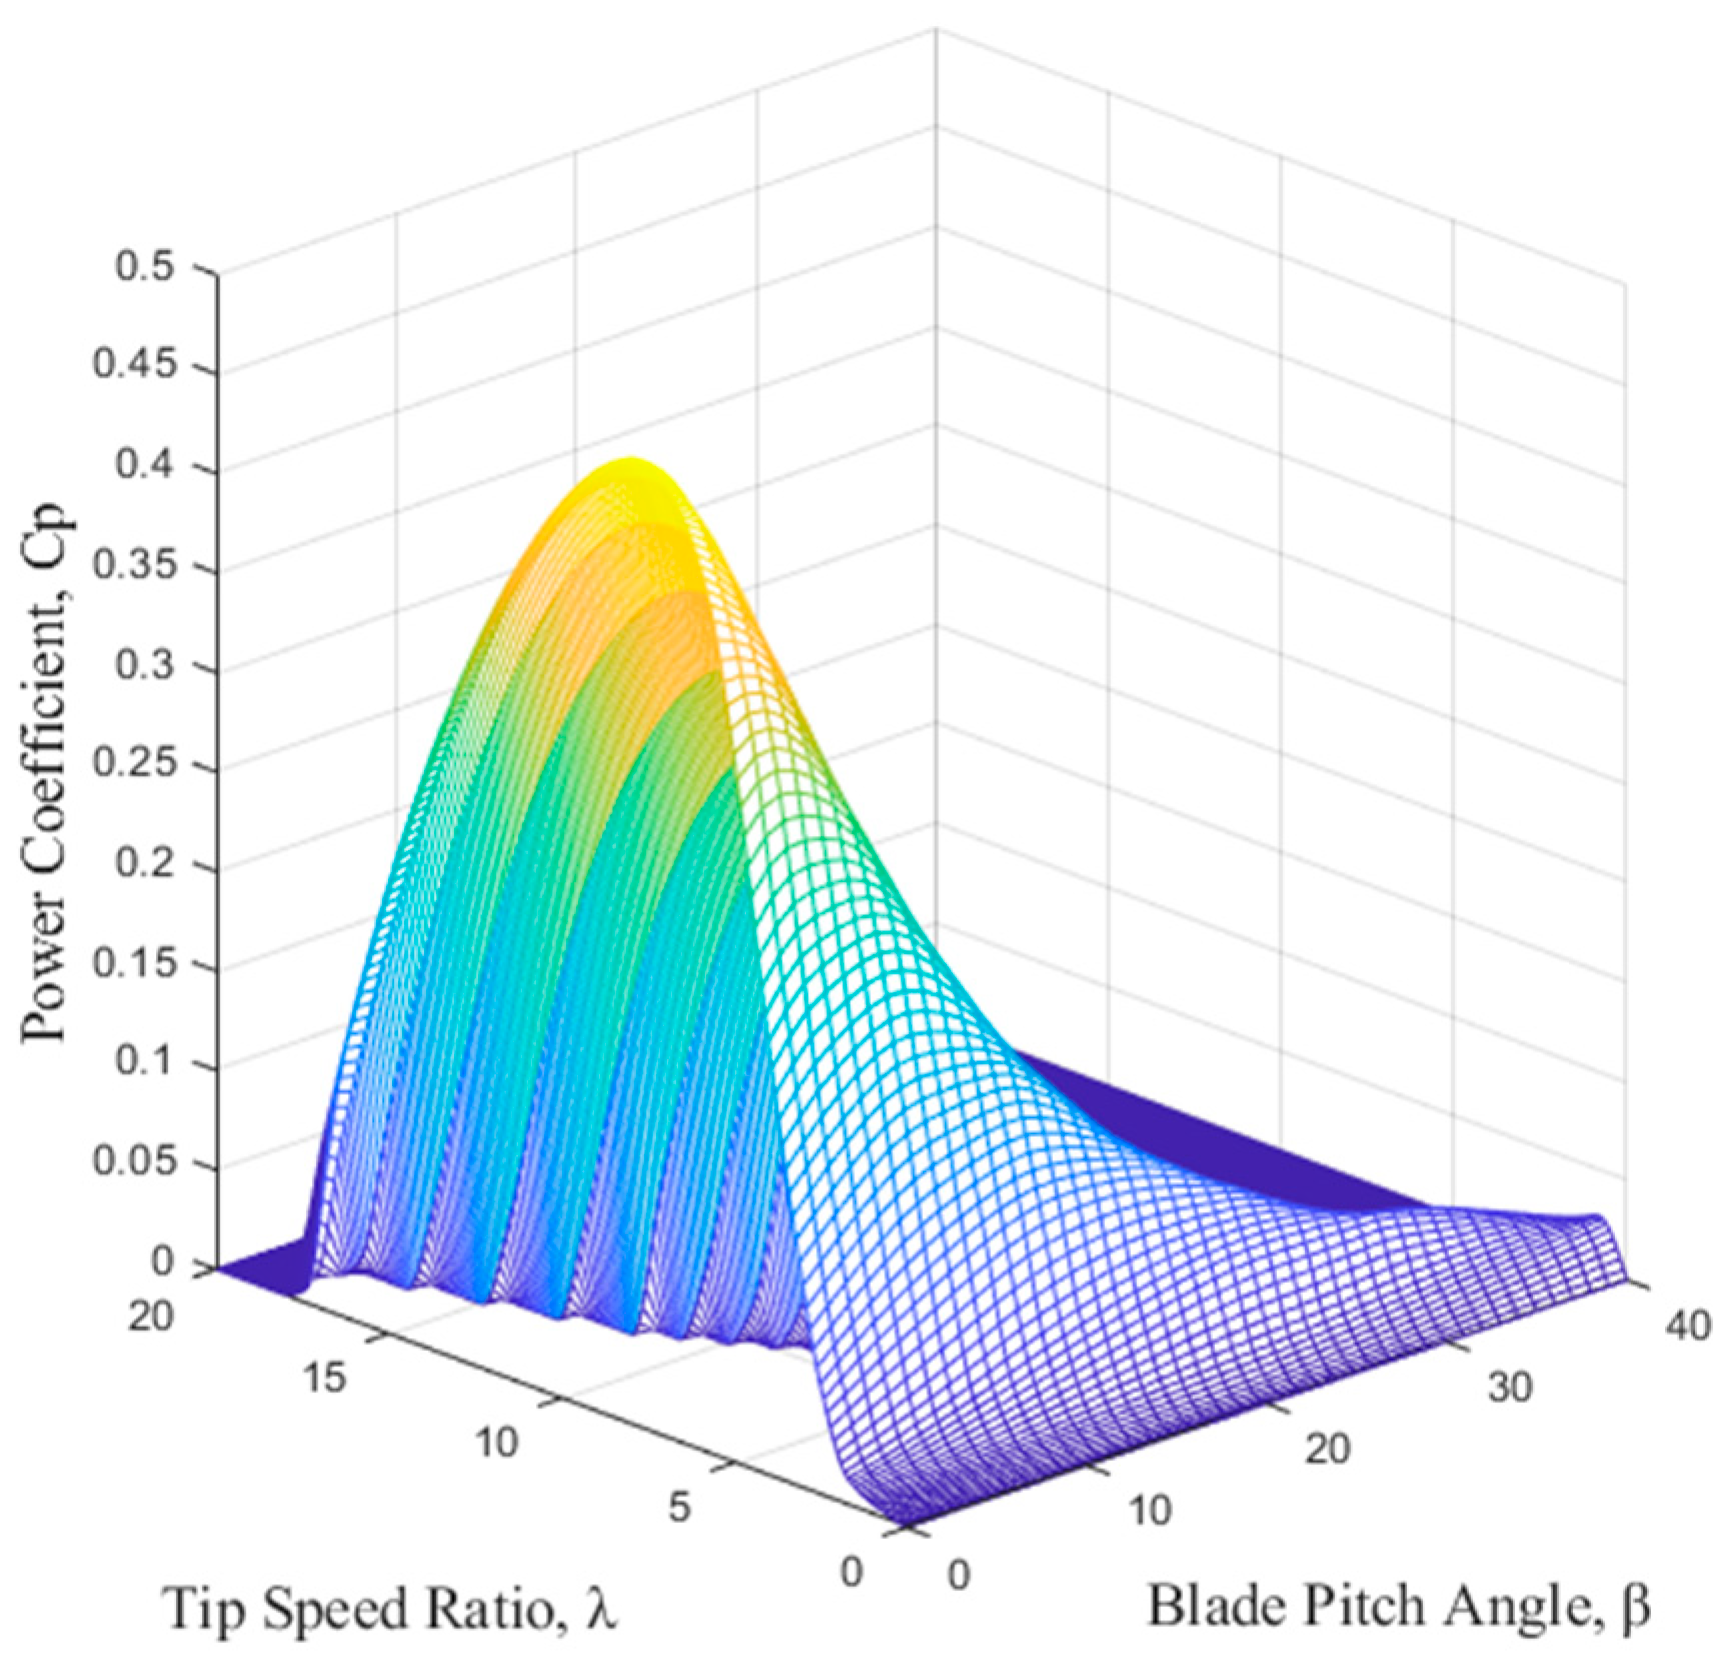
The structure of the Type 4B wind turbine system is shown in Figure 1, consisting of blades and a permanent magnet synchronous generator (PMSG) connected via a gearbox, a back-to-back converter for generator control, and a control system. In general, wind turbines output active power through torque and pitch controllers.
The overall wind turbine system can be represented through a generalized block diagram, typically consisting of key subsystems such as the blade and pitch control mechanism, drivetrain, generator with its associated power electronics, and a torque control unit. A representative structure of such a wind turbine system is illustrated in Figure 2.

2.1. Blade Model

The blade system collects mechanical energy by converting wind energy into rotational motion [26]. The output of the blade power can be calculated using the following expression:
P b = 1 2 ρ π R 2 C p λ , β v w i n d 3
where ρ is the air density, R is the blade radius, v w i n d is the wind speed, C p λ , β is the power coefficient, which is a function of the tip speed ratio λ and blade pitch angle β .
The wind turbine tip speed ratio can be expressed as follows:
λ = ω r R v w i n d
where ω r is the generator rotational speed.
Equation (1) indicates that the blade power is proportional to the cube of the wind speed, and that the efficiency of capturing kinetic energy from the wind varies depending on the blade’s unique mechanical geometry.
The power coefficient C p is represented as a three-dimensional surface shown in Figure 3. It is noted that the power coefficient data in Figure 3 is based on NREL’s 5MW reference turbine [27], and does not represent the actual data for the U151 model used in this study.

2.2. Back-to-Back Converter Model

As shown in Figure 1, the back-to-back converter consists of a shared DC-link capacitor between the machine-side converter (MSC) and the grid-side converter (GSC) [28]. The MSC controls the generator’s active power, while the GSC regulates the DC-link voltage to deliver power to the grid. The converter is rated higher than the turbine capacity, and as the generator transmits power through MSC and GSC, the machine and grid can operate independently. This paper does not focus on the electrical dynamics, so the converter model is omitted, as its internal control dynamics have minimal impact on the proposed estimation method.

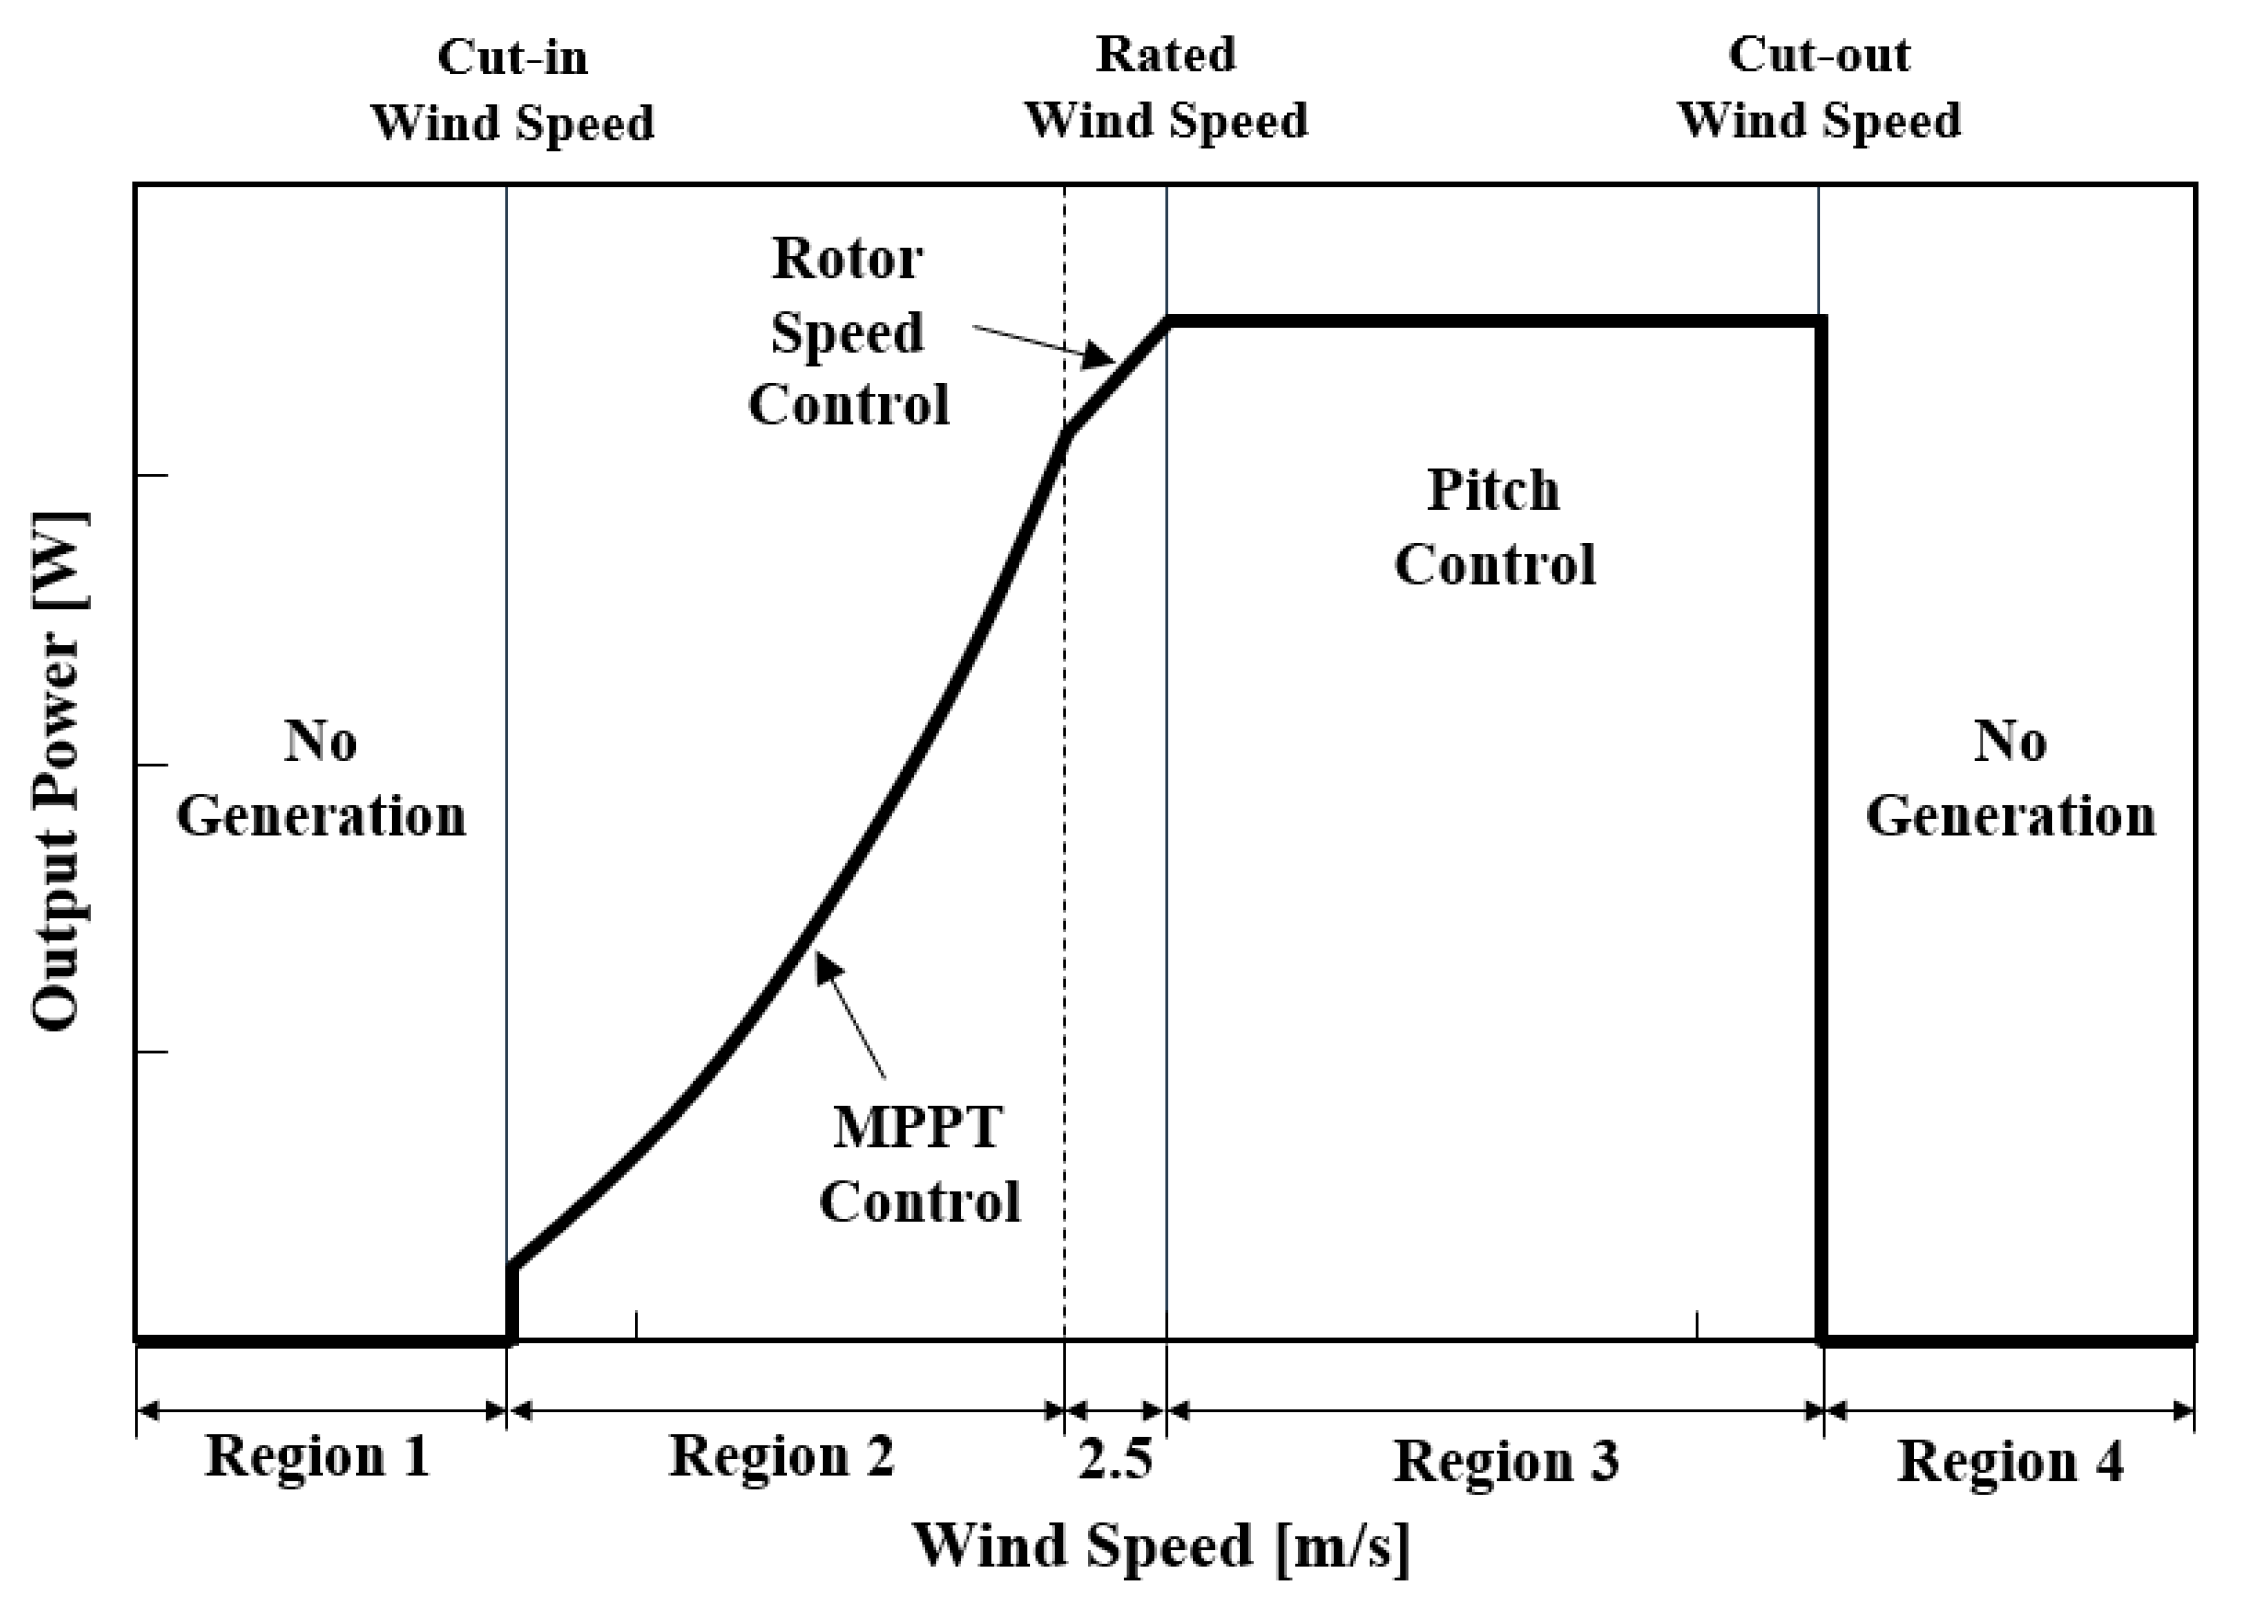
2.3. Torque Controller

Depending on wind speed, the operation of the wind turbine is divided into four distinct regions, as shown in Figure 4 [29].
Regions 1 and 4 are shutdown zones due to efficiency and safety considerations. In Region 2, the wind turbine operates in MPPT mode to collect wind energy at maximum efficiency. In Region 3, when wind speed increases and generator output reaches rated power, the pitch controller reduces the power coefficient to limit aerodynamic power capture and maintain rated power output. Region 2.5 represents an intermediate zone, where the generator output is below the rated value but the rotor speed exceeds the rated speed; thus, the rotor speed is controlled to prevent overspeed.
The operational regions in Figure 4 are defined without considering the grid status and are referred to as baseline control by NREL. Accordingly, the term “baseline control” in this paper refers to control modes that do not respond to grid frequency or system conditions, focusing primarily on Regions 2 through 3, where the torque and pitch controllers are actively engaged.
The torque controller switches between MPPT and PI-based speed control depending on the wind speed, to ensure stable active power output. While operating in MPPT mode (Region 2), the controller maintains an optimal pitch angle to maximize aerodynamic efficiency [30].
As wind speed increases, aerodynamic torque immediately increases, but due to rotor inertia, there is a delay in the speed increase. The difference between the aerodynamic torque and the reaction torque causes gradual acceleration, and the controller shifts to a new operating point in MPPT mode.
The reference torque from the torque controller can be calculated to maintain the maximum power coefficient as follows:
T g = 1 2 ρ π R 5 C p m a x λ o p t 3 ω g 2
where λ o p t is the optimal tip speed ratio and C p m a x is the maximum power coefficient.
When the generator speed exceeds its rated value, the controller transitions to PI-based speed control to limit output and protect mechanical components.

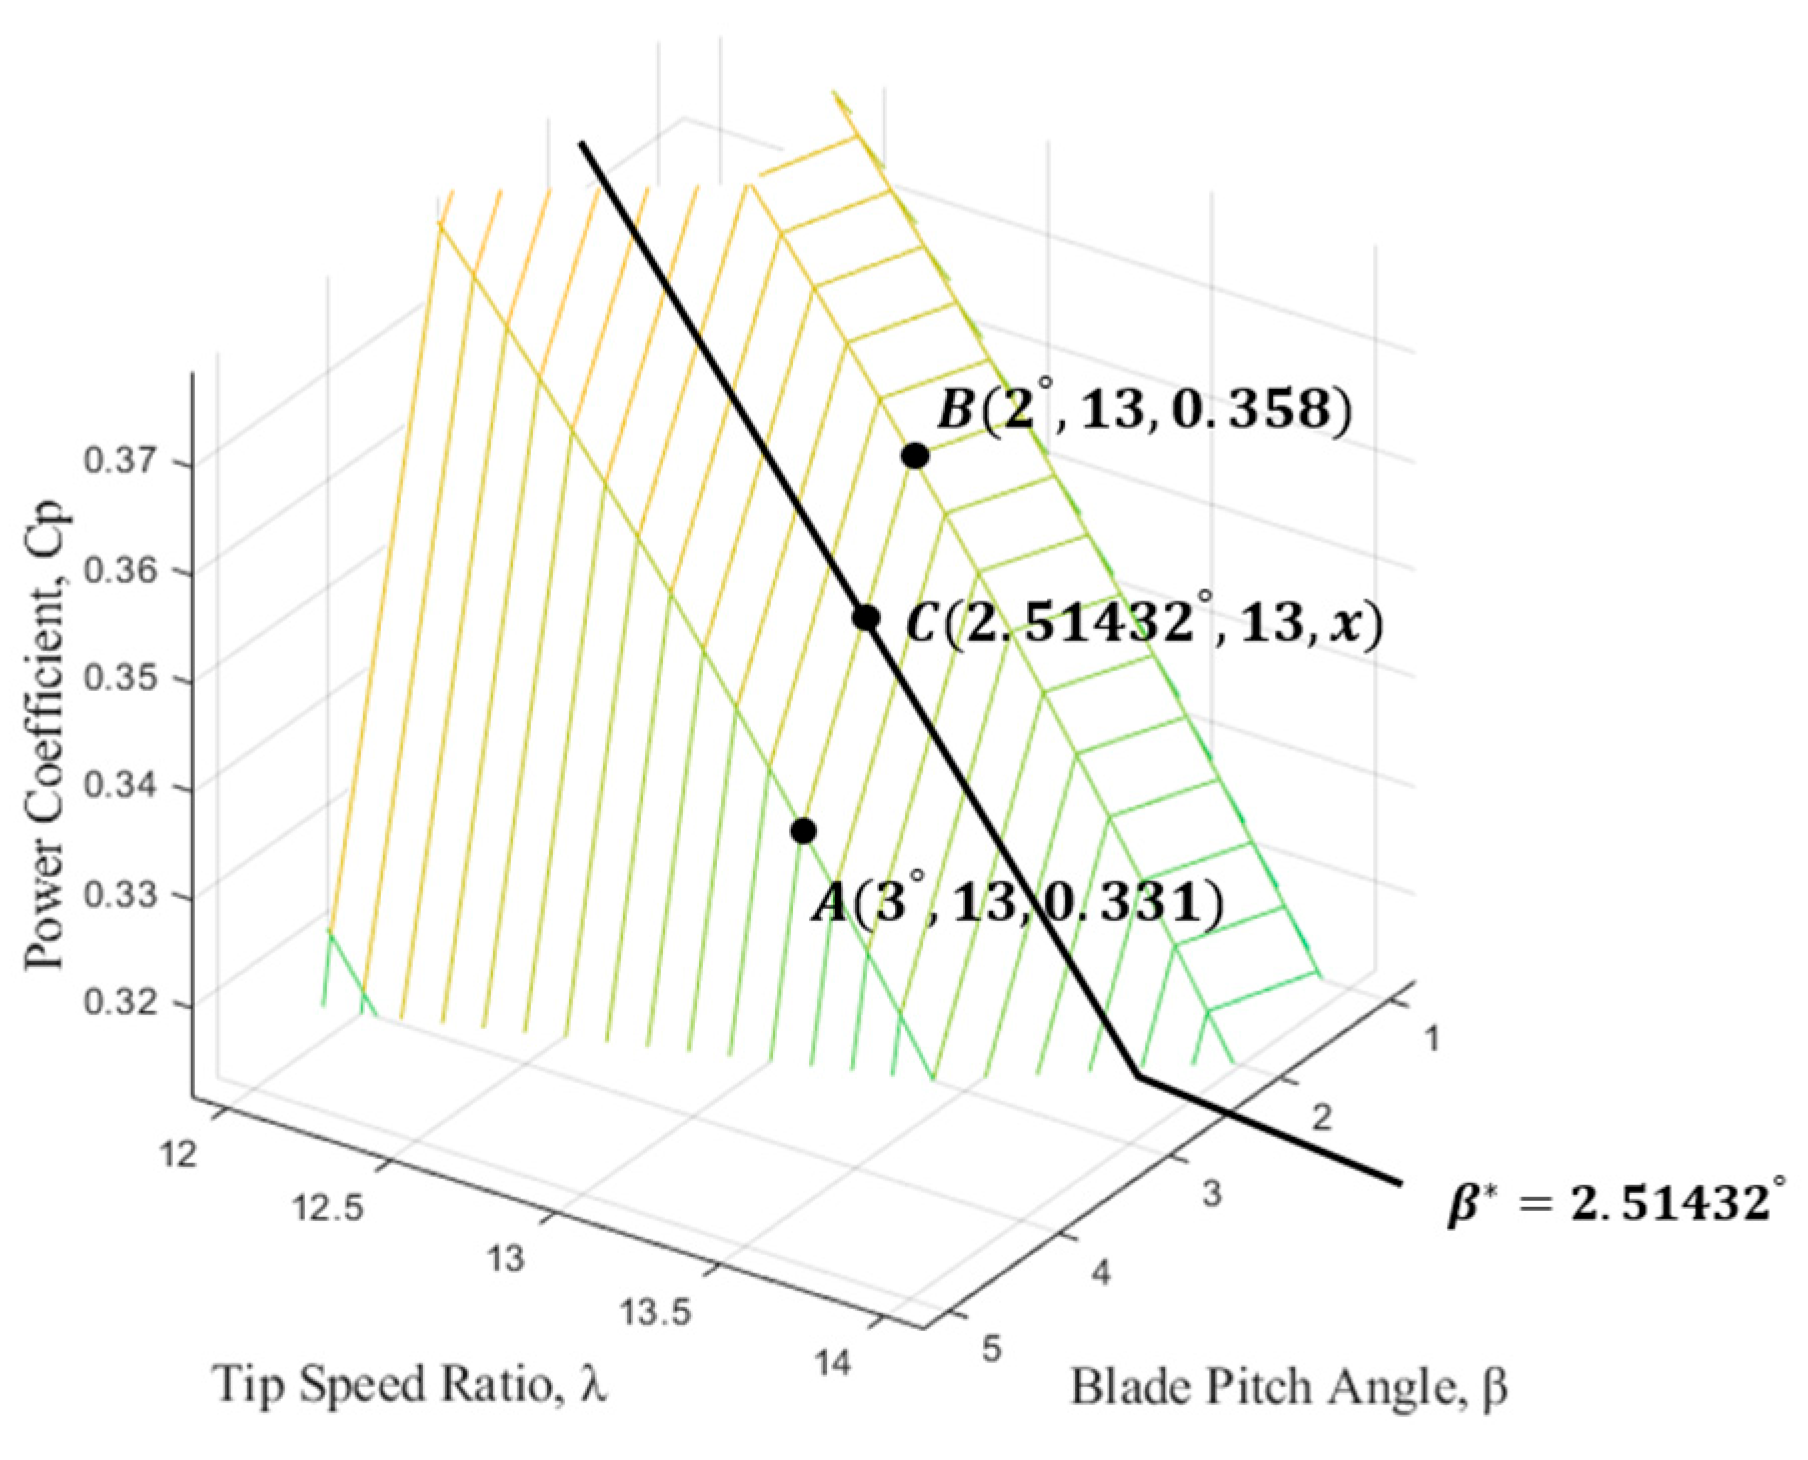
2.4. Pitch Controller

The pitch controller ensures that the turbine output remains within rated limits under high wind conditions, corresponding to Region 4 in Figure 4. To do this, it adjusts the power coefficient C p to reduce the collected wind energy, which is proportional to the cube of the wind speed.
Due to the nonlinear relationship between pitch angle and output, gain scheduling is employed to maintain uniform response characteristics, ensuring that the turbine output does not exceed its rated capacity even as wind speed continues to rise [30].

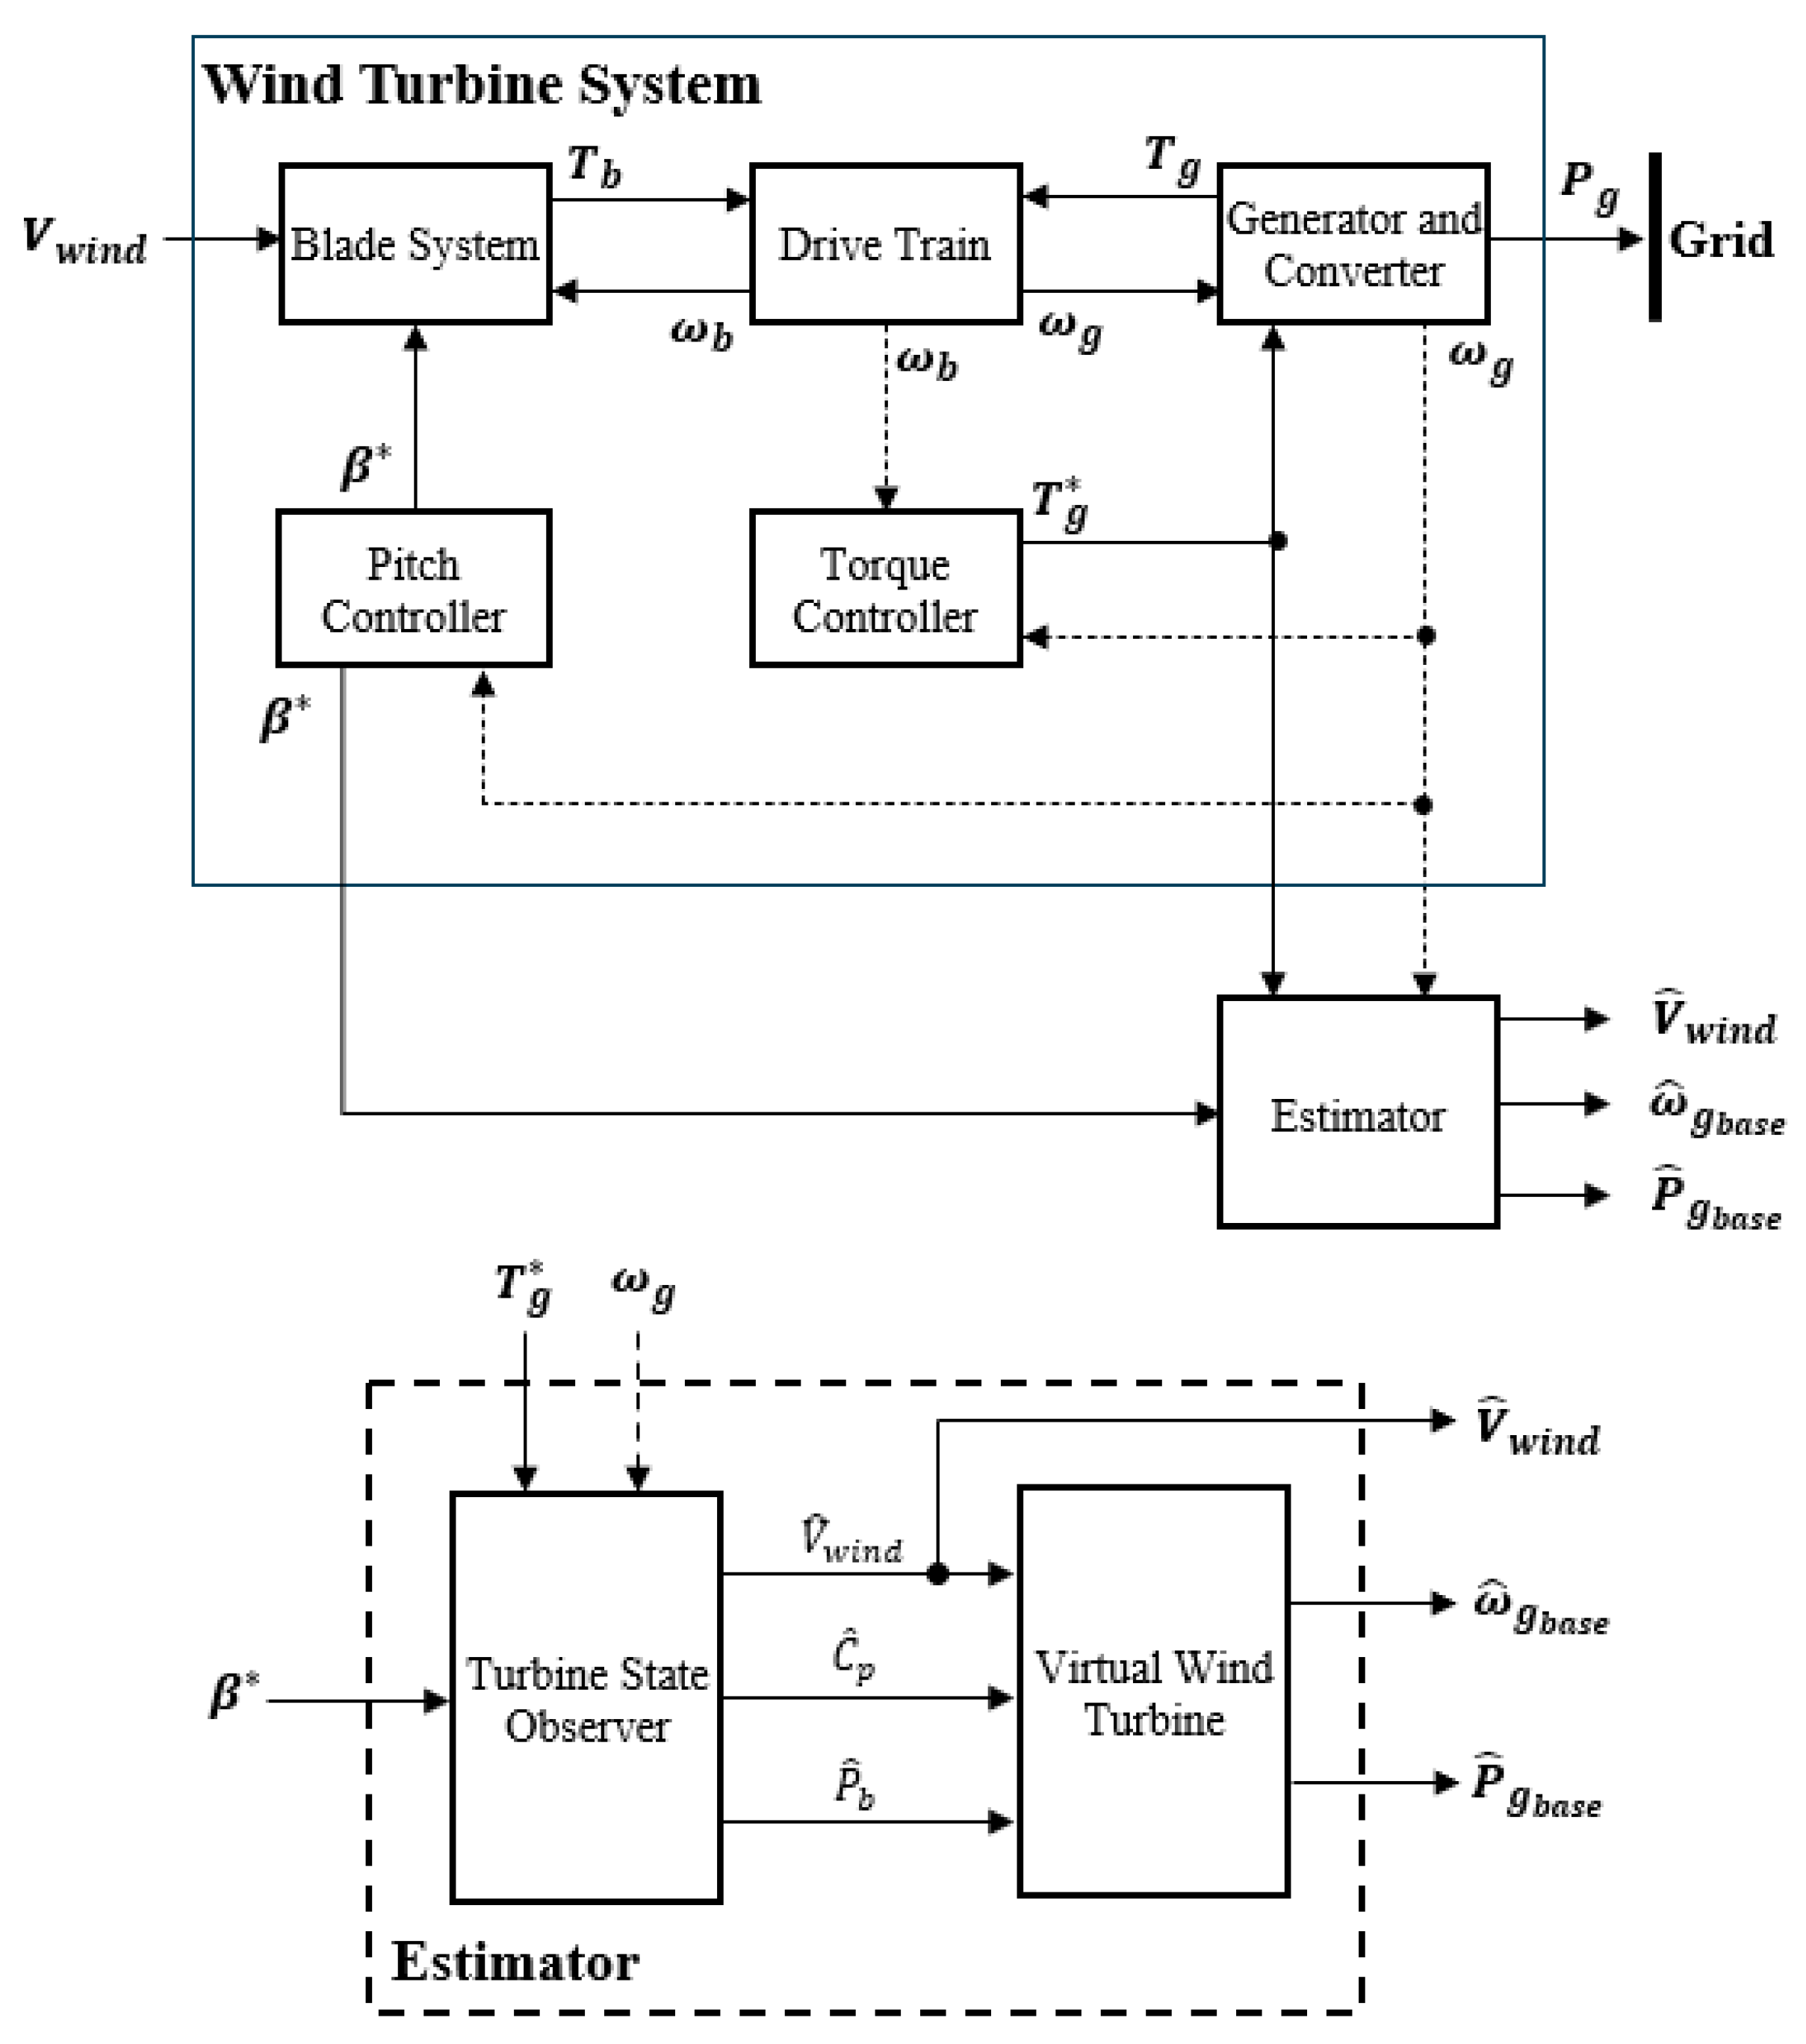
3. Proposed Estimator Based on a Virtual Wind Turbine Model

In the previous section, the key components of the wind turbine system, its operating regions based on wind speed, and the control system were described. Based on this, this section proposes a model that enables comparison of the overall turbine state under identical wind speed and grid frequency conditions, with and without frequency support functionality.
By using this model, the operating point of a wind turbine without frequency support can be estimated under the same wind conditions, allowing for the evaluation of the turbine’s contribution to frequency stability when frequency support is active.
Figure 2 presents a block diagram of the wind turbine system and the proposed estimator model. As shown in the lower part of Figure 2, the turbine state observer model receives real-time turbine operating data and provides estimated values to the virtual wind turbine model, which then outputs the equivalent wind speed acting on the rotor as well as the generator’s active power P ^ g b a s e and generator speed ω ^ g b a s e . Details of the proposed estimator are shown in Figure 5.
In this paper, variables with the subscript “base” denote the outputs of the virtual wind turbine operating under baseline control, where no frequency support function is applied.

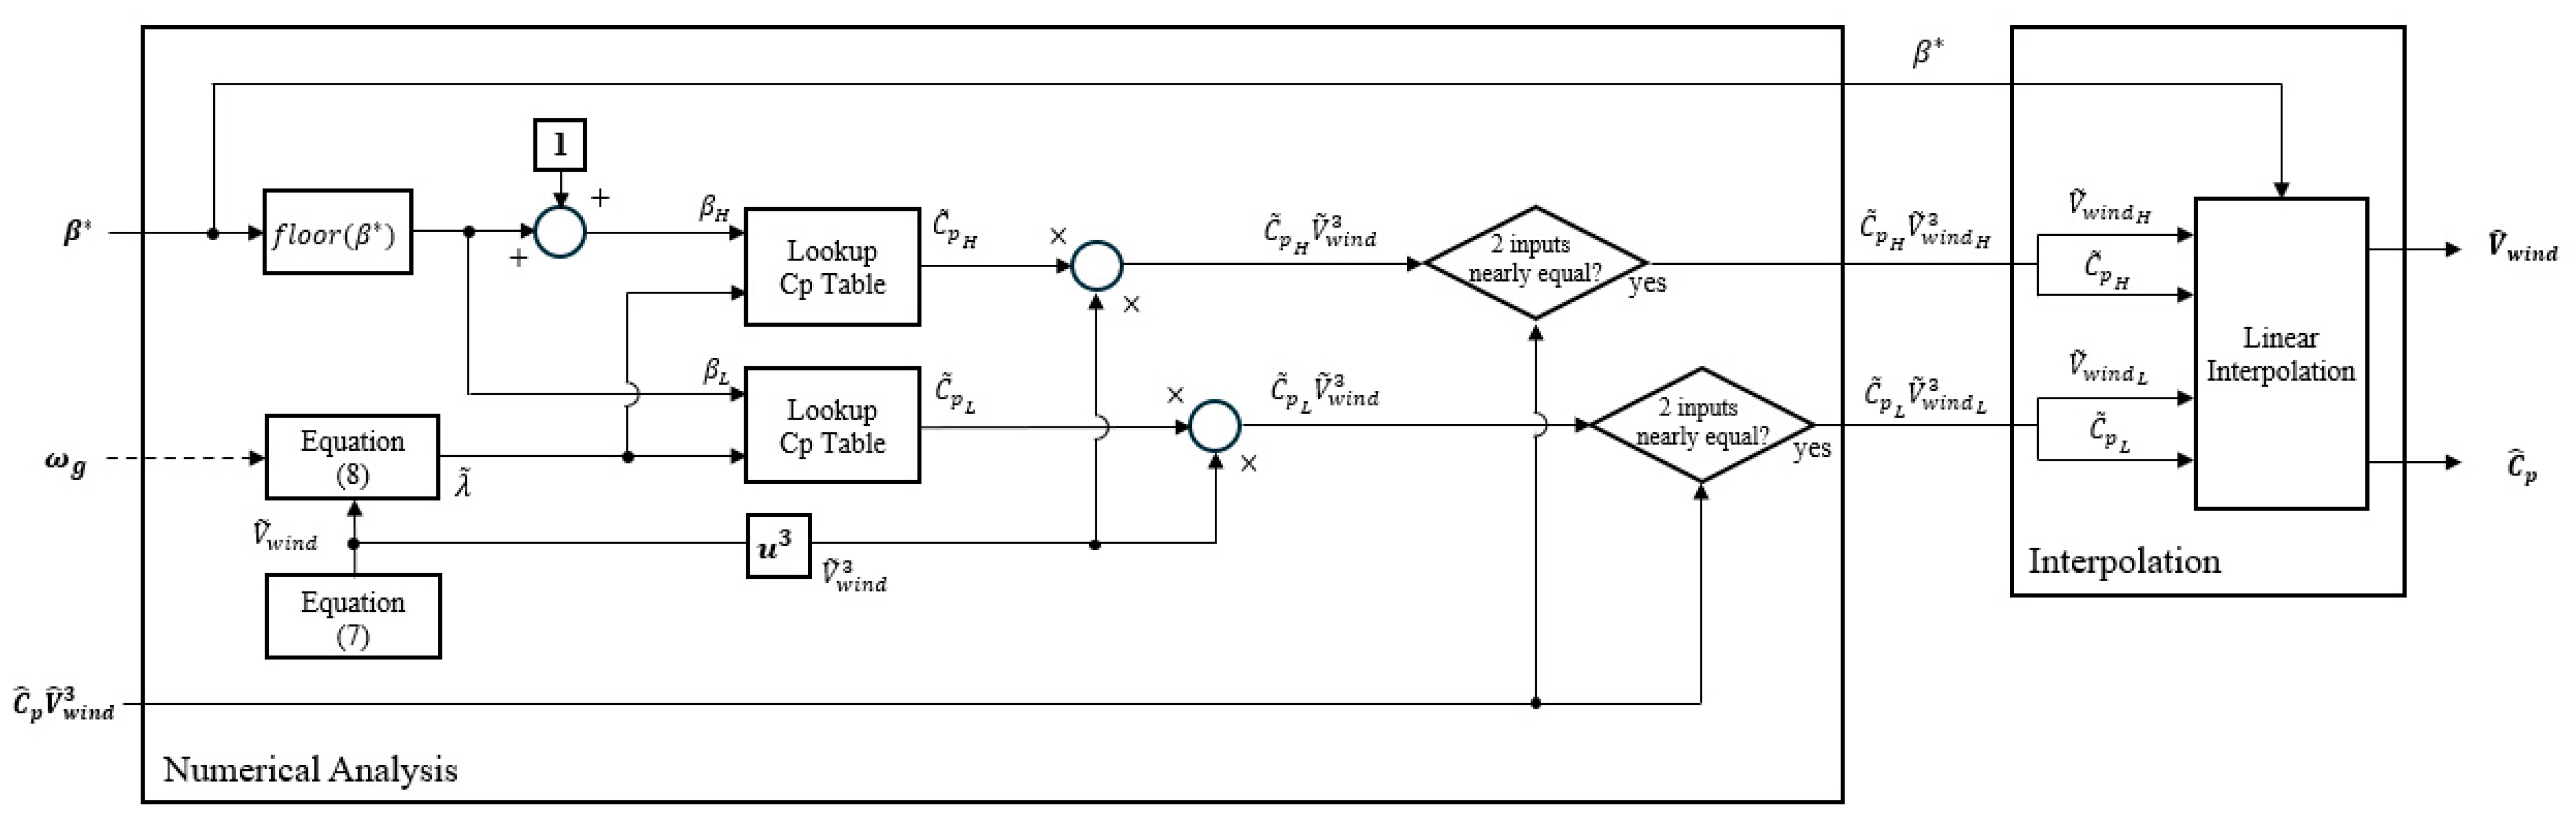
3.1. Turbine State Observer

As shown in the left block of Figure 5, the turbine state observer receives the generator torque command T g * , generator speed ω g , and blade pitch angle reference β * . It then estimates the current wind speed V ^ w i n d , power coefficient C ^ p , and blade output power P ^ b .
Before calculating the torque acting on the blade shaft, the observer first computes the acceleration torque component T α , which reflects the influence of turbine acceleration or deceleration, as given by the following equation:
T α = J b + J g G R 2 ω g ω g o l d T s a m p
The acceleration torque is calculated using the measured change in generator speed and the moments of inertia of both the blade and generator, applying the rotational form of Newton’s second law. Since the wind turbine’s low-speed shaft inertia must be converted to high-speed shaft inertia through the gearbox, the low-speed side inertia is divided by the square of the gear ratio G R .
To obtain angular acceleration, the observer subtracts the previous generator speed sample from the current one and divides by the sampling period T s a m p . Then, the acceleration torque is added to the generator torque command and multiplied by the drivetrain efficiency to yield the estimated blade torque. Finally, the blade power is estimated by the following equation:
P ^ b = T g + J b + J g G R 2 ω g ω g o l d T s a m p / η D T · ω g
Meanwhile, using Equations (1) and (2), the expression can be transformed into the form of following equation:
C ^ p V ^ w i n d 3 = 2 P ^ b ρ π R 2
where the right-hand side is determined by Equation (5), allowing the left-hand side to be numerically decomposed into the power coefficient C ^ p and wind speed V ^ w i n d .
As shown in Figure 6, the “Numerical Analysis” module—part of the turbine state observer presented in Figure 5—incrementally increases the estimated wind speed V ^ w i n d , starting from 0.1 m/s, according to the following equation:
V ~ w i n d + = 0.01 ( V ~ w i n d < V c u t o f f )
where V c u t o f f denotes the cut-off wind speed of the wind turbine, which is typically set to 25 m/s in most systems.
For each value, the corresponding tip speed ratio λ ^ is calculated by the following equation:
λ = R ω g V w i n d · G R
Equation (8) is obtained by converting the tip speed ratio of the blade, corresponding to Equation (2), to the generator side.
The power coefficient C ^ p is retrieved from a pre-defined lookup C p table based on the tip speed ratio λ ^ and blade pitch angle β * . That is, the term C ^ p V ^ w i n d 3 is calculated step-by-step, and the wind speed that results in a value closest to the estimated C ^ p V ^ w i n d 3 is selected. In other words, the numerical analysis loop in Figure 6 is iterated until a value that closely matches the previously calculated C ^ p V ^ w i n d 3 is found, and the process does not proceed to the next step until this condition is met. The C p lookup table, shown in Figure 7, contains discrete values of C p as a function of λ ^ and β * , typically provided by the turbine manufacturer.
Because the C p table is not continuous, interpolation is required to retrieve C ^ p for a given β * . In this study, a C p table with a 1° pitch angle resolution is used. For each given pitch angle command, two adjacent data points are used to perform numerical calculations, and linear interpolation is applied to obtain the final estimates for the power coefficient C ^ p and wind speed V ^ w i n d .
For example, as shown in Figure 7, if the estimated tip speed ratio is λ = 13 and the reference of the blade pitch angle is β * = 2.51432 ° , the observer retrieves C ^ p values at the nearest lower and upper pitch angles, and performs linear interpolation, assuming C ^ p varies linearly with pitch.

3.2. Virtual Wind Turbine

As shown in the right block of Figure 5, the virtual wind turbine receives estimated values from the turbine state observer and outputs the generator power P ^ g b a s e and generator speed ω ^ g b a s e under the baseline control.
The embedded blade module inside the virtual wind turbine takes the estimated wind speed V ^ w i n d , estimated blade pitch angle β ^ b a s e , and blade rotational speed ω ^ b b a s e as inputs. Using the C p lookup table, it returns the power coefficient C ^ p b a s e , which is then used to calculate the blade power P ^ b b a s e as the following equation:
P ^ b b a s e = C ^ p b a s e C ^ p P ^ b
To compute the power coefficient C ^ p b a s e of the virtual wind turbine, an interpolation process for the blade pitch angle β ^ b a s e is required in order to access the corresponding value from the C p lookup table, following the same procedure described in Figure 6.
The drive train module, torque controller, and pitch controller in the virtual wind turbine are the same as those used in the actual wind turbine model.
Upon initialization, the internal variables of the virtual wind turbine are set to the current operating point of the real wind turbine. As the simulation progresses, the virtual wind turbine continuously receives estimated values from the turbine state observer and operates under baseline control.
Finally, the generator performs MPPT or PI-based speed control depending on whether the generator speed ω ^ g b a s e is below or above the rated value, and outputs P ^ g b a s e .

4. Simulation Results and Discussions

4.1. Case Study

In this section, the estimator proposed in Section 3 is applied to a Type 4B wind turbine system, and simulation scenarios are described to validate its performance. The wind turbine model is implemented in MATLAB/Simulink based on the block diagram shown in Figure 2 and is operated by switching control modes according to varying wind speed, as depicted in Figure 4. The simulation time step is set to 100 µs, while the controller and estimator operate with a sampling period of 10 ms.
The parameters used for modeling are based on the U151E 4.5MW wind turbine model from Unison, as listed in Table 1. The turbine model is constructed using transfer function-based mathematical blocks. As stated in Section 2, the electrical characteristics and associated converter models are excluded in this study.
Figure 8 illustrates two different wind speed profiles and grid frequency conditions. In Case 1, the wind profile has an average speed of 6.5 m/s, a maximum of 7.789 m/s, a minimum of 4.805 m/s, and a turbulence intensity of 10%. The corresponding grid frequency profile has an average of 60.02 Hz, a maximum of 60.097 Hz, and a minimum of 59.910 Hz. Since the blade rotational speed does not reach the rated value, MPPT control is applied throughout the simulation.
On the other hand, Case 2 involves a high wind speed condition with an average of 10 m/s, a maximum of 11.289 m/s, a minimum of 8.571 m/s, and a turbulence intensity of 10%. The grid frequency in this case has an average of 60.12 Hz, with a maximum of 60.20 Hz and a minimum of 60.01 Hz. Under Case 2, the wind turbine operates in the speed control region and activates pitch control when the generator output exceeds the rated level. In high-frequency conditions, turbines performing frequency support functions increase the blade pitch angle to reduce generator output.
In Case 3, the wind profile represents a moderate wind speed condition, with an average wind speed of 8 m/s, a maximum of 9.587 m/s, a minimum of 6.819 m/s, and a turbulence intensity of 10%. The corresponding grid frequency profile has an average value of 59.98 Hz, with a maximum of 60.072 Hz and a minimum of 59.92 Hz. Unlike Case 1, which assumes typical MPPT operation, and Case 2, which simulates high wind speed and high-frequency conditions that significantly affect the operating point due to the activation of frequency support functions, Case 3 represents a transitionary operational scenario. In this case, the wind turbine frequently switches between MPPT, speed control, and pitch control modes in response to moderate wind fluctuations and varying generator output levels.
For performance comparison, two identical wind turbine models are configured under the same wind speed and frequency conditions. Turbine No. 1 operates under baseline control without considering grid frequency variations, while Turbine No. 2 performs both baseline control and frequency support. The proposed estimator is applied to Turbine No. 2, and its accuracy is evaluated by comparing its predicted generator operating point with the actual state of Turbine No. 1, which serves as a reference.
Turbine No. 2 simultaneously performs baseline control and frequency droop control, which adjusts active power in proportion to frequency deviation, as illustrated in Figure 9.
Unlike synchronous generators such as thermal or nuclear power plants, inverter-based renewable generation allows for faster control responses [12]. Therefore, frequency support with a small droop coefficient is feasible. Accordingly, a 1% droop coefficient is applied in Case 1 and Case 3, and 0.5% is applied in Case 2. Since Case 2 involves a higher grid frequency, the turbine’s active power response becomes twice as sensitive to frequency deviations. Thus, the robustness of the proposed estimator is verified by comparing the mechanical operating point of Turbine No. 2, affected by droop control, with that of Turbine No. 1.
Because the estimated variables differ in units and scales, and there are moments when the pitch angle of Turbine No. 1 reaches zero, the performance of the proposed estimator is quantitatively evaluated using the weighted mean absolute percentage error (WMAPE), as defined in the following equation:
W M A P E = x x ^ x × 100
where x denotes the actual value and x ^ denotes the estimated value. Specifically, x corresponds to the state of Turbine No. 1, while x ^ is the output of the estimator applied to Turbine No. 2.

4.2. Case 1: Average Wind Speed 6.5 m/s, Average Frequency 60 Hz, Droop Coefficient 1%

Figure 10 shows the simulation results for Case 1, where the turbine operates solely under MPPT control, corresponding to Operating Region 2 in Figure 4.
The subplots present time series data of (a) wind speed, (b) generator speed, (c) generator power, and (d) blade pitch angle. In Figure 10a, the green solid line indicates the actual wind input, while the black solid line represents the estimated wind speed by the proposed estimator. In Figure 10b,c, the red line shows the state of Turbine No. 1, the blue line represents Turbine No. 2, and the black dashed line indicates the estimator’s prediction.
As shown in Figure 10c, Turbine No. 1 performs only MPPT control based on wind variation without any frequency support, and the generator power fluctuates accordingly. In contrast, the output of Turbine No. 2 varies inversely with frequency deviation due to droop control. Consequently, Figure 10b demonstrates that the generator speed of Turbine No. 2 is affected by both wind and grid frequency. Despite this, the proposed estimator accurately predicts the state of Turbine No. 1, evidenced by the close overlap between the red and black lines. Additionally, Figure 10a confirms that the estimator tracks the actual wind speed in real time using the turbine state observer introduced in Section 3. Since the turbine remains in Operating Region 2, the pitch angle remains zero for both turbines, as seen in Figure 10d.

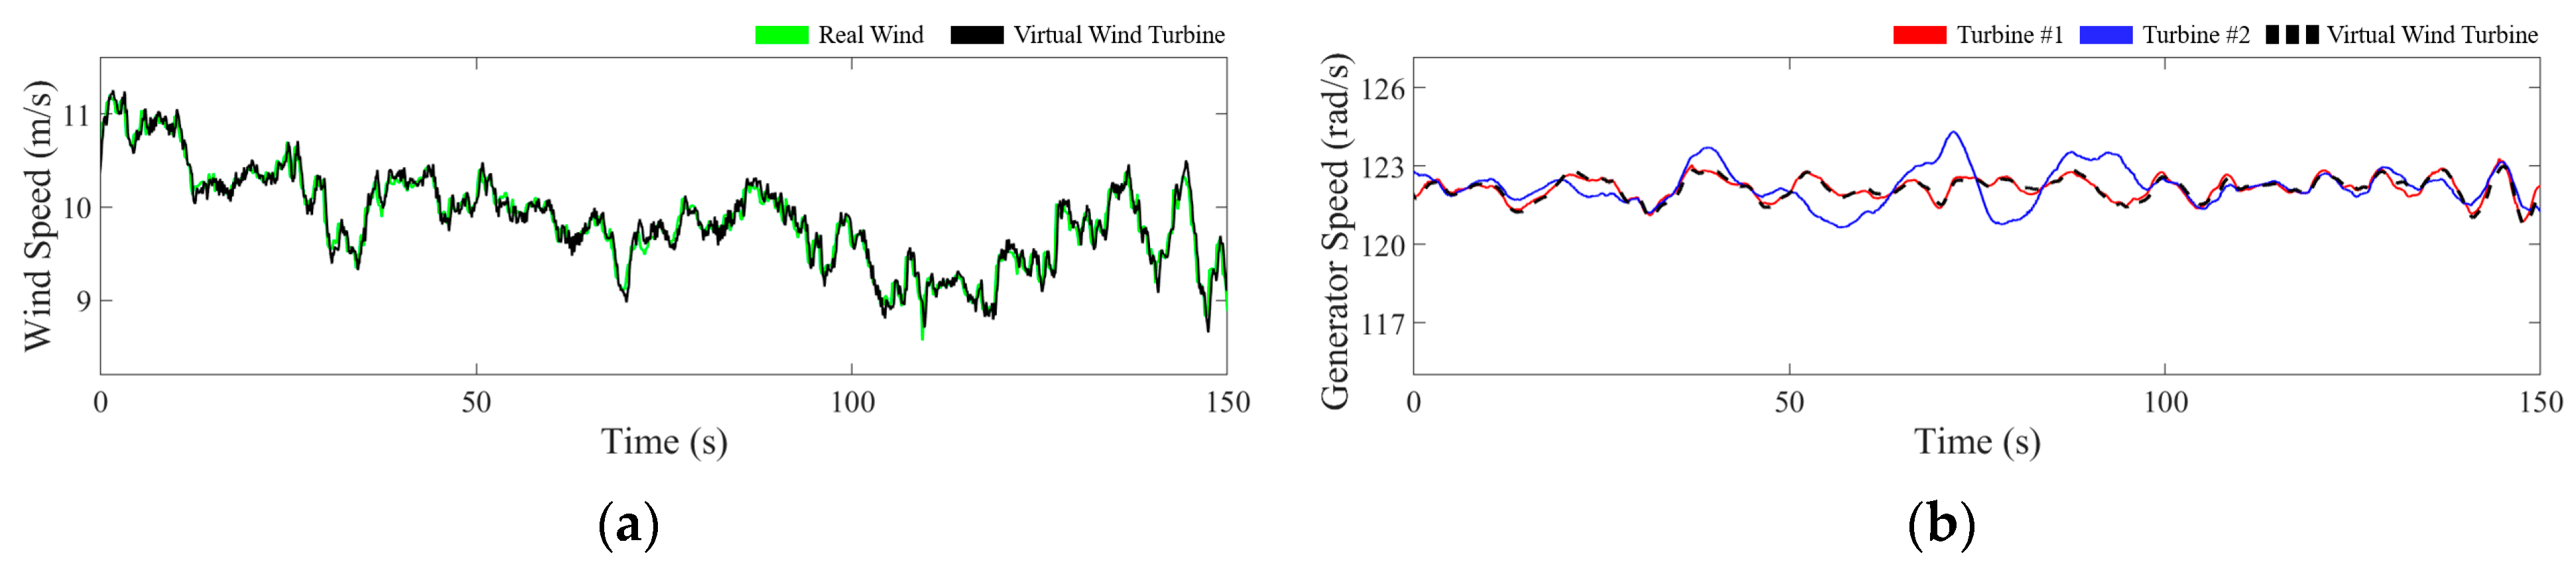
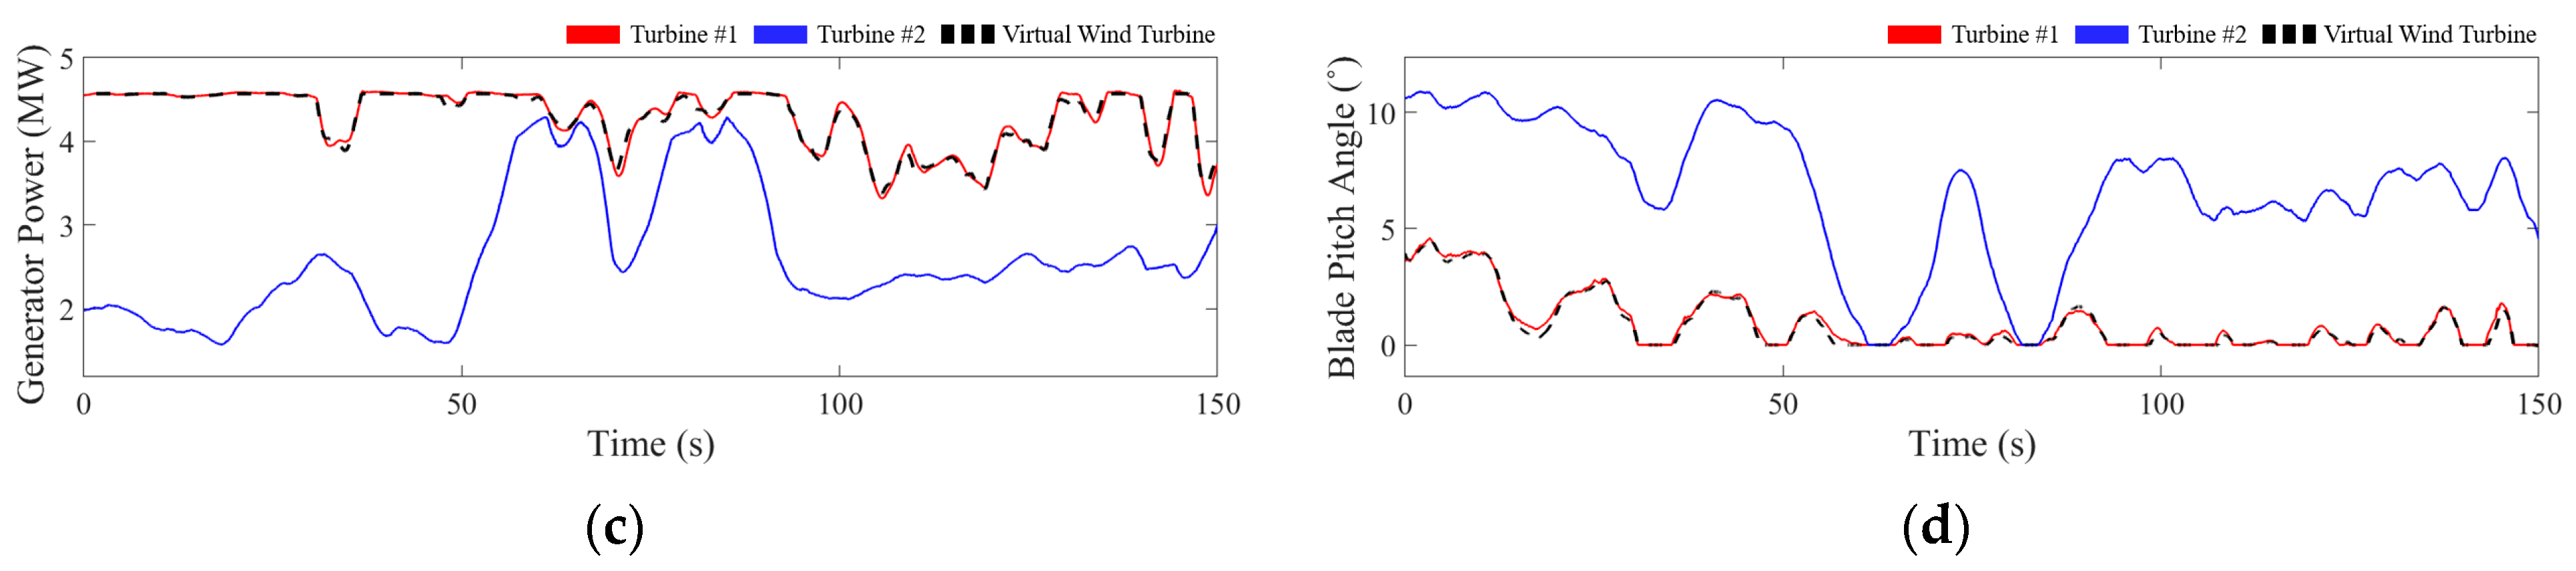
4.3. Case 2: Average Wind Speed 10 m/s, Average Frequency 60.1 Hz, Droop Coefficient 0.5%

Figure 11 illustrates the simulation results for Case 2, where the turbine enters the extended high wind operating region (Region 2.5 and 3 in Figure 4).
As wind speed increases, the turbine performs pitch control to prevent the generator speed from exceeding the rated value while maintaining constant power output. As shown in Figure 11c,d, when the output exceeds the rated value, Turbine No. 1 increases the blade pitch angle to maintain the rated output, and the blade pitch angle varies in line with wind speed changes.
To evaluate the estimator’s performance in the pitch control region, Case 2 applies more severe conditions than Case 1. The droop coefficient is reduced to 0.5% to make Turbine No. 2 more sensitive to frequency changes, and the average frequency is set to 60.1 Hz. Figure 11c shows that the generator power of Turbine No. 2 decreases to mitigate the elevated grid frequency, with the blue line consistently below the red line. Conversely, Figure 11d shows that the pitch angle of Turbine No. 2 (blue line) remains higher than that of Turbine No. 1 (red line).
Between 50 and 70 s, as shown in Figure 8, grid frequency decreases to 60 Hz, reducing the impact of droop control on Turbine No. 2. During this period, the blue lines in Figure 11c,d converge toward the red lines, diverging again as the frequency rises. Despite the significant deviation in the operating point of Turbine No. 2 compared to Turbine No. 1, the proposed estimator continues to track the reference turbine’s state accurately.

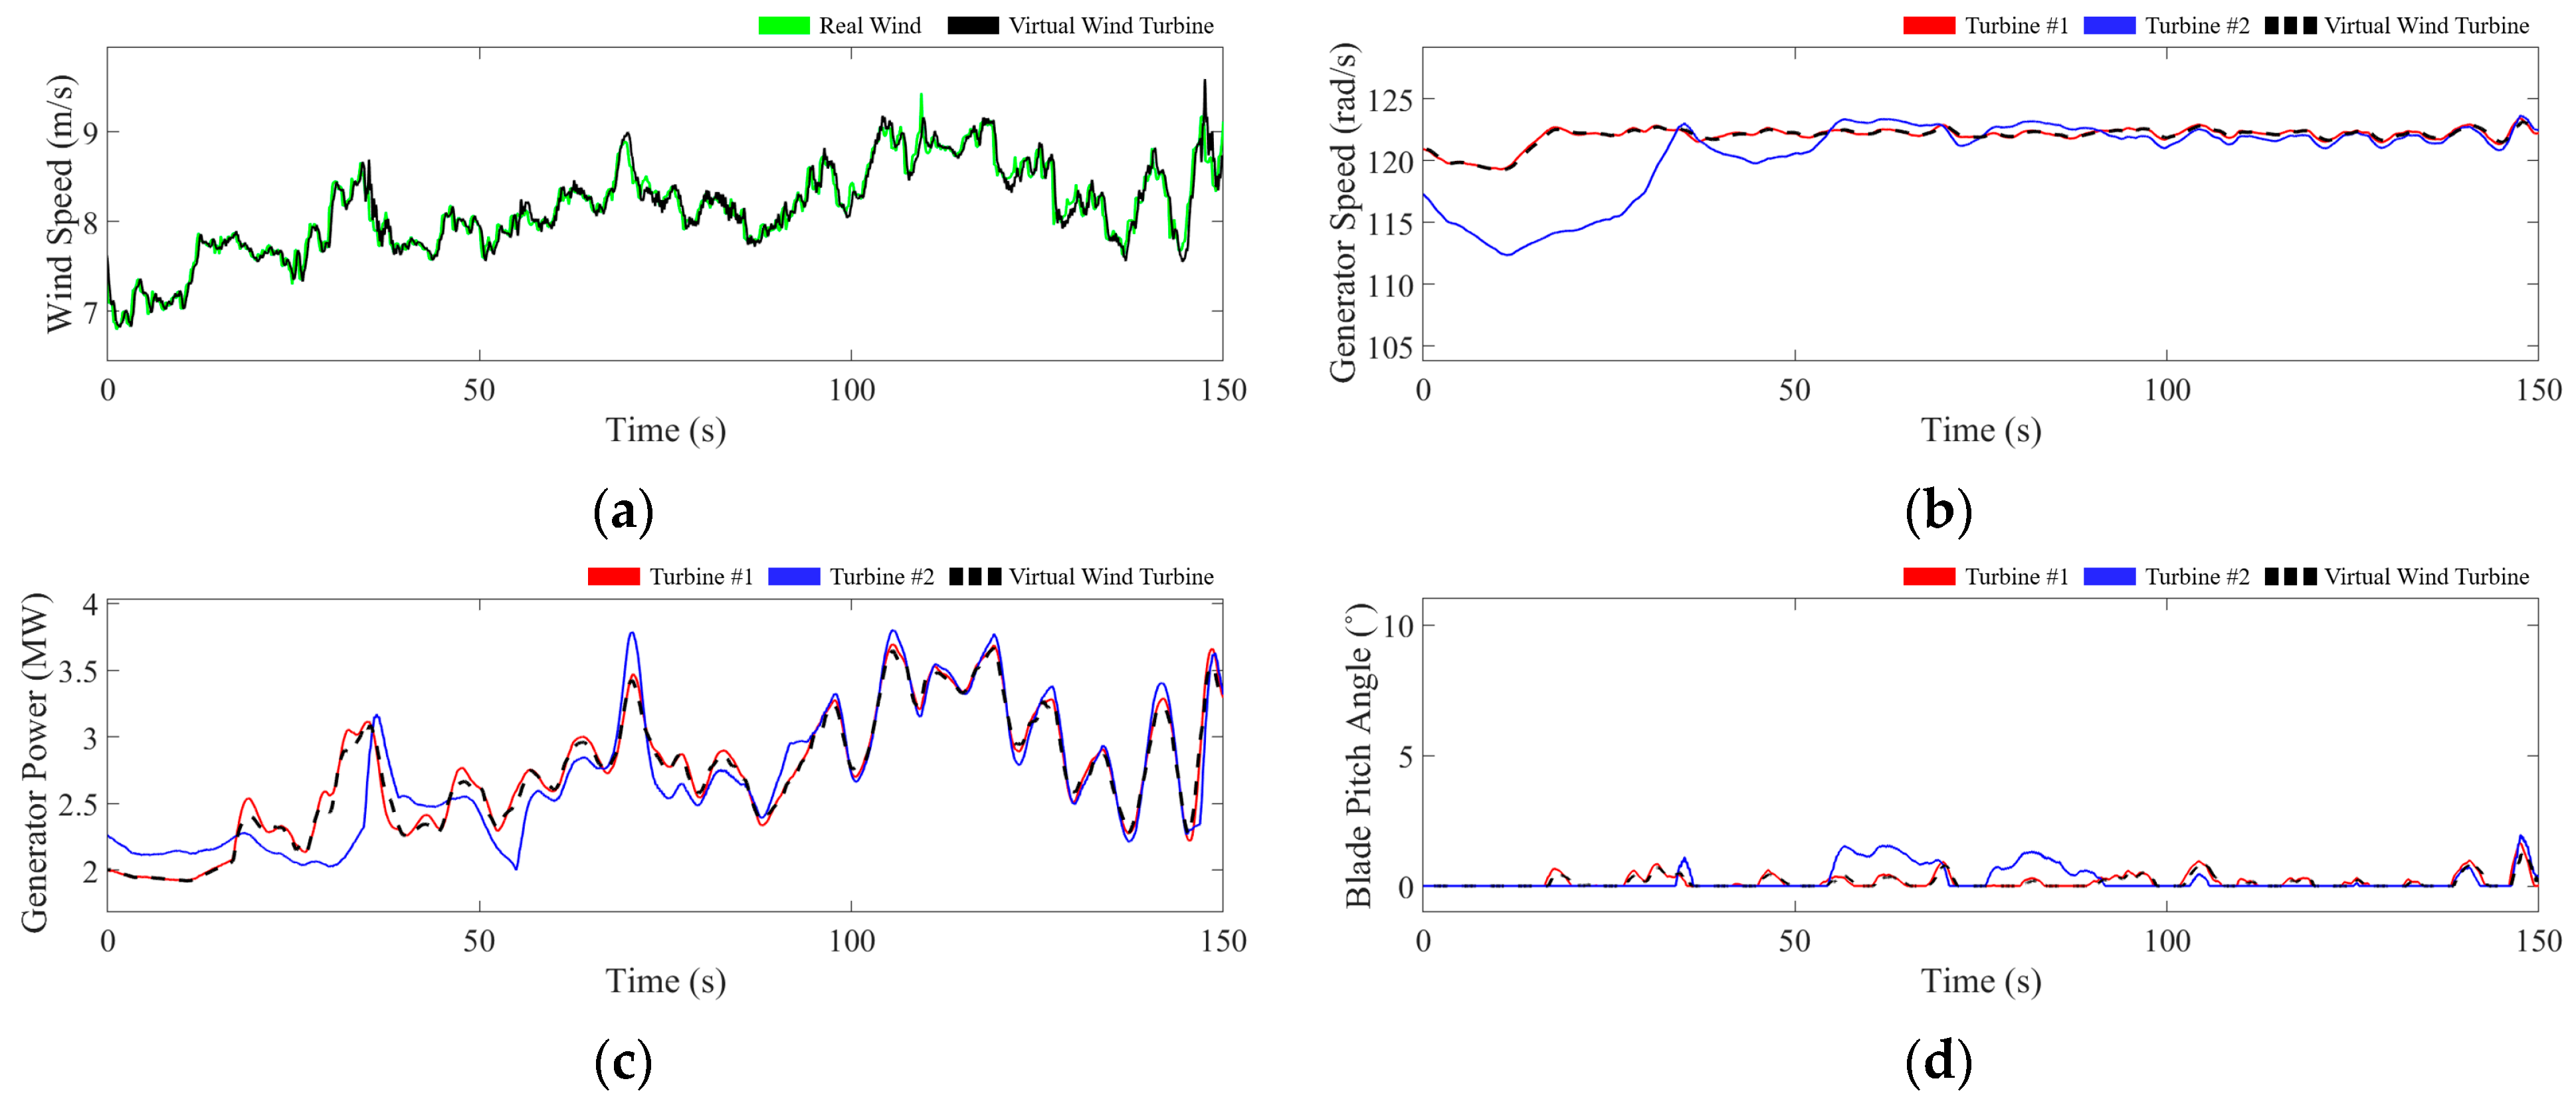
4.4. Case 3: Average Wind Speed 8 m/s, Average Frequency 60 Hz, Droop Coefficient 1%

Figure 12 illustrates the simulation results for Case 3, where the turbine enters the moderate wind operating region (Region 2, 2.5, and 3 in Figure 4).
From 0 to 20 s, the wind turbine operates MPPT control. As shown in Figure 12b, the generator speed remains below its rated value, and the output power of the turbine exhibits a relatively smooth trend compared to the subsequent speed-controlled operation period, as illustrated in Figure 12c. Since neither the rated speed nor the rated power output is reached during this interval, the pitch controller remains inactive, as indicated in Figure 12d.
Starting at approximately 20 s, the equivalent wind speed input to the turbine, represented by the green waveform in Figure 12a, begins to increase. In response, the turbine transitions into the speed control region. To prevent excessive increases in the generator speed and output power of Turbine No. 1, the pitch controller becomes intermittently active, as depicted in Figure 12d.
In contrast, the output of Turbine No. 2 responds inversely to frequency deviations due to droop control. As observed in the grid frequency profile in Figure 8, a period between approximately 55 and 90 s shows a significant frequency rise above 60 Hz. These frequency increases are clearly reflected in the generator speed and output power of Turbine No. 2, as shown in Figure 12b,c. To mitigate high-frequency events, the droop controller reduces the electromagnetic torque reference, resulting in an increase in generator speed and a decrease in active power output. Conversely, during periods when the grid frequency drops below 60 Hz, the torque reference is increased to boost power output.
Despite these dynamic changes, the estimated operating point, represented by the black dashed line, remains closely aligned with that of Turbine No. 1, even though the estimator is embedded within Turbine No. 2, which is performing droop control. This confirms the effectiveness of the proposed estimation approach under varying operational modes and frequency conditions.

4.5. Robustness Evaluation of Proposed Model Using WMAPE

Table 2 presents the WMAPE results for key variables under each case to quantitatively assess the performance of the proposed virtual wind turbine model. From top to bottom, WMAPEs are reported for wind speed, generator speed, generator power, and blade pitch angle.
In Case 1, where the turbine operates exclusively within the MPPT region, the blade pitch angle remains fixed at 0° throughout the simulation, and thus its WMAPE is not computed. Under an average wind speed of 6.5 m/s, the WMAPE of the estimated wind speed is 1.206%, indicating the model’s ability to accurately track wind variations in real time. The WMAPEs for generator speed and power are 0.2912% and 0.8767%, respectively, even lower than the wind speed estimation error. This result reflects the low-pass filtering effect introduced by the turbine’s rotational inertia, which smooths out fluctuations in aerodynamic torque.
In contrast, Case 2 assumes a high wind scenario with an average speed above 10 m/s, where the pitch control becomes active and the blade pitch angle β * varies over time. Consequently, the estimator performs linear interpolation as described in Figure 7 to obtain the power coefficient C ^ p , resulting in a pitch angle WMAPE of 8.458%, the highest among the evaluated parameters. The wind speed estimation error rises to 3.758% due to the sensitivity of the numerical solution to C ^ p , which itself depends on the interpolated pitch angle. Despite this, the WMAPEs for generator speed and power are 0.0785% and 0.8406%, respectively, lower than those of Case 1.
Finally, in Case 3, the estimation of wind speed yields the smallest error among the three cases, with a WMAPE of only 1.050%. However, the blade pitch angle estimation exhibits the largest error, reaching a WMAPE of 19.63%. This comparatively high value is primarily attributed to the low cumulative sum of the actual blade pitch angle of Turbine No. 1, which appears in the denominator of the WMAPE calculation. As a result, even small absolute deviations in pitch angle estimation lead to a relatively large percentage error when compared to Case 2.
Despite the high error in blade pitch angle estimation, the WMAPE of generator power remains as low as 1.329%, demonstrating the estimator’s excellent performance in tracking the turbine’s mechanical output. These results reaffirm the robustness and reliability of the proposed estimator, even under conditions involving frequent switching between MPPT, speed control, and pitch control. The model’s ability to maintain accurate estimation of generator states despite nonlinear dynamics and control mode transitions further highlights its applicability for real-time wind turbine monitoring and advanced control strategies.

5. Conclusions

This study proposed an estimation model based on a virtual wind turbine, which enables real-time estimation of the operating point of a wind turbine under frequency support conditions, assuming the turbine does not provide any grid support. The proposed model employs a turbine state observer to estimate wind speed and power coefficient, and subsequently calculates key mechanical states such as generator speed, generator power, and blade pitch angle under baseline control conditions. A numerical calculation technique based on a predefined C p lookup table and linear interpolation were applied to ensure the estimator operates accurately across various control modes, including MPPT, speed control, and pitch control.
To validate the proposed model, it was implemented in a MATLAB/Simulink-based Type 4B wind turbine system, and three case studies were conducted—Case 1 for MPPT-only operation, Case 2 for pitch control, and Case 3 for the whole operating region of the wind turbine. In each case, the proposed estimator used the output data of a frequency-supporting wind turbine to infer the mechanical states of an identical turbine operating without frequency support. The estimation performance was quantitatively assessed using the WMAPE for each variable. The results showed that WMAPEs for generator speed and power remained below 2% in every case, demonstrating high estimation accuracy. Even under high wind speed and pitch control conditions, the estimator successfully tracked the generator’s baseline operating point.
In conclusion, the proposed virtual wind turbine-based estimation model provides a reliable method for decoupling and analyzing the impact of grid frequency support functions on wind turbine dynamics. However, the proposed estimator relies on numerical analysis techniques that may require careful consideration of the controller’s computational speed for real-time implementation on actual wind turbine systems. Furthermore, the estimation accuracy depends heavily on the precision of the C p table derived from experimental data, implying that errors in the C p dataset could directly affect estimator performance. If these limitations are appropriately addressed through optimized implementation and accurate modeling, the proposed approach can offer even more robust and scalable solutions. The model shows strong potential for application in advanced wind turbine control strategies and comprehensive performance evaluations for grid-connected wind energy systems.

Author Contributions

Conceptualization, B.-H.W. and Y.-C.K.; methodology, B.-H.W. and Y.-C.K.; formal analysis, B.-H.W.; software, B.-H.W.; validation, B.-H.W. and Y.-C.K.; writing—original draft preparation, B.-H.W.; writing—review and editing, Y.-C.K. and S.-H.S.; visualization, B.-H.W.; supervision, S.-H.S.; project administration, S.-H.S. All authors have read and agreed to the published version of the manuscript.

Funding

This study was supported by the Korean Energy Technology Evaluation and Planning (KETEP) and Kwangwoon University (grant numbers 20223030020110 and 2025-0310).

Data Availability Statement

The datasets generated during and/or analyzed during the current study are available from the corresponding author upon reasonable request. The data are not publicly available due to confidentiality agreements.

Conflicts of Interest

The authors declare no conflicts of interest.

References

  1. EN 50160:2007; Voltage Characteristics of Electricity Supplied by Public Distribution Networks. European Committee for Electrotechnical Standardization (CENELEC): Brussels, Belgium, 2007.
  2. Wu, L.; Infield, D.G. Towards an assessment of power system frequency support from wind plant—Modeling aggregate inertial response. IEEE Trans. Power Syst. 2013, 28, 2283–2291. [Google Scholar] [CrossRef]
  3. Mohamed, Y.A.-R.I.; El-Saadany, E.F. Adaptive Decentralized Droop Controller to Preserve Power Sharing Stability of Paralleled Inverters in Distributed Generation Microgrids. IEEE Trans. Power Electron. 2008, 23, 2806–2816. [Google Scholar] [CrossRef]
  4. Dall’Asta, M.S.; Lazzarin, T.B. A Review of Fast Power-Reserve Control Techniques in Grid-Connected Wind Energy Conversion Systems. Energies 2024, 17, 451. [Google Scholar] [CrossRef]
  5. Zhang, J.; Li, H.; Cheng, P.; Yan, J. Interpretable Wind Power Short-Term Power Prediction Model Using Deep Graph Attention Network. Energies 2024, 17, 384. [Google Scholar] [CrossRef]
  6. Ullah, F.; Khan, H.; Mehmood, U.; Ali, M.; Rauf, M.; Kim, C.H. A Comprehensive Review of Wind Power Integration and Energy Storage Technologies for Modern Grid Frequency Regulation. Heliyon 2024, 10, e30466. [Google Scholar] [CrossRef]
  7. Wang, Z.; Bu, S. Probabilistic Frequency Stability Analysis Considering Dynamics of Wind Power Generation with Different Control Strategies. IEEE Trans. Power Syst. 2024, 39, 6412–6425. [Google Scholar] [CrossRef]
  8. Ibrahim, H.; Ghandour, M.; Dimitrova, M.; Ilinca, A.; Perron, J. Integration of wind energy into electricity systems: Technical challenges and actual solutions. Energy Procedia 2011, 6, 815–824. [Google Scholar] [CrossRef]
  9. Björk, J.; Pombo, D.V.; Johansson, K.H. Variable-Speed Wind Turbine Control Designed for Coordinated Fast Frequency Reserves. IEEE Trans. Power Syst. 2022, 37, 1471–1481. [Google Scholar] [CrossRef]
  10. Cheng, Y.; Azizipanah-Abarghooee, R.; Azizi, S.; Ding, L.; Terzija, V. Smart frequency control in low inertia energy systems based on frequency response techniques: A review. Appl. Energy 2020, 279, 115798. [Google Scholar] [CrossRef]
  11. Van de Vyver, J.; De Kooning, J.D.M.; Meersman, B.; Vandevelde, L.; Vandoorn, T.L. Droop control as an alternative inertial response strategy for the synthetic inertia on wind turbines. IEEE Trans. Power Syst. 2016, 31, 1129–1138. [Google Scholar] [CrossRef]
  12. Tan, Y.; Meegahapola, L.; Muttaqi, K.M. A suboptimal power-point tracking-based primary frequency response strategy for DFIGs in hybrid remote area power supply systems. IEEE Trans. Energy Convers. 2016, 31, 93–105. [Google Scholar] [CrossRef]
  13. Phung, B.N.; Wu, Y.-K.; Pham, M.-H. Novel Fuzzy Logic Controls to Enhance Dynamic Frequency Control and Pitch Angle Regulation in Variable-Speed Wind Turbines. Energies 2024, 17, 2617. [Google Scholar] [CrossRef]
  14. Karbouj, H.; Rather, Z.H.; Flynn, D.; Qazi, H.W. Non-synchronous fast frequency reserves in renewable energy integrated power systems: A critical review. Int. J. Electr. Power Energy Syst. 2019, 106, 488–501. [Google Scholar] [CrossRef]
  15. Vidyanandan, K.V.; Senroy, N. Primary frequency regulation by deloaded wind turbines using variable droop. IEEE Trans. Power Syst. 2013, 28, 837–846. [Google Scholar] [CrossRef]
  16. Boyle, J.; Littler, T. A Review of Frequency-Control Techniques for Wind Power Stations to Enable Higher Penetration of Renewables onto the Irish Power System. Energy Rep. 2024, 12, 5567–5581. [Google Scholar] [CrossRef]
  17. Trinh, D.-T.; Wu, Y.-K.; Pham, M.-H. Adaptive Frequency Control Strategy for PMSG-Based Wind Turbines with Improved Rotor Speed Recovery. IEEE Access 2024, 12, 63853–63864. [Google Scholar] [CrossRef]
  18. Jiang, B.; Guo, C.; Chen, Z. Modeling the Coupling of Rotor Speed, Primary Frequency Reserve and Virtual Inertia of Wind Turbines in Frequency Constrained Look-Ahead Dispatch. IEEE Trans. Sustain. Energy 2024, 15, 1885–1899. [Google Scholar] [CrossRef]
  19. Kim, Y.-C.; Song, S.-H. Validity Study of foreign Technical Standards for Frequency-Based Synthetic Inertia Through Analysis of Wind Turbines and Power System Dynamics. Trans. Korean Inst. Power Electron. 2023, 28, 377–386. [Google Scholar] [CrossRef]
  20. Chowdhury, M.M.; Haque, M.E.; Aktarujjaman, M.; Negnevitsky, M.; Gargoom, A. Grid integration impacts and energy storage systems for wind energy applications—A review. In Proceedings of the 2011 IEEE Power and Energy Society General Meeting, Detroit, MI, USA, 24–28 July 2011; pp. 1–8. [Google Scholar]
  21. Gupta, A. Integration Challenges of Wind Power on Power System Grid: A Review. In Proceedings of the 2018 International Conference on Advanced Computation and Telecommunication (ICACAT), Bhopal, India, 28–29 December 2018; pp. 1–7. [Google Scholar]
  22. Duong, M.Q.; Le, K.H.; Grimaccia, F.; Leva, S.; Mussetta, M.; Zich, R.E. Comparison of power quality in different grid-integrated wind turbines. In Proceedings of the 2014 16th International Conference on Harmonics and Quality of Power (ICHQP), Bucharest, Romania, 25–28 May 2014; pp. 448–452. [Google Scholar]
  23. Nguyen, N.; Mitra, J. Effect of wind power on load frequency control. In Proceedings of the 2016 IEEE Power and Energy Society General Meeting (PESGM), Boston, MA, USA, 17–21 July 2016; pp. 1–5. [Google Scholar]
  24. Wang, Y.; Li, Y.; Lin, S.; Cao, X.; Ren, Y.; Wu, Y. Analysis of Frequency Regulation Capability and Fatigue Loads of Wind Turbine Based on Over-Speed Control. Electronics 2023, 12, 2009. [Google Scholar] [CrossRef]
  25. Kim, Y.-C.; Woo, B.-H.; Song, S.-H. Real-Time Estimation of MPPT Reference Point in Frequency Droop Controlled Wind Turbines. Trans. Korean Inst. Power Electron. 2025, 30, 148–158. [Google Scholar] [CrossRef]
  26. Merabet, A.; Rajasekaran, V.; Kerr, J. Modelling and control of a pitch controlled wind turbine experiment workstation. In Proceedings of the IECON 2012—38th Annual Conference on IEEE Industrial Electronics Society, Montreal, QC, Canada, 25–28 October 2012; pp. 4316–4320. [Google Scholar]
  27. Jonkman, J.; Butterfield, S.; Musial, W.; Scott, G. Definition of a 5-MW Reference Wind Turbine for Offshore System Development; National Renewable Energy Laboratory: Golden, CO, USA, 2009.
  28. Kim, J.-J.; Song, S.-H. PSCAD/EMTDC simulation model of variable speed wind power generation system using permanent magnet synchronous machine. Trans. Korean Inst. Power Electron. 2005, 10, 253–256. [Google Scholar]
  29. Ha, K.; Bae, J.; Choi, Y.; Kim, Y.; Lee, J.; Han, J. Recent control technologies for floating offshore wind energy system: A review. Int. J. Precis. Eng. Manuf. Green Technol. 2021, 8, 281–301. [Google Scholar] [CrossRef]
  30. Nam, Y.-S. Wind Turbine System Control; GS Intervision: Seoul, Republic of Korea, 2013; pp. 28–37. [Google Scholar]
Figure 1. Configuration of the Type 4B wind turbine system.
Energies 18 02774 g001
Figure 2. Block diagram of a wind turbine including an estimator.
Energies 18 02774 g002
Figure 3. Blade power coefficient of offshore NREL 5MW wind turbine [27].
Energies 18 02774 g003
Figure 4. Operational regions of the wind turbine.
Energies 18 02774 g004
Figure 5. Block diagram of the proposed estimator.
Energies 18 02774 g005
Figure 6. Block diagram of the numerical analysis.
Energies 18 02774 g006
Figure 7. Example of linear interpolation using the C p table.
Energies 18 02774 g007
Figure 8. Wind and grid frequency profiles of all cases.
Energies 18 02774 g008
Figure 9. Characteristics of frequency droop control for wind turbines.
Energies 18 02774 g009
Figure 10. Simulation results for Case 1: (a) wind speed; (b) generator speed; (c) generator power; (d) blade pitch angle.
Energies 18 02774 g010
Figure 11. Simulation results for Case 2: (a) wind speed; (b) generator speed; (c) generator power; (d) blade pitch angle.
Energies 18 02774 g011aEnergies 18 02774 g011b
Figure 12. Simulation results for Case 3: (a) wind speed; (b) generator speed; (c) generator power; (d) blade pitch angle.
Energies 18 02774 g012
Table 1. Parameters of the UNISON U151E wind turbine.
SymbolValueUnit
R 75.5 m
G R 110.1
J b 6.882 · 10 7 k g m 2
J g 2.996 · 10 6 k g m 2
ρ 1.225 k g / m 3
λ o p t 11.4
C p m a x 0.474254
η D T 1
ω g r a t e 122.2 r a d / s
ω g m i n 69.18 r a d / s
Table 2. WMAPE results for each case.
CategoryCase 1 (%)Case 2 (%)Case 3 (%)
Wind speed1.2063.7581.050
Generator speed0.29120.07850.080
Generator power0.87670.84061.329
Blade pitch angle 8.45819.63
Disclaimer/Publisher’s Note: The statements, opinions and data contained in all publications are solely those of the individual author(s) and contributor(s) and not of MDPI and/or the editor(s). MDPI and/or the editor(s) disclaim responsibility for any injury to people or property resulting from any ideas, methods, instructions or products referred to in the content.

