1. Introduction
The agroindustry is a major consumer of energy, with greenhouse production being particularly energy-intensive due to the need for controlled environments to optimize crop yields, primarily for heating [
1]. Greenhouse farming enhances environmental conditions for crop growth by utilizing controlled microclimates to boost production [
2,
3]. The integration of intelligent decision systems and real-time monitoring can complement energy efficiency strategies in agricultural practices [
4] and reduce operational costs in controlled environments [
5].
In the context of tomato production, greenhouses are predominantly located in regions with favorable climatic conditions and access to energy resources. However, greenhouse tomato production in Europe exhibits significant regional disparities, particularly between northern and southern regions. Northern European greenhouses rely heavily on high-energy systems for heating and cooling, resulting in greater energy consumption compared to their southern counterparts, which benefit from greater natural sunlight. The primary energy sources used in greenhouse tomato production include natural gas, electricity, and, increasingly, renewable energy sources such as biomass and solar energy [
5]. The dependence on fossil fuels for heating during winter months leads to elevated greenhouse gas emissions, as evidenced by studies illustrating that countries like Austria experience higher emissions due to intensive heating systems [
6,
7], which are crucial for greenhouse operations. This discrepancy in energy use highlights the need for efficient energy management in greenhouses to enhance productivity and reduce operational costs [
1]. There is a growing trend toward integrating renewable energy sources to reduce reliance on fossil fuels and lower emissions. In this sense, the Netherlands exemplifies the adoption of advanced greenhouse technologies, emphasizing energy efficiency and renewable sources to reduce its dependence on fossil fuel resources [
8,
9]. Additionally, research indicates a substantial reduction in climate impact due to the transition to renewable energy, with a 61% decrease in the climate footprint of Finnish greenhouse vegetables from 2004 to 2017 [
7]. An extensive review developed by Cuce et al. (2016) on the renewable and sustainable energy-saving strategies of greenhouse systems analyzes different technologies applied in greenhouses, going from photovoltaic modules to phase change materials, passing through heat pumps, and others; it concludes that renewable and sustainable energy technologies are required to reach energy and greenhouse emission savings in the greenhouse sector; the investment can obtain 4 to 8 years of payback, depending on the technology chosen, climate zone, and crop type [
10]. Despite these promising developments, achieving consistent energy efficiency across diverse greenhouse systems remains a challenge, particularly for maintaining optimal growing conditions without excessive energy consumption [
8].
In recent years, industrial symbiosis (IS) has gained momentum in Europe as a strategy to improve resource efficiency and sustainability. IS involves the exchange of materials, energy, water, or other by-products between industries, fostering mutually beneficial relationships. This approach plays a crucial role in enhancing emission reductions in industrial settings, by promoting resource efficiency and sustainability in industrial processes [
11,
12].
Life Cycle Assessment (LCA) and Life Cycle Costing (LCC) are well-established methods advocated by the EU Commission to assess the environmental footprint and economic performance of products and organizations throughout their life span to promote sustainable and cost-effective choices [
13,
14]. Interestingly, while LCA is widely used in the IS literature to assess the environmental performance of existent or future symbiotic developments [
11,
15,
16], economic performance is seldom studied in-depth in combination with LCA.
Through IS, industries can exchange materials, energy, and by-products, thereby contributing to a circular economy. The integration of IS within LCA and LCC frameworks enables a comprehensive evaluation of environmental impacts and economic benefits throughout the product life cycle. By utilizing waste streams as feedstock, industries can significantly reduce their environmental footprint [
17]. LCA and LCC incorporate both economic and environmental metrics, allowing for a holistic assessment of IS impacts [
18,
19]. Examples from biopolymer production illustrate how IS can enhance sustainability through effective waste valorization [
19], while LCC analyses show that initial investments in symbiotic relationships can yield significant long-term savings and environmental benefits [
20]. However, challenges such as limited collaboration and resource availability can hinder the effectiveness of IS [
21]. Overcoming these barriers may require significant changes in organizational practices and stakeholder engagement [
22]. IS not only reduces waste but also lowers operational costs and mitigates environmental impacts [
18].
Although industrial symbiosis (IS) has been widely studied in various industrial contexts [
21], few studies integrate both environmental and economic assessments within a real case of waste heat recovery applied to greenhouse farming [
18,
23]. Previous works have primarily focused on energy recovery in heavy industries [
12,
24,
25,
26]. Waste heat recycling is highlighted as an important measure to achieve GHG emission reduction targets in industrial processes, for instance, by reutilizing waste heat in the iron and steel industry for municipal heating [
24], recovering low-grade waste heat from the flue gases in a coking plant for preheating coal in adjacent processes [
25], reusing waste heat generated from an iron and steel plant and ironmaking to supply a thermal power plant with heat [
12], or replacing district heating with waste heat from a hypothetical urban vertical farm integrated with a host building and other local companies [
27], neglecting the agricultural sector as a potential beneficiary of symbiotic heat recovery solutions [
27]. Nevertheless, these studies do not elaborate on estimations of several environmental impact reduction potentials from waste heat recovery measures, nor do these studies provide any economic assessments of the proposed symbiotic developments.
In the case of the greenhouse under study, waste heat from a nearby pulp and paper mill is utilized to heat the greenhouse, exemplifying a successful IS application. The pulp and paper industry is known for its high energy consumption and waste generation, producing waste streams such as waste heat, solid waste, wastewater containing organic matter and chemicals, and air emissions. By redirecting waste heat to the greenhouse, the environmental footprint of both the pulp and paper mill and the greenhouse is significantly reduced [
1].
While improving energy efficiency and sustainability in greenhouse production is essential, it is also crucial to consider potential challenges, such as the initial investment costs required for renewable technologies and the necessary infrastructure to support IS.
This study aims to assess the environmental and economic benefits of using waste heat recovery for greenhouse heating in Sweden, optimizing resource use and reducing costs [
23]. The study aims to answer the following research questions:
Is the use of low-grade waste heat for greenhouse heating in Sweden economically comparable with a BAU greenhouse using fossil fuels or biomass as a heat energy source?
What financial and environmental benefits arise from utilizing low-grade waste heat for greenhouse heating in Sweden?
How does the real case of waste heat reuse in Frövi for a tomato greenhouse compare to various business-as-usual (BAU) scenarios where greenhouses and systems operate under standard conditions, in terms of environmental and economic performance?
The innovative aspect of this research lies in comparing the environmental and economic analysis of the symbiotic scenario of local tomato production in Sweden using waste heat, generated in a pulp and paper mill from the CHP process, with the BAU scenario of importing tomatoes produced in a regular greenhouse located in the Netherlands. The novelty of this study lies in applying LCA and LCC methodologies in tandem, to assess the environmental and economic effects of waste heat recycling, exploring a real IS case, and providing insights into estimations on the environmental burden reduction and environmental benefits, which have been identified as a gap in the current IS literature addressing waste heat recovery. The findings are expected to contribute to the scientific community by providing a model for enabling competitive greenhouse operations in Sweden, potentially reducing dependence on imported tomatoes from the Netherlands. This, in turn, would enhance local food production and sustainability by leveraging low-grade waste heat recovery while lowering greenhouse gas emissions associated with food transportation, among other environmental benefits.
2. Methodologies
This section outlines the process followed to obtain the LCA and LCC results for the IS demonstration case in Sweden, specifically located in Frövi. It also describes the scenarios against which it is compared.
2.1. Demo Case Demonstrator Description
The Frövi demonstration case, part of the CORALIS project initiative, funded by the European Commission, features a 10-hectare tomato greenhouse in Frövi, Sweden. This greenhouse utilizes industrial waste heat from a nearby pulp and paper facility. Construction began in 2022 and was completed by mid-2024, with planning having started much earlier. The greenhouse is notable for its innovative energy and resource optimization strategies, including waste heat reuse, rainwater and snowmelt collection, thermal and light screens, water filtration and reuse, and efficient LED lighting. It is the first large-scale vegetable greenhouse in Sweden to repurpose low-grade industrial waste heat [
28].
The data used in this study were collected from key project partners; they included business and production information from the tomato producer, data from materials and quantities, and costs from the project developer, the grower, the greenhouse provider, commercial databases, scientific and technical literature, and detailed engineering drawings and specifications. The data were reviewed by WA3RM and CIRCE to ensure high-quality, site-specific information following a data quality approach connecting the SimaPro, the LCA, and the LCC [
29,
30].
Key partners included the greenhouse and materials supplier, the tomato producer, the special purpose vehicle entity, the project developer (WA3RM), the on-site management team, and the construction contractor.
LCC assessment followed the same system as for the LCA assessment processes, considering Capital Expenditure (CapEx) and Operational Expenditure (OpEx).
CapEx data covered building materials, heat and water systems, lighting, land preparation, construction, transport, and fuel.
OpEx data included heat, electricity, water, fertilizers, substrate, packaging, and waste consumption.
2.2. Life Cycle Inventory (LCI)
The LCI is essential for evaluating the environmental impact and sustainability of the system, providing insights to enhance resource efficiency. This analysis encompasses all inputs, outputs, energy, materials, and expenses within the system boundaries, as defined in the processes.
The LCI involves reviewing previous inventories, collecting primary and secondary data, normalizing inputs and outputs, and modeling the inventory using Ecoinvent v3.8. The aggregated LCI data used for LCA assessment are provided in
Appendix A.
2.3. Life Cycle Assessment
LCA is a standardized, comprehensive tool for systematically evaluating the environmental impacts of different sectors, processes, and products throughout their entire life cycle, from resource extraction to disposal. It assesses value chain flows to identify strategic routes for environmental improvement. The LCA framework follows the standardized methodology outlined in ISO 14040:2006 and 14044:2006 [
31,
32], ensuring systematic assessment of environmental impacts, and consistency and quality [
33]. LCA studies consist of four stages: goal and scope definition, inventory analysis, impact assessment, and interpretation (
Figure 1) [
34]. The methodology allows for the identification of hotspots in product life cycles, facilitating targeted improvements [
35].
2.3.1. Goal and Scope Definition
This stage establishes the scope, system boundary, and functional unit (FU) of the study. The main objective is to assess the environmental performance of CORALIS scenarios by comparing the baseline scenario with the IS scenarios.
A cradle-to-gate approach is applied, evaluating environmental impacts from raw material extraction to the production facility’s gate, excluding use and disposal phases. The FU is calculated based on the expected lifetime of the greenhouses (30 years), in line with previous studies [
36,
37] and the total tomato production during that period. Consequently, the assessment considers 1 kg of tomatoes produced as the FU.
2.3.2. System Description and Boundaries
The study evaluates multiple scenarios, summarized in
Table 1.
Scenario 1—The real Frövi greenhouse in different conditions:
Scenario 1.1: The symbiotic scenario demonstrated in the Frövi demo case, using 100% hydropower electricity from Linde Energi and heat recovered from a pulp and paper mill.
Scenario 1.2: The Frövi greenhouse operates with biomass heating and the Swedish electricity mix but without the symbiotic heat connection.
Scenario 1.3: Similar to Scenario 1.2, but with natural gas as the primary heat source.
Scenario 2—A generic Swedish greenhouse:
A BAU greenhouse in Sweden, using the Swedish electricity mix, biomass for heating, and generic irrigation methods.
Scenario 3—A generic Dutch greenhouse:
A BAU greenhouse in the Netherlands, producing tomatoes for export to Sweden.
Uses the Netherlands electricity mix and natural gas for heating, along with generic irrigation methods.
Tomatoes are transported to Sweden by road and sea, covering an average distance of 1580 km.
The study follows Product Category Rule (PCR) guidelines for arable vegetables [
38] to define the scope, boundaries, and data requirements for the LCI and LCA of the different scenarios. Both LCA and LCC assessments consider the same system boundaries, including material, water, energy, and waste flows, as detailed in
Table 2.
2.3.3. Cut-Off Criteria
The cut-off criteria applied in this study focus on the relative contribution of mass and energy to the FU, as well as generated waste (air emissions, water waste, and solid waste). The following criteria are applied: (i) Materials: flows contributing less than 1% of the cumulative mass were excluded, provided their environmental relevance was negligible. However, the sum of neglected material flows did not exceed 5% of the mass or environmental relevance. (ii) Energy: flows contributing less than 1% of cumulative energy were excluded from the analysis.
2.3.4. Impact Assessment
Impact assessment evaluates the environmental impact of value chains using SimaPro Analyst 9.3.0.3., complemented by in-house databases and Ecoinvent 3.8. The ReCiPe 2016 v1.1 midpoint method [
39] was used for data analysis.
Midpoint analysis identifies the most impactful categories, while characterization determines the contribution of different processes.
Table 3 lists the selected environmental impact indicators.
2.3.5. Interpretation
This stage analyzes impact assessment results and suggests improvements. It compares life cycle stages, and between baseline and the IS scenario.
2.4. Life Cycle Costing
LCC [
14] evaluates the costs incurred throughout a product’s life cycle, following the same principles as LCA. It includes both direct costs (CapEx) and indirect costs (OpEx).
Due to limitations in gathering baseline cost information, the LCC analysis focuses on direct and indirect costs rather than predicting long-term economic trends. When specific cost data are unavailable, estimated cost factors based on Peters (2011) [
40] are used.
The lifespan of the Frövi greenhouse is assumed to be 30 years, with CapEx calculations incorporating data from 2022, 2023, and 2024, while OpEx inputs are exclusively from 2024. Some inputs are estimates rather than actual data, particularly for future years.
The total LCC is calculated as follows:
where
represents initial capital costs, including land acquisition, civil works, engineering, greenhouse construction materials, investment in irrigation systems, electricity and heat generation/distribution, and waste operations.
represents annual operational costs, including insurance, harvesting, personnel costs, water and energy use, fertilizers, CO2 supply, and greenhouse maintenance.
is the number of years considered in the analysis (30 years).
Certain costs are excluded from the calculation, such as the cost of the cultivation system, as cultivation is performed manually. The estimated annual crop sale value is based on average figures provided by the tomato producer.
Additionally, the Levelized production cost (€/kg of tomatoes) is estimated as follows:
where
This analysis focuses on comparing different heating scenarios rather than making long-term financial predictions.
3. Results
3.1. LCA Evaluation
The LCA evaluation assesses the environmental impacts associated with all stages of the greenhouse system, from resource extraction to operation and waste management.
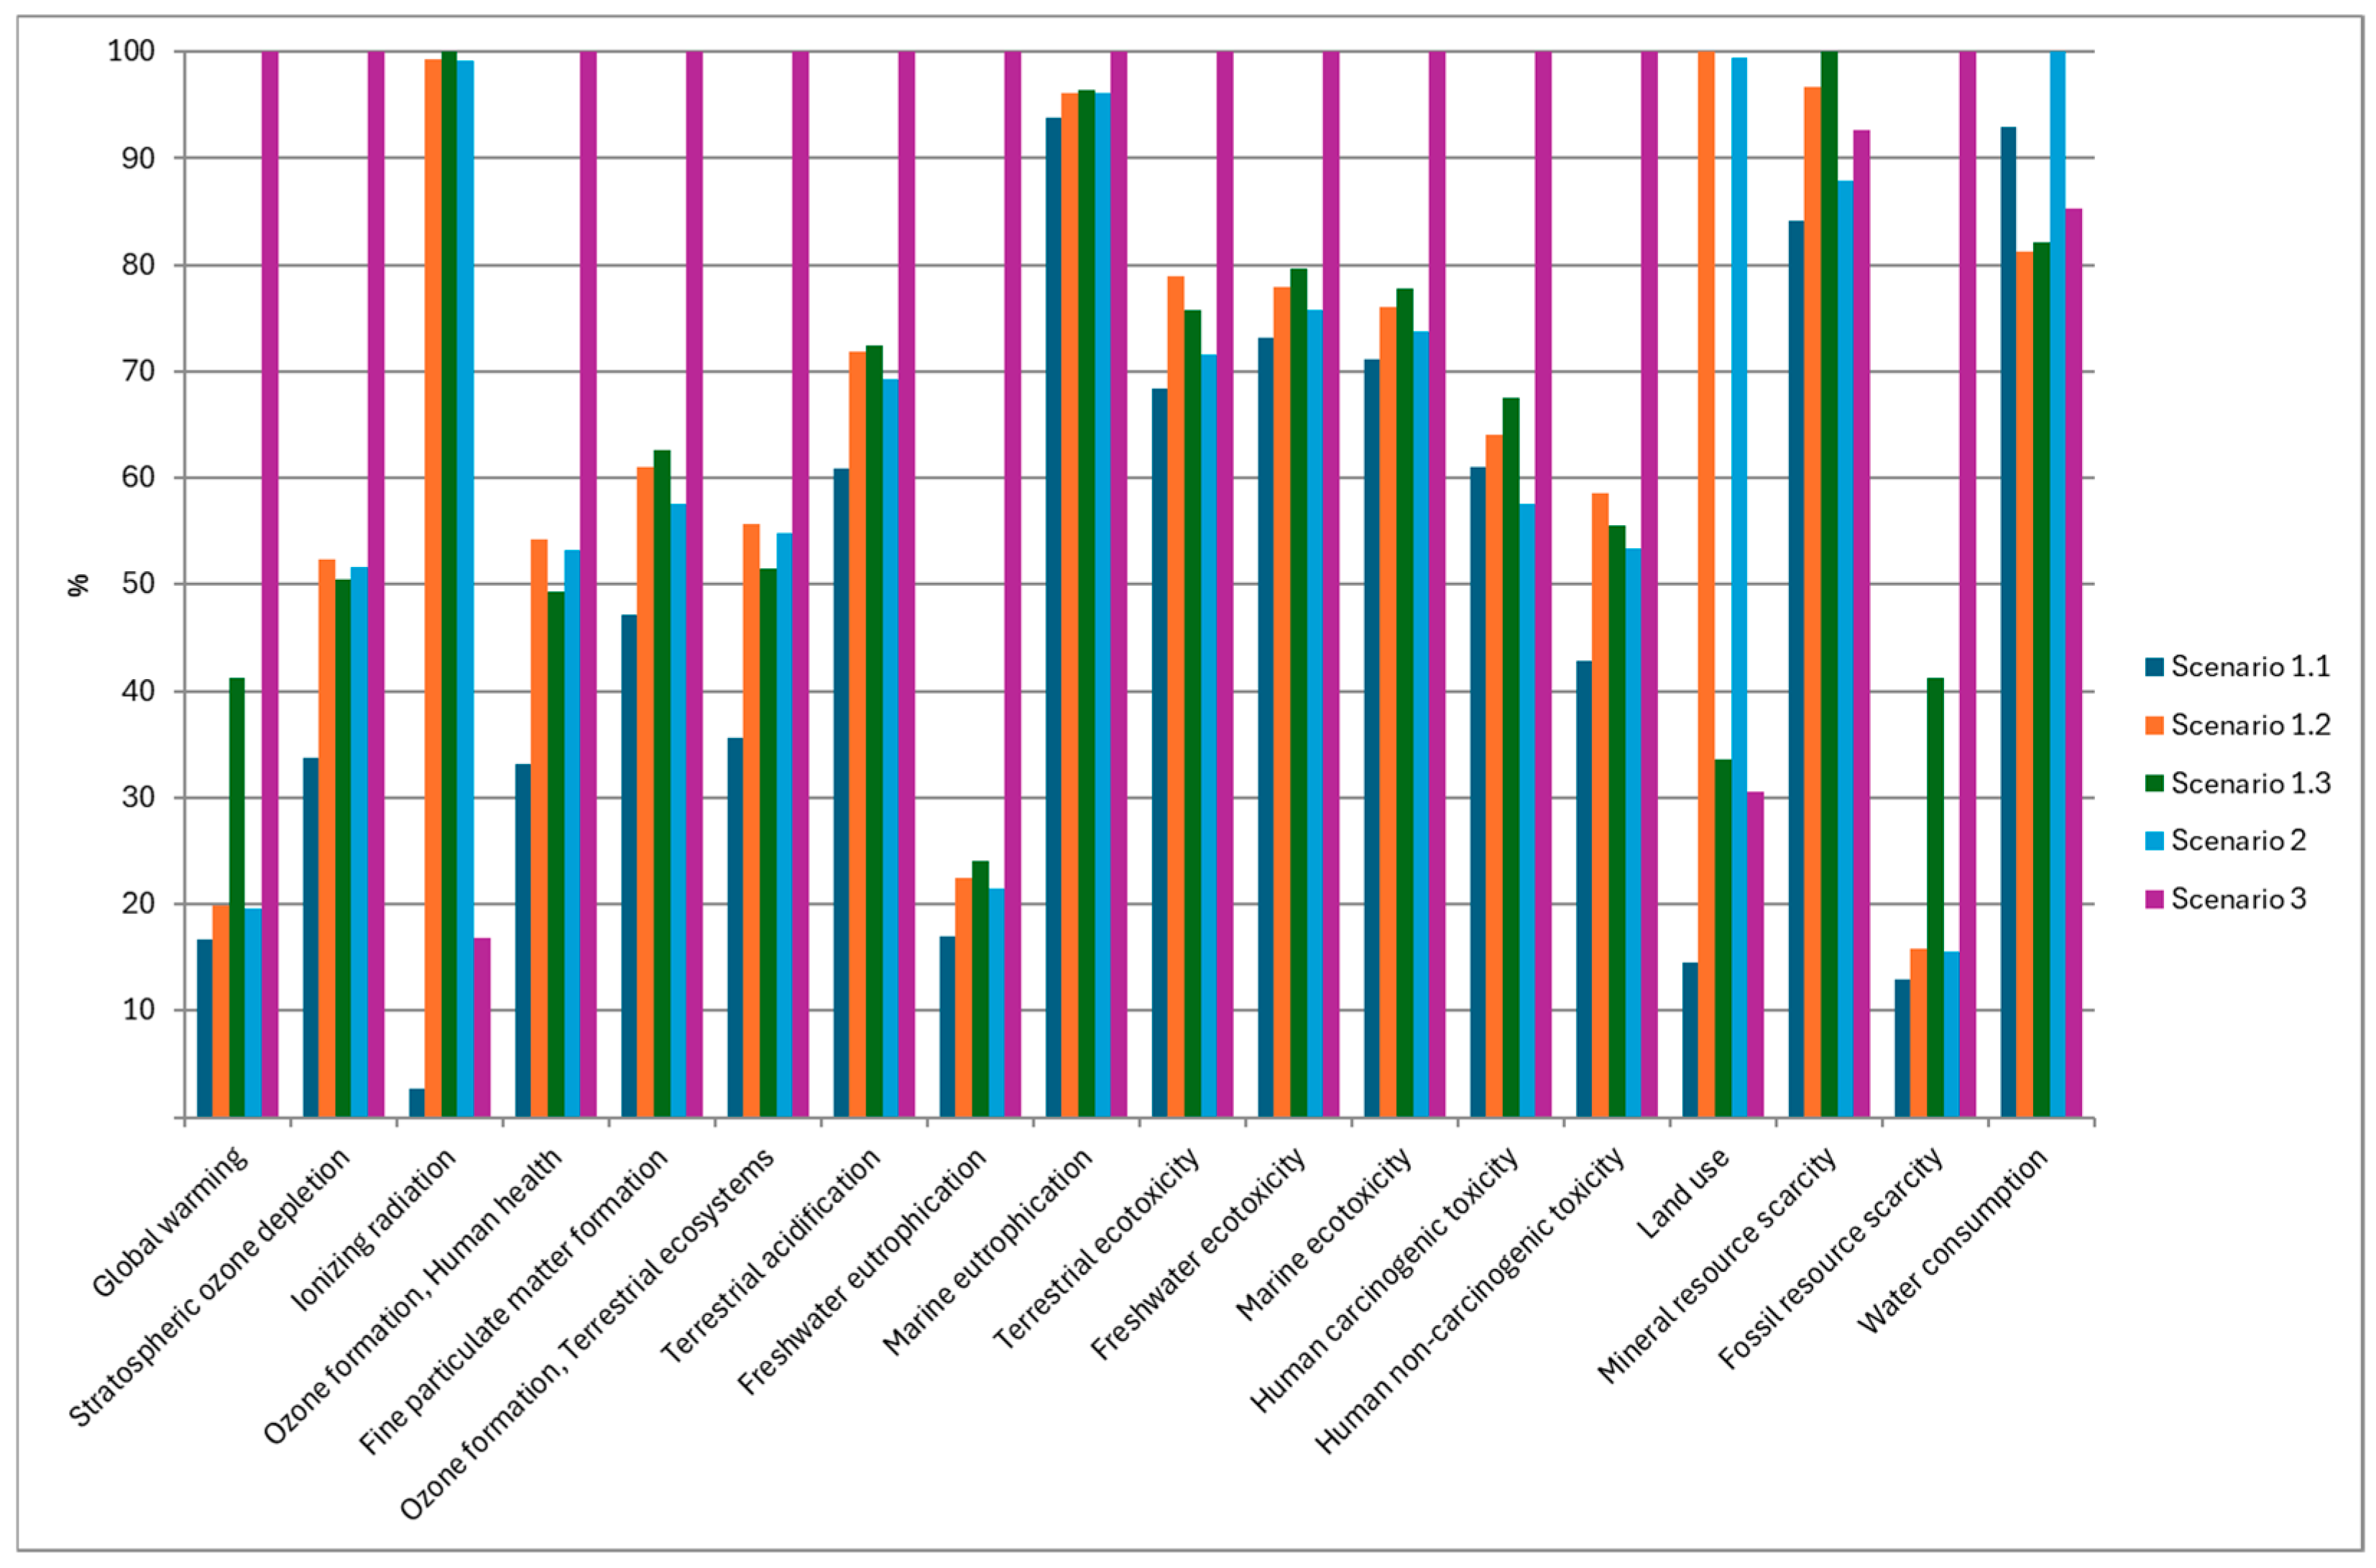
Considering the 30-year life expectancy of the greenhouse (in alignment with previous studies) and using a BAU greenhouse from the Ecoinvent database as a reference (minimum lifespan of 25 years), the most and least impactful scenarios per kg of tomatoes analyzed were identified (see
Figure 2):
Scenario 3—The generic Dutch greenhouse exhibits the highest environmental impact in 14 out of 18 impact categories.
Scenario 1.1—The symbiotic scenario being demonstrated in the Frövi greenhouse has the lowest environmental impact in 17 out of 18 impact categories. However, for water consumption, Scenario 1.1 ranks second highest due to the environmental burden associated with Linde Energi hydropower plant construction and materials production (notably gravel and steel).
The remaining scenarios fall between these two extremes.
A comparative analysis was conducted between Scenario 1.1 and the remaining scenarios (
Table 4). The key findings are as follows:
Significant environmental burden reductions were observed across multiple impact categories.
Total avoided GHG emissions in the symbiotic scenario (Scenario 1.1) compared to the BAU scenario amount to 3.382 kg CO2 equivalent per kg of tomatoes produced, translating to a yearly reduction of 29,270 tons of CO2 equivalent. While GHG reductions are lower when compared with other scenarios, Scenario 1.1 remains the least impactful in terms of Global Warming Potential (GWP).
Water consumption per kg of tomatoes is 9% higher (0.003 m3/kg) in Scenario 1.1 compared to the reference scenario.
Fossil resource consumption per kg of tomatoes is reduced by 1.07 kg of oil equivalent (87%) compared to the reference scenario.
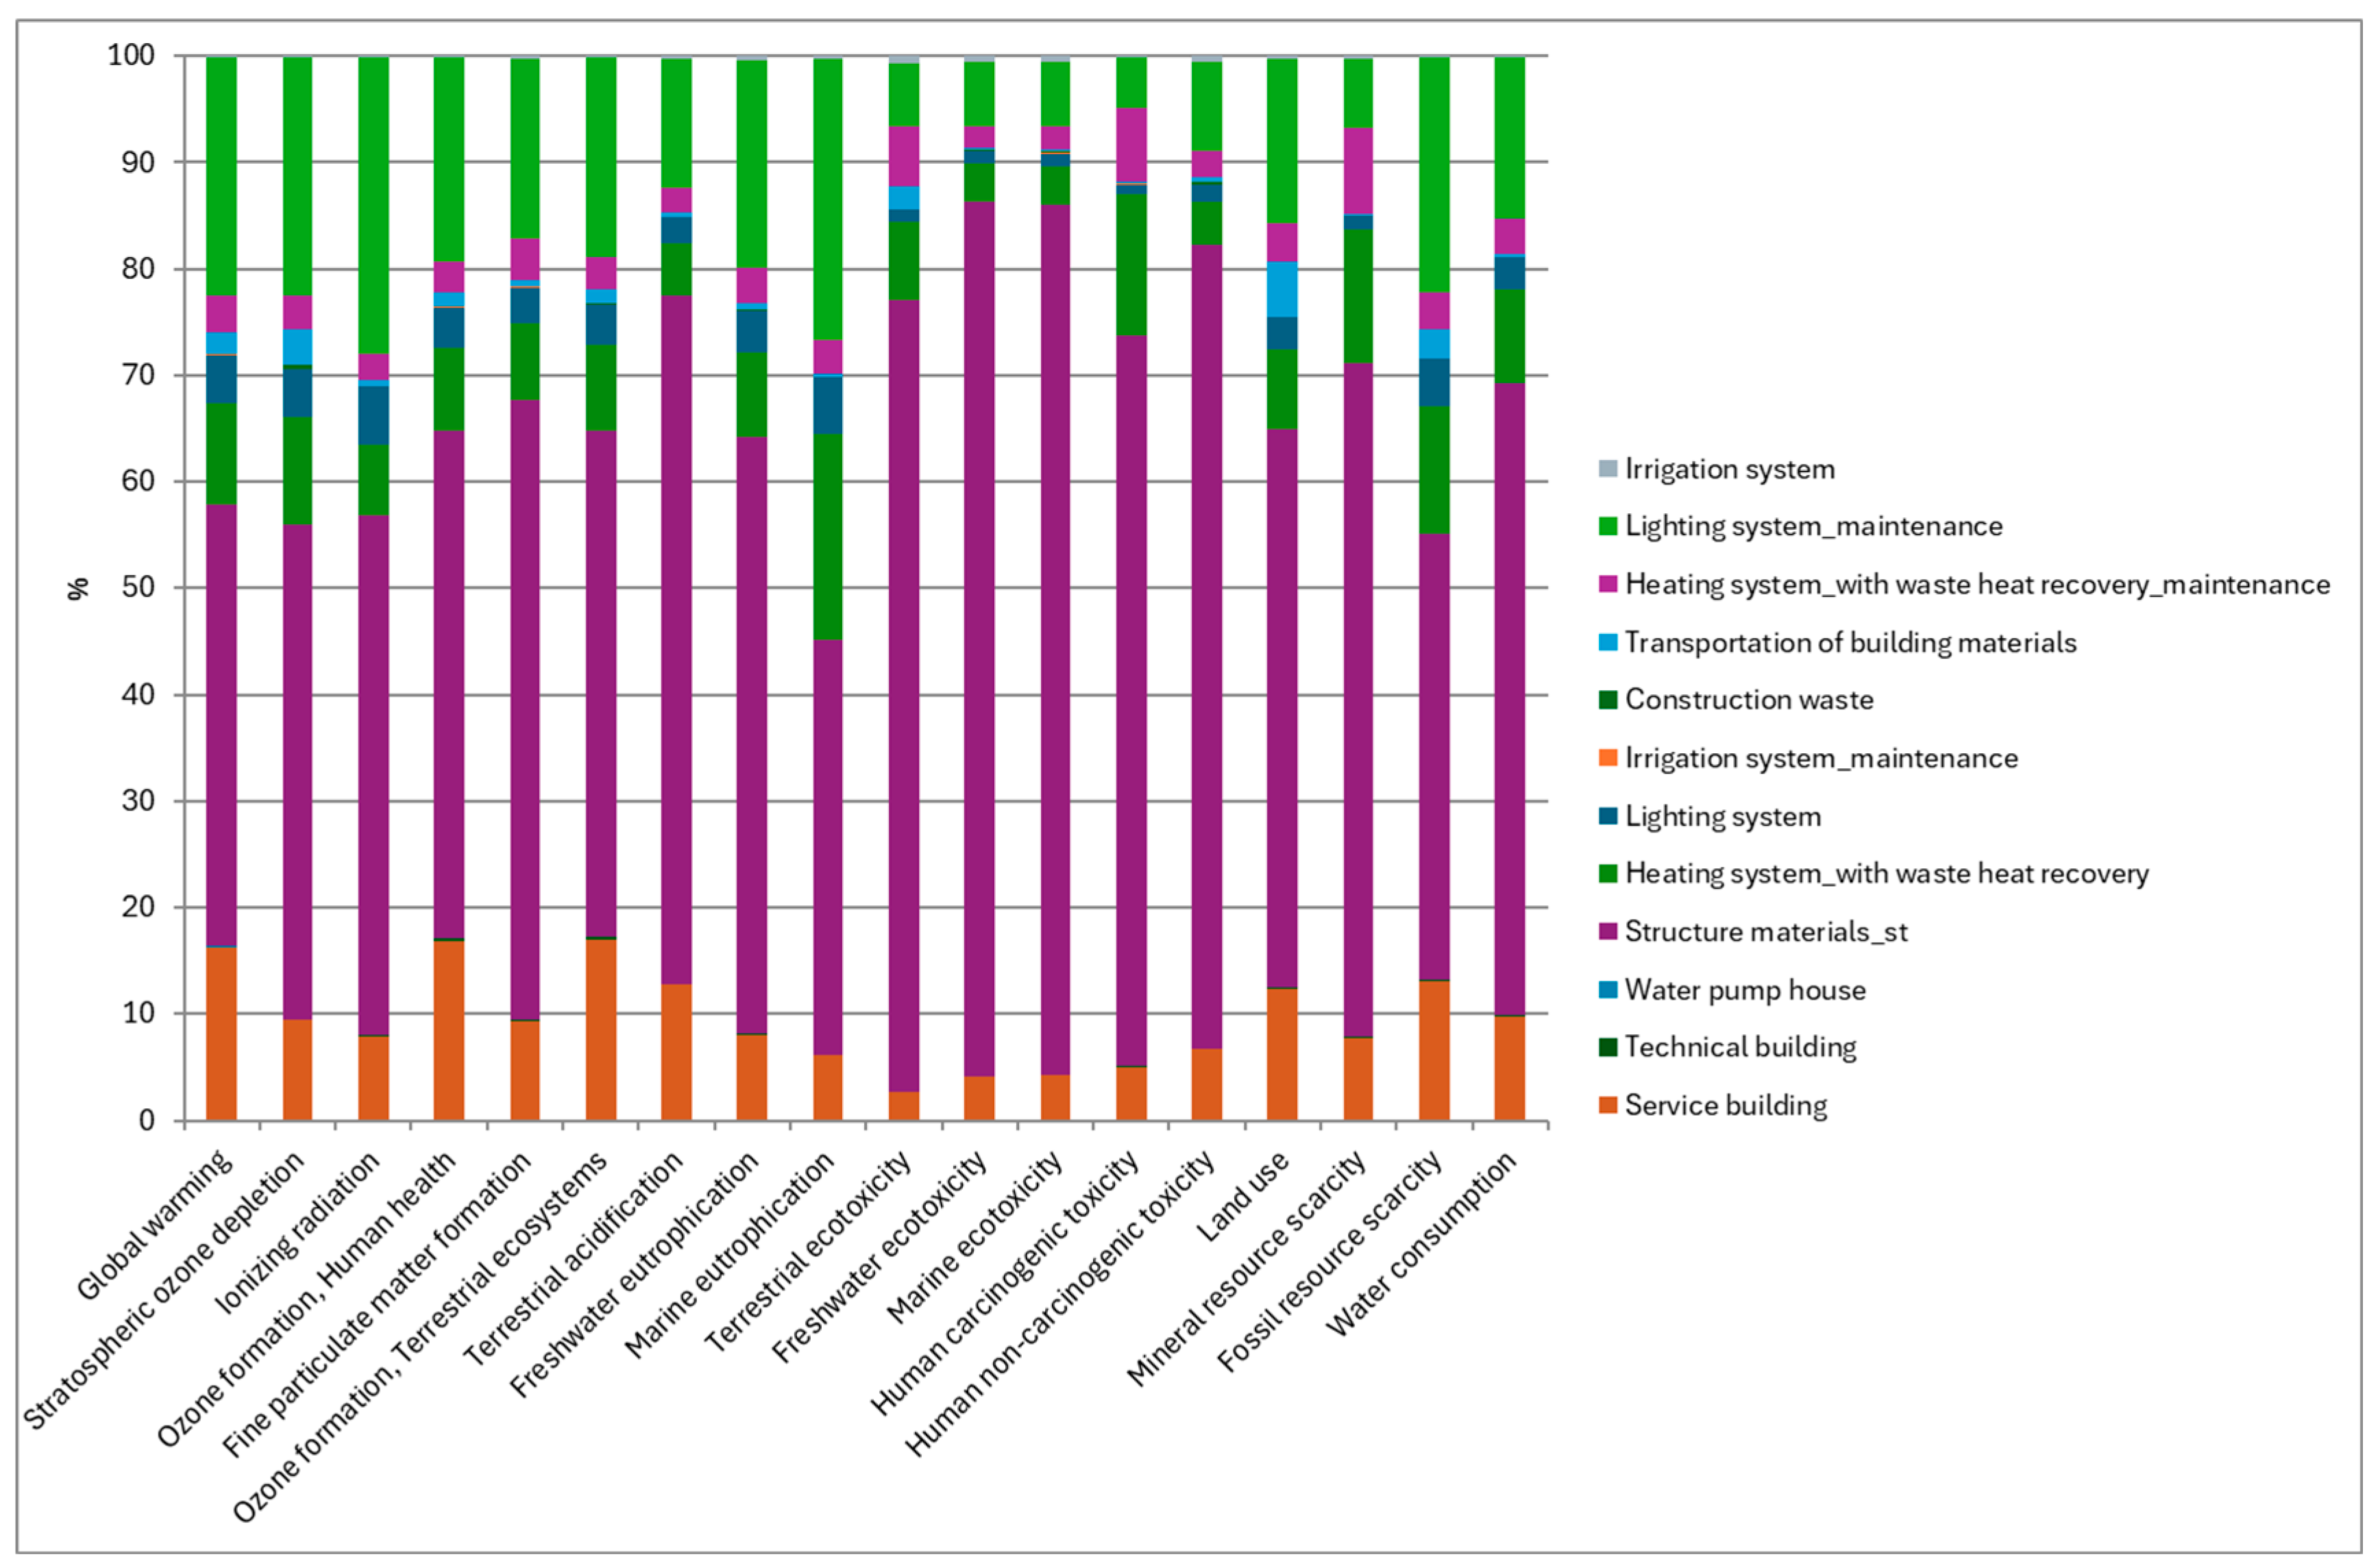
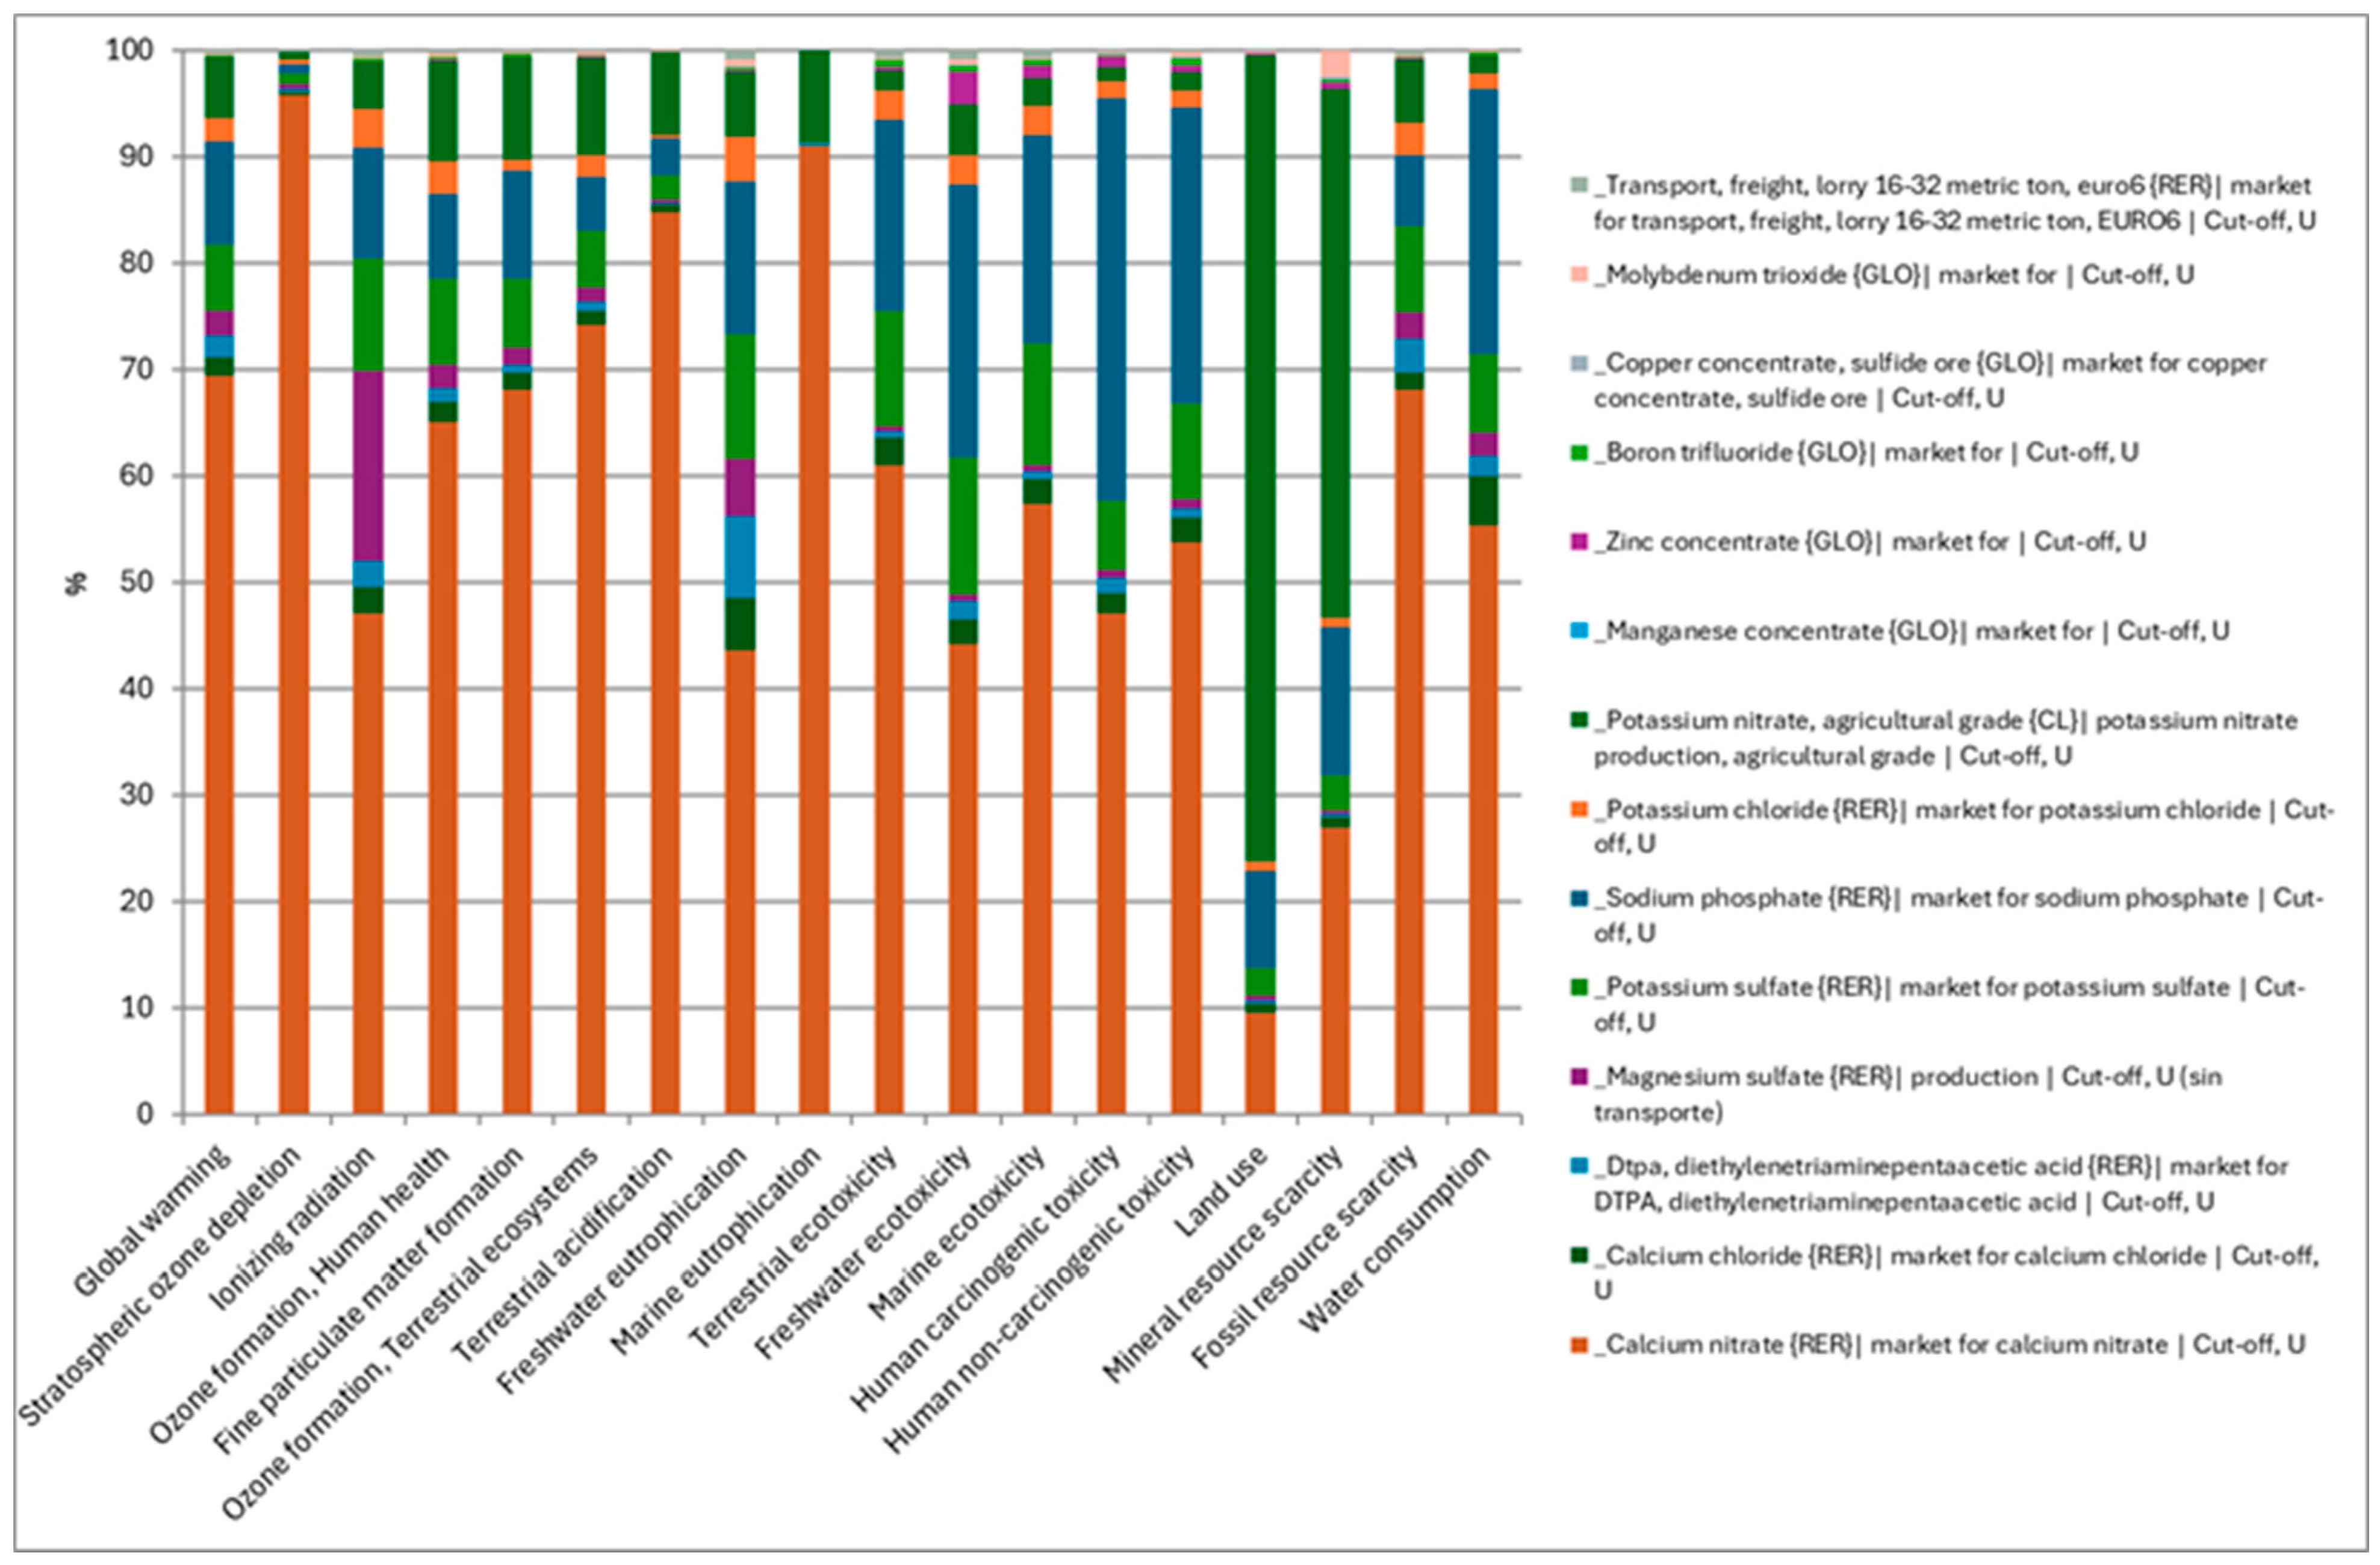
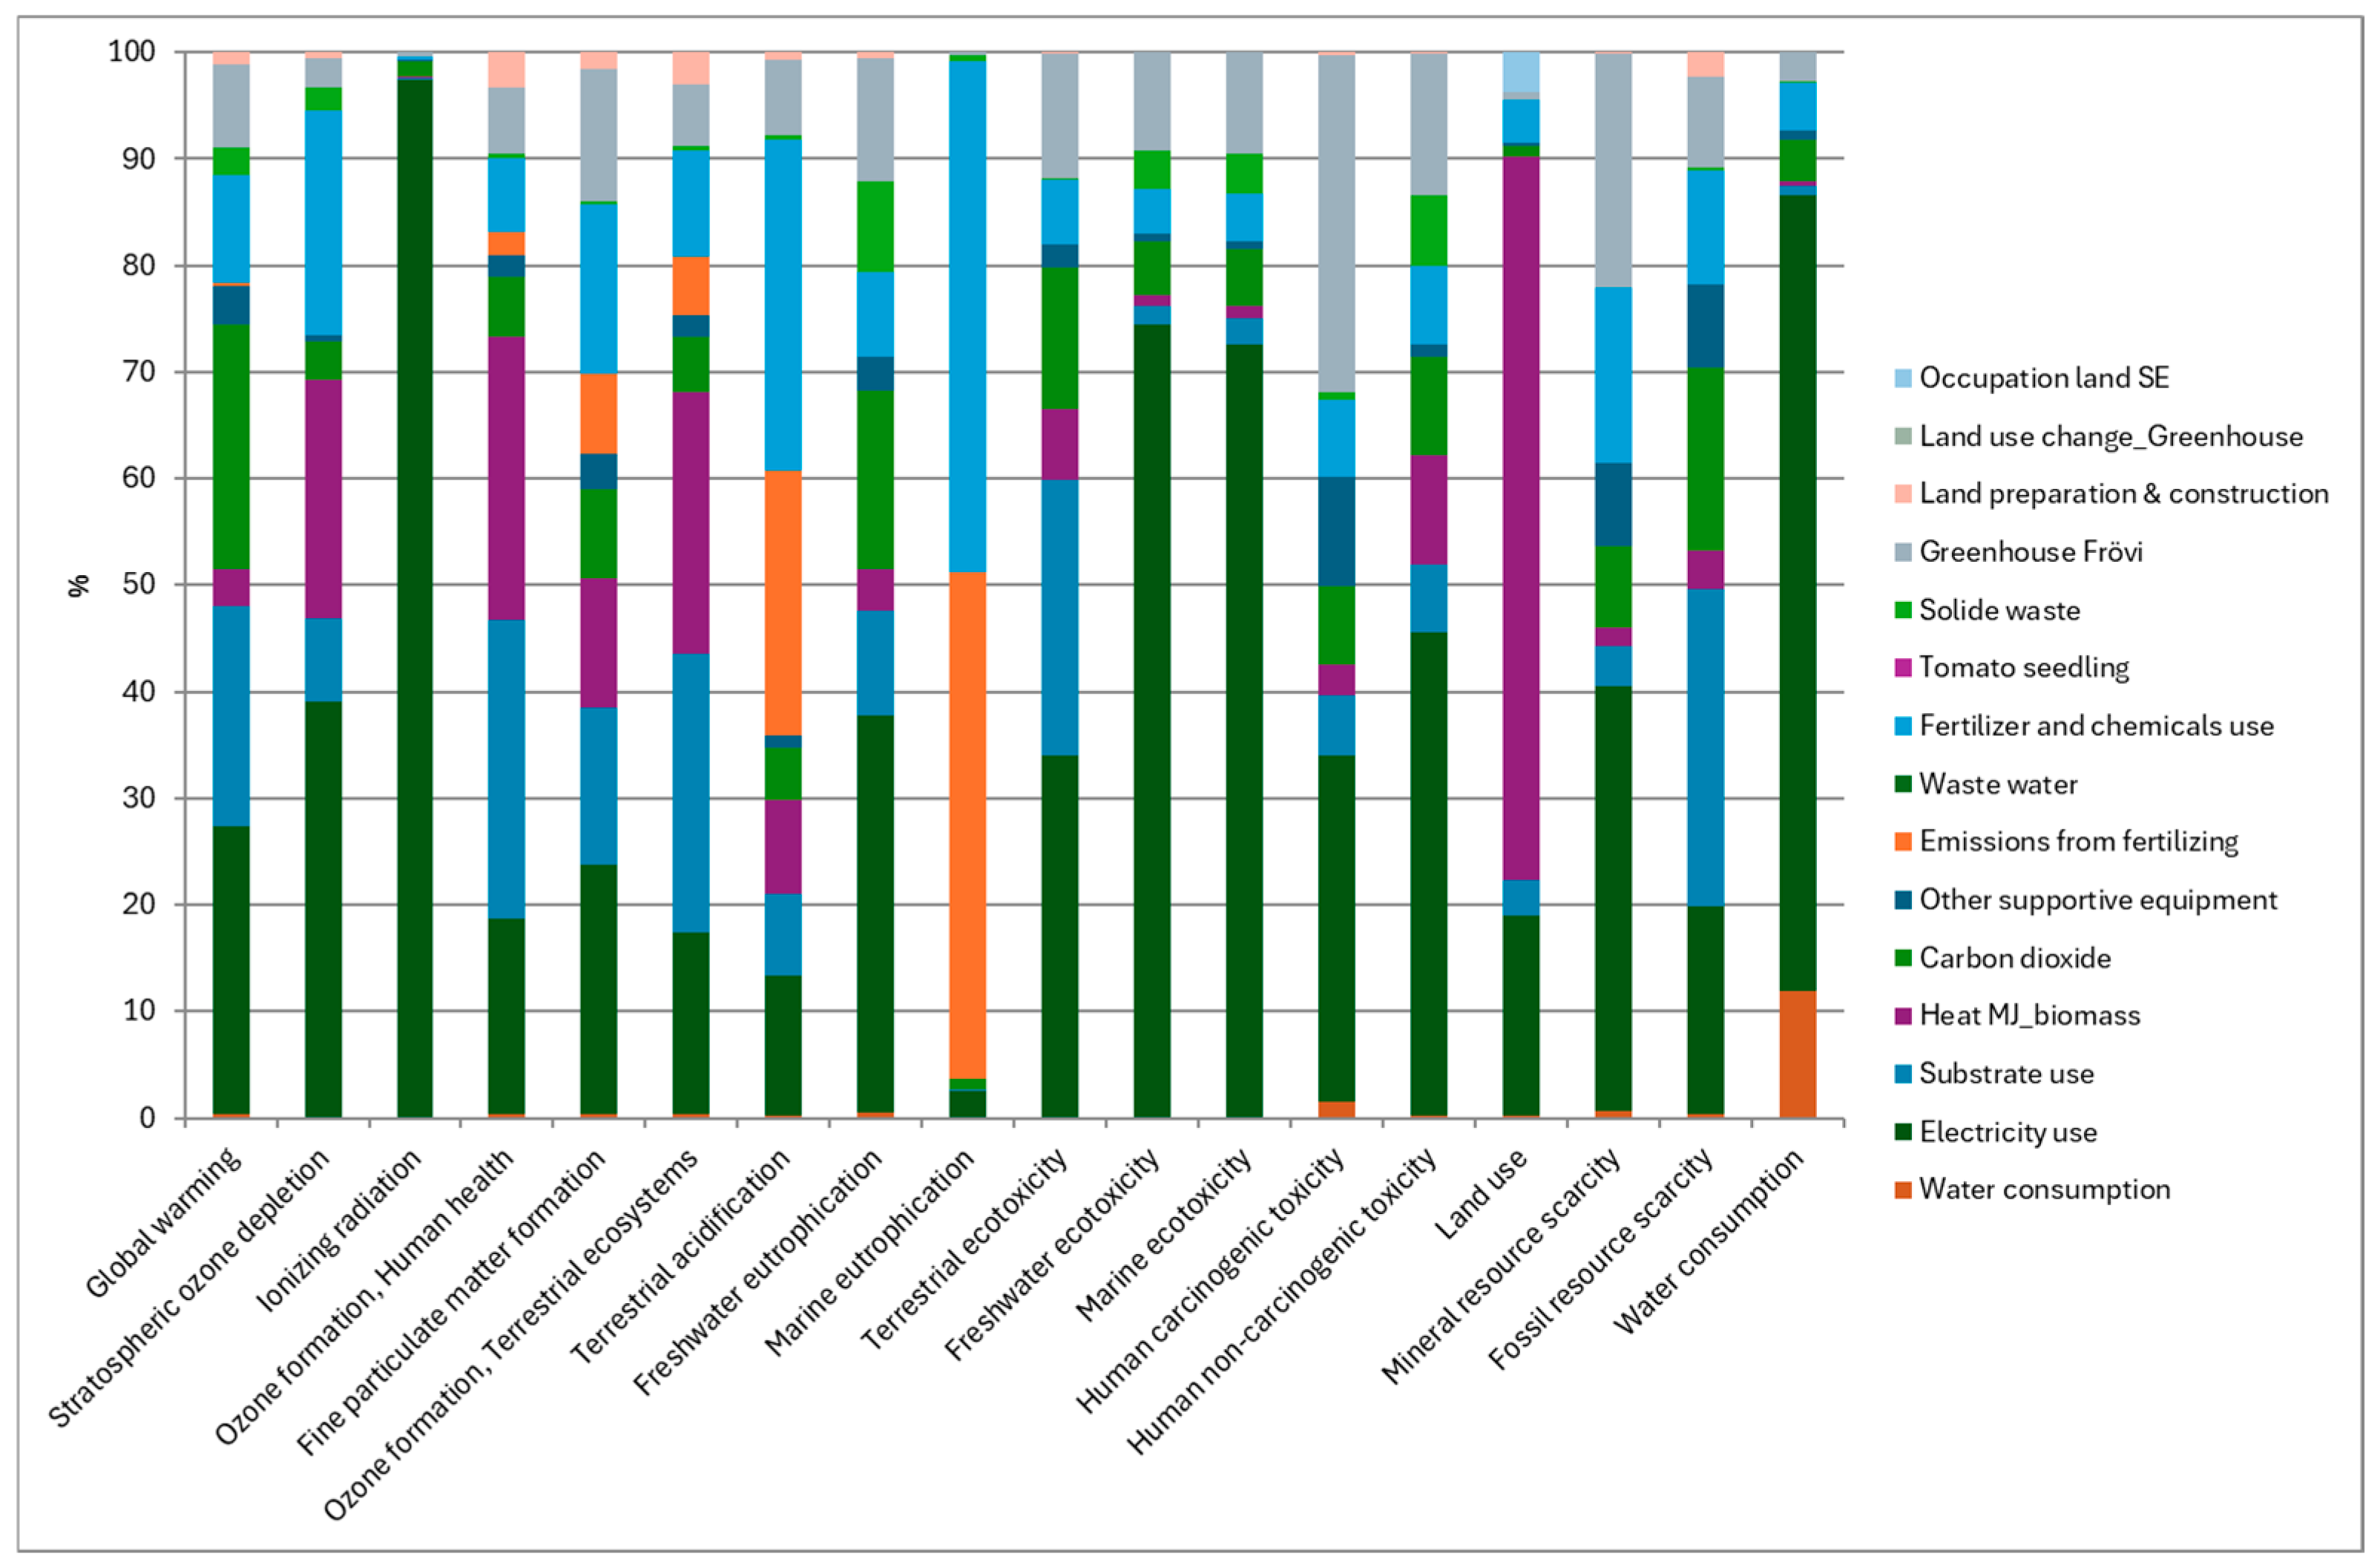
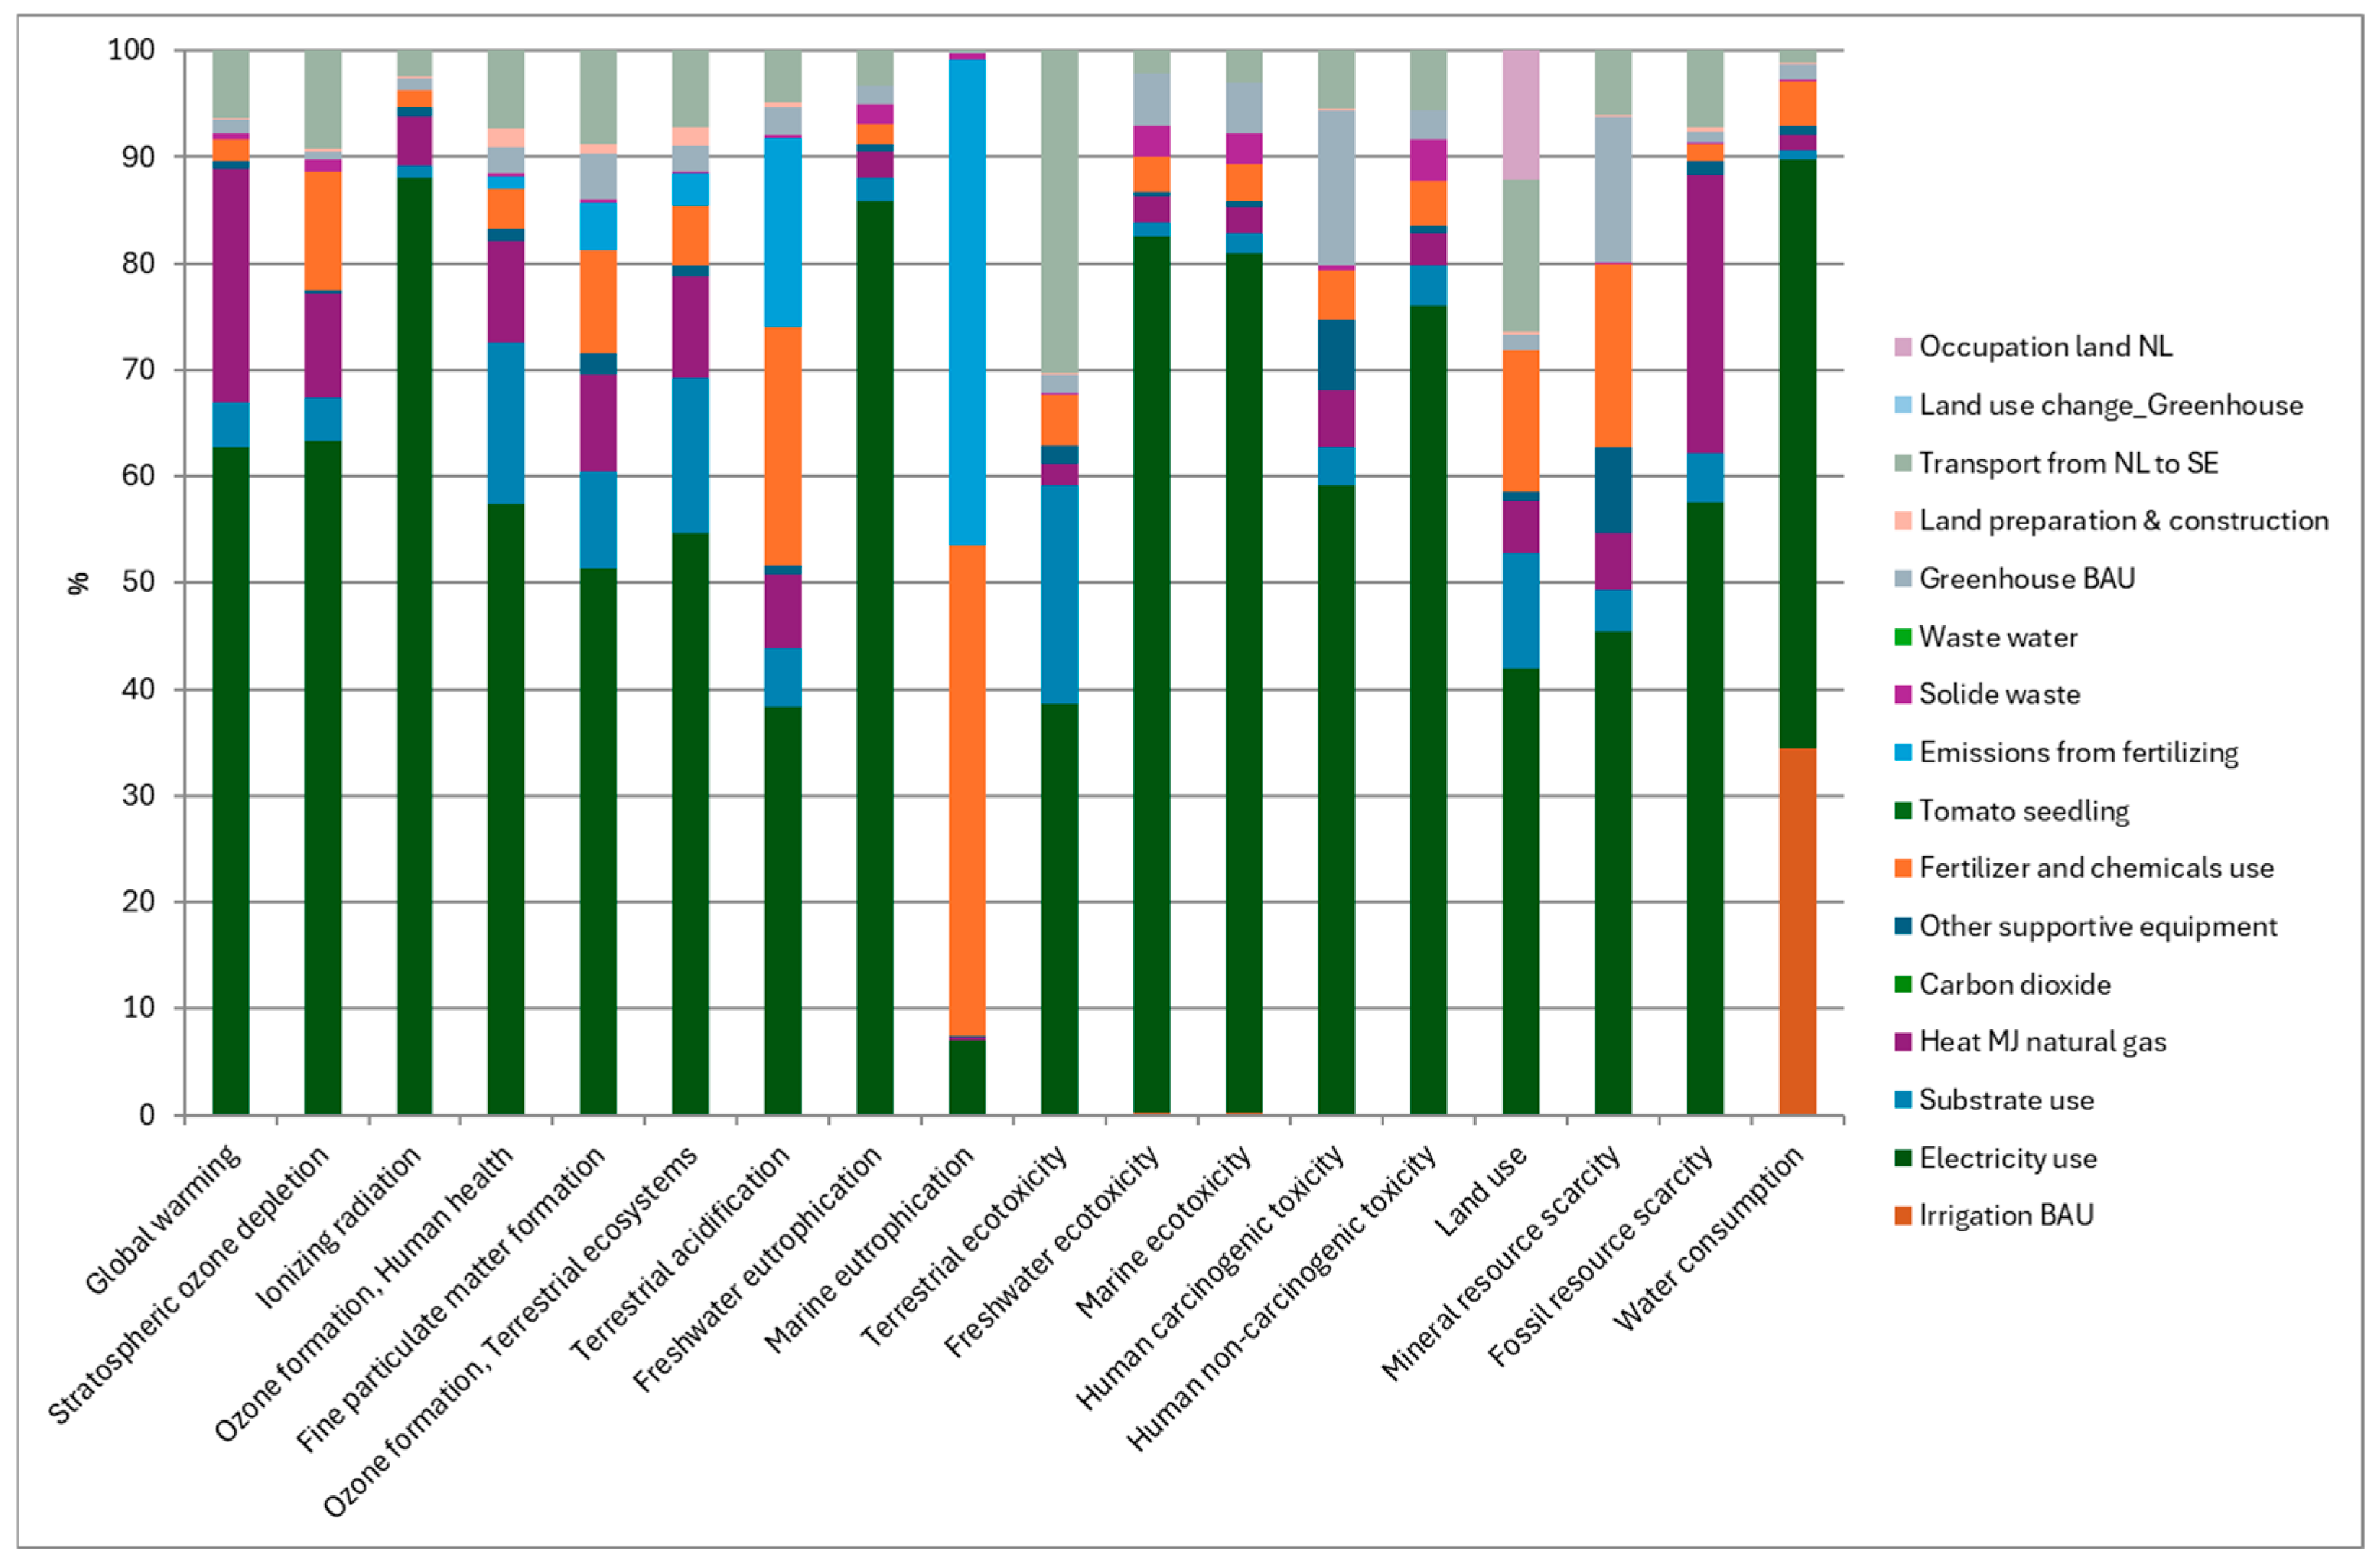
An environmental impact analysis was conducted for each scenario. The findings for Scenario 1.1 (symbiotic waste heat scenario in Frövi’s greenhouse) are presented in
Figure 3 and
Table 5:
Greenhouse construction and building processes contribute significantly to environmental impact and warrant further examination, being the highest contributor in human non-carcinogenic and mineral resource scarcity impact categories. This process will be analyzed in more detail.
Fertilizer and chemical production are among the most impactful processes across all impact categories, particularly in the stratospheric ozone depletion, terrestrial acidification, marine eutrophication, and land use categories due to the application of macronutrients. Emissions from the application of fertilizers appear as an important contributor in the terrestrial acidification and marine eutrophication. These processes are analyzed further in the next section.
Carbon dioxide represents the first impacting process in the global warming and ionizing radiation impact categories due to its nature, which mainly impacts in those impact categories.
Substrate use in the hydroponic base is the first impacting process in the ozone formation (human and terrestrial), terrestrial ecotoxicity, and fossil resource scarcity impacting categories.
Electricity consumption from Linde Energi purchased for tomato cultivation is also identified as a key contributor.
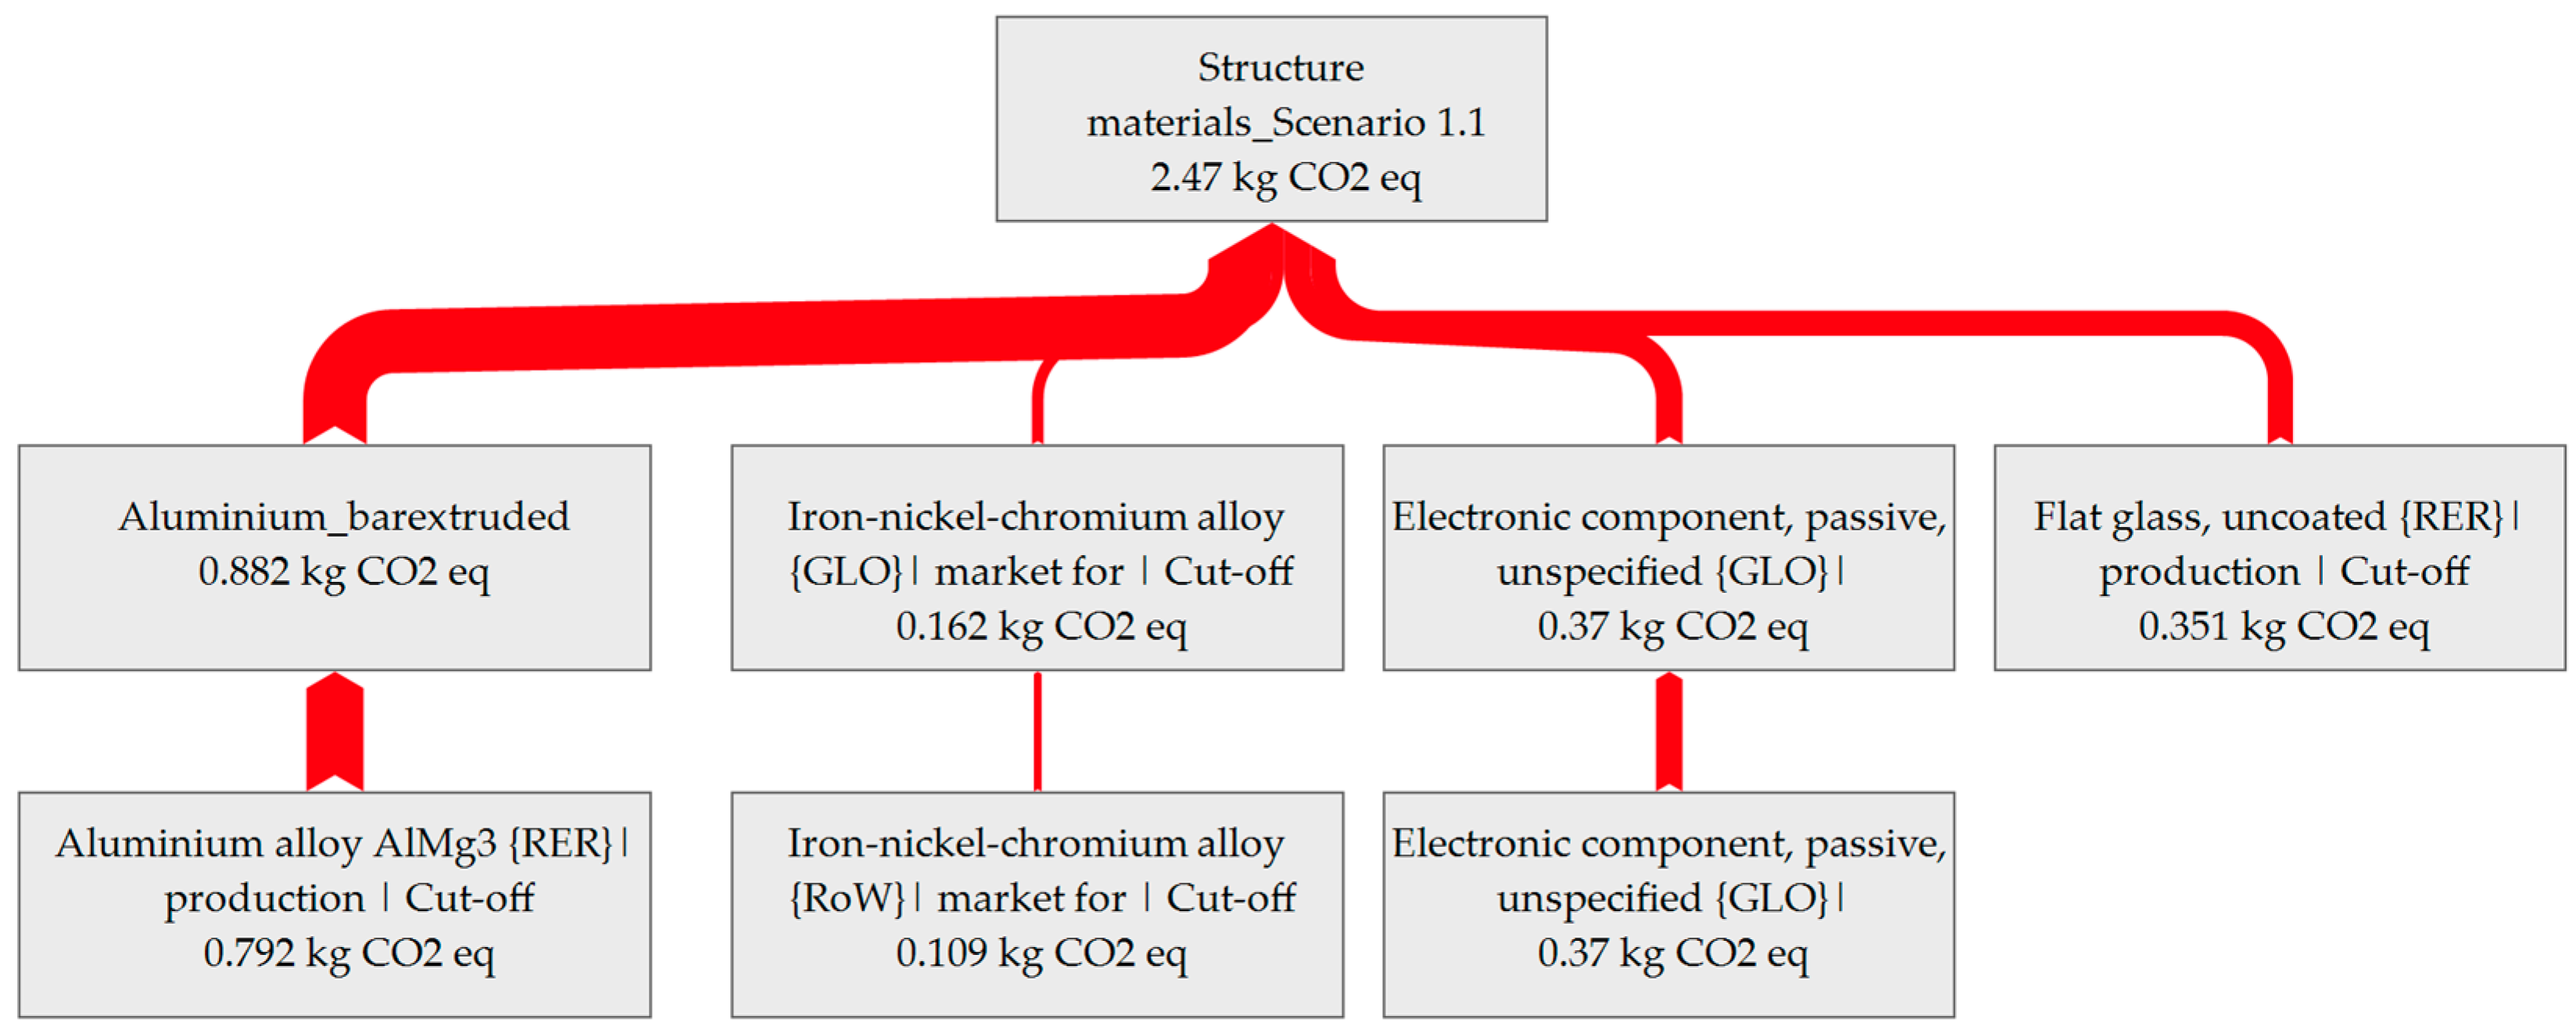
When analyzing the total IS greenhouse’s structure and materials—excluding tomato production processes, inputs, and outputs, and land preparation and construction and land use and occupation—the greatest environmental impact comes from the materials used in the greenhouse’s construction. The most significant contributors to the global warming impact category (measured in kg CO
2 eq) are electrical components, glass panels and aluminum structures. This is illustrated in
Figure 4 and
Figure 5.
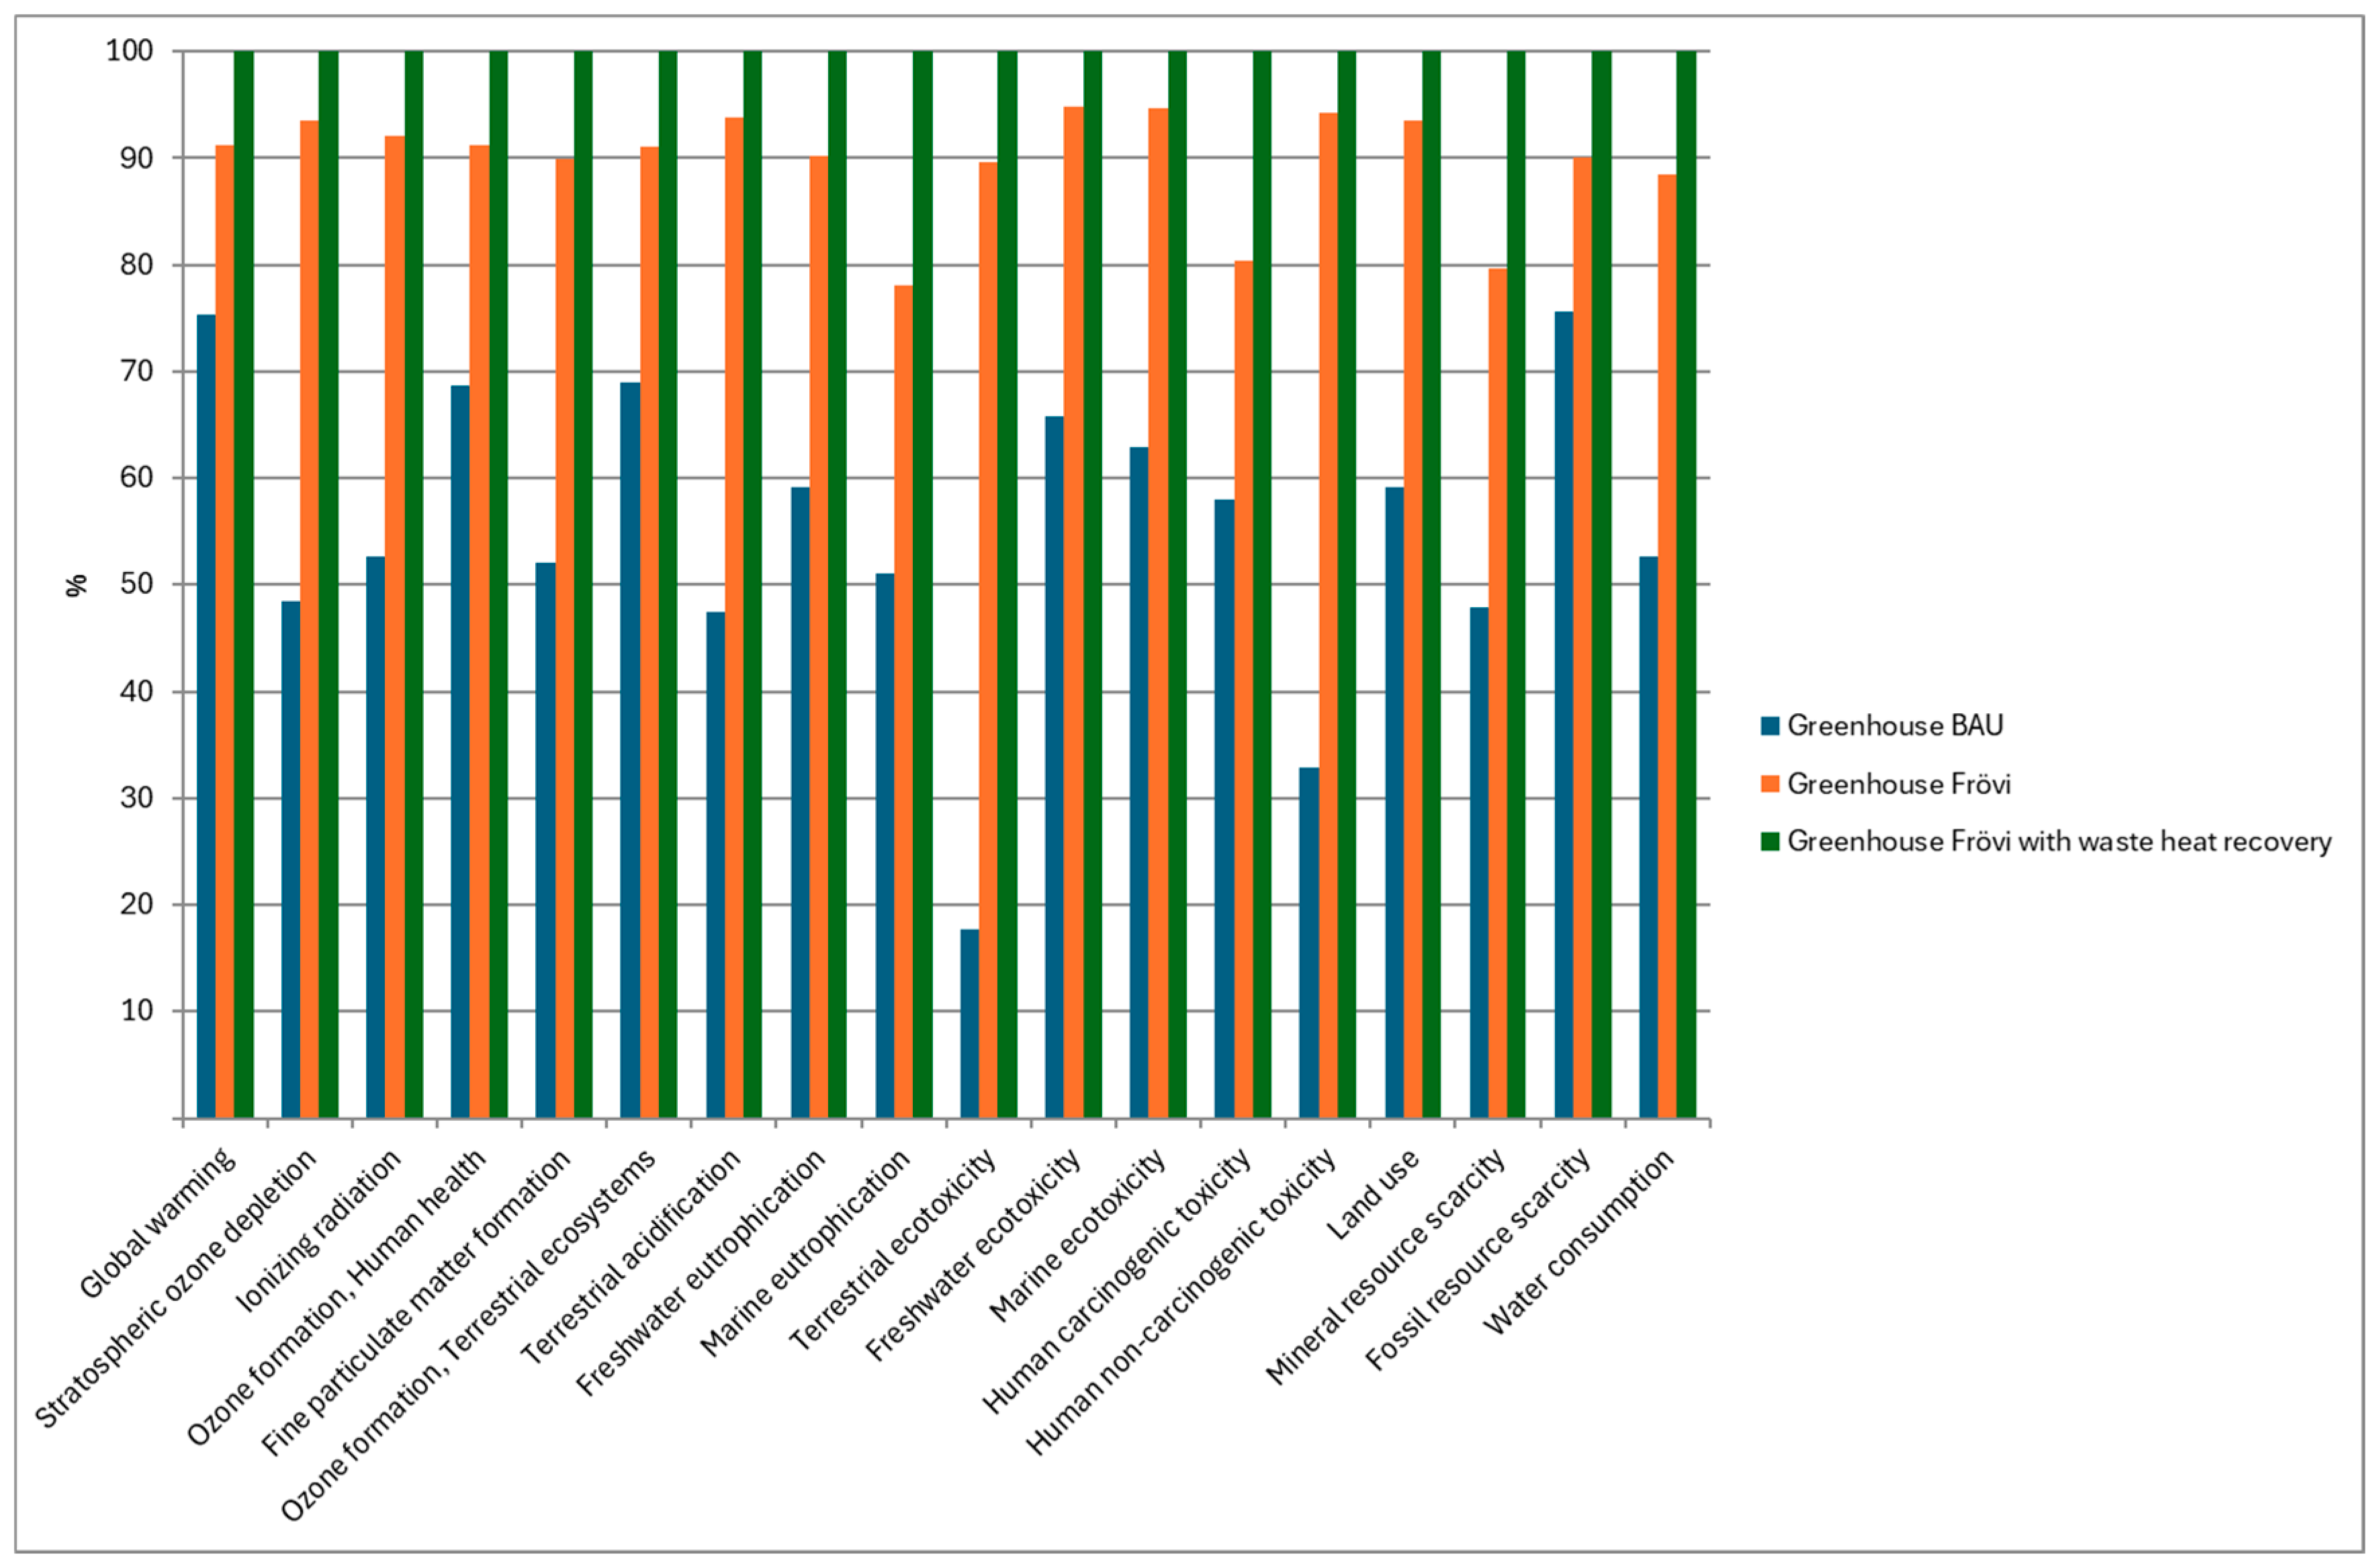
The environmental impact per FU was also analyzed across different greenhouse scenarios (
Figure 6,
Table 6) including the BAU greenhouses (Scenario 2 and Scenario 3), Frövi’s greenhouse without symbiotic heat recovery (Scenario 1.2 and Scenario 1.3), and Frövi’s greenhouse with symbiotic waste heat recovery system (Scenario 1.1, developed within the CORALIS project).
Among these results, Scenario 1.1 has the highest environmental impact per FU, mainly because the waste heat recovery system is included within its system boundaries. In contrast, in other scenarios, the heating sources (natural gas or biomass) are outside their boundaries, as they are not part of the greenhouse infrastructure, and are part of the operational processes.
For BAU greenhouse, the most environmentally impactful materials and processes are the production and transport of the aluminum, the flat glass panels, and the steel used in structure components. These materials contribute significantly to Global Warming Potential (kg CO
2 eq) (see
Figure 7).
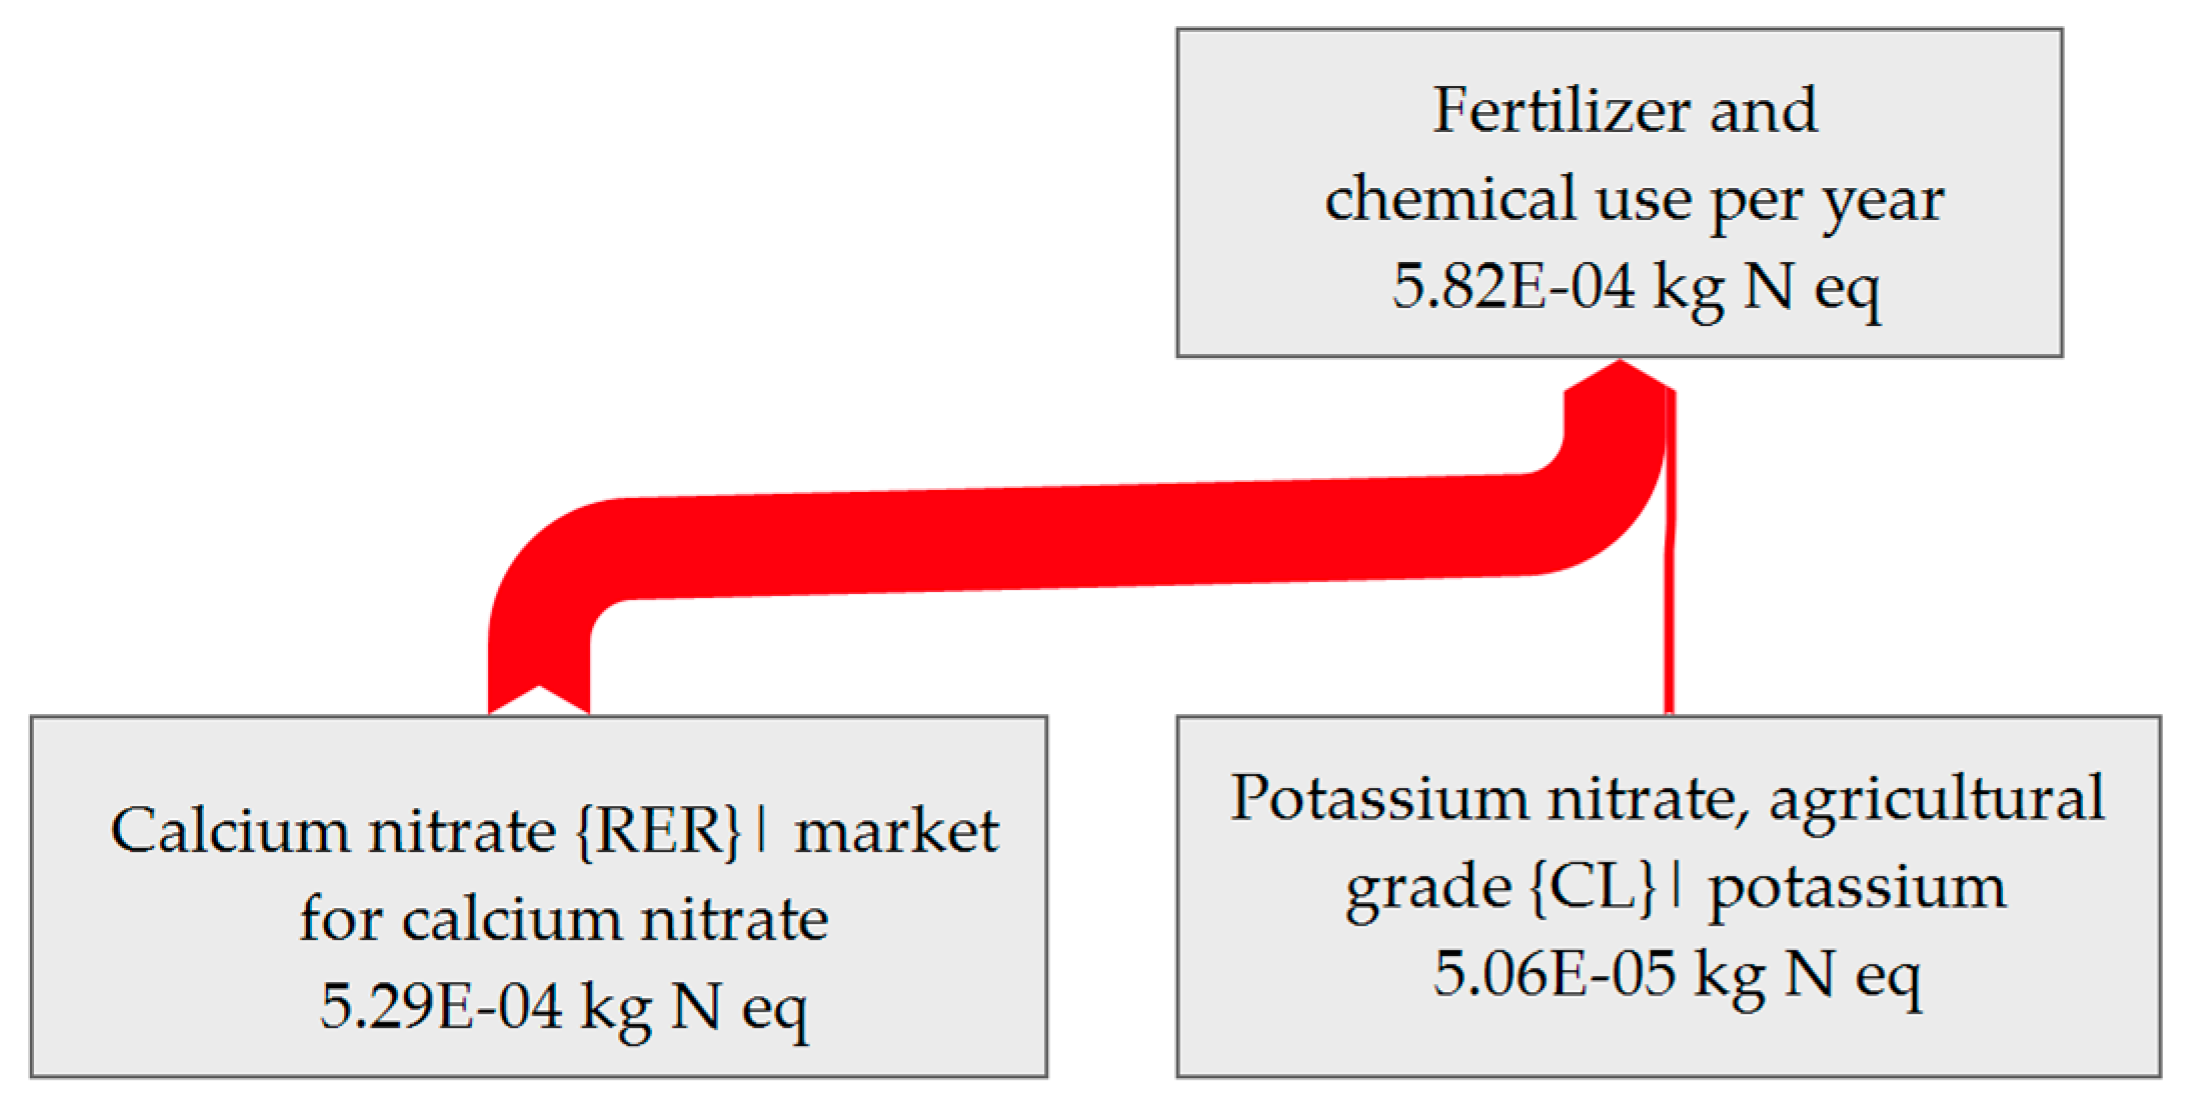
The analysis of the fertilizer production and application shows that the main contributor to environmental impact is the production of ammonia, which is utilized to synthesize nitric acid that is later used in the manufacturing of calcium nitrate. This applies to all scenarios (see
Figure 8 and
Figure 9 for marine eutrophication impact category).
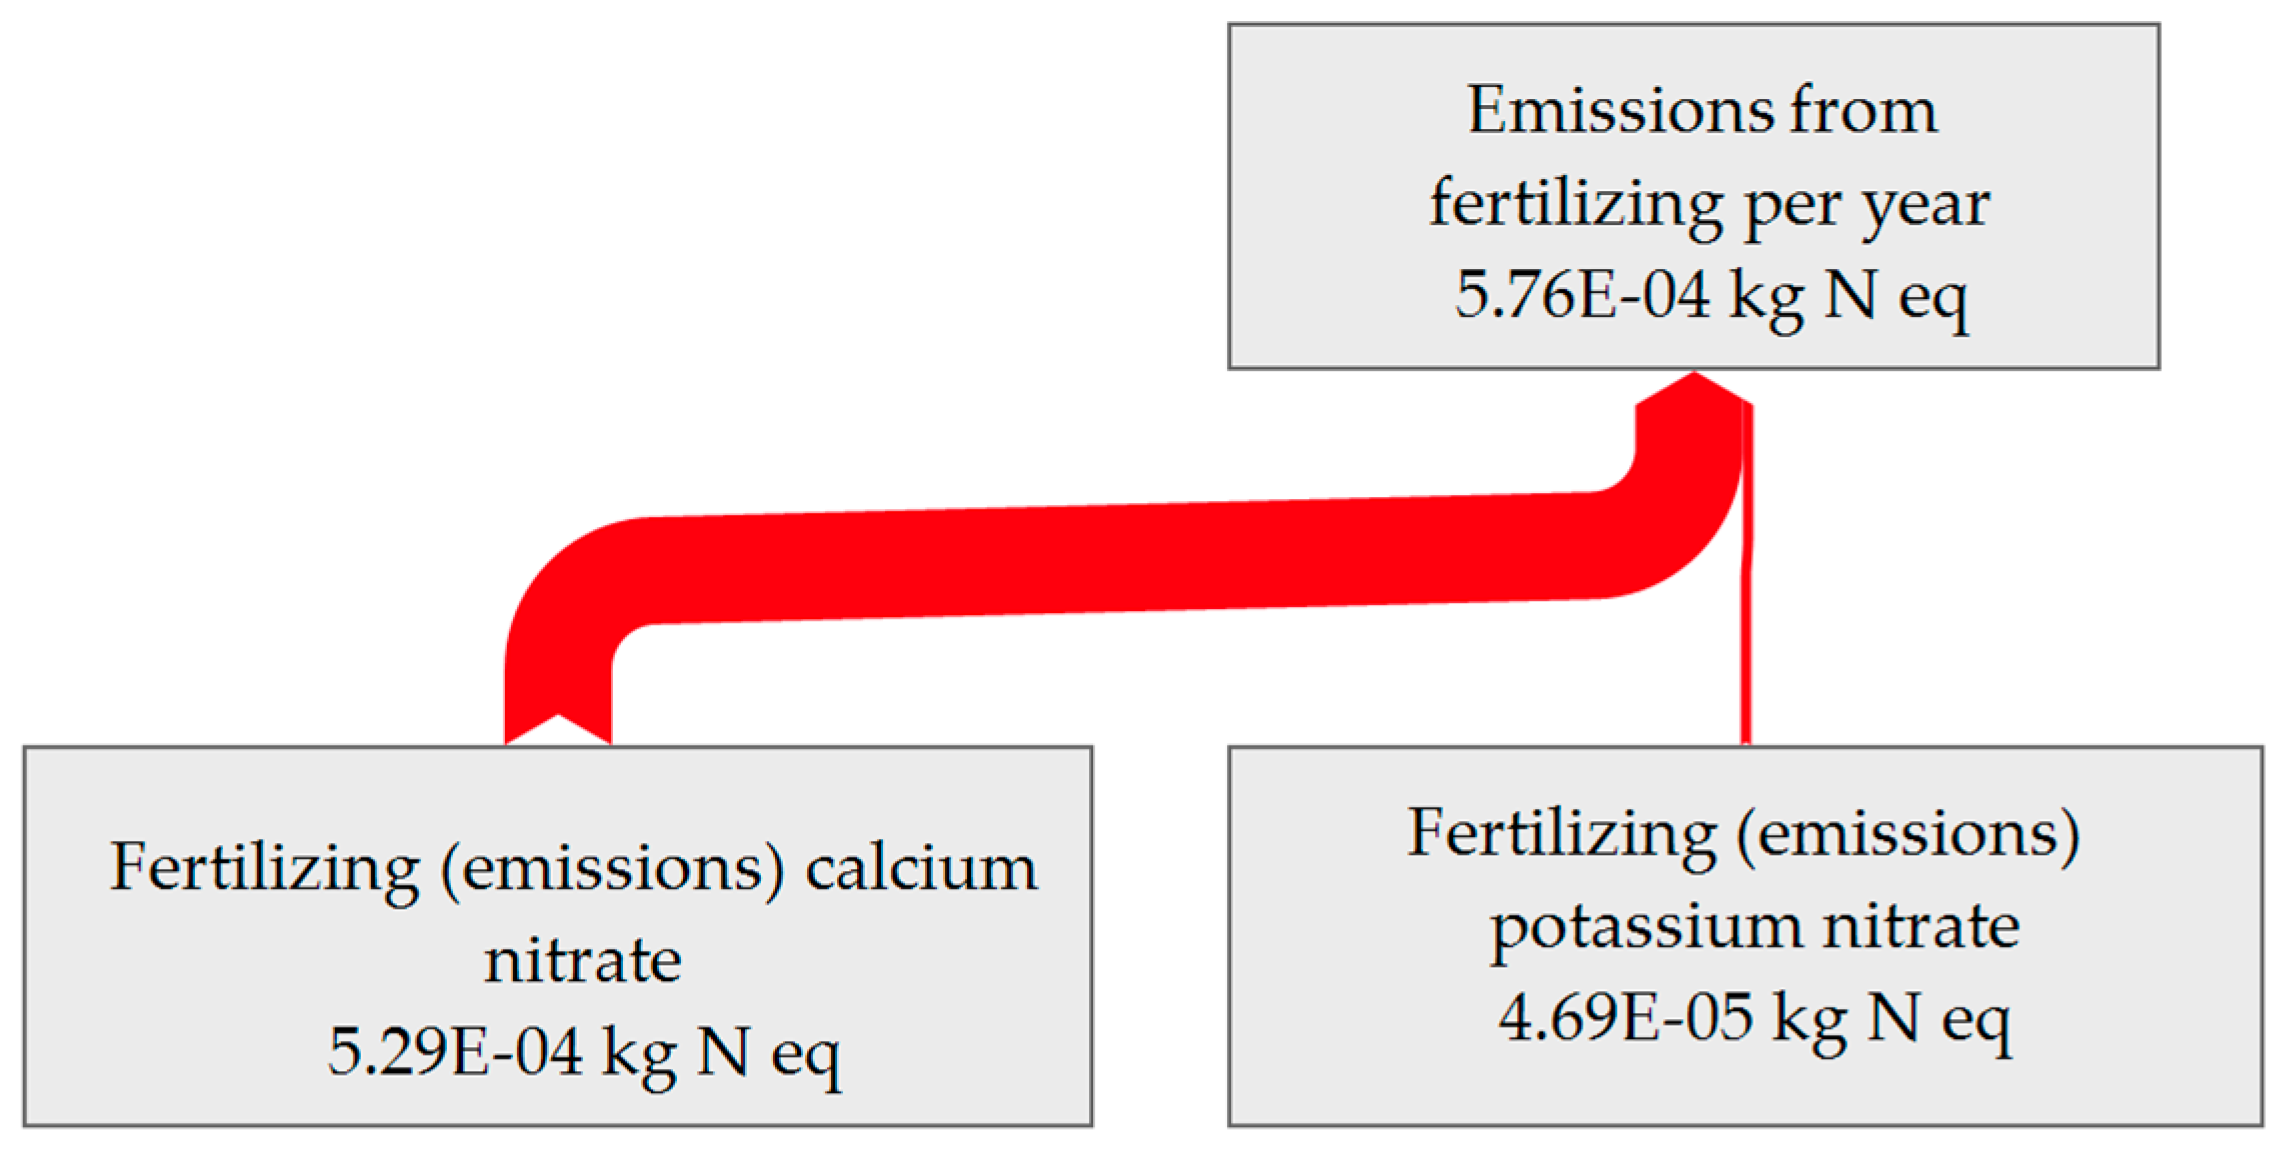
For the case of the emissions due to the process of fertilizing, the main contributor for the marine eutrophication impact category is the emissions coming from the calcium nitrate application due to its content of Nitrogen (0.0153 kg N
eq per kg of this emission and 0.000529 kg N
eq per kg of tomato production (
Figure 10)).
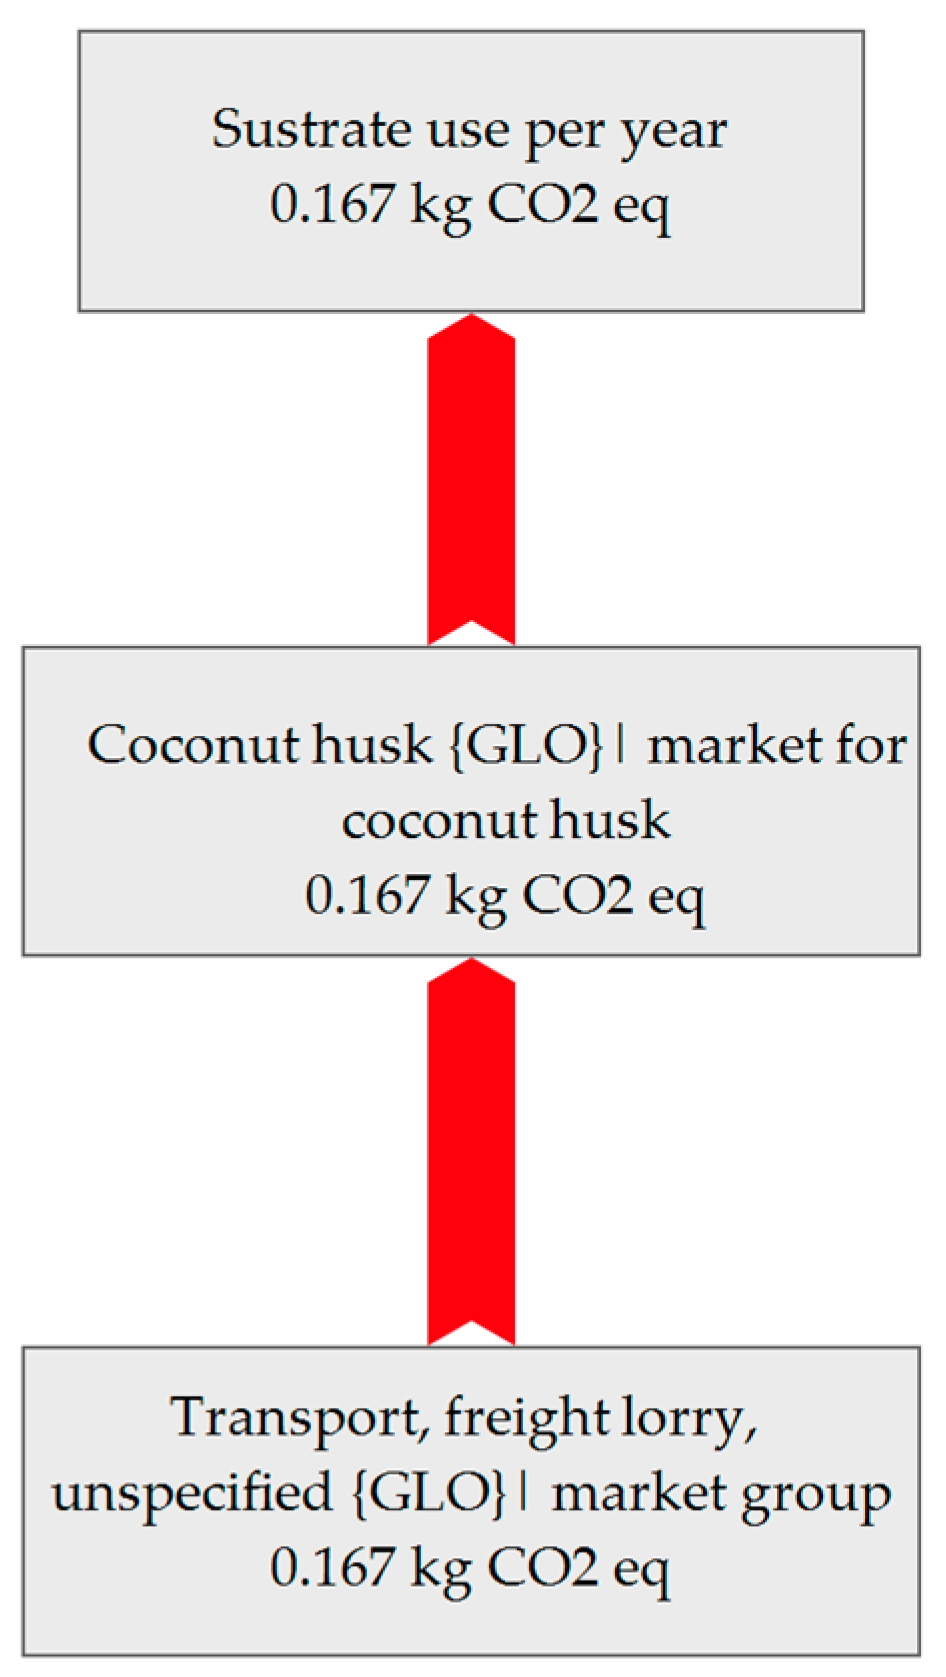
The main environmental impact in substrate use (
Figure 11) comes from transportation, as the substrate is sourced from India and transported mainly by road to its final destination.
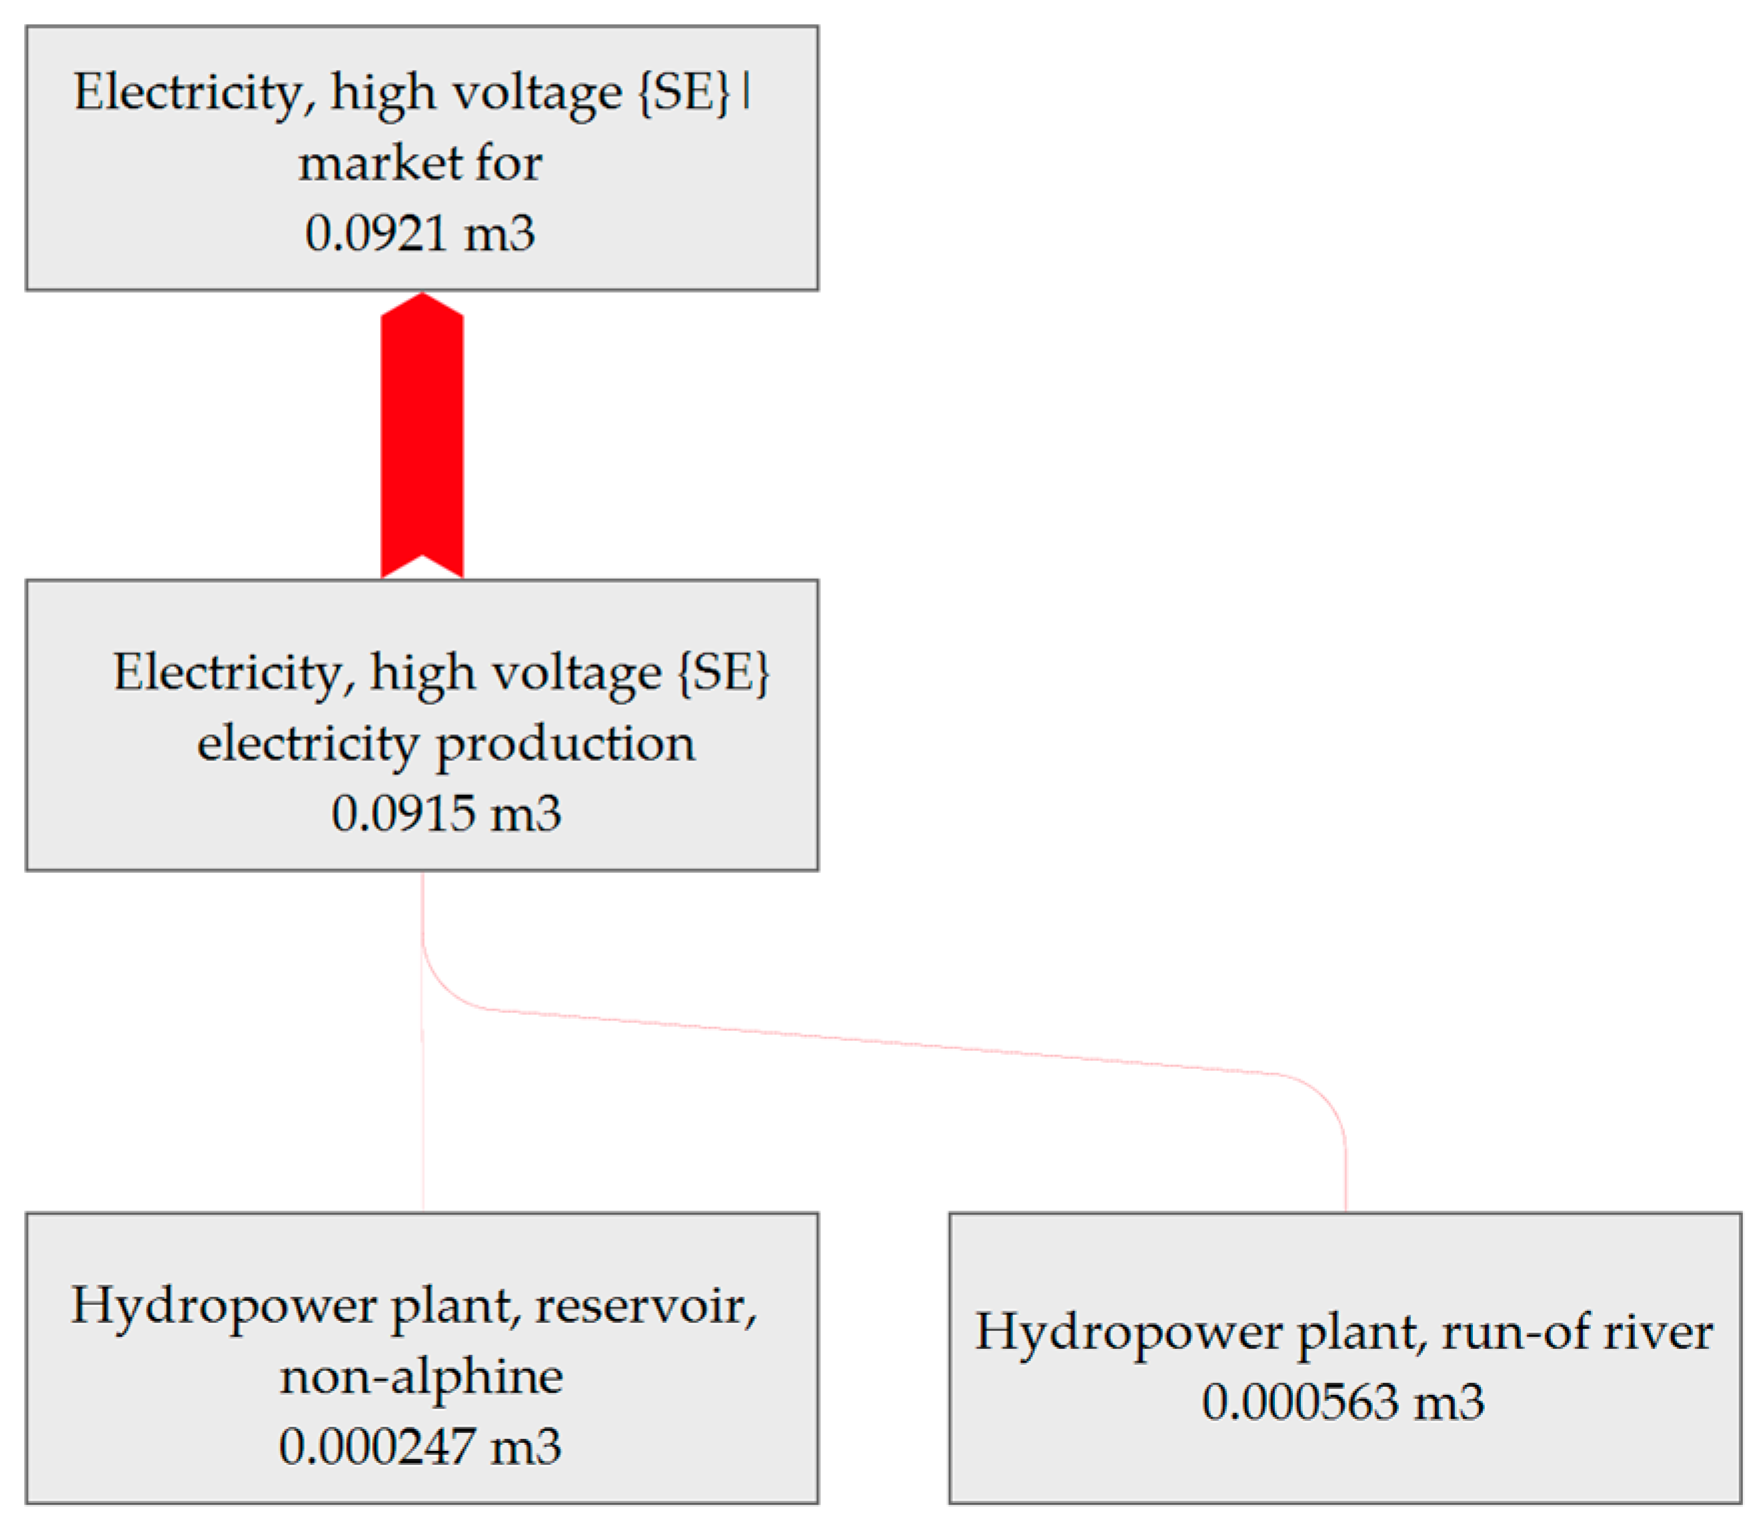
For the electricity input, the energy supplier mix is 100% hydropower, 12.71 kWh is consumed per kg of tomatoes, and 0.0921 m
3 of water is consumed in the electricity high voltage, due to the gravel extraction and steel production for the hydropower plant construction (
Figure 12).
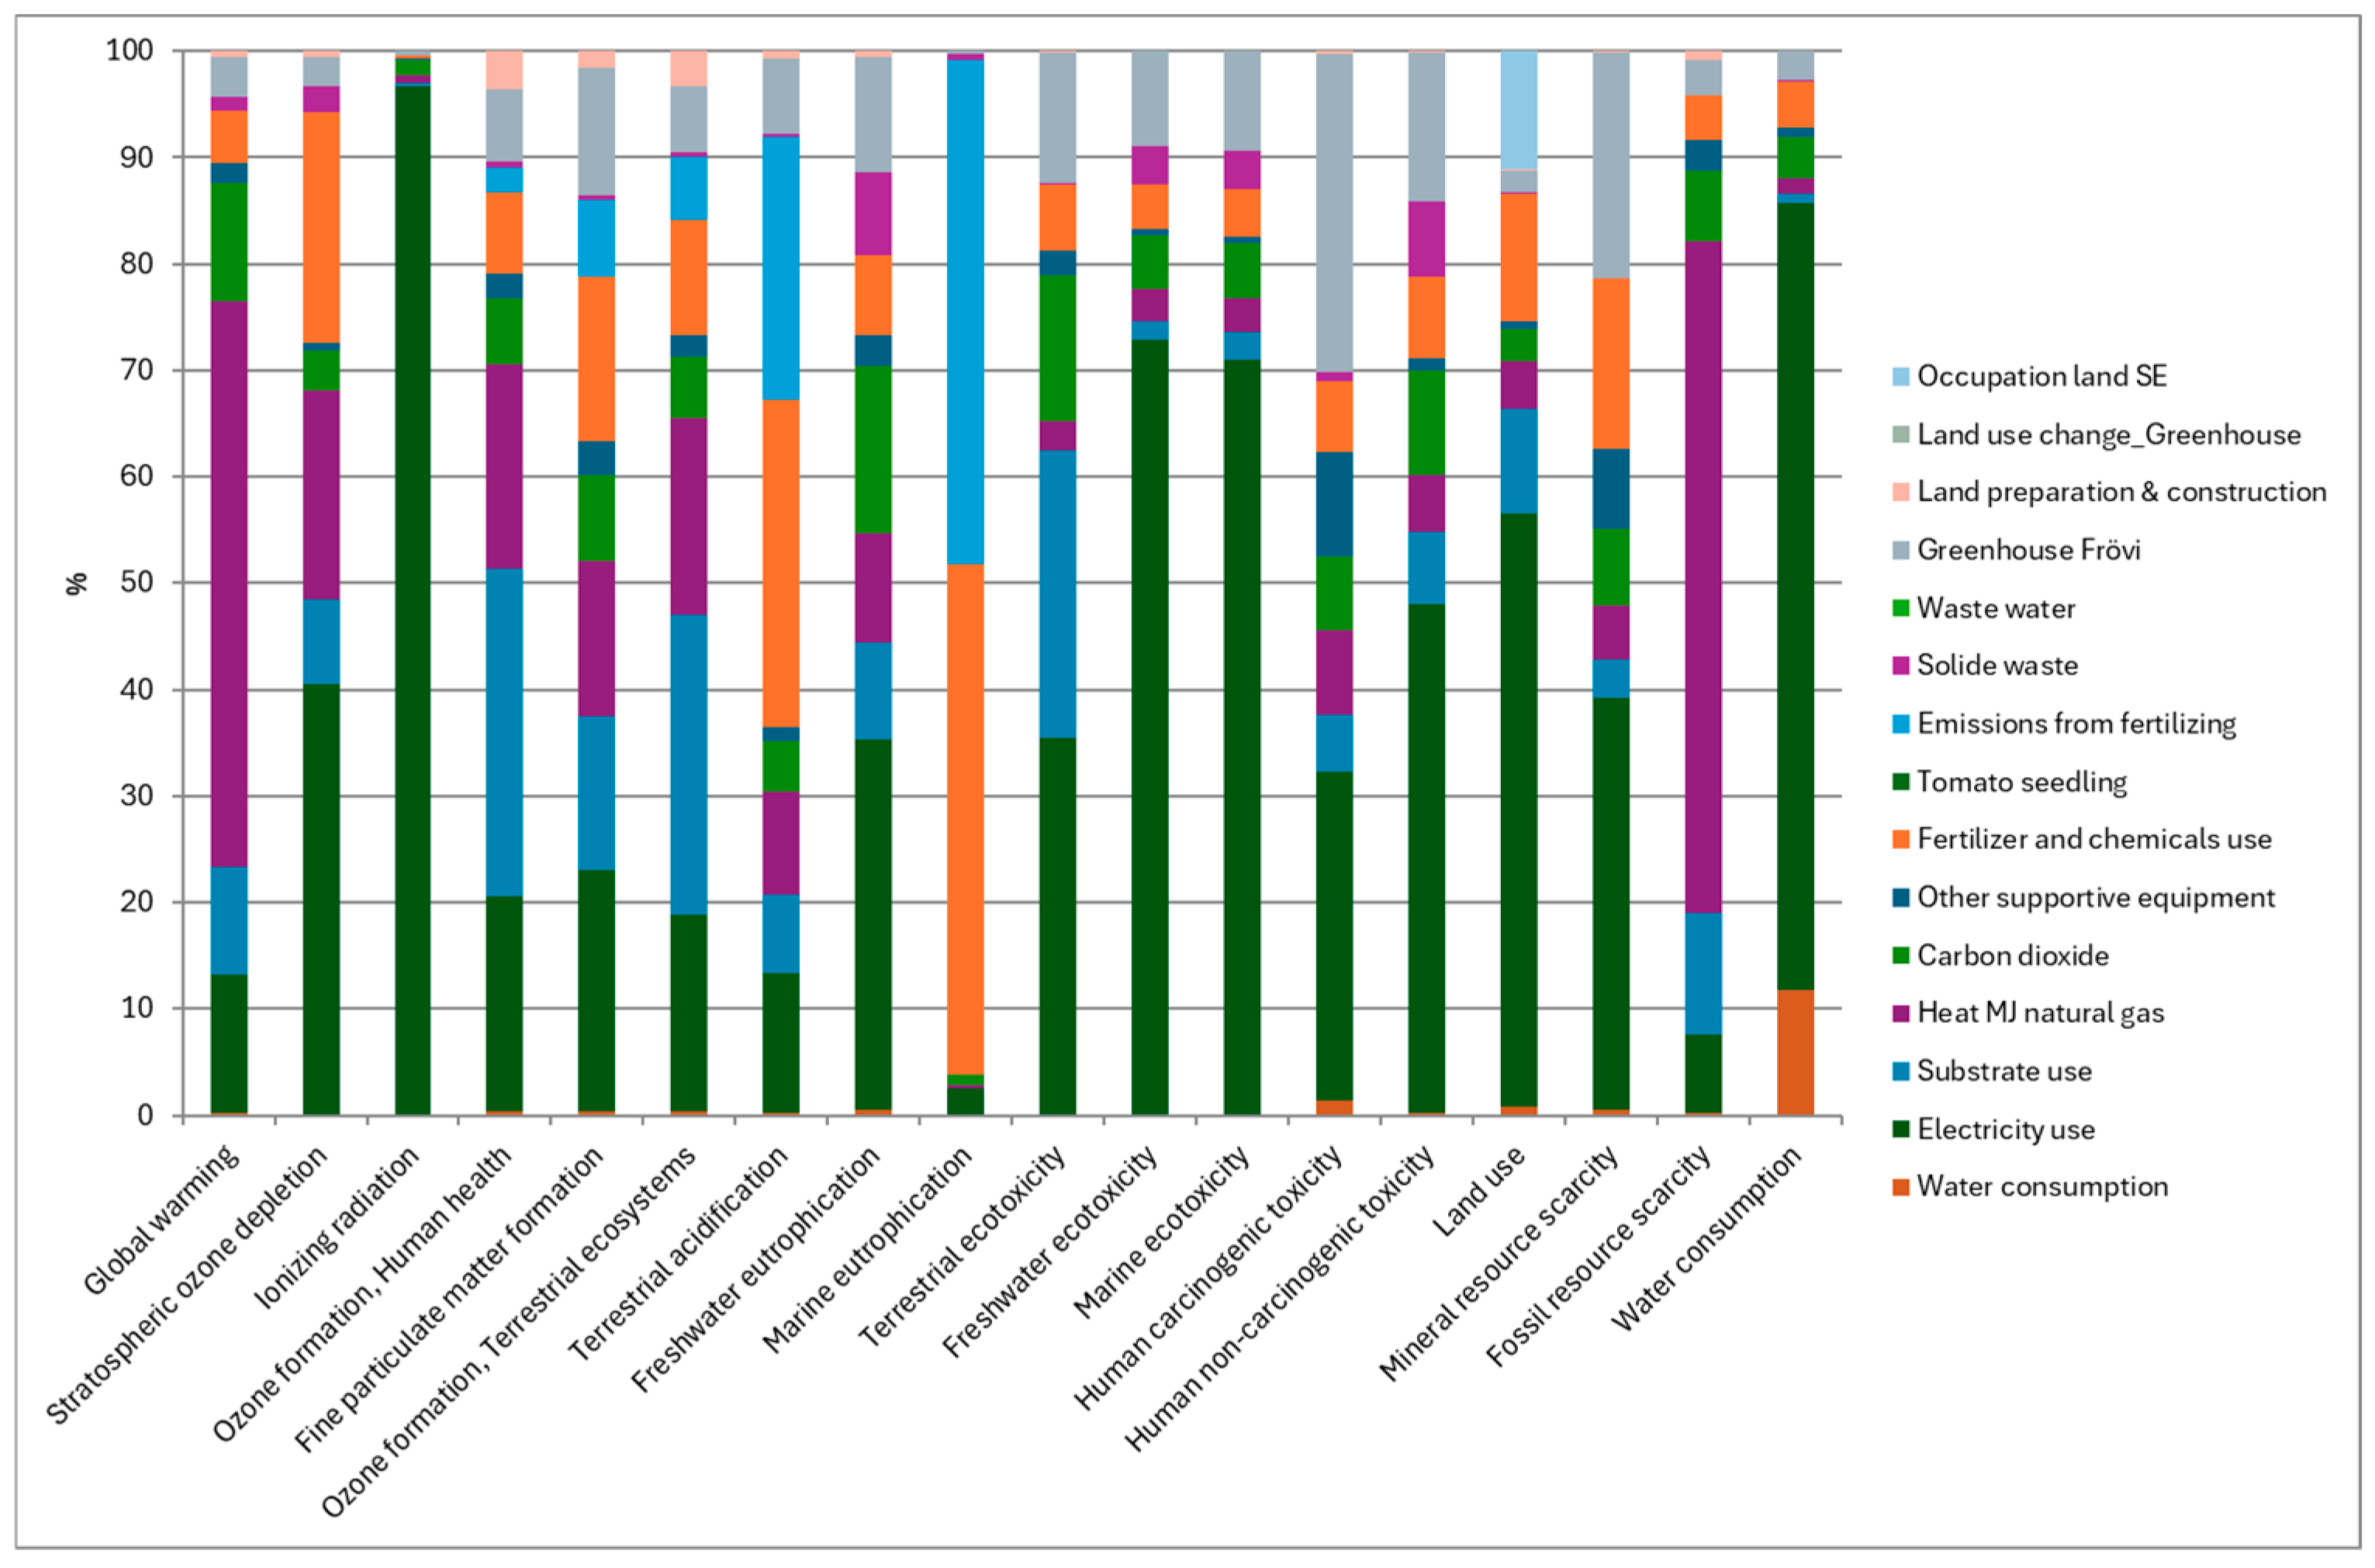
When analyzing Scenario 1.2 (
Figure 13,
Table 7. Life cycle assessment results (energy processes) for Scenario 1.2 per FU) and Scenario 1.3 (
Figure 14,
Table 8. Life cycle assessment results for Scenario 1.3 (heat natural gas process) per FU), in addition to the main impact contributors already identified in Scenario 1.1, the heat produced by biomass (Scenario 1.2) and by natural gas (Scenario 1.3) emerges as a major factor in the Global Warming Potential impact category. However, using biomass as a heat source results in lower environmental impact than using natural gas in this category.
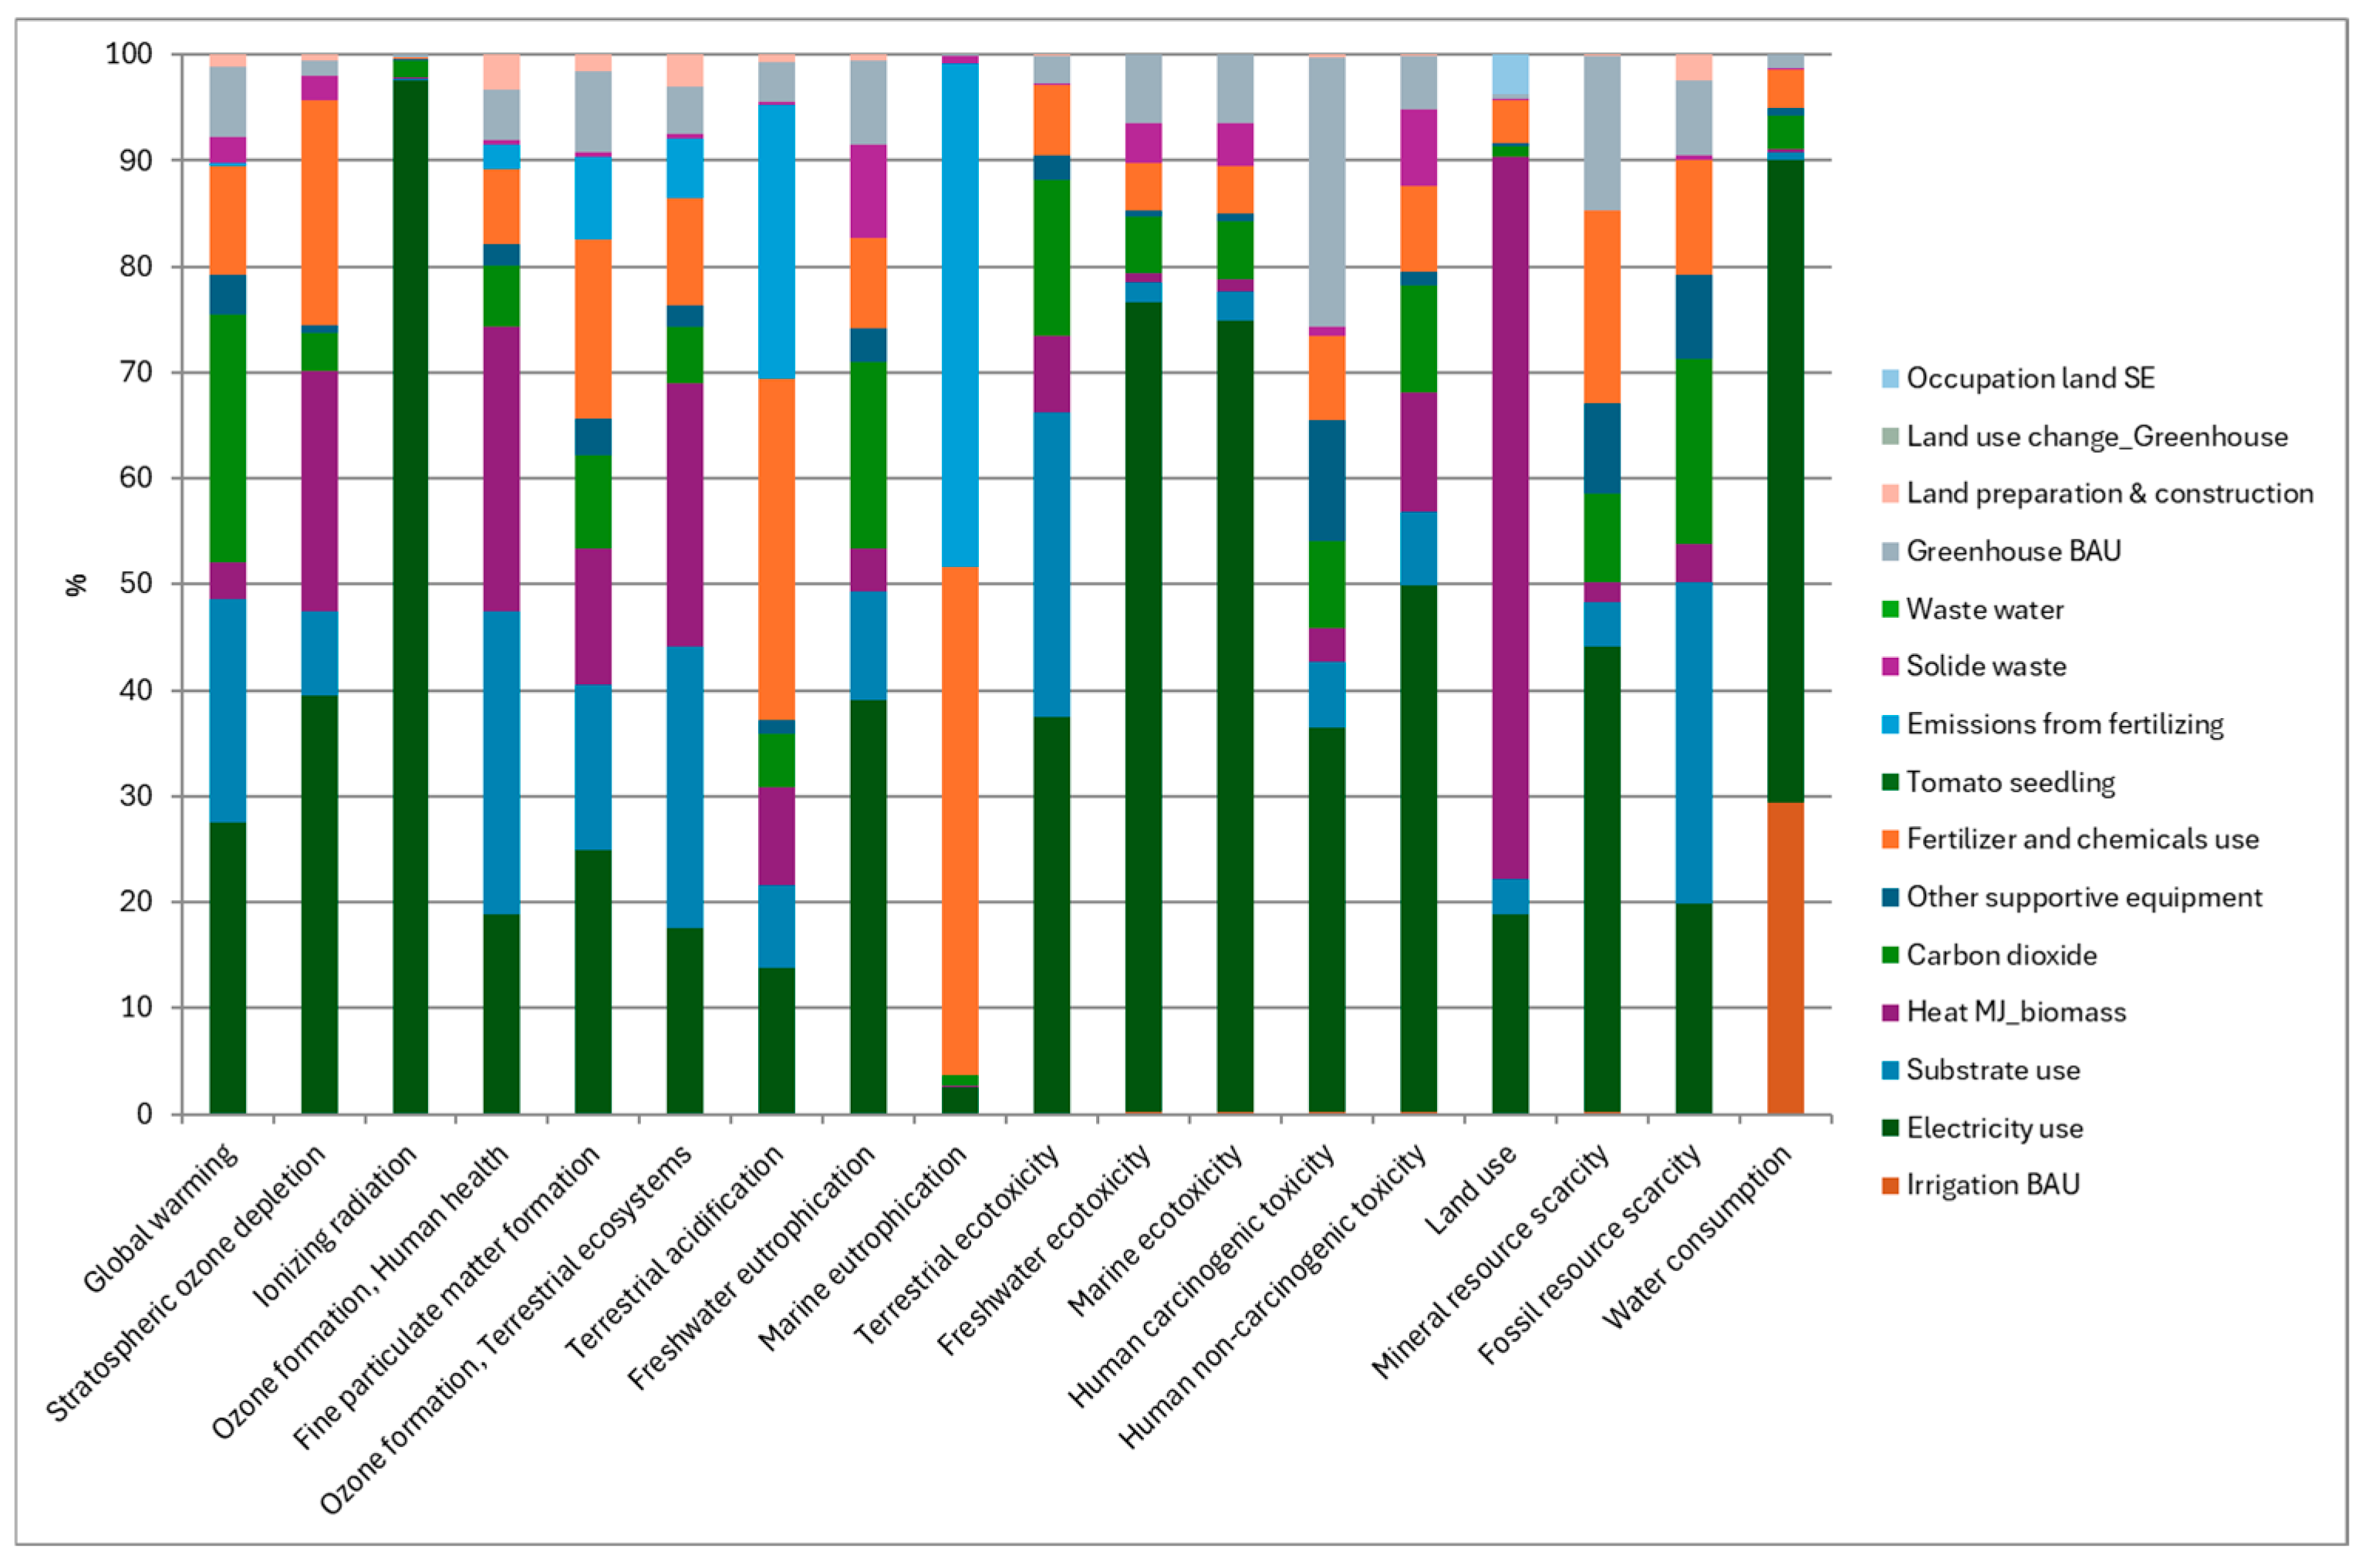
Scenario 2 (
Figure 15) indicates that the Swedish electricity mix (
Table 7) has a lower environmental impact compared to the Dutch electricity mix. Meanwhile, the transport of tomatoes from the Netherlands to Sweden in Scenario 3 (
Figure 16 and
Table 9) represents a considerable impact, which is avoided in all other scenarios. However, in Scenario 1.1, the waste heat recovery system increases the impact associated with the greenhouse infrastructure. Despite this, its overall impact is offset by the avoided heat production from biomass (Scenario 1.2) and natural gas (Scenario 1.3).
3.2. LCC Evaluation
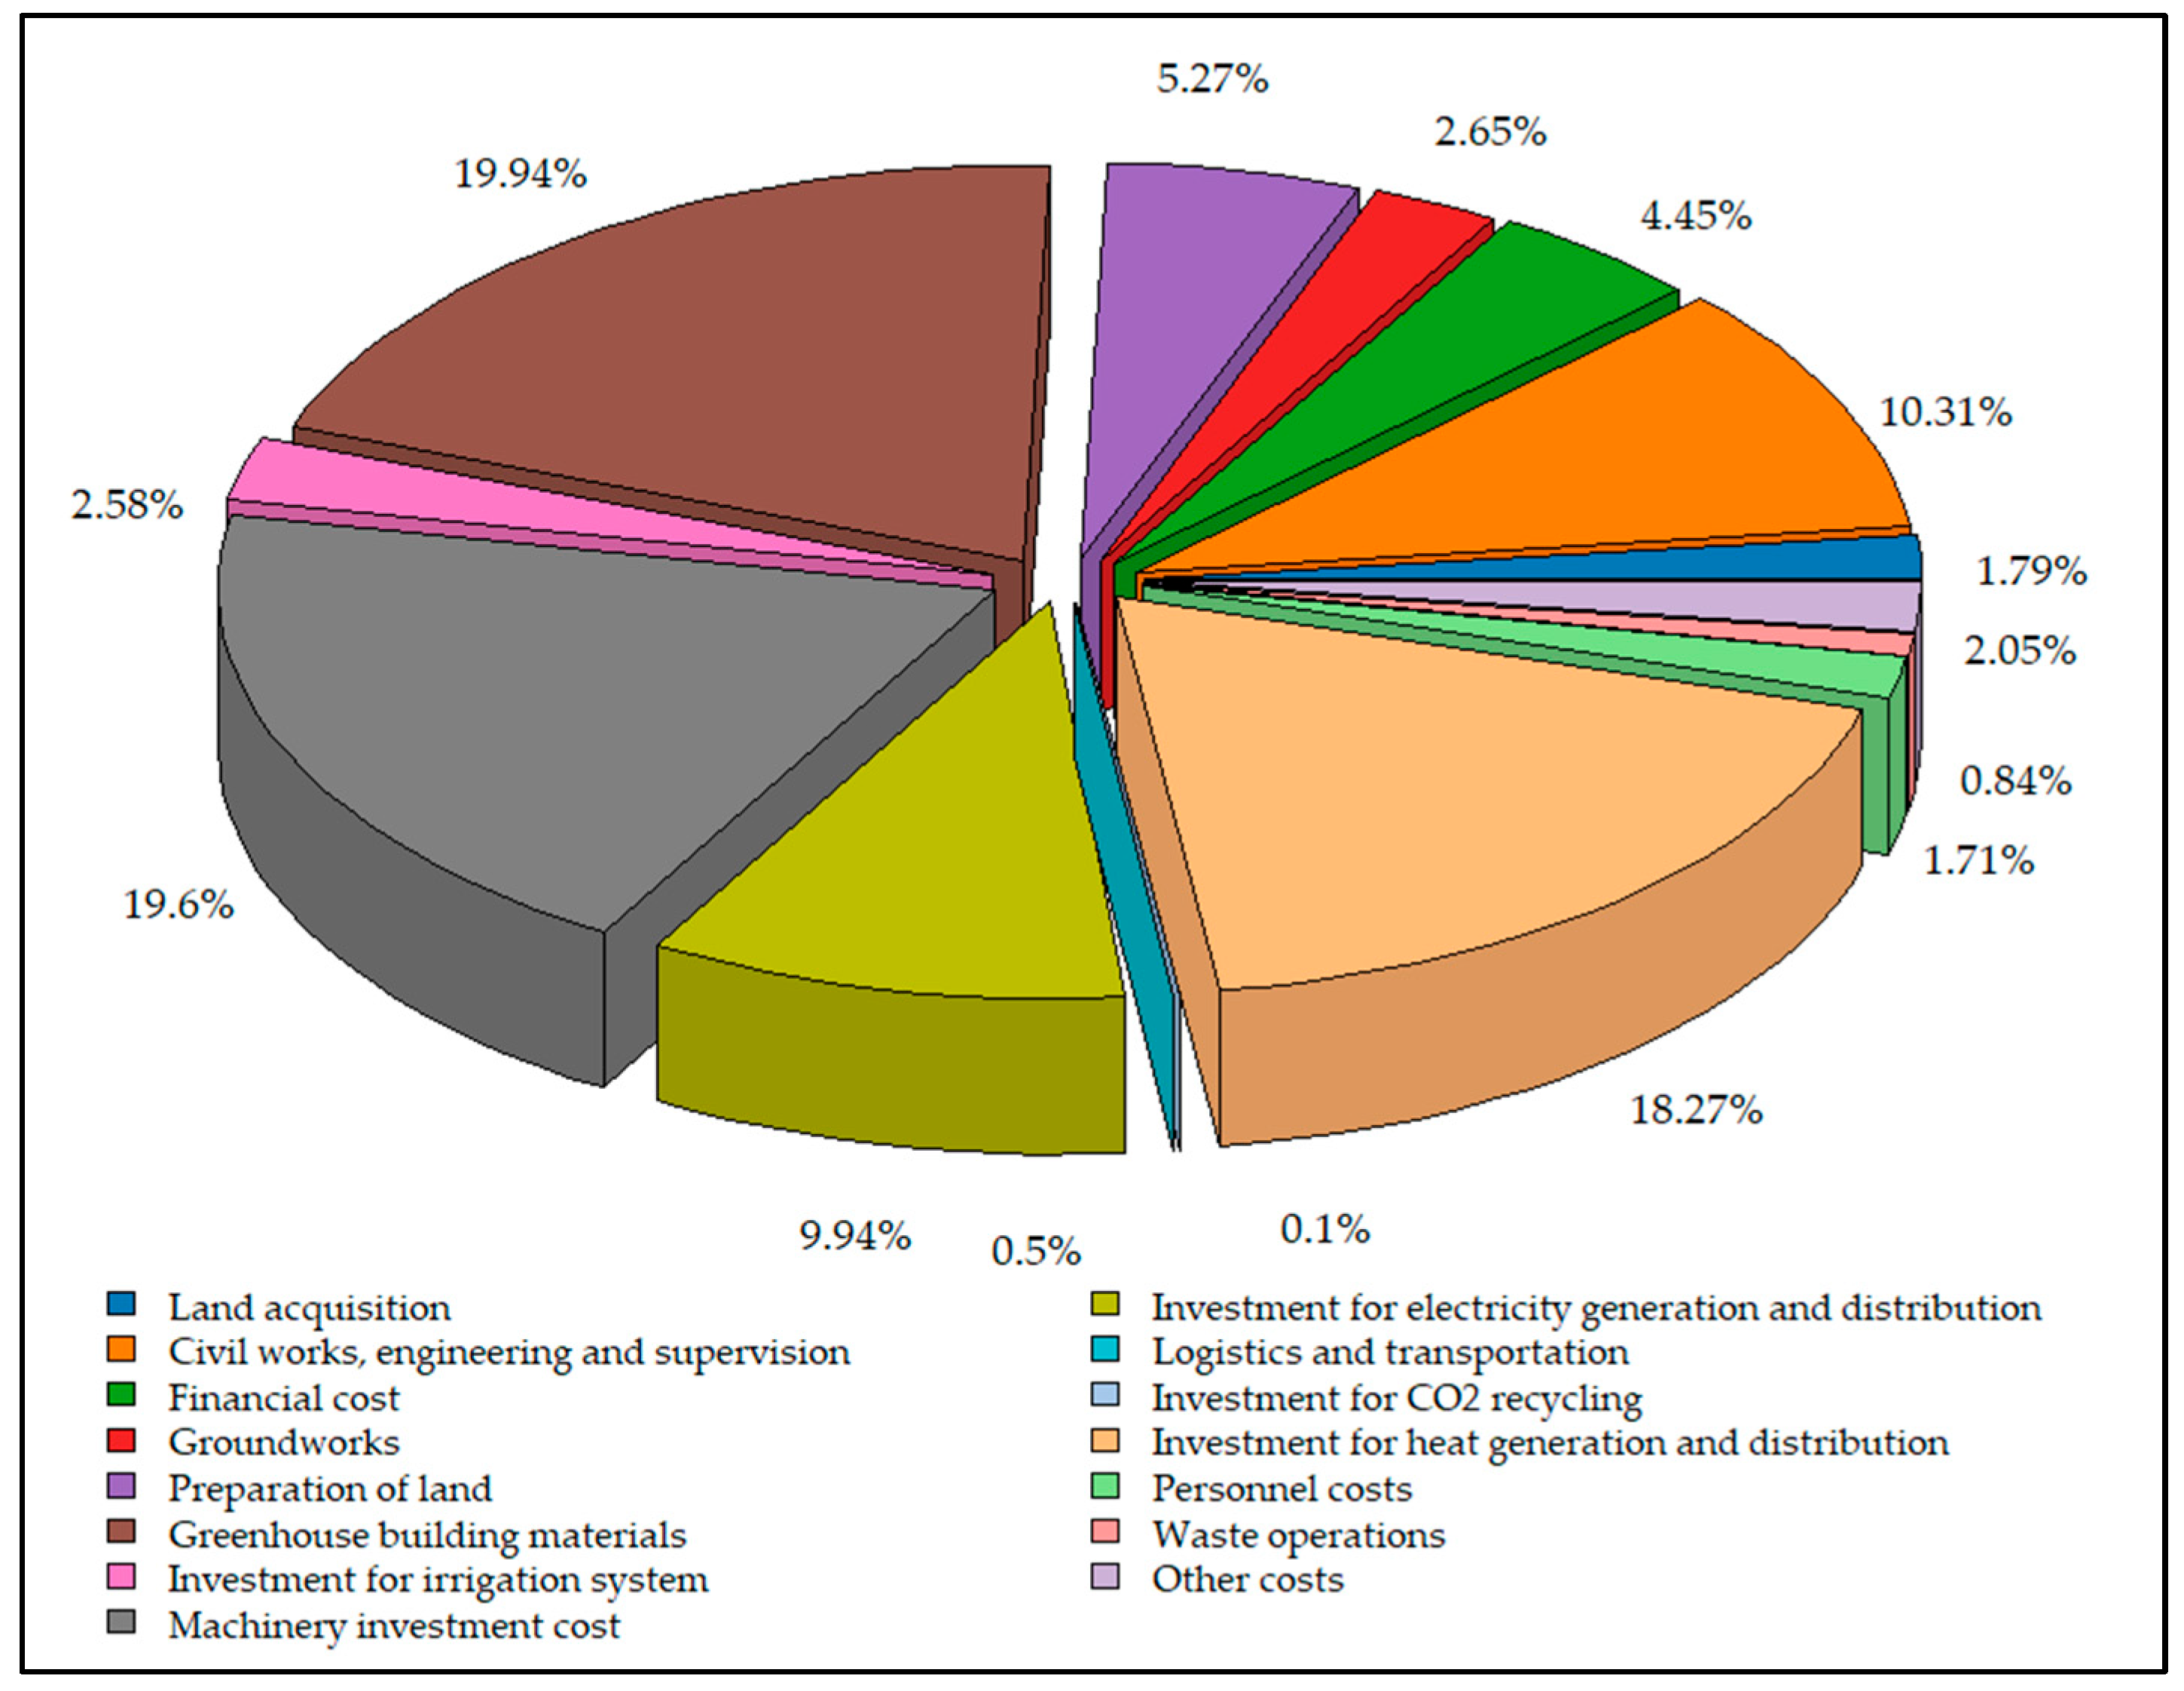
The most significant Capital Expenditures (CapEx) are related to infrastructure and functionality, while the main Operational Expenditures (OpEx) are associated with personnel and energy costs.
Figure 17 and
Figure 18 present the financial structure of the project, detailing the distribution of Capital Expenditures (CapEx) and Operational Expenditures (OpEx).
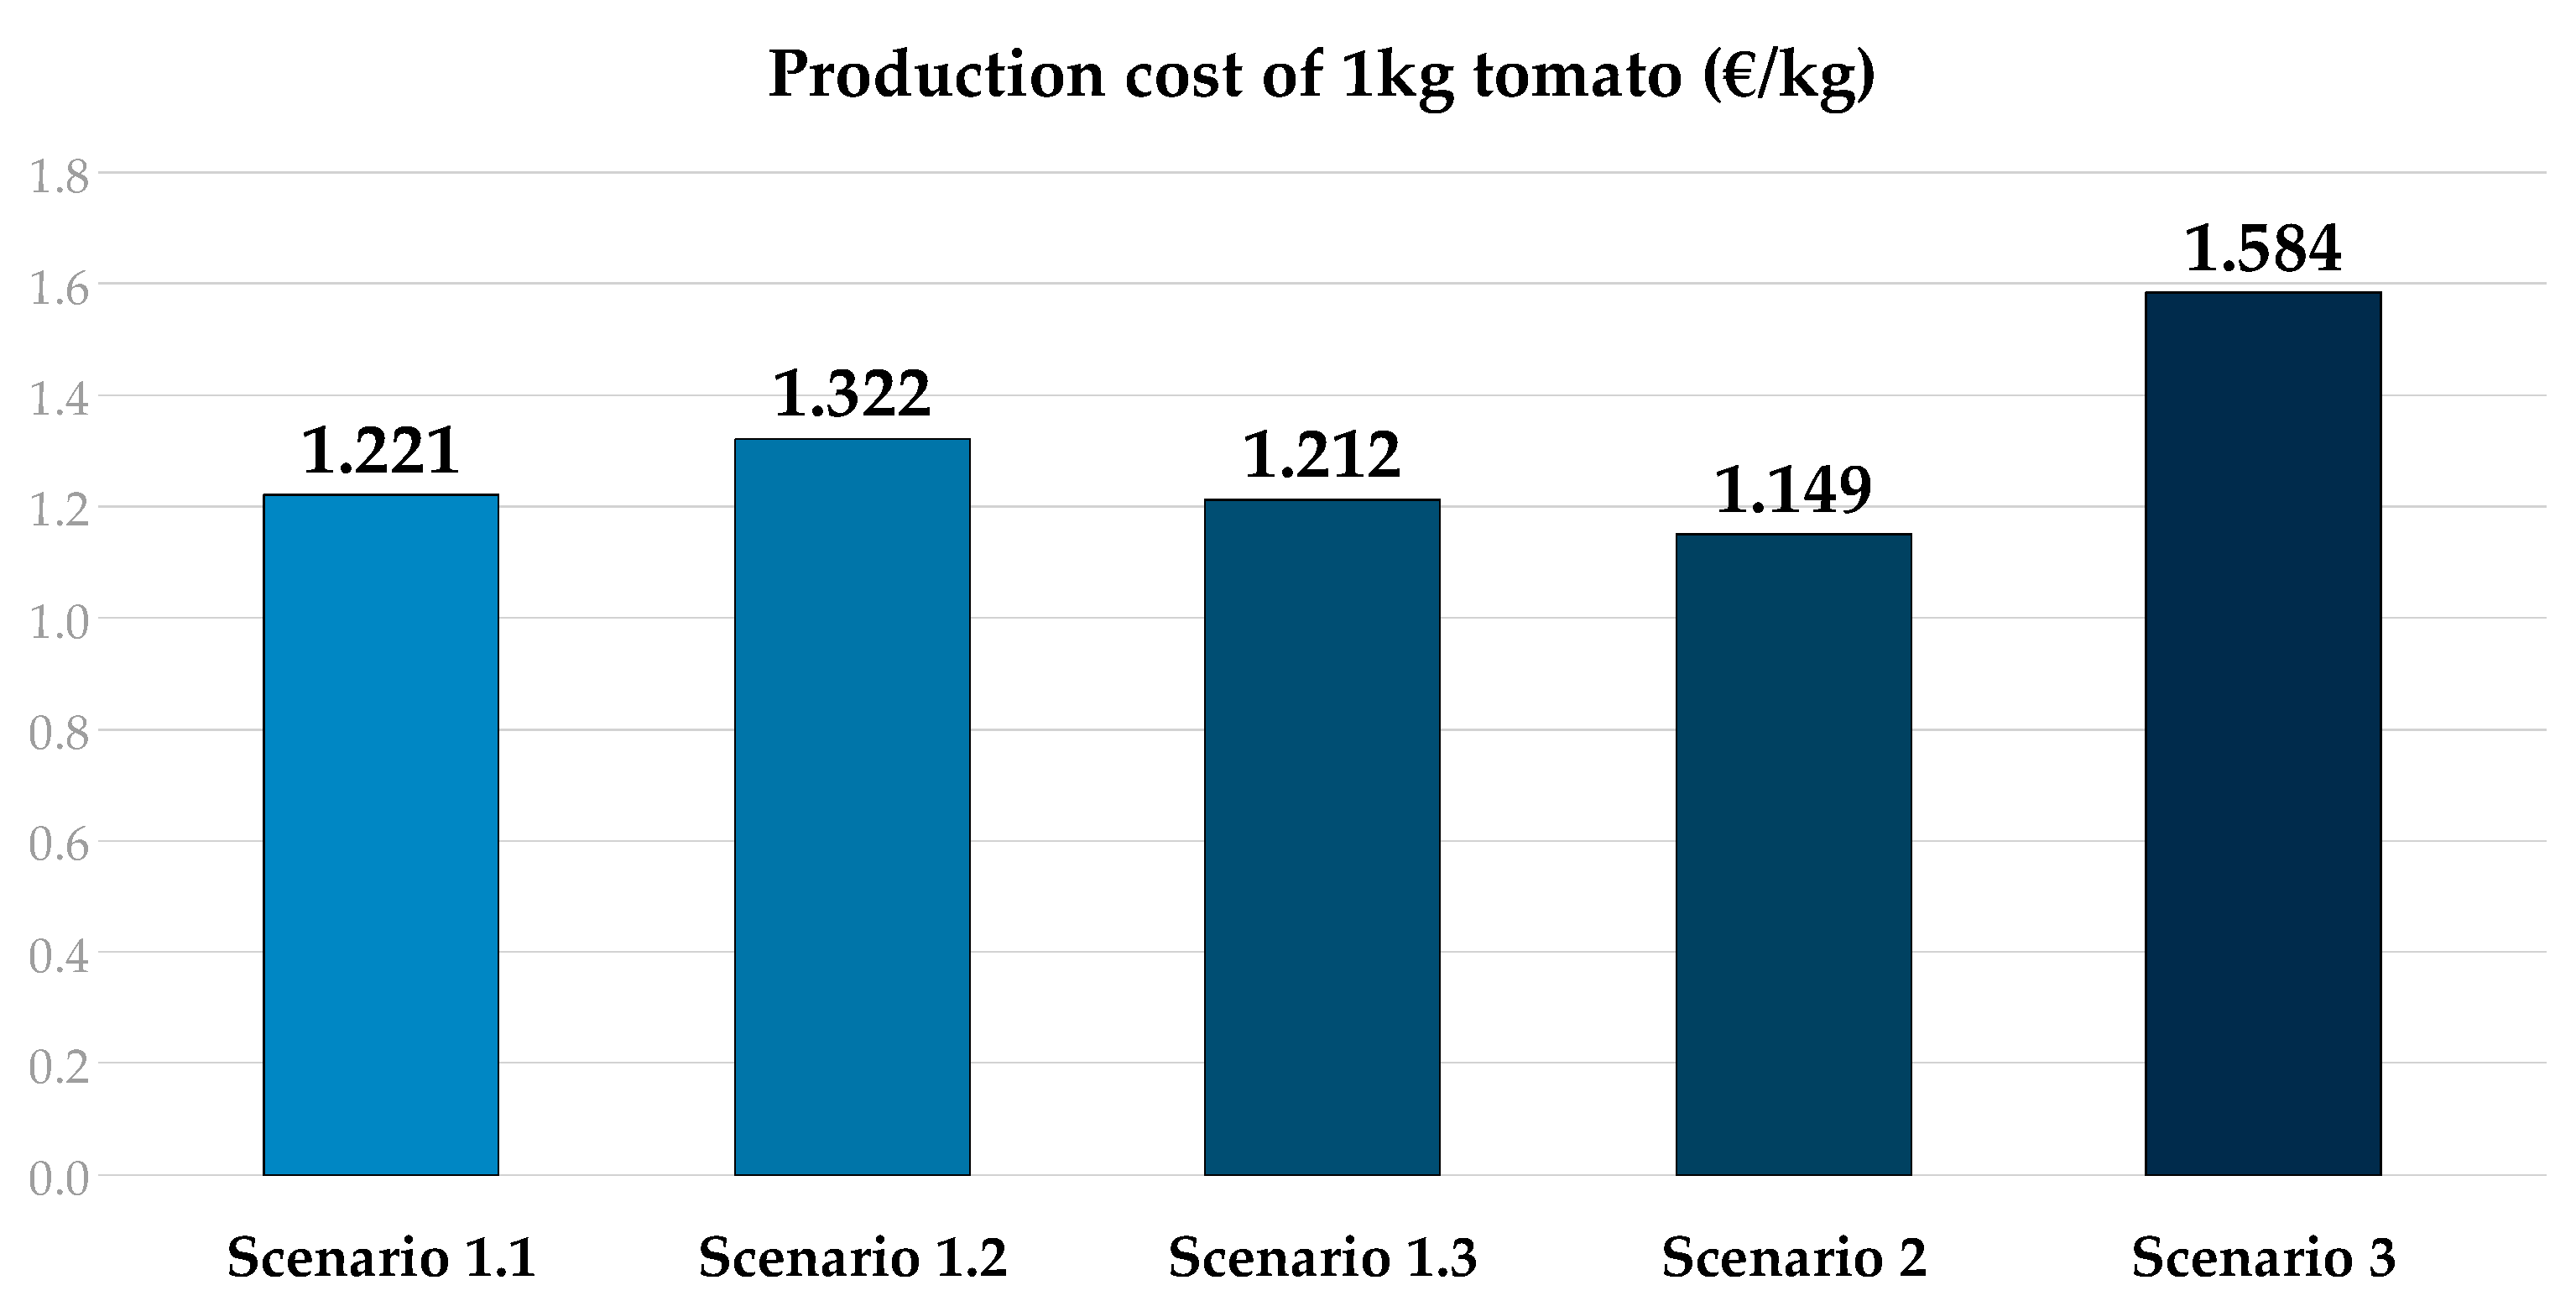
Figure 19 illustrates the differences in production costs per kg of tomatoes across the analyzed scenarios. The results indicate that production costs range from €1.149/kg (Scenario 2) to €1.584/kg (Scenario 3), highlighting the economic trade-offs between sustainable and conventional greenhouse practices.
Scenario 1.1 (€1.221/kg) has a relatively low production cost, benefiting from 100% hydropower electricity supplied locally and waste heat from the pulp and paper mill. However, it is slightly more expensive than Scenario 1.3 (€1.212/kg), due to Capital Expenditures, and Scenario 2 (€1.149/kg), which achieve lower costs due to their specific energy configurations. Scenario 1.2 (€1.322/kg) shows a moderate cost increase due to its dependence on the Swedish energy mix (SE mix), which combines renewable and non-renewable sources. Scenario 1.3, which relies on natural gas for heating, is more cost-efficient than Scenario 1.1.
Scenario 2 (€1.149/kg), representing a typical Swedish greenhouse, closely aligns with Scenario 1.3, reflecting similar energy dependencies and efficiencies. Scenario 3 (€1.584/kg), the most expensive scenario, represents the Dutch greenhouse model, which relies on energy-intensive operations, mainly using natural gas, leading to higher economic costs and environmental impacts.
These findings highlight that while Scenario 1.1 benefits from renewable and waste-based energy sources, Scenario 1.3 and Scenario 2 offer lower costs for greenhouse tomato production in Sweden.
4. Discussion
The present work has been dedicated to analyzing the environmental and economic impact of the CORALIS project through the study of a demo case where different industrial symbiotic solutions have been tested, with a focus on the demonstration of recycling of low-grade waste heat for ambient heating in a tomato greenhouse.
The innovative tomato greenhouse demo case constructed in Frövi, Sweden shows that there are both environmental and economic benefits when comparing the industrial symbiotic scenario with the rest of the scenarios included in the study. The main findings from this study are the following:
The LCA results demonstrate significant reductions in environmental burdens across key impact categories (in fact, 17 out of 18 environmental impact categories are included in the LCA, when the symbiotic scenario (1.1) is compared with the Netherlands BAU scenario (3)).
The total avoided GHG emissions of the symbiotic scenario (Scenario 1.1), compared with the Netherlands BAU scenario (Scenario 3) are 3.382 kg CO2 equivalents per kg of tomatoes produced, or 29,270 tons of CO2 equivalents yearly when considering the 30-year estimated lifespan of the greenhouse. When compared with the rest of the scenarios the GHG emissions avoided are less, but still the symbiotic scenario is the least impacting with respect to the Global Warming Potential impact.
The total water consumption per kg of tomatoes is 9% higher (0.003 m3/kg tomatoes) when the symbiotic scenario (Scenario 1.1) is compared to the Netherlands BAU scenario (Scenario 3).
The total fossil resources used per kg of tomatoes is 87% lower (1.07 kg of oil equivalent/kg tomatoes) when the symbiotic scenario (Scenario 1.1) is compared to the Netherlands BAU scenario (Scenario 3), when the greenhouse is heated mainly by waste heat from the pulp and paper as expected.
The LCC indicated that when comparing all the scenarios, the average Swedish greenhouse scenario (Scenario 2) had the lowest production costs.
The LCC also highlighted that the greenhouse building materials, machinery investment, and investment for heat generation and distribution costs accounted for the largest portions of the Frövi project CapEx (combined 57.8%). The LCC also indicated that the personnel and energy costs accounted for the largest portions of OpEx (combined 57%) for the Frövi project. Therefore, these can be understood as key leverage points for further reducing the CapEx and OpEx in similar future symbiosis projects, conceptualized in the literature.
LCA has been proven to be an effective methodology/tool to evaluate and compare the environmental impacts/benefits of IS scenarios versus BAU scenarios, aligned with previous works where it is used to evaluate the benefit of applying IS in an energy-intensive industrial park in China [
17,
41]. LCA and LCC are instruments proposed to overcome economic uncertainty in future investments within an IS context in the work of Mainar-Toledo et al. (2022) [
17].
Examples of future explorations could be to look into how organic fertilizers’ impact would decrease if waste heat from other facilities in the proximity could be used to replace heat from fossil fuels [
42]. The Frövi LCA and LCC example also highlights that it is a viable option to utilize waste heat other than for replacing fossil fuels from local heating systems [
26], while assessing the emission reduction potential of biofuels in Sweden.
Other interesting analyses to pursue for the case of Frövi are applications to use the low-grade waste heat for drying purposes when the waste heat from the pulp and paper is not needed, such as is the case during the summer period. Previous studies have pointed to the potential of waste heat for decreasing the environmental impacts from different production processes, where the recovery of low-grade heat could potentially improve the environmental performance of the coking industry, mainly through heat recovery for preheating coal [
25]; others have suggested that using waste heat from other industrial processes for drying and wet extraction processes would improve the energy demands of the algal biofuel production facility [
43].
5. Conclusions
This LCA and LCC assessment applied to a real IS demonstrator intended to assess the environmental and economic impacts of low-grade waste recycling, thus filling the gap in the literature for real case analysis of symbiosis developments. The results obtained at Frövi demonstrate the following:
The IS model is economically and environmentally viable, when speaking about recovering waste heat from a near industrial facility and when the greenhouse and its systems perform as expected.
The LCA indicated that greenhouse building materials were a key contributor to environmental impact, which highlights the importance of material choices in early project design stages.
The LCA also indicated that the waste heat symbiotic scenario had a significant environmental impact related to the waste heat pipe infrastructure and water pipe infrastructure when compared with the generic Sweden scenario (Scenario 2) and the generic Netherlands scenario (Scenario 3).
While the symbiotic scenario (Scenario 1.1) performed better than the generic Netherlands scenario (Scenario 3) in 17 out of 18 impact categories, the other scenarios (Scenarios 1.2, 1.3, and 2) indicated that there are some areas of potential improvement for future similar projects.
The solution established for the present study shows that the waste recovery system helps to reduce both the environmental impacts and the economic impacts of the tomatoes produced in Frövi’s greenhouse.
Additionally, the Frövi tomato greenhouse avoids environmental and economic impacts related to the use of natural gas for heating and related to the transport from the Netherlands to Sweden required in the BAU Netherlands scenario (Scenario 3).
This research presents a novel application of LCA and LCC to an industrial symbiosis case in greenhouse agriculture, demonstrating the dual benefits of waste heat recovery in terms of both environmental and economic performance. The findings provide robust evidence that IS can be a viable strategy for decarbonizing agricultural heating systems, reducing operational costs, and improving energy efficiency. This approach serves as a replicable model for future implementations of IS in different sectors, particularly in regions aiming to optimize resource use and transition towards more circular economies.
Nevertheless, further research is needed to explore IS projects on a larger scale. Future studies should analyze and compare additional waste heat reuse scenarios, considering different heat source temperatures, geographical contexts, and agricultural applications beyond greenhouse tomato production, such as protein, shrimp, or fish farming. Additionally, validating these findings with real operational data, rather than estimated values, would strengthen the robustness of the conclusions and enhance their applicability in real-world industrial symbiosis strategies.
Despite these promising results, several barriers could limit the large-scale adoption of waste heat recovery in greenhouse agriculture. The high initial investment (CapEx) required for infrastructure, such as heat transport pipelines and greenhouse adaptation, poses a significant challenge, particularly in the absence of financial incentives. Additionally, the geographical proximity between heat suppliers and greenhouse operations is crucial, as long-distance heat transport can reduce efficiency and increase costs. Regulatory constraints also play a key role, as policies governing energy use, waste heat valorization, and agricultural production may not fully accommodate industrial symbiosis solutions.
Moreover, energy price volatility could affect the long-term economic viability of these systems, requiring further research into mechanisms that could mitigate financial risks, such as subsidies, carbon pricing incentive, or long-term energy purchase agreements. Future research should explore these aspects to better understand how policy support, business model innovation, and stakeholder collaboration can enable broader adoption of industrial symbiosis strategies for sustainable greenhouse production.


 ,
, 