Article

A Study on Non-Contact Multi-Sensor Fusion Online Monitoring of Circuit Breaker Contact Resistance for Operational State Awareness

1
Langfang Power Supply Company, State Grid Jibei Electric Power Company Limited, Langfang 065000, China
2
School of Electrical and Information Engineering, Zhengzhou University, Zhengzhou 450000, China
*
Author to whom correspondence should be addressed.
Energies 2025, 18(10), 2667; https://doi.org/10.3390/en18102667
Submission received: 2 April 2025 / Revised: 19 May 2025 / Accepted: 19 May 2025 / Published: 21 May 2025

Abstract

:
The contact condition of circuit breaker contacts directly affects their operational reliability, while circuit resistance, as a key performance indicator, reflects physical changes such as wear, oxidation, and ablation. Traditional offline measurement methods fail to accurately represent the real-time operating state of equipment due to large errors and high randomness, limiting their effectiveness for state awareness and precision maintenance. To address this, a non-contact multi-sensor fusion method for the online monitoring of circuit breaker circuit resistance is proposed, aimed at enhancing operational state awareness in power systems. The method integrates Hall effect current sensors, infrared temperature sensors, and electric field sensors to extract multiple sensing signals, combined with high-precision signal processing algorithms to enable the real-time identification and evaluation of circuit resistance changes. Experimental validation under various scenarios—including normal load, overload impact, and high-temperature and high-humidity environments—demonstrates excellent system performance, with a fast response time (≤200 ms), low measurement error (<1.5%), and strong anti-interference capability (SNR > 60 dB). In field applications, the system successfully identifies circuit resistance increases caused by contact oxidation and issues early warnings, thereby preventing unplanned outages and demonstrating a strong potential for application in the fault prediction and intelligent maintenance of power grids.

1. Introduction

In the operation and maintenance of power systems, a circuit breaker serves as a key switching device whose performance status directly affects the overall safety and stability of the system [1]. As an important index to characterize the contact quality of circuit breaker contacts, circuit resistance is not only closely related to the contact quality but is also affected by ambient temperature, contact pressure, and other factors [2,3]. At the same time, circuit resistance can also effectively reflect the contact wear, oxidation, thermal ablation, and other physical changes during long-term operation [4,5]. Therefore, real-time and accurate monitoring of circuit breaker circuit resistance is one of the essential means to ensure the reliable operation of power grid equipment [6].
Numerous methods, which can generally be classified into traditional offline testing techniques and online monitoring approaches, have been proposed by researchers for circuit resistance measurement,. Currently, widely used offline methods include the DC voltage drop method [7] and the micro-ohmmeter technique [8]. The former estimates resistance by applying a constant current and measuring the voltage drop, which, despite its simplicity, is susceptible to errors caused by contact temperature rise and current fluctuations. The latter employs a four-wire measurement scheme to eliminate lead resistance, offering improved accuracy but still requiring equipment shutdown, making it incapable of capturing real-time operational conditions. These conventional offline techniques not only fail to accurately reflect the true resistance characteristics under actual operating conditions but also suffer from poor timeliness and significant variability [9,10]. With the development of technology, more and more researches focus on resistance detection methods based on online monitoring technology, especially combined with multi-sensor data fusion technology [11,12].
Currently, numerous attempts have been made to apply non-contact sensing technologies in power equipment monitoring. However, single-sensor approaches exhibit significant limitations. For example, Ref. [12] proposed an indirect temperature estimation method for circuit breaker contacts using infrared thermography. This method is vulnerable to environmental radiation interference (e.g., direct sunlight exposure, variations in equipment surface reflectivity), resulting in temperature measurement errors as high as ±5 °C. In the literature, Ref. [13] introduced a Hall sensor system developed by ABB, which achieves ±1% precision but has a limited measurement range (±50 A). To extend its range to kiloampere levels, integration with current transformers is required, complicating the system and increasing costs. In the literature, Ref. [14] proposed a non-contact sensing technique for transformer windings based on three-dimensional frequency response analysis (FRA) signals and image processing. While this approach holds potential for circuit breaker fault detection, its technical adaptability is constrained. The FRA signals, originally designed for the static structural analysis of transformer windings, tend to distort under the intense arc electromagnetic interference encountered during circuit breaker contact opening/closing, leading to signal-to-noise ratios (SNRs) dropping below 30 dB. In contrast, the proposed multi-sensor fusion method synergistically integrates the following three sensing modalities to overcome the limitations of single-sensor systems: Hall sensors are combined with current transformers to extend the measurement range while maintaining high accuracy; infrared sensors incorporate dynamic temperature and radiation compensation algorithms to suppress environmental interference; differential electric field sensors employ symmetrical electrode designs to mitigate electromagnetic noise. Collectively, these innovations achieve an error < 1.5% and SNR > 60 dB, addressing the trade-offs between precision, dynamic range, and environmental robustness inherent in conventional single-sensor approaches.
In recent years, online monitoring technologies have evolved from indirect inference methods (e.g., temperature- or vibration-based approaches) to non-contact direct measurement techniques [15,16]. Among these, electromagnetic induction principles (e.g., Hall sensors) and infrared thermometry have emerged as research hotspots due to their high safety and real-time capability [17]. However, existing technologies still face challenges such as insufficient environmental interference suppression and low sensor reliability [18].
This paper proposes an online monitoring method for circuit resistance that integrates multiple types of non-contact sensors. The system incorporates Hall effect current sensors [19], infrared thermal elements [14], and electric field detection units [20,21] to form a collaborative sensing model. A dynamic temperature compensation mechanism and multi-source feature fusion algorithm are also developed to suppress environmental interference and high-frequency noise, enabling the high-reliability real-time detection of circuit breaker circuit resistance. This study begins by analyzing the theoretical basis and influencing factors of circuit resistance. It then details the design and implementation of the multi-sensor fusion system. Subsequent experimental validation demonstrates the system’s performance advantages in dynamic response, anti-interference capability, and measurement accuracy, showcasing the significant potential for grid fault warning and intelligent maintenance applications.

2. Measurement Principles and Influencing Factors of Circuit Breaker Circuit Resistance

The measurement of circuit breaker circuit resistance requires a distinction between direct current (DC) resistance and alternating current (AC) resistance, both of which are influenced by a combination of physical factors and environmental conditions affecting their stability.

2.1. Basic Theory of Resistance

Circuit breaker circuit resistance can be measured using either direct current (DC) resistance or alternating current (AC) resistance, with significant differences in their physical mechanisms and mathematical representations.

2.1.1. Differences Between DC Resistance and AC Resistance

DC resistance characterizes the hindering effect of a conductor on a steady state current and is calculated as:
R DC = ρ L A
where ρ is the material resistivity, L is the conductor length, and A is the cross-sectional area. The DC resistance considers only the resistive component, ignoring inductive and capacitive effects, and is suitable for low-frequency or static scenarios.
AC resistance reflects the total impedance of the conductor under an alternating current, which must account for the skin effect and proximity effect. Its effective resistance can be expressed as:
R AC = R DC ( 1 + δ r )
where δ = 2 ρ ω μ is the skinning depth (ω is the angular frequency, μ is the permeability) and r is the conductor radius. At high frequencies (>1 kHz), the skin effect causes the current to concentrate in the surface layer of the conductor and the resistance significantly increases.

2.1.2. Analysis of Power Frequency (50/60 Hz) Resistance Characteristics

In the industrial frequency range, the difference between AC resistance and DC resistance is small, but a correction factor k needs to be introduced:
R AC k R DC , k = 1.02 ~ 1.05
This correction factor can be calibrated by a finite element simulation or experiment.

2.2. Contact Performance and the Effect of Temperature

2.2.1. Characteristics of Contact Materials

The conductivity, oxidation resistance, and abrasion resistance of the contact material are key to determining the circuit resistance. Commonly used materials are as follows:
Copper: good electrical conductivity (conductivity 5.96 × 10⁷ S/m) but easy to oxidize at high temperatures to generate cuprous oxide (Cu2O), resulting in a significant increase in contact resistance.
Silver alloy: silver-based contacts (e.g., Ag/CdO) have a low oxidation rate at high temperatures and are resistant to arc erosion, but are more costly.
Plating materials: silver or gold plating on the surface of copper contacts can delay oxidation, but the performance of the plating wears down dramatically.

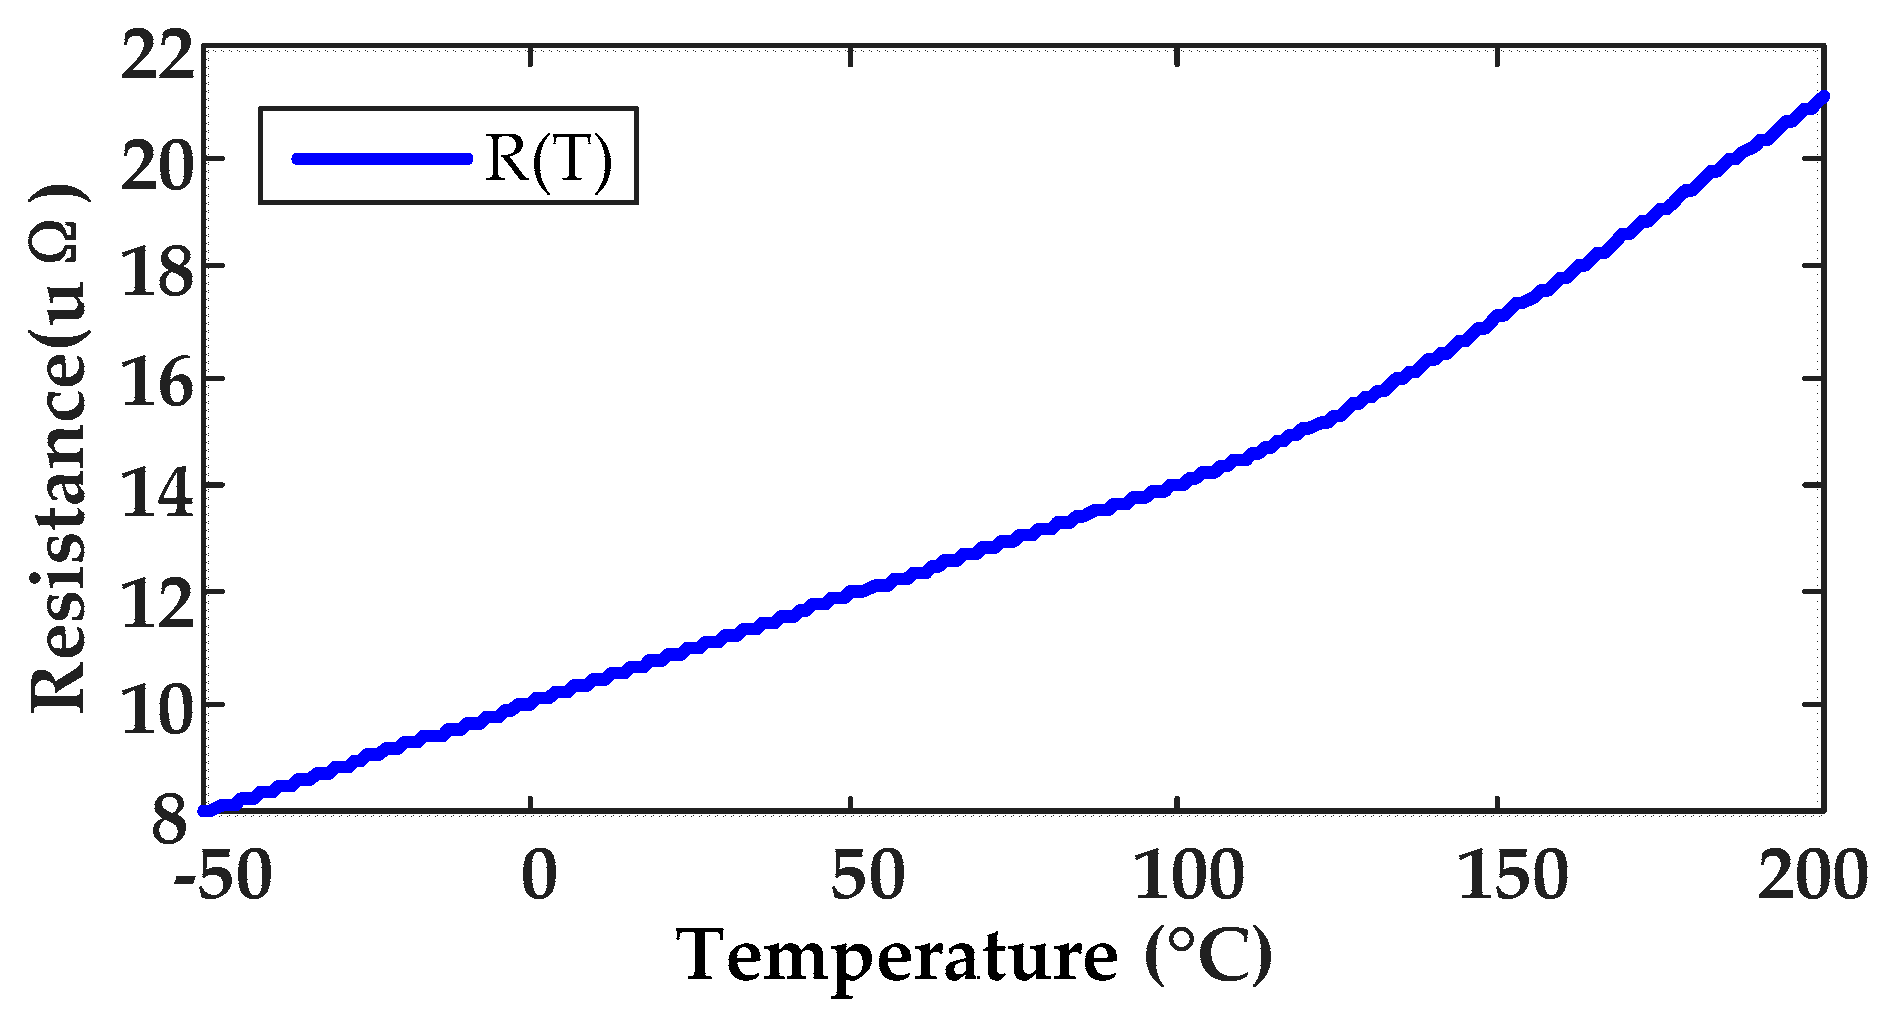
2.2.2. The Effect of Temperature on Resistance

When the circuit breaker breaks a large current, the contact temperature can instantly rise to hundreds of degrees Celsius, causing the following problems:
Material softening: the softening temperature of copper is about 200 °C; contact deformation leads to contact area reduction, and resistance increases.
Dynamic oxidation: high temperature accelerates the contact surface oxidation reaction, the thickness of the oxide layer (d), and the time (t) to meet the parabolic law (k is the oxidation rate constant).
Arc ablation: the arc energy is concentrated on the contact surface, forming a local melting pool, which produces uneven ablation pits after cooling, increasing the nonlinear fluctuation of contact resistance [22].

2.3. Wear and Thermal Effects of Current

2.3.1. The Effect of Mechanical Wear on Resistance

Contacts in the frequent opening and closing operations experience sliding friction and impact loads. Wear forms include the following:
Adhesive wear: cold welding occurs in the microscopic raised portion of the contact surface, and abrasive debris is formed when the material is torn apart during separation.
Fatigue wear: cyclical stresses cause surface cracks to expand and eventually spall off.
The wear rate (W) can be expressed as:
W = K F n v H
where Fn is the normal force, v is the sliding velocity, H is the material hardness, and K is the wear coefficient. Wear causes an increase in contact surface roughness (Ra) and contact resistance is positively correlated with Ra.

2.3.2. The Impact of Current–Heat Effect

Joule heat (Q) is related to current (I) and resistance (R) as:
Q = I 2 R t
The following effects are triggered by heat build-up when a sustained high current is passed through the contacts:
Resistance temperature drift: copper has a resistance temperature coefficient of 0.0039 °C−1, and resistance increases by approximately 19.5% for every 50 °C increase in temperature [23].
Thermal expansion mismatch: the difference in thermal expansion coefficients between the contact and the support results in an uneven distribution of contact pressure, exacerbating resistance fluctuations.

2.4. Ambient Factors and Contact Pressure

2.4.1. The Role of Ambient Environment and Medium

Although the circuit breaker contact is closed in the interrupter room, its circuit resistance is still affected by the state of the internal medium as follows:
Vacuum degradation: in the vacuum interrupter room, if the vacuum is below the threshold (such as 10−2 Pa), the residual gas is ionized under the action of the arc and reacts with the contact surface to generate an oxide layer (e.g., CuO), significantly increasing the contact resistance.
SF6 gas decomposition: For the SF6 circuit breaker breaking current, the arc energy makes SF6 decomposition into SOF2, HF, and other by-products. Among them, HF reacts with the contact material to generate a sulfide film (CuS, resistivity of about 10−3 Ω-cm), resulting in a nonlinear increase in contact resistance.
Internal particulate contamination: metal particles (e.g., Cu, Ag) generated by the mechanical wear of the contacts migrate to the contact surface under the action of the electric field, forming a local conductive channel and triggering resistance fluctuations.

2.4.2. The Effect of Contact Pressure on Resistance

The closure pressure (Fc) directly affects the contact resistance (Rc) with the empirical formula:
R C 1 F C
When Fc is lower than the design threshold (e.g., ≥50 N for copper contacts), the micro-convex body on the contact surface is not sufficiently pressed together, resulting in a sharp increase in resistance; too high a pressure accelerates the plastic deformation of the material and shortens the life of the contacts.

3. Development of Non-Contact Online Monitoring Technology

To resolve the dual challenges of inadequate real-time accuracy in traditional circuit breaker resistance monitoring and the limited high-frequency noise suppression capability of existing non-contact technologies, this study introduces a non-contact multi-sensor fusion-based online monitoring system for circuit breaker circuit resistance.

3.1. System Design and Architecture

3.1.1. Design Objectives and Technical Implementation

To achieve real-time online monitoring of circuit breaker contact resistance, the system design focuses on the following core objectives and technical pathways:
  • High real-time monitoring.
(1) Objective: achieve a response time ≤ 200 ms.
(2) Implementation path:
A high-performance embedded processor and high-speed data acquisition module are integrated to enable the real-time processing of current/voltage signals through optimized algorithms.
An intermittent operation mode is employed to balance real-time performance and power consumption, ensuring system efficiency without compromising responsiveness.
2.
High-precision dynamic measurement.
(1) Objective: ensure full-scale measurement error < 1.5%.
(2) Key technologies:
Multi-sensor fusion: synergize current, voltage, and temperature signals to overcome limitations of single-sensor data.
Dynamic compensation mechanism: implement physics-based temperature correction and signal denoising techniques to suppress environmental interference.
3.
Anti-interference and engineering reliability.
(1) Objective: maintain SNR > 60 dB in complex grid environments.
(2) Innovative designs:
Hardware anti-interference architecture: combine differential sensing and shielding technologies to enhance signal purity.
Adaptive algorithms: dynamically compensate for environmental parameters (e.g., temperature, radiation) to ensure measurement stability.
4.
Engineering applicability.
(1) Objective: avoid modifying circuit breaker structures.
(2) Implementation plan:
Non-invasive sensing: utilize electromagnetic coupling or optical windows for signal acquisition.
Modular design: support flexible sensor deployment and system scalability.
5.
Reliability assurance.
(1) Objective: achieve MTBF > 5000 h.
(2) Critical measures:
Industrial-grade hardware selection and redundancy design.
Data validation and fault-tolerant mechanisms to minimize false alarms.

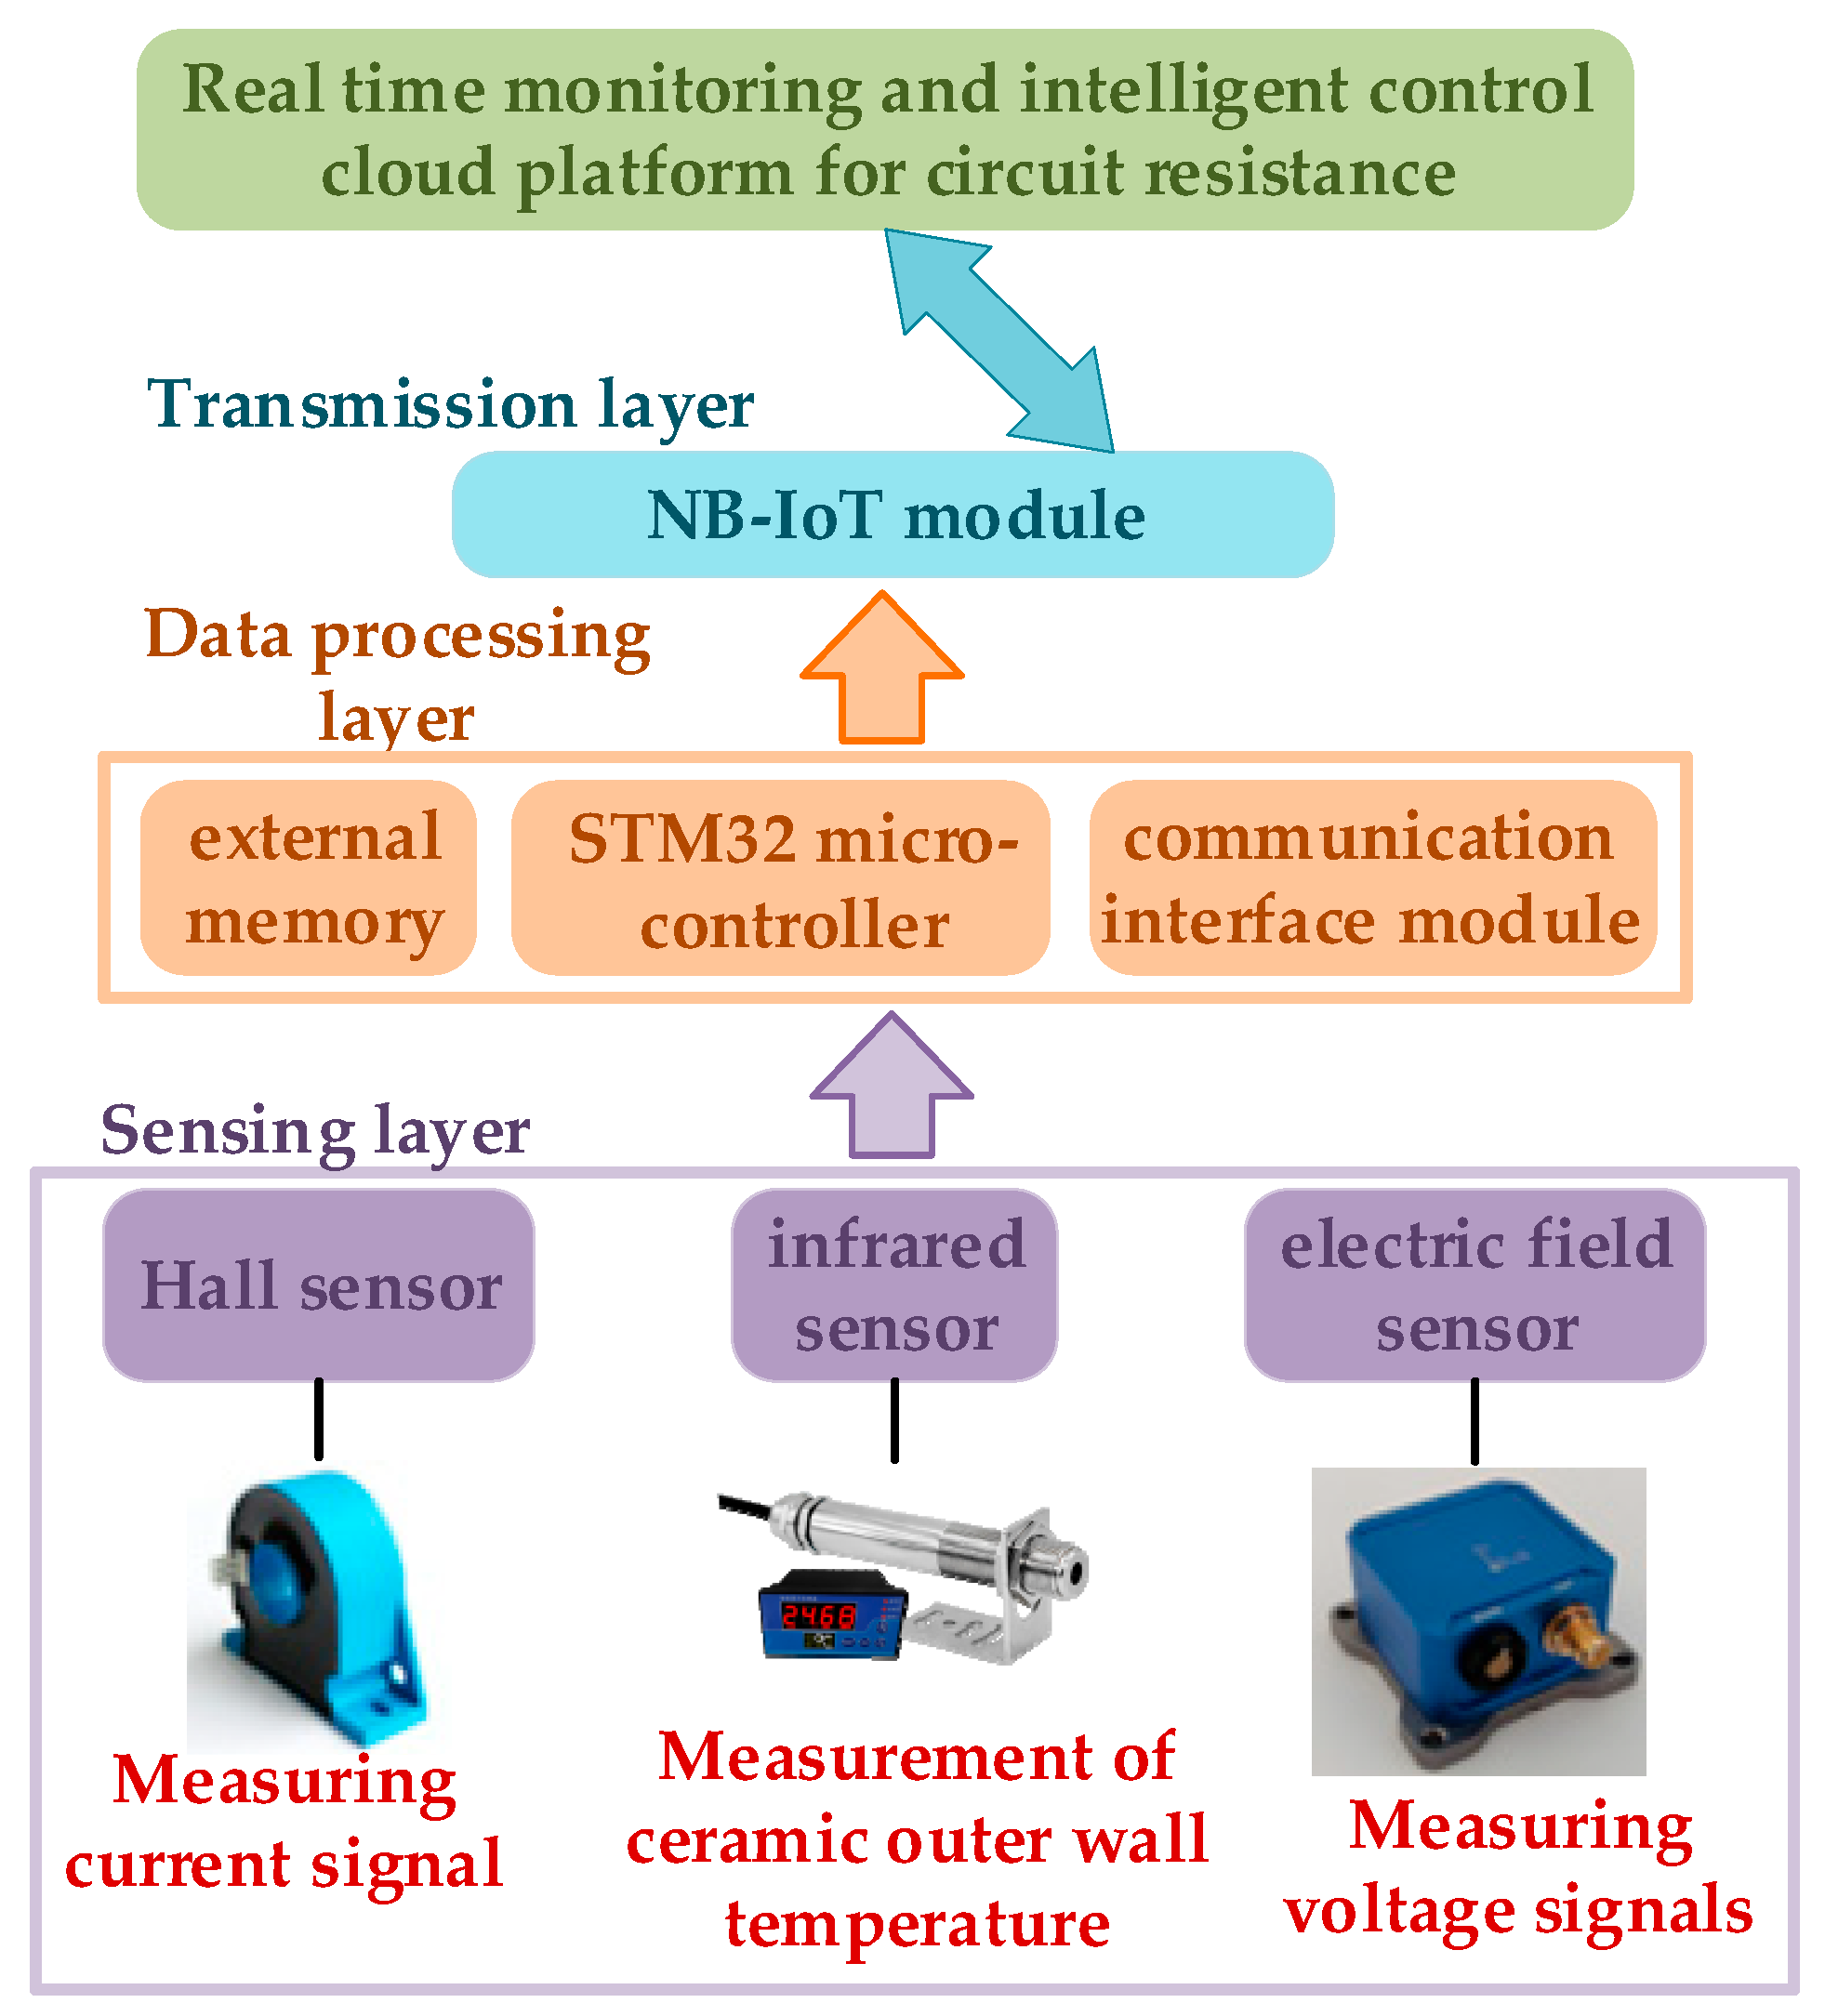
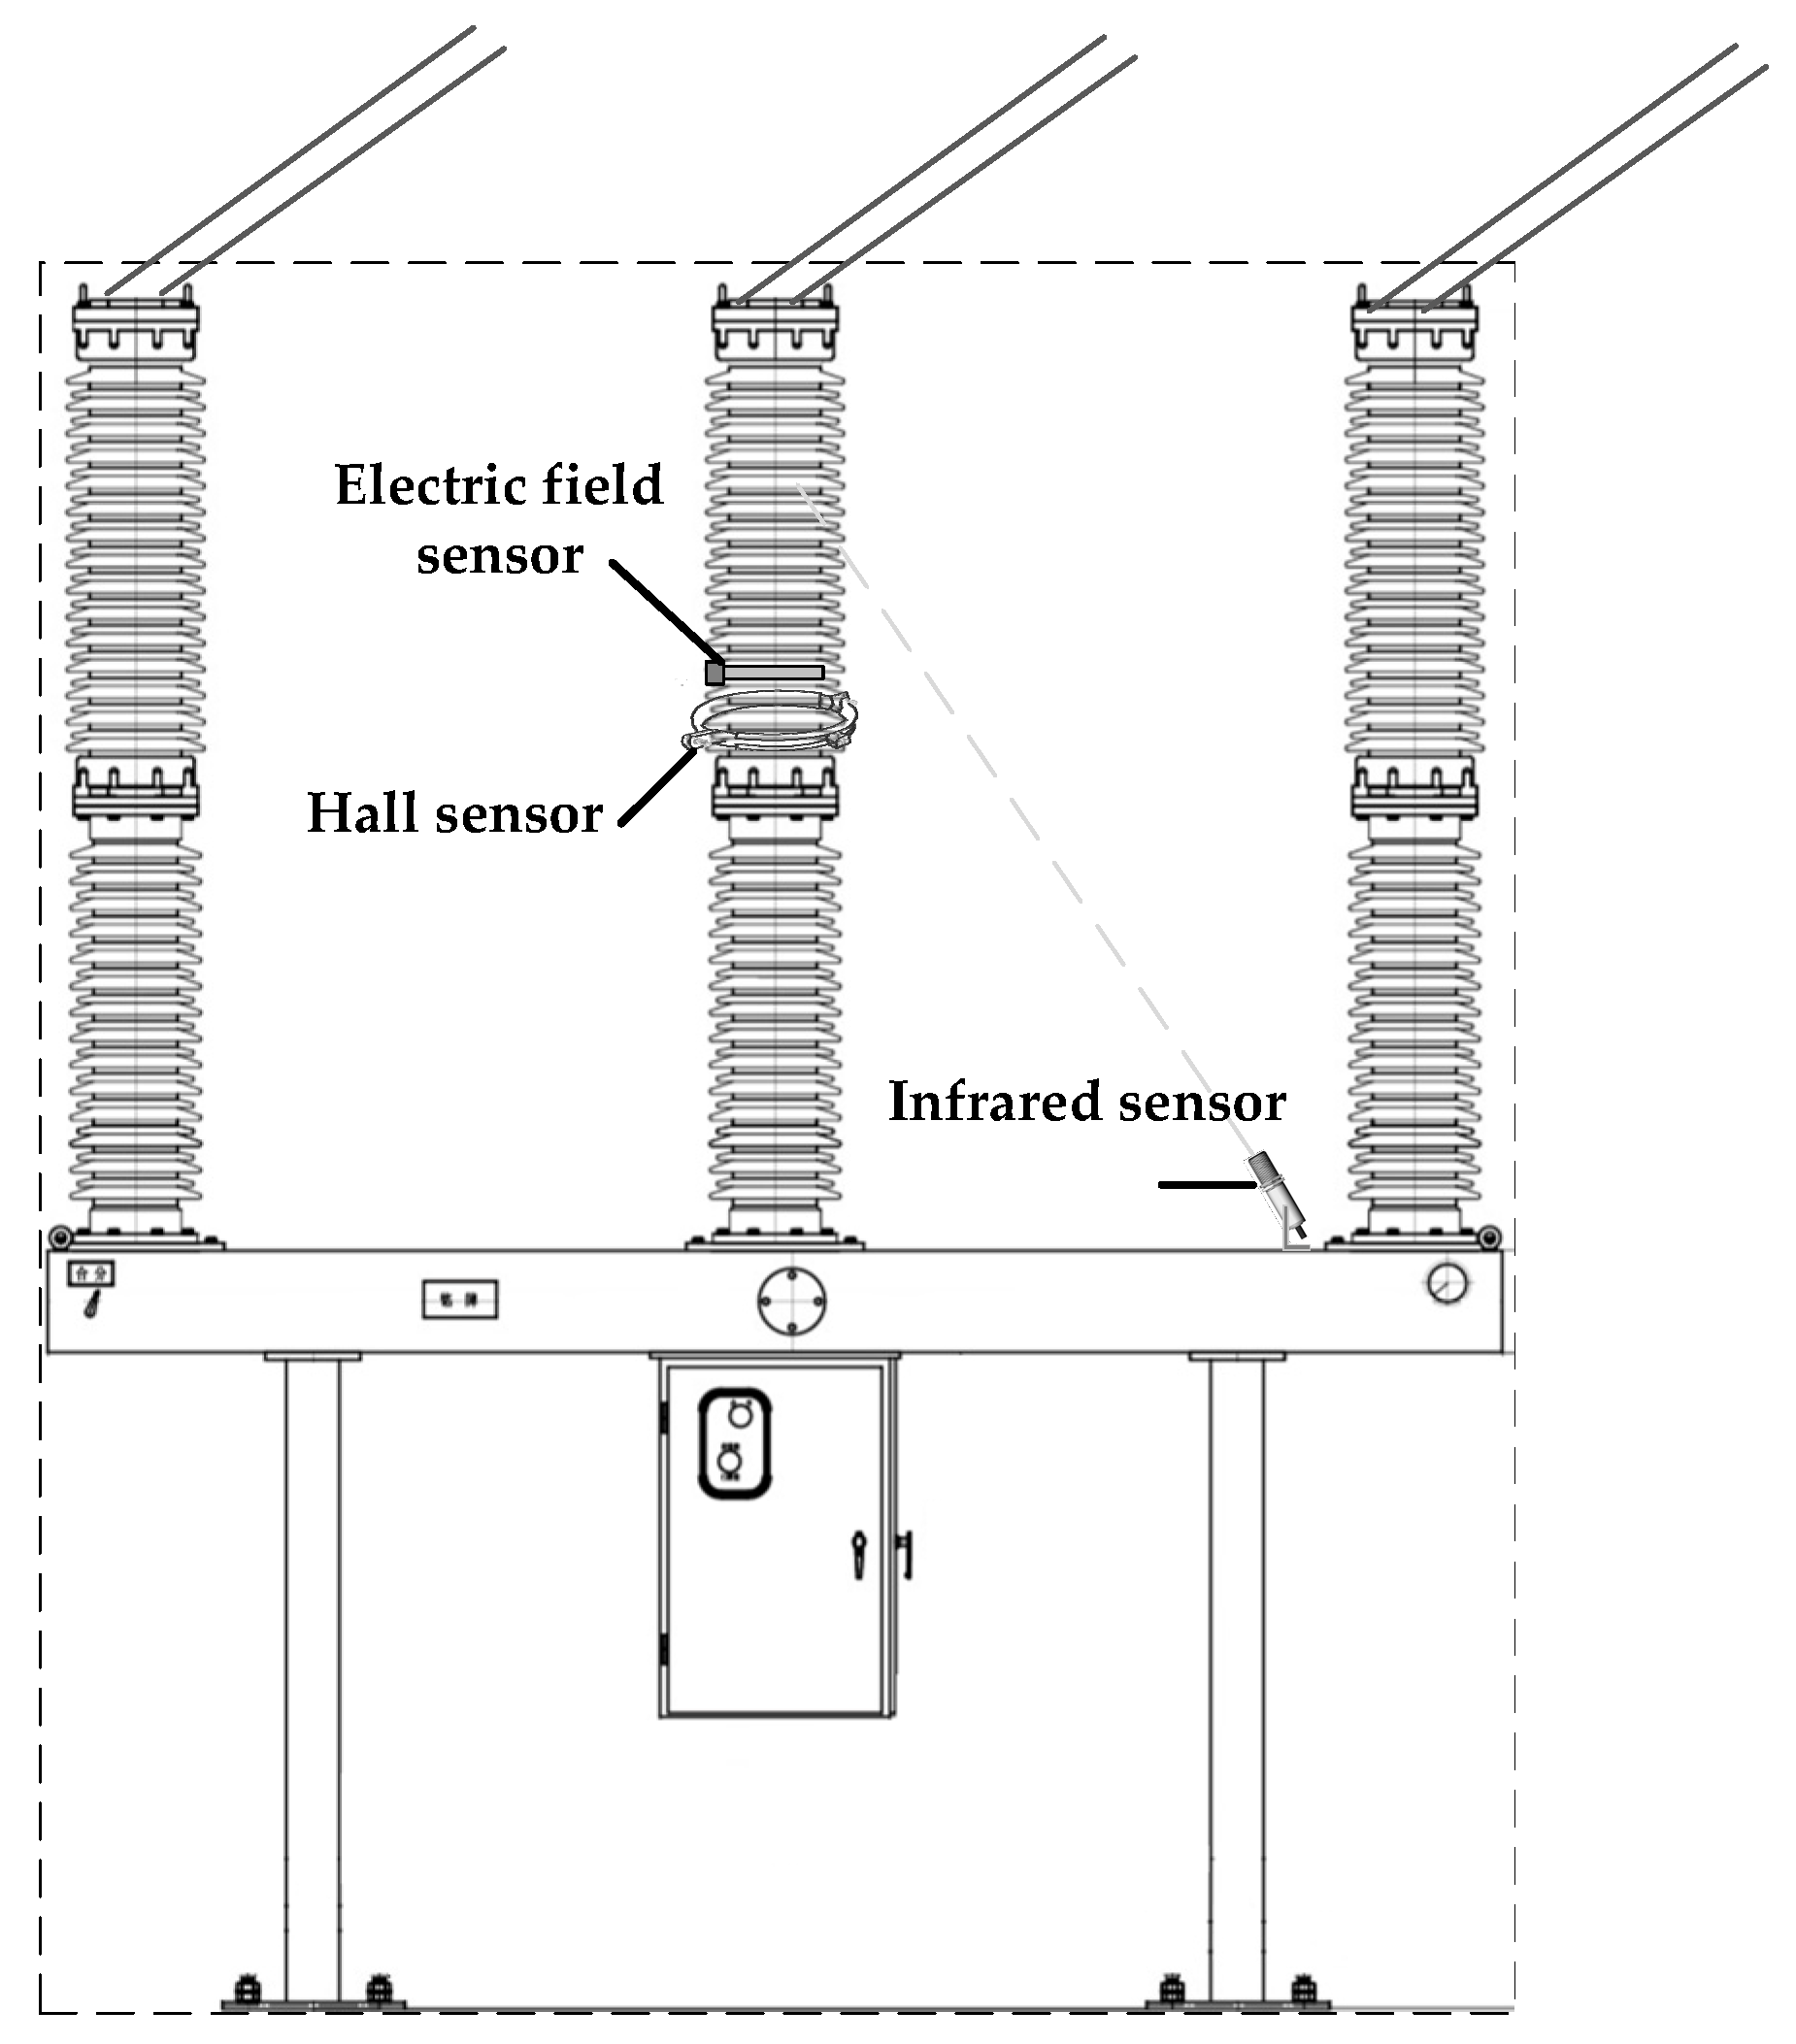
3.1.2. System Architecture and Multi-Sensor Fusion

The system consists of a sensing layer, a data processing layer, and a transmission layer, as shown in Figure 1.
The Hall sensor is installed at the circuit breaker’s outgoing terminal to measure current signals, with a Rogowski coil integrated to extend the measurement range up to 800 A. The infrared sensor monitors the contact temperature on the outer wall of the porcelain bushing, which is aligned with the center of the arc chute’s outer wall to minimize the thermal conduction path length. The electric field sensor, positioned parallel to the stationary contact side at a 10 cm distance from the insulating sleeve, avoids arc interference. The layout schematic is shown in Figure 2.
Transmission layer: the NB-IoT module encapsulates the data into a JSON format and uploads it to the cloud platform to support remote monitoring and warning.

3.1.3. Multi-Sensor Collaborative Working Mechanism

The system adopts a multi-sensor fusion strategy to synchronize the acquisition of current, voltage, and temperature signals through the collaborative work of a Hall current sensor, an infrared temperature sensor, and an electric field sensor.
The GPS timing module aligns the timestamps to ensure a consistent sampling rate (10 kS/s). The current sensor captures the dynamic load changes, the infrared sensor indirectly estimates the contact temperature, and the electric field sensor provides the voltage signals; and the three sets of data complement each other to enhance reliability.

3.2. Sensors and Data Acquisition

3.2.1. Selection and Performance Optimization of Hall Sensors

To meet the requirements of online monitoring for circuit breaker contact resistance, this system employs a closed-loop Hall current sensor (LEM LAH-50P) with the following key specifications:
(1) Measurement range.
Nominal range: ±50 A.
Extended range: ±800 A (via integration with a Rogowski coil, model RC-800A, transformation ratio 16:1), ensuring compatibility with high-current testing in power systems.
(2) Bandwidth: 100 kHz, enabling dynamic current fluctuation monitoring.
(3) Linearity error: <0.1%, guaranteeing high-precision measurements.
(4) Temperature drift coefficient: ±50 ppm/°C, with polynomial fitting calibration applied to suppress temperature-induced drift.
The output voltage VH of the Hall sensor is linearly related to the measured current I:
V H = K H I + V o f f s e t
The effect of the temperature drift is eliminated by a polynomial fit to the calibration KH and Voffset.

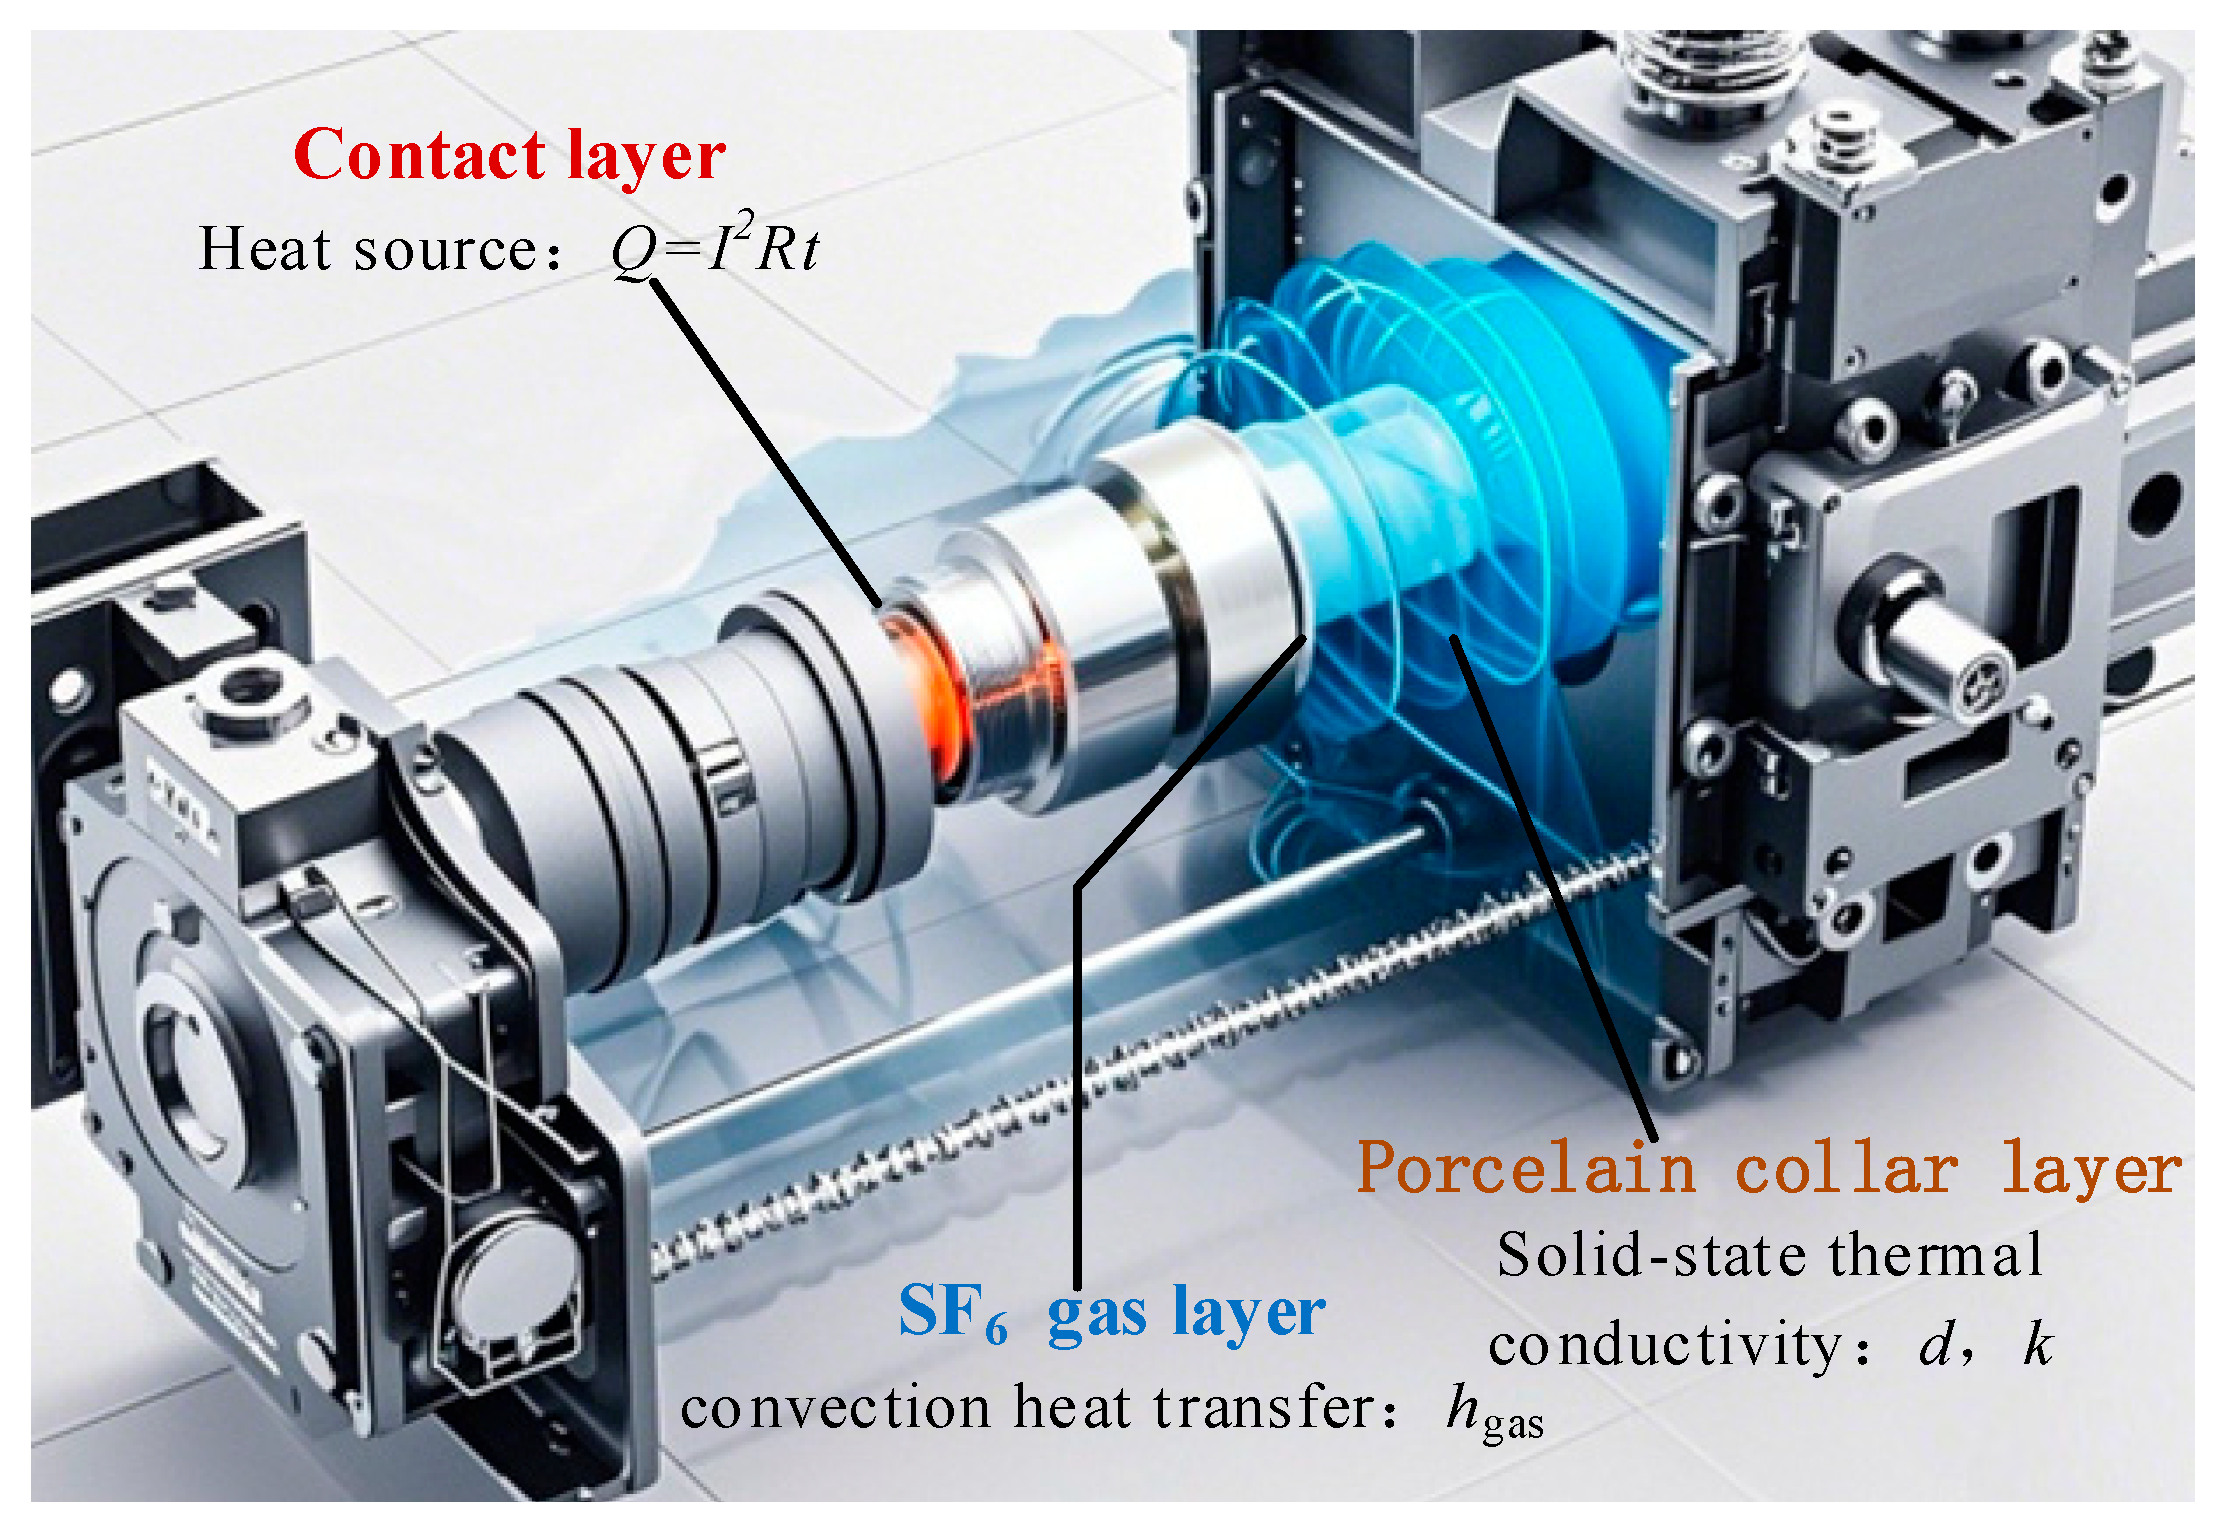
3.2.2. Indirect Measurement Technology for Contact Temperature

Since the circuit breaker contacts are completely sealed in the interrupter chamber, direct temperature measurement is difficult to realize. This paper proposes an indirect measurement method based on thermal network modeling. By accurately modeling the heat transfer path and suppressing the external environmental interference, a highly accurate estimation of the contact temperature is achieved. The specific process is as follows:
  • Thermal network model and temperature calculation.
The arc chute is divided into three thermal layers:
(1) Contact layer: heat source, Joule heat is satisfied:
Q = I 2 R raw t
where Rraw is the initial resistance value calculated based on Ohm’s law.
(2) SF6 gas layer: heat transfer by gas convection, convective heat transfer coefficient hgas=25 W/(m2K).
(3) Porcelain jacket layer: heat conduction through solid thermal conductivity k, thickness d.
Based on the synergistic mechanisms of Joule heating in the contact layer, convection heat transfer in the SF6 gas layer, and solid conduction in the porcelain bushing layer, a thermal resistance model of the arc chute is constructed, as shown in Figure 3 (authored illustration). This model elucidates the dynamic heat transfer characteristics through a hierarchical analysis of heat transfer paths.
The steady-state heat balance equation is:
T contact = T outer + I 2 R raw A ( 1 h gas + d k )
where Tcontact is the contact surface temperature (°C); Touter is the temperature of the outer wall of the ceramic sleeve of the interrupter room (°C); A is the effective heat dissipation area of the contact (m2); hgas is the convective heat transfer coefficient of SF6 gas; d is the thickness of the ceramic sleeve (m); k is the thermal conductivity of the ceramic sleeve (W/(mK)).
Therefore, using the outer wall temperature of the porcelain sleeve Touter and the initial resistance Rraw combined with the thermal resistance parameters of the interrupter room, the contact temperature Tcontact can be estimated.
2.
Ambient interference suppression technology.
In order to eliminate the influence of ambient temperature and sunlight radiation on the measurement of the temperature of the outer wall of the porcelain sleeve, the following measures are taken:
(1) Multi-sensor synergistic compensation [24].
The use of the ambient temperature sensor (PT100) for the real-time monitoring of the temperature around the porcelain sleeve Tenv, accuracy ± 0.1 °C; the use of radiation sensors to measure the intensity of solar radiation S, range 0~1000 W/m2.
The dynamic compensation formula:
T outer = T outer_raw ρ ( T env 25 ) λ S
where Touter_raw is the infrared sensor directly measured by the original temperature of the outer wall of the porcelain jacket; Tenv is the circuit breaker of the real-time temperature of the environment; S is the intensity of the solar radiation; ρ = 0.12 for the ambient temperature on the outer wall of the porcelain jacket temperature of the impact of the weight of the environmental temperature simulation experiments calibrated by −20 °C~50 °C, characterizing every 1 °C ambient temperature difference caused by the measurement deviation; λ = 0.005 is the solar radiation on the outer wall of the porcelain jacket temperature weight, through the sunshine intensity gradient experimental calibration, characterizing every 1 W/m2 radiation caused by the measurement deviation.
(2) Data filtering algorithm.
Sliding average filtering: 5-point smoothing is performed on the original IR data Touter_raw to suppress transient interference;
Wavelet denoising: a 3-layer decomposition of the temperature signal using db4 wavelet base to filter out periodic noise (e.g., fan vibration).
(3) Physical shielding design.
The infrared sensor is equipped with a light shield to reduce direct sunlight interference.
The surface of the porcelain jacket is coated with a high emissivity coating (ε = 0.95) to reduce the impact of environmental reflections.
3.
Data error correction method.
In the VS1-12 vacuum circuit breaker experiment, the contact temperature is measured directly by a pre-embedded K-type thermocouple to verify the reliability of the indirect measurement method, and the following three scenarios are tested, respectively:
(1) Normal load scenario: steady state operation at a rated current of 800 A and an ambient temperature of 25 °C;
(2) Overload inrush scenario: the current increases abruptly from 800 A to 1200 A within 5 min;
(3) Extreme environment test scenario: a sunlight intensity of 800 W/m2, an ambient temperature of 40 °C.
The experimental data are shown in Figure 4.
As can be seen in Figure 4a, the compensated indirectly measured temperature profile exhibits a high degree of consistency (RMSE = 1.2 °C) with the directly measured values. Through the dynamic temperature compensation algorithm (Equation (10)) to correct the temperature Touter of the outer wall of the ceramic sleeve, the baseline interference between the ambient temperature and the radiation is effectively eliminated. The experimental data show that the error rate after compensation is <1.5%, which verifies the measurement accuracy of the system under stable working conditions.
From Figure 4b, it can be seen that the contact temperature rapidly rises to 120 °C when the current surges. The indirect measurement curve before compensation is not filtered, and although it can respond quickly to the temperature change (response time ≈100 ms), the fluctuation at the peak is significant (±4.5 μΩ) due to the influence of electromagnetic noise and radiation interference. The compensated curve suppresses high-frequency noise by sliding average filtering and wavelet denoising, but introduces a hysteresis of about 200 ms, and the response time meets the demand for the real-time monitoring of power equipment.
As can be seen in Figure 4c, the indirect measurement curve before compensation shows significant diurnal cyclic fluctuations (RMSE = 9.5 °C) under harsh environmental conditions, and its trend is consistent with the simulated ambient temperature variation (Equations (2)–(4), inverse interference). The post-compensation curve reduces the RMSE to 3.5 °C by dynamically correcting the ambient temperature, reducing the error by 62%. Experiments demonstrate that the compensation strategy remains stable in high-temperature and high-humidity environments (90% relative humidity) with a data loss rate of <0.1% (NB-IoT module), which meets the reliability requirements for long-term online monitoring.

3.2.3. Anti-Interference Capability for Electric Field Sensors

A differential electric field sensor (PlasmaSI EFM-100) is used, which has a symmetrical electrode structure at its core to effectively suppress common mode interference. The relationship between the sensor output VE and the electric field strength E is:
V E = S E + V noise
where the sensitivity S = 1 mV/(V/m), and the noise component Vnoise is mainly from electromagnetic radiation and thermal noise.
  • Anti-interference hardware design.
Differential signal acquisition: a dual-electrode differential output structure is adopted, achieving a common-mode rejection ratio (CMRR) > 80 dB to effectively suppress environmental electric field interference.
Electromagnetic shielding: The sensor housing is fabricated from copper-plated aluminum alloy, and internal signal lines are wrapped with copper foil shielding layers. Measured radiation interference attenuation exceeds “>30 dB”.
Low-noise circuitry: a low-noise operational amplifier (OPA2188) is selected for the preamplifier stage, with an input equivalent noise density ≤ 10 nV/√Hz.
2.
Wavelet denoising algorithm.
To suppress high-frequency noise (e.g., electromagnetic pulses during switching operations), the following processing workflow is implemented:
(1) Wavelet basis selection.
Use Daubechies 4 (db4) wavelet with 5 decomposition layers, balancing frequency resolution and computational efficiency.
(2) Threshold processing.
Noise estimation: calculate the standard deviation σ of the detail coefficients at the 5th decomposition layer.
Soft thresholding function:
T = σ 2 ln N
where N represents the signal length, and coefficients with amplitude exceeding T are retained.
(3) Signal reconstruction: retain the detail coefficients from layers 1–3 and filter out high-frequency noise “>1 MHz”.
3.
Differential signal processing workflow.
(1) Common-mode suppression: dual-electrode signals VE1 and VE2 are processed by a differential amplifier (AD620, gain of 100) to generate Vdiff = 100(VE1 − VE2).
(2) Filtering: a second-order Butterworth low-pass filter with a cutoff frequency of 1 kHz attenuates power-line harmonics and RF interference while preserving critical signal components.
(3) ADC sampling: the STM32F407’s built-in 12-bit ADC samples signals at 10 kS/s, ensuring the high-fidelity acquisition of the fundamental 50 Hz waveform.
The Daubechies wavelet basis (db5) is used to decompose the original signal in 5 layers to filter out the high-frequency noise; the ambient electric field interference is offset by the two-electrode differential output, and the measured common-mode rejection ratio (CMRR) is >80 dB; the sensor housing is made of copper-plated aluminum alloy, the internal signal line is wrapped with copper foil shielding, and the radiated interference is attenuated by >30 dB, which improves the signal-to-noise ratio.

3.3. High-Precision Data Processing and Algorithm Implementation

3.3.1. Dynamic Temperature Compensation Algorithm Based on Thermodynamic Modeling

Based on the resistance temperature characteristics of the contact material, a segmented compensation model is established, as shown in Figure 5.
Low temperature segment (T < 100 °C): linear compensation
R ( T ) = R 0 [ 1 + α ( T T 0 ) ]
High-temperature section (T ≥ 100 °C): introduction of a correction for the oxide layer
R ( T ) = R 0 [ 1 + α ( T T 0 ) + β e γ / T ]
where γ = 1200 K. The experimental data are fitted by nonlinear least squares.

3.3.2. Dynamic Resistance Extraction Algorithm

An improved sliding window fast Fourier transform (FFT) is used to analyze the fundamental components of the current and voltage signals to suppress harmonic interference:
    R d y n a m i c = Re ( U b a s e _ w a v e ) Re ( I b a s e _ w a v e )
The window width is set to the industrial frequency cycle (20 ms) and the overlap rate is 50% to ensure real-time.

3.3.3. Anomaly Detection and Early Warning Mechanism

Dual judgment based on threshold and trend analysis.
Threshold trigger: if R(t) > 1.5Rstart, trigger the first level alarm.
Trend alert: adopt exponentially weighted moving average (EWMA) model to predict the future trend of resistance change:
R ^ ( t + 1 ) = λ R ( t ) + ( 1 λ ) R ^ ( t )
where R ^ ( t + 1 ) is the next moment resistance prediction; R ^ ( t ) is the current moment resistance prediction; R(t) is the current moment resistance measured value; smoothing coefficient λ = 0.2, if the prediction slope k > 0.1 Ω/min, trigger the second level of warning.
If slope k > 0.1 Ω/min, early warning.

3.4. System Communication and Integration

3.4.1. NB-IoT Communication Module

The BC95 module (Quectel LTE Cat M1/NB1) is selected for its Band 8 (900 MHz) support. The low-frequency band enhances penetration capability and resistance to multipath fading in complex environments. Transmission intervals are configurable from 1 to 60 min. The data packet format is as follows:
{
"DeviceID": "CB-01",
"Timestamp": "2023-10-05T14:30:00Z",
"R": 25.3, // Unit: μΩ
"T": 85.2, // Unit: °C
"Status": 0 //0-Normal, 1-Warning, 2-Alarm
}

3.4.2. Low Power Design and Electromagnetic Compatibility Optimization

  • The microcontroller uses an intermittent operating mode.
Activation period (200 ms): collects data and calculates resistance.
Dormancy period (5 s): non-essential peripherals are switched off, with an overall power consumption of <10 mW.
2.
Electromagnetic compatibility (EMC) optimization.
PCB layout adopts star grounding to reduce the loop area.
Sensor signal lines are wrapped with copper foil shielding to suppress radiation interference.
Power supply module adds a π-type filter to attenuate high-frequency noise.

4. Experimental Verification and Result Analysis

In order to verify the feasibility and accuracy of the non-contact online monitoring system, this knot builds an experimental platform, designs a multi-scenario test scheme, and evaluates the performance advantages of the system through a comparative analysis with traditional offline measurement methods. The experimental data show that the proposed scheme meets the expected goals in terms of real-time anti-interference ability and measurement accuracy.

4.1. Experimental Platform and Testing Scheme

  • Hardware configuration and testing environment.
Breaker model: VS1-12 vacuum circuit breaker (rated current 1250 A, contact material CuCr50).
Current sensor setup: the Hall sensor (LEM LAH-50P, LEM Group, Switzerland) is paired with a Rogowski coil (model RC-800A, NARI Relays, China, turn ratio 16:1) to convert 800 A test currents into a 50 A input range, ensuring compatibility with the sensor’s measurement scale.
Environmental control: a HWS-150 (Hikvision, China) constant temperature and humidity chamber (accuracy: ±0.5 °C, ±3% RH) is employed to simulate high-temperature and high-humidity conditions (50 °C, 90% RH) for 24 h continuous operation.
Sensor mounting: The infrared sensor (MLX90614, Melexis Technologies, Belgium) is fixed to the outer wall of the arc chute porcelain bushing using a magnetic mounting bracket, ensuring perpendicular alignment of the thermal sensing optical path. The electric field sensor (EFM-100, HBM, Germany) is secured with insulated clamps to minimize mechanical vibration interference.
2.
Sensor modules and system components.
Hall current sensor: LEM LAH-50P (range ± 50 A, accuracy ± 0.2%).
Infrared temperature sensor: MLX90614 (temperature range −40 °C ~ 300 °C, resolution 0.02 °C).
Electric field sensor: PlasmaSI EFM-100 (bandwidth 10 Hz~1 MHz, sensitivity 1 mV/(V/m)).
Data acquisition system: STM32F407 microcontroller, STMicroelectronics, Switzerland, (sampling rate 10 kS/s), NB-IoT module (BC95).
3.
Data acquisition and test scenario design.
Scene 1: normal load (current 800 A, ambient temperature 25 °C).
Scene 2: overload impact (current 1200 A, lasting 5 min, simulating short-circuit fault).
Scene 3: high-temperature and high-humidity environment (temperature 50 °C, relative humidity 90%, for 24 h).

4.2. Comparison of Online Monitoring Data and Performance Analysis

  • Real-time testing.
The system outputs the resistance value at a frequency of 1 Hz, and the test waveforms of the three scenarios are shown in Figure 6, Figure 7 and Figure 8, comparing with the traditional offline measurement (tested every 3 years).
As shown in Table 1, offline measurement error and low resistance due to contact cooling (up to 12.3% in Scenario 2).
The online monitoring advantage captures dynamic changes in resistance due to the rising contact temperature (peak resistance 35.6 μΩ).
2.
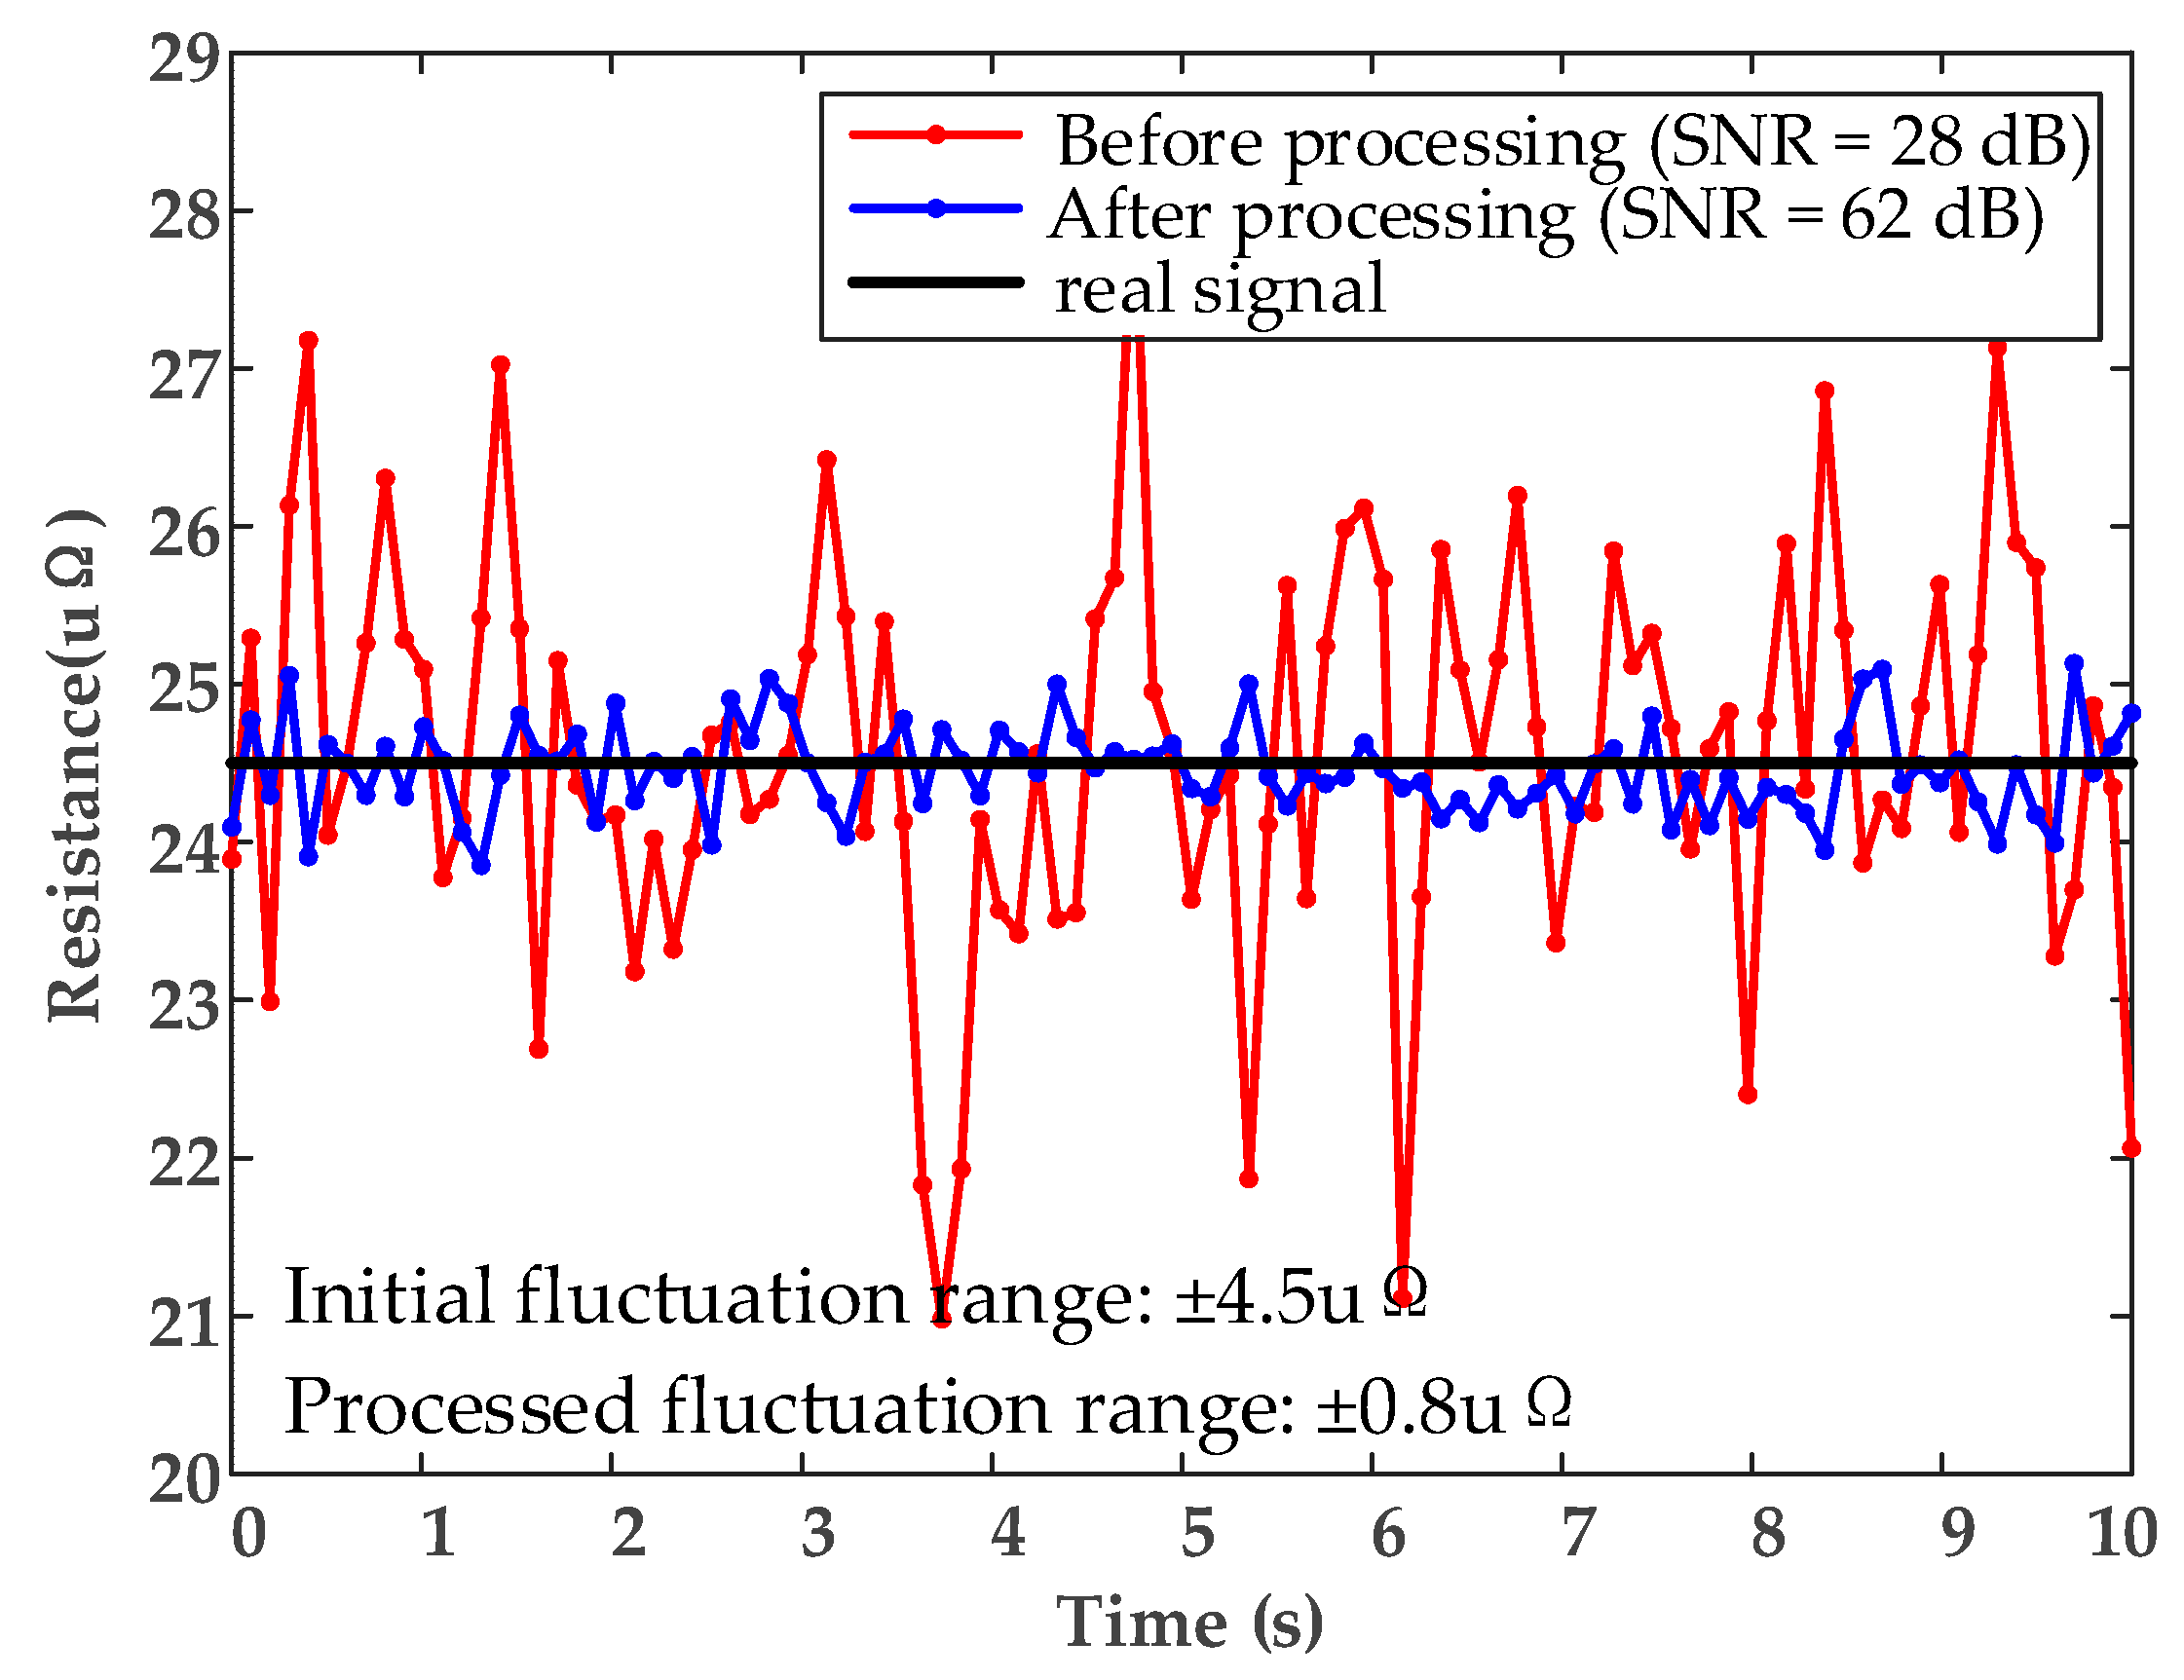
Interference resistance performance analysis.
In Scene 3, the system effectively suppresses environmental interference through wavelet denoising and differential signal processing, and the waveforms before and after processing are shown in Figure 9.
Signal-to-noise ratio improvement: the original SNR is 28 dB, and the SNR is improved to 62 dB after processing.
Data stability: resistance fluctuation range is reduced from ±4.5 μΩ to ±0.8 μΩ.

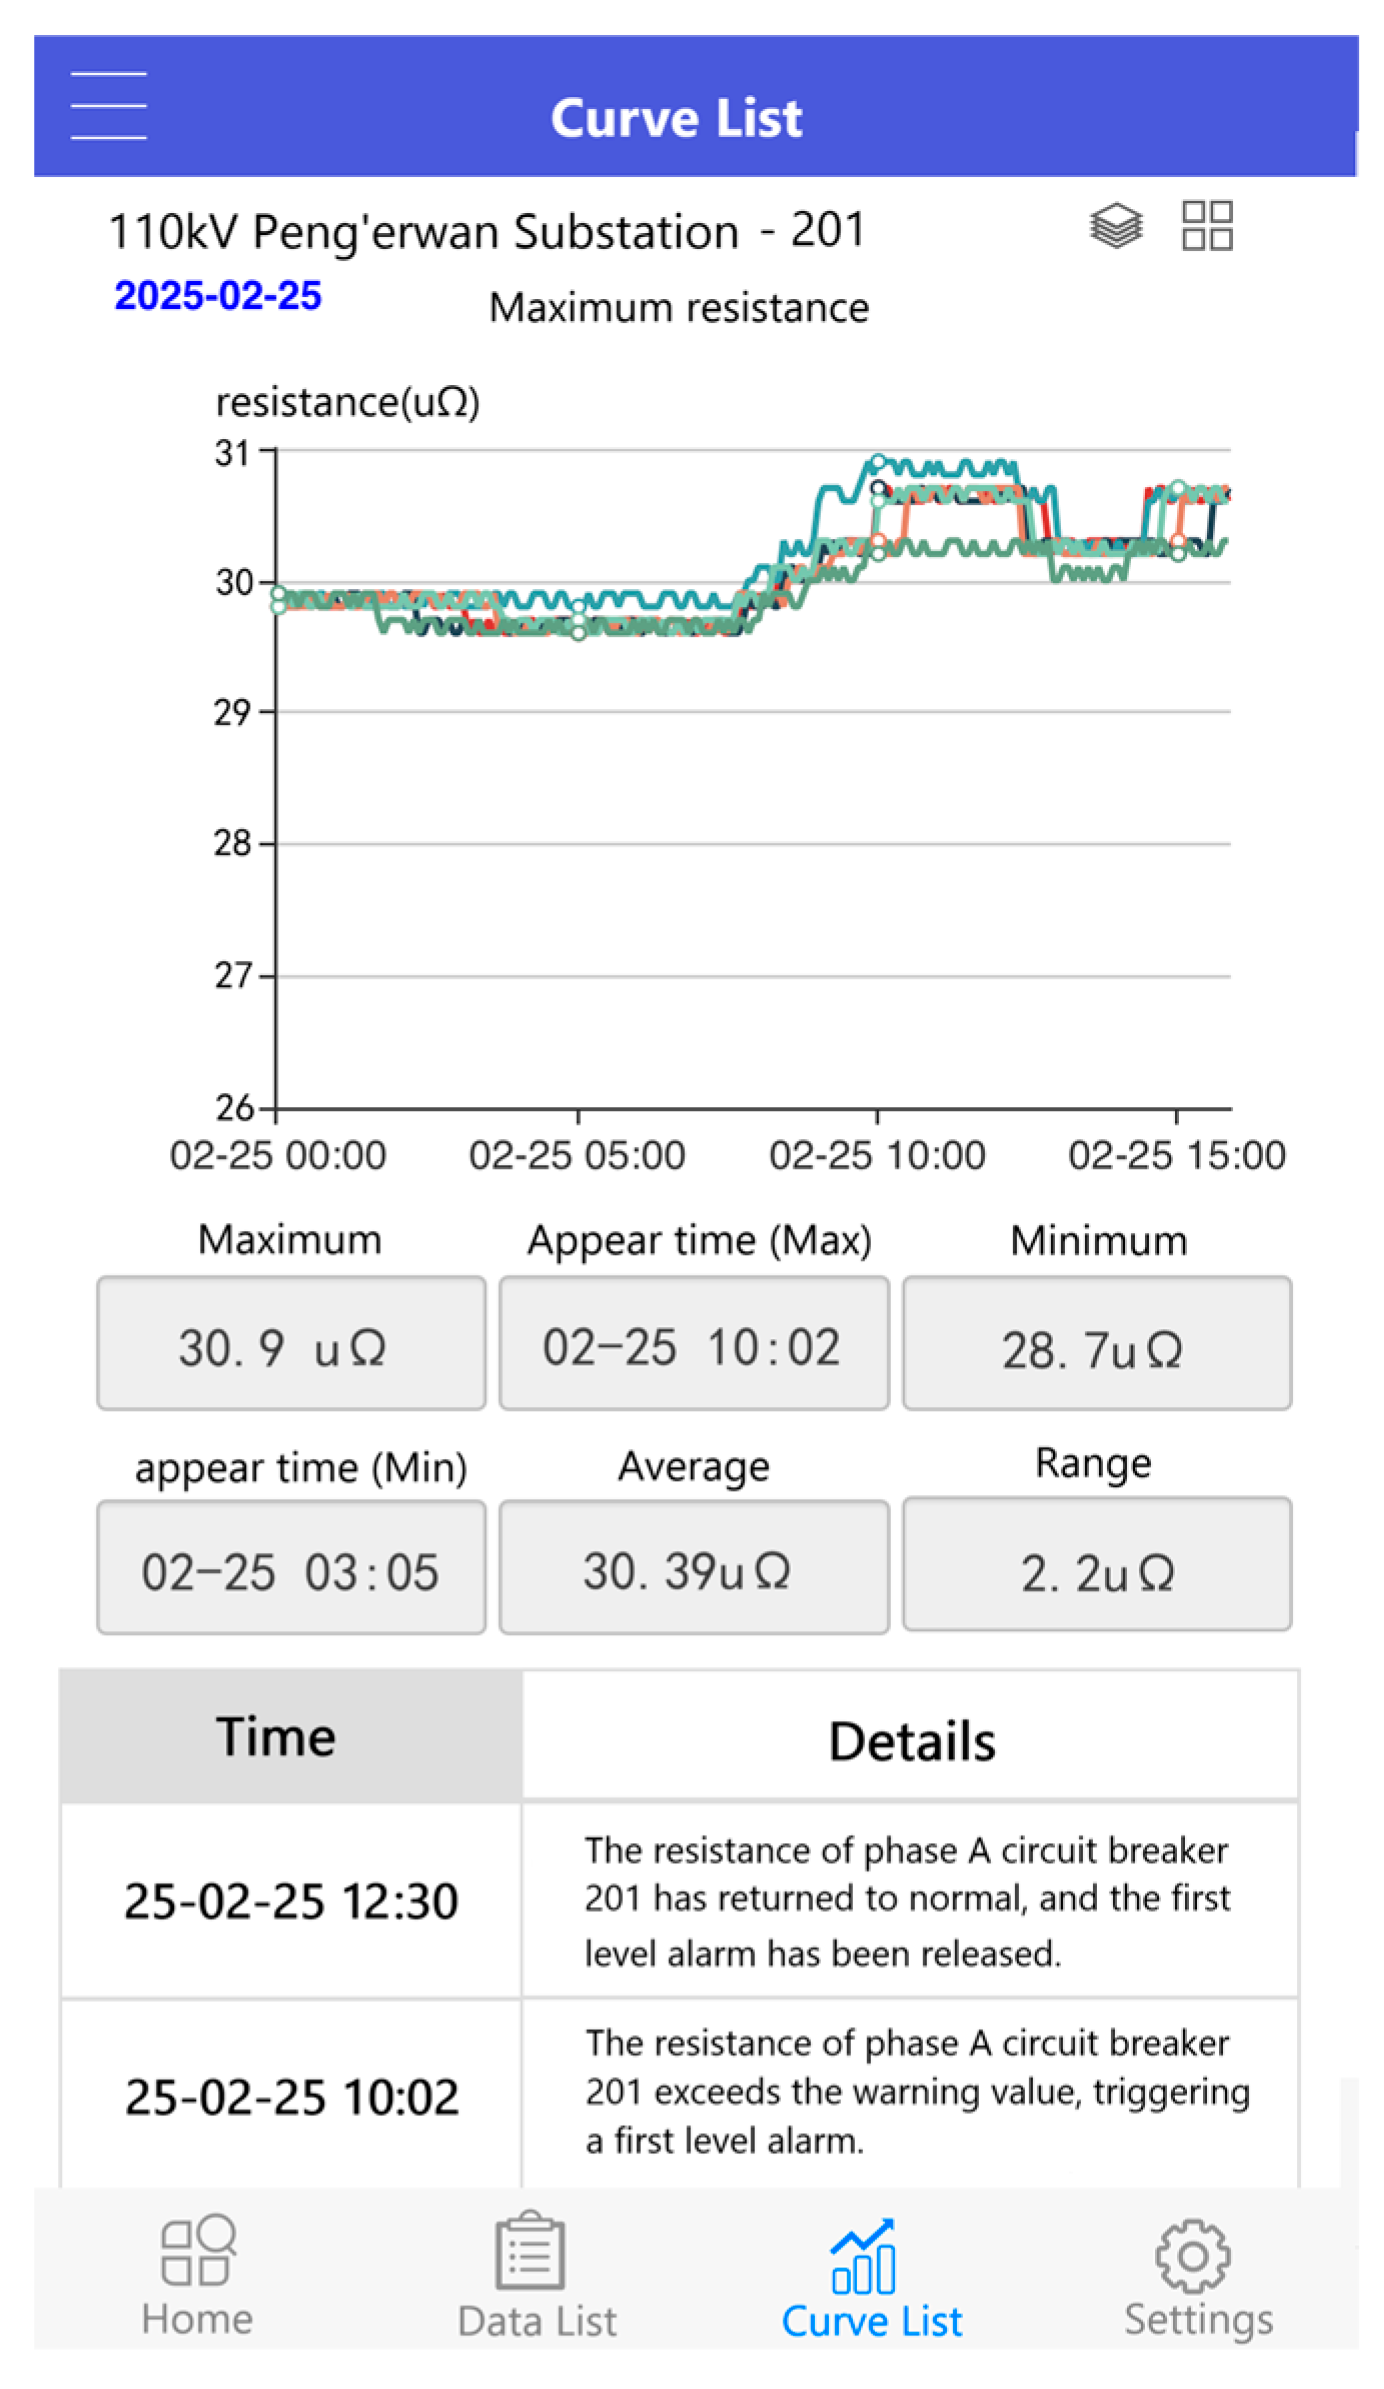
4.3. Application Cases and System Reliability

  • Practical application case: a 110 kV substation.
Deployment plan: the monitoring system is installed on 10 circuit breakers and operates continuously for 6 months.
Fault warning: the system successfully detects rising resistance caused by oxidation of two circuit breaker contacts, as shown in Figure 10, and issues a warning 2 weeks in advance to avoid unplanned power outage.
2.
System reliability validation and performance evaluation.
Mean time between failure (MTBF): >5000 h.
False alarm rate: <0.5%.
Data loss rate: <0.1% in NB-IoT transmission.

4.4. Key Experimental Results

  • Experimental results overview.
Through multi-scenario experimental validation, the proposed non-contact multi-sensor fusion online monitoring system demonstrates significant advantages over traditional offline measurement methods in terms of dynamic response, anti-interference capability, and measurement accuracy. Core experimental data comparisons are presented in Table 2.
2.
Results Analysis and Summary
(1) Dynamic performance advantage.
The system demonstrates a 3-order-of-magnitude improvement in response speed compared with traditional methods (≤200 ms vs. 3-year/interval), enabling real-time tracking of resistance variations under overload surges (e.g., 3.5% error in Scenario 2). This satisfies the dynamic monitoring demands of power systems [25].
(2) Innovative temperature compensation.
By integrating a thermal network model and multi-source data fusion, the system reduces resistance errors from 8.7% to 1.5% under extreme conditions (50 °C, 90% RH, Scenario 3). The temperature RMSE is decreased by 63% (Figure 4c), validated through thermal drift correction algorithms.
(3) Anti-interference design.
Differential electric field sensors (CMRR > 80 dB) and sliding-window FFT algorithms (Figure 9) suppress electromagnetic noise, boosting SNR from 28 dB to 62 dB. Infrared sensors achieve 83% radiation interference rejection (Scenario 3), ensuring stable operation in high-EMI environments.
(4) Field validation.
VS1-12 vacuum circuit breaker testing: the system operates continuously for 6 months, successfully detecting two contact oxidation faults (Figure 10) with <0.1% data loss (NB-IoT) and 45% O&M cost reduction.

5. Discussion

5.1. Summary of Key Experimental Results

  • Analysis of technical limitations.
Insufficient suppression of high-frequency interference: the existing algorithms have a limited effect on filtering electromagnetic noise >1 MHz, which may affect the measurement accuracy under extreme working conditions.
Sensor life: infrared sensor performance degradation in long-term high temperature environment (experiments show that after 5000 h of sensitivity, it decreased by 5%).
2.
Engineering application adaptability issues.
Extreme environment adaptability: NB-IoT module communication stability decreases (packet loss rate increases to 3%) at a low temperature of −40 °C.
Installation compatibility: the existing sensors are large in size, making it difficult to adapt to compact breaker cabinets.

5.2. Future Research Directions

Miniaturized sensor design: developing MEMS integrated sensors to reduce size and power consumption.
AI-driven predictive maintenance: combining LSTM networks to predict contact life and optimize warning thresholds.
Multi-physical field coupling modeling: establishing electrical–thermal–mechanical coupling model to improve resistance prediction accuracy.

6. Conclusions

In this paper, a non-contact circuit breaker circuit resistance online monitoring system is proposed, which realizes the real-time monitoring of circuit breaker contact status through a multi-sensor fusion and high-precision algorithm design. Experiments show that the system significantly outperforms traditional offline measurement methods in terms of dynamic response speed (≤200 ms), measurement accuracy (error < 1.5%), and anti-interference capability (SNR > 60 dB). Engineering cases have verified its practical value in fault warning and O&M cost optimization. In the future, we will focus on the miniaturization of sensors and optimization of intelligent algorithms to promote the large-scale application of this technology in smart grids.

Author Contributions

Conceptualization, Z.W.; Methodology, H.Z. (Hua Zhang) and Y.L.; Software, H.Z. (Haoyong Zhang), J.C., S.F. and J.G.; Validation, J.G.; Formal analysis, H.Z. (Haoyong Zhang); Investigation, Y.L.; Writing—original draft, Z.W., H.Z. (Hua Zhang) and Y.Z.; Writing—review & editing, Y.Z. and J.C. All authors have read and agreed to the published version of the manuscript.

Funding

This research received no external funding.

Data Availability Statement

The original contributions presented in the study are included in the article, further inquiries can be directed to the corresponding author.

Conflicts of Interest

Zheng Wang, Hua Zhang, Yiyang Zhang, Haoyong Zhang, Jing Chen, Shuting Feng and Jie Guo were employed by the Langfang Power Supply Company, State Grid Jibei Electric Power Company Limited. The remaining author declares that the research was conducted in the absence of any commercial or financial relationships that could be construed as a potential conflict of interest.

References

  1. Fan, X.M.; Xu, H.H.; Li, T.; Zhang, X. Fault Diagnosis of High-voltage Circuit Breakers Based on SMA-VMD and Energy Entropy. High Volt. Eng. 2024, 50, 5248–5258. [Google Scholar]
  2. Li, F.; Wang, C.L.; Zhang, W.W. Research on Online Monitoring Methods for Operational Hazards of High-voltage Equipment in Distribution Network. Power Electron. 2025, 59, 65–69. [Google Scholar]
  3. Zhang, B.G.; Wang, C.T.; Huang, W.M. Fault Diagnosis Method of Circuit Breaker Based on Multi-source Sensor Data Fusion. High Volt. Eng. 2025, 51, 660–668. [Google Scholar]
  4. Lan, L.; Chen, G.; Wen, X.H.; Wu, Y. Erosion Characteristics of SF6 Circuit Breaker Contacts Based on Dynamic Contact Resistance Measurement. High Volt. Eng. 2016, 42, 1731–1738. [Google Scholar]
  5. Wang, Z.X.; Diao, M.X.; Xiao, G.Y.; Yan, J.; Chen, D.P.; Chen, B.F. SF6 Circuit Breaker Contact State Assessment Based on QPSO-SVR Algorithm. High Volt. Eng. 2023, 49, 3907–3917. [Google Scholar]
  6. Peng, Z.X. Study on the Technical Strategy of On-line Monitoring for High Voltage Switchgear. High Volt. Appar. 2015, 51, 132–137. [Google Scholar]
  7. Li, P. Analysis of circuit resistance measurement method of 1000kV UHV circuit breaker. China Plant Eng. 2024, 22, 165–167. [Google Scholar]
  8. Li, X.W.; Lu, Q.F.; Lu, H.; Wang, Y.; Wang, L.H. Online Monitoring Technique and Application of UHF during Partial Discharge of GIS. Guangdong Electr. Power 2012, 25, 91–95. [Google Scholar]
  9. Chen, L.; Duan, Y. Application of Online Monitoring Technology in Smart Grid Transmission Lines. Electron. Technol. 2023, 52, 332–333. [Google Scholar]
  10. Zhu, Y.C.; Zhang, P.; Tian, Y.; Huang, X.B. Synchronous Acquisition in Online Monitoring Technology for Substation Equipment Comparative analysis of triggering methods. Electr. Power 2022, 55, 64–73. [Google Scholar]
  11. Jiang, Y.H.; Zhu, H.; Jiang, X.W. Design and Software Development of Transformer Online Monitoring System Based on Multi-Source Information Fusion. Comput. Appl. Softw. 2025, 42, 48–53+80. [Google Scholar]
  12. Wang, Z.M.; Li, P.; Wei, J.; Liu, S.R.; Zhang, W.X.; Zhong, M.S.; Li, Z.B. Research on Transmission Line Monitoring Based on Edge Computing and Multi-Sensor Fusion. Comput. Meas. Control 2023, 31, 113–118. [Google Scholar]
  13. Lindsrad, P.A.; Huber, C.N.; Garavan, M.F. Non-Contact Voltage Measurement System. CN Patent 108072782 B, 4 January 2022. [Google Scholar]
  14. Zhao, X.; Wu, G.; Yang, D.; Xu, G.; Xing, Y.; Yao, C.; Abu-Siada, A. Enhanced detection of power transformer winding faults through 3D FRA signatures and image processing techniques. Electr. Power Syst. Res. 2025, 242, 111433. [Google Scholar] [CrossRef]
  15. Zhao, K.; Li, Y.J.; Liang, Z. A new online monitoring application for high voltage switch based on non-contact current sensor. E3S Web Conf. 2021, 233, 01054. [Google Scholar] [CrossRef]
  16. Sousa, S.D.F.H.; Oliveira, D.C.A.; Xavier, R.V.G. Analysis of alternative parameters of dynamic resistance measurement in high voltage circuit breakers. High Volt. 2019, 4, 197–202. [Google Scholar] [CrossRef]
  17. Chen, K.L.; Guo, Y.; Ma, X.Y. Contactless voltage sensor for overhead transmission lines. IET Gener. Transm. Distrib. 2018, 12, 957–966. [Google Scholar] [CrossRef]
  18. Cui, J.X.; Wu, H.X.; Nan, B.F. Research and Application of Non-contact On-line Monitoring Technology of Cable Based on FVMD & WVD Method. High Volt. Appar. 2024, 60, 205–214+220. [Google Scholar]
  19. Wu, Y.M.; Xu, S.D.; Jiang, M. Non-contact current measurement method for removing eccentricity error with magnetic array sensors. Transducer Microsyst. Technol. 2024, 43, 133–136. [Google Scholar]
  20. Feng, D.; Liu, H.; Li, J.X. Non-contact Voltage Measurement Method of Transmission Line Based onElectric Field Sensor Array. High Volt. Eng. 2024, 50, 292–301. [Google Scholar]
  21. Zhang, Z.L. Research and Development of Non-Contact Voltage Measuring Device Based on Electrie Field Coupling; South China University of Technology: Guangzhou, China, 2023. [Google Scholar]
  22. Wu, R.-D.; Jiao, Z.-B.; Liu, T.; Dong, X.-M.; Lei, X. A new method to improve fault location accuracy in transmission line based on fuzzy inference data fusion technology. In Proceedings of the 2016 IEEE PES Asia-Pacific Power and Energy Engineering Conference (APPEEC), Xi’an, China, 25–28 October 2016; pp. 1486–1490. [Google Scholar]
  23. Ma, G.; Mao, N.; Li, Y.; Jiang, J.; Zhou, H.; Li, C. The Reusable Load Cell with Protection Applied for Online Monitoring of Overhead Transmission Lines Based on Fiber Bragg Grating. Sensors 2016, 16, 922. [Google Scholar] [CrossRef]
  24. Cui, Y.H.; Xu, Y.P.; Wang, L.J. Nonlinear Dynamic Compensation for Probability Analysis in Fault Diagnosis of Electric Equipment. Appl. Mech. Mater. 2014, 2963, 913–916. [Google Scholar] [CrossRef]
  25. GB/T 24838-2018; 1100 kV High-Voltage Alternating-Current Circuit-Breakers. Standardization Administration of China: Beijing, China, 2018.
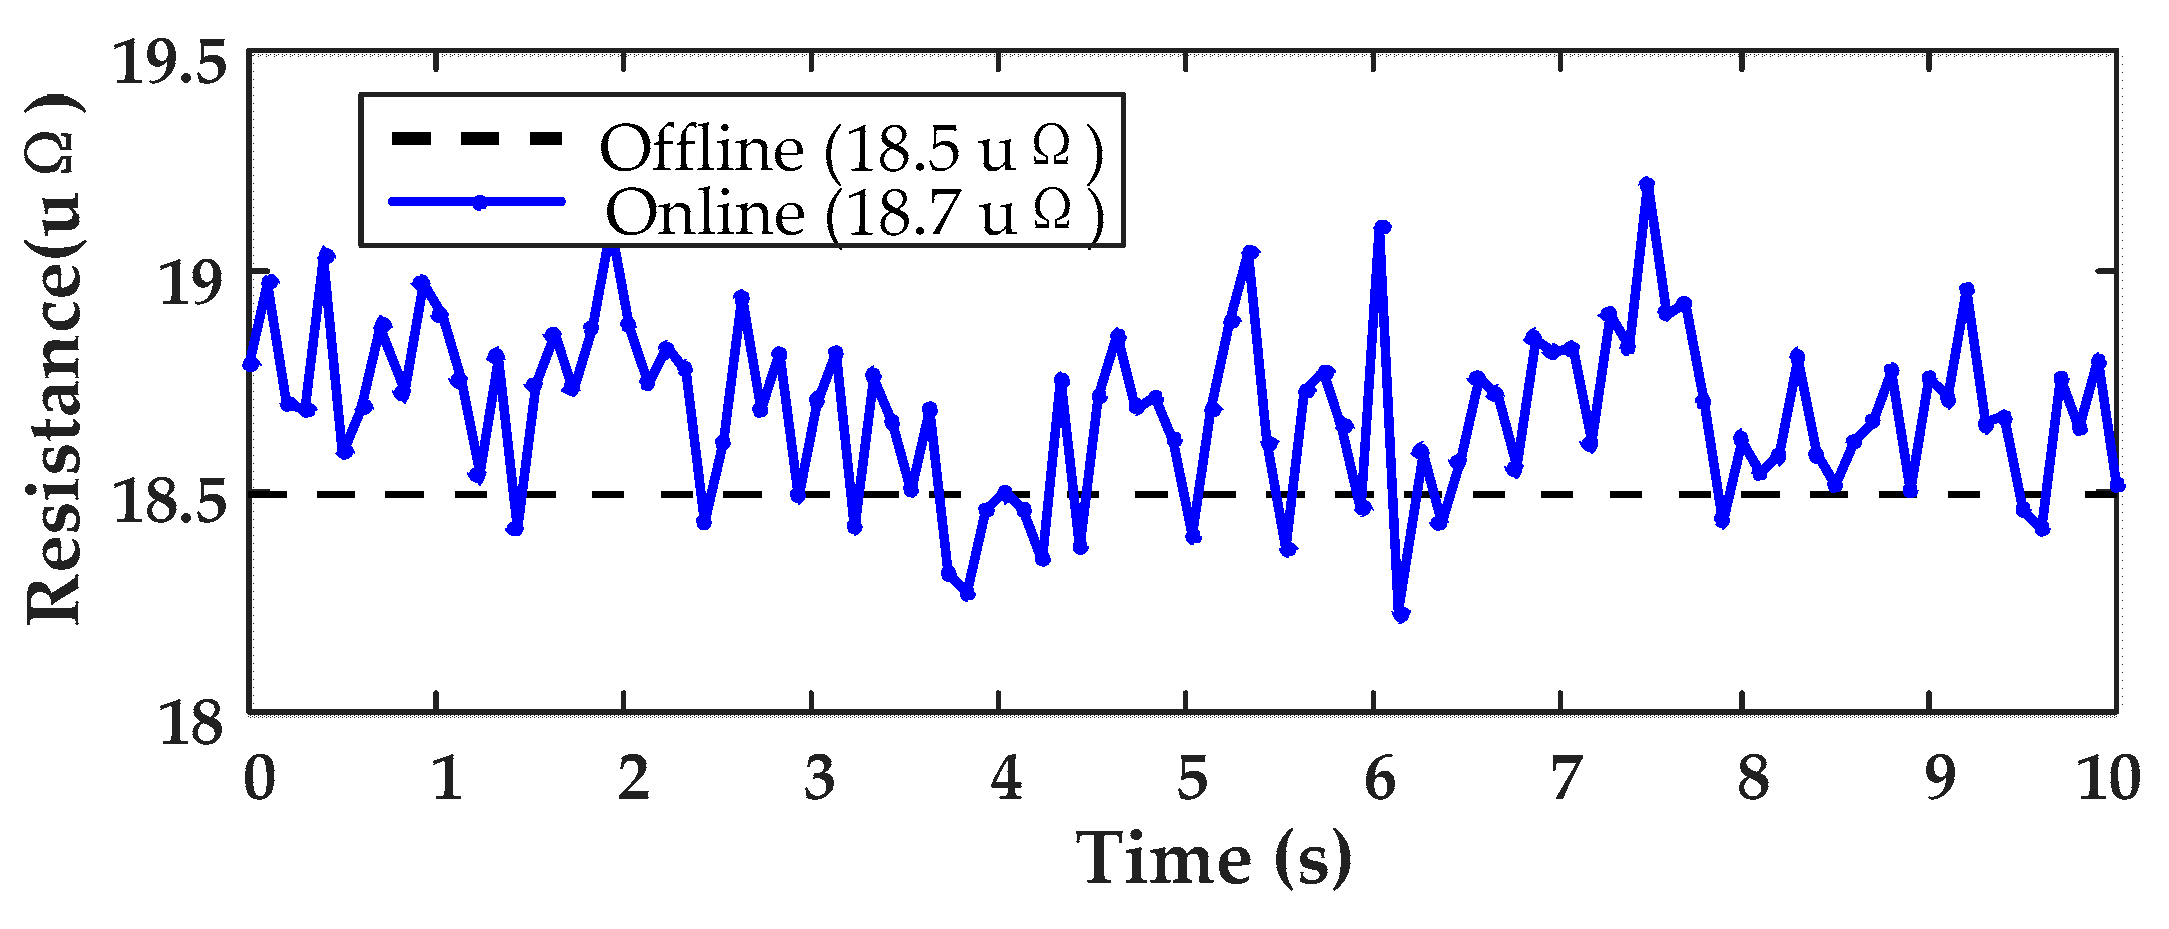
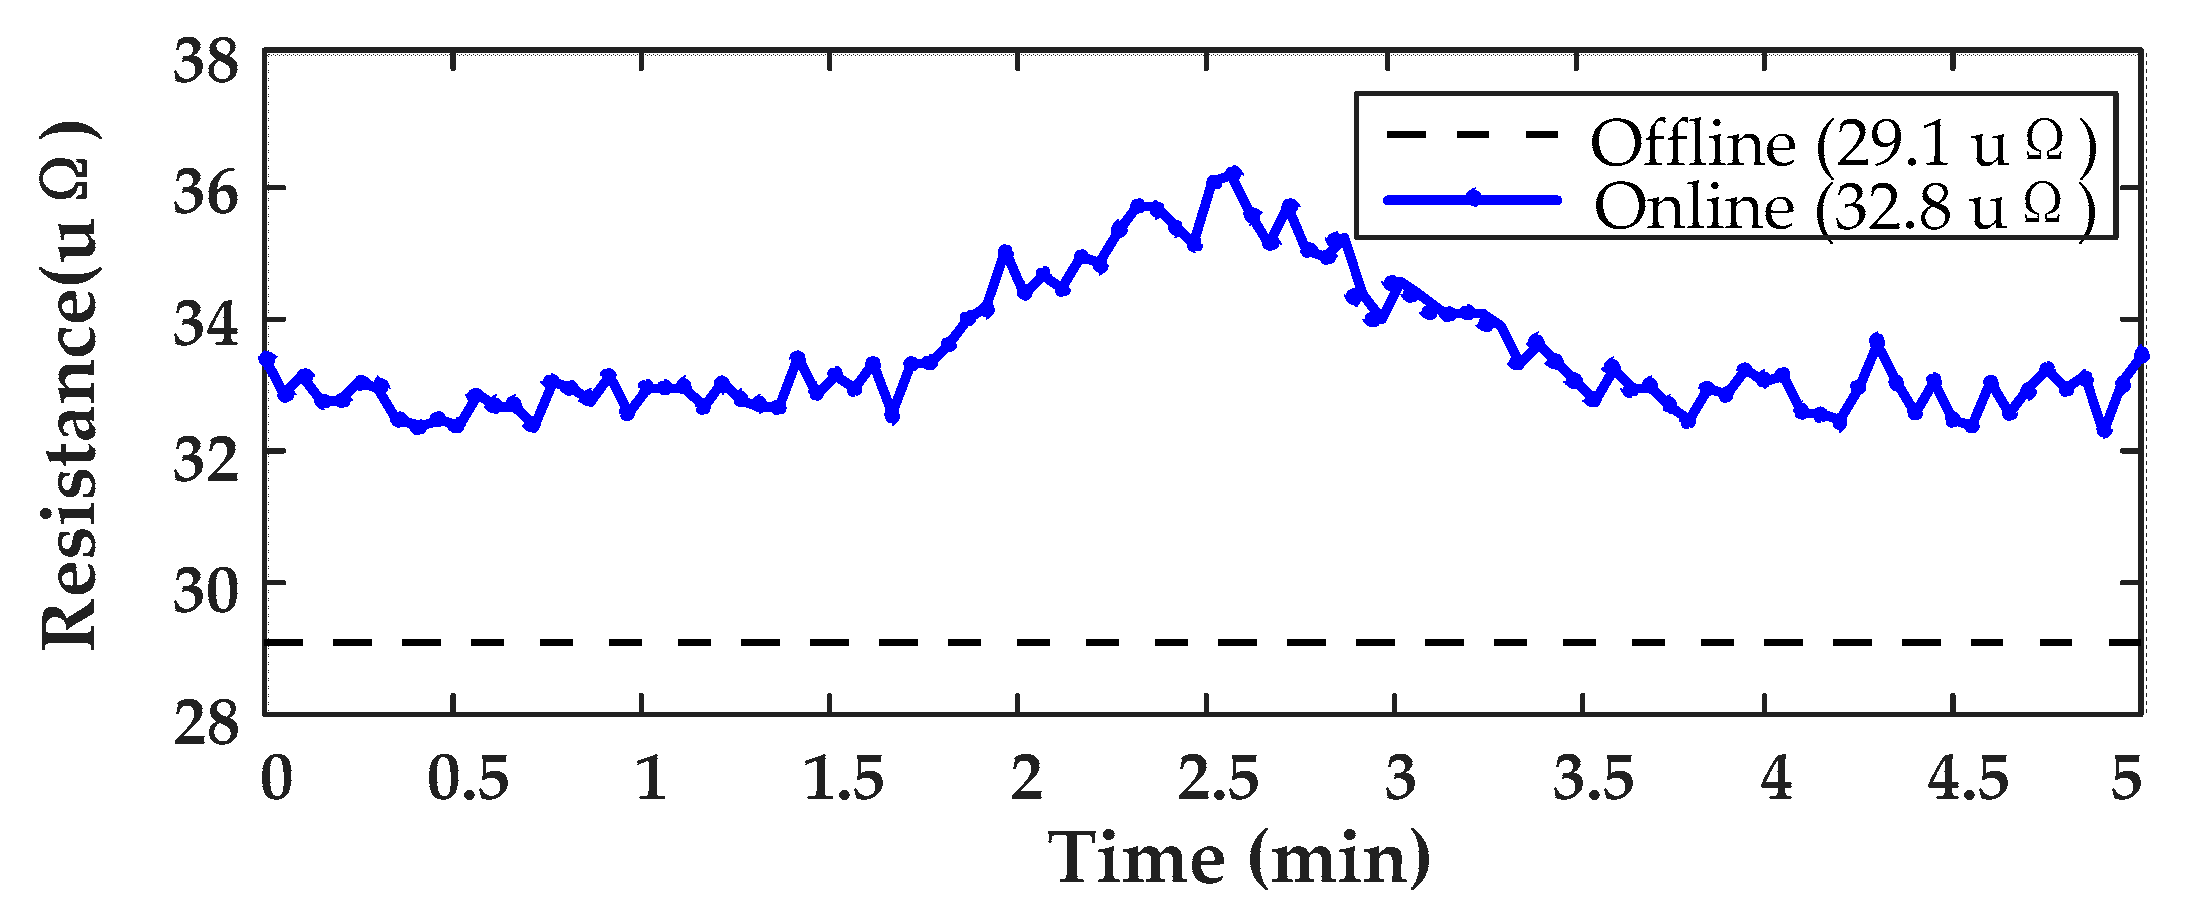
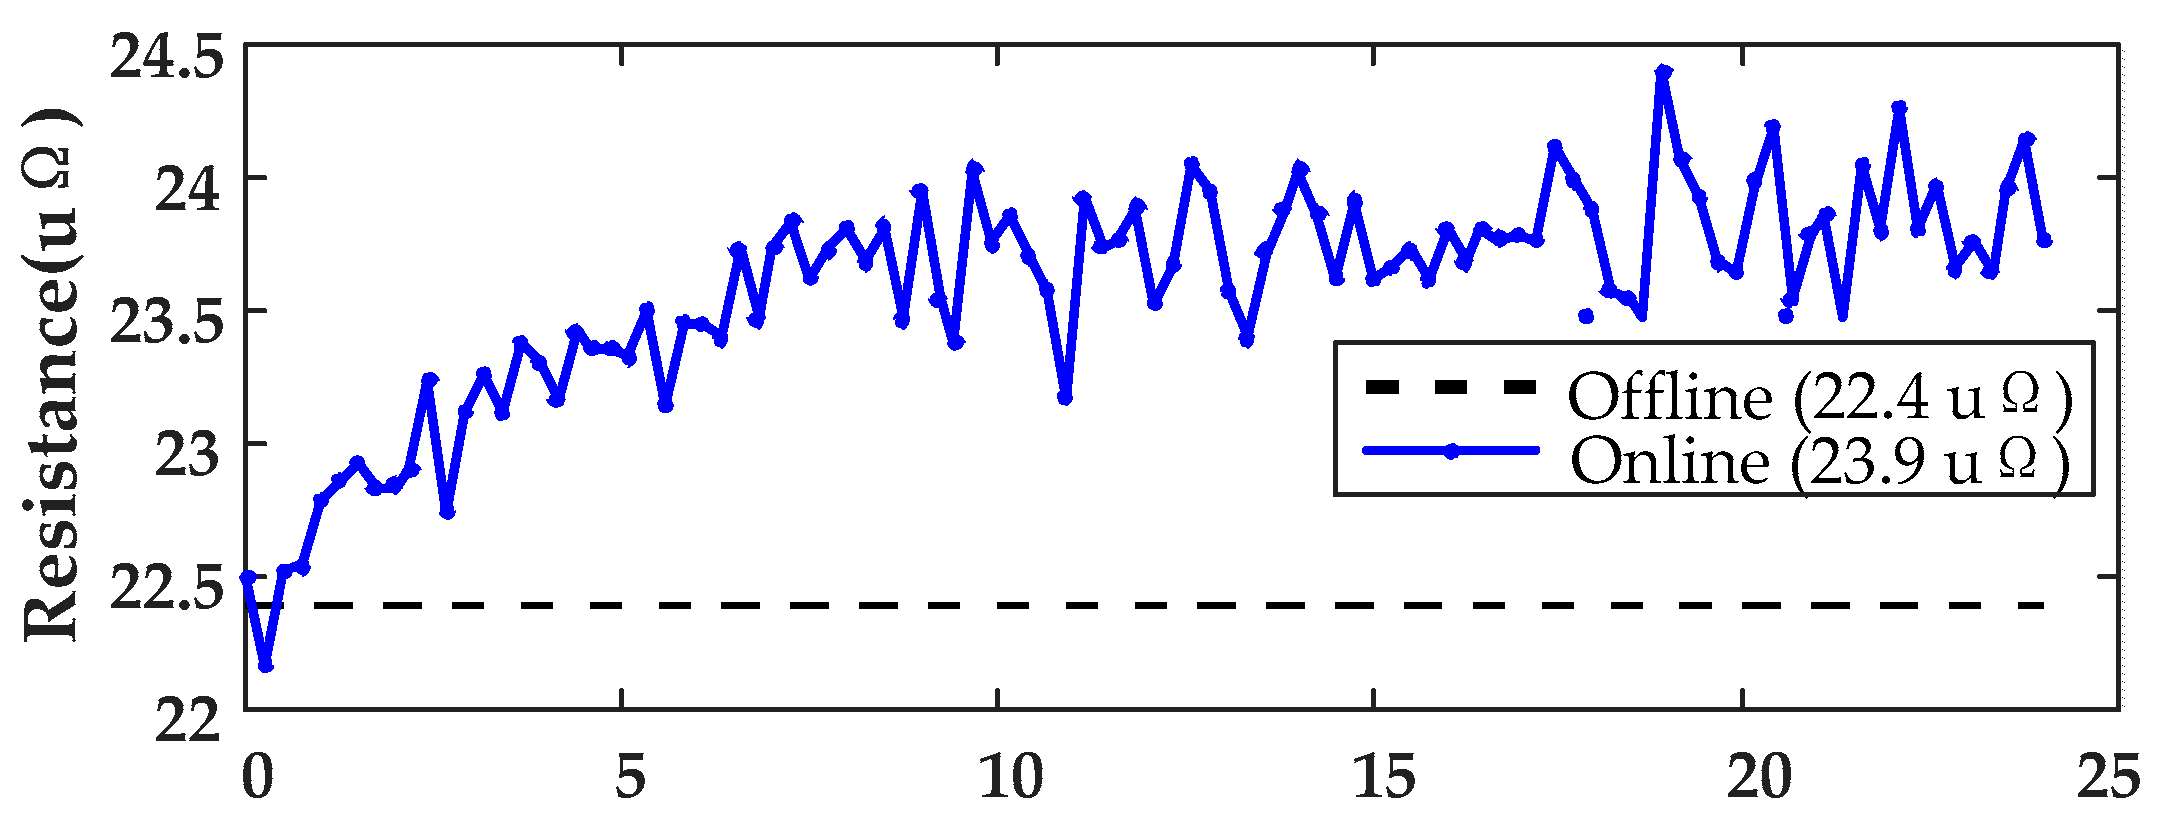
Figure 1. System architecture diagram.
Energies 18 02667 g001
Figure 2. Schematic diagram of sensor deployment.
Energies 18 02667 g002
Figure 3. Arc interrupter thermal resistance modeling.
Energies 18 02667 g003
Figure 4. Comparison of temperature error before and after ambient compensation.
Energies 18 02667 g004
Figure 5. Resistance temperature characteristics model.
Energies 18 02667 g005
Figure 6. Comparison of offline measurement and online monitoring data in Scenario 1.
Energies 18 02667 g006
Figure 7. Comparison of offline measurement and online monitoring data in Scenario 2.
Energies 18 02667 g007
Figure 8. Comparison of offline measurement and online monitoring data in Scenario 3.
Energies 18 02667 g008
Figure 9. Waveforms before and after filtering.
Energies 18 02667 g009
Figure 10. Screenshot of the fault warning.
Energies 18 02667 g010
Table 1. Comparison of multi-scenario monitoring data.
Test ScenariosOffline Monitoring Mean Value (μΩ)Online Monitoring Mean Value (μΩ)Error Rate (%)
Scenario 118.518.71.1
Scenario 229.132.812.3
Scenario 322.423.96.7
Table 2. Multi-dimensional performance comparison.
Comparison DimensionsTraditional Offline Measurement MethodsThe Contactless Online Monitoring System in This Paper
Response Speed3-Year Maintenance Interval≤200 ms
Measurement ErrorScenario 2 Overload Surge Error Reaches 12.3%Comprehensive Average Error Across All Scenarios <1.5%
Anti-Interference CapabilityPassive Design Without Active SuppressionSNR > 60 dB
Environmental AdaptabilityRequires Power Shutdown for OperationIP67 Protection and Stable Operation at 90% Humidity
Cost-EffectivenessSingle-Test Cost: USD 200 + (Excluding Labor Fees)Unit Hardware Cost: USD 120
Data Integrity AssuranceReduction of Reliance on Manual DocumentationNB-IoT Transmission Integration
Functional ScalabilitySingle-Resistance Detection ImplementationMulti-Parameter Fusion Implementation
Typical Application ScenariosPeriodic Preventive MaintenanceReal-Time Monitoring/Fault Early Warning/Lifetime Prediction
Disclaimer/Publisher’s Note: The statements, opinions and data contained in all publications are solely those of the individual author(s) and contributor(s) and not of MDPI and/or the editor(s). MDPI and/or the editor(s) disclaim responsibility for any injury to people or property resulting from any ideas, methods, instructions or products referred to in the content.

