Abstract
This study experimentally evaluates the survivability and hydrodynamic performance of a moored oscillating water column (OWC) wave energy converter (WEC) subjected to extreme cyclonic wave conditions emulating tropical cyclone Oma (2019). Laboratory tests recreated realistic cyclonic sea states using focused wave groups through the NewWave theory, combining singular and embedded focused waves within irregular seas to simulate extreme crests, troughs, and transient slamming events. Three mooring systems, including catenary, vertical-taut, and taut with 45° tendons, were tested to quantify their influence on structural response, chamber pressures, mooring tensions, and motion dynamics. The results revealed a critical trade-off: mooring configurations optimised for energy capture efficiency (e.g., taut systems) exhibited reduced survivability during extreme waves, while survivability-focused designs (e.g., catenary) compromised operational performance. Slamming pressures and transient loads were highly sensitive to wave group and mooring stiffness, with vertical taut systems experiencing the largest peak tensions. By integrating localised slamming pressure data with global mooring load measurements, this work provides a novel framework for balancing energy production and storm resilience in OWC design.
1. Introduction
The growing global demand for renewable and sustainable energy has driven significant advancements in harnessing ocean wave power through wave energy converters (WECs). In recent years, extensive research has focused on enhancing WEC performance [1,2,3]. However, ensuring the survivability of offshore WECs is equally critical for the long-term success of this emerging technology [1,4,5,6,7,8].
Various types of WECs are currently under development, including oscillating water columns (OWCs), wave-activated bodies, overtopping devices [9,10,11], and submerged pressure differential devices. This article focuses specifically on floating moored OWCs, given their unique operating principles and behaviour in extreme sea states [12,13,14].
An oscillating water column (OWC) is a hydrodynamic–aerodynamic wave energy converter (WEC) designed with a partially submerged chamber open to the sea below the waterline. As waves interact with the OWC, they cause fluctuations in the water level and air pressure within the chamber. This trapped air is then forced through a turbine and power take-off (PTO) system, generating electricity (Figure 1). In small-scale experiments, the PTO system is typically simulated using an orifice [12,13].
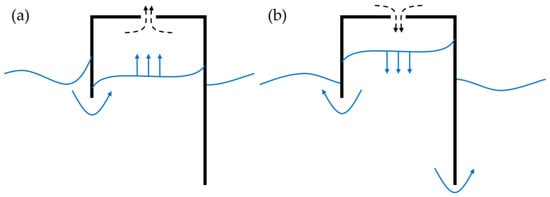
Figure 1.
OWC operating principle. (a) Exhale phase: as the water level inside the OWC chamber rises, the trapped air is expelled from the chamber. (b) Inhale phase: as the water recedes from the chamber’s underside, air from the surrounding atmosphere is drawn into the chamber.
OWCs can be broadly categorised into bottom-mounted and floating systems. Bottom-mounted OWCs are fixed to the seabed, providing structural stability and reducing the influence of wave-induced motion. In contrast, floating OWCs are moored to the seabed and interact more dynamically with incoming waves, making them highly responsive but also more susceptible to extreme sea conditions.
In severe sea states, the water motion inside a floating OWC chamber can generate significant air pressure fluctuations, resulting in high-velocity airflow between the chamber and the surrounding atmosphere. To prevent potential damage to the turbomachinery, the power take-off (PTO) system is typically sealed off from the chamber. While this measure protects the PTO components, it fundamentally alters the system’s hydrodynamics. Without the PTO acting as an air relief mechanism, the trapped air inside the chamber behaves differently, leading to intensified pressure oscillations and changes in wave structure interactions. These effects influence the floating OWC’s overall stability, motion response, and energy conversion efficiency, necessitating further investigation to ensure reliable operation in extreme conditions.
Some OWC technologies are reaching precommercial maturity. A notable example is Wave Swell Energy’s UniWave200, demonstrated at King Island, Australia [15]. The UniWave200 was Australia’s first grid-connected OWC commissioned in June 2021 and decommissioned in late 2022 as part of the funding agreement with the Australian Renewable Energy Agency (ARENA). During its operation, the device successfully demonstrated a balance between performance and survivability, exporting its first power to the King Island grid. Figure 2 illustrates the deployment of this gravity-based OWC, showing large waves breaking and slamming into the structure. Installed in shallow waters near the coastline, the device benefited from seabed support, which reduced its exposure to extreme hydrodynamic forces.
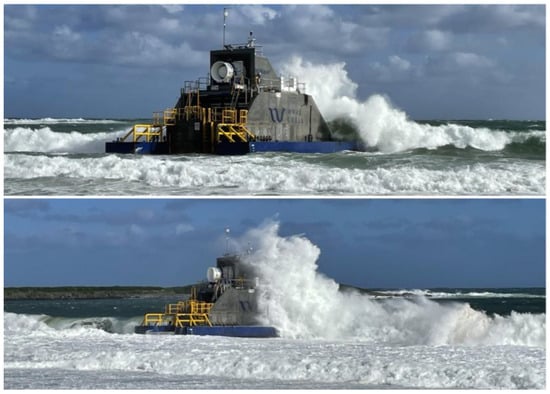
Figure 2.
Large waves breaking and slamming into the Wave Swell Energy OWC WEC that was installed on King Island, Tasmania (photos courtesy of Assoc. Prof. Gregor MacFarlane).
Floating moored OWCs operate in deep-water environments, where they are subjected to significantly larger forces compared to their shallow-water, bottom-mounted counterparts. These forces arise from the increased wave energy present in deeper waters, resulting in greater hydrodynamic loads, higher structural stresses, and more pronounced platform motions. Unlike gravity-based OWCs, which benefit from seabed support, floating moored OWCs rely solely on their mooring systems to maintain stability and position, making them more susceptible to extreme wave conditions. This challenge is exemplified in Figure 3, where powerful waves can be seen breaking around the OceanEnergy floating moored OWC [16]. The dynamic interaction between the floating structure and the surrounding wave field creates complex hydrodynamic effects, influencing energy conversion efficiency, system survivability, and mooring performance. Understanding these interactions is critical for optimising the design and reliability of floating OWC technology in offshore environments. Further, moorings are a critical component of a floating moored OWC WEC as they have a large impact on hydrodynamic performance (by influencing rigid body motions) and are solely responsible for station-keeping during extreme weather events.
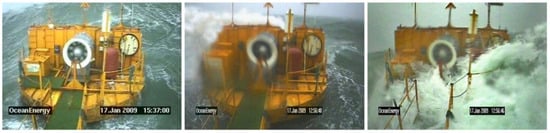
Figure 3.
Large breaking waves interacting with the Ocean Energy Buoy whilst deployed at Galloway Bay, Ireland [16].
Spar-buoy OWCs have been extensively investigated in various scientific articles in recent years [17,18,19,20,21,22,23]. The relationship between performance and survivability for different arrays of spar-buoy OWCs and mooring configurations has been well-documented [21,23]. Specifically, Howey et al. [23] examined the effects of different array arrangements and mooring configurations on hydrodynamic performance, finding that interconnected arrays of spar-buoy OWCs increased annual energy extraction by 75% compared to non-interconnected arrangements. Complementing this, Gomes et al. [21] investigated mooring loads and survivability under moderate and extreme wave conditions, as tested in [23]. Their findings indicated that while all configurations performed well in moderate seas, significant forces were observed in the inter-body lines under extreme conditions. These studies [21,23] highlight the trade-off between enhanced operational performance and increased structural loads during severe sea states.
For asymmetrical OWCs, Elhanafi et al. [24] investigated the hydrodynamic performance of a floating OWC moored with a tension leg, while subsequent research [25] assessed its intact and damaged survivability. Kisacik et al. [8] examined the efficiency and survivability of a catenary–moored asymmetrical OWC, and Ribeiro e Silva et al. [26] analysed the hydrodynamic responses of a UGEN OWC WEC, particularly its operational performance and survivability in extreme wave conditions. Such studies provide valuable insights into the behaviour of OWCs with specific mooring configurations. However, the influence of alternative mooring systems on both performance and survivability remains insufficiently explored.
Addressing this gap, Gubesch et al. [12] investigated the effects of three unique mooring configurations, including tension leg (vertical-taut), 45° tendon mooring, and chain catenary, on the hydrodynamic performance of an offshore asymmetrical OWC WEC. Their study used a fixed condition as a baseline to assess mooring-induced performance variations. They found a notable reduction in hydrodynamic performance when transitioning from the fixed to the floating moored conditions, with the 45° tendon mooring yielding the best performance, followed by the vertical-taut and then the catenary–moored configuration.
While previous studies primarily focused on floating WECs under operational sea conditions, this study specifically examines their survivability under focused extreme wave events modelled after tropical cyclone Oma. This addresses a critical gap in understanding how different mooring configurations influence both operational performance and survivability under cyclonic conditions. Unlike prior studies that analysed these aspects separately, this research simultaneously evaluates hydrodynamic performance and survivability, providing a comprehensive assessment of mooring effectiveness in extreme environments. The findings presented here offer valuable insights for the design and optimisation of floating OWCs and mooring systems, ensuring consistent energy extraction in operational conditions while mitigating risks associated with severe storms. Studies providing this level of detailed analysis for multiple mooring configurations remain scarce.
A key contribution of this study is the application of sea states modelled after a real-world cyclone using focused wave groups to simulate extreme conditions—an approach rarely explored in OWC WEC research. The significance of this approach is further underscored by the environmental conditions generated by tropical cyclone Alfred in March 2025. Cyclone Alfred impacted a region similar to that affected by tropical cyclone Oma and produced extreme sea states, including rogue waves, along the East Australian coastline. These real-world observations highlight the importance of evaluating floating WECs under cyclone-scale wave conditions to validate mooring system performance and support the development of risk-adaptive configurations for offshore renewable energy systems. Additionally, the study investigates the performance and survivability of a floating OWC moored with three generic configurations: a chain catenary, a vertical-taut mooring, and a 45° taut mooring. The results offer new insights into the relationship between hydrodynamic efficiency and system integrity under cyclonic conditions. By integrating both global (tension forces) and local (pressure) slamming responses, this study provides a holistic approach to survivability analysis, which is critical for understanding system behaviour in extreme wave environments. Floating OWCs subjected to such conditions experience both global responses, including mooring tensions and structural forces, and local responses, such as slamming loads, which may induce high-frequency motions and mooring tension. These complex interactions are essential considerations for both global strength and fatigue strength analyses, making this study particularly relevant for the future design of resilient floating OWCs. While fatigue loading is an important consideration in the full-scale design and lifecycle assessment of mooring systems, the structural analysis of the moorings and fatigue life estimations are beyond the scope of this study. This experimental investigation is specifically focused on evaluating the survivability of a floating OWC wave energy converter under extreme wave conditions, representative of the tropical cyclone Oma event. The primary objective is to examine the peak responses, including motions and mooring tensions, under these harsh conditions across three mooring configurations. Capturing cyclic loading effects for fatigue assessment would require significantly longer test durations and multiple irregular wave realisations, which are not within the experimental design of this study. Instead, this work aims to inform survivability-related decisions by identifying motion and load extremes that may challenge the structural integrity or performance of floating OWC devices.
This paper presents experimental investigations into the survivability characteristics of a floating moored OWC WEC. Three focused wave groups were used to simulate extreme conditions: a large singular focused wave and two focused waves embedded in an irregular sea state. The OWC WEC was tested under three distinct mooring configurations to assess variations in hydrodynamic performance and survivability. The paper is structured as follows. Section 2 outlines the details of the experimental setup, including the 1:36 scale model, mooring configurations, instrumentation, test matrix, uncertainty analysis, and decay tests. Section 3 provides a detailed analysis of the performance of each mooring configuration across the tested sea states, examining wave-slamming pressures, rigid body motions, mooring tensions, and OWC chamber pressures. Section 4 discusses the observed responses for each mooring configuration, drawing comparisons to highlight their relative advantages and drawbacks in extreme conditions. Finally, Section 5 presents the main conclusions of this research, offering insights into optimising floating OWC designs for both energy production and survivability in harsh marine environments.
2. Materials and Methods
2.1. OWC Model
The OWC wave energy converter model was designed based on a novel column-stabilised semi-submersible platform. This platform incorporated an asymmetrical OWC chamber, a large heave plate, and vertical stabilising columns. To enhance hydrodynamic performance under operational conditions, harbour walls were installed between the OWC chamber and the forward columns. A scaled model of the OWC system was constructed at a 1:36 scale, with key design parameters outlined in Table 1. The table details critical geometric and physical characteristics, including chamber dimensions, column diameters, mass properties, and stability parameters.

Table 1.
Key parameters of the OWC model.
To replicate the survivability condition for the power take-off (PTO) system, the OWC orifice was sealed with a clear plastic plate, ensuring an airtight chamber. A flap valve was integrated to allow internal air pressure to equilibrate with the surrounding atmosphere after each test. In operational conditions, it is well established that the air inside the OWC chamber behaves as an incompressible fluid [27,28]. However, under extreme conditions, the influence of air compressibility remains uncertain and requires further investigation. Since the OWC orifice was sealed, the air trapped inside the chamber may have affected the experimental results, and therefore, all findings in this study should be interpreted at the experimental scale. A visual representation of the novel floating offshore OWC device, supported by four stabilised columns and a heave plate, is provided in Figure 4.
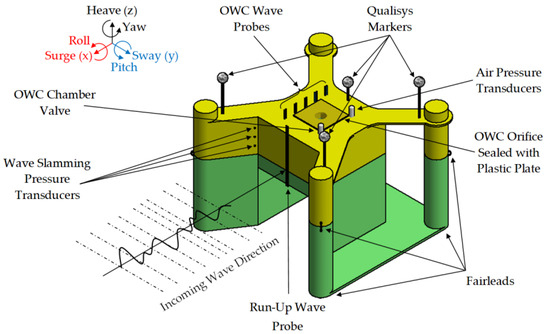
Figure 4.
A novel floating offshore OWC device supported by four stabilised columns and a heave plate.
2.2. Experimental Setup
The experimental campaign was conducted in the Model Test Basin (MTB) at the Australian Maritime College in Launceston, Tasmania. The facility measures 35 m in length and 12 m in width (Figure 5), with a water depth of 0.8 m during the experiments. A porous beach with a steepness ratio of 1:6 was positioned at the basin’s end. The WEC device was placed 13.675 m from the wave maker, ensuring sufficient distance for the wave group to focus before interacting with the model. The in-situ model setup, including instrumentation, is illustrated in Figure 6.
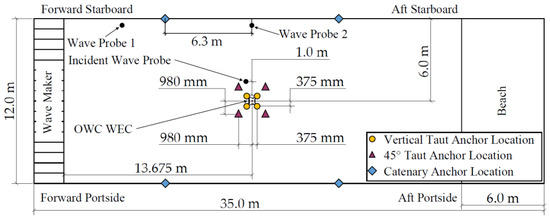
Figure 5.
Model Test Basin configuration illustrating the locations of the WEC, the wave probes, and the anchors for each tested mooring configuration.
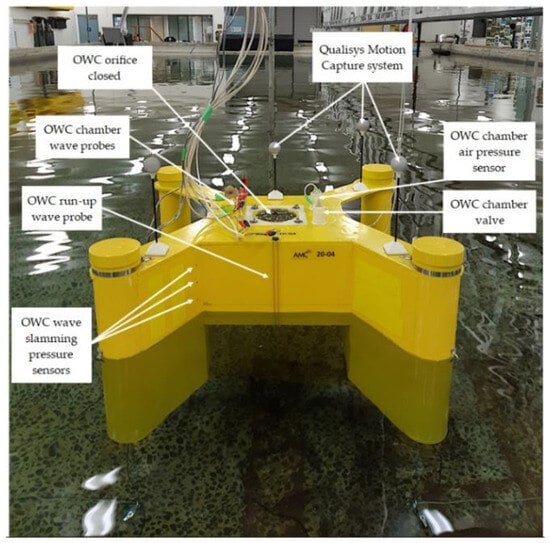
Figure 6.
In-situ model setup showing the device deployed in the wave basin.
2.3. Mooring Configurations
Three mooring configurations were experimentally tested: a vertical-taut (TLP) mooring (Figure 7a), a taut mooring with 45° tendons (Figure 7b), and a catenary mooring (Figure 7c). The taut moorings were constructed using 49-strand, 2 mm diameter stainless steel wire rope, while the catenary mooring was made of galvanised steel chain with a submerged weight of 5.366 N/m. Each mooring system was designed to assess its influence on the hydrodynamic performance of the floating offshore OWC wave energy converter.
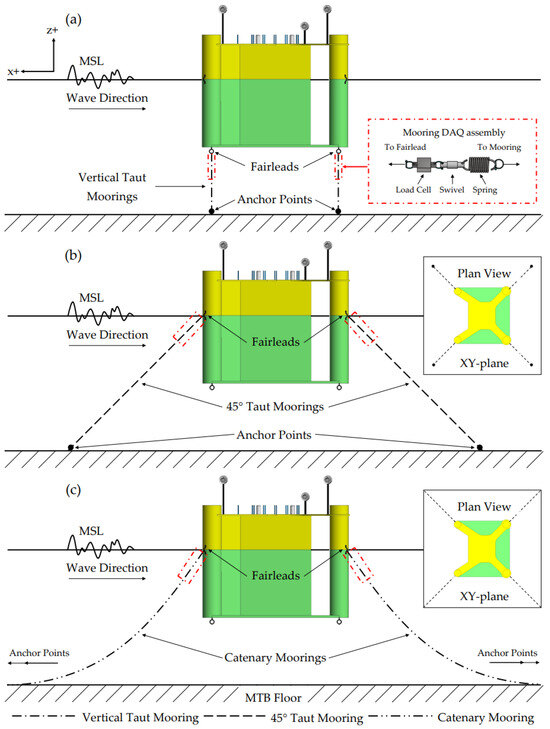
Figure 7.
Tested mooring configurations (x–z plane). (a) Vertical-taut mooring, (b) 45° taut mooring, and (c) catenary mooring.
For the TLP model, the top connectors of the tendons were positioned at the base of the columns, whereas for the catenary and 45° taut mooring configurations, the fairlead points were located at the still water level (SWL). In the TLP configuration, the pretension in the forward and aft tendons was 12.412 N and 17.634 N, respectively, with an initial tendon length (distance between the fairlead and anchor points) of 0.340 m. In the 45° taut mooring configuration, the pretension in the forward and aft moorings was 19.195 N and 23.293 N, respectively, with an initial tendon length of 1.031 m. A spring was incorporated into all mooring configurations to regulate elasticity in both the taut and catenary moorings, with an average spring constant of 20,568.75 N/m.
The instrumentation setup included various measurement transducers. Resistive wave probes were used to quantify the wave field and surface elevation inside the OWC chamber. A dedicated incident wave probe, aligned with the forward columns of the WEC and positioned 1 m to the starboard side, measured focused waves. An air pressure transducer was installed inside the OWC chamber, while load cells were used to monitor mooring tensions.
To enhance data reliability and redundancy, multiple sensors were deployed where feasible. Wave elevation in phase with the model and within the OWC chambers was measured using five evenly distributed wave probes. Additionally, a wave probe was installed on the forward OWC face to record wave run-up, and two air pressure sensors measured chamber pressure inside the OWC.
Mooring loads were recorded using four FUTEK QLA150 100 lb load cells (Costa Mesa, CA, USA). Surface elevations, air pressures, and mooring loads were sampled at 1000 Hz via a National Instruments 16-bit data acquisition (DAQ) board, with data filtered through a 10 Hz filter. The wave energy converter’s (WEC) motions were tracked using a Qualisys Motion Capture System (Göteborg, Sweden) at a sampling rate of 200 Hz.
2.4. Measurements of Wave-Slamming Pressure
Wave-slamming pressures were measured using three MeasureX MRV21 pressure sensors (Melbourne, Australia) installed on the starboard harbour wall. Their locations were determined based on the extreme wave run-up near the intersection of the harbour and forward walls. The sensors, labelled SP1, SP2, and SP3, were mounted vertically at 50 mm, 100 mm, and 150 mm above the still water level (SWL), respectively (see Figure 4). Table 2 provides the specifications of the pressure sensors. To accurately capture short-duration slamming pressures, a sampling frequency of 20 kHz was employed.
Table 2.
Specifications of wave-slamming pressure sensors.
2.5. Test Matrix
To assess the performance of the oscillating water column (OWC) in both fixed and moored modes, several regular wave conditions were tested. Wave heights ranged from 0.039 m to 0.060 m (equivalent to 1.4 m–2.16 m at full scale), while wave periods varied from 0.8 s to 3 s (corresponding to 4.8 s–18 s at full scale).
Additionally, three extreme wave conditions were generated for experimental survivability testing. The significant wave height (Hs) and peak wave period (Tp) were selected based on full-scale conditions recorded during tropical cyclone Oma, where Hs = 5.47 m, Tp = 10.35 s, and the maximum wave height (Hmax) reached 10.14 m. These extreme waves were generated using the NewWave theory, as detailed in [7]. As shown in Figure 8, three focused wave events were designed to evaluate the WEC’s response under extreme conditions:
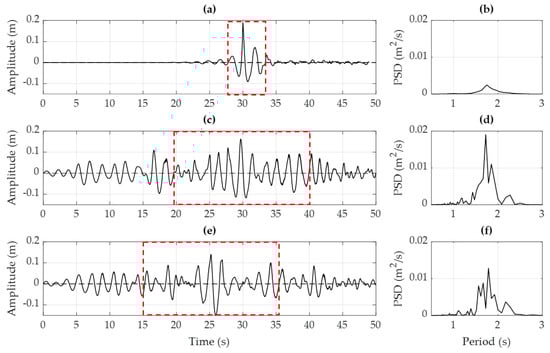
Figure 8.
Surface amplitudes and power spectrum density (PSD) for the tested waves. (a,b) Wave 1, (c,d) Wave 2, and (e,f) Wave 3. The red dashed boxes define the sea state window.
- Wave 1: a large singular focused wave group designed to generate wave slamming events onto the forward surface of the WEC, assessing wave-slamming pressures, hydrodynamic responses, and mooring tensions under steep wave impacts.
- Wave 2: a focused wave embedded within an irregular sea state, producing a large crest similar to Wave 1.
- Wave 3: another focused wave embedded within an irregular sea state but characterised by a deep trough instead of a crest.
Table 3 summarises the average measured crest amplitude (Ac), trough amplitude (At), and maximum wave height (Hmax) across the three wave fields. The recorded Hmax was 0.278 ± 0.002 m. The relative difference between the full-scale target and the extrapolated measured Hmax was estimated as +0.592% for Wave 1, −1.302% for Wave 2, and −2.012% for Wave 3.
Table 3.
Test matrix and the resulting average wave amplitudes and magnitudes.
2.6. Repeatability Analysis of Measurements
Uncertainty analysis was conducted on twelve repeated focused wave tests (Wave 1) for the 45° taut-moored WEC configuration using Equations (1) and (2) [12,29]. The results are presented in Table 4 and Table 5 and Figure 9 and Figure 10. The static mooring line tension (measured in still water) was removed, so reported mooring loads reflect only WEC-induced forces.
where X and K(a, b, c, …) are coefficients that are dependent on the physical interactions of the model and the incident waves; Z is the incident wave amplitude; α is a nonlinear exponential coefficient that represents the magnitude of nonlinear dependency relative to the incoming waves; and CV is the coefficient of variation.
X = K(a, b, c, …)Zα
CV(X) ≈ αCV(Z)
Table 4.
Repeatability results of the positive amplitudes (maxima) obtained from 12 repeated focused wave tests (Wave 1) for the 45° taut mooring configuration.
Table 5.
Repeatability results of the negative amplitudes (minima) obtained from 12 repeated focused wave tests (Wave 1) for the 45° taut mooring configuration.
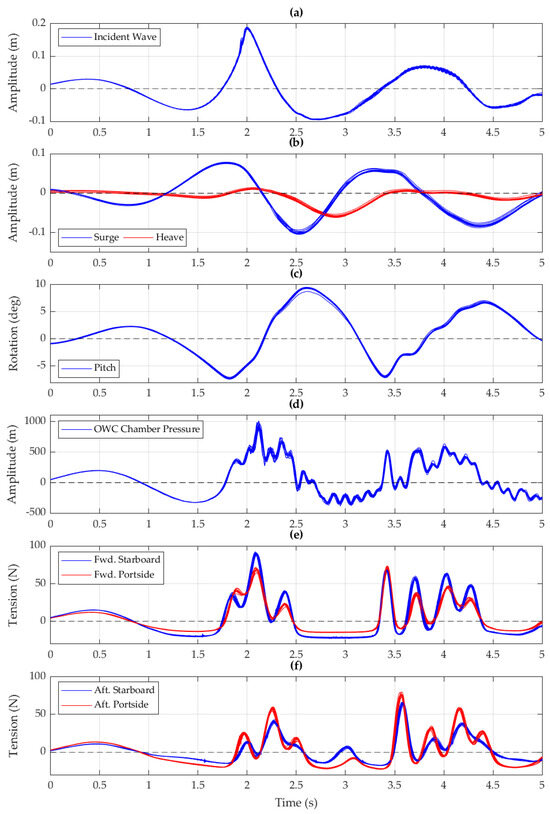
Figure 9.
Twelve repeated focused waves (Wave 1) for the 45° taut-moored condition. The subplots present (a) the amplitude of the incident wave, (b) surge and heave translations, (c) pitch rotations, (d) OWC chamber air pressure, and (e,f) the forward and aft mooring tensions.
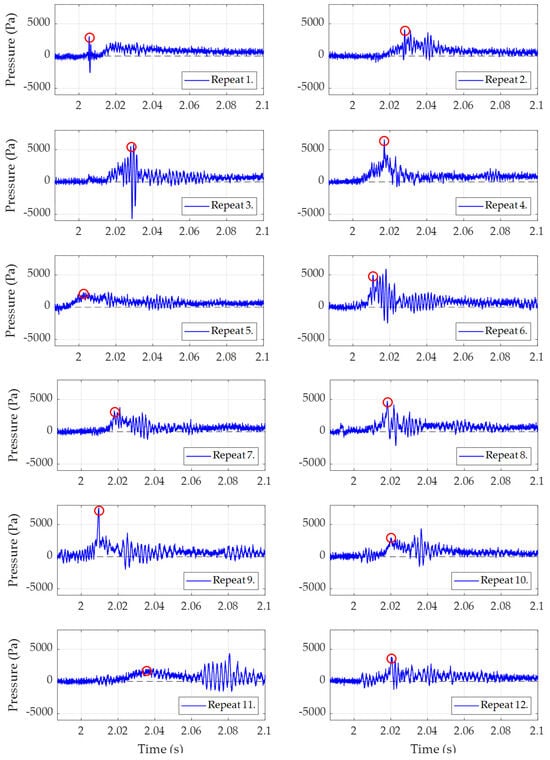
Figure 10.
Twelve repeated focused waves (Wave 1) illustrating the variation in experimental wave slamming repeatability for the 45° taut-moored condition. The presented data were measured with SP1. Red circles indicate the initial wave slam.
The results show high repeatability for wave amplitudes, with crest and trough amplitude CVs of 1.20% and 0.75%, respectively. Surge, heave, and pitch motions typically exhibit CVs below 2.5%, occasionally reaching 3.7%. Heave crest amplitudes show greater variation (CV = 14.53%), though the absolute range remains within 5 mm. Mooring tensions demonstrate excellent repeatability, with CVs of 1.7% and 1.3% for positive and negative amplitudes. Figure 9 illustrates the repeatability of wave amplitudes, translations, rotations, OWC chamber pressures, and mooring tensions.
Despite the overall good repeatability, wave-slamming pressures (SP1) exhibit significant variability (CV = 39.54%). Figure 10 highlights large fluctuations in recorded slamming pressures, with two cases (Repeats 5 and 11) showing notably reduced impact pressures. This variability likely arises from several interrelated factors, including inconsistencies in wave impact location, minor variations in WEC positioning, and complex air entrapment dynamics during wave slamming. The slamming pressure sensors were mounted on a vertical wall, where steep waves interact with the structure, leading to significant variations in impact conditions. The nature of these waves introduces unpredictability in the local free surface profile at the moment of impact. Even slight differences in the shape, steepness, or phase of the incoming wave can lead to notable pressure variations. Air entrapment at the wave impact site is another key factor contributing to variability. As the impacting wave crashes onto the vertical surface, pockets of air can become trapped between the wave and the structure. The compressibility of this trapped air influences the measured impact pressures—if a larger air pocket is present, the impact force may be partially cushioned, reducing the peak pressure recorded by the sensor. Conversely, minimal air entrapment or rapid air escape can lead to sharp, high-magnitude pressure peaks [30,31].
To address the variability observed in SP1 measurements, a boxplot representation of the data has been added (Figure 11). The figure shows the range, interquartile spread, and identifies any statistical outliers based on interquartile range criteria. Notably, no outliers were detected, including the high value observed in Repeat 9 (7590 Pa), indicating that this measurement falls within the expected variability for such slamming events.
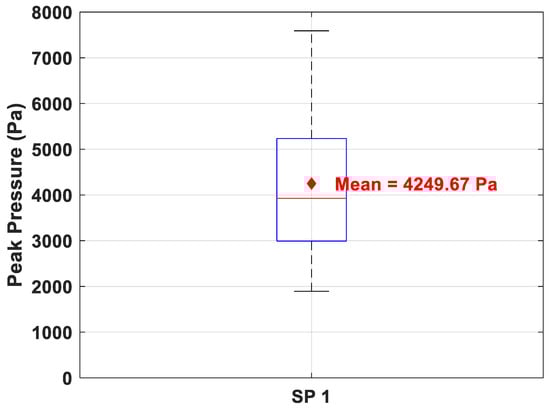
Figure 11.
Boxplot of peak pressure measurements by SP1.
The coefficient of variation for SP1 is 39.63%, significantly higher than the corresponding wave crest CV of 1.2%. This discrepancy is quantified using the ratio α = CV(SP1)/CV(Ac) = 33.11, highlighting the amplification effect of local wave impact phenomena compared to the overall wave field variability.
Although the observed variation is inherent to the nature of violent wave impacts, it underscores the value of increasing spatial resolution through additional sensors in future campaigns. In this context, pressure variability can be further decomposed into spatial and temporal contributions to better isolate the influence of wave kinematics, air entrapment, and structural response.
3. Results
3.1. Model’s Natural Periods
3.1.1. OWC Moonpool Decay Test
The natural periods of the fluid motions inside the OWC chamber were determined experimentally. The resulting values are presented in Table 6. The results indicate two dominant fluid motion modes: piston mode and sloshing mode. At full scale, the piston mode has a natural period of 8.20 s, while the sloshing mode exhibits a significantly shorter period of 4.10 s. The piston mode falls well within the critical ocean wave period range (5 s–20 s), meaning it could experience resonance with incoming waves, potentially amplifying internal fluid oscillations and affecting the system’s overall response. In contrast, the sloshing mode, with its shorter period, is less likely to be directly excited by typical ocean waves but may still interact with higher-frequency wave components or vessel motions.
Table 6.
Natural periods/frequencies of the OWC chamber in the piston and sloshing modes.
These findings underscore the importance of understanding the internal fluid–structure interactions within the OWC chamber, particularly in survivability scenarios where the PTO system is sealed. Further studies are necessary to assess how these fluid motions influence the dynamic behaviour of the WEC under realistic operating conditions.
3.1.2. Rigid Body Decay Tests
The natural periods of the floating moored configurations were determined through rigid body decay tests. Spectral analysis techniques were applied to extract the dominant response frequencies. Table 7 presents the measured natural periods for each mooring configuration at both model and full scale.
Table 7.
Natural periods of the moored OWC WEC.
The full-scale results indicate that surge and sway motions exhibit long natural periods, exceeding 44 s for most configurations. These values fall well beyond the typical range of dominant ocean wave periods (5–20 s), suggesting minimal excitation from wave forcing in these modes. Conversely, heave, roll, and pitch exhibit much shorter natural periods, with values ranging from 1.75 s to 16.87 s depending on the mooring configuration. Of particular concern are the natural periods that fall within the 5–20 s range, where resonance with ocean waves is possible. The catenary mooring system shows heave, roll, and pitch natural periods of 16.87 s, 13.60 s, and 11.53 s, respectively, making these modes more susceptible to wave-induced resonant excitation. The 45° taut mooring also has roll (3.75 s) and pitch (3.86 s) periods near the lower boundary of the critical range, whereas the vertical-taut mooring exhibits the shortest natural periods, implying a stiffer response and lower susceptibility to wave resonance. Additionally, strong coupling between different degrees of freedom was observed in some tests, which could further influence the system’s dynamic behaviour. These findings highlight the importance of mooring selection in controlling the response characteristics of floating structures.
3.2. Hydrodynamic Capture Width Ratio and Power Absorption
Table 8 presents the peak hydrodynamic capture width ratios (CWRs) and the corresponding power absorbed by the WEC in both fixed and floating moored conditions. The CWR quantifies the proportion of incident wave energy absorbed by the OWC per unit width of the chamber. The full-scale power estimates provided do not account for potential losses due to air compressibility, turbomachinery inefficiencies, or PTO system limitations.
Table 8.
Hydrodynamic capture width ratio and power absorption.
The results reveal a significant reduction in both capture width ratio and full-scale power absorption when transitioning from the fixed condition (where all rigid body motions were constrained) to floating moored configurations. In the fixed condition, the system achieved the highest CWR (154.1%) and peak full-scale power absorption (492 kW), highlighting the idealised performance potential when no platform motions are present. Among the floating moored configurations, the 45° taut mooring system exhibited the highest CWR (73.4%) and power absorption (196 kW), outperforming the vertical-taut mooring (54.1%, 136 kW) and catenary mooring (24.3%, 85 kW). The pronounced reduction in CWR for the catenary mooring system suggests that its greater flexibility leads to excessive platform motions, which negatively impact wave energy conversion efficiency.
These findings indicate a clear inverse relationship between rigid body motion magnitude and energy absorption efficiency. Increased platform motions disrupt the optimal hydrodynamic interactions necessary for efficient wave energy capture, emphasising the importance of mooring selection in balancing motion response and power performance.
3.3. Wave 1: Wave Slamming Events
Wave 1 was used to evaluate wave-slamming pressures, hydrodynamic responses, and mooring tensions. As discussed in Section 2.1 (refer to Figure 4), three pressure sensors were installed in the starboard harbour wall to measure wave-slamming pressures. The pressure sensors were vertically aligned and installed 15 mm from the harbour/forward wall intersection. Sensor 1 (SP1), Sensor 2 (SP2), and Sensor 3 (SP3) were positioned 150 mm, 100 mm, and 50 mm above the SWL, respectively.
Due to the observed variability discussed in Section 2.6, pressure measurements that were recorded during the wave slamming events are presented as boxplots in Figure 12 and were nondimensionalised with Equation (3) to create a wave-slamming pressure coefficient (P*). Each boxplot represents the minimum, maximum, lower quartile, upper quartile, outliers, and median values for each condition in the dataset.
where P* is the nondimensionalised slamming pressure coefficient; P is the wave-slamming pressure measurement as per the experiment; ρ is the density of water; g is gravitational acceleration; and ζc is the crest amplitude of the incident wave.
P* = P/(ρgζc)
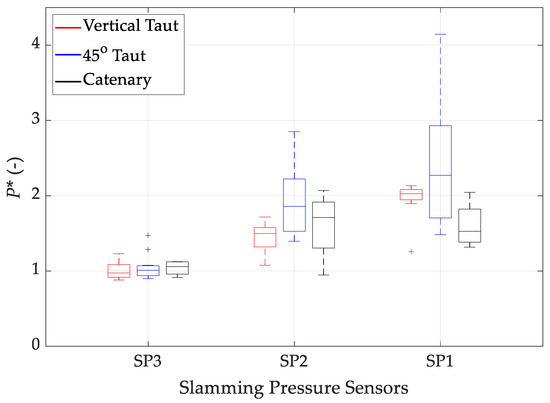
Figure 12.
Boxplots of the recorded wave-slamming pressures generated by Wave 1.
Figure 12 shows that the largest slamming pressures for both taut mooring configurations were measured by the pressure sensor furthest from the SWL (i.e., SP1). This suggests that larger pressures were generated as the crest of the breaking wave made contact with the WEC. It is also possible that wave slamming was not a significant feature in data collected by SP2 and SP3 due to water running vertically up the face of the WEC rather than by direct impact. Figure 12 also highlights statistical outliers in the slamming pressure measurements, indicated by (+) markers in the boxplots. These outliers were identified using the interquartile range method but were retained in the dataset as they are considered representative of extreme yet physically valid slamming events. Such peaks likely result from localised phenomena such as air pocket entrapment or crest focusing near the forward wall. Their presence emphasises the importance of accounting for variability in slamming pressure design assessments, particularly for SP1, which consistently recorded the highest pressure values across all configurations.
The highest slamming measurements were recorded with the 45° taut mooring configuration, where the median slamming pressure coefficient was 2.272, and the maximum coefficient was 4.146. The phase of the pitch rotations relative to the peak of the focused wave and the additional resistance to surge translations generated with the 45° taut mooring are thought to be contributing factors affecting the increased pressure measurements.
The median slamming pressure coefficient of SP1 for the vertical-taut mooring was 2.027, and the maximum coefficient was 2.131. The pitch rotations of the WEC with the vertical-taut mooring at the time of the slam were close to vertical, and the lack of resistance to surge translations due to the mooring configuration may have reduced pressure measurements.
The maximum median pressure coefficient with the catenary mooring configuration was measured by SP2 (1.710), which was slightly larger than the pressure coefficient measured by SP1 (1.527).
While the recorded pressure measurements appear to demonstrate a trend for the respective mooring configurations, increasing the sample size for each wave slamming event may consolidate the trend. Additionally, as the pressure sensors were located close to the harbour/forward wall intersection, the maximum pressures on the forward wall of the OWC chamber may be considerably higher. Further experimental research is recommended in order to collect additional wave slamming data at a wider range of locations, with particular attention to the vertical line of symmetry on the forward wall of the OWC.
Wave 1 generated a severe dynamic response from the WEC and each of the tested mooring configurations. Figure 13 presents a sequence of photographs of the wave as it slammed into the forward wall of the WEC when moored with the vertical-taut configuration. Figure 14 and Table 9 present the incident wave amplitude (a), the surge and heave translations (b), pitch rotations (c), OWC chamber pressures (d), and the forward and aft mooring tensions that were recorded during the wave slamming event. The harbour walls that connect the forward columns to the OWC chamber were originally designed to concentrate wave energy along the entry of the OWC to increase the WEC’s hydrodynamic performance. In extreme conditions, the harbour walls concentrate the energy of the large breaking wave along the forward surfaces of the OWC, which appears to have a significant effect on the WEC’s motions and mooring tensions.
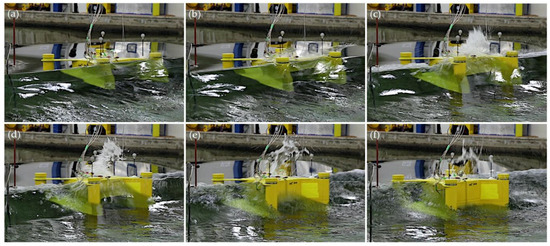
Figure 13.
Wave 1 slamming into the WEC when moored with the vertical-taut mooring. The wave in this figure is moving from the right side to the left side of each image. Lettered notations (i.e., (a–f), etc.) identify key events that occurred during the wave slamming event.
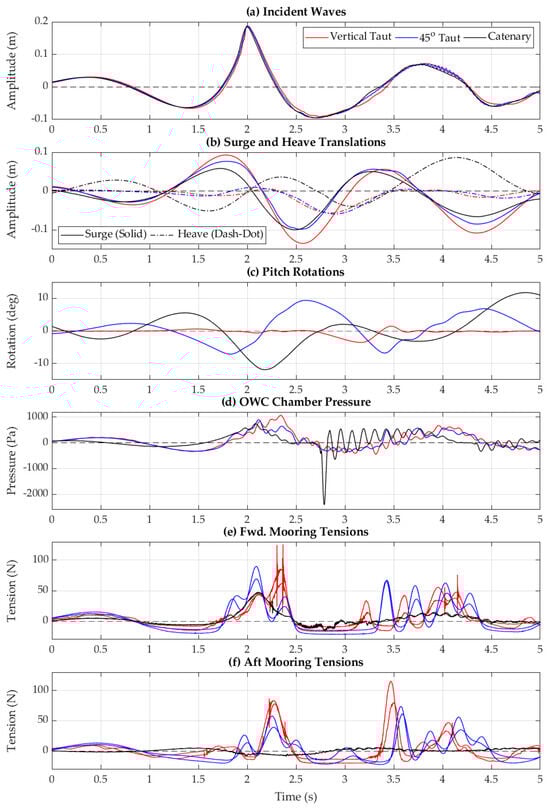
Figure 14.
Hydrodynamic responses to Wave 1 when the WEC was moored with a vertical-taut, 45° taut, and catenary mooring.
Table 9.
Peak values of the measurements recorded during the wave slamming event (wave 1).
The largest surge translations were observed with the vertical-taut configuration, followed by the 45° taut and catenary moorings. The heave translations showed the opposite trend, with the catenary displaying the largest translations, followed by the 45° taut and vertical-taut moorings. The peak OWC chamber pressure appears to be related to the WEC’s heave translations. For example, the catenary mooring displayed the highest chamber pressures and heave translations, whereas the vertical-taut moorings had the lowest heave translations and lowest chamber pressures. Both the 45° taut and catenary moorings displayed large pitch rotations, which may be related to the location of the fairleads. The water seal between the OWC chamber and the atmosphere for the catenary mooring was breached during Wave 1. This generated a large negative pressure (−2406 Pa), followed by high-frequency pressure oscillations (Figure 14d, between 2.8 s and 3.8 s). Coupling between heave and pitch is believed to be a key factor in the OWC chamber breach. The large pressure oscillations underscore the importance of closing the OWC’s power take-off (PTO) system during survivability conditions to protect the turbomachinery from damage. However, fully sealing the OWC chamber from the atmosphere may create adverse conditions when a breach occurs under extreme conditions. Further investigation is needed to assess the impact of OWC chamber damping on the survivability of floating moored OWCs.
The significant negative pressure observed during catenary moored tests suggests that, at the model scale, the air inside the OWC chamber does not behave as an incompressible fluid under these conditions. This contrasts with hydrodynamic performance testing in operational conditions, where air compressibility effects are often neglected in scale model experiments.
The 45° taut-moored configuration generated slightly higher average loads in the forward moorings (79.640 N) when compared to the vertical-taut condition (74.020 N). The forward mooring tensions of the 45° taut configuration were expected to be considerably higher than the vertical-taut configuration due to the angle of incline; however, this was not the case. The increased pitch rotations may have absorbed and deflected a portion of the incoming wave energy, which may have reduced the load in the moorings.
The tensions in the aft moorings were substantially lower than the forward mooring tensions. This reduction is thought to be due to the angled design of the mooring combined with the surge translations. In this case, as the WEC surges in the aft direction, the relative tension in the aft moorings is somewhat reduced.
As with the vertical-taut configuration, all pretension was lost in the 45° taut moorings as the trough of the focused wave passed the WEC. A large increase in tension was recorded as the following wave interacted with the WEC. A ringing-like behaviour can be observed in Figure 14e,f between 3.25 s and 4.5 s.
The catenary mooring configuration demonstrated the lowest overall mooring tensions. The highest tensions were measured in the forward moorings, albeit the loads were much lower than the other mooring configurations. The aft catenary moorings displayed a reduction of tension during the wave slamming event (between 1.8 s and 2.9 s in Figure 14f). As the WEC surged towards the aft, the suspended length of the mooring chain reduced, which proportionally lowered the tension in the mooring.
The vertical-taut moorings exhibited a complex response to Wave 1. Based on tendon behaviour, three distinct events were identified, as highlighted in Figure 15b,c in regions (i), (ii), and (iii).
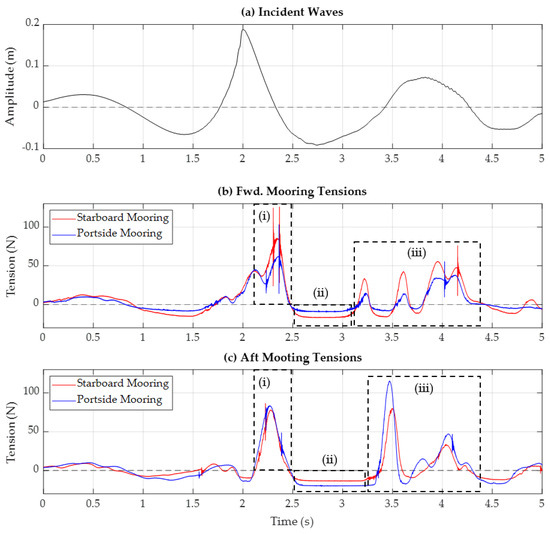
Figure 15.
Vertical-taut mooring response to Wave 1. (a) Incident wave amplitude; (b,c) forward and aft mooring responses, respectively. Region (i) represents the initial response to the focused wave, region (ii) represents a complete loss of mooring pretension immediately following the impact, and region (iii) represents the post-wave interactions after the moorings regained tension.
- Region (i) corresponds to a very high-frequency response occurring during wave impact. This will be discussed in detail in the following paragraphs.
- Region (ii) shows a complete loss of mooring pretension immediately after impact. The moorings became slack as the wave trough caused the WEC to heave downward.
- Region (iii) captures a secondary high-frequency response as the following wave interacts with the WEC. This response, though at a lower frequency than in region (i), appears to align with the heave natural period of the WEC and vertical-taut moorings (T3 = 0.291 s).
A detailed analysis of the dataset was conducted to determine the cause of the high-frequency response observed in region (i). Similar behaviour was detected in other mooring configurations and extreme wave conditions, though with significantly lower magnitudes in the 45° taut configuration and negligible effects in the catenary mooring. Post-experiment dry testing evaluated the frequency response of the moorings and data acquisition system, revealing an average response frequency of 226.3 Hz. The experimental model exhibited peak and minor frequency responses at 167.2 Hz and ~350 Hz, respectively. The load cell manufacturer (FUTEK) confirmed that the signal likely originated from a physical measurement rather than a sensor error. However, all these values remain significantly lower than the observed 981.4 Hz during hydrodynamic testing, suggesting that the moorings and model are unlikely to be the source of this response.
The high-frequency response is ultimately considered noise with no physical meaning. However, given that tendon ringing can occur in TLP systems when excited by slamming events, the raw data were retained for analysis. While air pressure data suggests a potential correlation with the high-frequency response, this relationship remains inconclusive and requires further investigation.
3.4. Wave 2: The Effects of a Focused Wave Crest Embedded in an Irregular Sea State
Wave 2 extends Wave 1 by embedding the focused wave group within an irregular sea state, simulating a more realistic survivable condition. Figure 16 presents the time history of the WEC’s motions and mooring tensions in response to Wave 2 for the tested mooring configurations.
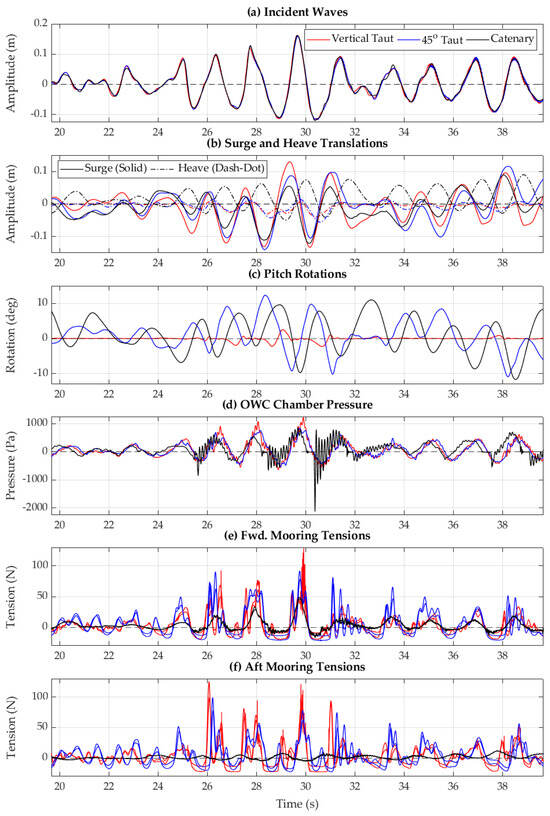
Figure 16.
Model’s motion and mooring responses to Wave 2.
As shown in Table 10, the average maximum incident wave height during Wave 2 was 0.278 m, a 0.714% decrease compared to Wave 1 (0.280 m). Despite similar wave heights, variations in crest and trough amplitudes influenced the WEC’s response, allowing for a direct comparison between a single focused wave (Wave 1) and focused wave groups embedded in irregular seas (Wave 2).
Table 10.
Peak values of the measurements recorded during the impact caused by Wave 2.
The vertical-taut mooring exhibited the largest surge motion (0.263 m), while the catenary mooring had the highest heave (0.115 m) and pitch (19.315°), reflecting its greater flexibility. The OWC chamber pressure response varied significantly, with the vertical-taut mooring generating the highest positive pressure (1220 Pa) and the catenary mooring experiencing the largest negative pressure (−2125 Pa).
Mooring loads also varied, with the 45° taut mooring experiencing the highest forward mooring tension (85.085 N), while the vertical-taut mooring had the highest aft mooring tension (80.770 N). The catenary mooring, despite allowing greater platform motions, had the lowest mooring tensions, suggesting reduced restraint and increased compliance.
These results highlight the trade-off between mooring stiffness and platform response. While stiffer mooring configurations limit motion, they increase mooring loads and chamber pressures, whereas more compliant systems reduce loads but allow greater dynamic motion.
3.5. Wave 3: The Effects of a Focused Wave Trough Embedded in an Irregular Sea State
Wave 3 extends Wave 2 by embedding a focused wave trough within an irregular sea state. Figure 17 presents the time history of the WEC’s motions and mooring responses to Wave 3 for the tested mooring configurations. As shown in Table 11, the average maximum wave height recorded during Wave 3 was 0.276 m, 1.428% lower than in Wave 1 (0.280 m) and 0.719% lower than in Wave 2 (0.278 m). The similarity in wave heights allows for a direct comparison between the WEC’s response to focused wave crests (Wave 2) and focused wave troughs (Wave 3).
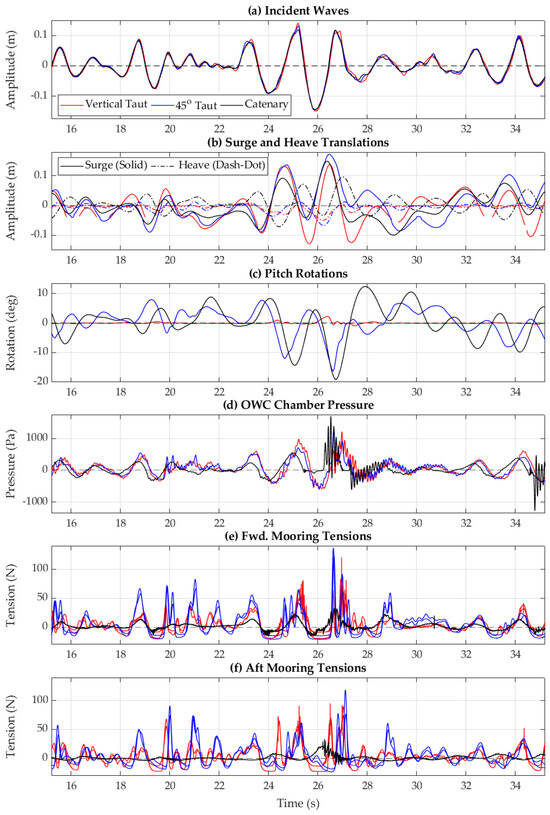
Figure 17.
Model’s motion and mooring responses to Wave 3.
Table 11.
Peak values of the measurements recorded during the impact caused by Wave 3.
The vertical-taut mooring exhibited the largest surge motion (0.267 m), while the catenary mooring showed the highest heave (0.130 m) and pitch (31.481°), reflecting its increased flexibility. The OWC chamber pressure response was highest for the catenary mooring, reaching 1698 Pa, while both taut mooring configurations exhibited similar pressure fluctuations. Mooring loads varied significantly, with the 45° taut mooring experiencing the highest forward mooring tension (130.045 N) and aft mooring tension (97.555 N), whereas the catenary mooring had the lowest overall tensions, indicating greater compliance. Figure 18 provides a sequence of snapshots visualising the interaction between the impacted wave (Wave 3) and the moored OWC device with the catenary mooring configuration. Large bubbles were observed from the OWC chamber during this event.
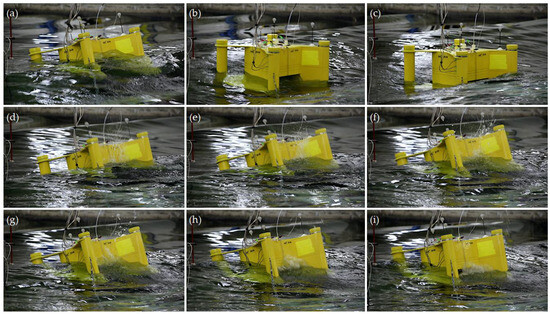
Figure 18.
Large bubbles exploding from the OWC chamber after the catenary moored WEC interacted with the focused trough in Wave 3. Lettered notations (e.g., (a–i), etc.) denote key events that occurred during Wave 3.
The focused wave trough in Wave 3 triggered a sequence of events that led to the formation of large air bubbles inside the OWC chamber, ultimately causing a high-frequency response in the catenary mooring tensions. This sequence is illustrated in Figure 18:
- As the approaching wave interacts with the WEC, water runs up the forward wall of the OWC chamber, increasing the internal water level and pressure (Figure 19, t ≈ 25.0 s).
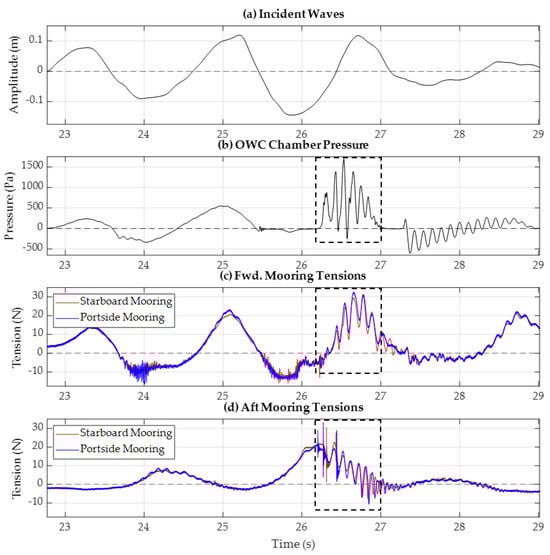 Figure 19. Catenary mooring response to Wave 3. Fluctuations in the OWC chamber pressure and mooring tensions are highlighted by the dashed box.
 - As the wave trough reaches the WEC, the OWC chamber becomes exposed to the atmosphere, causing the internal pressure to equalise and allowing water to be discharged with little resistance (Figure 19, t ≈ 25.5 s).
- The following wave crest approaches while the OWC chamber remains open to the atmosphere, maintaining ambient pressure inside the chamber (Figure 19, t ≈ 26.0 s).
- As the second wave crest impacts, the WEC pitches backward, and a large volume of water is forced into the OWC chamber, compressing the trapped air (Figure 19, t ≈ 26.25 s).
- (e)–(g) Small sprays of water and air are ejected from the OWC chamber due to pressure fluctuations (Figure 19, 26.25 s < t < 26.50 s).
- (h)–(i) Finally, a large air bubble is expelled as the OWC chamber’s forward wall nears the waterline, marking the peak of this dynamic interaction (Figure 19, t > 26.50 s).
This rapid sequence of pressure changes inside the OWC chamber induced high-frequency oscillations in the catenary mooring tensions, as seen in Figure 19 (t ≈ 26.25–27.0 s). Further analysis in Figure 20 shows a peak frequency of 8.695 Hz for both the OWC chamber pressure and mooring tensions, 11.878 times larger than the OWC moonpool’s piston mode frequency and 5.939 times larger than its sloshing mode frequency (refer to Table 6). This suggests a strong coupling between the internal chamber dynamics and the mooring system, particularly for the catenary configuration.
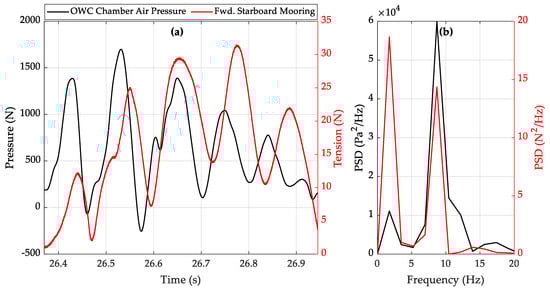
Figure 20.
High-frequency response measured in the forward starboard catenary mooring as evidenced from the OWC air pressure post-Wave 3. (a) Time domain and (b) frequency domain.
4. Discussion
4.1. Vertical-Taut Mooring Configuration
Figure 21 presents the hydrodynamic responses of the vertical-taut moored configurations to the three tested sea states and shows a clear trend regarding the maximum and minimum responses. Positive and negative amplitude values are depicted with the (+) and (−) signs and are relative to the coordinate system defined in Section 2.1. The surge translation for Wave 2 and Wave 3 had similar offset magnitudes and were on average 16% larger than Wave 1. On average, heave setdown was 7.63 times greater than positive heave motions, following a similar trend to other TLP structures. The pitch rotations for Wave 1 and Wave 2 were similar in magnitude and occurred with the focused crest, whereas the pitch rotations for the focused trough (Wave 3) were 58.7% smaller. The OWC chamber pressures for Wave 1 were 88.7% and 72.2% lower than the pressures generated with Wave 2 and Wave 3, which were relatively similar despite the focused crest and focused trough. Regardless of the wave type, the vertical-taut configuration tended to generate higher positive OWC chamber pressures rather than negative pressures. The forward and aft mooring tensions demonstrated a high level of consistency for all three tested waves. On average, the forward moorings shared an average of 75.3 N, and the aft tensions were 8% larger, with an average of 81.3 N.
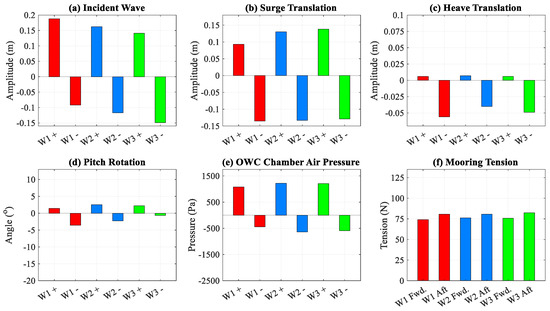
Figure 21.
Comparison of the peak values of the measurements recorded with the vertical mooring configuration caused by the impact of Waves 1, 2, and 3 (W1, W2, and W3).
4.2. 45° Taut Mooring Configuration
The 45° taut moored configuration showed a clear trend regarding survivability in the tested sea states (see Figure 22). The focused trough that was generated with Wave 3 caused substantially higher surge and heave translations, OWC chamber pressures, and mooring tensions. Of notable importance, the forward moorings demonstrated higher tensions than the aft moorings for all three waves. The maximum forward mooring tensions were recorded with the focused trough (Wave 3) and were 63.3% larger than the single focused wave (Wave 1) and 52.8% larger than the focused wave embedded into an irregular sea state (Wave 2). Regarding the aft moorings, the maximum tensions measured during Wave 3 were 100.5% greater than Wave 1, and 85.8% greater than Wave 2. Overall, the focused trough represented the worst-case scenario for the 45° taut moored configuration.
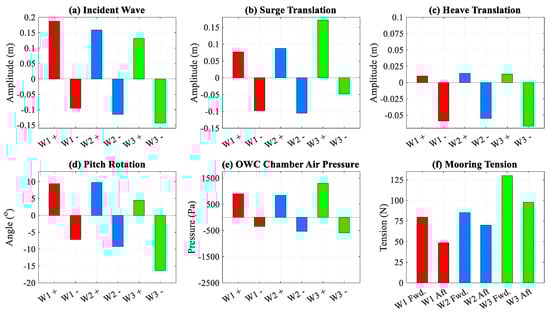
Figure 22.
Comparison of the peak values of the measurements recorded with the 45° taut mooring configuration caused by the impact of Waves 1, 2, and 3 (W1, W2, and W3).
4.3. Catenary Mooring Configuration
The catenary moored configuration demonstrated a wide range of responses to the tested waves (see Figure 23). The largest surge, heave, and pitch responses were observed during Wave 3, followed by Wave 2 and Wave 1. The waves with focused crests (Wave 1 and Wave 2) recorded the largest negative OWC chamber pressures, whereas the focused trough (Wave 3) recorded the largest positive pressure. Regarding mooring tensions, the forward mooring lines experienced 6.95, 4.92, and 0.469 times greater than the aft mooring lines for Wave 1, Wave 2, and Wave 3, respectively. As such, it appears that the forces generated by the focused wave crest were largely absorbed by the forward catenary moorings, whereas the forces generated by the deep trough substantially increased the tensions in the aft moorings.
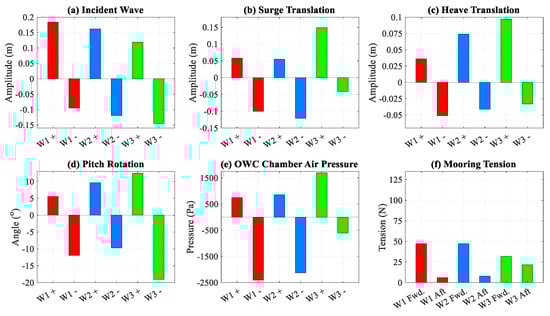
Figure 23.
Comparison of the peak values of the measurements recorded with the catenary mooring configuration caused by the impact of Waves 1, 2, and 3 (W1, W2, and W3).
4.4. Interpretation of Experimental Observations
Figure 24 illustrates the survivability challenges and potential failure modes that floating moored OWC wave energy converters may encounter when subjected to extreme wave conditions. The observed phenomena were categorised into six key scenarios (denoted as (1)–(6) in Figure 24) based on experimental observations, as described below:
- (1)
- Interactions with extreme waves: the forward surface of asymmetrical OWCs may experience high-energy wave impacts from nonlinear breaking waves, leading to wave slamming and significant wave run-up. These interactions can impose substantial loads on the structure, necessitating careful design considerations to ensure the integrity of the forward chamber walls.
- (2)
- Overtopping and deck loading: the presence of green water on the deck poses risks to the power take-off (PTO) housing and other critical topside infrastructure. This hazard is particularly relevant for WECs employing taut mooring systems, which may increase exposure to overtopping events.
- (3)
- OWC chamber hydrodynamics and aerodynamics: fluid dynamics within the OWC chamber significantly influence the rigid body motions of the WEC. To enhance survivability, moonpool damping mechanisms—distinct from PTO damping—may be required to mitigate excessive motion and associated risks.
- (4)
- Excessive motions and stability concerns: extreme wave conditions, in combination with OWC chamber dynamics, can induce large-amplitude motions across all six degrees of freedom. Such motions threaten platform stability and mooring system integrity, necessitating robust design and control strategies.
- (5)
- OWC chamber breaching and air escapement: the air escaping from the OWC chamber can trigger a highly complex dynamic response, potentially compromising the structural integrity of the WEC and affecting PTO turbomachinery. Mitigation strategies may be required to manage air pressure variations and associated risks.
- (6)
- Mooring system responses: mooring systems, particularly taut moorings, are influenced by all of the above factors. Their response to extreme wave conditions requires detailed analysis during the design phase to ensure reliability and prevent failure.
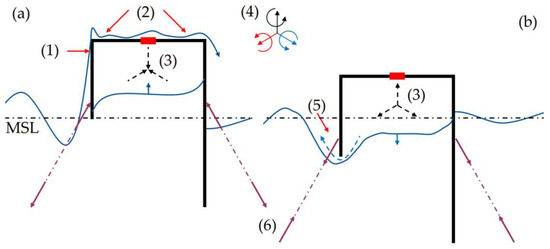
Figure 24.
Illustration of a floating moored OWC WEC interacting with extreme wave events: (a) water entry phase and (b) water exit phase.
- (7)
- Scaling considerations for OWC chamber air dynamics: it is important to acknowledge that air compressibility effects observed in the model-scale experiments are not fully scalable using Froude scaling laws, which are typically valid for gravity-driven free-surface flows. In our tests, the PTO duct was sealed to isolate hydrodynamic effects, which led to measurable air pressure fluctuations, including negative peaks as low as −2406 Pa in the catenary mooring configuration. These results illustrate strong air–water coupling, particularly under wave impacts and chamber drawdown phases. At full scale, however, several factors would influence the chamber pressure dynamics differently, including:
- (i)
- Air volume in the full-scale chamber is proportionally larger, meaning that compressibility effects would be less pronounced, assuming a constant polytropic index.
- (ii)
- The presence of an operational PTO system (e.g., Wells or impulse turbines) would act as a pressure relief mechanism, regulating air pressures and likely reducing the occurrence of extreme negative values.
- (iii)
- The thermal and polytropic behaviour of air (isentropic vs. isothermal compression/expansion) would differ at scale, potentially reducing pressure spikes or aiding damping effects.
While the tested scale models (1:36) provide valuable insight into survivability-related pressure loads, it should be noted that a direct extrapolation of chamber pressures to full scale must be approached with caution. The observed pressure values primarily indicate that under sealed or restrictive airflow conditions, significant pressure-induced structural loads may occur, highlighting the need for careful chamber wall design and PTO tuning at full scale. A detailed numerical or spectral analysis (e.g., CFD coupled with thermodynamic analysis) would be a valuable next step to refine scaling interpretations and evaluate the compressibility effects under realistic operational conditions.
4.5. Hydrodynamic Performance Versus Survivability Characteristics
Figure 25 compares the hydrodynamic performance of the floating moored WEC with the peak mooring tensions discussed in previous sections. The mooring tension data in this figure were extrapolated from the 1:36 scale model and nondimensionalised by the breaking load of a potential full-scale catenary mooring (T*). The catenary moorings used in this analysis (Table 12) were designed by scaling the model-scale chain dry mass per unit length (kg/m) to its full-scale submerged equivalent. A 111 mm Ramnäs Bruk, R3, stud link chain was selected to meet the required submerged mass. To ensure redundancy and enhance the safety factor, three chains per corner were used. To maintain a conservative approach, the analysis of T* was conducted using the chain’s breaking load of 9650 kN.
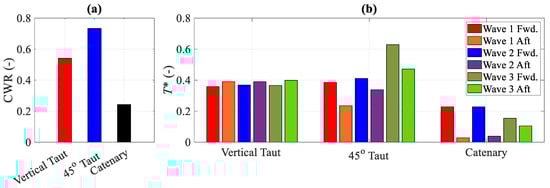
Figure 25.
(a) Capture width ratio in operational sea states, (b) nondimensionalised full-scale maximum mooring tensions (T*) for the three tested waves.
Table 12.
Full-scale equivalent catenary mooring specifications.
Analysing the nondimensionalised mooring tension data (T*) presented in Figure 25, the maximum tension coefficient for the catenary mooring is 22.8% of the breaking load of the selected mooring chains, providing a substantial safety margin. Similarly, the vertical and 45° taut moorings exhibited maximum tension coefficients of 39.9% and 62.9%, respectively.
For operational performance, the 45° taut mooring configuration demonstrated the highest hydrodynamic capture width ratio (CWR) and the largest mooring tensions, whereas the catenary mooring exhibited the lowest CWR and the least mooring tension. This suggests an inverse relationship between the WEC’s hydrodynamic performance and its survivability characteristics, depending on whether a catenary or taut mooring configuration is used.
To provide a more intuitive understanding of the motion behavior, the surge (X*), heave (Z*), and pitch (Ry*) responses are presented in dimensionless form in Table 13, normalised by the incident wave height (Hmax) and wavenumber (k). This approach enables consistent comparison across different wave conditions and mooring configurations.
Table 13.
Dimensionless results of motions.
From the table, it is evident that the vertical-taut mooring system generally results in lower pitch responses (Ry*), particularly in Wave 3, where Ry* is only 0.109 compared to 0.835 for the 45° taut mooring and 1.313 for the catenary mooring. This indicates superior rotational stability under this configuration. Conversely, surge (X*) is consistently higher for the vertical-taut mooring, especially in Wave 2 (X* = 0.943), suggesting a trade-off between horizontal and rotational motion control.
The catenary mooring shows the highest heave responses (Z*), increasing significantly with wave severity—from 0.312 in Wave 1 to 0.492 in Wave 3—highlighting its relative compliance in vertical motion. In contrast, the 45° taut mooring presents a balanced response, with moderate values across all motion types, indicating a compromise between stiffness and flexibility.
The trade-off between energy capture and survivability is particularly evident when comparing the 45° taut and catenary mooring systems. The 45° taut mooring achieves the highest energy performance (CWR = 73.4%), but also subjects the system to the highest mooring tension loads, reaching 62.9% of the breaking load. This raises important questions regarding the viability of this configuration under long-term operational conditions and highlights the need for optimisation strategies. One potential approach to mitigating peak tensions while preserving energy capture is to adjust the pretension or the inclination angles of the mooring lines to reduce the system’s stiffness in critical directions. Reducing horizontal restraint could allow more compliant surge motion, possibly lowering peak loads without significantly impacting OWC resonance conditions.
In contrast, the catenary system, with significantly lower peak tensions (22.8% of breaking load), demonstrates favourable survivability characteristics, but its low energy performance (CWR = 24.3%) makes it less viable for efficient energy extraction. This suggests an opportunity for hybrid mooring strategies—such as taut–catenary combinations—which could potentially blend the energy capture benefits of taut systems with the load-damping properties of catenary lines.
While such optimisation and hybridisation strategies were beyond the scope of this experimental study, the obtained results lay a foundational understanding of how different mooring stiffness profiles influence both energy and survivability performance. Future work should include parametric studies or numerical modelling to explore these design spaces more comprehensively.
Ideally, a successful OWC WEC and mooring system would ensure consistent energy production across a range of oceanic conditions while mitigating risks from severe storms. However, the inverse relationship between operational performance and survivability suggests that developers may need to make strategic trade-offs for economic viability. Based on model testing observations, the following high-level findings and recommendations emerge:
- The significant reduction in hydrodynamic performance when the WEC is floating and moored suggests that minimising all rigid body motions would be necessary to maximise energy production across various conditions. However, this is not a viable offshore solution unless a jacket-like structure is used, which may be feasible in shallow waters.
- A taut mooring system designed to minimise surge motion while enhancing heave motion may be a viable solution. However, such a system must ensure that moorings, anchors, and fairleads can withstand both fatigue loads in operational conditions and extreme loads during severe storms.
- A catenary moored OWC WEC may enhance system survivability at the expense of operational performance, potentially reducing economic returns.
- A hybrid mooring system combining taut mooring with a clump weight and catenary elements may strike a better balance between hydrodynamic performance and survivability.
- While focused wave techniques provide an effective method for evaluating survivability, generating different wave trains (e.g., Waves 1, 2, and 3) is necessary to capture the stochastic nature of extreme wave events.
- While peak mooring tensions have been analysed, fatigue life—critical for long-term mooring durability—has only been briefly addressed. Cyclic loading in operational conditions (e.g., 45° taut moorings) may lead to premature failure, even if peak tensions remain within safety margins.
- Venting the air inside the OWC chamber to the atmosphere (while preventing PTO damage with a valve) may be a potential mitigation strategy to reduce mooring tensions and OWC chamber pressure fluctuations. However, this approach requires additional research to quantify the effect of the water motions inside the OWC chamber. Additionally, quantifying the effect of moonpool damping (rather than PTO damping) may inform full-scale designs.
5. Conclusions
This experimental study assessed the survivability and hydrodynamic performance of a floating moored oscillating water column (OWC) wave energy converter (WEC) under extreme wave conditions. The key conclusions and design implications are summarised below.
An inverse relationship was observed between energy capture efficiency and mooring system survivability:
- 45° taut moorings exhibited the highest capture width ratio (CWR = 73.4%), but also the largest mooring tensions (62.9% of the breaking load), raising survivability concerns.
- Catenary moorings minimised mooring loads (22.8% of the breaking load) but suffered excessive platform motions, significantly reducing energy capture (CWR = 24.3%).
- Vertical-taut moorings balanced performance, achieving moderate energy capture (CWR = 54.1%) with survivable tension loads (39.9% of the breaking load).
These findings highlight the need for mooring system optimisation. Hybrid configurations (e.g., taut moorings with clump weights) warrant further investigation to enhance both resilience and efficiency.
Specific findings relative to extreme wave scenarios and failure mechanisms are as follows:
- Wave-slamming pressures were highest in taut mooring configurations, particularly at the forward wall (SP1), where peak slamming pressures (P* = 2.272) posed structural risks.
- Focused wave troughs (Wave 3) induced severe responses in compliant systems: catenary moorings experienced extreme pitch rotations (31.5°) and chamber breaching, generating large negative pressures (−2406 Pa) and high-frequency tension oscillations (8.695 Hz), while taut systems restricted platform motions but incurred high cyclic loads, increasing fatigue risks (e.g., 130 N forward tensions in the 45° taut mooring configuration, Wave 3).
- Irregular wave groups (Waves 2–3) amplified platform motions and mooring loads beyond single focused waves (Wave 1), emphasising the necessity of stochastic wave testing for survivability assessments.
- OWC chamber dynamics, including piston and sloshing modes, coupled with platform motions, intensifying negative pressures and air escapement. Integrating moonpool damping mechanisms is crucial for motion suppression beyond PTO damping strategies. Air compressibility effects, often neglected in operational tests, significantly influenced survivability by exacerbating chamber breaching and pressure oscillations, necessitating revised scaling methodologies.
Optimising mooring configurations, refining survivability scaling methods, and incorporating stochastic wave testing are essential next steps to enhance the real-world reliability of floating OWC WECs under extreme wave conditions.
Author Contributions
Conceptualisation, E.G., N.A., I.P. and C.C.; methodology, E.G., N.A., I.P. and C.C.; validation, E.G. and N.A.; formal analysis, E.G. and N.A.; investigation, E.G., N.A., I.P. and C.C.; resources, N.A., I.P. and C.C.; data curation, E.G., N.A., I.P. and C.C.; writing—original draft preparation, E.G. and N.A.; writing—review and editing, E.G., N.A., I.P. and C.C.; visualisation, E.G. and N.A.; supervision, N.A., I.P. and C.C.; project administration, E.G. and N.A.; funding acquisition, N.A., I.P. and C.C. All authors have read and agreed to the published version of the manuscript.
Funding
This research was partially funded by the Institute of Marine Engineering, Science and Technology (IMarEST) through the IMarEST Laurie Prandolini Research Fellowship (grant No. 115097).
Data Availability Statement
The experimental data supporting the findings of this study are available upon request (due to the large size of the dataset). Researchers and CFD practitioners interested in accessing the data may contact the authors of this paper.
Acknowledgments
The authors acknowledge the expertise and technical support provided during the experiments by Gregor Macfarlane, Nick Johnson, Kye Curwen, Liam Honeychurch, and Toby Davis, Australian Maritime College (AMC), University of Tasmania, Australia. Irene Penesis and Nagi Abdussamie’s time was supported under the Blue Economy Cooperative Research Centre, established and supported under the Australian Government’s Cooperative Research Centres Program (grant number CRC-20180101). Matthew Folley and Ryan Coe are acknowledged for reviewing the content of this article when examining the primary authors’ PhD thesis. Financial support from the University of Tasmania and the Institute of Marine Engineering, Science and Technology (IMarEST) is acknowledged.
Conflicts of Interest
Author Irene Penesis was employed by the company Blue Economy Cooperative Research Centre-Co. (established as a not-for-profit research and development organisation). The remaining authors declare that the research was conducted in the absence of any commercial or financial relationships that could be construed as a potential conflict of interest.
References
- Barua, A.; Rasel, M.S. Advances and challenges in ocean wave energy harvesting. Sustain. Energy Technol. Assess. 2024, 61, 103599. [Google Scholar] [CrossRef]
- Konispoliatis, D.N.; Mavrakos, A.S. Comparative Analysis of Catenary and TLP Mooring Systems on the Wave Power Efficiency for a Dual-Chamber OWC Wave Energy Converter. Energies 2025, 18, 1473. [Google Scholar] [CrossRef]
- Sheng, W.; Aggidis, G. An Experimental Study of a Conventional Cylindrical Oscillating Water Column Wave Energy Converter: Fixed and Floating Devices. Energies 2025, 18, 500. [Google Scholar] [CrossRef]
- Shahroozi, Z. Survivability control using data-driven approaches and reliability analysis for wave energy converters. In Acta Universitatis Upsaliensis; Uppsala University: Uppsala, Sweden, 2024. [Google Scholar]
- Chen, W.; Xie, W.; Zhang, Y.; Wang, C.; Wang, L.; Huang, L. Improving wave energy conversion performance of a floating BBDB-OWC system by using dual chambers and a novel enhancement plate. Energy Convers. Manag. 2024, 307, 118332. [Google Scholar] [CrossRef]
- Apau, M. Survivability, Environmental, and Regulatory Considerations of Integrating a Wave Energy Converter into an Observational Buoy: An OSU Marine Energy Collegiate Competition Design Case. Bachelor’s Thesis, Oregon State University, Corvallis, OR, USA, 2024. [Google Scholar]
- Gubesch, E.; Abdussamie, N.; Penesis, I.; Chin, C. Physical and numerical modelling of extreme wave conditions. Ocean Eng. 2023, 283, 115055. [Google Scholar] [CrossRef]
- Kisacik, D.; Stratigaki, V.; Wu, M.; Cappietti, L.; Simonetti, I.; Troch, P.; Crespo, A.; Altomare, C.; Domínguez, J.; Hall, M.; et al. Efficiency and survivability of a floating oscillating water column wave energy converter moored to the seabed: An overview of the EsflOWC MaRINET2 database. Water 2020, 12, 992. [Google Scholar] [CrossRef]
- Pecher, A.; Kofoed, J.P. Handbook of Ocean Wave Energy; Springer Nature: Cham, Switzerland, 2017. [Google Scholar]
- Yang, B.; Duan, J.; Chen, Y.; Wu, S.; Li, M.; Cao, P.; Jiang, L. A critical survey of power take-off systems based wave energy converters: Summaries, advances, and perspectives. Ocean Eng. 2024, 298, 117149. [Google Scholar] [CrossRef]
- Wang, H.; Sun, J.; Xi, Z.; Dai, S.; Xing, F.; Xu, M. Recent Progress on Built-in Wave Energy Converters: A Review. J. Mar. Sci. Eng. 2024, 12, 1176. [Google Scholar] [CrossRef]
- Gubesch, E.; Abdussamie, N.; Penesis, I.; Chin, C. Effects of mooring configurations on the hydrodynamic performance of a floating offshore oscillating water column wave energy converter. Renew. Sustain. Energy Rev. 2022, 166, 112643. [Google Scholar] [CrossRef]
- Gubesch, E.; Abdussamie, N.; Penesis, I.; Chin, C. Maximising the hydrodynamic performance of offshore oscillating water column wave energy converters. Appl. Energy 2022, 308, 118304. [Google Scholar] [CrossRef]
- Singh, U.; Abdussamie, N.; Hore, J. Hydrodynamic performance of a floating offshore OWC wave energy converter: An experimental study. Renew. Sustain. Energy Rev. 2020, 117, 109501. [Google Scholar] [CrossRef]
- Wave Swell Energy. Uniwave. 2023. Available online: https://www.waveswell.com/technology/ (accessed on 15 August 2023).
- Ocean Energy. 2024. Available online: http://www.oceanenergy.ie/oetechnology1/platform (accessed on 20 September 2024).
- Gomes, R.; Henriques, J.; Gato, L.; Falcão, A. Hydrodynamic optimization of an axisymmetric floating oscillating water column for wave energy conversion. Renew. Energy 2012, 44, 328–339. [Google Scholar] [CrossRef]
- da Fonseca, F.C.; Gomes, R.; Henriques, J.; Gato, L.; Falcão, A. Model testing of an oscillating water column spar-buoy wave energy converter isolated and in array: Motions and mooring forces. Energy 2016, 112, 1207–1218. [Google Scholar] [CrossRef]
- Giorgi, G.; Gomes, R.P.; Henriques, J.C.; Gato, L.M.; Bracco, G.; Mattiazzo, G. Detecting parametric resonance in a floating oscillating water column device for wave energy conversion: Numerical simulations and validation with physical model tests. Appl. Energy 2020, 276, 115421. [Google Scholar] [CrossRef]
- Gomes, R.; Henriques, J.; Gato, L.; Falcão, A. Time-domain simulation of a slack-moored floating oscillating water column and validation with physical model tests. Renew. Energy 2020, 149, 165–180. [Google Scholar] [CrossRef]
- Gomes, R.P.; Gato, L.M.; Henriques, J.C.; Portillo, J.C.; Howey, B.D.; Collins, K.M.; Hann, M.R.; Greaves, D.M. Compact floating wave energy converters arrays: Mooring loads and survivability through scale physical modelling. Appl. Energy 2020, 280, 115982. [Google Scholar] [CrossRef]
- Oikonomou, C.; Gomes, R.; Gato, L.; Falcão, A. On the dynamics of an array of spar-buoy oscillating water column devices with inter-body mooring connections. Renew. Energy 2020, 148, 309–325. [Google Scholar] [CrossRef]
- Howey, B.; Collins, K.M.; Hann, M.; Iglesias, G.; Gomes, R.P.; Henriques, J.C.; Gato, L.M.; Greaves, D. Compact floating wave energy converter arrays: Inter-device mooring connectivity and performance. Appl. Ocean Res. 2021, 115, 102820. [Google Scholar] [CrossRef]
- Elhanafi, A.; Macfarlane, G.; Fleming, A.; Leong, Z. Experimental and numerical investigations on the hydrodynamic performance of a floating–moored oscillating water column wave energy converter. Appl. Energy 2017, 205, 369–390. [Google Scholar] [CrossRef]
- Elhanafi, A.; Macfarlane, G.; Fleming, A.; Leong, Z. Experimental and numerical investigations on the intact and damage survivability of a floating–moored oscillating water column device. Appl. Ocean Res. 2017, 68, 276–292. [Google Scholar] [CrossRef]
- e Silva, S.R.; Gomes, R.; Lopes, B.; Carrelhas, A.; Gato, L.; Henriques, J.; Gordo, J.; Falcão, A. Model testing of a floating wave energy converter with an internal U-shaped oscillating water column. Energy Convers. Manag. 2021, 240, 114211. [Google Scholar] [CrossRef]
- Elhanafi, A.; Macfarlane, G.; Fleming, A.; Leong, Z. Scaling and air compressibility effects on a three-dimensional offshore stationary OWC wave energy converter. Appl. Energy 2017, 189, 1–20. [Google Scholar] [CrossRef]
- Simonetti, I.; Cappietti, L.; Elsafti, H.; Oumeraci, H. Evaluation of air compressibility effects on the performance of fixed OWC wave energy converters using CFD modelling. Renew. Energy 2018, 119, 741–753. [Google Scholar] [CrossRef]
- Abdussamie, N.; Drobyshevski, Y.; Ojeda, R.; Thomas, G.; Amin, W. Experimental investigation of wave-in-deck impact events on a TLP model. Ocean Eng. 2017, 142, 541–562. [Google Scholar] [CrossRef]
- O’Connor, C.; Mohajernasab, S.; Abdussamie, N. Numerical investigation into water entry problems of a flat plate with air pockets. J. Ocean Eng. Sci. 2023, 8, 386–400. [Google Scholar] [CrossRef]
- Mohajernasab, S.; Drobyshevski, Y.; Abdussamie, N.; Ojeda, R. Experimental investigation into the effects of air pockets on wave-in-deck loads of offshore structures. Mar. Struct. 2023, 90, 103442. [Google Scholar] [CrossRef]
Disclaimer/Publisher’s Note: The statements, opinions and data contained in all publications are solely those of the individual author(s) and contributor(s) and not of MDPI and/or the editor(s). MDPI and/or the editor(s) disclaim responsibility for any injury to people or property resulting from any ideas, methods, instructions or products referred to in the content. |
© 2025 by the authors. Licensee MDPI, Basel, Switzerland. This article is an open access article distributed under the terms and conditions of the Creative Commons Attribution (CC BY) license (https://creativecommons.org/licenses/by/4.0/).