Abstract
This paper addresses issues relating to the temperature stability of impedance infrastructure used for the realization of impedance units and the calibration of measuring instruments. A description of the new infrastructure for impedance metrology recently developed in Poland is provided. We present the results of measurements of temperature coefficients for four-port resistance standards and two-port capacitors used in the permuting capacitor device. We also report the results of stability tests of the recently developed temperature-controlled capacitance set. The results demonstrate excellent temperature stability for the impedance components and serve as an important source of information for selecting environmental conditions during comparisons and routine calibration.
1. Introduction
The importance of impedance component measurements in the power industry is growing year by year. In some applications, precise resistance or impedance measurements are required. One such application is battery energy storage systems (BESS), the number of which is increasing rapidly. The condition of battery systems should be monitored since it affects not only reliable operation but also human safety [1]. One of the most important indicators used to assess battery condition is the State of Health (SOH) indicator. Measuring this indicator usually requires either single-point impedance measurements or the use of electrochemical impedance spectroscopy (EIS) [2,3,4,5]. The contemporary development of primary impedance metrology, including impedance standards of the highest accuracy [6,7], also plays a key role in precise electrochemical measurements, which are essential in modern energy and material technologies. Advances in the design of impedance bridges and reference standards enable increasingly accurate electrochemical measurements, which are crucial for analyzing processes occurring in batteries, fuel cells, and energy storage systems. The rising demand for precision in impedance measurements in modern impedance spectroscopy stems, among other factors, from the need for more detailed modeling of electrochemical processes in batteries and biological systems. In particular, the development of frequency selection methods in the impedance analysis of lithium-ion batteries allows for a more accurate representation of their dynamic characteristics and better prediction of degradation processes.
Therefore, the importance of impedance measurements and the necessary standards for reproducing impedance components is constantly growing worldwide. However, precise measurements require suitable environmental conditions. In the accurate measurement of impedance, temperature is one of the most important factors influencing the results [8]. To eliminate or significantly reduce the uncertainty associated with temperature changes, laboratories undertake the following actions during precise impedance comparisons:
- (1)
- Using standards and measuring equipment with the lowest possible temperature coefficients.
- (2)
- Stabilizing environmental conditions (especially the ambient temperature in the laboratory) to a level where the effect of temperature on the comparison results can be neglected or minimized.
- (3)
- Designing new standards equipped with temperature regulation systems or using air thermostatic chambers specifically dedicated to storing standards during measurement.
Currently, precise measurements of impedance components commonly employ methods that involve a direct comparison of the tested object with a reference standard that has known parameters (e.g., from international comparisons) [9,10,11,12,13,14,15,16,17,18,19]. In recent years, many national metrological institutes have implemented digital impedance comparator bridges based on quantum [16,17,18,19] or non-quantum [12,13,14,20] sources of AC voltage. These circuits are designed to compare impedances of the same (like impedances) or different (unlike impedances) nature. Regardless of the digital source used, the impedance ratio is determined directly based on the known complex voltage ratio. For certain types of comparison, such as L-L comparison using the comparator, as described in the ref. [9], the influence of temperature on the comparison results is mostly compensated. However, this is only possible if the compared standards have similar temperature coefficients; unfortunately, this is not always the case.
In resonant systems, such as those described in refs. [10,11] or in the Maxwell-Wien bridge [21], the inductance is directly compared with the capacitance, and the temperature changes of the standards are summed rather than compensated, as in the aforementioned L-L comparison. In the aforementioned digital impedance comparator bridges, which are very popular today, the influence of temperature depends on the type of impedances being compared. Here, subtraction (for like impedances and R-L and R-C comparisons) or summation (for L-C comparisons) of temperature coefficients can occur. However, due to the significant differences in the temperature coefficients of resistance, capacitance, and inductance standards, the influence of temperature on the comparison result in the ratio comparator bridge must be carefully analyzed.
Due to the aforementioned issues, minimizing the values of the temperature coefficients of impedance standards is extremely important. Furthermore, the knowledge of the temperature coefficients of standards enables the design of an appropriate laboratory room temperature stabilization system or a suitable thermostatic chamber, ensuring that the uncertainty component associated with temperature changes is negligible. Additionally, understanding the temperature coefficients of standards allows for an estimation of the uncertainty component of the comparison related to temperature effects.
The remainder of the paper is outlined as follows: In Section 2, we describe recently developed capacitance standards, resistance standards, and a permuting capacitor. Section 3 focuses on the construction and properties of an air thermostat designed and manufactured for temperature testing of impedance infrastructure. In Section 4, we present and discuss the results of the investigation. The figures shown here illustrate the response of the standards to a 9 °C step in the ambient temperature. Finally, conclusions are drawn in Section 5.
2. New Impedance Calibration Infrastructure Developed in Poland
2.1. Impedance Standards
In 2025, a set of temperature-controlled capacitance standards was manufactured at GUM (Figure 1). The word “manufacture” was deliberately used here to indicate that the set of capacitance standards was made by hand, carefully selecting the appropriate components and materials. The set consists of five capacitance standards with nominal values: 1 nF, 10 nF, 100 nF, 1 μF, and 10 μF. All the standards use SMD 1206 GMR31 series C0G capacitors from Murata, Japan [22], selected from a large batch containing several hundred pieces. The nominal value of the temperature coefficient of the Murata capacitor is 0 ± 30 ppm/°C. The standards were constructed as four-terminal pairs (4TP) [23] and are equipped with MUSA Metrology Grade silver-plated connectors manufactured by Canford, UK. The temperature of the set labeled Z42-2/2025 (GUM, Warsaw, Poland) is regulated using a dedicated system that controls the current driving the heating foil. The design of this set of capacitance standards is similar to that created in 2021 and described in the ref. [24]. However, the current standards are all built from the same type of capacitors, each with a value of 10 nF. This has a positive effect on minimizing the dielectric loss factor. Details about the stages of building the set and the materials used are presented in the ref. [25].
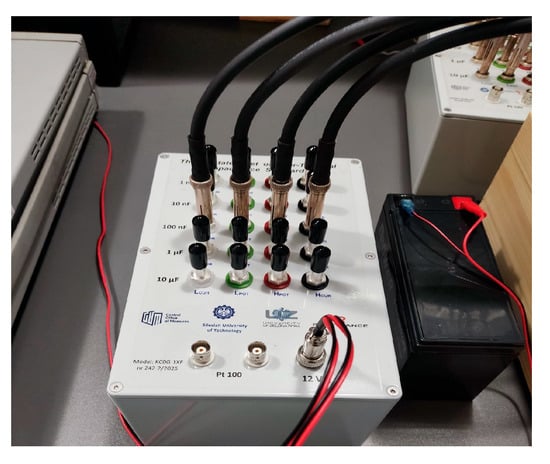
Figure 1.
Image of the C-box Z42-2/2025 developed at GUM.
Moreover, a set of five 4TP resistance standards was manufactured at SUT (Figure 2). The standards have nominal values of: 10 Ω, 100 Ω, 1 kΩ, 10 kΩ, and 100 kΩ. Ultra-high precision four-terminal resistors made by Ohm-Labs (Figure 2a) were used to fabricate these standards. Since the declared temperature coefficient of their resistance (TCR) is below ±1 ppm/°C, there is no need to place them in the thermostatic chamber. Therefore, each of the Ohm-Labs resistors was mounted in a non-thermostatized chrome-plated brass housing, as presented in the lower part of Figure 2b.
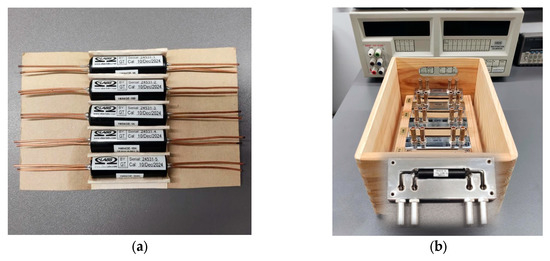
Figure 2.
Resistance standards H484GE developed at SUT: (a) four-terminal precision resistors fabricated by Ohm-Labs (Pittsburgh, PA, USA) and (b) a wooden container with five standard resistors (a 1 kΩ resistor without a top cover is presented in the lower part of the figure).
2.2. Permuting Capacitor Device
In the framework of the project funded under the “Polish Metrology I” program, a precise device operating based on the permuted capacitors method [26] for testing the nonlinearity of digitizers was developed and manufactured at SUT [27]. This device, presented in Figure 3 and hereinafter referred to as the permuted capacitors device (PCD), is characterized by a fully symmetrical design and is made from a solid aluminum block with appropriate holes for the capacitors. In 2024, the PCD was improved by replacing the existing Styroflex capacitors with 10 nF SMD 1206 GMR31 series C0G capacitors from Murata, Japan. The C0G (NP0) dielectric is the most popular formulation of the “temperature-compensating” EIA Class I ceramic materials. The SMD capacitors necessary for the construction of the PCD were carefully selected from a large batch by measuring their values using a precision capacitance bridge AH2700A (Andeen-Hagerling, Cleveland, OH, USA) and choosing a group of 11 items with the most similar capacitance values.
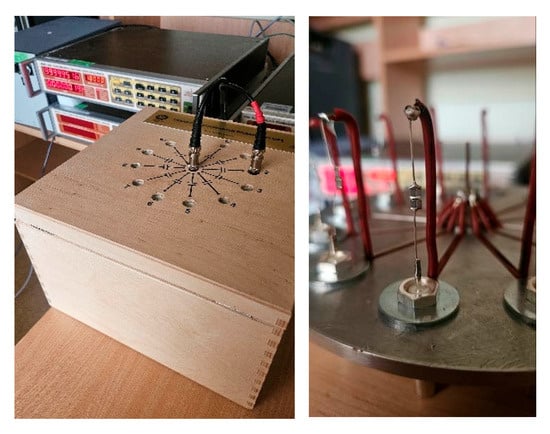
Figure 3.
Permuting capacitor device developed at SUT (10 nF SMD capacitors are visible in the photograph on the right).
Selecting a group of capacitors based on their measured values does not guarantee high accuracy in the voltage ratio realization in the PCD, as the capacitance values may change with temperature fluctuations. The manufacturer states that the nominal temperature coefficient of the capacitors is 0 ± 30 ppm/°C, but this value may vary among individual elements. Therefore, the device was very effectively thermally insulated with a thick five-centimeter layer of extruded polystyrene. Despite this, it is advisable to conduct appropriate temperature tests to assess thermal influences.
3. Thermostatic Chamber
Maintaining a constant temperature during calibration is, in many situations, crucial to ensuring sufficiently low measurement uncertainty. In impedance metrology, this primarily pertains to the calibration of standards with various characteristics (the so-called “unlike impedances”) involving a self-inductance standard. The extremely unfavorable situation of summing temperature coefficients that occurs in L-C comparisons may cause the effect of temperature on the comparison result to exceed even 5 × 10⁻⁵ 1/°C. Therefore, achieving a relative uncertainty in impedance comparison below 3 × 10−⁶ necessitates stabilizing the temperature to within hundredths of a degree. Such a requirement cannot be met by any, even the most advanced, room air conditioning system or commercially available climatic chamber having suitable capacity. Commercially available chambers are usually solutions adapted to perform thermal or climatic tests for which the accuracy of the temperature setting, parameter stability, and homogeneity are not crucial. Often, one of the key parameters is the heating or cooling rate [28]. Such solutions are offered today by many companies around the world. However, only a few manufacturers can provide the stability that is required in the metrology of measurement standards. In these cases, the chamber is usually used not to examine the behavior of details in a specific environment but to maintain strictly defined environmental parameters (especially temperature). One of the few commercial solutions that can be used in national metrology institutes to store standards during calibration is the TK-X CK chamber with a setting resolution of 0.001 °C. Such chambers, having a capacity of hundreds of liters and capable of holding multiple impedance standards, exhibit temperature stability ±0.1 °C and uniformity ±0.5 °C [29]. The only chamber known to the authors with temperature stability ±0.05 °C is K3-90 [29]. However, its volume of 90 L is insufficient to hold several standards or other measuring devices. Consequently, our research team has undertaken the construction of an air thermostatic chamber with stability better than 50 mK and a volume of 150 L.
The primary function of the designed chamber is to stabilize the temperature of the reference standards, which should match the temperature at which they were calibrated. This temperature can be either higher or lower than the ambient temperature. Therefore, in the designed and manufactured thermostatic chamber (Figure 4), the capability to achieve both lower and higher temperatures than the ambient temperature was incorporated. This feature also allows the chamber to be used to determine the temperature coefficient of standards and other measuring equipment. Peltier cells were utilized as temperature control elements, enabling the chamber to be heated or cooled using the same devices. The total power of the cells was estimated to be approximately 1 kW, allowing the chamber to achieve temperatures ranging from 15 to 80 °C. Special attention was given to ensuring continuous air circulation to prevent air stratification inside the thermostatic chamber. With a capacity of 150 L, the chamber can simultaneously accommodate several impedance standards and the most typical measuring instruments used in impedance metrology.
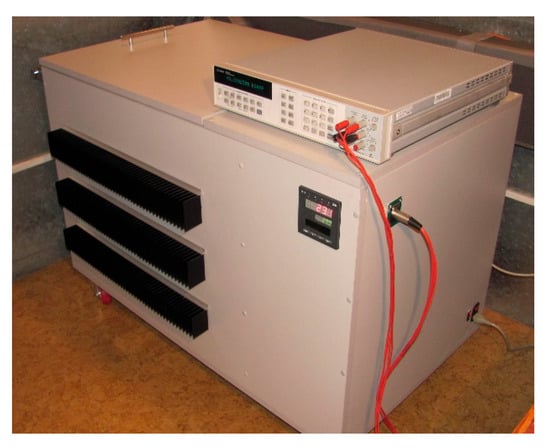
Figure 4.
Thermostatic chamber developed at SUT.
Using the experimental step-response method, the parameters of the dynamic model of the chamber were determined, which are given as follows:
- −
- For heating the thermostatic chamber: time constant T = 153.8 min, delay τ = 7.4 min, and gain k = 0.647 °C/%.
- −
- For cooling the thermostatic chamber: T = 67 min, τ = 3.5 min, and k = 0.075 °C/%.
Using the Ziegler–Nichols method [30] and assuming there are no overshoots in the system, the parameters of the PID controller used to control the thermostatic chamber were calculated as follows:
- −
- For heating: proportional gain kR = 31.04%/°C, integration time constant Ti = 17.5 min, and derivative time constant Td = 2.9 min.
- −
- For cooling: kR = 266.3%/°C, Ti = 7.6 min, and Td = 1.3 min.
After tuning the PID RE19 controller (LUMEL, Zielona Góra, Poland), the control time was examined. This is defined as the time taken from when the thermostat is switched on until the temperature differs from the set point by no more than 0.05 °C. The control time indicates the speed at which the set point is reached within the usable operating range. The test was conducted for a set temperature of 26 °C under nominal operating conditions in the thermostatic chamber, specifically during the comparison of a group of impedance standards located within the chamber (Figure 5). Based on the obtained results, the time to reach the set temperature was recorded as treg = 164 min.
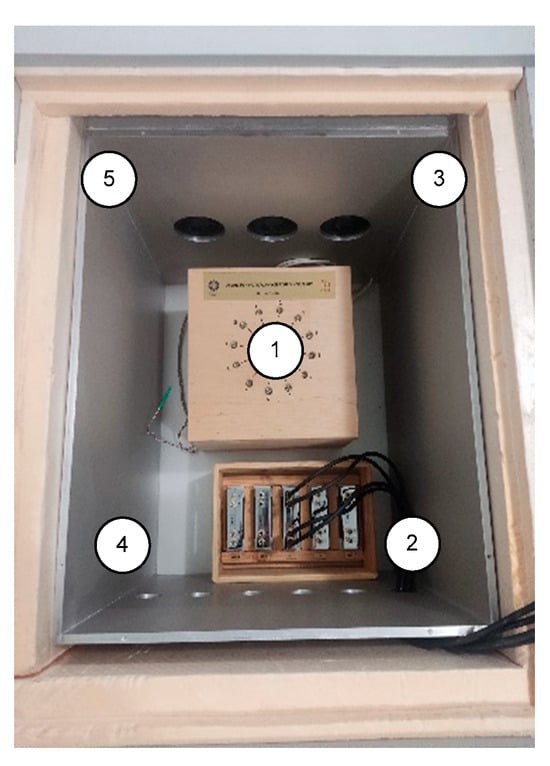
Figure 5.
Photograph of the inside of the thermostatic chamber with PCD and resistance standards placed in the chamber (temperature measurement points are marked 1 to 5).
4. Investigation
4.1. Stability of the Thermostatic Chamber
The stability test of the thermostatic chamber was conducted in the Precision Electrical Measurements Laboratory at SUT. The temperature in the room was not stabilized. The temperature inside the chamber was measured using a Pt100 (TEWA, Lublin, Poland) class A platinum sensor connected via a four-wire configuration to 3458A (Agilent Technologies, Santa Clara, CA, USA), precision multimeter. Several experiments were performed, which involved changing the location of the platinum sensors. This ultimately resulted in placing the regulatory sensors on opposite heating walls, ensuring a sufficiently quick response from the regulation system. Stability tests were conducted at three temperatures, i.e., 20, 23, and 26 °C, at which renowned national metrology institutes (such as PTB, NIST, and INRIM) typically calibrate impedance standards. The measuring sensor was positioned at the central point of the chamber, at half the height of the interior (position 1 in Figure 5). For all tested temperatures, the stability of the thermostatic chamber was better than ±0.03 °C over a twelve-hour observation period. The results obtained at a temperature of 26 °C are shown in Figure 6a.
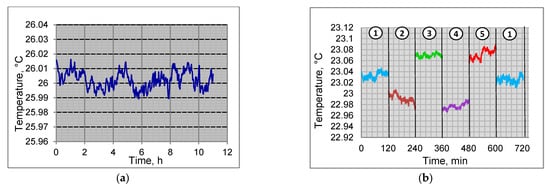
Figure 6.
The results of the chamber’s test: (a) stability test performed at the central point of the chamber and (b) the results of the homogeneity test (numbers 1–5 correspond to the sensor location, as shown in Figure 5).
To examine the homogeneity of the temperature field, we performed an additional test with the temperature set at 23 °C for the five different points in the chamber, as marked in Figure 5. Positions 3 and 5 correspond to the sensors placed in the lower corners, while positions 2 and 4 are located in the upper corners of the chamber. The sensor position changed from 1 to 5 every two hours, and finally, after ten hours, the sensor was relocated to the central point of the chamber (position 1). The results of the homogeneity experiment are shown in Figure 6b. Although temperature stratification is visible, both the stability and homogeneity of the constructed chamber are significantly better than those of commercially available thermal chambers.
The obtained measurement results indicate that the temperature in the thermostatic chamber remains stable at 30 mK over the twelve-hour observation period, with a homogeneity of 0.1 °C. Given that all the impedance standards are typically placed at the same level (usually at the bottom of the chamber) during comparison, the temperature inhomogeneity does not affect the temperature errors of the standards.
The thermostatic chamber presented in this section, in addition to its main function of stabilizing the temperature of standards, can be used to study the effects of temperature on measuring equipment and electronic components. Therefore, its application goes beyond the area of impedance metrology.
4.2. Temperature Dependence of the Standard Resistors and Capacitors
Using the air thermostatic chamber described in Section 3, along with the precision RLC bridge E4980A (Agilent Technologies, Santa Clara, CA, USA) and the precision multimeter Agilent 3458A, temperature tests were conducted on the resistance standards, as described in Section 2.1, as well as on the capacitors used in the permuting capacitor device, as presented in Section 2.2. For this purpose, appropriate software was developed in the LabVIEW environment, which allows for the acquisition and visualization of measurement data from the aforementioned measuring devices at intervals of 5 s. Temperature coefficient tests were carried out within the range of 18 to 27 °C for three measurement points: 18, 22.5, and 27 °C. This range corresponds to the possible temperature settings in laboratories during the calibration of standards. Heating standards beyond this range do not yield useful information and may raise concerns about the standards due to potentially irreversible changes in their structure. The limitation to three measurement points is justified by the very high inertia of the thermostat system and the tested standards. A single measurement usually takes 5–8 h. The measurement system used for the tests is shown in Figure 7. The Agilent 3458A multimeter was employed to measure DC resistance, while the Agilent E4980A RLC bridge was used to measure the capacitance of the permuting capacitor device (PCD). The results of the temperature coefficient measurements for the resistance standards are illustrated in Figure 8, while the results for selected capacitors from the PCD are presented in Figure 9. The results for the two capacitors that exhibited the highest temperature coefficients during the measurements are shown in Figure 9. Error bars were determined based on the scatter of temperature values determined from 50 measurement points obtained at an interval of 5 s.
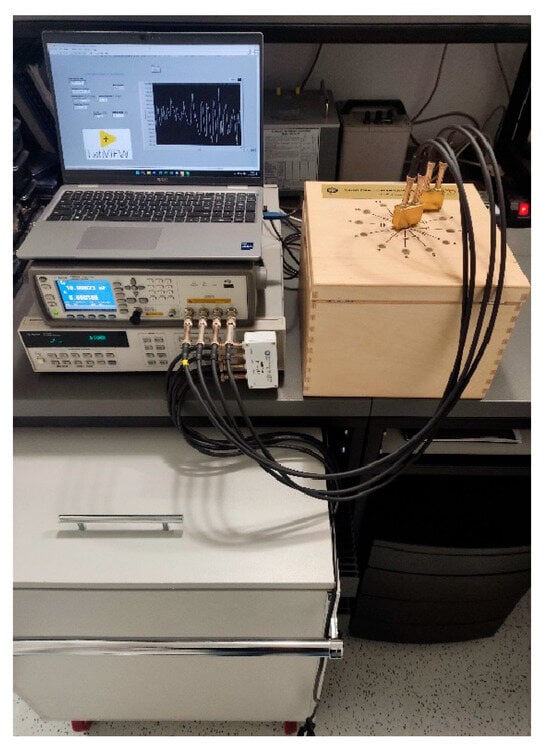
Figure 7.
The setup for the investigation of the temperature dependence (PCD, temporarily out of the chamber, is visible on the right).
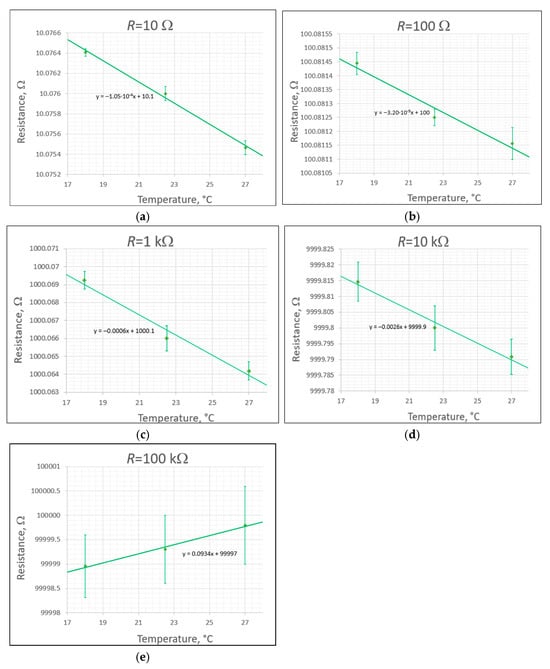
Figure 8.
Temperature dependence of the 4TP standards using Ohm-Lab resistors, (a) for 10 Ω resistor, (b) for 100 Ω resistor, (c) for 1 kΩ resistor, (d) for 10 kΩ resistor, (e) for 100 kΩ resistor.
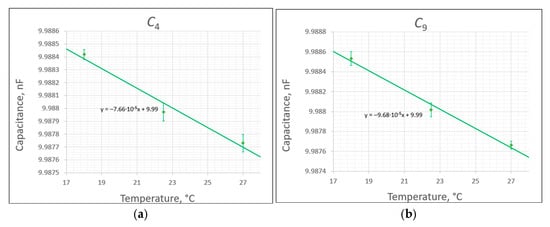
Figure 9.
Temperature dependence of the capacitors C4 (a) and C9 (b) used in PCD.
Temperature coefficients of the resistance standards were calculated according to the following formula:
where:
is the slope of the approximating line for the appropriate resistance standard given in Figure 8.
The results are as follows:
- −
- For R = 10 Ω: TCR= −10.5 ppm/°C.
- −
- For R = 100 Ω: TCR= −0.32 ppm/°C.
- −
- For R = 1 kΩ: TCR = −0.60 ppm/°C.
- −
- For R = 10 kΩ: TCR = −0.26 ppm/°C.
- −
- For R = 100 kΩ: TCR = +0.93 ppm/°C.
It is also worth noting that resistance variation with temperature was minimal due to thermal inertia (the thick brass walls of the housing). This will have a positive impact on the measurement accuracy since the typical time for the impedance standard comparison is several minutes.
Temperature coefficients of the capacitors used in the permuting capacitor device were calculated according to the following formula:
where:
is the slope of the approximating line for the appropriate capacitor given in Figure 9.
The temperature coefficients TCC of the two selected capacitors (worst-case scenarios) are as follows:
- −
- For C4 = 10 nF: TCC = −7.7 ppm/°C.
- −
- For C9 = 10 nF: TCC = −9.7 ppm/°C.
All the capacitors (C1 to C11) are characterized by negative temperature coefficients ranging from −7 to −10 ppm/°C. A high inertia (with a time constant of about 5 h) was observed in the PCD due to its thick aluminum case and effective polystyrene insulation of the permuting capacitor device. The limited dynamics of the permuting capacitor device positively affect the accuracy of the voltage ratio reproduction when using the PCD.
Studies show that the resistance value [31] and capacitance value of standards [32,33,34] can be influenced not only by temperature but also by humidity. For capacitors, this is related to the change in the relative permittivity of the dielectric with the change in humidity. Therefore, the authors of the work decided to investigate the effect of humidity changes on the resistance value of standards and on the capacitance value of the elements used to build PCD. The studies were carried out using a humidity chamber built at the SUT and equipped with temperature sensors and a standard hygrometer (psychrometric probe). The humidity value was changed from 40% to 55%, and changes in resistance and capacitance of the elements were measured using an Agilent E4980A bridge. The results of relative changes in the parameters of standards are presented in Table 1. In the table, the humidity coefficients are defined as ΔX/X·106/ΔRH%, where X = R or C.

Table 1.
Humidity dependence of the resistance standards H484GE and capacitors C4 and C9.
In addition, tests were conducted to evaluate the heating and stability of the temperature-controlled set of the capacitance standard Z42-2/2025 (GUM, Warsaw, Poland). The same measurement system shown in Figure 7 was used for these tests. The set began at the ambient temperature, and at time t = 0, the temperature regulation circuit was activated. The temperature was measured using a four-wire technique with a Pt100 sensor integrated into the capacitance set. A high-precision multimeter, the Agilent 3458A, was used to measure the four-wire resistance of the Pt100 sensor. The measurement results are presented in Figure 10, which indicates the temperature stability of the standard at a level of 0.003 °C.
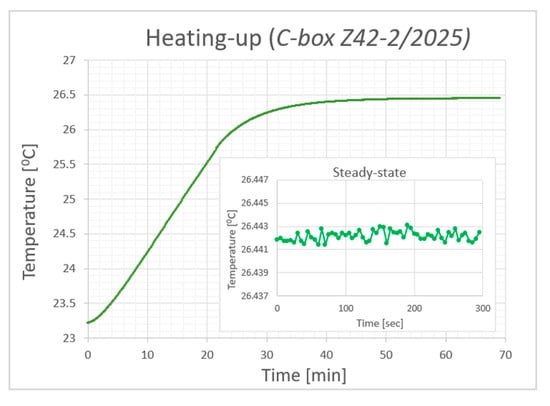
Figure 10.
The results of the stability test for a set of capacitance standards Z42-2/2025.
The results of this test are of great importance to users of standards since they provide information on the time required to reach a steady-state temperature, which is approximately one hour. Moreover, the results of the temperature stability tests explain why there is no need to analyze the temperature coefficients of the capacitors used, even though, in extremely unfavorable cases, they can be as high as 30 ppm/°C.
5. Conclusions
The temperature tests performed provide valuable information for individuals conducting measurements using impedance standards. The obtained values of temperature coefficients allow for the assessment of the impact of temperature changes on the accuracy of impedance standard comparisons. Furthermore, they enable a decision regarding the potential use of an external thermostatic chamber when temperature influences are too significant and unacceptable concerning the desired measurement uncertainty. Accurate knowledge of the temperature coefficients of the impedance infrastructure, along with information on changes in the ambient temperature, allows for the determination of the uncertainty component of the comparison relating to temperature changes.
Temperature tests conducted with a set of temperature-controlled capacitors provide users with information on the necessary stabilization time required to achieve a steady temperature state. The observed low dynamics of changes in the parameters of the described standards make them suitable for use in impedance comparisons. Given that the typical duration of standard comparisons using most digital bridges does not exceed several minutes, the influence of the ambient temperature fluctuations during comparisons can generally be neglected.
Author Contributions
Conceptualization, K.M.; methodology, M.K. (Marian Kampik), R.R., J.K. and M.K. (Mirosław Kozioł); software, K.M.; investigation, K.M., J.K., M.K. (Mirosław Kozioł), M.K. (Maciej Koszarny) and A.Z.; resources, K.M., M.K. (Maciej Koszarny), A.Z., P.Z. and J.J.; data curation, K.M.; writing—original draft preparation, K.M.; writing—review and editing, R.R., J.K., M.K. (Marian Kampik), A.Z., P.Z. and J.J; supervision, M.K. (Marian Kampik), J.K. and R.R.; funding acquisition, R.R. All authors have read and agreed to the published version of the manuscript.
Funding
This research was funded by the Polish Ministry of Science and Higher Education (grant no. PM-II/SP/0067/2024/02) and realized within the framework of the program “Polish Metrology II.”
Data Availability Statement
Measurement results are available on local disks and can be made available following an individual request by an interested person.
Conflicts of Interest
The authors declare no conflict of interest.
Abbreviations
The following abbreviations are used in this manuscript:
| SUT | Silesian University of Technology, Gliwice, Poland |
| GUM | Central Office of Measures, Warsaw, Poland |
| PCD | Permuting capacitor device |
| 4TP | Four-terminal pair, type of terminals |
| TCR | Temperature coefficient of resistance |
References
- Mašláň, S.; He, H.; Bergster, T.; Seitz, S.; Heins, T.P. Interlaboratory comparison of battery impedance analyzers calibration. Measurement 2023, 218, 113176. [Google Scholar] [CrossRef]
- Barsoukov, E.; Macdonald, J.R. Impedance Spectroscopy: Theory, Experiment, and Applications; Wiley: Hoboken, NJ, USA, 2018. [Google Scholar]
- Xiao, Y.; Huang, X.; Meng, J.; Zhang, Y.; Knap, V.; Stroe, D.-I. Electrochemical Impedance Spectroscopy-Based Characterization and Modeling of Lithium-Ion Batteries Based on Frequency Selection. Batteries 2025, 11, 11. [Google Scholar] [CrossRef]
- Kanoun, O. (Ed.) Impedance Spectroscopy/Advanced Applications: Battery Research, Bioimpedance, System Design; Springer: Berlin/Heidelberg, Germany, 2021. [Google Scholar]
- Pandey, L.; Kumar, D.; Parkash, O.; Pandey, S. Analytical Impedance Spectroscopy; CRC Press: Boca Raton, FL, USA, 2024. [Google Scholar]
- Overney, F.; Jeanneret, B. Impedance bridges: From Wheatstone to Josephson. Metrologia 2018, 55, 119–134. [Google Scholar] [CrossRef]
- Ortolano, M.; Marzano, M.; Overney, F.; Eichenberger, A.L.; Kucera, J.; D’Elia, V. An International Trilateral Comparison Among the Newest Generations of Digital and Josephson Impedance Bridges. IEEE Trans. Instrum. Meas. 2025, 74, 1501009. [Google Scholar] [CrossRef]
- Ansari, M.A.; Saxena, A.K.; Krishnan Marg, K.S. Comparison of Temperature Coefficient of Standard Inductor by Measuring Change in Inductance and Resistance. In Proceedings of the Conference of Precision Electromagnetics Measurement, Daejeon, Republic of Korea, 13–18 June 2010. [Google Scholar]
- Musioł, K.; Met, A.; Skubis, T. Automatic Bridge for Comparison of Inductance Standards. Measurement 2010, 43, 1661–1667. [Google Scholar] [CrossRef]
- Cabiati, F.; Bosco, G.C. LC comparison system based on two-phase generator. IEEE Trans. Instr. Meas. 1987, 36, 411–417. [Google Scholar] [CrossRef]
- Muciek, A. A combined transformer bridge for precise comparison of inductance with capacitance. IEEE Trans. Instr. Meas. 1983, 32, 419–423. [Google Scholar] [CrossRef]
- Mašláň, S.; Šíra, M.; Skalická, T.; Bergsten, T. Four-Terminal Pair Digital Sampling Impedance Bridge up to 1 MHz. IEEE Trans. Instr. Meas. 2019, 68, 1860–1869. [Google Scholar] [CrossRef]
- Overney, F.; Jeanneret, B. RLC Bridge Based on an Automated Synchronous Sampling System. IEEE Trans. Instrum. Meas. 2011, 60, 2393–2398. [Google Scholar] [CrossRef]
- Ortolano, M.; Palafox, L.; Kučera, J.; Callegaro, L.; D’Elia, V.; Marzano, M.; Overney, F.; Gülmez, G. An international comparison of phase angle standards between the novel impedance bridges of CMI, INRIM and METAS. Metrologia 2018, 55, 499–512. [Google Scholar] [CrossRef]
- Overney, F.; Flowers-Jacobs, N.E.; Jeanneret, B.; Rufenacht, A.; Fox, A.E.; Dresselhaus, P.D.; Benz, S.P. Dual Josephson impedance bridge: Towards a universal bridge for impedance metrology. Metrologia 2020, 57, 065014. [Google Scholar] [CrossRef] [PubMed]
- Pimsut, Y.; Bauer, S.; Karus, M.; Behr, R.; Kruskopf, M.; Kieler, O.; Palafox, L. Development and implementation of an automated four terminal-pair Josephson impedance bridge. Metrologia 2024, 61, 025007. [Google Scholar] [CrossRef]
- Overney, F.; Flowers-Jacobs, N.E.; Jeanneret, B.; Rufenacht, A.; Fox, A.E.; Underwood, J.M.; Koffman, A.D.; Benz, S.P. Josephson-based full digital bridge for high-accuracy impedance comparison. Metrologia 2016, 53, 1045–1053. [Google Scholar] [CrossRef]
- Bauer, S.; Behr, R.; Hagen, T.; Kieler, O.; Lee, J.; Palafox, L.; Schurr, J. A novel two-terminal-pair pulse-driven Josephson impedance bridge linking a 10 nF capacitance standard to the quantized Hall resistance. Metrologia 2017, 54, 152–160. [Google Scholar] [CrossRef]
- Bauer, S.; Behr, R.; Elmquist, R.E.; Götz, M.; Herick, J.; Kieler, O.; Kruskop, M.; Lee, J.; Palafox, L.; Pimsut, Y. A Four-terminal-pair Josephson impedance bridge combined with a graphene-quantized Hall resistance. Meas. Sci. Technol 2021, 32, 065007. [Google Scholar] [CrossRef]
- Musioł, K.; Kampik, M.; Ziółek, A.; Jursza, J. Experiences with a new sampling-based four-terminal-pair digital impedance bridge. Measurement 2022, 205, 112159. [Google Scholar] [CrossRef]
- Sedlacek, R. A Wide-Range Maxwell-Wien Bridge Utilizing IVD’s and Precision Electronic Circuits. In Proceedings of the IEEE Instrumentation and Measurement Technology Conference, Ottawa, ON, Canada, 17–19 May 2005. [Google Scholar]
- Murata Manufacturing Co., Ltd. Chip Multilayer Ceramic Capacitors for General Purpose, Specification of Murata GRM31C5C1H104JA01#. Available online: https://www.murata.com (accessed on 12 February 2025).
- Kibble, B.P. Four terminal-pair to anything else! In Proceedings of the IEE Colloquium on Interconnections from DC to Microwaves (Ref. No. 1999/019), London, UK, 18 February 1999. [Google Scholar]
- Musioł, K.; Koszarny, M.; Kampik, M.; Kubiczek, K.; Ziółek, A.; Jursza, J. A new impedance metrology infrastructure at GUM. In Proceedings of the 25th IMEKO TC-4 International Symposium on Measurement of Electrical Quantities, Brescia, Italy, 12–14 September 2022. [Google Scholar]
- HZ Series (Z-Foil) with Zero TCR. Vishay Precision Group, Document Number: 63120. Available online: https://www.vishay.com/en/how/onlineliterature/online-libraries/ (accessed on 10 March 2025).
- Cutkosky, R.D.; Shields, J.Q. The precision measurement of transformer ratios. IRE Trans. Instrum. 1960, 9, 243–250. [Google Scholar] [CrossRef]
- Kampik, M.; Kubiczek, K.; Musioł, K.; Zawadzki, P.; Koszarny, M.; Ziółek, A.; Jursza, J. Linearity measurement of digitizers used in sampling-based digital impedance bridges by the method of permuting capacitors. Metrol. Hallmark 2024, 1, 1–9. [Google Scholar]
- Temperature and Humidity Test Chambers Lab1st—Technical Data. Available online: https://www.lab1st.com (accessed on 8 May 2025).
- Temperature Chambers Kambič—Technical Data Sheets. Available online: www.kambicmetrology.com/temperature-chamber/ (accessed on 8 May 2025).
- Meshram, P.M.; Kanojiya, R.G. Tuning of PID controller using Ziegler-Nichols method for speed control of DC motor. In Proceedings of the IEEE-International Conference On Advances In Engineering, Science and Management (ICAESM), Nagapattinam, India, 30–31 March 2012; pp. 117–122. [Google Scholar]
- Oe, T.; Kaneko, N.-H.; Nozato, H.; Suma, H.; Zama, M.; Kumagai, M. Extremely Stable 10 kΩ Metal Foil Resistors in n Ω/Ω Level. IEEE Trans. Instrum. Meas. 2025, 74, 1008007. [Google Scholar] [CrossRef]
- Lee, H.-K.; Kim, D.B.; Kim, W.-S. Effect of Humidity on the Calibration of the Four-Terminal-Pair Air-Dielectric Capacitance Standards. Measurement 2016, 86, 196–201. [Google Scholar] [CrossRef]
- Rietveld, G.; Bauer, A.; Dix, B.; Laegsgaard, E.; van den Brom, H.E. DC and Low-Frequency Humidity Dependence of a 20 pF Air-Gap Capacitor. IEEE Trans. Instrum. Meas. 2009, 58, 1197–1203. [Google Scholar] [CrossRef]
- Cutkosky, R.D.; Lee, L.H. Improved Ten-Picofarad Fused Silica Dielectric Capacitor. J. Res. Natl. Bur. Stand. Sect. C Eng. Instrum. 1965, 69C, 173–179. [Google Scholar] [CrossRef]
Disclaimer/Publisher’s Note: The statements, opinions and data contained in all publications are solely those of the individual author(s) and contributor(s) and not of MDPI and/or the editor(s). MDPI and/or the editor(s) disclaim responsibility for any injury to people or property resulting from any ideas, methods, instructions or products referred to in the content. |
© 2025 by the authors. Licensee MDPI, Basel, Switzerland. This article is an open access article distributed under the terms and conditions of the Creative Commons Attribution (CC BY) license (https://creativecommons.org/licenses/by/4.0/).