1. Introduction
Static stability control is a highly challenging field in power system planning and reliability assessment. In recent years, with the increasing complexity of power system operation planning, the safe and stable operation of the system has become an important concern in the daily operation of modern power systems. Large-scale blackouts that have occurred successively around the world, such as the three major power grid failures in India in 2012, the North American blackout in 2003, and the blackout in Moscow in 2005 [
1], were mainly caused by the severe imbalance of the power supply in the separated system after the operation of the protection devices following the accidents, leading to a drop in system frequency and ultimately resulting in large-scale blackouts. Static instability was the dominant factor in these blackouts, making the research on static stability analysis and the control of large-scale power systems particularly important.
The static stability of power systems can be controlled through measures such as reactive power compensation, transformer tap control, re-dispatching of generation plans, and load shedding [
2]. The authors of [
3] used the method of connecting parallel capacitors to compensate for the insufficient transmission capacity caused by asymmetric faults (single-phase short circuit and two-phase short circuit). The author of [
4] improved the load margin of the power system by applying the decision tree method through series compensation on transmission lines. The author of [
5] proposed a method to enhance the static stability of the power system by re-dispatching generation and shedding loads. When the margin is insufficient, the authors of [
6] proposed a control method considering both economy and effectiveness (such as re-dispatching active power generation and load shedding) to improve the safety and static stability of the power system. The authors of [
7] used the method of orthogonal vectors based on voltage collapse boundaries to increase the static stability limit load margin of the system by adjusting the output of generators. The authors of [
8] proposed an optimal power flow method under voltage stability constraints by using linear static stability indices as static stability constraints to improve the voltage stability of the system. The authors of [
9] used the method of tracking equilibrium points to find the voltage collapse point and calculate the amount of load to be shed to restore the static stability of the power system after a fault. The authors of [
10] used parallel capacitors and adjusted the transformer ratio to improve the static and dynamic voltage stability of the power system.
Line switching is a method that changes the topology of the power grid by disconnecting or connecting transmission lines to optimize the operation of the grid. The authors of [
11] summarized the application of transmission line switching as a corrective measure in the past, provided a mathematical description of the transmission line switching problem, and reviewed the research methods for solving over-limit problems. The authors of [
12] applied line switching to alleviate transmission line overload. The authors of [
13] simulated the grid switching operation by injecting current and combined it with the re-dispatching of generation to reduce network losses through the use of linear programming methods. The authors of [
14] studied the grid switching operation and generator re-dispatch under N − 1 security constraints with the goal of reducing network losses in the power system. Summarizing previous research, people have applied the method of changing the grid topology through line switching to improve voltage distribution in the grid, eliminate transmission line overload, and reduce network losses [
15]. Changes in the grid topology affect node voltages and branch currents, so changing the grid structure can eliminate line overload and voltage violations, voltage collapse in the grid, and increase the system load margin [
16].
The main characteristics that distinguish port microgrids from large land-based power grids are their smaller scale, stronger independence, higher flexibility, and greater emphasis on integration with the specific needs of ports. Port microgrids typically serve specific areas such as docks, storage areas, and ship power supply, and can achieve self-sufficiency, reducing reliance on large land-based power grids. Their energy structure is more diversified, often combining renewable energy sources (such as solar and wind energy) and energy storage systems to address the high energy consumption and fluctuating demands of ports. Additionally, port microgrids need to have higher reliability and rapid response capabilities to support power supply during ship berthing and the emergency handling of unexpected events. The main task of the port power network is to provide power supply for the port area, that is, the port power system should be able to stably provide reliable power supply, meet the power demands of various equipment in the port area, and ensure the normal operation of the port. Reference [
17] established a joint optimization model of a generator unit combination and power grid topology structure under the constraint of ensuring the N − 1 reliability of the power grid. Reference [
18] considered the optimal power grid topology structure under the base state power system and N − 1 faults, with the objective of avoiding line overload in both the base state power system and the power system after N − 1 faults. Reference [
19] pointed out that it is relatively difficult to design a real-time control for nonlinear power systems, so simple control strategies and technologies can be used to achieve the rapid control of the power system.
The switching of power grid lines affects the node voltage and the flow of bus power, thereby changing the load margin of the system [
20]. At the same time, the modification is small in intensity and has good adjustability. Therefore, changing the line opening state can effectively prevent bus voltage from exceeding the limit in the power grid to enhance system stability. Meanwhile, although the switching of lines can change the load margin of the power grid, its effect needs to be calculated. The P-V curve of the system can be obtained through CFPFLOW [
21], and then the load margin of the system can be obtained. For power grid planning, each line opening condition needs to be calculated, and the workload is extremely large.
This paper proposes a new method for identifying and optimizing line switching based on the continuous power flow method, with the following specific work:
- (1)
The system layout and load conditions of the Lagos Port in Nigeria were investigated, and by referring to the actual logic of shore bridge start–stop operations and generator commissioning, a port simulation model that fits the actual situation was established to provide simulation evidence for the new method.
- (2)
The identification and optimization problem of line switching measures was broken down into a three-step process: first, linear sensitivity analysis was used to scan and filter the measures; second, nonlinear fitting was adopted to rank the load margin of the measures; and finally, accurate calculations were performed on the control measures with higher load margin ranks to determine the optimal line switching control measures.
- (3)
By referring to the actual line conditions of the port, relevant numerical experiments were designed to verify the effectiveness and superiority of the proposed method.
This paper is organized as follows.
Section 2 introduces the line switching of a conventional distribution network as a proof of the theoretical feasibility of this paper.
Section 3 presents the derivation process of the theoretical method proposed in this paper and the implementation steps of the method.
Section 4 conducts simulation verification using the real power system ETAP 21.0.1 model of a port, demonstrating the correctness and practicality of the method.
Section 5 is a discussion, and
Section 6 is a summary.
2. Port Distribution Network
Port of LEKKI is an off-grid microgrid, powered by diesel generator sets. The system has a total of six key busbars with twelve lines and is divided into three power consumption areas and one power supply area. There are over 130 distribution lines in total. The specific network layout is shown in
Figure 1. The power supply area includes eight diesel generators of 2080 kw each. Area SS1 is the living power supply area, responsible for the power distribution of various buildings in the port and outdoor facilities such as parking sheds. The load in the area includes lighting, heating, charging points, building electricity, and so on. Area SS2 is the power supply area for cold storage facilities and other supporting facilities. The load in the area includes cold storage, loading and unloading machines, transport machines, and other medium-sized electrical equipment. Area SS3 is the power supply area for quay cranes. The port is equipped with seven quay cranes with a capacity of 1800 kw each as permanent facilities. In addition, it also includes shore power, transportation equipment, dispatch center power, and other loads. The system is powered by two generator stations, the system uses the double bus form, and each area is composed of two interconnected bus bars powered by two generator bus bars to increase system stability. Each generator station has four diesel generators; when one of them fails, it does not affect the power supply. When a generator station fails, the system will automatically cut off the corresponding bus, and then another generator station for power supply. Four generators are sufficient to support off-peak electricity consumption at the port.
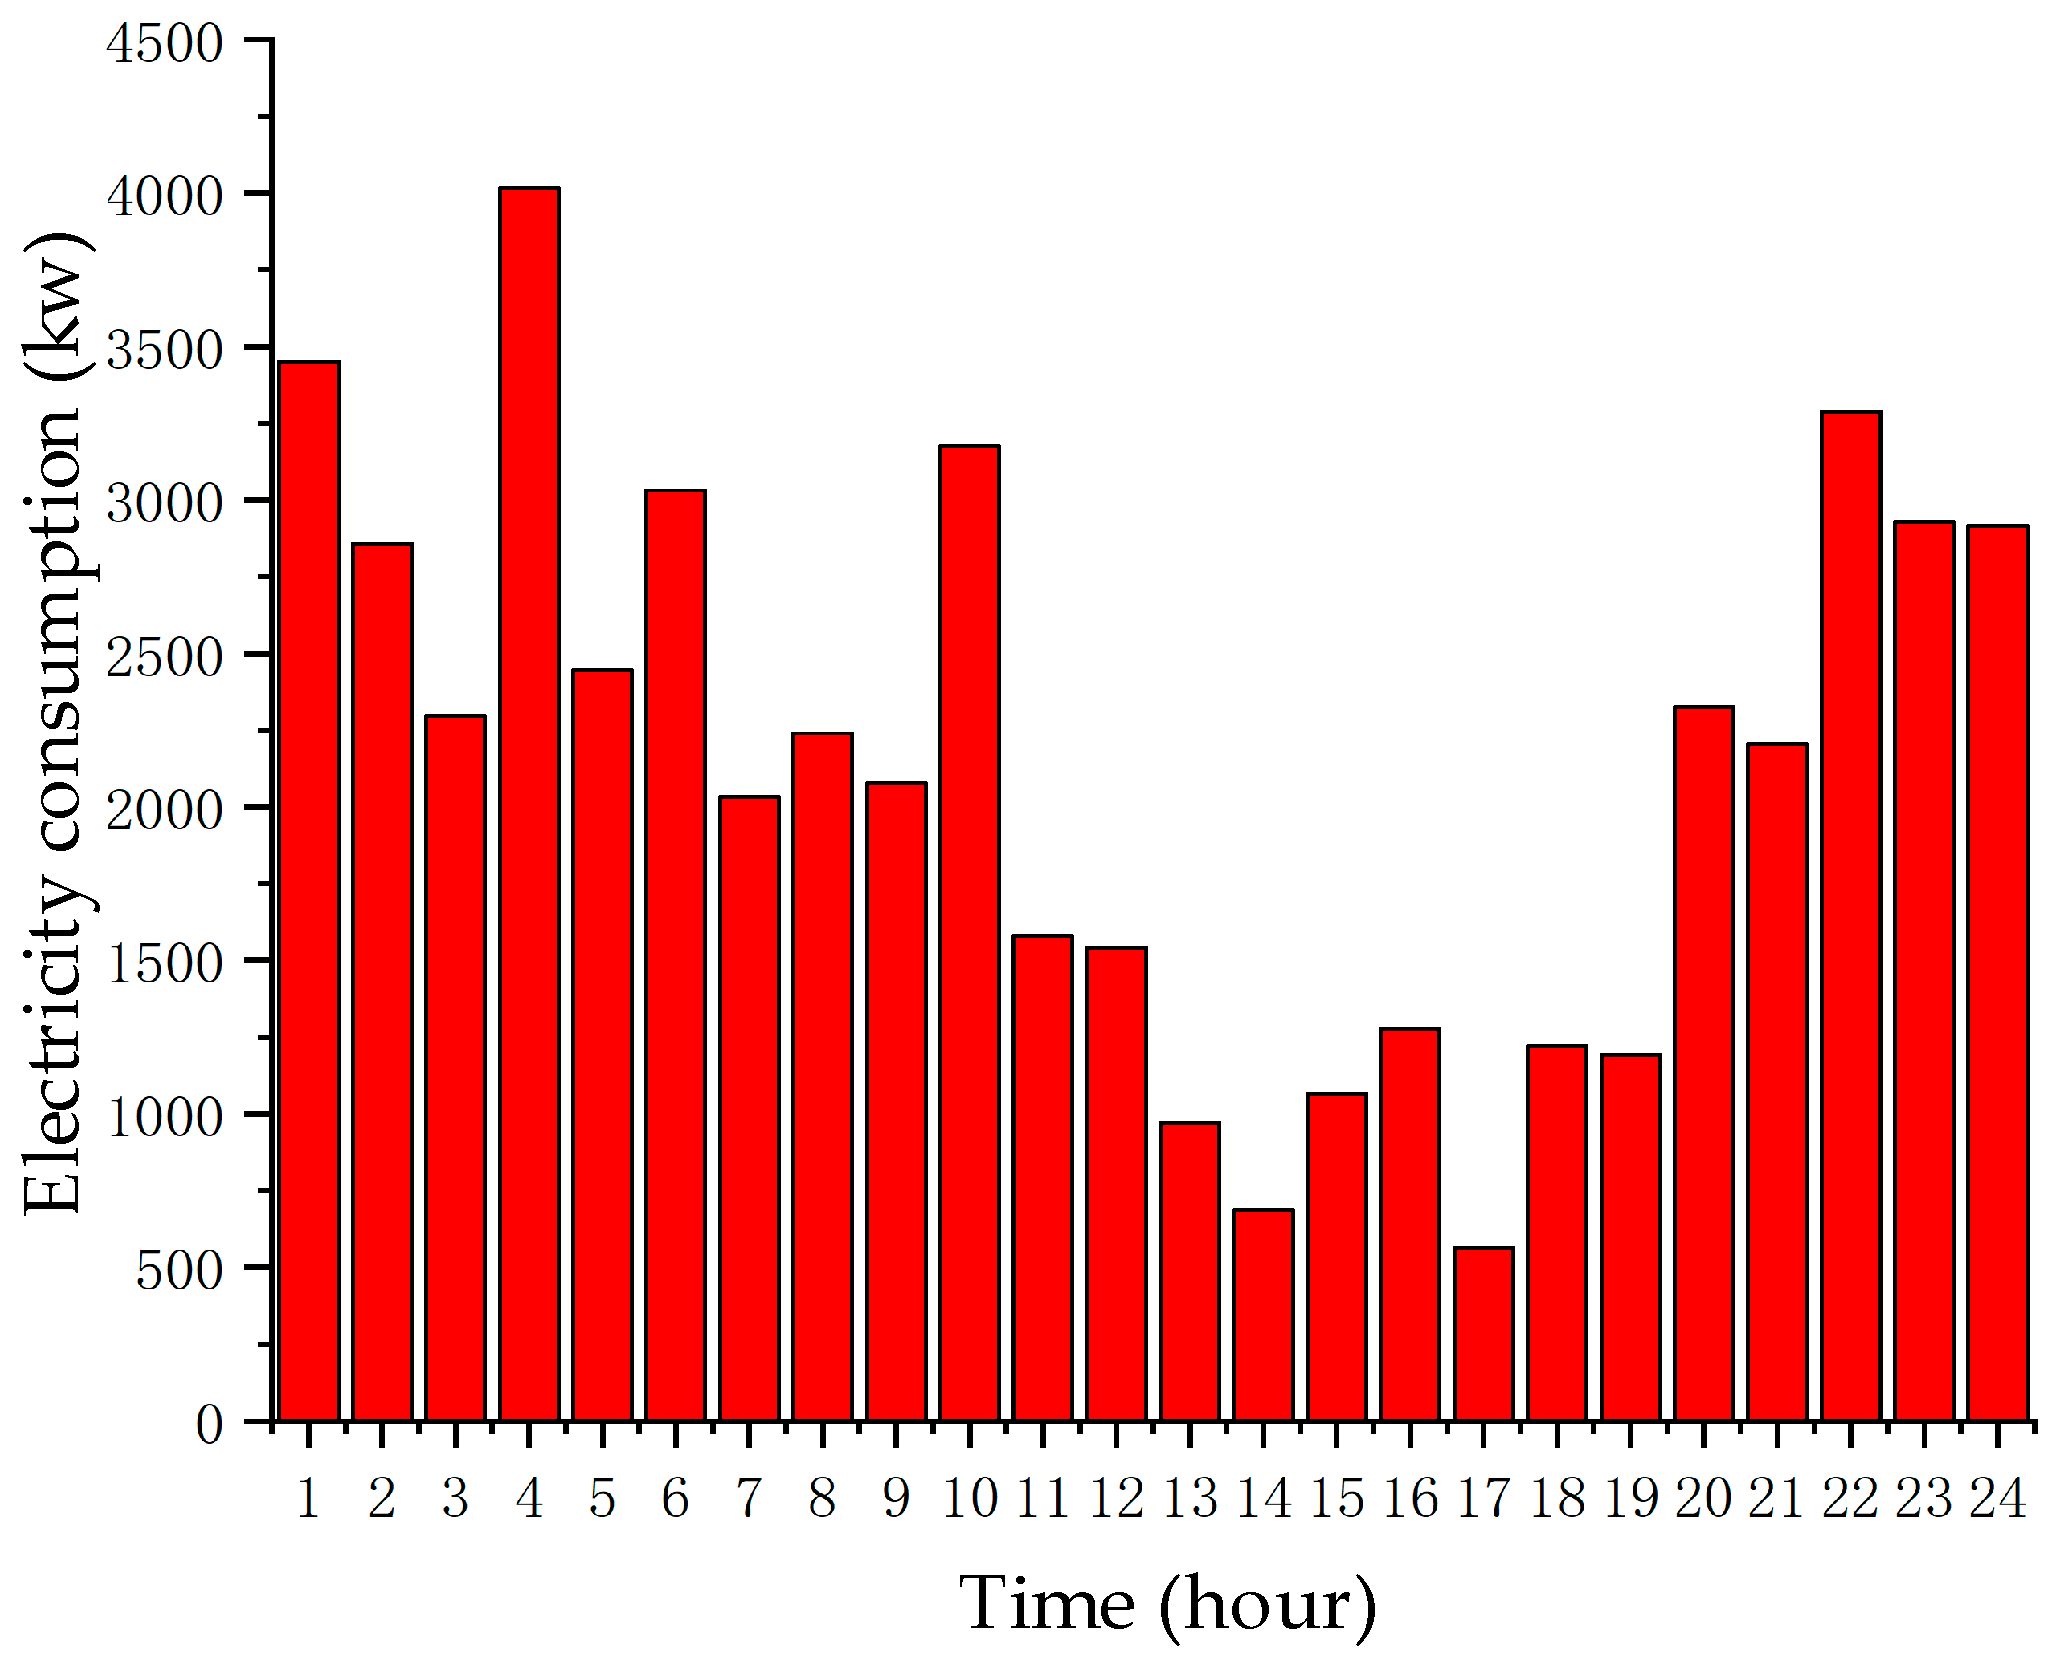
The port bridge is normally idle, and when goods arrive at the port, the shore bridge operation will be started as needed.
Figure 2 shows the real collection of port electricity on a certain day in March 2013.
It can be observed that due to the irregular arrival time of cargo ships, the 24 h power consumption of the port is rather complex and variable. The arrival plans of ships are uncertain, so the power consumption of the port in certain time periods can be significantly higher than in others or lower than the average level. Considering economic factors, diesel generators cannot remain in a constant start-up state. Therefore, to address the power supply issue for quay cranes, the port has designed an automated system for quay cranes and generator sets, which starts the diesel generator sets quantitatively based on the number of quay cranes that need to be started. Under such circumstances, due to the off-grid island operation mode of the port area, the potential static stability risks of the power grid cannot be ignored.
To address this issue, the static stability of the power system can be controlled through measures such as line switching (active power re-dispatch), reactive power compensation, transformer tap control, and generation plan re-dispatch.
In the solution process, the traditional approach of using algorithms like the CPFLOW method to solve the system load margin is as follows: each line switching measure is regarded as an alternative condition. First, obtain the current operating status of the power system, establish the expected power injection change direction of the power system based on the expected load demand and generation plan of the power system, and finally perform continuous power flow calculation to obtain the P-V curve of the system and thereby determine the load margin of the system. This approach yields very accurate results but requires calculations for each condition, which is a huge workload.
Considering the complexity of the system, this paper makes improvements: it incorporates the parameters of the disconnected lines into consideration, further expands the CPFLOW method, and proposes a three-stage method for identifying and optimizing the grid topology for line switching measures. The stages are as follows:
- (1)
Apply linear sensitivity to scan and screen the measures;
- (2)
Use nonlinear fitting to rank the measures;
- (3)
Calculate the top control measures to determine the best line disconnection control measures.
Effect Analysis of Line Switching Measures
Before systematically presenting the grid topology identification and optimization methods proposed in this section, this section first analyzes the impact of the grid topology structure on the load margin of the power system by using the local power system of the port as an example. The port microgrid is off-grid, but there are grid-connected interfaces. Compared with the large land power grid, the port microgrid is self-sufficient, using diesel generators to generate electricity, and the distribution network is small.
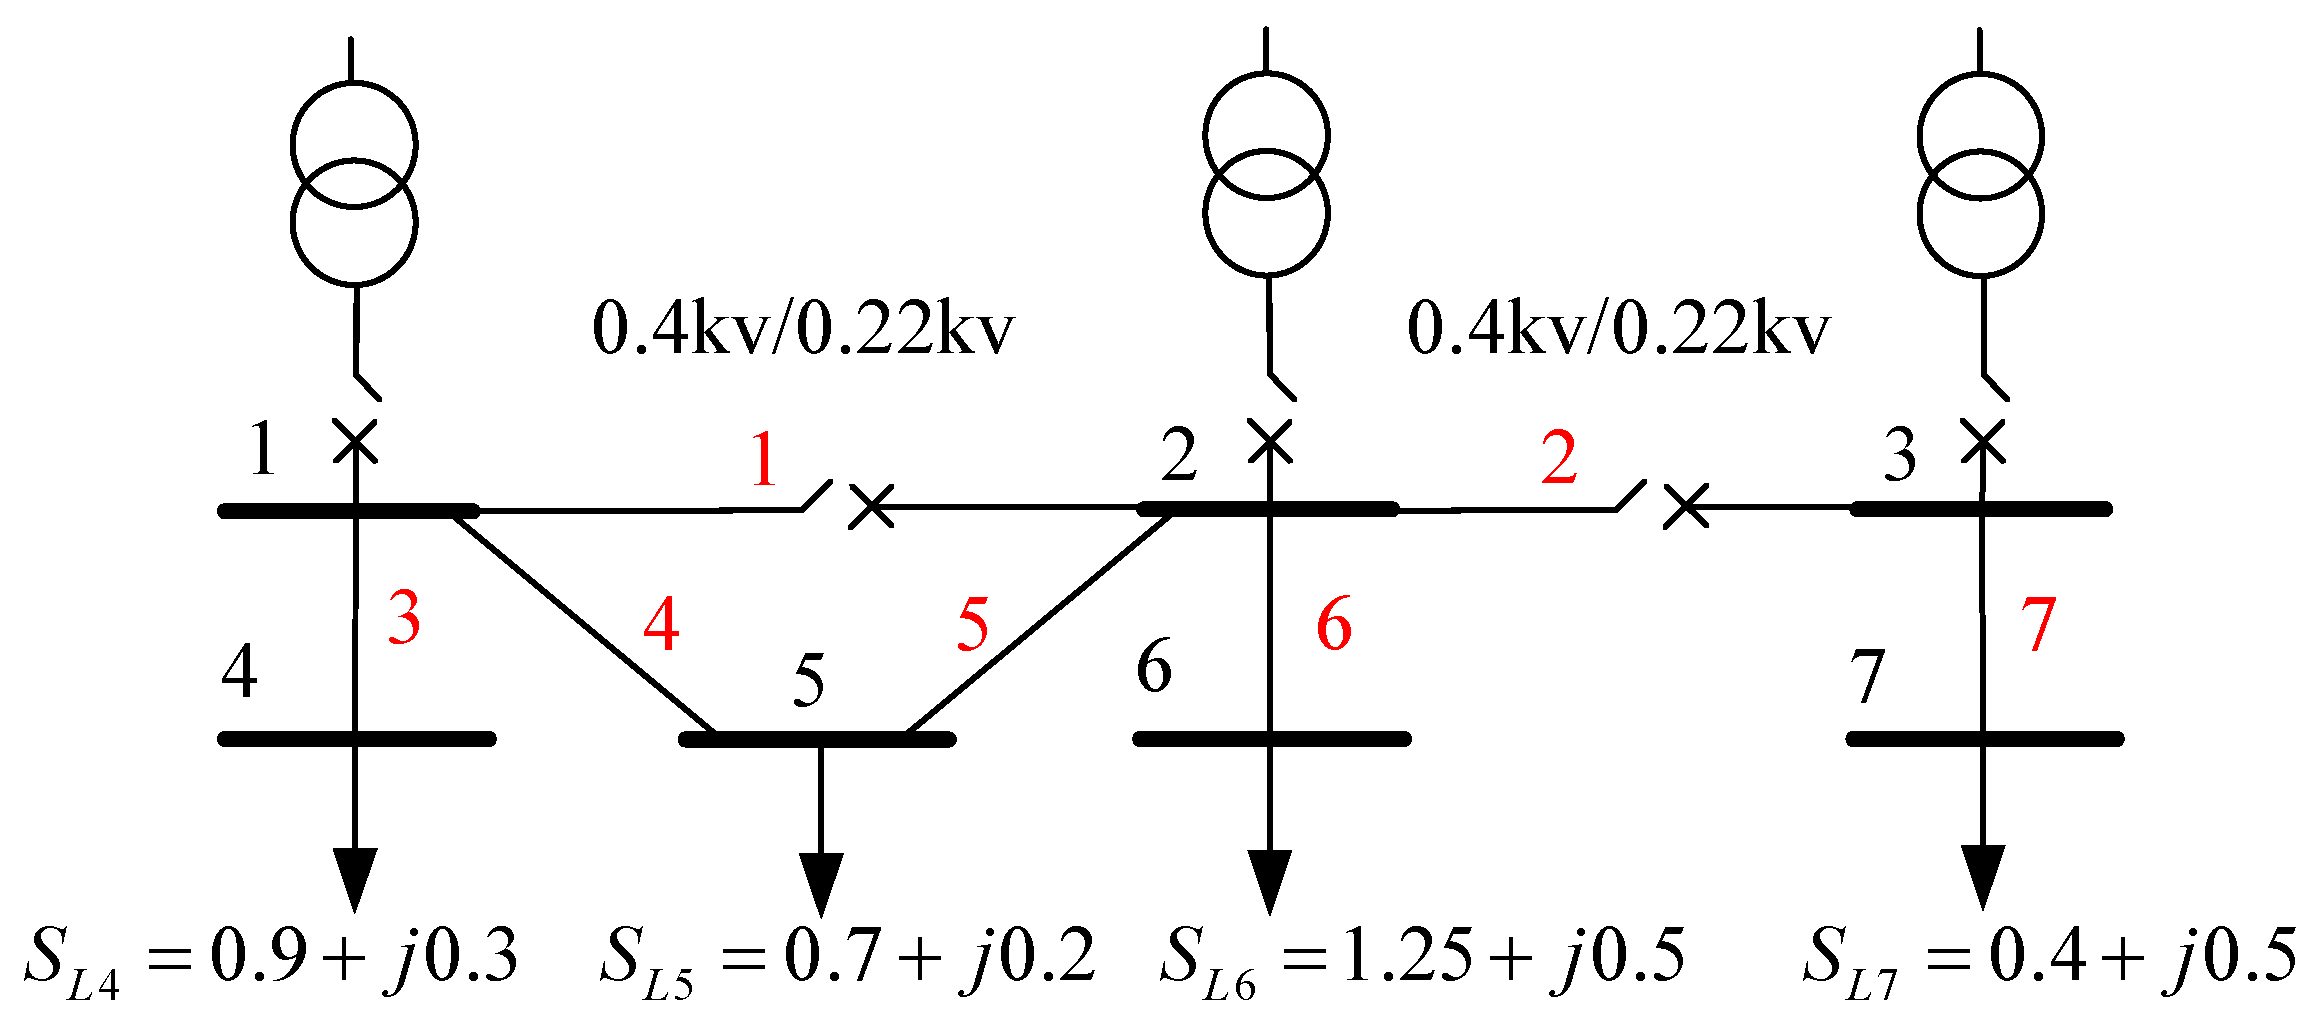
This section uses the distribution system of the port conference room as an example for analysis. The system topology structure and parameters are shown in
Figure 3. The system has four loads, seven nodes, and seven lines. The base case power flow under normal operation conditions is shown in
Table 1. Take bus 6 as the object, and set the upper limit of voltage to 1.05 p.u. and the lower limit to 0.95 p.u.
The data in the
Figure 3 are all per unit values, and the reference value is 1 kw. The line data are shown in
Table 1:
Table 1.
Line parameter data.
Table 1.
Line parameter data.
| No. | Initial Node | End Node | Resistance (p.u.) | Reactance (p.u.) |
|---|
| 1 | 1 | 2 | 0.019 | 0.110 |
| 2 | 2 | 3 | 0.020 | 0.100 |
| 3 | 1 | 4 | 0.039 | 0.170 |
| 4 | 1 | 5 | 0.019 | 0.110 |
| 5 | 5 | 2 | 0.019 | 0.110 |
| 6 | 2 | 6 | 0.032 | 0.161 |
| 7 | 3 | 7 | 0.020 | 0.100 |
The continuous power flow method is used to calculate the load margin of the ground state power system and the power system after line 4 is disconnected; the load margin of the ground state system is 136.67 kw, and the load margin of the power system after line 4 is disconnected is 141.7 kw, which is 5.03 kw higher than that before the line is disconnected.
This research shows that breaking the transmission line may increase the static stability limit load margin of the power system. But each line breaking scheme represents a change, and a large number of schemes bring a large number of calculations. Therefore, a simple and fast method for selecting schemes is crucial.
3. Identification and Optimization Methods for Line Disconnection
3.1. Load Margin Evaluation Method Based on Sensitivity
To efficiently judge the specific impact of each line’s disconnection on the static stability of the power system, this section derives a load margin evaluation method based on sensitivity analysis, which allows for the rapid preliminary screening of line disconnection actions. In the continuous power flow calculation, the parameterized power flow equations can be expressed as follows:
where
x represents the voltage state vector of the system,
λ ∈
R1 is a variable continuous parameter, where
b is the load growth coefficient,
p is the system breaking line parameter,
b ∈
Rn represents the change in actual and reactive power load demand and the change in actual power generation. The Taylor series expansion of Equation (1) at the saddle node bifurcation point (SNB) can be obtained:
where
is the Jacobian matrix of the system at the SNB point, which is itself singular. There is a left eigenvector
ω(x*, λ*) corresponding to the zero eigenvalue of the Jacobian matrix
,
is the partial derivative of the continuous power flow equation with respect to
p, and
is the partial derivative of Equation (1) with respect to
λ.
At the saddle bifurcation point
(x*, λ*), the
of the system is singular and thus satisfies the following:
Multiply the eigenvector corresponding to the zero eigenroot of
at both ends left, and we obtain the following:
Finally, the system sensitivity ∆
λ at SNB is obtained:
The parameter p in the formula is the line conductance, susceptance, and ground accommodation of the disconnected transmission line. ∆p is the negative parameter vector of the broken line. is the partial derivative matrix of all continuous power flow equations with respect to the conductance, susceptance, and susceptance to earth. For a system with n nodes (a total of n1 PQ nodes and n2 PV nodes) and m branches, is a matrix of the order (2n1 + n2) * m.
It can be seen from the continuous power flow equation that if the breaking line is
i-
j, only the active power balance equation and reactive power equation of nodes
i and
j corresponding to the breaking line are directly related to the parameters of the breaking line, so there are only four non-zero elements in matrix
, namely
,
,
and
. The four non-zero elements are as follows:
where
Vi is the voltage value of node
i, ∆
Pi, ∆
Qi, and ∆
Pj; ∆
Qj is the active power and reactive power flowing to nodes
i and
j before and after the line is broken,
P0i,
Q0i and
P0j; and
Q0j is the active power and reactive power flowing to nodes
i and
j before the line is broken.
Gij and
Bij are the real and imaginary parts of the network admittance between node
i and node
j,
δij is the voltage phase angle difference between node
i and
j, Δ
PGi represents the change trend of the generator injection at node
i, and Δ
PLi and Δ
Qli represent the change trend of the load at node
i. Formulas (6)–(9) is derived for the
i-
j parameters of the line, and then the following is obtained:
Among them, pij is the line conductance, susceptance, and ground receptivity of line i-j, pji is the line conductance, susceptance, and ground receptivity of line j-i, gij is the branch conductance of line i-j, bij is the branch susceptance, and bij0 is half of the ground susceptance of line i-j. According to the derivation of Equations (10)–(13), it can be obtained that and of node i are numerically equal to the active power Pij and reactive power Qij flowing from node i to node j. and of node j are numerically equal to the active power Pij and reactive power Qji flowing from node j to node i.
is defined, and the load margin change
caused by the transmission line break between nodes
i and
j is obtained as follows:
where
Pij and
Pji are, respectively, the branch active power flowing between node
i and node
j.
Qij and
Qji are the branch reactive power flowing between nodes
i and
j, respectively.
and
are the elements representing the active and reactive power balance equations of node
i in vector
, and
and
are the elements representing the active and reactive power balance equations of node j in vector
.
The linear sensitivity method is used to scan all alternative breaking lines. If the sensitivity is positive after breaking, the alternative breaking line is retained; otherwise, it is screened.
3.2. Load Margin Calculation Method Based on Look-Ahead Strategy
Through sensitivity analysis, the line tripping conditions are screened to identify those lines that may increase the load margin after being disconnected. Although sensitivity analysis can provide a preliminary qualitative judgment on the candidate lines to be disconnected, it cannot offer a quantitative analysis of the disconnection operation. Therefore, this study instead adopts the look-ahead load margin method to estimate the load margin of the screened lines. This method is based on the assumption that the P-V curve near the saddle-node bifurcation can be approximately regarded as a part of a quadratic curve, thereby enabling the calculation and assessment of the load margin.
Unlike traditional curve fitting methods, the look-ahead load margin calculation technique only uses two power flow solutions ((
Vi,1,
λ1), (
Vi,2,
λ2)) and the derivative of the load margin corresponding to the second power flow solution to estimate the load margin. To improve the fitting accuracy and considering the differences in the P-V curves of each node, the look-ahead technique recommends using the point with the largest change in the load node voltage magnitude among the selected two power flow solution positions as a reference for P-V curve fitting to obtain the estimated load margin. The selection criterion for node
i follows Equation (15):
Substituting the solution into the conic equation, the following is obtained:
Solving Equation (16) yields coefficients
α,
β, and
γ. Therefore, the load margin can be estimated as follows:
If
λ* and
λ2 of the second solution exist, the following is obtained:
Then, the load margin obtained by the look-ahead method is
λ*; if not, this indicates that the second power flow solution is far away from the bifurcation point of the saddle node. It must be regarded as the first power flow solution, and a new power flow solution is selected as the second power flow solution according to Equation (19).
ε is the smaller real number, and μ < 1 is the step control factor.
A new power flow solution
is calculated through prediction and correction:
Among them, Equation (20) is obtained by differentiating the continuous power flow equation f with respect to the state variable x. By substituting Equations (19) and (20) into (21), the predicted solution of the state variable x is obtained. For correction, the predicted solution is used as the starting value, and the power flow solution method is iterated to converge to the corrected solution x2.
The look-ahead nonlinear assessment technology is adopted to conduct a load margin analysis on the disconnected lines retained in the previous stage. Subsequently, based on the analysis results, these lines are prioritized. Then, the continuous power flow algorithm is used to conduct a precise load margin analysis on the disconnected lines ranked higher in the screening, thereby determining the load margin of each disconnected line and re-ranking them.
3.3. Method Flow Introduction
The topology identification and optimization method for port microgrids based on line disconnection proposed in this paper consists of three stages. The required data include the parameters of the current power system and the set of line disconnection schemes. Considering the real changes in the actual engineering environment, the following data are also needed: load growth prediction data and power system generation dispatching plans.
During the systematic traversal and comprehensive scanning of the set of transmission lines to be disconnected, the process meticulously identifies and eliminates any schemes that would result in a reduction in the system’s load margin. Through linear sensitivity analysis, it is possible to identify schemes that may compromise the stability or reliability of the system. This step is essential for maintaining the integrity and robustness of the power grid, as it ensures that only those schemes which do not adversely affect the load margin are considered for further analysis or implementation.
This stage employs a nonlinear look-ahead strategy, which leverages computational techniques to analyze the load margin of the schemes that were initially screened in stage 1. Based on the comprehensive analysis results, the schemes are meticulously ranked according to their performance metrics, such as stability, efficiency, and risk mitigation. Ultimately, only the top 10% of the highest-performing schemes, which demonstrate the most favorable load margins and operational resilience, are advanced to the next stage for further evaluation and implementation. This rigorous selection process ensures that only the most optimal and reliable solutions progress, enhancing the overall system performance and minimizing potential risks.
The CPFLOW method is used to precisely calculate the load margin of the top-ranked schemes from stage 2, and they are re-ranked. Finally, multiple optimal solutions for the disconnection of lines are obtained.
It is clear that the sensitivities-based screening will result in favorable schemes; the nonlinear look-ahead strategy will initially rank them, and the top 10% of them will be adopted and accurately ranked using the continuous flow method.
4. Method Effect Simulation Analysis
4.1. IEEE 118-Bus System
The IEEE 118 system has one-hundred and eighty-six branches, including nine transformer branches. Node 69 is a balanced node. In the test, the upper and lower limits of the voltage of each node are set to 1.05 p.u. and 0.95 p.u. The total system load is 4242 MW and 1438 Mvar.
By applying the method proposed in this paper, the outputs of each stage are as follows:
- (1)
stage 1: The sensitivity of 118 candidate lines to be disconnected is positive, and those with negative sensitivity are eliminated.
- (2)
stage 2: The 118 candidate lines to be disconnected are ranked based on the load margin estimated by the look-ahead method, and the top 10 lines are sent to stage 3 for detailed assessment.
Table 2 presents the static stability limit load margin and ranking given by the look-ahead method and those calculated by the CPFLOW method.
49–66 1 and 49–66 2 represent the connection lines between node 49 and node 66. According to the simulation results, the following conclusions can be obtained:
- (1)
After opening line 40–41, the load margin of the system increases to 22.391. The system load margin after breaking increased by 7.03%.
- (2)
The load margin and ranking of the breaking line given by the look-ahead method are close to the accurate load margin and ranking given by the CPFLOW method, which once again confirms the accuracy of the look-ahead method.
Figure 4 shows the comparison between the proposed method and the traditional continuous power flow method. It can be seen that the load margin and ranking of the opening line given by the three-stage method are close to the load margin and ranking given by the accurate CPFLOW method, but the calculation time is shortened by more than 50%.
4.2. Engineering Application: LEKKI
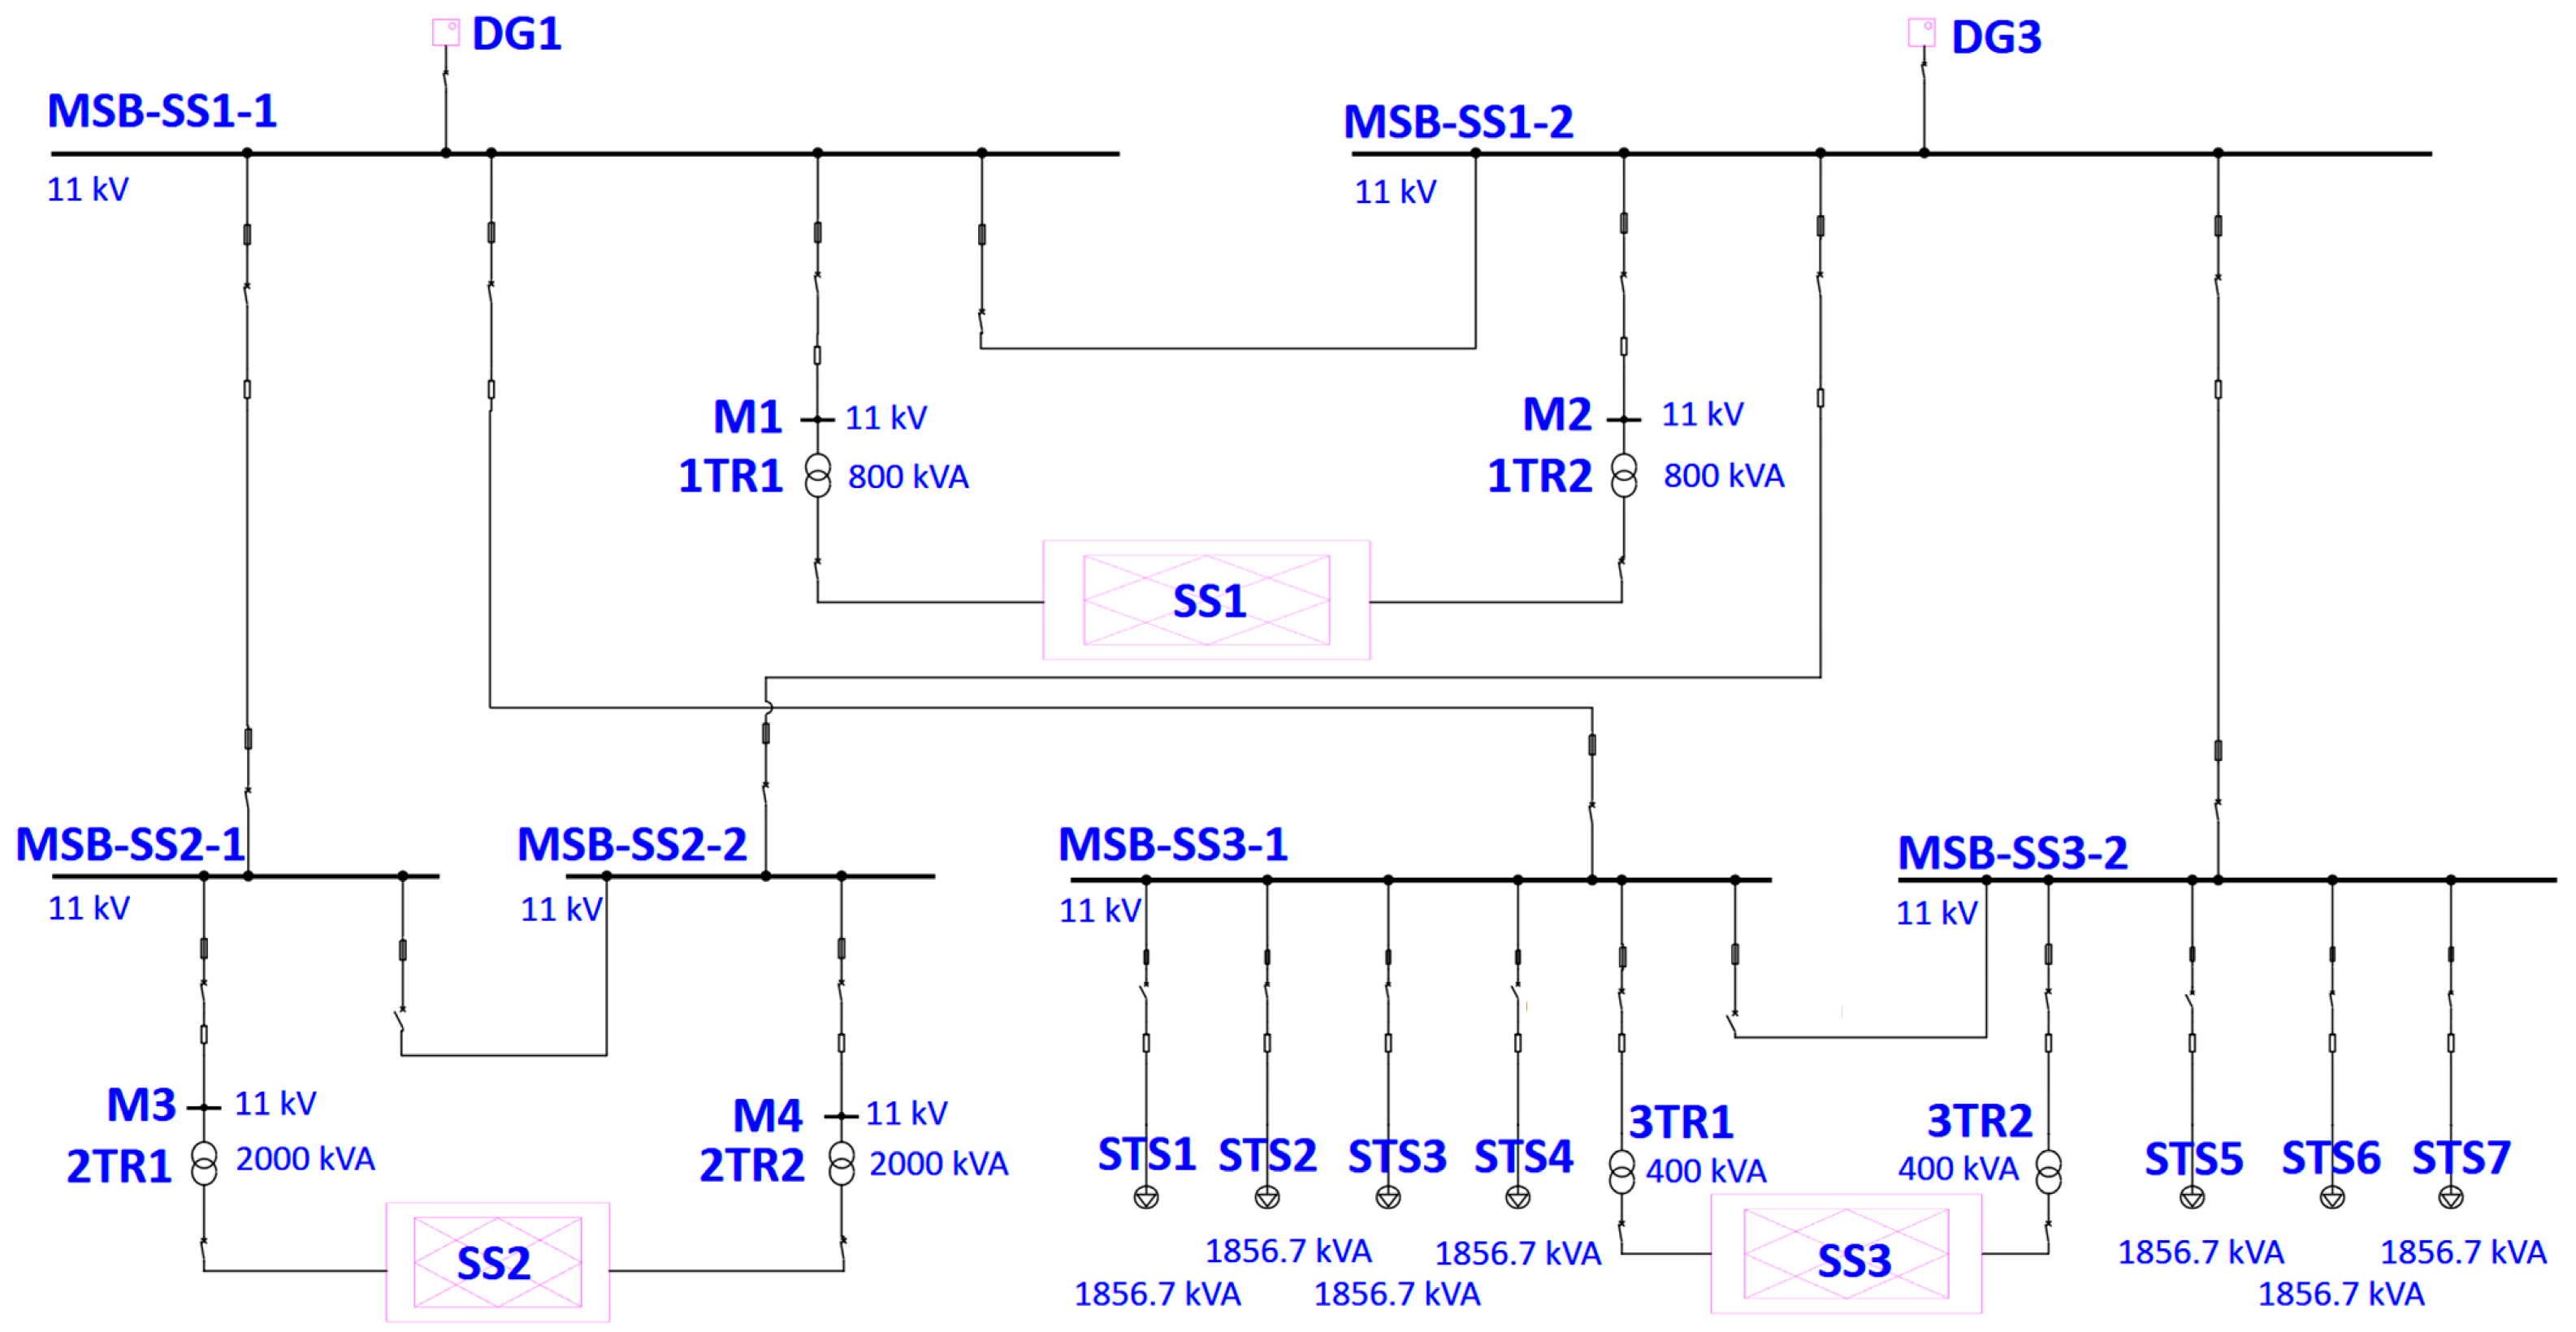
This paper uses the power system simulation software ETAP 21.0.1 to establish a simulation model of the port distribution system. Based on the actual layout and equipment conditions of the LEKKI Port in Nigeria, the simulation model is built through component modeling and data entry.
Figure 5 shows the built port simulation model. According to the problem studied, the simulation model makes the following assumptions:
- (1)
The model includes eight diesel generators, and when calculating the load margin, an average of four are put into operation according to the actual situation;
- (2)
The model includes seven quay cranes, and when calculating the load margin, an average of four are put into operation according to the actual situation;
- (3)
Small-scale local distribution networks with minimal impact on the system are equivalently replaced by load models;
- (4)
The load model of the load is consistent with the port design plan;
- (5)
The line numbers are marked from left to right and top to bottom, and are divided into zones.
The proposed line switching screening method and the traditional CFPFLOW method, respectively, are applied to analyze the power system of the SS3 wharf in the port area, and the results are as follows:
- (1)
After stage 1, the schemes with negative sensitivity were removed, and finally, 58 schemes with positive sensitivity were obtained.
- (2)
According to the load margin of each operating condition estimated by the method in stage 2, the schemes were ranked, and the top five were considered as the optimal solutions.
- (3)
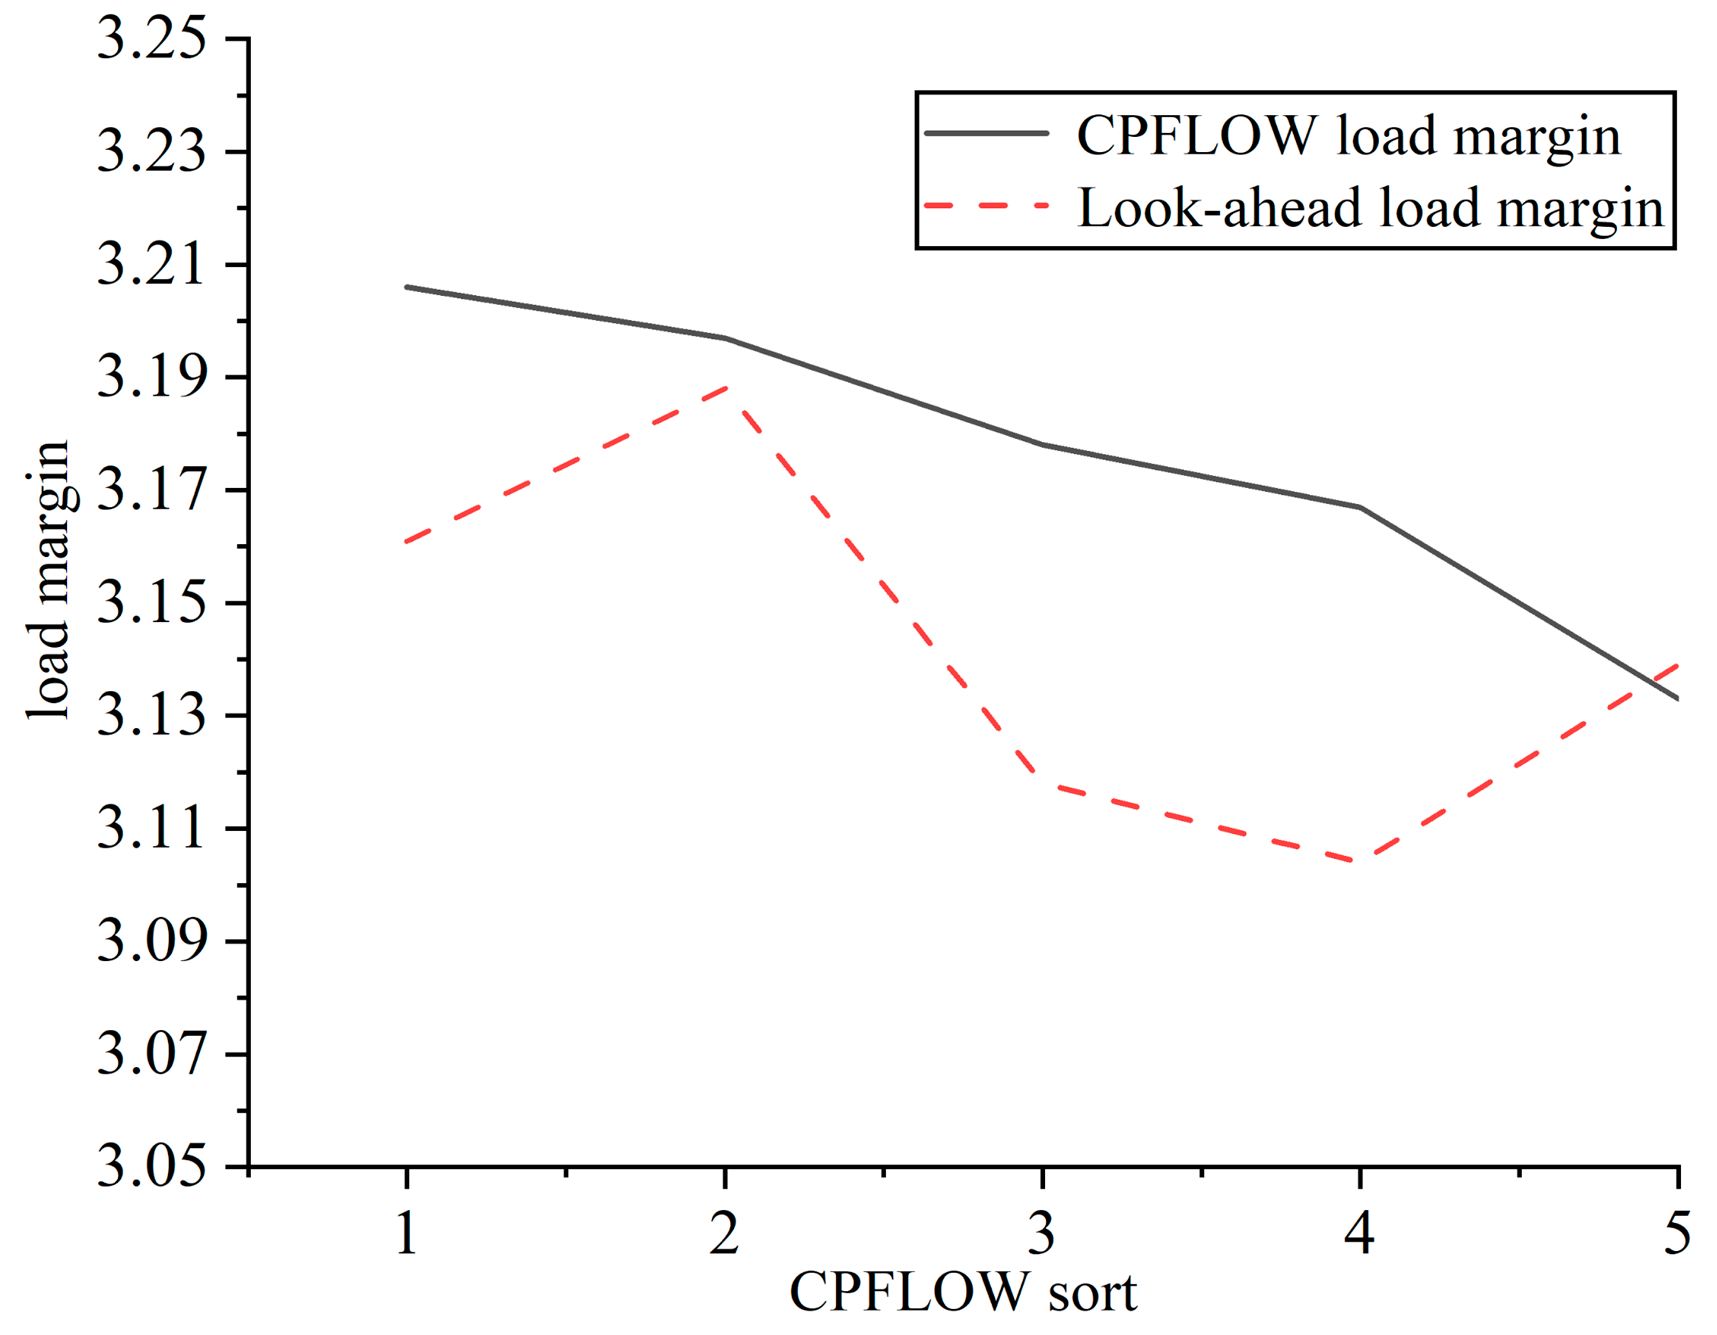
After the precise calculation of all schemes using the CPFLOW method, the load margins and rankings of the five schemes in stage 2 were extracted and compared with the results of step 2 to judge the rationality of the method.
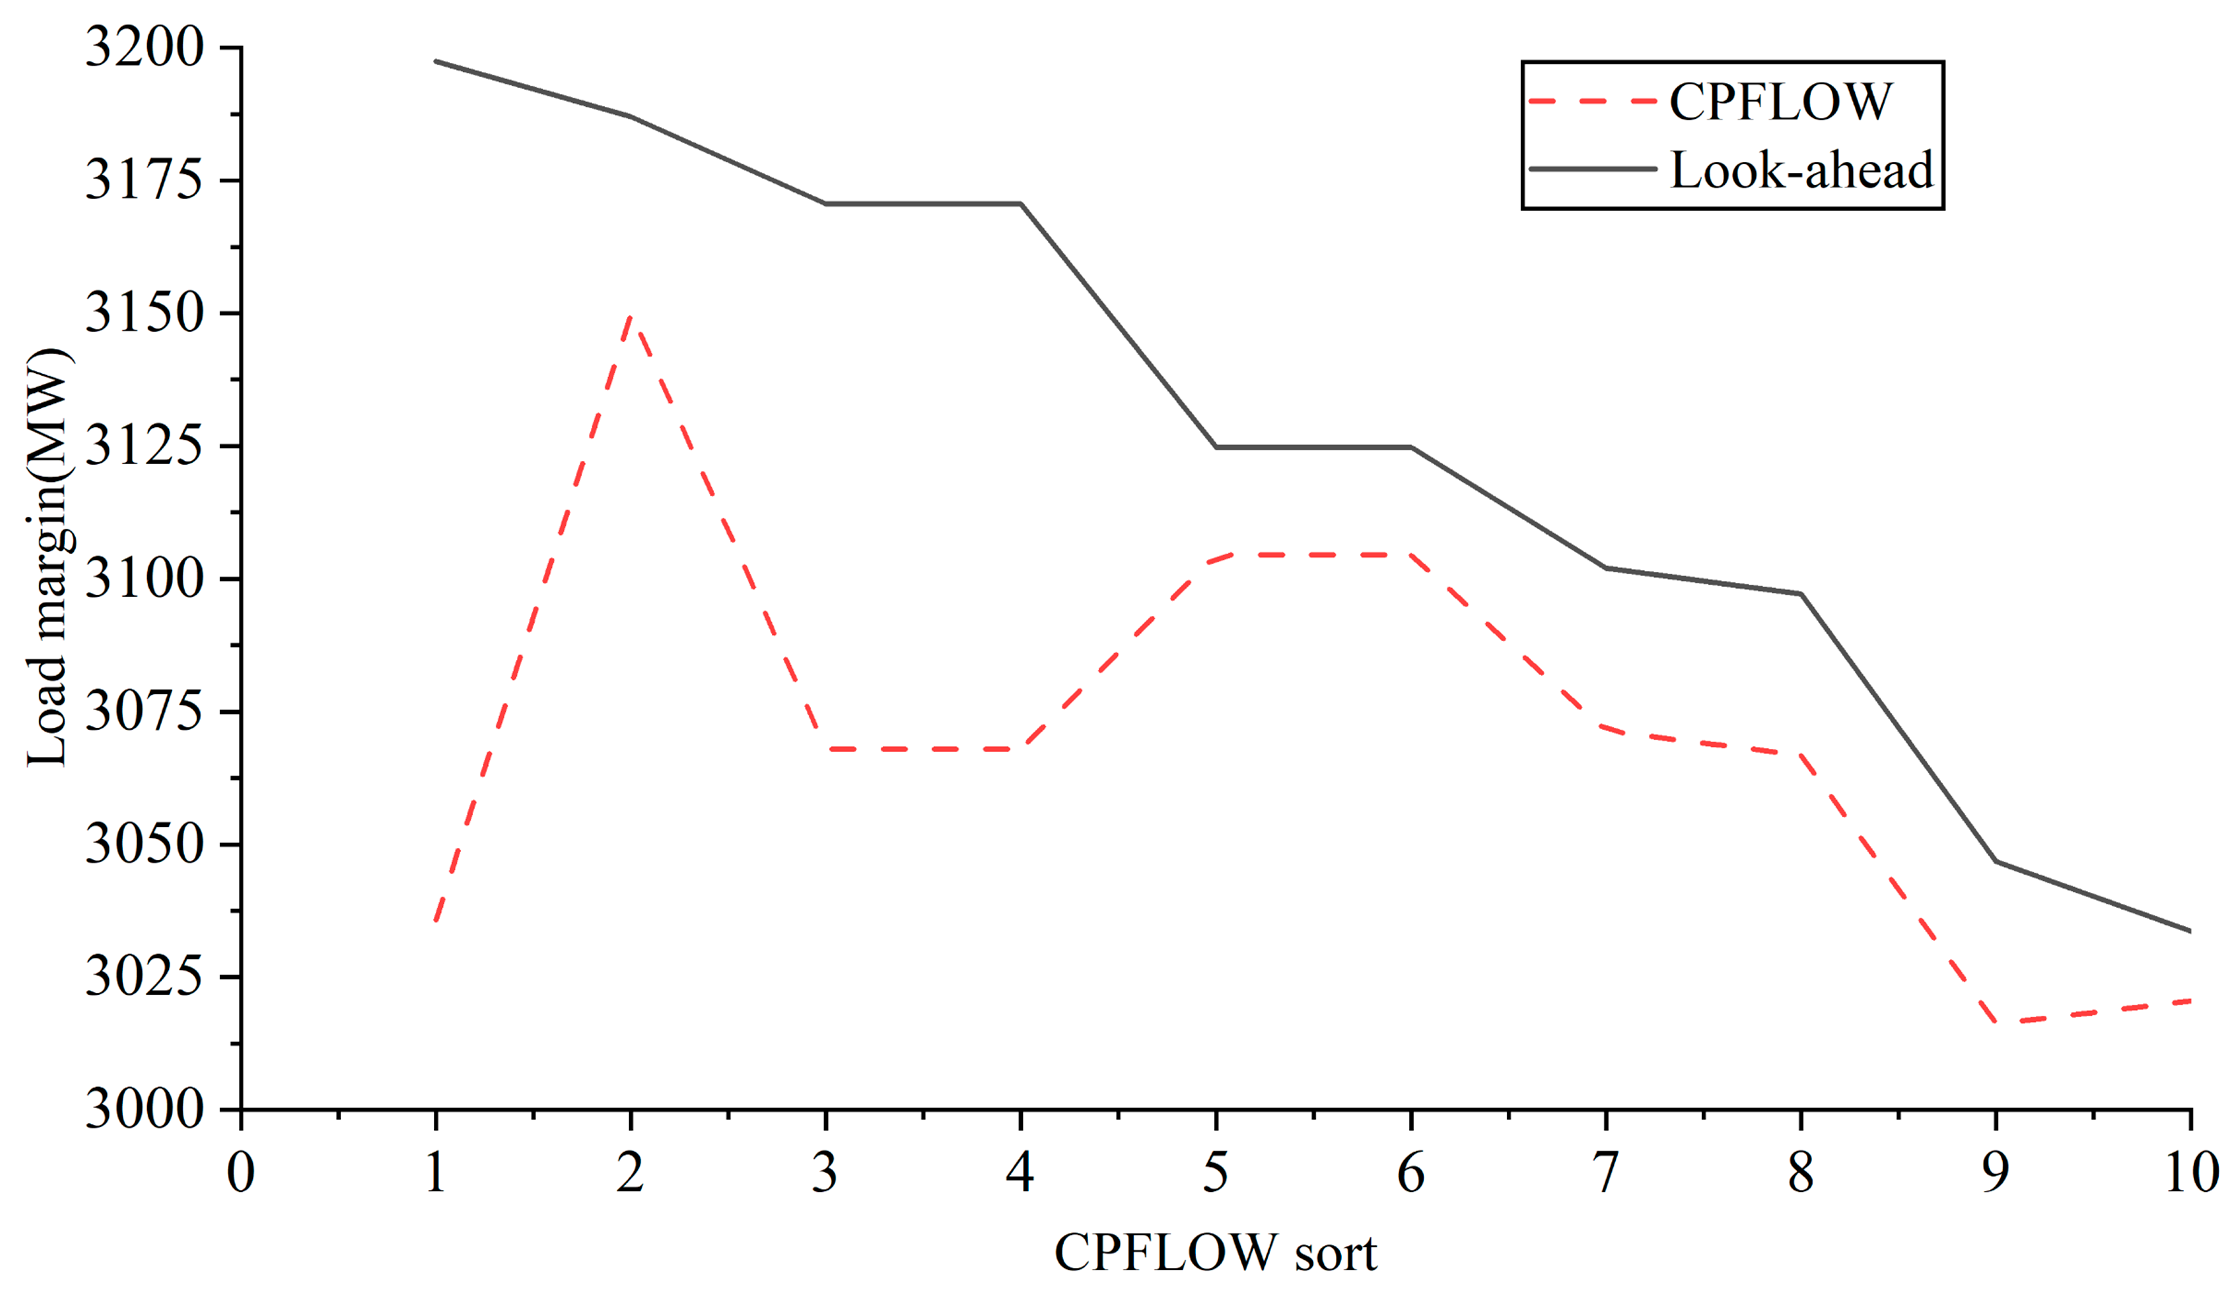
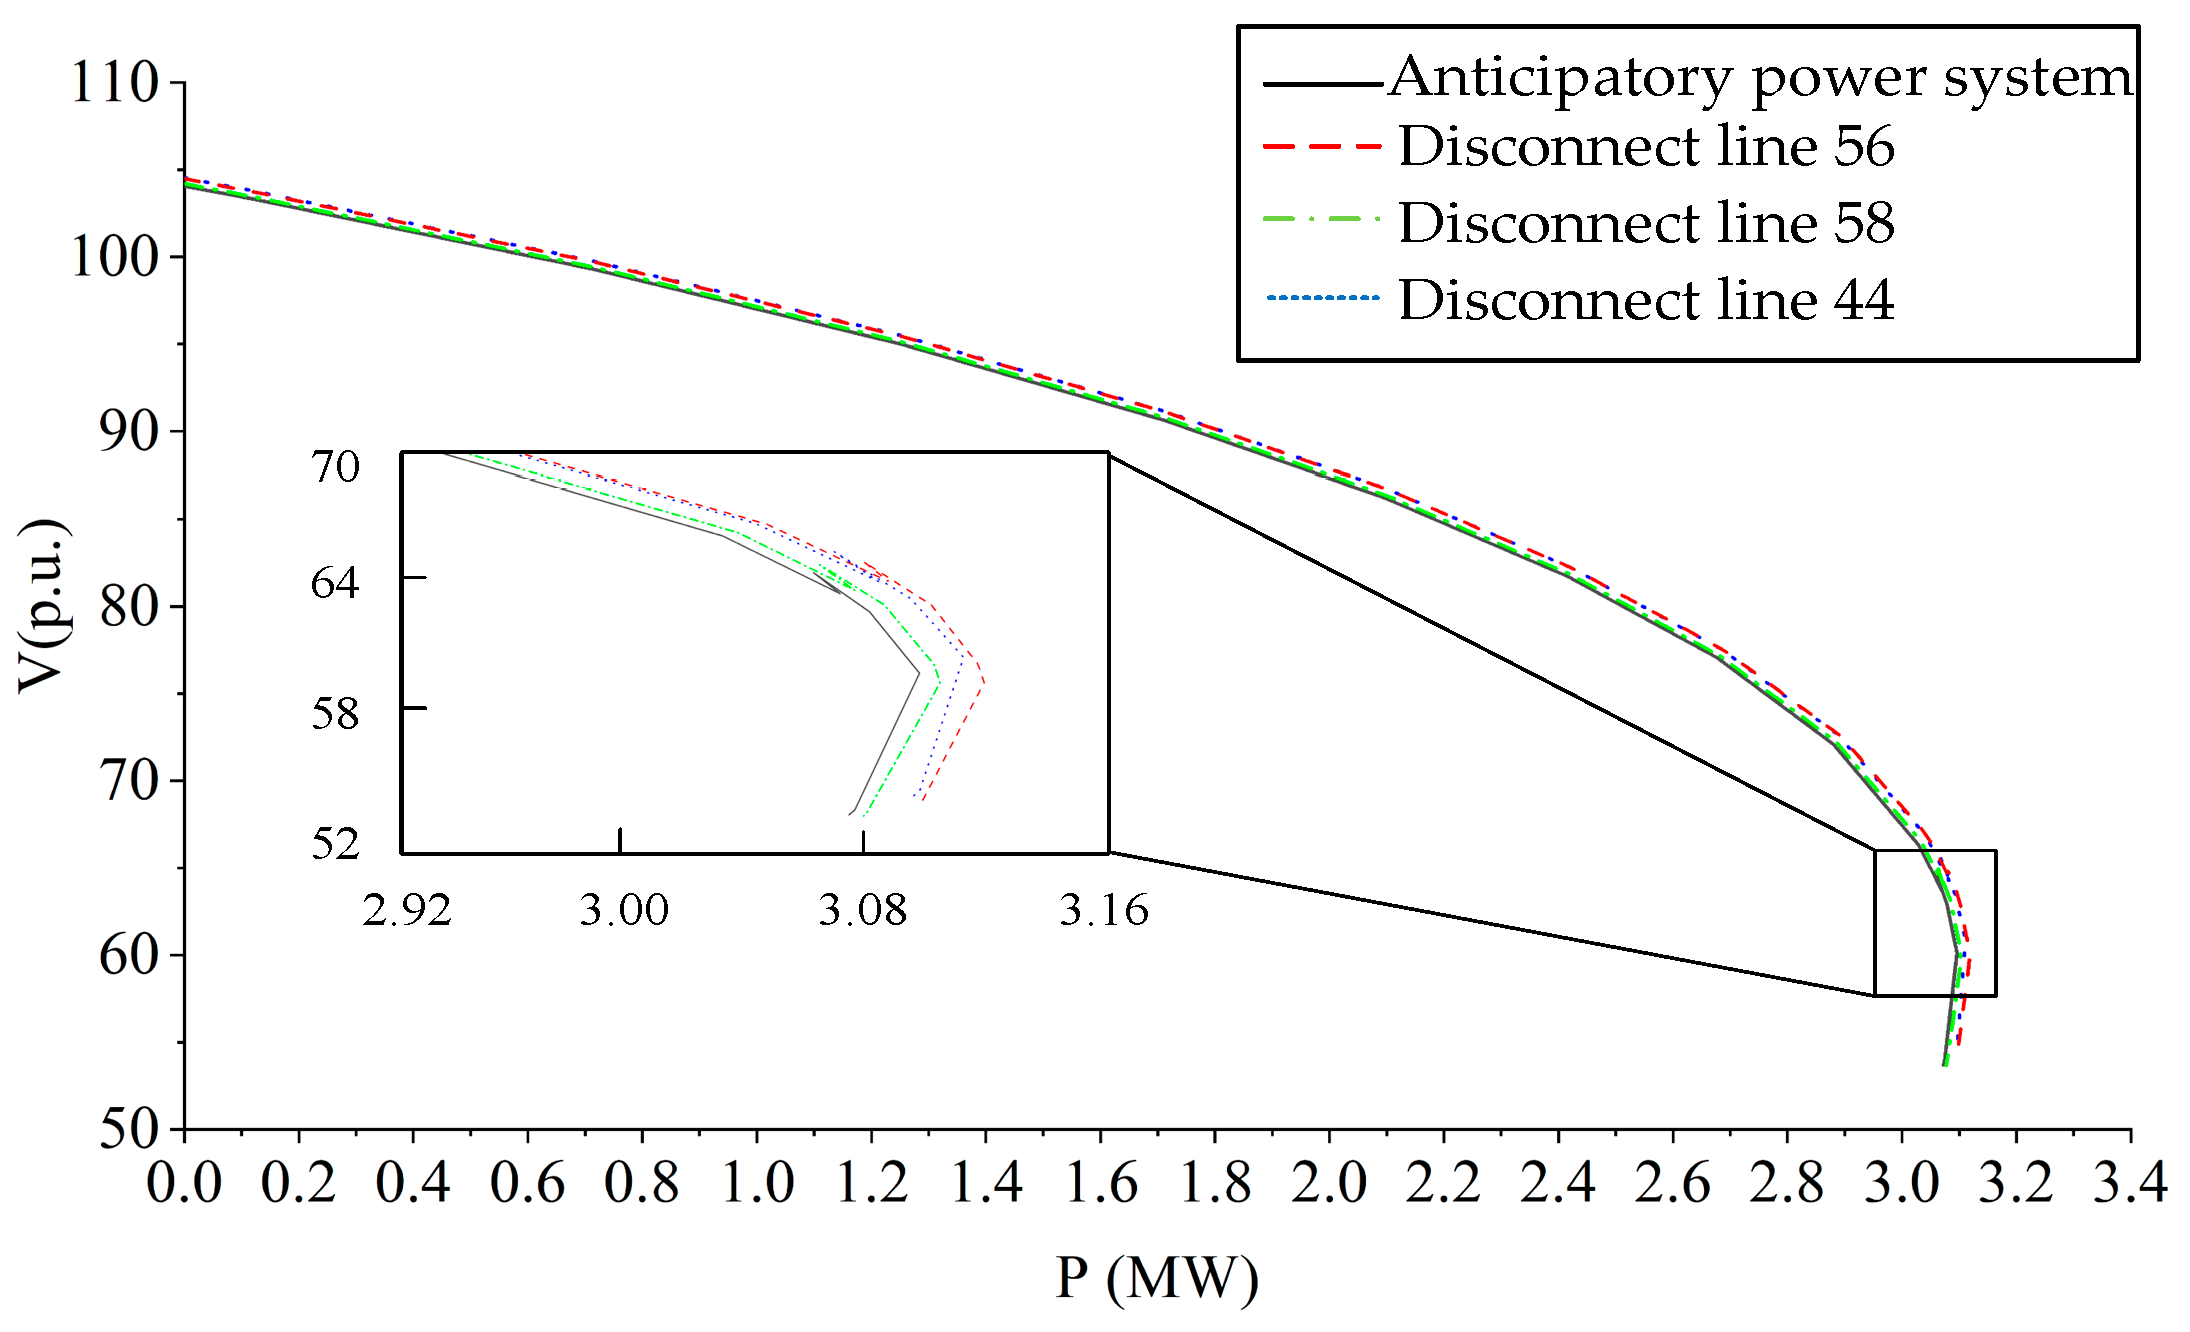
The expected P-V curves of the top three opening conditions of the power system and load margin are shown in
Figure 6. The comparison of load margin ranking between the two methods is shown in
Figure 7 and the data of the top five opening conditions of load margin are shown in
Table 3.
The expected load margin of the power system is 3.096 MW. The first-ranked opening condition is line 56, with a load margin of 3.118 MW, and an increase of 22 kW. The second-ranked opening condition is line 44, with a load margin of 3.111 MW, and an increase of 15 kW. The third-ranked opening condition is line 58, with a load margin of 3.109 MW, and an increase of 13 kW. The feasibility and advantage of the method are verified by simulation.
4.3. Comparison with Existing Work
The voltage stability of the microgrid is of great research significance, and many scholars have studied it from various aspects. Changing the power grid topology can simply and effectively change system stability. Common research contents in this field are shown in
Table 4:
The index of scheme ordering similarity represents the reliability of the ordering results of various methods. Considering the ordering sequence numbers of the methods as a set of arrays, the Euclidean distance is used to represent the similarity with the ordering sequence numbers of the traditional continuation power flow method. Accuracy indicates the accuracy of the calculation results of the method, that is, the error between the results of the traditional continuation power flow method. Complexity is an estimation range that represents the computational time of different methods under the same conditions.
The most traditional CPFLOW method is the basis for comparison. From the comparison results, the method proposed in this paper has an excellent comprehensive ability and a strong engineering application ability. It has been preliminarily verified in Port LEKKI, Nigeria, and the superiority is obvious.
5. Discussion of Multiple Line Breaks
The problem of opening multiple lines to enhance static stability is a combined issue of the single-line opening problem. For instance, in a system with eight-thousand lines, when only one line is allowed to be opened, eight-thousand lines need to be calculated one by one; when two lines are allowed to be opened, calculations need to be made for combinations; when three lines are allowed to be opened, combinations need to be calculated, and so on. Therefore, the problem of opening multiple lines is a task with an extremely large amount of calculation. In this section, the implementation scheme of allowing multiple lines to be broken to improve static stability is given as follows:
- (1)
Assume that the maximum allowable number of openable lines is m and the set of openable alternative lines is CAk, so that the number of openable lines k = 1;
- (2)
The method proposed in this paper is applied to CAk to identify the leading breaking line set Ak;
- (3)
If k < m, use formula 15 to obtain CAk+1; then, let k = k + 1 and go to step 2. Otherwise, let k = m, and go to the next step.
Here, Ak and A1 represent the sets of disconnected lines when the number of disconnected lines is k and 1, respectively. CAk+1 is the Cartesian product of Ak and A1;
- (4)
Obtain the solution sets A1, A2, … Am for the disconnection of multiple lines and their corresponding load margins.
In (3), the composition method of the alternative line disconnection set when multiple lines are disconnected is provided. The most direct way to give the alternative set of multiple line disconnections is the M-combination of all lines. However, this method leads to a huge amount of computation that is not suitable for online applications. Therefore, this section proposes a method of combining the sets of the top-ranked disconnected lines. This method is the two-combination of the solution set Am−1 of multiple line disconnections and the solution set A1 of single-line disconnections to form a new alternative set of disconnected lines CAm. For example, if m = 4, then its alternative set of disconnected lines is CA4 = A3 × A1.
Considering the local characteristics of the sensitivity method, when multiple lines are allowed to be disconnected, directly taking the change in the load margin of the initial power system, , as the scanning index is inaccurate. Therefore, the power system after disconnecting m − 1 lines can be regarded as a new “base state system”, and the sensitivity Formula (14) can be used to estimate . This is also the reason why this paper considers the disconnection set CAm as a new candidate set of lines to be disconnected. Mathematically speaking, we have not yet proved that the solution of this method must be globally optimal, so we call it a high-quality solution (with a significantly better effect than most other solutions). In our future plans, we will further explore whether there are more superior approaches to the disconnection of multiple lines and will also consider a broader scope of research, such as the behavior of bus disconnections.
6. Conclusions
This paper addressed the issue of enhancing the static stability of port microgrids and conducted an in-depth study in terms of line topology optimization, with the aim of improving the voltage distribution of the power grid, eliminating transmission line overloads, and reducing network losses through line switching measures. Firstly, the influence of grid line switching on the load margin of the power system was verified from a practical aspect, and the feasibility of line disconnection was demonstrated using a real port as an example. On this basis, a novel method for grid topology identification and optimization was proposed. This method decomposes the identification and optimization process of line switching problems into three steps, namely linear sensitivity scanning, nonlinear fitting sorting, and precise quantitative calculation.
To validate the effectiveness and superiority of the proposed method, the theoretical calculation was carried out by the IEEE 118-bus system, and then a port simulation model that conforms to actual conditions was established, taking the LEKKI Port in Nigeria as an example. Through an in-depth simulation analysis of the actual operation data of the port distribution network, the results indicate that the proposed method can significantly enhance the load margin of the power grid and optimize the operation status of the grid.
The research on the identification and optimization of grid topology in this paper holds significant theoretical and practical significance. It not only provides a new optimization approach for power system operation but also offers beneficial references for the implementation of a green energy development strategy. This research method is anticipated to play a more extensive role in domains such as power system operation optimization and smart grid construction.
Future research will further focus on the expansion of the method. When confronted with the disconnection of multiple lines, the application of the method awaits exploration. Simultaneously, the constraints of real conditions in the actual operation of the power grid will render the objective function of the system theoretical model more complex. Research on the utilization of these constraints to achieve more accurate results will be a highly significant direction.
Author Contributions
Conceptualization, H.Z. and Y.W.; methodology, H.Z. and W.Z.; software, H.Z., X.W. and J.W.; validation, H.Z., Y.W. and J.W.; formal analysis, H.Z. and W.Z.; investigation, Y.W. and X.W.; resources, Y.W. and X.W.; data curation, H.Z. and Y.W.; writing—original draft preparation, H.Z., W.Z. and Y.W.; writing—review and editing, H.Z., W.Z. and Y.W.; visualization, H.Z.; supervision, Y.W. and X.W.; project administration, Y.W., X.W. and J.W.; funding acquisition, H.Z. and J.W. All authors have read and agreed to the published version of the manuscript.
Funding
This research was funded by the National Natural Science Foundation of China 62073095, 51307035, the Harbin Science and Technology Innovation Talent Project RC2024DY395.
Data Availability Statement
Restrictions apply to the availability of these data. Data are available from Hanqing Zhang with the permission of Harbin Institute of Technology.
Conflicts of Interest
Author Xiaoyong Wang was employed by the company CSCEC (Quanzhou) City Development Co., Ltd. The remaining authors declare that the research was conducted in the absence of any commercial or financial relationships that could be construed as a potential conflict of interest.
References
- Huang, K.Y.; Huang, Y.C. Integrating direct load control with interruptible load management to provide instantaneous reserves for ancillary services. IEEE Trans. Power Syst. 2004, 19, 1626–1634. [Google Scholar] [CrossRef]
- Tan, B.; Zhao, J.; Xie, L. Transferable Deep Kernel Emulator for Probabilistic Load Margin Assessment with Topology Changes, Uncertain Renewable Generations and Loads. IEEE Trans. Power Syst. 2023, 38, 5740–5754. [Google Scholar] [CrossRef]
- Bharati, A.K.; Ajjarapu, V. Investigation of Relevant Distribution System Representation with DG for Voltage Stability Margin Assessment. IEEE Trans. Power Syst. 2020, 35, 2072–2081. [Google Scholar] [CrossRef]
- Wiszniewski, A. New Criteria of Voltage Stability Margin for the Purpose of Load Shedding. IEEE Trans. Power Deliv. 2007, 22, 1367–1371. [Google Scholar] [CrossRef]
- Bento, M.E. Physics-Guided Neural Network for Load Margin Assessment of Power Systems. IEEE Trans. Power Syst. 2024, 39, 564–575. [Google Scholar] [CrossRef]
- Pierrou, G.; Wang, X. Analytical Study of the Impacts of Stochastic Load Fluctuation on the Dynamic Voltage Stability Margin Using Bifurcation Theory. IEEE Trans. Circuits Syst. I Regul. Pap. 2020, 67, 1286–1295. [Google Scholar] [CrossRef]
- Zhou, Y.; Ajjarapu, V. A Fast Algorithm for Identification and Tracing of Voltage and Oscillatory Stability Margin Boundaries. Proc. IEEE 2005, 93, 934–946. [Google Scholar] [CrossRef]
- Chen, Z.; Qi, J.; Chen, X.; Xu, J. Stability Margin Evaluation of Black-Box Power Distribution Systems in a Wide Load Range. CPSS Trans. Power Electron. Appl. 2023, 8, 325–335. [Google Scholar] [CrossRef]
- Neves, L.S.; Alberto, L.F.C. On The Computation of The Locally Closest Bifurcation Point Considering Loading Uncertainties and Reactive Power Limits. IEEE Trans. Power Syst. 2020, 35, 3885–3894. [Google Scholar] [CrossRef]
- Gao, H.; Wang, L.; Yang, D.; Cai, G.; Liu, C.; Yang, H.; Sun, Z.; Wang, B. Mechanism Enhanced Data-Driven Method for Reliability Improvement of Load Margin Estimation. IEEE Trans. Power Syst. 2024, 39, 3715–3724. [Google Scholar] [CrossRef]
- Luo, C.; Ajjarapu, V. Sensitivity-Based Efficient Identification of Oscillatory Stability Margin and Damping Margin Using Continuation of Invariant Subspaces. IEEE Trans. Power Syst. 2011, 26, 1484–1492. [Google Scholar] [CrossRef]
- Limpisawas, T.; Wattanapanitch, W. A Low-Power Wide-Load-Range Output-Capacitorless Low-Dropout Voltage Regulator with Indirect-Direct Nested Miller Compensation. IEEE Access 2022, 10, 67396–67412. [Google Scholar] [CrossRef]
- Saffarian, A.; Sanaye-Pasand, M. Enhancement of Power System Stability Using Adaptive Combinational Load Shedding Methods. IEEE Trans. Power Syst. 2011, 26, 1010–1020. [Google Scholar] [CrossRef]
- Rabiee, A.; Mohseni-Bonab, S.M.; Parniani, M.; Kamwa, I. Optimal Cost of Voltage Security Control Using Voltage Dependent Load Models in Presence of Demand Response. IEEE Trans. Smart Grid 2019, 1, 2383–2395. [Google Scholar] [CrossRef]
- Cai, G.; Gao, H.; Yang, D.; Wang, L. Synchrophasor-Based Online Load Margin Estimation Using Incremental Learning Assisted LightGBM in Smart Grid. IEEE Syst. J. 2023, 17, 4660–4670. [Google Scholar] [CrossRef]
- Delavari, A.; Kamwa, I. Improved Optimal Decentralized Load Modulation for Power System Primary Frequency Regulation. IEEE Trans. Power Syst. 2018, 33, 1013–1025. [Google Scholar] [CrossRef]
- Krishan, R.; Rohith, Y. Load and Generation Converters Control Strategy to Enhance the Constant Power Load Stability Margin in a DC Microgrid. IEEE Access 2024, 12, 35972–35983. [Google Scholar] [CrossRef]
- Li, C.; Chiang, H.D.; Du, Z. Investigation of an Effective Strategy for Computing Small-Signal Security Margins. IEEE Trans. Power Syst. 2018, 33, 5437–5445. [Google Scholar] [CrossRef]
- Su, H.-Y.; Hong, H.-H. An Intelligent Data-Driven Learning Approach to Enhance Online Probabilistic Voltage Stability Margin Prediction. IEEE Trans. Power Syst. 2021, 36, 3790–3793. [Google Scholar] [CrossRef]
- Lu, S.; Xu, Y.; Gu, W.; Fang, X.; Dong, Z. On Thermal Dynamics Embedded Static Voltage Stability Margin. IEEE Trans. Power Syst. 2023, 38, 2982–2985. [Google Scholar] [CrossRef]
- Zhou, D.Q.; Annakkage, U.D.; Rajapakse, A.D. Online Monitoring of Voltage Stability Margin Using an Artificial Neural Network. IEEE Trans. Power Syst. 2010, 25, 1566–1574. [Google Scholar] [CrossRef]
- Chiang, H.D.; Flueck, A.J.; Shah, K.S.; Balu, N. CPFLOW: A practical tool for tracing power system steady-state stationary behavior due to load and generation variations. IEEE Trans. Power Syst. 1995, 10, 623–634. [Google Scholar] [CrossRef]
- Shen, Z.; Tang, Y.; Yi, J.; Zhao, B.; Chen, C.; Hou, S. Network Topology Optimization Method for Relieving Voltage Violations by Transmission Switching Considering N–1 Security Constraints. Proc. IEEE 2005, 93, 934–946. [Google Scholar]
| Disclaimer/Publisher’s Note: The statements, opinions and data contained in all publications are solely those of the individual author(s) and contributor(s) and not of MDPI and/or the editor(s). MDPI and/or the editor(s) disclaim responsibility for any injury to people or property resulting from any ideas, methods, instructions or products referred to in the content. |
© 2025 by the authors. Licensee MDPI, Basel, Switzerland. This article is an open access article distributed under the terms and conditions of the Creative Commons Attribution (CC BY) license (https://creativecommons.org/licenses/by/4.0/).


