Article

Integrated 3D Geological Modeling, Stress Field Modeling, and Production Simulation for CBM Development Optimization in Zhengzhuang Block, Southern Qinshui Basin

1
Petro China Huabei Oilfield Company, Renqiu 062550, China
2
School of Emergency Management and Safety Engineering, North China University of Science and Technology, Tangshan 063210, China
3
School of Energy Resource, China University of Geosciences (Beijing), Beijing 100083, China
*
Author to whom correspondence should be addressed.
Energies 2025, 18(10), 2617; https://doi.org/10.3390/en18102617
Submission received: 9 April 2025 / Revised: 9 May 2025 / Accepted: 12 May 2025 / Published: 19 May 2025
(This article belongs to the Special Issue Advances in Unconventional Reservoirs and Enhanced Oil Recovery)

Abstract

:
The Zhengzhuang Block in the Qinshui Basin is one of the important coalbed methane (CBM) development areas in China. As high-quality CBM resources become depleted, remaining reserves exhibit complex geological characteristics requiring advanced development strategies. In this study, a multidisciplinary workflow integrating 3D geological modeling (94.85 km2 seismic data, 973 wells), geomechanical stress analysis, and production simulation was developed to optimize development of the Permian No. 3 coal seam. Structural architecture and reservoir heterogeneity were characterized through Petrel-based modeling, while finite-element analysis identified stress anisotropy with favorable stimulation zones concentrated in southwestern sectors. Computer Modeling Group (CMG) simulations of a 27-well group revealed a rapid initial pressure decline followed by a stabilization phase. A weighted multi-criteria evaluation framework classified resources into three tiers: type I (southwestern sector: 28–33.5 m3/t residual gas content, 0.8–1.0 mD permeability, 8–12% porosity), type II (northern/central: 20–26 m3/t residual gas content, 0.5–0.6 mD permeability, 5–8% porosity), and type III (<20 m3/t residual gas content, <0.4 mD permeability, <4% porosity). The integrated methodology provides a technical foundation for optimizing well patterns, enhancing hydraulic fracturing efficacy, and improving residual gas recovery in heterogeneous CBM reservoirs.

1. Introduction

Coalbed methane (CBM), as a clean and sustainable unconventional resource, plays a crucial role in the global energy transition and carbon reduction [1,2]. In recent years, significant advancements have been made in the development of CBM in China [3,4]. The Zhengzhuang Block in the Qinshui Basin is one of the major CBM development areas in China. As the scale of development expands and technology advances, high-quality resources have been largely depleted, leaving behind reservoirs with increasingly complex geological conditions and presenting considerable challenges for further development [5,6]. Addressing these challenges requires refined three-dimensional (3D) modeling of CBM reservoirs and numerical simulation of dynamic production to comprehensively understand the distribution patterns, productivity characteristics, and controlling factors of CBM reservoirs.
Three-dimensional geological modeling technology, as a vital tool for CBM reservoir characterization [7], integrates multi-source data, such as geological, logging, seismic, well testing, and reservoir engineering information [8,9,10,11]. This enables the construction of high-resolution 3D structural and property models, providing an in-depth understanding of the spatial distribution characteristics and accumulation evolution of coal reservoirs [12]. It also provides a solid foundation for numerical simulation and dynamic analysis of reservoir development. With the continuous advancement of stochastic 3D modeling theory, the integration of logging interpretation results and seismic data constraints has become a focal point in CBM modeling research, aiming to establish comprehensive and high-precision geological models for coal reservoirs.
Current research primarily focuses on the optimization of geologically favorable zones through geological characterization, while conventional optimization approaches often neglect the identification of stimulation-favorable zones [13,14]. To improve stimulation effectiveness in these areas, it is essential to develop targeted fracturing strategies based on geostress conditions. Meanwhile, the characterization of residual gas distribution has emerged as a critical research direction for unlocking future reservoir potential [15,16]. Traditional methods estimate residual gas by simply subtracting cumulative production from original gas content at the field scale. Although numerical simulation offers greater accuracy, its application has mostly been restricted to small well clusters due to computational limitations [17,18]. To enhance prediction accuracy for remaining gas reserves, this study proposes an integrated approach that combines localized numerical simulations with broader computational methods. This hybrid methodology utilizes simulation calibration to improve understanding of the spatial distribution of residual gas, providing a technical basis for optimizing subsequent development strategies and enhancing recovery.
Therefore, this study focuses on the No. 3 coal reservoir in the southern Zhengzhuang Block, employing Petrel geological modeling and numerical simulation technologies to conduct systematic characterization of coal reservoir properties. A comprehensive geological model was constructed, integrating sub-models for porosity, permeability, and gas content to identify optimal development zones. Using advanced modeling techniques, the spatial distribution of geostress magnitude and orientation was analyzed to determine stimulation-favorable zones for enhanced reservoir modification. Based on this geological framework, numerical simulations calibrated with historical production data were used to interpret production dynamics, quantify remaining gas, and evaluate both current productivity and untapped potential. An integrated evaluation framework was established by combining development-favorable areas, stimulation-targeted zones, and productivity assessments, ultimately mapping CBM production potential across the study area to support future planning.
The established models provide a scientific foundation for resource exploitation optimization, delivering the following: (1) A technical framework for optimizing well patterns and improving recovery strategies; (2) production performance simulations to forecast gas output and refine extraction plans; and (3) an integrated evaluation system for assessing economic feasibility. Collectively, these contributions support data-driven decision-making in CBM field development, particularly in overcoming the challenges of heterogeneous reservoir stimulation and residual gas recovery [19,20].

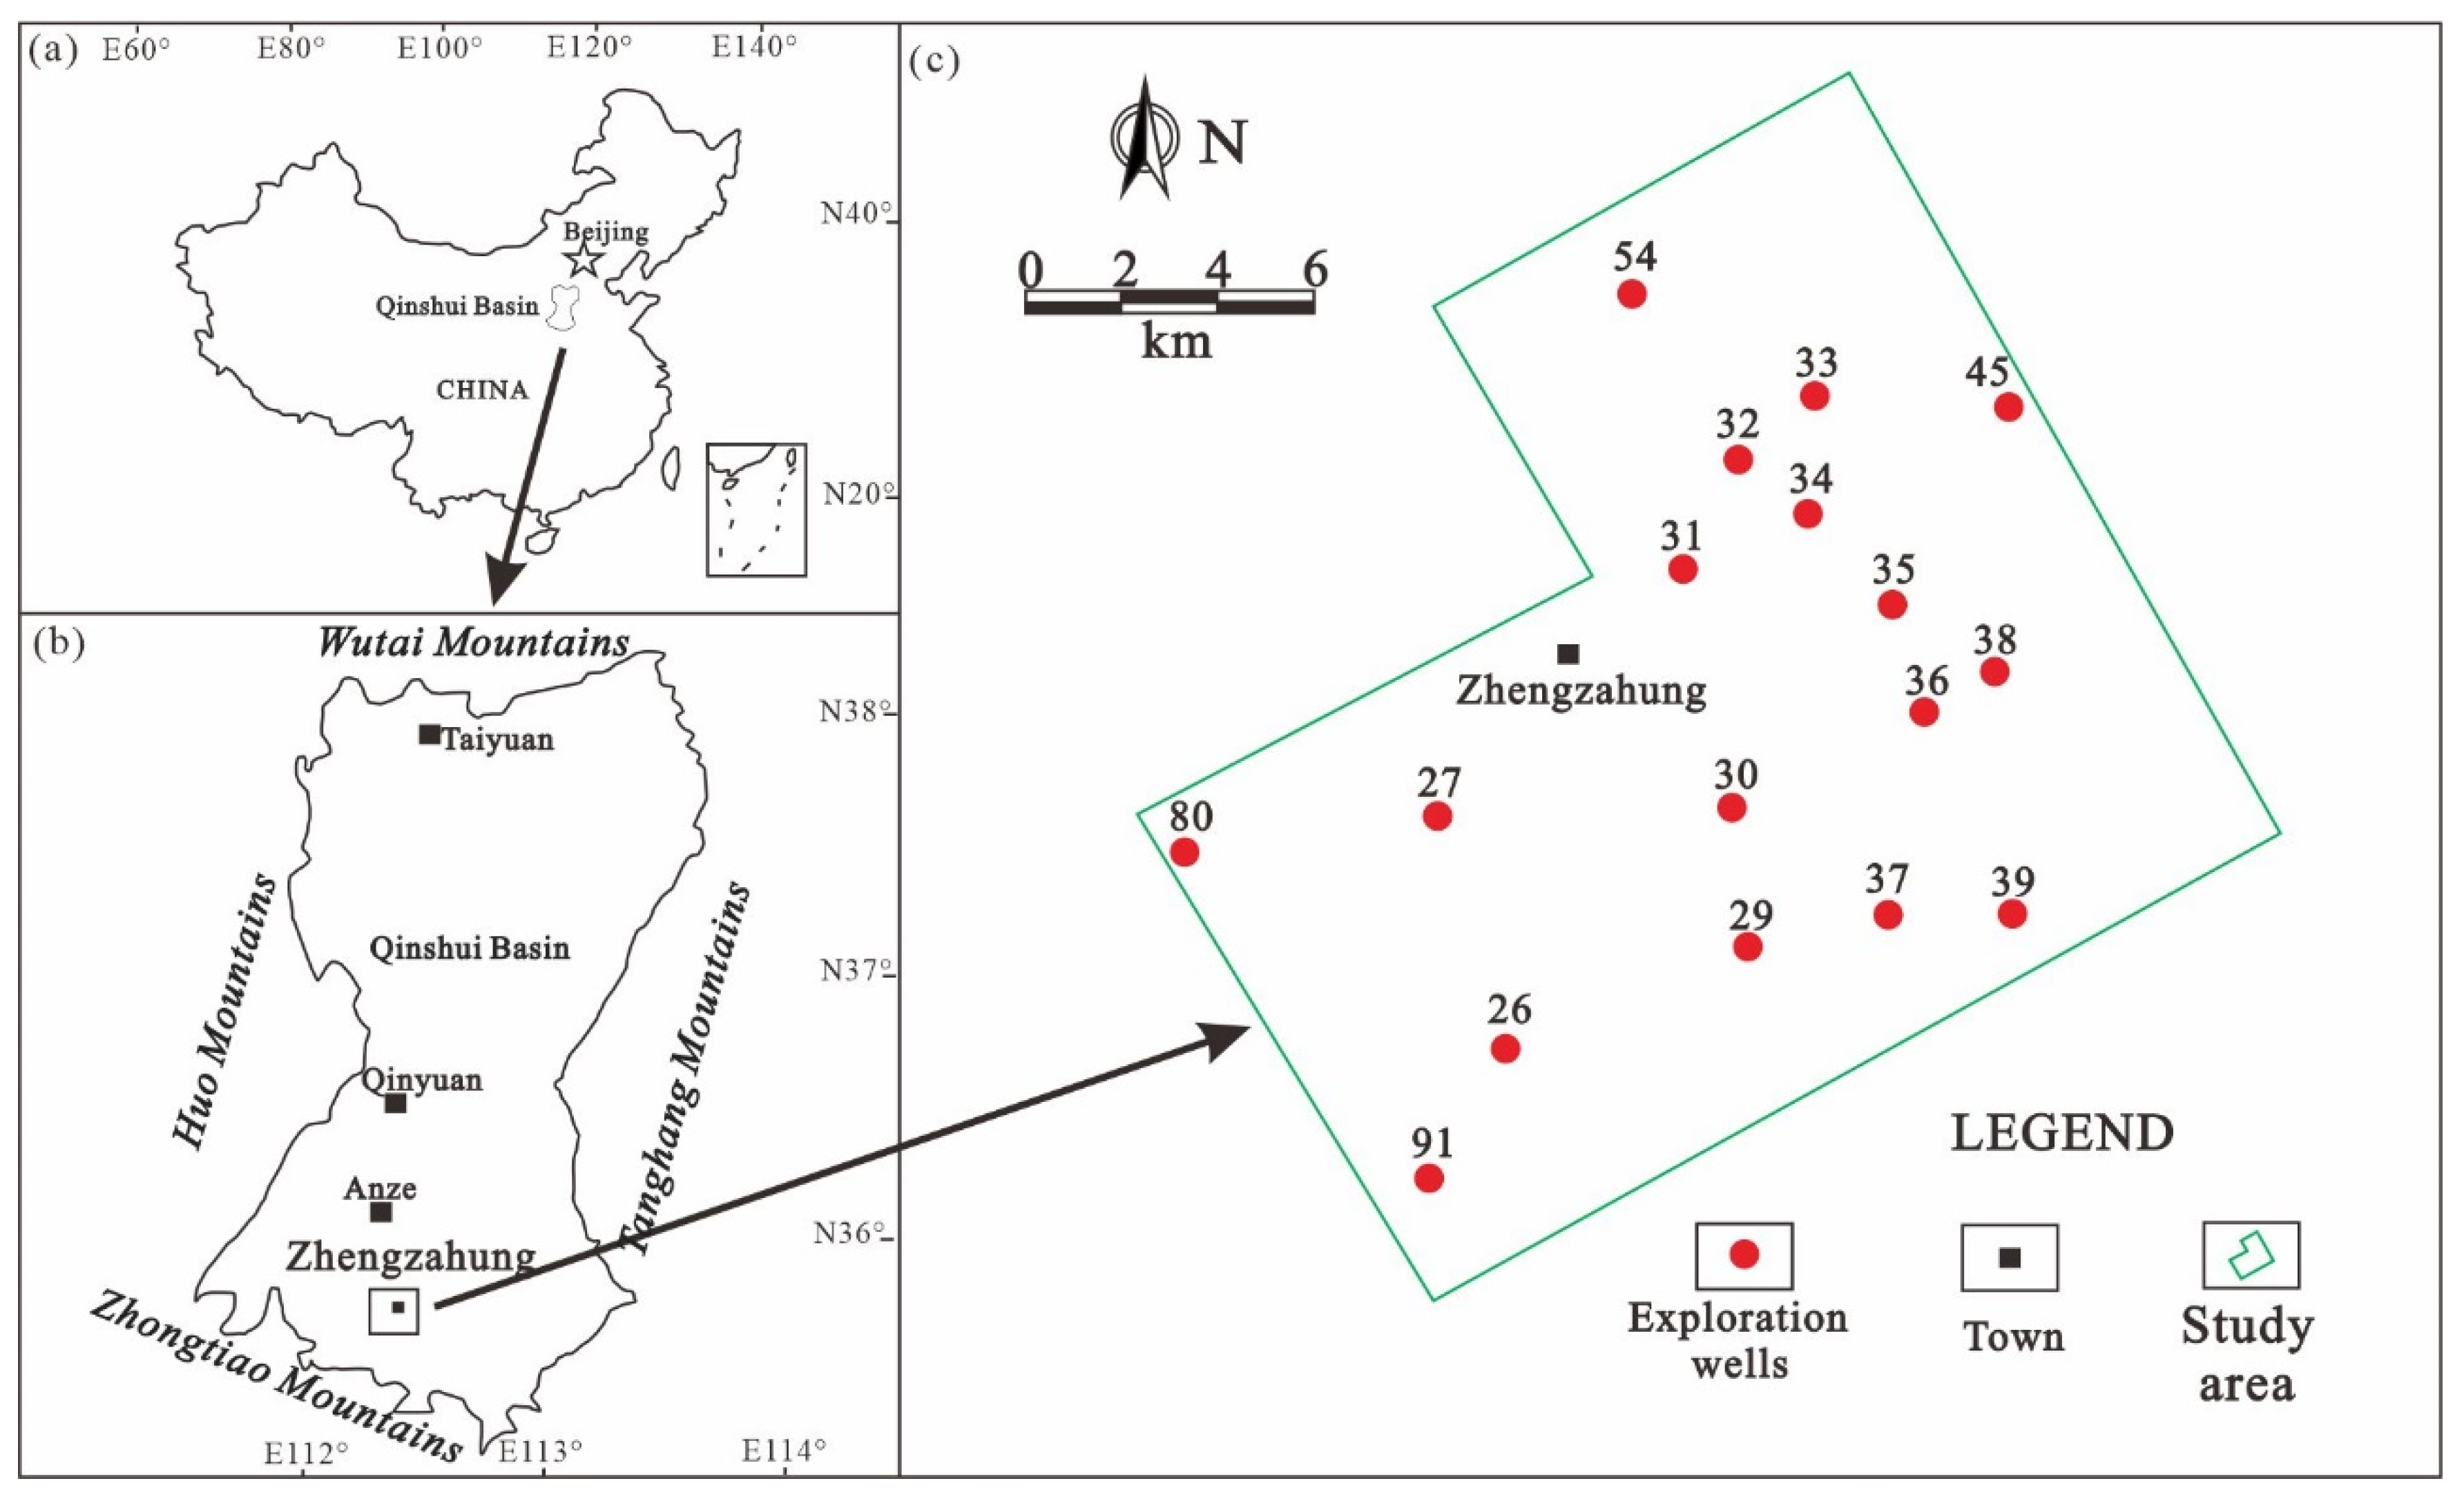
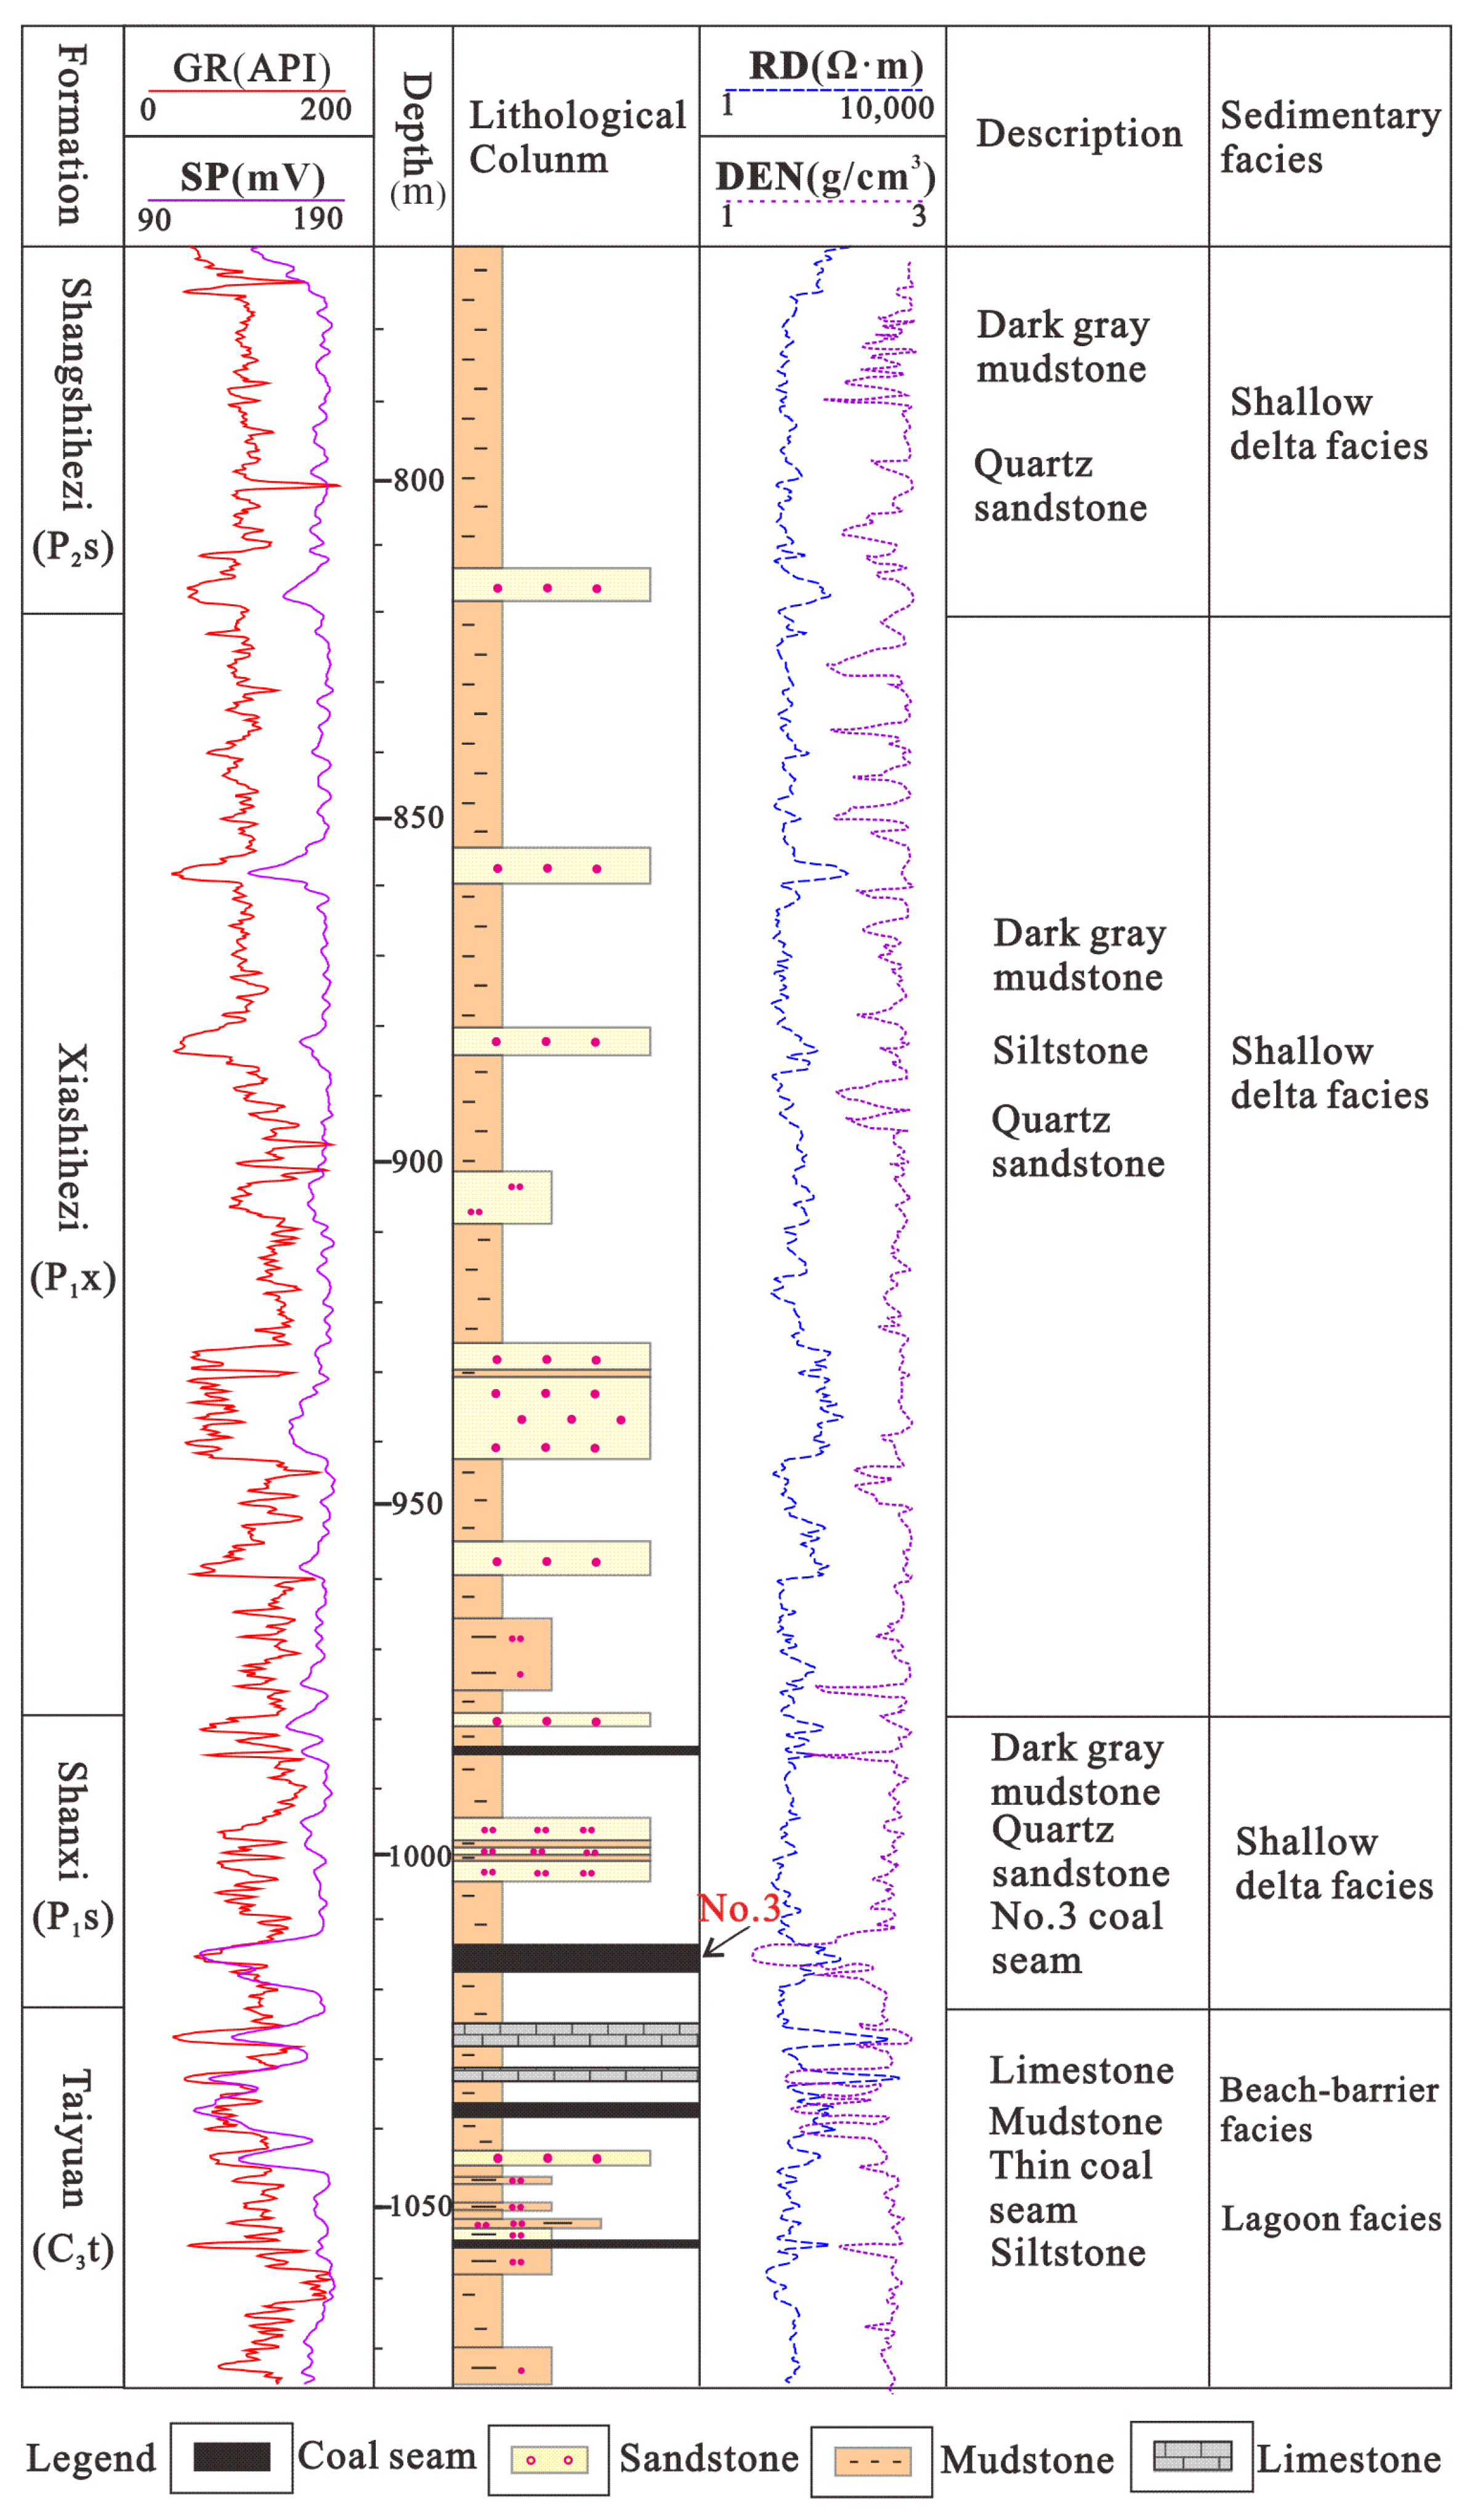
2. Geological Settings

The Qinshui Basin, located in North China, is a representative example of a Mesozoic intracratonic rift basin (Figure 1). Its tectonic and sedimentary evolution can be divided into three distinct stages. The first stage, spanning the Pennsylvanian to the Late Triassic, was characterized by prolonged tectonic subsidence and sedimentation. During the second stage in the Jurassic, the basin underwent regional uplift followed by subsidence and subsequent reburial of the strata. The third stage, from the Cretaceous to the present, has been dominated by continuous uplift and extensive erosion [13,21,22].
The Pennsylvanian–Permian coal-bearing strata in the basin were subjected to four phases of tectonic deformation, driven by major orogenic events [24]. The first phase, during the Late Permian to Triassic, was associated with the Indosinian orogeny, resulting in compressive deformation under a north–south (N–S) principal stress regime. The second phase, linked to the Yanshanian orogeny in the Jurassic and Early Cretaceous, intensified compressional deformation and reoriented the principal stress to a southeast–northwest (SE–NW) direction. This phase is regarded as crucial for the formation of the basin’s structural framework. The third phase, during the Paleogene, was driven by the early Himalayan orogeny, which transitioned the regional stress field to an extensional regime-oriented northwest–west to southeast–east (NWW–SEE). This extensional stress led to the formation of major normal faults, particularly in the eastern Zhengzhuang Field. The final phase, during the late Himalayan orogeny in the Quaternary, saw the stress regime revert to compression, with a principal stress direction-oriented northeast–southwest (NE–SW). This compressional regime is believed to be responsible for the closure of many major faults within the basin [10,24].
As shown in Figure 1b,c, the Zhengzhuang CBM Field, situated in the southern part of the Qinshui Basin, covers an area of approximately 570 km2 and represents a significant region for coalbed methane development. As shown in Figure 2, the Permo-Carboniferous coal-bearing strata in this field comprise, from bottom to top, the Benxi, Taiyuan, Upper Shihezi, and Shiqianfeng Formations, with the No. 3 coal seam in the Permian Shanxi Formation serving as the primary target for CBM production. The No. 3 coal seam is primarily composed of anthracite, with vitrinite reflectance (Ro, max) values reaching up to 4.3%. The gas generated has reached a total of approximately 300 m3/t from the Jurassic to Early Cretaceous, with an average gas content of 20.7 m3/t today, indicating a significant resource potential [23]. The Shanxi Formation, primarily deposited in deltaic environments such as mouth bars, interdistributary bays, and delta plains, consists of interbedded shale, sandstone, sandy shale, and coal. It has an average thickness of approximately 47 m, ranging from 20 to 90 m. The coal-bearing strata are underlain by early Paleozoic marine carbonates and overlain by fluvial deposits of the Triassic [25,26]. Among these, the No. 3 coal seam is the primary focus for CBM exploration and extraction within the Zhengzhuang Field due to its favorable geological and reservoir characteristics.

3. Data Sources

The structural interpretation results based on seismic data serve as foundational inputs for geological modeling. This study utilized 3D seismic data covering an area of 94.85 km2 in the research region to obtain structural morphology information of the target coal seam. The seismic survey area is located in Zhengzhuang, Qinshui County, Shanxi Province. The study area generally exhibits a topographic trend sloping from northwest to southeast, and it is one of the most developed blocks in the Qinshui Basin coalfield.
The study area contains 33 parameter wells and 940 production wells. This research collected drilling and completion data from the 33 parameter wells for geological horizon identification. Core observations from 119 core samples were integrated with selected logging curves—including acoustic interval transit time, density, natural gamma, resistivity, and compensated neutron logs—to determine macroscopic coal lithotypes, coal structure, and rock mechanical properties. Moreover, porosity, permeability, and gas content data were obtained from the 119 core samples distributed across the 33 parameter wells.
For the numerical simulation of production processes, a typical production zone containing 27 active production wells was selected for history matching of gas and water production. These wells commenced production between 2010 and 2012 and had been in continuous operation for four to five years by the data cutoff in December 2017.

4. Results and Discussion

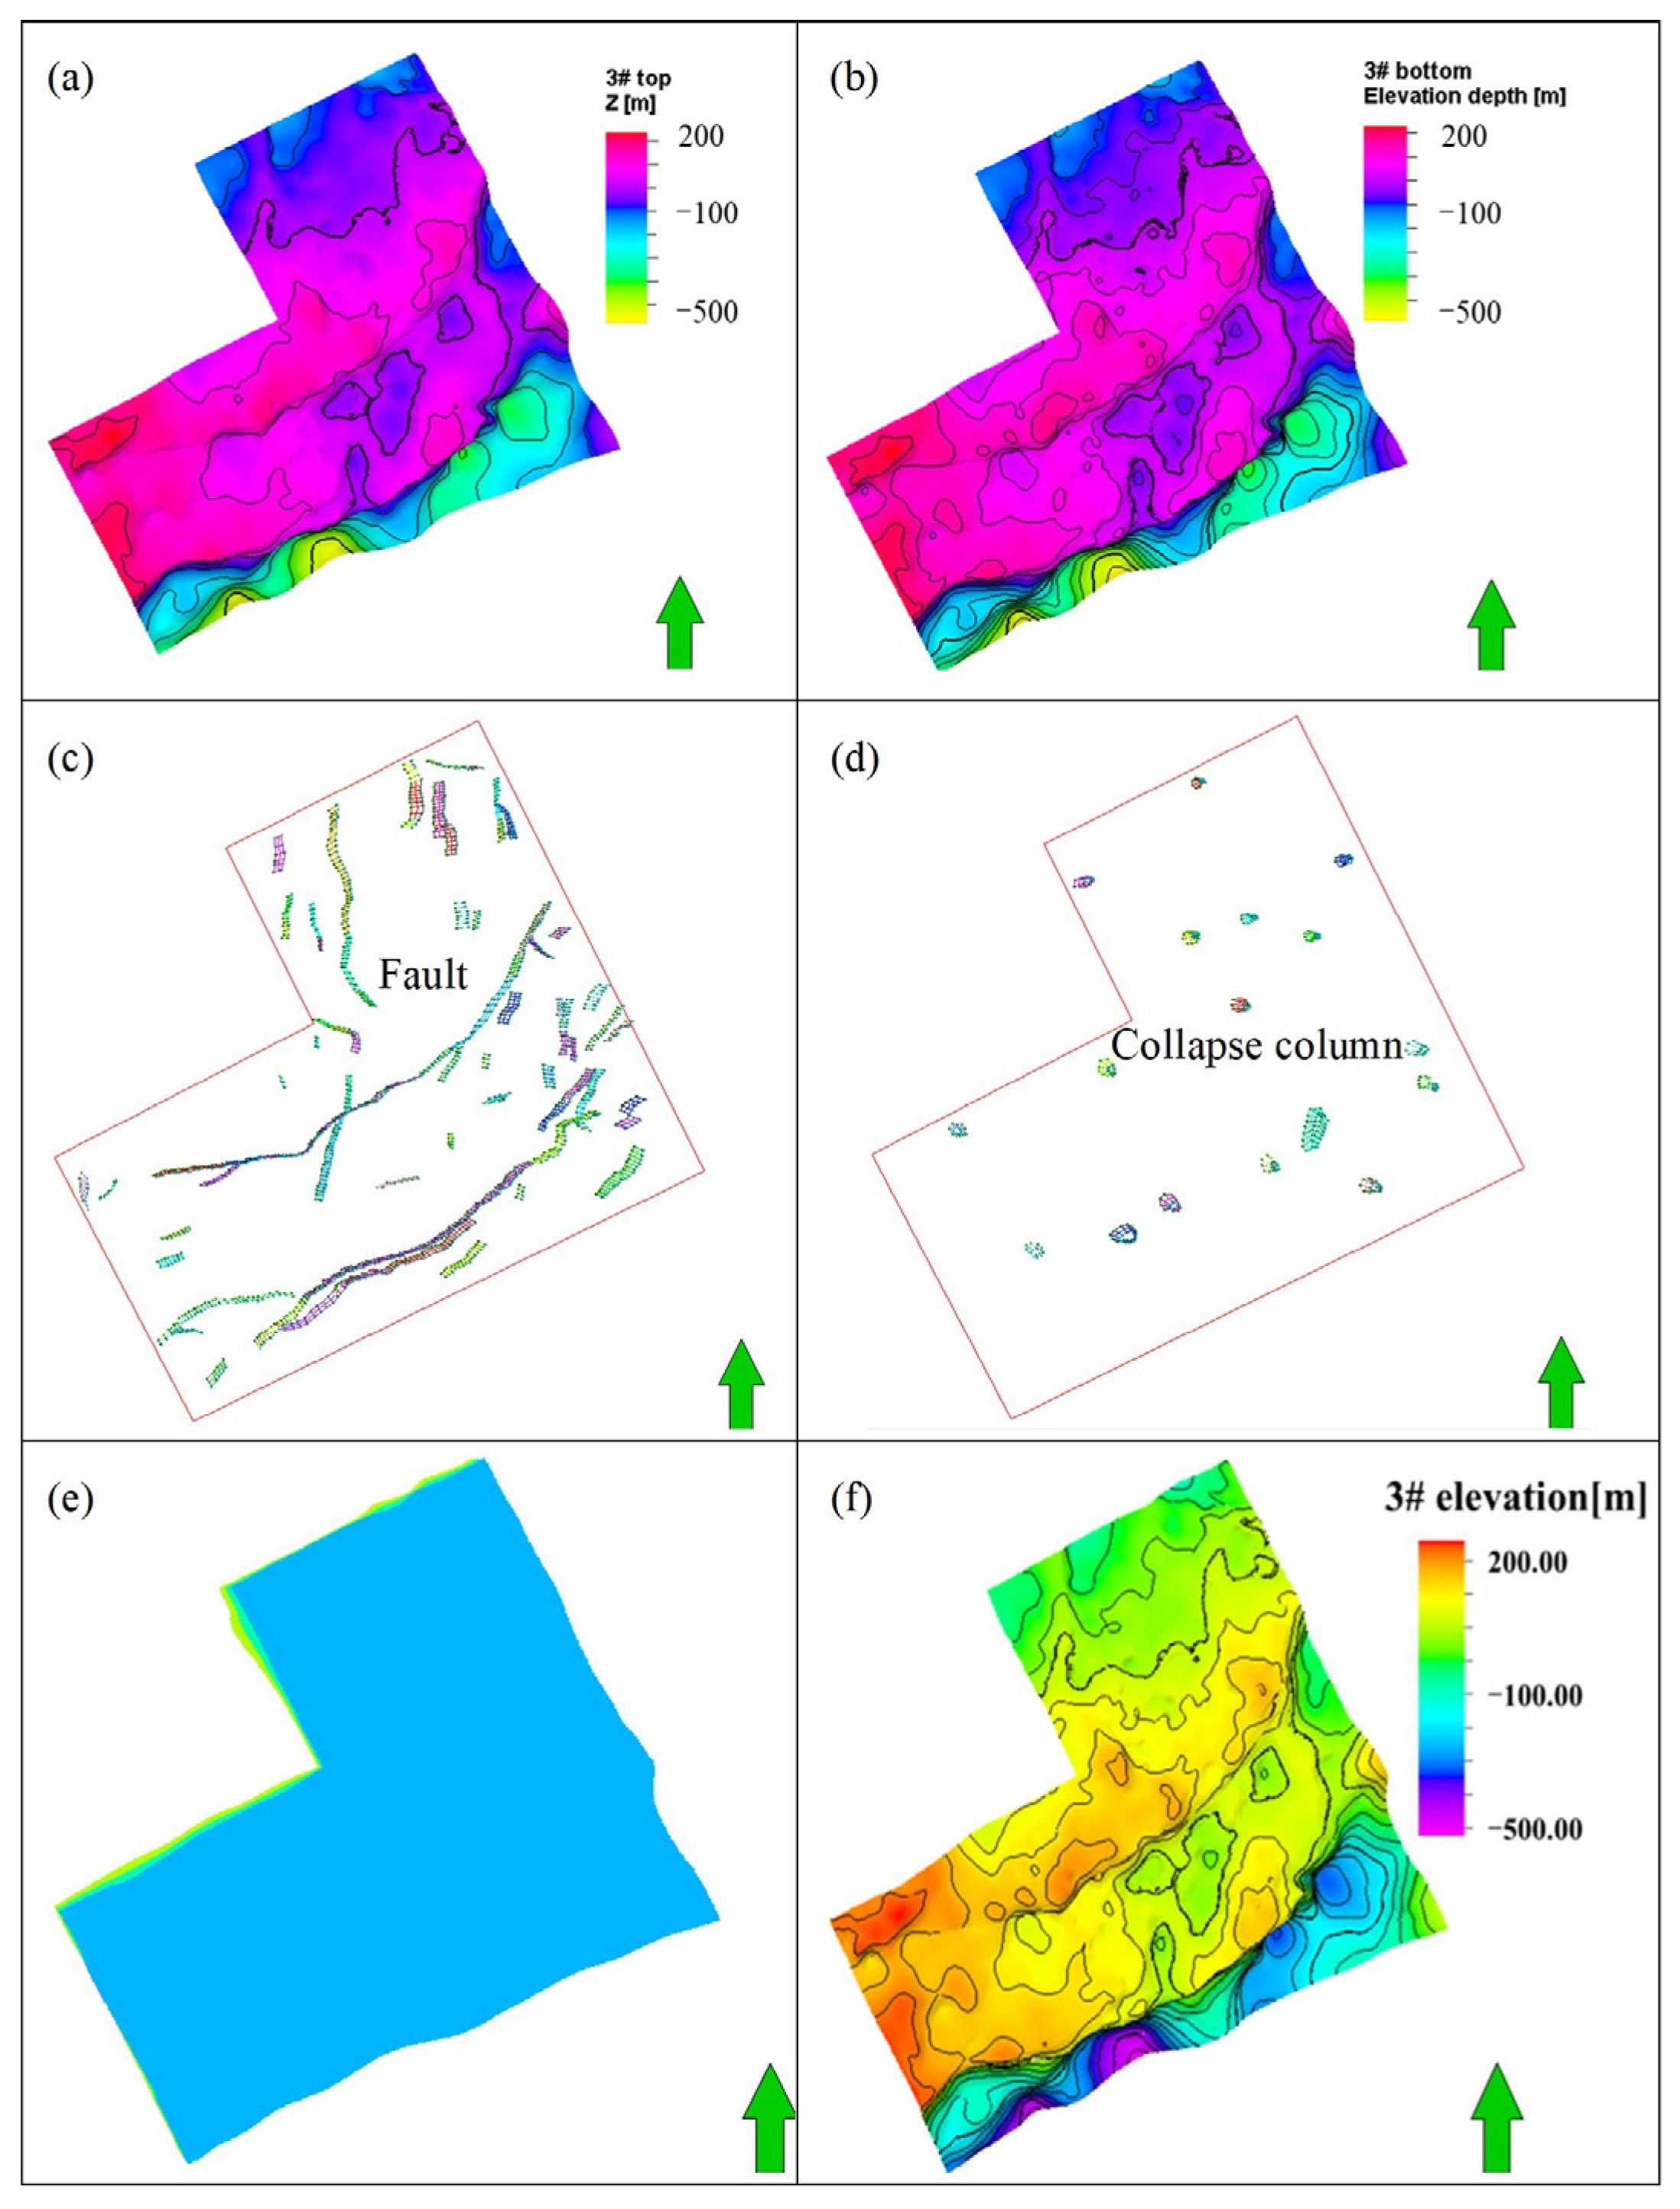
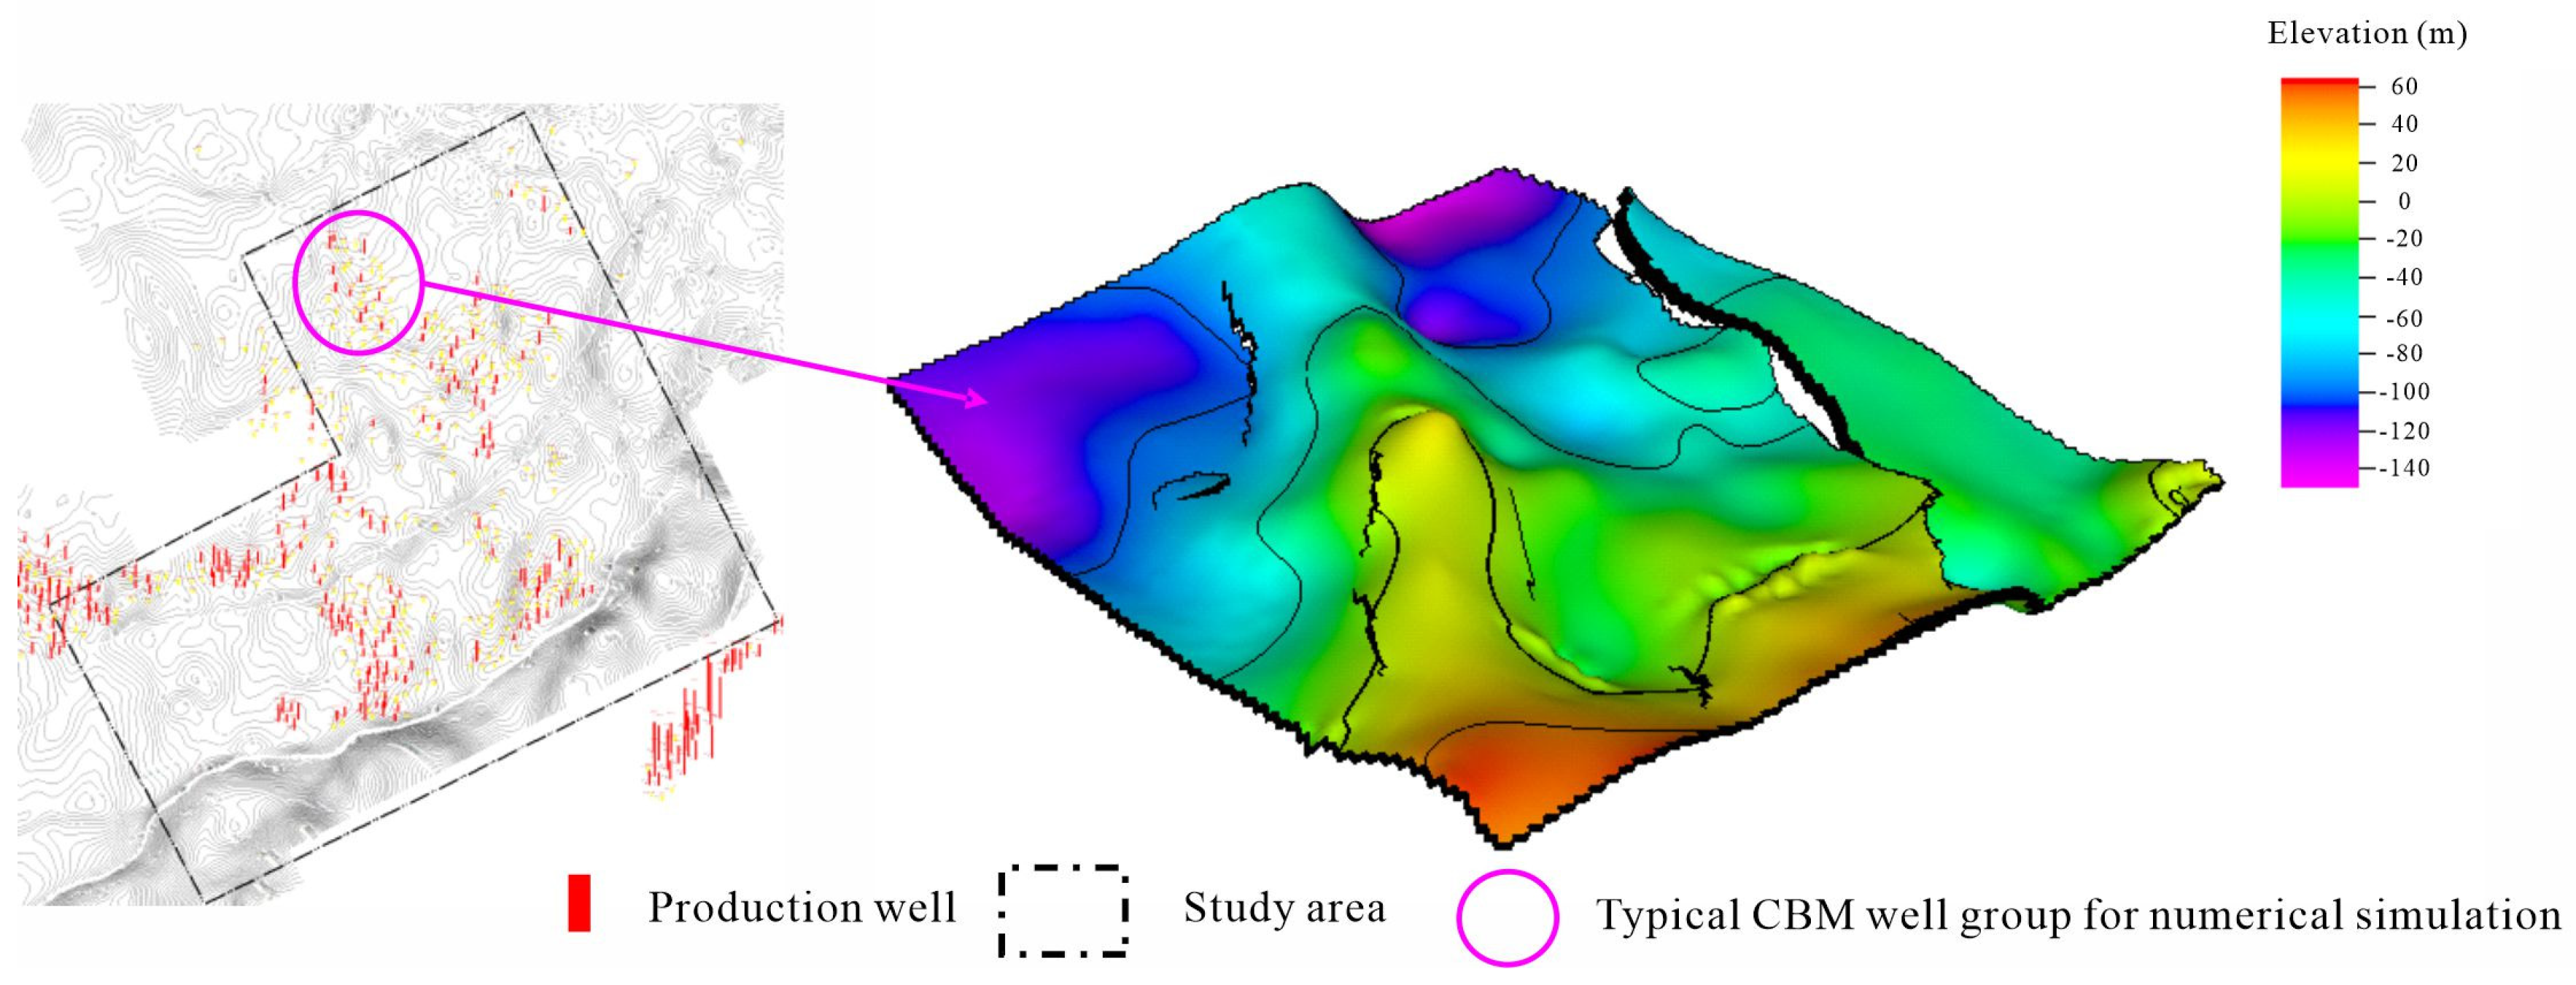
4.1. Three-Dimensional Structural Modeling

The 3D modeling module of the Petrel geological modeling software was used to construct the geological model of the No. 3 coal reservoir in the southern Zhengzhuang Field, based on drilling data and testing results for the No. 3 coal reservoir in the area. The modeling process included the following steps: First, the top-surface model (Figure 3a) and bottom-surface model (Figure 3b) of the No. 3 coal seam were constructed. Subsequently, fault models (Figure 3c) and collapse column models (Figure 3d) were developed. Next, planar gridding was performed using the pillar gridding method, ensuring the grid orientation was generally aligned with the strike of the faults. Considering the practical requirements of the study, including modeling accuracy and computational efficiency, the grid size was set to 25 m × 25 m (Figure 3e). Finally, the three-dimensional structural model of the No. 3 coal reservoir in the study area was completed by integrating the surface models, fault models, and collapse column models (Figure 3f).

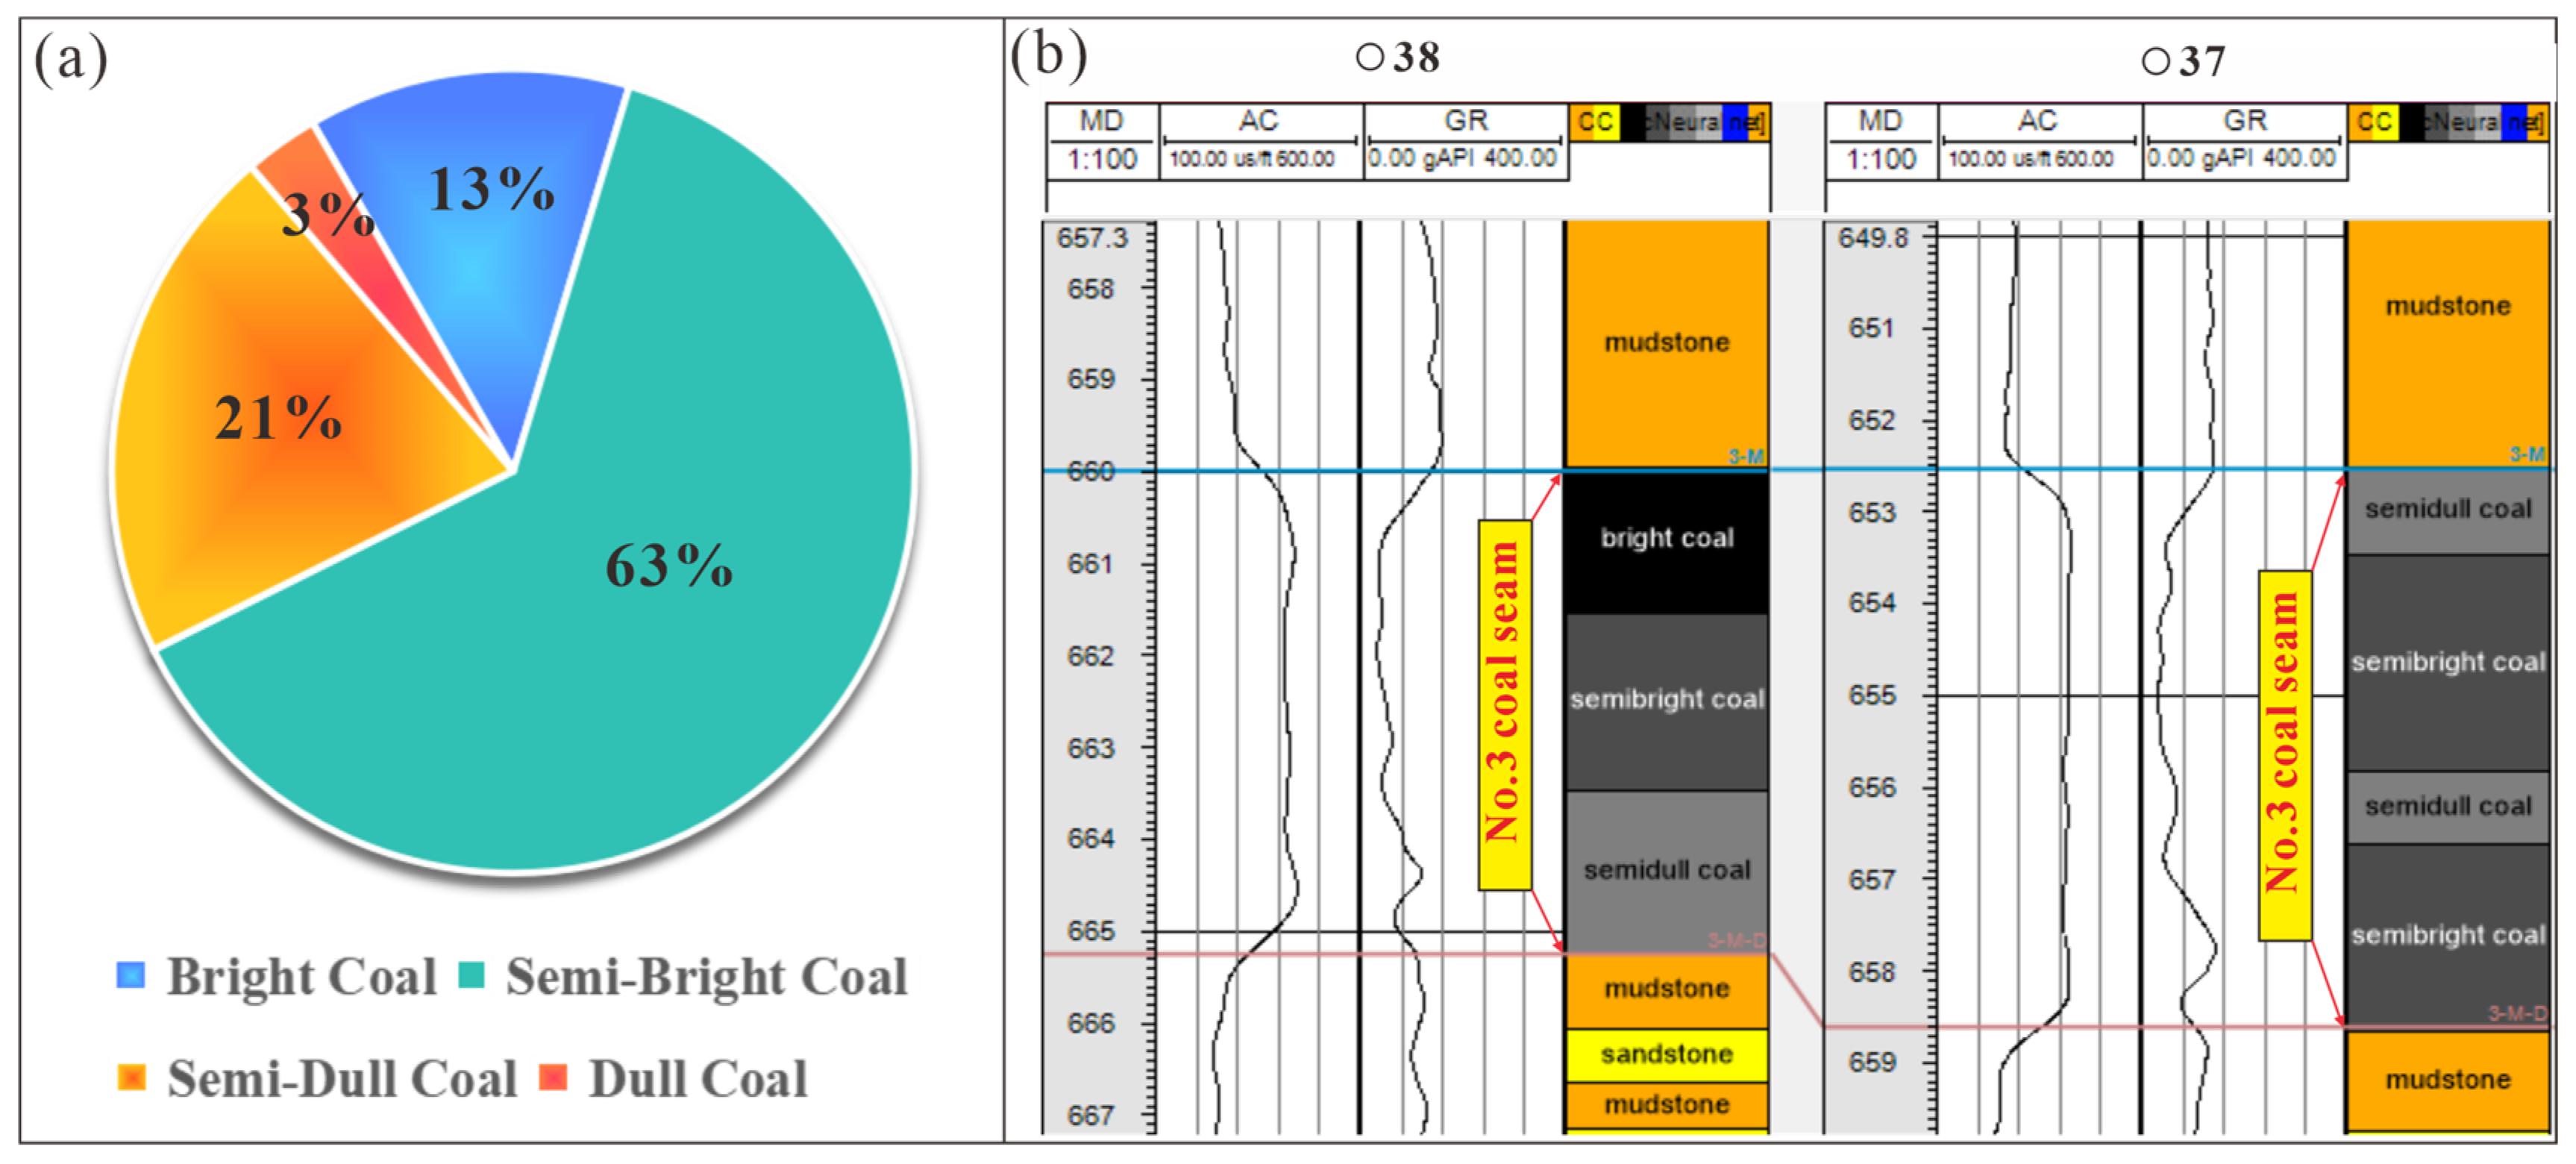
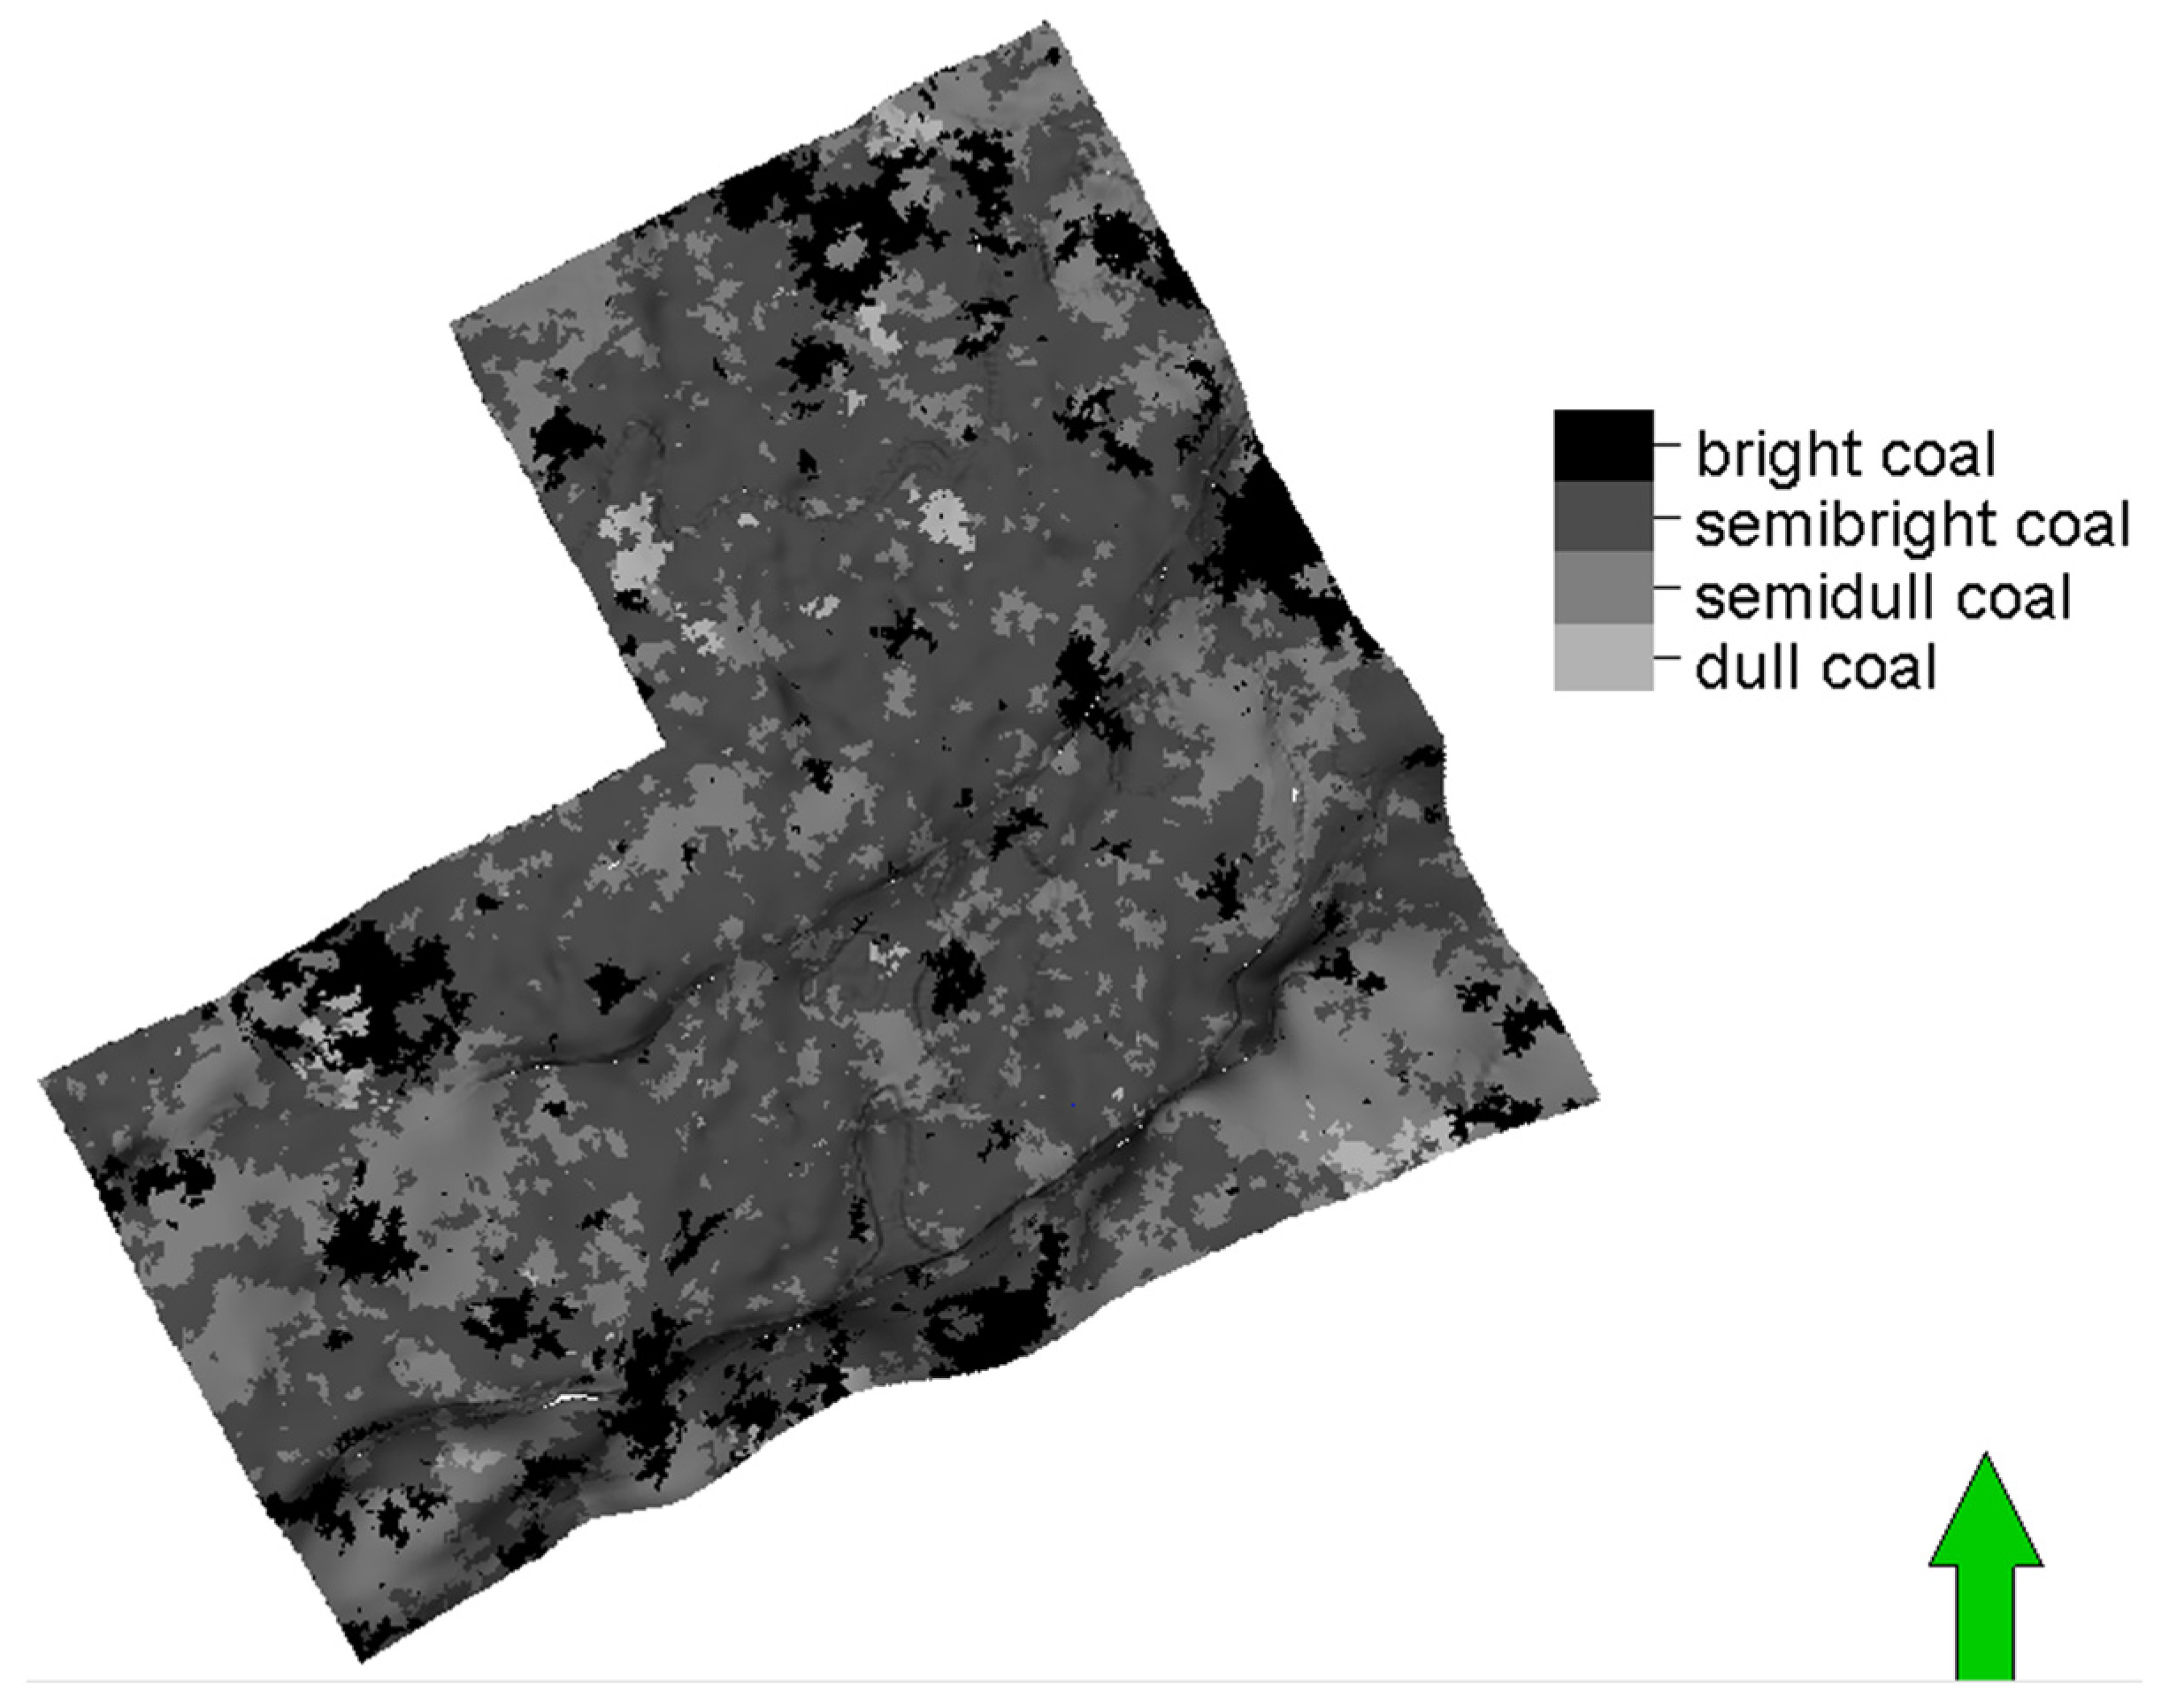
4.2. Modeling of Macroscopic Coal Lithotype

The establishment of a macroscopic coal lithotype model provides critical parameter constraints for subsequent coal seam attribute modeling. The modeling strategy simulates the spatial distribution of macroscopic coal lithotypes using Sequential Gaussian Simulation (SGS), with lithotype identification results from borehole locations serving as foundational data. Previous research has demonstrated quantifiable correlations between coal lithotype characteristics and corresponding well-logging responses, enabling the quantitative identification of lithotypes through logging data interpretation. In this study, the macroscopic lithotypes of 119 core samples from parameter wells within the study area were first determined through systematic core analysis, as illustrated in Figure 4a. Given the established correlation between logging parameters and coal lithotypes, neural network algorithms embedded in Petrel™ were employed to predict lithotypes in non-cored intervals, with two typical examples shown in Figure 4b.
The modeling results of the No. 3 coal seam (Figure 5) reveal distinct spatial heterogeneity in macroscopic lithotype distribution, dominated by semi-bright coal, which covers 38.76% of the area and exhibits laterally continuous depositional patterns in the western and northern sectors. Bright coal constitutes 29.73% of the seam, characterized by clustered distributions in the northern, southeastern, and southwestern regions, with isolated occurrences in the central areas, suggesting localized paleo-environmental controls on woody tissue preservation. Semi-dull coal accounts for 31.51% coverage, displaying well-connected networks in the southern and central zones, indicative of sustained mineral-rich or oxidative swamp conditions. Notably, dull coal is nearly absent (<0.01%), reflecting minimal wildfire events or rapid peat burial during peatification.

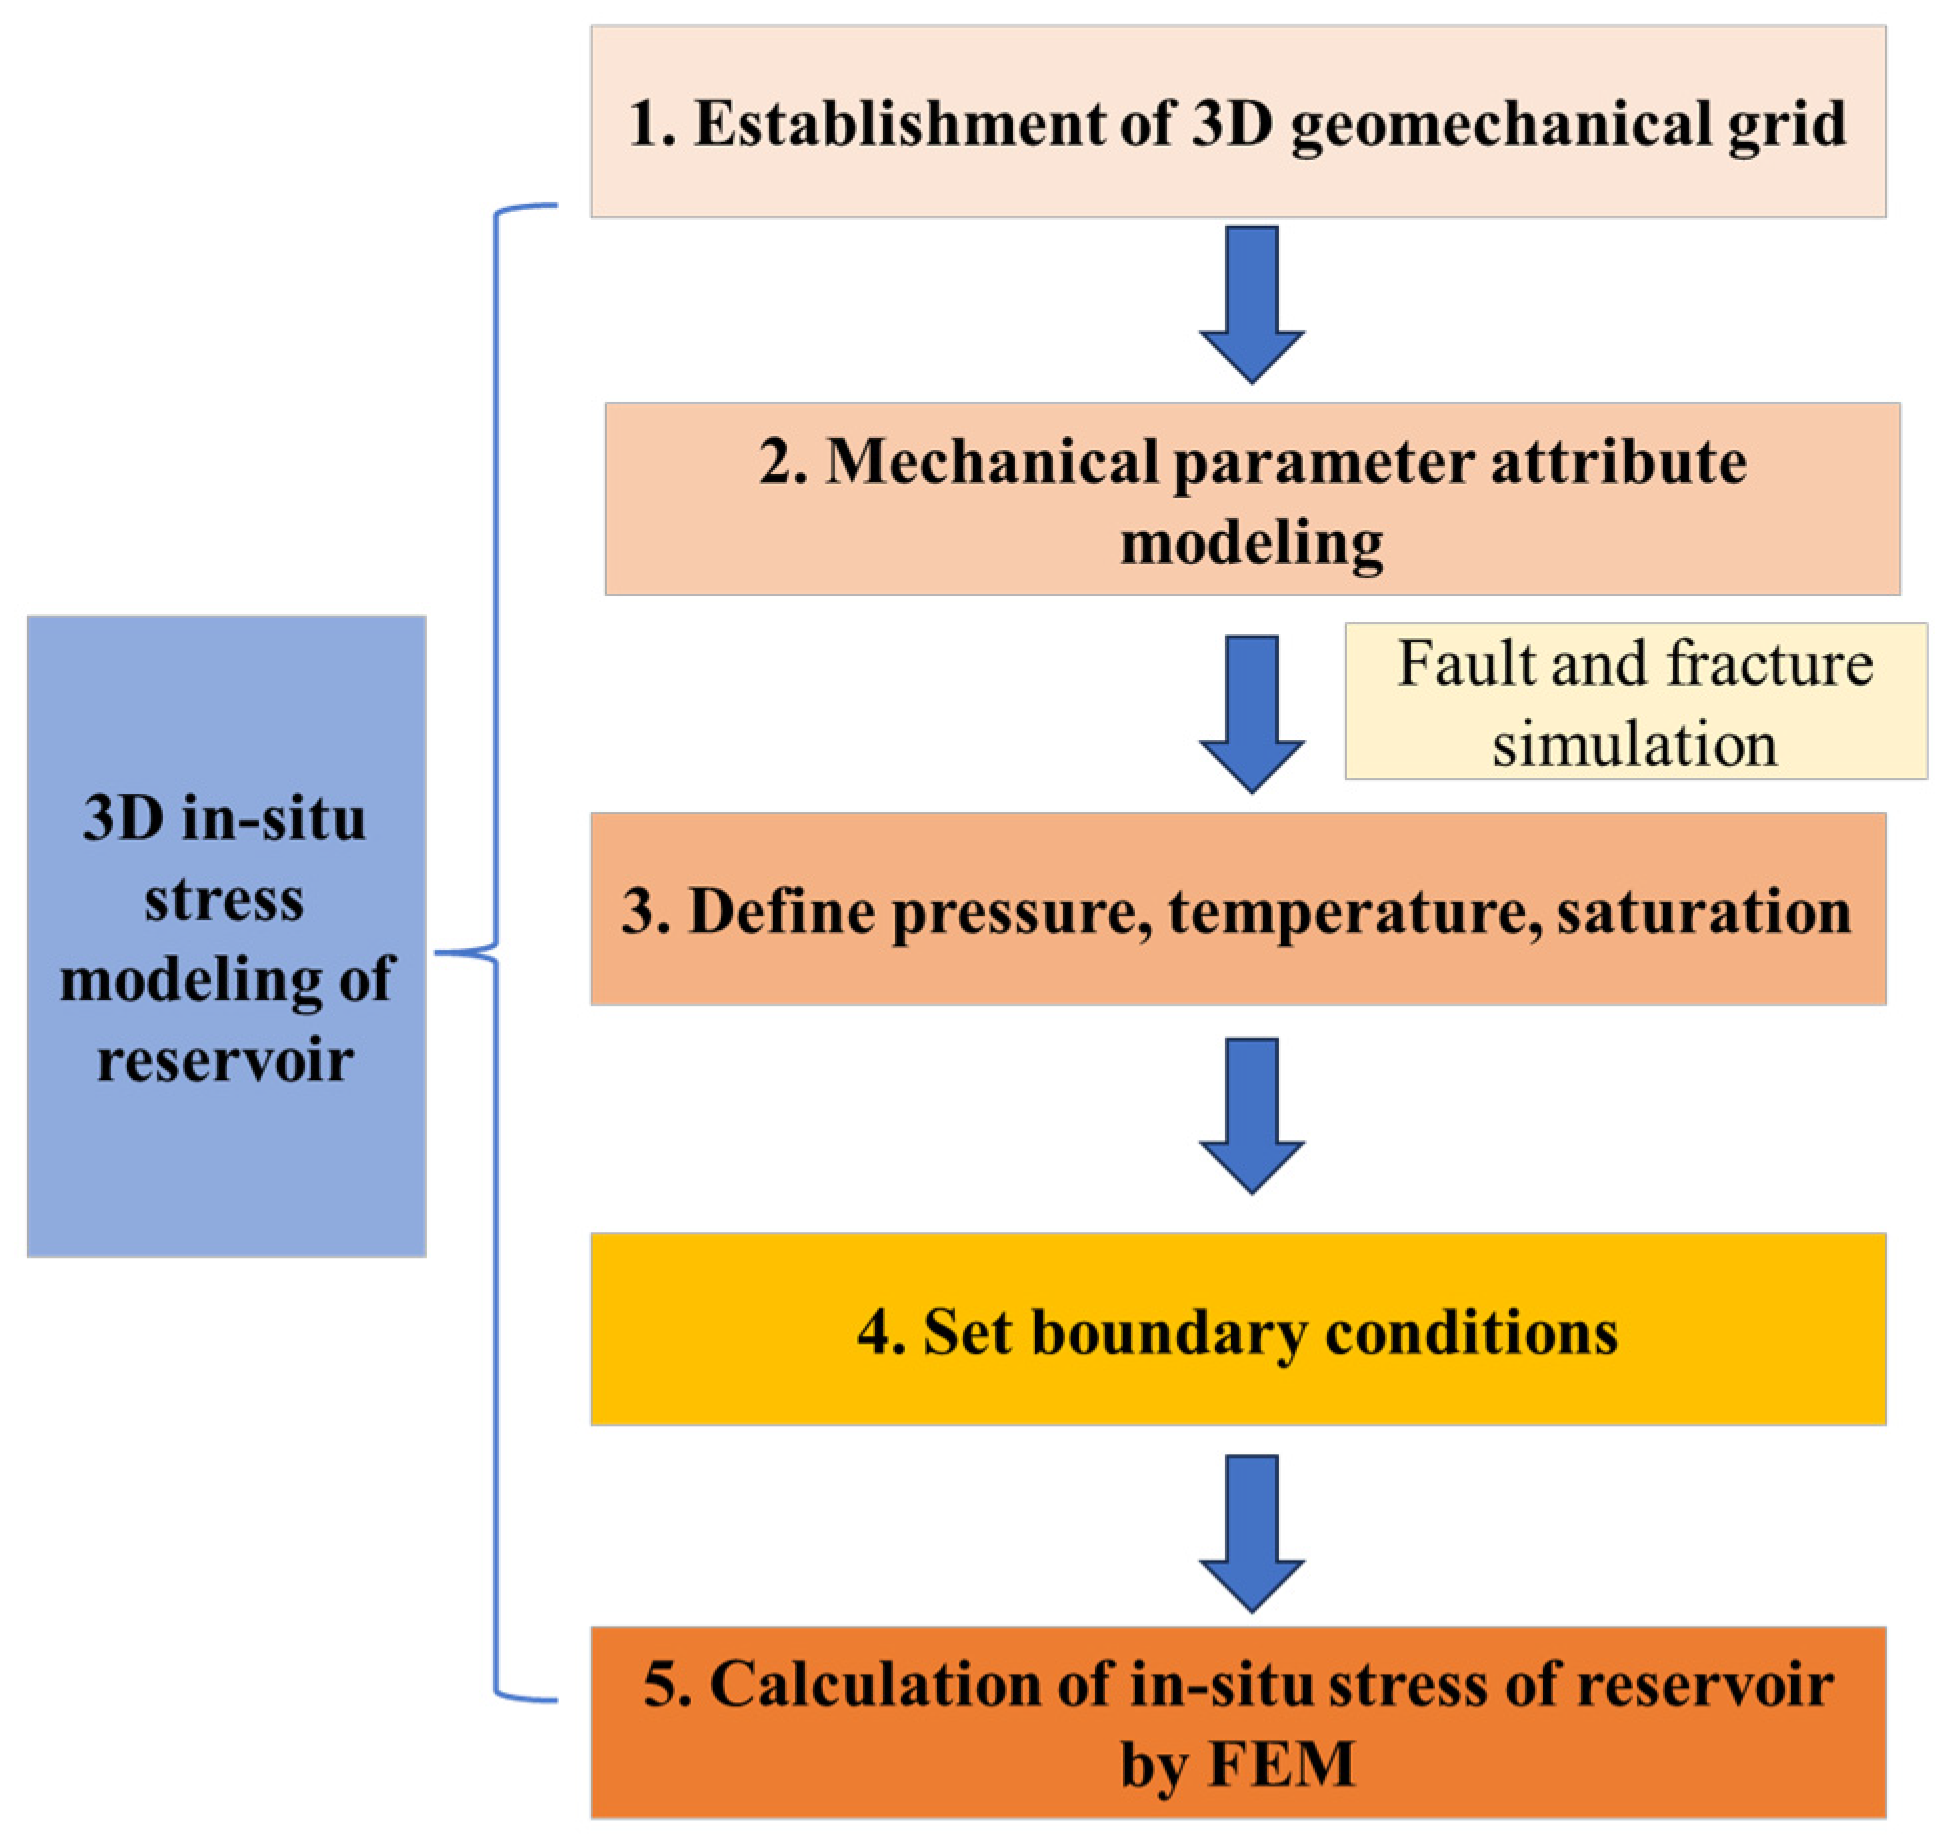
4.3. Modeling of 3D Geomechanical Stress

The development of a high-fidelity 3D in situ stress model requires seamless integration with a pre-constructed 3D geological framework. The workflow follows a five-stage hierarchical approach (Figure 6): geomechanical grid generation, mechanical property interpolation, natural fracture network characterization, boundary condition calibration, and finite element-based stress field simulation.

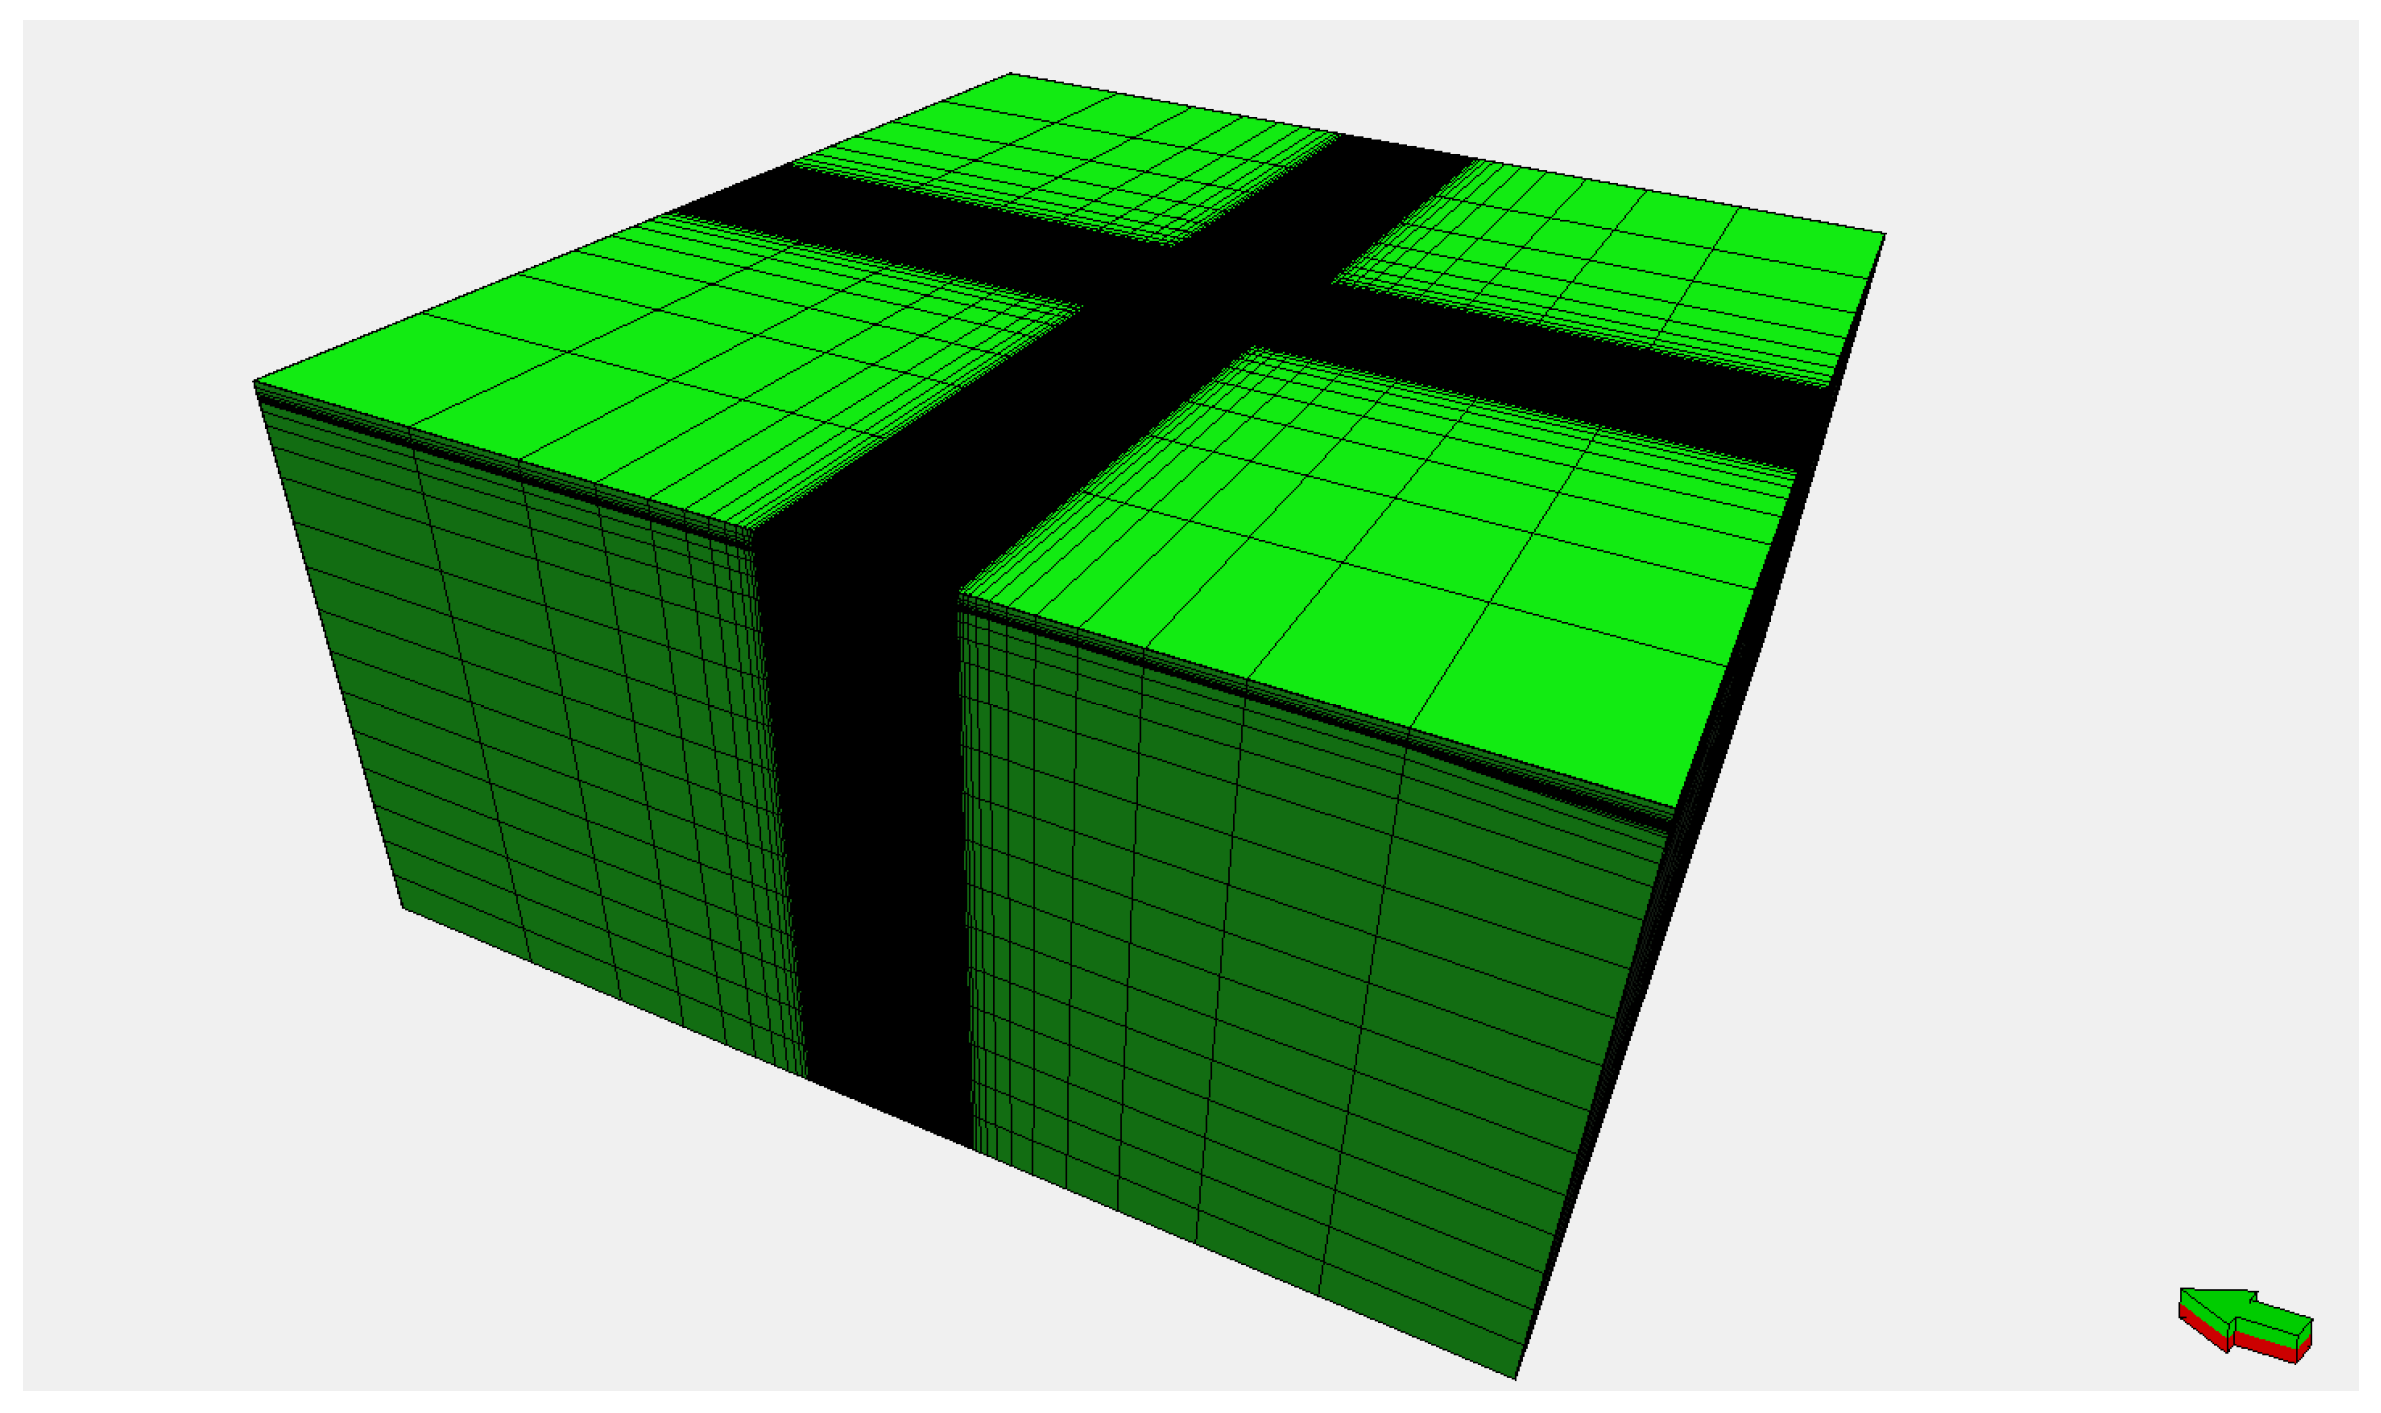
4.3.1. Geomechanical Grid Generation

A hexahedral-dominant grid architecture (aspect ratio < 3) was developed with progressive coarsening (scaling factor: 1.5×) from the reservoir core, prioritizing computational efficiency while maintaining ≤5% element distortion threshold. Lateral grid expansion along the I- and J-axes employed symmetric 15-layer scaling (1.5× ratio) with 50 m-thick rigid boundaries to mitigate edge effects, while vertical extension to the surface (Z = −900 m) ensured smooth cell-size transitions through graded coarsening. Underburden optimization constrained global grid dimensions to 197 × 210 × 44 cells (1,820,280 elements), balancing aspect ratio compliance (<3) with minimized computational overhead (Figure 7).

4.3.2. Mechanical Property Interpolation

Well-logging-derived rock mechanical parameterization has emerged as a cost-efficient methodology that provides continuous sampling coverage, enhanced vertical resolution (typically at sub-meter scales), and improved compatibility with reservoir-scale geomechanical modeling workflows [27]. This technique leverages multipole array acoustic logging tools to simultaneously record compressional wave slowness and shear wave slowness measurements across diverse lithological sequences. Through petrophysical inversion of these acoustic datasets, critical elastic mechanical parameters (e.g., Young’s modulus, Poisson’s ratio, and bulk modulus) can be systematically derived.
(1)
Poisson’s Ratio (μ)
Poisson’s ratio is defined as the absolute ratio of transverse strain to axial strain during uniaxial or triaxial compression within the elastic deformation stage. It is also termed the lateral compression coefficient. A higher Poisson’s ratio indicates that the material undergoes greater transverse deformation relative to longitudinal deformation before plastic deformation occurs. The formula is:
μ = Δ t s 2 2 Δ t p 2 2 ( Δ t s 2 Δ t p 2 )
where t s is shear wave slowness, μs/ft; t p is compressional wave slowness, μs/f.
(2)
Shear Modulus (G)
The shear modulus represents the ratio of shear stress to shear strain within the proportional limit of elastic deformation under shear stress. It characterizes the material’s ability to resist shear deformation. A higher shear modulus indicates greater rigidity of the material. The formula is:
G = ρ Δ t s 2 × 1 0 6
where G is Shear Modulus, GPa; ρ is density of coal, g/m3.
(3)
Young’s Modulus (E)
Young’s modulus, also termed the longitudinal elastic modulus, is defined as the ratio of stress to strain within the elastic deformation range. It quantifies a material’s stiffness and reflects the rock’s ability to resist tensile deformation. The formula is:
E = G 3 Δ t s 2 4 Δ t p 2 Δ t s 2 Δ t p 2
where E is Young’s Modulus, GPa.
(4)
Bulk Modulus (K)
The bulk modulus is the reciprocal of the compressibility coefficient. The compressibility coefficient measures the relative volume change in a material per 1 MPa increase in confining pressure at constant temperature. The formula for bulk modulus is:
K = G 3 Δ t s 2 4 Δ t p 2 3 Δ t p 2
where K is Bulk Modulus, GPa.
(5)
Compressive Strength ( σ c )
Compressive strength represents the stress value at which a rock undergoes complete failure under uniaxial pressure. It indirectly reflects the formation fracture strength and is primarily correlated with the rock’s elastic modulus and clay content through a statistical relationship. The expression is:
σ c = a E 1 V sh + b E V sh
V sh = 4 Δ G R 1 3
Δ G R = G R G R m i n G R G R m a x
where V s h is clay content; a and b are empirical coefficients dependent on lithology, which is estimated at approximately 4.59 and 8.16. GR is gamma logging, API.
(6)
Tensile Strength (σt)
Tensile strength refers to the ultimate stress at which a rock undergoes complete failure under tension. It influences formation fracture pressure and is closely related to reservoir fracturing parameters. It can be approximately expressed as:
σ t = σ c / 12
where σt is tensile strength, MPa; σc is compressive strength, MPa.
(7)
Cohesion (τ) and internal friction angle (φ)
Cohesion describes the intrinsic bonding force between adjacent parts within a rock (also termed cohesive strength). A commonly used empirical formula is:
τ = 1 0 12 0.0054 1 + 0.78 V s h Δ t p 4 ( 1 2 μ ) ρ 2 1 + μ 1 μ
The internal friction angle characterizes the frictional properties between rock particles formed by their mutual displacement and bonding. It is defined as the angle between the failure envelope and the horizontal axis in a shear strength diagram.
φ = 36.545 − 0.4952τ
where τ is cohesion, and φ is the internal friction angle.

4.3.3. Modeling of Reservoir Fracture

Seismic amplitude reflects acoustic impedance contrasts at subsurface geological interfaces. Significant spatial variations in amplitude often correspond to discontinuities such as faults, fractures, or lithological changes. The amplitude contrast method is highly sensitive to abrupt seismic features (e.g., fault zones, high-angle fractures) and effectively captures subtle seismic signal variations. Figure 8a displays ant-tracking attribute results derived from amplitude contrast analysis. The ant-tracking volume reveals clear fracture traces with localized high-density fracture clusters, demonstrating the method’s capability to delineate fracture systems.
Fracture attributes (including aperture and permeability) in the study area were quantified using empirical relationships:
A f = L × N o r m a l ( 0.00001 ,   0.000002 )
P f = ( A f 3.2808 ) 2 × 10 15
where Af is the aperture of fracture, cm; L is the length of fracture, cm; and Pf is fracture permeability, mD.
After upscaling the fracture attribute volume, a deterministic fracture model is generated, as shown in Figure 8b. This model integrates key fracture characteristics (e.g., orientation, density, aperture, and connectivity) into a structured grid format suitable for reservoir simulation and engineering applications.

4.3.4. Boundary Condition Configuration

The geomechanical modeling framework requires simultaneous satisfaction of equilibrium equations, kinematic compatibility, and constitutive relationships, governed by physically constrained boundary conditions. Initial stress field boundary conditions were implemented for efficient regional stress tensor reconstruction, with critical input parameters structured as overburden stress magnitude and stress anisotropy ratios.
Given the abundance of well testing and logging in the Zhengzhuang Field, hydraulic fracturing was used to obtain the vertical principal stress (σv, MPa), maximum horizontal principal stress (σH, MPa), and minimum horizontal principal stress (σh, MPa) [28]. The calculated results of typical well σH, σh, and σv are shown in Table 1, which show that maximum and minimum horizontal stress gradient are 0.0344  MPa/m and 0.0215  MPa/m, respectively.

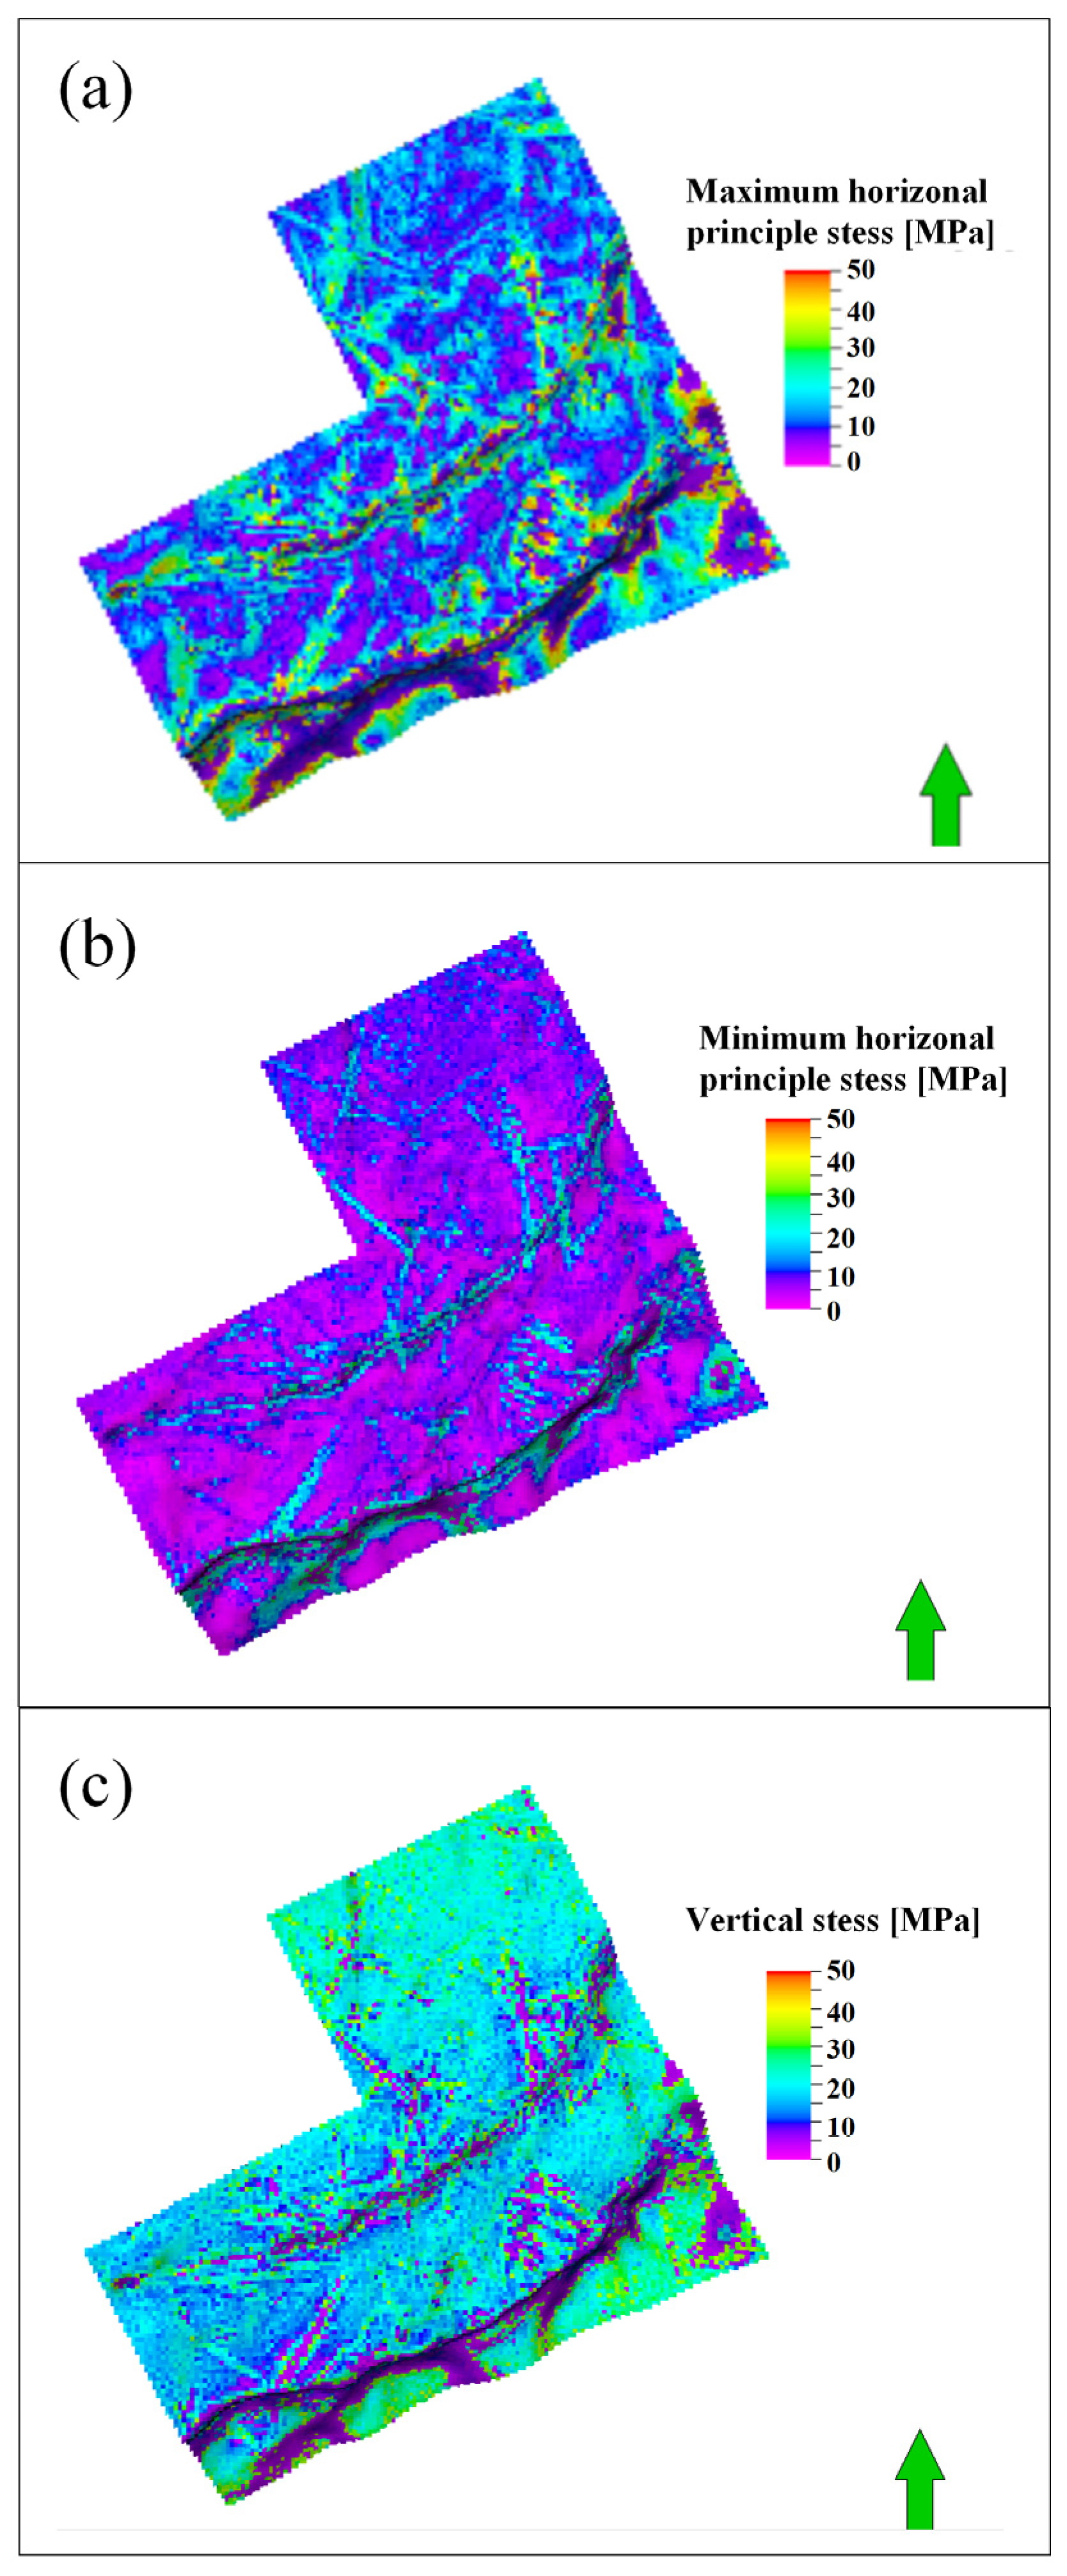
4.3.5. Modeling of In-Site Stress

Among numerical simulation methods, the finite element method (FEM) is one of the useful methods to solve geomechanical problems. According to the FEM, the modeling of σ H , σ h , and σ v in the study area are obtained (Figure 9).

4.4. Modeling of Reservoir Properties

This study employs a facies-controlled Sequential Gaussian Simulation (SGS) algorithm for attribute modeling (porosity and permeability) of coal reservoirs. Since sedimentary attributes within the same facies in the study area exhibit similar statistical patterns and value ranges, the modeling process integrates these characteristics to constrain property parameters layer-by-layer and phase-by-phase during stochastic simulation. This approach ensures that the attribute models more accurately reflect the physical property distribution in the study area.

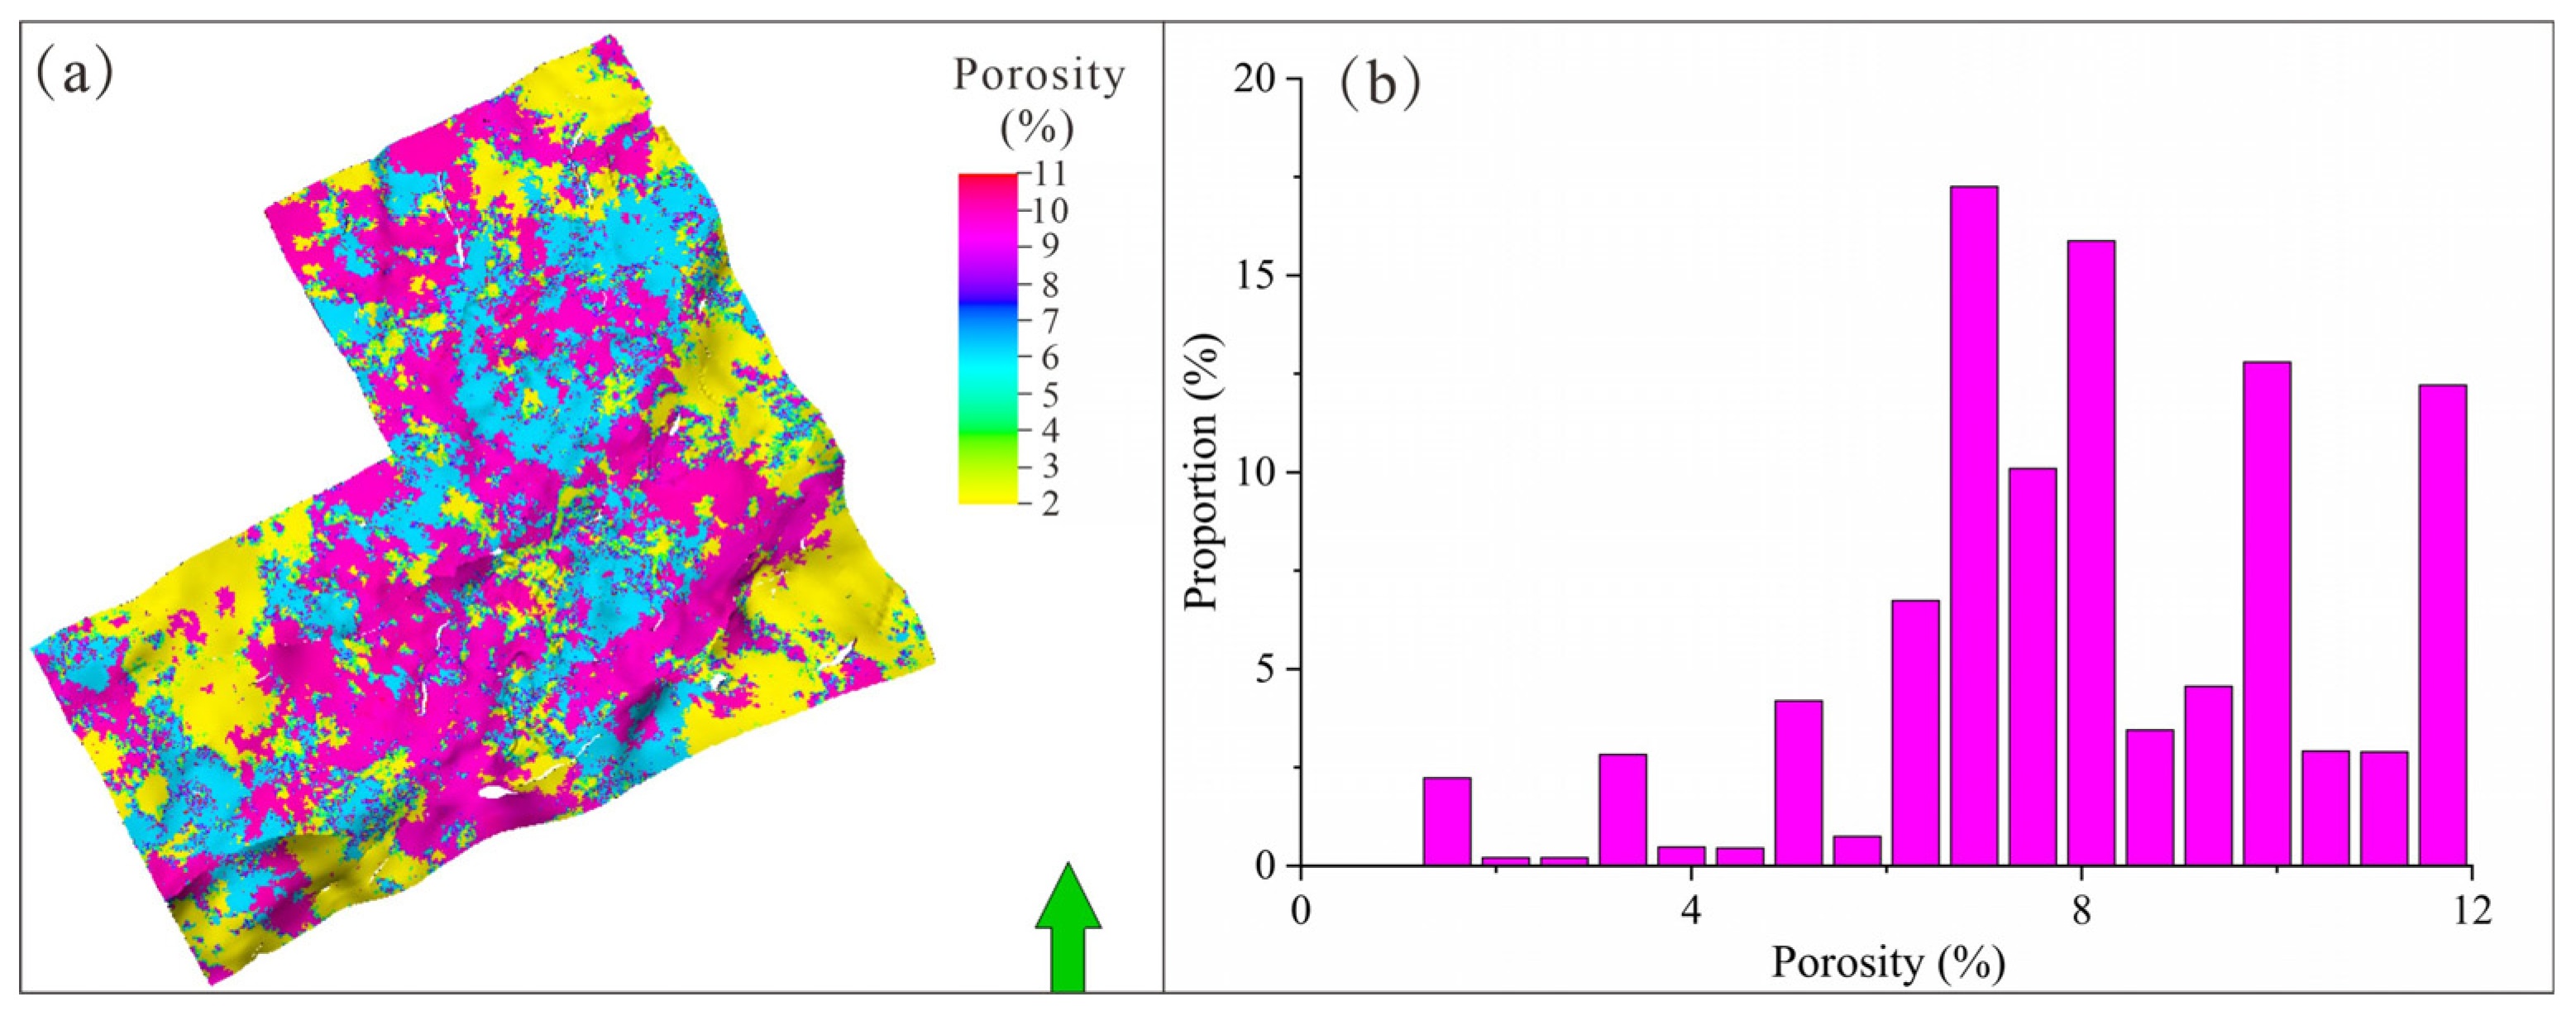
4.4.1. Modeling of Reservoir Porosity

Coal reservoir porosity serves as a fundamental petrophysical parameter governing methane storage capacity and fluid transport mechanisms in CBM systems. This study establishes a novel porosity modeling workflow through systematic integration of density logging measurements. Generally, reservoir porosity can be derived from the relationship between density logs and porosity values [29], as follows:
φ f = ρ m a ρ b ρ m a ρ f
where φ f is coal porosity (%); ρ m a is density of rock matrix (kg/m3); ρ b is bulk density (kg/m3); and ρ f is density of pore fluid (kg/m3).
Figure 10 delineates the reservoir porosity distribution of the No. 3 coal seam. As can be seen, high-porosity zones (8–12%), predominantly distributed across the central-southern and eastern sectors with robust lateral continuity. Discrete high-porosity anomalies (8–10%) in northern structural culminations further reinforce this lithotype-controlled porosity pattern. Moderately porous regions (5–7.5%), characterized by intermittent connectivity in central-north and southwestern domains. Marginally porous zones (1.3–4%) along the northern, southeastern, and western peripheries demonstrate fragmented distributions.

4.4.2. Modeling of Reservoir Permeability

The permeability calculation of coal seam mainly focuses on fracture permeability. Generally, the fracture aperture and fracture spacing are two key parameters for the calculation of reservoir permeability. The fracture aperture and fracture spacing can be calculated using the following equations, respectively,
h f = Δ C 4 C m f
h m = h f φ f
where hf is the fracture aperture (cm); ΔC is the difference between deep and shallow conductivity measurements (S/m); Cmf is the mud filtrate conductivity (S/m); hm is fracture spacing (cm); and φf is coal porosity (%).
Then, the fracture permeability of No. 3 coal seam was predicted using the Fracture-Stehfest (F-S) method. The fracture permeability of No. 3 coal seam can be calculated as:
K f = R F × 8.33 × 1 0 6 × h f 3 h m = R F × 8.33 × 1 0 6 × h f 2 × φ f
where Kf is fracture permeability (μm2); RF is the correlation coefficient, assigned an empirical value of 0.338 × 10⁴.
Following permeability calculations for individual wells using Equation (16), the permeability data were discretized. The permeability model of the No. 3 coal seam was then constructed (Figure 11) using the SGS method. Model results reveal a tripartite permeability hierarchy: (1) High-permeability sweet spots (0.8–1.0 mD) cluster in the northern and southeastern structural domains; (2) Moderately permeable corridors (0.5–0.6 mD) dominate central-south regions; (3) Low-permeability compartments (0.01–0.04 mD) occupy basin-margin positions (northwest, southeast). The reservoir-scale geometric mean permeability is 0.35 mD.

4.4.3. Modeling of Gas Content

The development of a coal seam gas content model is fundamental for optimizing CBM recovery strategies. A 3D gas content distribution model of the No. 3 coal seam was established by integrating field-measured gas content data from boreholes within and surrounding the study area. As shown in Figure 12, the gas content of the No. 3 coal seam exhibits a range of 14.03–33.54 m3/t (average 21.7 m3/t), delineating three distinct domains: high-gas-concentration zones (>28.0 m3/t) dominate the western and southeastern structural compartments, intermediate-gas zones (20–28 m3/t) display spatially sporadic distributions, and low-gas regions (<20 m3/t) form continuous belts in central and central-northern areas.

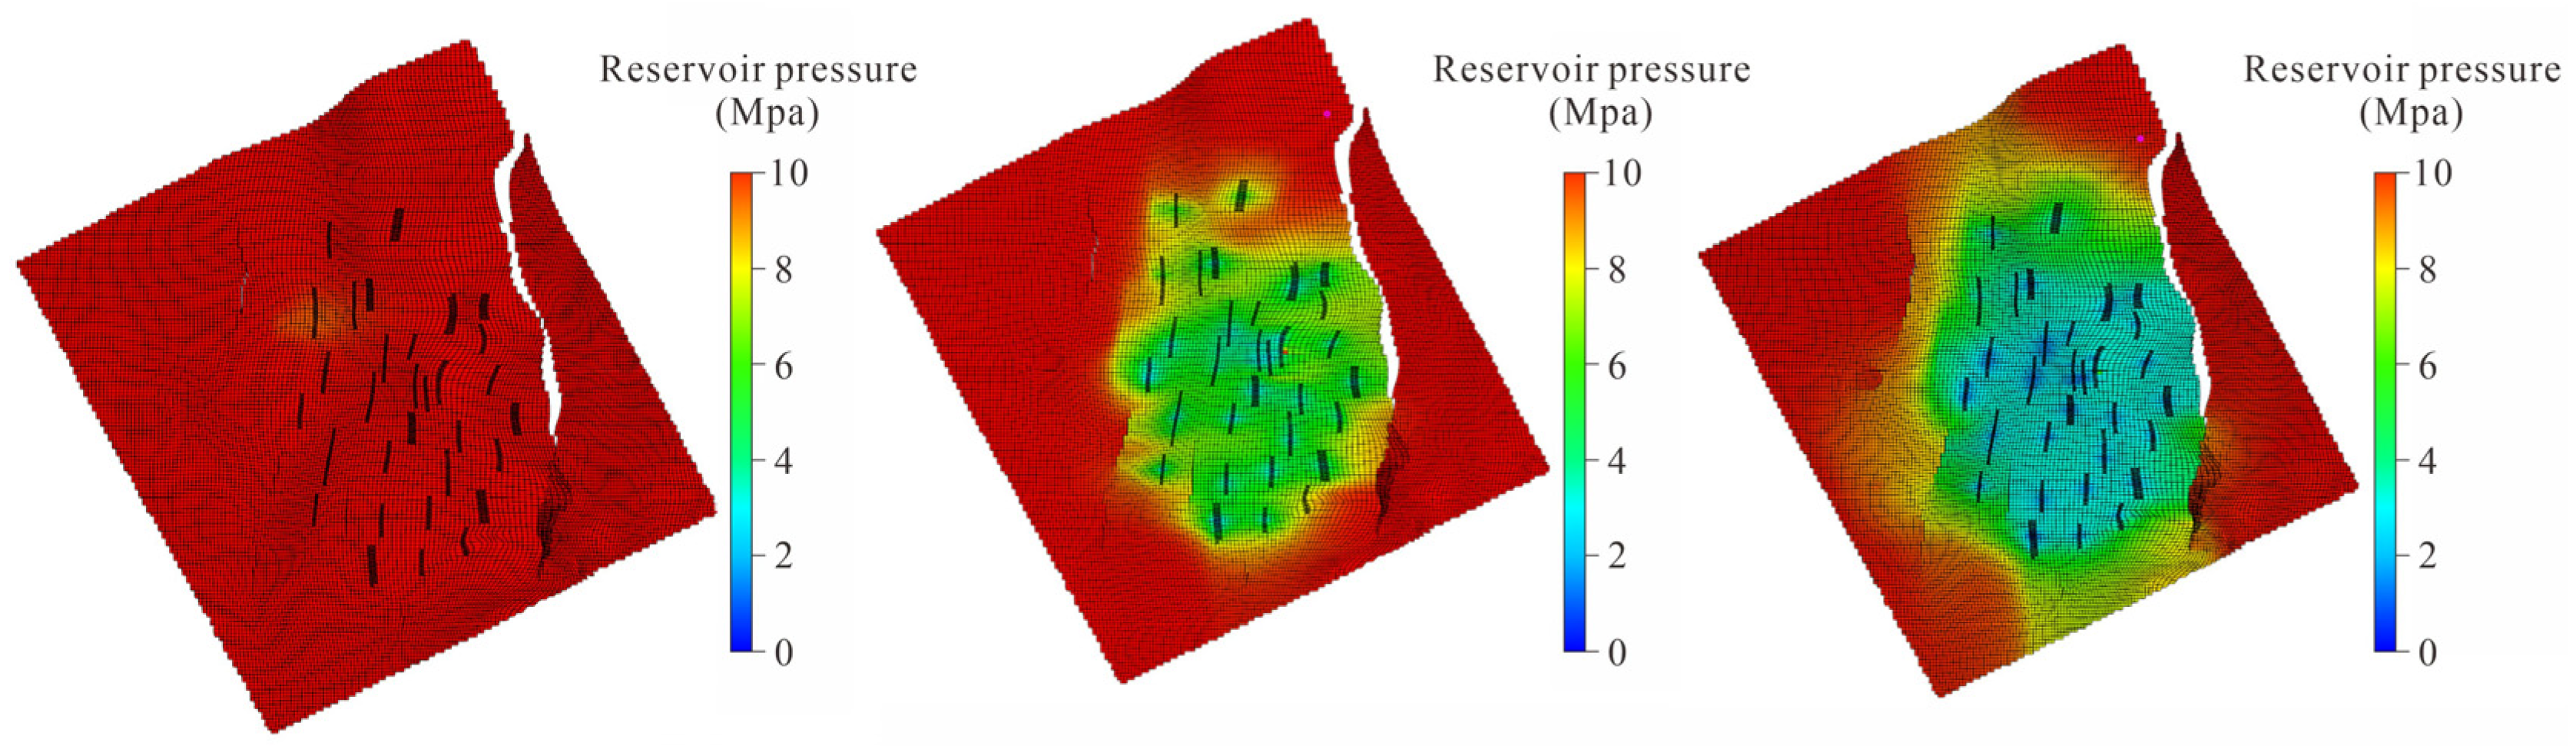
4.5. Production Numerical Simulation of Typical Well Group

Due to the large study area, conducting full-field numerical simulations of production processes would involve excessive computational load and coarse accuracy. Numerical simulations of production dynamics were conducted using CMG (v. 2021) software based on the Petrel geological model, focusing on a typical CBM well group in the northern Dongda 3D area (Figure 13). The study area spans 4650 m × 4675 m and includes 27 production wells. These wells were gradually put into operation between 2010 and 2012, accumulating 4–5 years of production history. The peak gas production of individual wells in this area ranged from 500 to 1500 m3/d, with some wells achieving stable production. The overall drainage–depressurization–desorption–production characteristics of CBM development were evident.

4.5.1. Numerical Model Setup

The geological model generated by Petrel was imported into CMG’s IMEX simulator, where reservoir and well parameters were configured. Based on actual reservoir data and production dynamics research objectives, grid sizes in the I, J, and K directions were adjusted. The horizontal grid spacing was set to Dx = Dy = 25 m, while the vertical direction was subdivided into 20 grids. Reservoir properties for the area, derived from the geological model, are summarized in Table 2. A dual-porosity dual-permeability (DUALPERM) model was used for initialization, assuming fluid flow in both matrix and fractures, with interporosity transfer driven by diffusion or Darcy flow depending on pressure gradients. The model also captures dynamic gas-water interactions, including CH4 adsorption/desorption in the coal matrix based on Langmuir isotherms. For history matching, a fixed bottom-hole flowing pressure method was used to match gas and water production across all 27 wells.

4.5.2. History Matching

As shown in Figure 14, the simulated cumulative gas and water production of CBM wells in the block were compared with actual field data. The results indicate relatively large errors in early-stage production due to operational instability and frequent adjustments in production strategies, which complicated the matching process. However, the matching accuracy improved as production stabilized. For cumulative gas production after full-scale development, the maximum error was 15.2% (i.e., a matching accuracy > 84.8%). For cumulative water production, the maximum error was 11.6% (i.e., a matching accuracy > 88.4%). Moreover, history matching was performed for gas and water production across all 27 wells. For each single well, the matching accuracy was high during the stable gas decline phase but poorer during early production. This discrepancy arose from rapid changes in reservoir properties and operational adjustments (e.g., drainage rates and gas ramp-up), which affected the simulation of initial gas and water.

4.5.3. Residual Gas Content of Reservoir

Figure 15 illustrates the dynamic changes in reservoir pressure over time within the simulated area. Reservoir pressure declined rapidly during the early years of development but stabilized in later stages. This trend is attributed to two factors: (a) early-stage production required significant depressurization and drainage to initiate gas desorption, but limited desorbed gas provided minimal energy support to the reservoir; (b) In later stages, higher gas desorption rates under lower pressures enhanced energy replenishment, slowing pressure decline. By the simulated cutoff date, the reservoir pressure at the central part of the well group had decreased to approximately 3 MPa, demonstrating effective pressure control by the deployed well pattern. The remaining gas saturation in the study area was obtained (Figure 16), showing relatively minor variations in gas saturation across the overall region. Concurrently, the distribution of residual gas in the study area can be derived from the gas saturation distribution pattern.

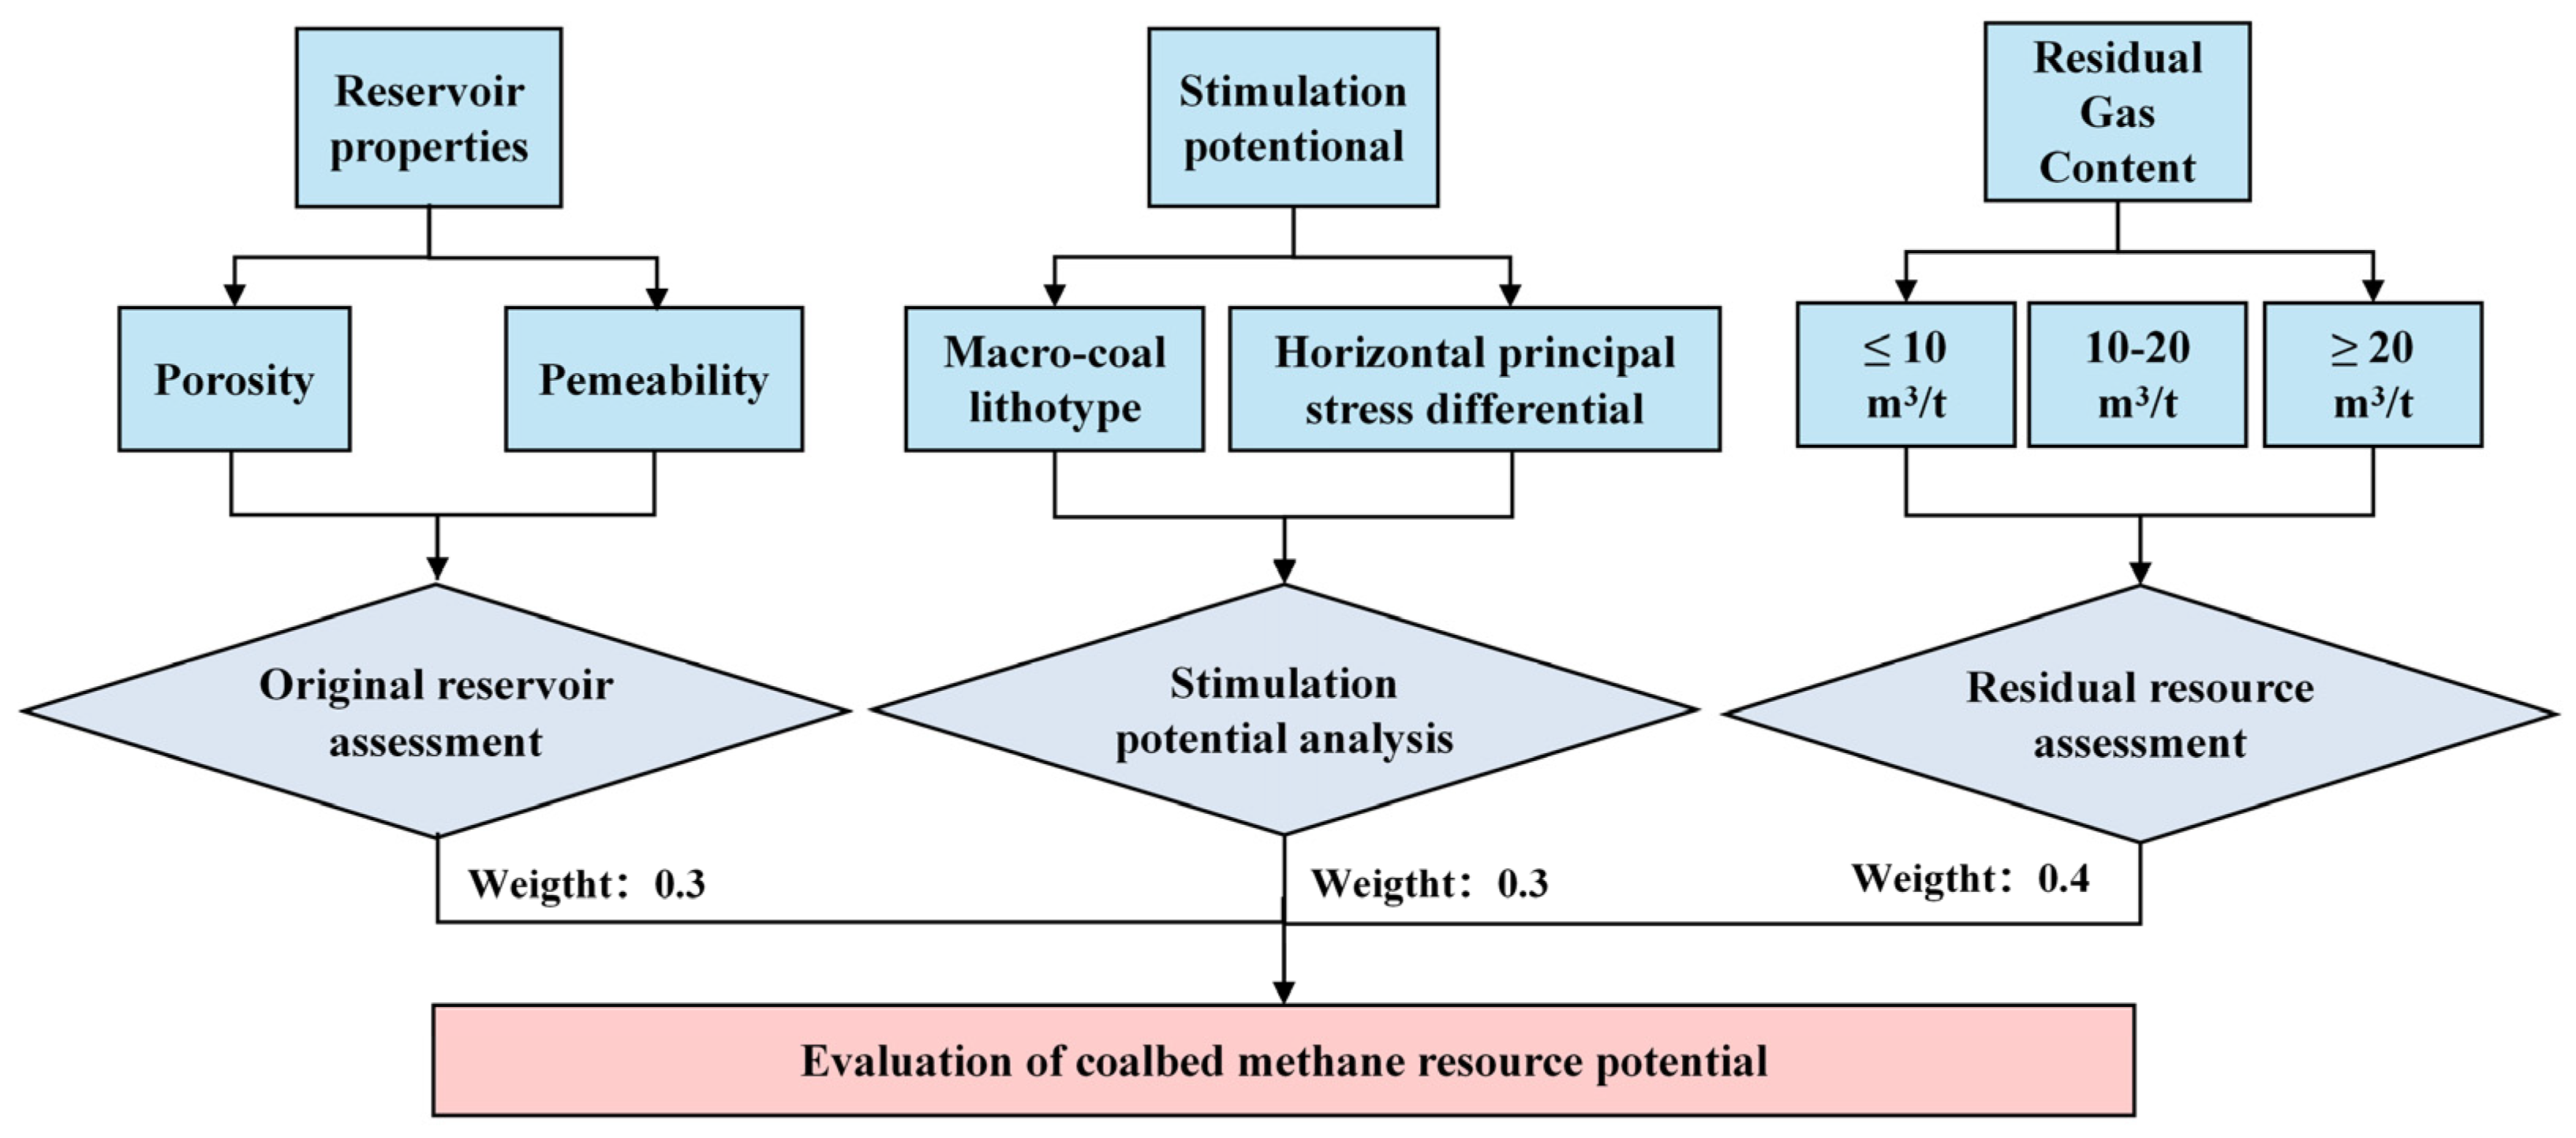
4.6. Potential Evaluation of CBM Resources

4.6.1. Residual Resources Assessment

The spatial distribution of residual CBM resources is governed by drainage interference effects from individual wells. The technically recoverable resources available for future development adjustments are determined by subtracting well interference-affected volumes from the total in situ resources within the well pattern. The well-controlled gas volume can be calculated using drainage area and resource concentration:
Q G = d 2 Q
where Q G is gas-in-place per well, m3; and d is drainage radius, m.
Using actual production data from the study area, the well-controlled recovery factor ( η ) is derived from cumulative gas production (Qg):
η = Q g Q G
The equivalent residual gas content ( V ) is calculated by integrating production performance, resource concentration, and drainage control:
V = Q G Q g 0.01 × h × ρ
A residual resource distribution map for the No. 3 coal seam (Figure 17) was generated through Kriging interpolation of the residual gas content. As can be seen, the central and western margin zones exhibit lower residual resources, while the western and eastern sectors show higher residual gas concentrations. For large study areas, residual gas content is determined using the aforementioned calculation method, while for small regions such as a typical well-group block, CMG numerical simulation results can be applied to refine residual gas distribution.

4.6.2. Evaluation of CBM Resource Potential

Based on reservoir modeling results, the CBM resource potential was evaluated through the analytic hierarchy process method, and the details and application example of this method can be found in a previous study [30]. The evaluated workflow of CBM resource potential was displayed in Figure 18. First, three critical assessment projects were established with weighted importance: reservoir properties (0.3), stimulation potential (0.3), and residual gas content (0.4), with weights validated through the CBM exploration and development pilot project of Zhengzhuang Field.
U = 0.3 U 1 + 0.3 U 2 + 0.4 U 3
where U is evaluated results of CBM resource potential; and U 1 , U 2 , and U 3 are evaluated scores of reservoir properties, stimulation potential, and residual gas content, respectively.
And then, threshold values statistically derived from data analysis and expert calibration (Table 3) categorized reservoir parameters into Better, Good, and Bad classes. A tiered scoring system was applied, assigning 1.0, 0.8, and 0.6 points to Better, Good, and Bad categories, respectively.
U 1 = u 1 + u 2
U 2 = v 1 + v 2
U 3 = w 1
where u 1 and u 2 are evaluated scores for porosity, permeability, and gas content, respectively; v 1 and v 2 are evaluated scores for macro-coal lithotype and horizontal principal stress differential, respectively; w 1 is the evaluated score for residual gas content.
Integrated reservoir assessment delineated three CBM prospectively tiers within the study area (Figure 19). The type I reservoirs, primarily concentrated in the southwestern part of the study, showcase high residual resources (≥20 m3/t) coupled with optimal reservoir conditions, including relative high porosity (8–12%) and permeability (≥0.8 mD). Type II transitional reservoirs prospects, across the northern and southern transitional part of the study area, exhibit moderate porosity (5–8%), permeability (0.5–0.8 mD), and gas content (10–20 m3/t). Type III marginal reservoirs, constrained by low gas content (<10 m3/t), demonstrate limited commercial viability without substantial technological intervention.
Integrated reservoir assessment delineated three CBM prospectively tiers within the study area (Figure 19). The type I reservoirs, primarily concentrated in the southwestern part of the study, showcase high residual resources (≥20 m3/t) coupled with optimal reservoir conditions, including relatively high porosity (8–12%) and permeability (≥0.8 mD). Type II transitional reservoir prospects, across the northern and southern transitional part of the study area, exhibit moderate porosity (5–8%), permeability (0.5–0.8 mD), and gas content (10–20 m3/t). Type III marginal reservoirs, constrained by low residual gas content (<20 m3/t), low permeability (<0.4 mD), low porosity (<4%), demonstrate limited commercial viability without substantial technological intervention.

5. Conclusions

This study establishes a comprehensive workflow for CBM reservoir evaluation and development optimization in the Zhengzhuang Block. Key findings include:
(1)
The 3D geological model effectively characterized spatial heterogeneity of the No. 3 coal seam, identifying semi-bright coal as dominant, with porosity (1.3–12%) and permeability (0.01–1 mD) variations controlled by fracture networks.
(2)
Stress field modeling revealed significant stress anisotropy (σHh gradients: 0.0344/0.0215 MPa/m), delineating stimulation-favorable zones in southwestern structural compartments.
(3)
Numerical simulations revealed that 84.8% of cumulative gas production and 88.4% of water production were matched historically, with residual gas content (14–33.5 m3/t) concentrated in structurally elevated western and southeastern regions.
(4)
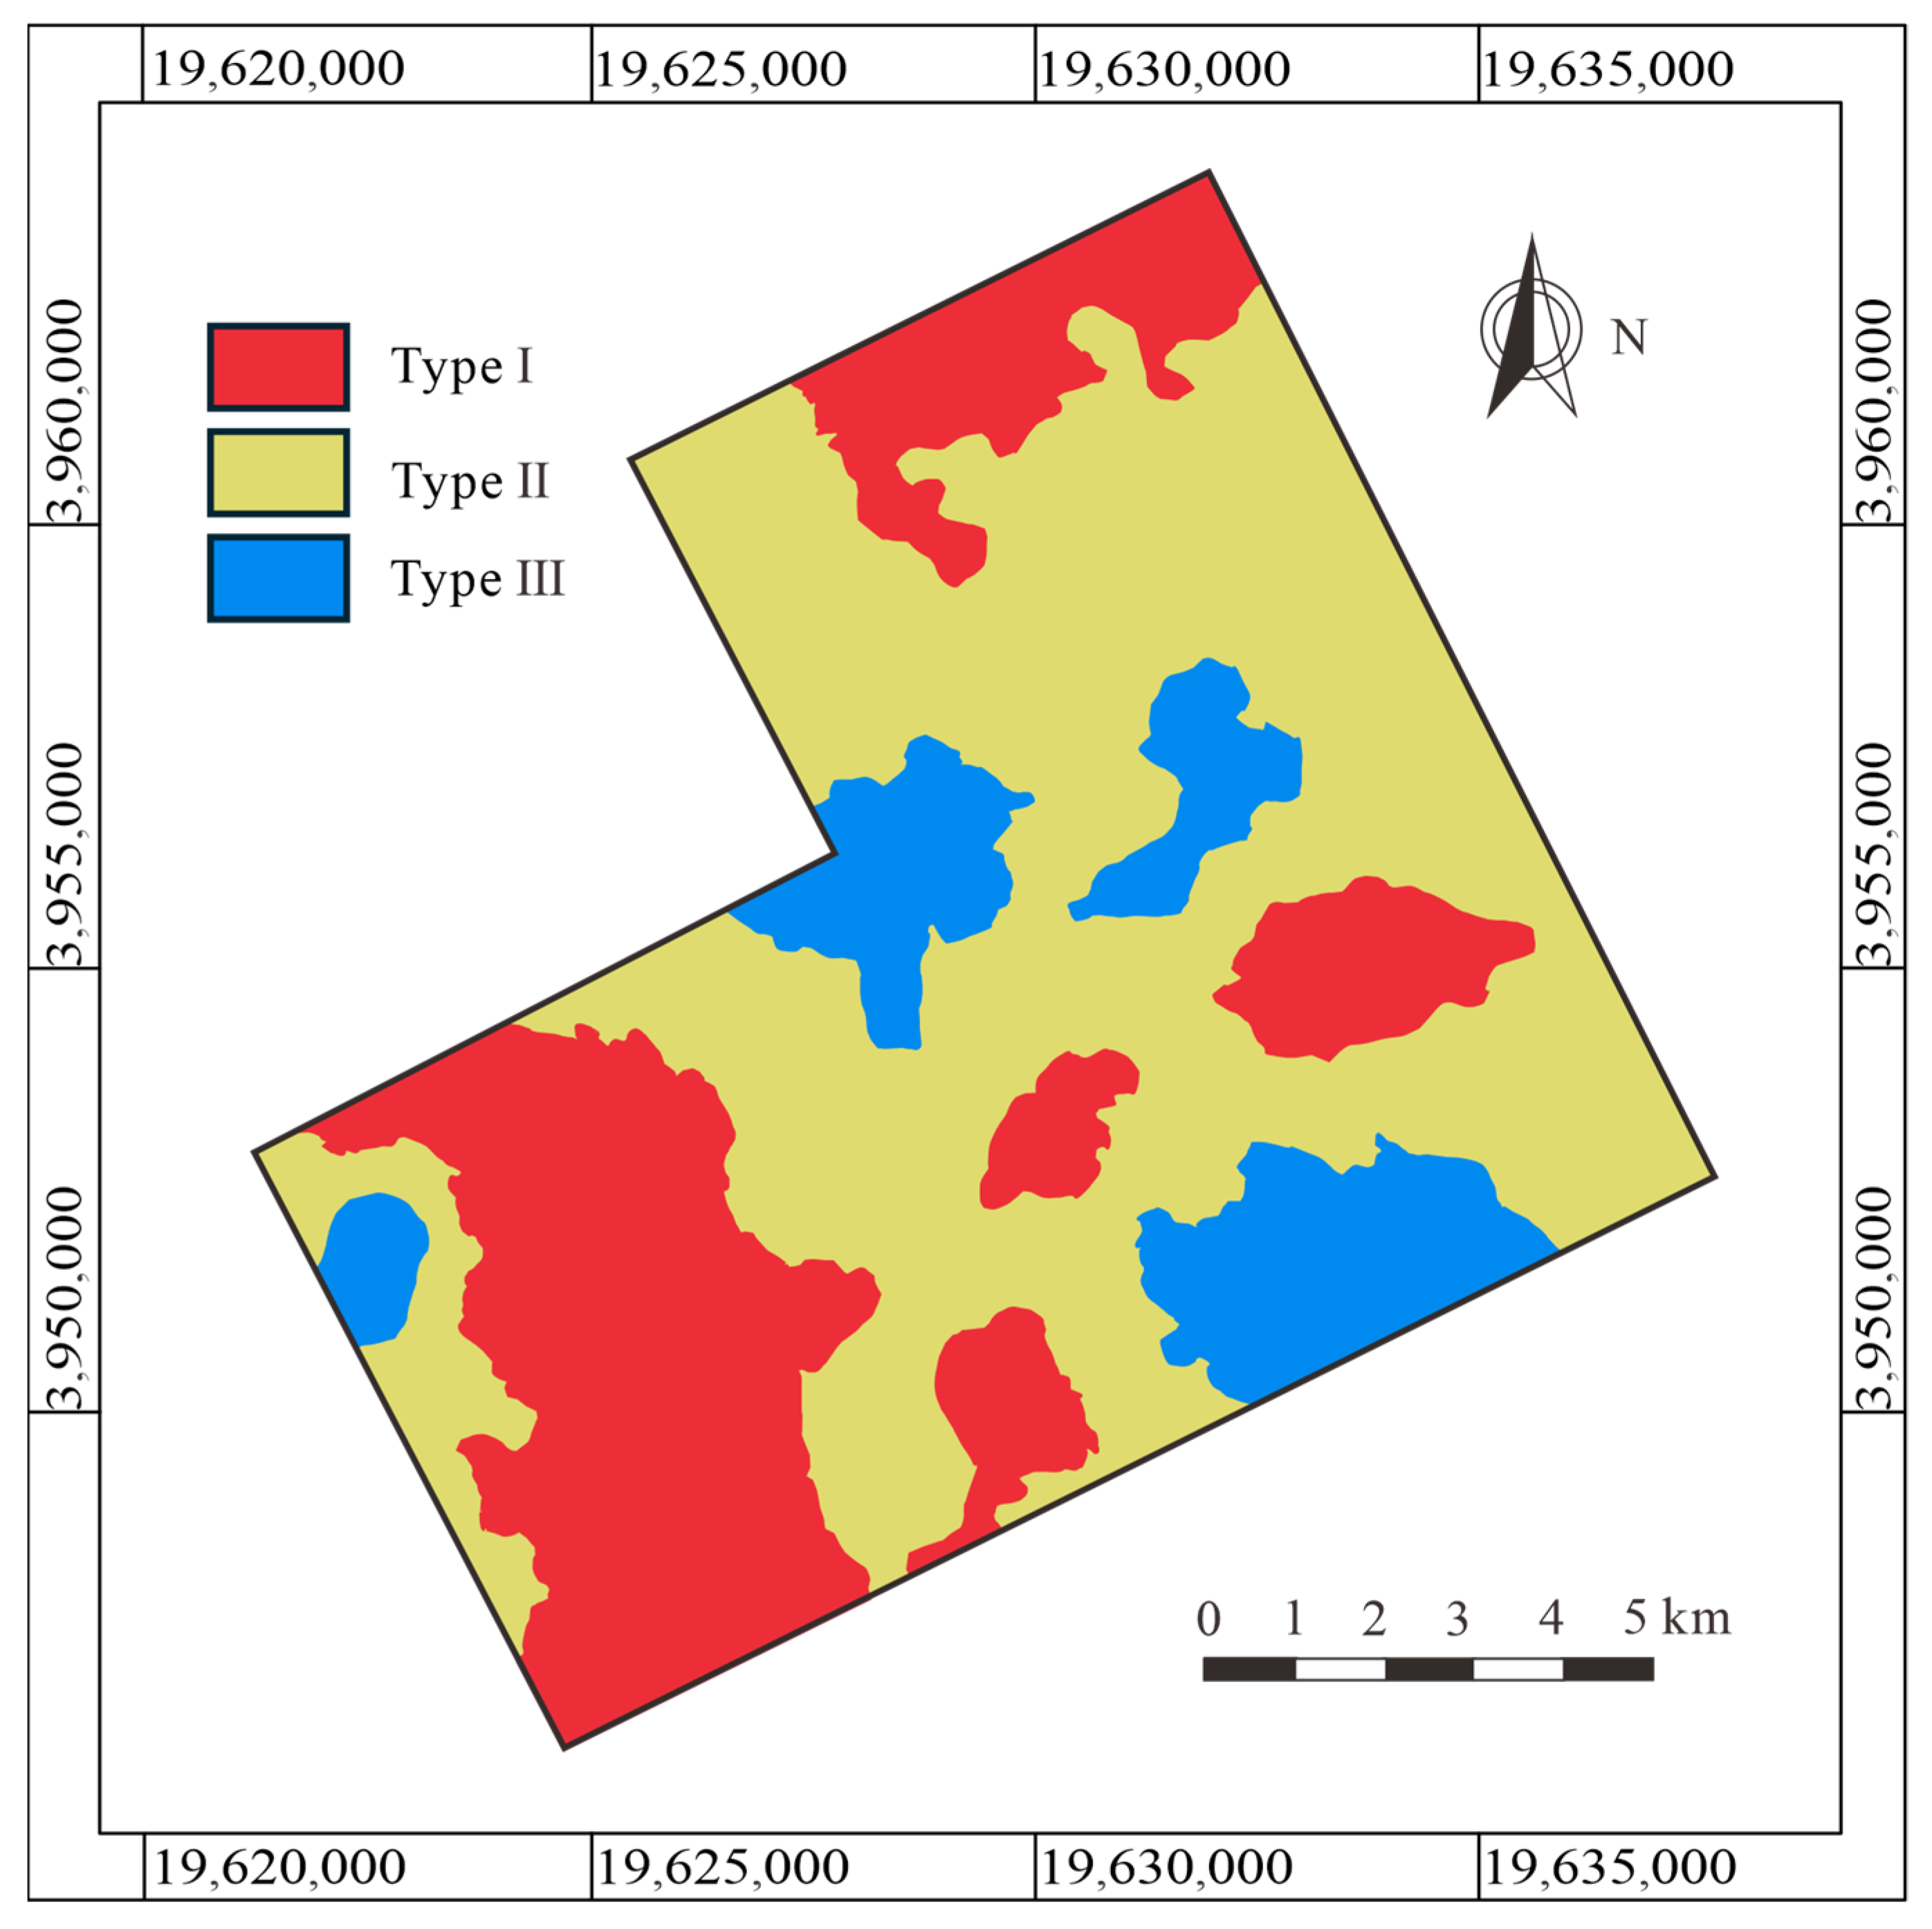
A multi-criteria evaluation framework categorized resources into three tiers: Type I, Type II, and Type III, among which Type I areas are prioritized for future development. This integrated approach establishes a technical basis for optimizing well patterns, improving hydraulic fracturing efficiency, and enhancing residual gas recovery in heterogeneous CBM reservoirs.

Author Contributions

Methodology, X.L., Q.Z. and Z.W.; Software, C.Z.; Validation, Z.L., X.L., Y.Y., T.Z. and Z.W.; Formal analysis, Z.L.; Investigation, Q.Z., T.Z. and C.Z.; Resources, Z.L.; Writing—original draft, H.W.; Funding acquisition, H.W. All authors have read and agreed to the published version of the manuscript.

Funding

This research was funded by the National Key R&D Program of China (2024YFC2909400), the National Natural Science Foundation of China [42402180, 42202195], and the Hebei Natural Science Foundation [D2024209008].

Data Availability Statement

The original contributions presented in this study are included in the article. Further inquiries can be directed to the corresponding author.

Conflicts of Interest

Authors Zhong Liu, Xiuqin Lu, Qianqian Zhang, Yanhui Yang, Tao Zhang, Chen Zhang and Zihan Wang were employed by the Petro China Huabei Oilfield Company. The remaining authors declare that the research was conducted in the absence of any commercial or financial relationships that could be construed as a potential conflict of interest.

References

  1. Pashin, J.C. Geology of North American coalbed methane reservoirs. In Coal Bed Methane (Second Edition): Theory and Applications; Elsevier Inc.: Amsterdam, The Netherlands, 2020. [Google Scholar] [CrossRef]
  2. Cai, Y.; Liu, D.; Yao, Y.; Li, J.; Qiu, Y. Geological Controls on Prediction of Coalbed Methane of No.3 Coal Seam in Southern Qinshui Basin, North China. Int. J. Coal Geol. 2011, 88, 101–112. [Google Scholar] [CrossRef]
  3. Ma, X.; Zhou, A.; Cheng, X.; Cheng, C.; Zhao, W. Multi-Field Coupling Models of Coal and Gas and Their Engineering Applications to CBM in Deep Seams: A Review. Energies 2024, 17, 6221. [Google Scholar] [CrossRef]
  4. Wei, C.; Qin, Y.; Wang, G.; Jiang, B.; Zhang, Z. Simulation Study on Rvolution of Coalbed Methane Reservoir in Qinshui Basin, China. Int. J. Coal Geol. 2007, 72, 53–69. [Google Scholar] [CrossRef]
  5. Li, C.; Sun, L.; Zhao, Z.; Zhang, J.; Li, Y.; Meng, Y.; Wang, L. A Method for Evaluating Coalbed Methane Reservoir Productivity Considering Drilling Fluid Damage. Energies 2024, 17, 1686. [Google Scholar] [CrossRef]
  6. Leng, K.; Guan, B.; Liu, W.; Jiang, C.; Cong, S.; Xin, Y. Research Progress of Coalbed Methane Extraction. Energy Rep. 2024, 12, 5728–5746. [Google Scholar] [CrossRef]
  7. Mondalt, D.; Sang, S.; Han, S.; Zhou, X.; Zhao, F.; Zhang, J.; Gao, W. Coalbed Methane Reservoir Properties Assessment and 3D Static Modeling for Sweet-spot Prediction in Dahebian Block, Liupanshui Coal field, Guizhou Province, Southwestern China. Heliyon 2024, 10, e35481. [Google Scholar] [CrossRef]
  8. Cao, L.; Yao, Y.; Liu, D.; Yang, Y.; Wang, Y.; Cai, Y. Application of Seismic Curvature Attributes in the Delineation of Coal Texture and Deformation in Zhengzhuang Field, Southern Qinshui Basin. AAPG Bull. 2020, 104, 1143–1166. [Google Scholar] [CrossRef]
  9. Chen, S.; Chen, P.; Tang, D.; Tao, S.; Zhang, T. Identification of Thin-layer Coal Texture Using Geophysical Logging Data: Investigation by Wavelet Transform and Linear Discrimination Analysis. Int. J. Coal Geol. 2021, 239, 103727. [Google Scholar] [CrossRef]
  10. Liu, D.; Yao, Y.; Wang, H. Structural Compartmentalization and Its Relationships with Gas Accumulation and Gas Production in the Zhengzhuang Field, Southern Qinshui Basin. Int. J. Coal Geol. 2022, 259, 104055. [Google Scholar] [CrossRef]
  11. Di, C.; Wei, Z.; Wang, K.; Deng, P.; Chen, B.; Shen, L.; Chen, Z. The impact of pressurization-induced decrease of capillary pressure and residual saturation on geological carbon dioxide storage. J. Clean. Prod. 2025, 486, 144573. [Google Scholar] [CrossRef]
  12. Chen, Y.; Tang, D.; Xu, H.; Li, Y.; Meng, Y. Structural Controls on Coalbed Methane Accumulation and High Production Models in the Eastern Margin of Ordos Basin, China. J. Nat. Gas Sci. Eng. 2015, 23, 524–537. [Google Scholar] [CrossRef]
  13. Wang, B.; Zhang, Q.; Qu, Z.; Zhang, Y. South Anze Structure and Its Control on Coalbed Methane Aggregation in the Qinshui Basin and the Mechanism of Syncline Gas Enrichment in the Qinshui Basin. Energies 2023, 16, 4521. [Google Scholar] [CrossRef]
  14. Huang, S.; Liu, D.; Gomez-Rivas, E.; Griera, A.; Gan, Q.; Wang, M.; Xing, Y.; Zhao, Y. Experimental Insights into the Nucleation and Propagation of Hydraulic Fractures in Anthracite Coalbed Methane Reservoirs. Earth Energy Sci. 2025; in press. [Google Scholar] [CrossRef]
  15. Zhou, F.D.; Yao, G.Q.; Tyson, S. Impact of Geological Modeling Processes on Spatial Coalbed Methane Resource Estimation. Int. J. Coal Geol. 2015, 146, 14–27. [Google Scholar] [CrossRef]
  16. Zhang, B.; Deng, Z.; Fu, X.; Yin, K. A Study on Three-Phase Gas Content in Coal Reservoirs and Coalbed Methane-Water Differential Distribution in the Western Fukang Mining Area, Xinjiang, China. ACS Omega 2021, 6, 3999–4012. [Google Scholar] [CrossRef]
  17. Yue, P.; Qu, S.; Zhang, Y.; Tu, J.; Ning, W.; Duan, J. Numerical Simulation Study of the Upper Aquifer Impact on the Coalbed Methane Production. Front. Energy Res. 2022, 9, 789021. [Google Scholar] [CrossRef]
  18. Quan, F.; Wei, C.; Feng, S.; Hu, Y. Physical Experiment and Numerical Simulation of the Depressurization Rate for Coalbed Methane Production. ACS Omega 2020, 5, 22661–22673. [Google Scholar] [CrossRef] [PubMed]
  19. Rahman, M.K.; Suarez, Y.; Chen, Z.; Rahman, S.S. Unsuccessful Hydraulic Fracturing Cases in Australia: Investigation into Causes of Failures and Their Remedies. J. Pet. Sci. Eng. 2007, 55, 213–227. [Google Scholar] [CrossRef]
  20. Zhang, Y.P.; Yang, Y.H.; Shao, G.L.; Chen, L.W.; Wei, N.; Zhang, L.W. Problems and Countermeasures in the Exploitation of High Coal Rank CBM Horizontal Wells in Fanzhuang–Zhengzhuang Area of Qinshui Basin. Nat. Gas Ind. 2017, 37, 46–54. [Google Scholar] [CrossRef]
  21. Su, X.; Lin, X.; Liu, S.; Zhao, M.; Song, Y. Geology of Coalbed Methane Reservoirs in the Southeast Qinshui Basin of China. Int. J. Coal Geol. 2005, 62, 197–210. [Google Scholar] [CrossRef]
  22. Yang, X.; Tang, S.; Xi, Z.; Zhang, S.; Zhang, Q.; Zhang, K. Dynamic Evolution and Differential Enrichment of Deep Coalbed Methane: A Case Study in Qinshui Basin. Int. J. Coal Geol. 2025, 299, 104696. [Google Scholar] [CrossRef]
  23. Wang, H.; Yao, Y.; Huang, C.; Liu, D.; Cai, Y. Fault Development Characteristics and Their Effects on Current Gas Content and Productivity of No. 3 Coal Seam in the Zhengzhuang Field, Southern Qinshui Basin, North China. Energy Fuel 2021, 35, 2268–2281. [Google Scholar] [CrossRef]
  24. Qin, Y.; Jiang, B.; Wang, J.; Wu, C.; Ju, Y. Coupling Control of Tectonic Dynamical Conditions to Coalbed Methane Reservoir Formation in the Qinshui Basin, Shanxi, China. Acta Geolog. Sin. 2008, 82, 1355–1362. [Google Scholar]
  25. Shao, L.; Wang, X.; Wang, D.; Li, M.; Wang, S.; Li, Y.; Shao, K.; Zhang, C.; Gao, C.; Dong, D.; et al. Sequence Stratigraphy, Paleogeography, and Coal Accumulation Regularity of Major Coal-Accumulating Periods in China. Int. J. Coal Sci. Technol. 2020, 7, 240–262. [Google Scholar] [CrossRef]
  26. Wang, H.; Yao, Y.; Liu, D.; Pan, Z.J.; Yang, Y.; Cai, Y. Fault-sealing Capability and Its Impact on Coalbed Methane Distribution in the Zhengzhuang Field, Southern Qinshui Basin, North China. J. Nat. Gas Sci. Eng. 2016, 28, 613–625. [Google Scholar] [CrossRef]
  27. Allawi, R.H. Geomechanical Model of Ratawi Shale Reservoir. Int. J. Coal Sci. Technol. 2024, 35, 1–16. [Google Scholar] [CrossRef]
  28. Huang, S.; Liu, D.; Yao, Y.; Gan, Q.; Cai, Y.; Xu, L. Natural Fractures Initiation and Fracture Type Prediction in Coal Reservoir under Different In-situ Stresses during Hydraulic Fracturing. J. Nat. Gas Sci. Eng. 2017, 43, 69–80. [Google Scholar] [CrossRef]
  29. Sun, Y.; Zhang, J.; Yu, Z.; Liu, Z.; Yin, P. WOA (Whale Optimization Algorithm) Optimizes Elman Neural Network Model to Predict Porosity Value in Well Logging Curve. Energies 2022, 15, 4456. [Google Scholar] [CrossRef]
  30. Wang, Y.; Liu, D.; Cai, Y.; Yao, Y.; Pan, Z. Constraining coalbed methane reservoir petrophysical and mechanical properties through a new coal structure index in the southern Qinshui Basin, northern China: Implications for hydraulic fracturing. AAPG Bull. 2020, 104, 1817–1842. [Google Scholar] [CrossRef]
Figure 1. (a) Map showing the location of Qinshui Basin in China. (b) Location of the Zhengzhuang Field in Qinshui Basin. (c) Study area with 3D seismic and locations of the exploration wells in the Zhengzhuang Field (Modified after Wang et al. [23]).
Energies 18 02617 g001
Figure 2. Sedimentary characteristics of the coal-bearing strata in the Zhengzuhang Field (Modified after Wang et al. [23]).
Energies 18 02617 g002
Figure 3. Three-dimensional geological modeling elements and structural characteristics of No. 3 coal seam. (a) Top-surface model of the coal seam. (b) Bottom-surface model of the coal seam. (c) Spatial distribution model of fault systems. (d) Collapse column configuration model. (e) Discretization grid division (25 m × 25 m resolution). (f) Integrated 3D geological structure model incorporating lithological interfaces and tectonic features.
Energies 18 02617 g003
Figure 4. (a) Composition of macroscopic coal lithotypes based on core descriptions. (b) Representative log-derived lithotype predictions in the study area.
Energies 18 02617 g004
Figure 5. Spatial heterogeneity and distribution of macroscopic coal lithotypes of No. 3 coal seam in the study area.
Energies 18 02617 g005
Figure 6. Workflow for 3D geomechanical stress modeling.
Energies 18 02617 g006
Figure 7. Geomechanical grid of No. 3 coal seam in the study area.
Energies 18 02617 g007
Figure 8. Ant-tracking attribute (a) and modeling of reservoir fracture (b).
Energies 18 02617 g008
Figure 9. The in situ stress model of the No. 3 coal seam in the study area. (a) Maximum horizontal principal stress. (b) Minimum horizontal principal stress. (c) Vertical principal stress.
Energies 18 02617 g009
Figure 10. No. 3 coal seam in the study area. (a) Reservoir porosity model; (b) Permeability distribution histogram.
Energies 18 02617 g010
Figure 11. Permeability of No. 3 coal seam in the study area. (a) Reservoir permeability model. (b) Permeability distribution range histogram.
Energies 18 02617 g011
Figure 12. Gas content of the No. 3 coal seam in the study area. (a) Reservoir gas content model. (b) Gas content distribution range histogram.
Energies 18 02617 g012
Figure 13. Typical CBM well group for numerical simulation.
Energies 18 02617 g013
Figure 14. Dynamic History Fitting of Coalbed Methane Well Production. (a) Cumulative gas production. (b) Cumulative gas production.
Energies 18 02617 g014
Figure 15. Dynamic variations in reservoir pressure over time.
Energies 18 02617 g015
Figure 16. Remaining gas saturation across the simulated area.
Energies 18 02617 g016
Figure 17. Residual resource distribution of No. 3 coal seam in the study area.
Energies 18 02617 g017
Figure 18. Workflow and weights of key parameters for evaluating CBM resource potential.
Energies 18 02617 g018
Figure 19. Evaluation results of CBM resource potential.
Energies 18 02617 g019
Table 1. Calculation results of typical well ground stress.
WellDepth (m)Top Elevation
(m)
σ H (Mpa) σ h (Mpa) σ v (Mpa)
141122.3919.1142.7226.4027.50
15896.71815.7426.2316.8721.97
19559.85746.8926.8615.9813.72
27747.05885.9122.9514.7718.30
30638.5633.9914.7510.5115.64
31601.25674.0620.7813.2114.73
38659.95693.1930.7918.8716.17
39992.9597.7227.2418.9224.33
641242.4826.3144.7727.6530.44
671269.792446.8629.0931.11
691187.25112729.1619.1929.09
76515.4904.428.4515.9712.63
78702.8100020.1711.8817.22
80752.194121.3713.4518.43
82703.893721.0913.0817.24
89521.673722.7513.4712.78
1021102.4869.442.6425.9927.01
Table 2. Reservoir properties for the study area.
Input ParametersValue
Initial reservoir pressure (Mpa)4.76–10.89
Permeability (mD)0.012–1
Porosity (%)0.0129–0.10
Gas content (m3/t)14.1–31.8
Water saturation (%)100
Table 3. Weights of key reservoir parameters for evaluating CBM resource potential.
Assessment ProjectsReservoir ParametersBetterGoodBad
Reservoir propertiesPorosity≥8%4–8%≤4%
Permeability≥0.8 mD0.5–0.8 mD≤0.5 mD
Stimulation potentialMacro-coal lithotypeBright coalSemi-bright coalSemi-dull coal and dull coal
Horizontal principal stress differential≥10 MPa5–10 MPa≤5 MPa
Residual resource assessmentResidual gas content≥20 m3/t10–20 m3/t≤10 m3/t
Disclaimer/Publisher’s Note: The statements, opinions and data contained in all publications are solely those of the individual author(s) and contributor(s) and not of MDPI and/or the editor(s). MDPI and/or the editor(s) disclaim responsibility for any injury to people or property resulting from any ideas, methods, instructions or products referred to in the content.

