Article

Surfactant–Polymer Formulation for Chemical Flooding in Oil Reservoirs

Department of Oil and Gas Fields Development and Operation, Empress Catherine II Saint Petersburg Mining University, 2, 21st Line, 199106 St. Petersburg, Russia
*
Author to whom correspondence should be addressed.
Energies 2025, 18(7), 1814; https://doi.org/10.3390/en18071814
Submission received: 13 March 2025 / Revised: 30 March 2025 / Accepted: 2 April 2025 / Published: 3 April 2025
(This article belongs to the Special Issue Advances in Unconventional Reservoirs and Enhanced Oil Recovery)

Abstract

:
A significant part of oil fields has reached a late stage of development, where technologies aimed at increasing the oil recovery factor are becoming particularly relevant. One such technology is surfactant–polymer flooding. To implement this technology, it is necessary to select a chemical formulation that retains its properties under reservoir conditions and enhances the efficiency of water flooding. This work presents a laboratory evaluation of various polymer and surfactant samples to develop an effective chemical formulation. The results demonstrate that anionic surfactants based on sodium laureth sulphate and betaine significantly reduce interfacial tension at the oil–water interface of the target reservoir. Furthermore, when combined with a partially hydrolysed polymer, the sodium laureth sulphate-based surfactant increases the capillary number by 4500 times (reducing interfacial tension from 32.77 mN/m to 0.065 mN/m and increasing the viscosity of the injected agent from 0.5 mPa·s to 4.36 mPa·s). Based on core flooding studies, it can be concluded that the proposed surfactant–polymer composition increases the oil displacement factor from the core sample by 0.15–0.24, depending on the injection volume. The selected formulation can be recommended for application in water flooding at the target reservoir.

1. Introduction

Today, a significant portion of the world’s oil fields has entered a late stage of development, characterised by a high water cut, a low recovery factor relative to initial recoverable reserves, and a slow pace of production [1,2,3,4]. One such object, located in the West Siberian Oil and Gas Basin in Russia, is represented by heterogeneous terrigenous reservoirs associated with the Alym and Cherkashin formations.
The reservoirs under consideration are characterised by a high degree of heterogeneity and lithological variability both laterally and vertically. Typically, the overall clay content and compartmentalisation of the section increase from the crest to the flanks of the reservoirs. A distinctive feature is the alternation of massive sandstone intervals with thin interbedded sand–clay sequences within the section. The average effective thickness is 3.7 m, ranging from 1.7 to 8.3 m, while permeability varies from 0.008 to 0.43 µm2. The oils in the AV reservoirs are low-viscosity, with an average viscosity of 2 mPa·s, ranging from 1 to 4.4 mPa·s. The clay content in the productive formation is moderate, up to 15%. The salinity of formation water varies between 19 and 32 g/L. The average water cut of the produced fluids is 90%, ranging from 70% to 97%.
The AV2 development target, which includes the oil-bearing AV1/3 and AV2 reservoirs, is the primary focus for the subsoil user in terms of production volumes and available potential reserves. Although these reservoirs are hydrodynamically connected by more than 70% and share a common oil–water contact (OWC), they differ significantly in terms of structural characteristics and reservoir properties. The ratio of permeability values for these reservoirs varies from 3 to 8 across different fields.
The development of the vast majority of such reservoirs is carried out with reservoir pressure maintenance through continuous water injection into the formation via injection wells. However, the efficiency of traditional water flooding in heterogeneous terrigenous reservoirs, in terms of oil recovery factor, is still considered unsatisfactory [1].
For increasing the level of extraction in mature oil fields, various enhanced oil recovery (EOR) technologies can be applied [2,5]. Some of these technologies aim to improve the displacement and sweeping efficiency of water, primarily by adding various chemical agents [6,7]. Such methods are commonly referred to as chemical EOR methods, among which the following main types can be distinguished: polymer flooding, surfactant–polymer (SP) flooding, and alkaline-surfactant-polymer (ASP) flooding.
The addition of thickening agents (polymers) to increase the viscosity of the displacing fluid can be implemented in two scenarios [8]:
-
When there is an unfavourable mobility ratio between oil and water;
-
When the mobility ratio is favourable but the oil viscosity is low in reservoirs with a certain degree of heterogeneity.
In the first case, inefficient displacement at the macroscopic level is observed, leading to early water breakthrough followed by a prolonged period of oil production with increasing water cut [9,10]. This situation is well illustrated by the phenomenon of “viscous fingering”, which occurs due to the viscosity contrast between oil and water, resulting in the formation of unswept zones [11]. This issue can also arise when injecting insufficiently viscous polymer into reservoirs containing heavy oil. The above is clearly described by the mobility ratio formula, which, under ideal conditions, should be equal to (1):
M = λ w λ o = k w S o r μ o k o S w i μ w
λ w —mobility of water (dimensionless);
λ o —mobility of oil (dimensionless);
k w S o r —relative permeability to water at residual oil saturation (dimensionless);
k o S w i —relative permeability to oil at irreducible water saturation (dimensionless);
μ o —viscosity of oil, mPa∙s;
μ w —viscosity of water, mPa∙s.
In the second case, during conventional water flooding with a favourable mobility ratio, the presence of high-permeability channels or significant reservoir compartmentalisation can lead to a reduction in sweep efficiency, both areal (lateral) and vertical [12,13]. The presence of high-permeability layers can also result in premature water breakthrough. Under such conditions, increasing the viscosity through polymer flooding can significantly improve sweep efficiency [14].
In the case of polymer flooding, it is not so much the compartmentalisation of the reservoir that needs to be considered, but rather the degree of permeability contrast between its different parts. With a small permeability contrast, polymer flooding can have a favorable effect by balancing the displacement profile between low-permeability and high-permeability zones [15]. However, in cases of high heterogeneity (where the ratio of maximum to minimum permeability is 20 times or more), the polyacrylamide (PAM) solution flows will predominantly occur in the high-permeability zone, which is typically already highly depleted. In such cases, technologies aimed at completely plugging high-permeability intervals are necessary [16].
Additionally, the value of absolute permeability must be taken into account. The lower limit, which is approximately 0.1–0.2 µm2 (the exact value depends on the properties of the specific polymer), is determined by the ability of PAM molecules to pass through small pores [17,18,19]. At lower permeability values, the size of PAM molecules becomes comparable to the diameter of the pore channels, which can lead to pore plugging.
It is also important to note that, due to various microscopic effects associated with the viscoelastic properties of polymer solutions, polymer flooding not only improves the sweep efficiency, but also enhances the oil displacement factor. This refers to the additional displacement of a portion of oil contained in dead-end pores, residual oil in already swept pore channels of varying permeability, and oil held by capillary forces [20].
Some studies [21] suggest that the greatest improvement in oil displacement by polymer solutions is attributed to the mechanism of elastic turbulence. This involves the chaotic redistribution of flows in the boundary layer [22], causing micro-level pressure fluctuations that, in turn, lead to variations in shear rates and changes in the mobility of oil and water in zones with increased heterogeneity.
The authors [23] note that a polymer solution with viscoelastic properties displaces a greater amount of oil than a Newtonian fluid of the same viscosity. Studies [24,25] associate the reduction in residual oil saturation with the molecular weight of the polymer and the relaxation time of the molecules during flow in a porous medium.
The pivotal parameter governing the efficacy of polymer flooding implementation is the viscosity of the injected solution. The primary cause of viscosity loss stems from chain scission, i.e., the rupture of polymer backbone structures. It is imperative to distinguish between chain scission and degradation processes, as they entail fundamentally different physicochemical mechanisms with distinct implications for polymer performance under reservoir conditions [26].
Degradation refers to the deterioration of material properties—such as polymer solubility or solution viscosity loss—without the cleavage of macromolecular chains. This phenomenon arises from alterations in macromolecular conformation, changes in polymer coil dimensions, modifications to the chemical activity of functional groups, and their interactions with polyvalent salt ions present in aqueous media.
In contrast, chain destruction entails the rupture and fragmentation of macromolecules into smaller segments, thereby reducing the polymer’s molecular weight. This process invariably diminishes polymer solution viscosity. Destruction mechanisms may be thermal, chemical, mechanical, or biological in nature, each inducing distinct pathways of molecular breakdown [27].
Elevated reservoir temperatures accelerate the hydrolysis of polyacrylamide. At 50 °C, PAM hydrolysis proceeds at a negligible rate, with solutions maintaining prolonged stability irrespective of brine salinity or ionic composition [28]. At temperatures exceeding 70 °C, amide group hydrolysis occurs at a pronounced rate, rendering the polymer susceptible to polymineral aggression. Consequently, under such thermal conditions, PAM application remains viable only when formation water contains calcium ions (Ca2+) at concentrations ≤ 200 ppm [29].
Chemical or oxidative degradation predominantly proceeds via free-radical chain reactions. The active centre forms in the polymer backbone through the abstraction of a tertiary hydrogen atom. Subsequent oxygen molecule attachment generates a peroxide radical, which may either abstract another tertiary hydrogen or induce chain destruction [30]. In polymer flooding applications, such free radicals typically form through redox reactions between dissolved oxygen and either iron (II) species or hydrogen sulphide (H2S). The resulting chain scission events reduce the polymer’s hydrodynamic volume, ultimately leading to viscosity degradation [31].
The mechanical degradation of polymers occurs when macromolecules are subjected to excessive shear rates or abrupt pressure differentials within pipes, chokes, orifices, or pumping equipment. This induces molecular chain rupture, consequently diminishing polymer viscosity [32,33].
Biological degradation can occur in both partially hydrolysed polyacrylamides and polysaccharides, though with a higher probability in the latter case. The governing factors include bacterial strains present in solution, pressure, temperature, salinity, and coexisting chemical species. Biodegradation proceeds more rapidly in low-salinity environments at moderate temperatures [33].
The degradation challenges posed by high salinity and temperature can be mitigated through acrylamide copolymerisation with hydrolysis-resistant monomers, such as acrylamide-tert-butyl sulfonate (ATBS) [34].
ATBS is synthesised via the Ritter reaction utilising acrylonitrile and isobutylene in the presence of sulphuric acid and water. This monomer has been extensively investigated to address amide group stability issues under elevated temperature conditions.
Surfactants can enhance the oil recovery factor through the following two mechanisms:
(1)
Reduction ininterfacial tension (IFT) at the oil–water interface;
(2)
Alteration of rock wettability.
Interfacial tension can be defined as the force acting between molecules at the interface of two phases [35], specifically at the oil–water interface.
Reducing interfacial tension contributes to an increase in the capillary number, which is a dimensionless ratio of viscous forces to local capillary forces:
N c a = F V F C = μ v σ   c o s   c o s   θ  
F V —viscous forces;
F C —capillary forces;
μ —viscosity of the displacing fluid, mPa∙s;
v —velocity of the displacing fluid, m/s;
σ —interfacial tension (surface tension), mN/m;
θ —contact angle (wettability angle), degrees.
Experimental data show that as the capillary number increases, residual oil saturation decreases [36].
It is important to note that the chemical substances mentioned above can also be used in other field operations unrelated to enhanced oil recovery (EOR) technologies. For example, surfactants can be employed in well-killing operations [37,38,39] or in technologies aimed at preventing or removing asphalt–resin–paraffin deposits (ARPD) [40,41,42]. In turn, polymers can be used in the preparation of drilling fluids [43,44], for sand control production [45,46], reducing hydraulic resistance in pipes, and other operations [47].
Surfactants have the ability to dissolve in both water and oil, thereby reducing the interfacial tension at the oil–water interface to sufficiently low values. This enables a high capillary number, which helps overcome capillary forces and extract additional oil [48].
The first results of laboratory and field tests of ionogenic surfactants used as additives in water flooding were published in the USA in the 1940s–1950s. There were more than 30 surfactant injection (water-soluble and oil-soluble surfactants) pilots on different fields in Russia, but the first one was carried out in 1964 on Arlanskoye field. Aqueous solutions of OP-10 were used [49].
To date, over 700 chemical flooding projects have been implemented across diverse geological and petrophysical environments. Given this study’s specific focus on surfactant–polymer (SP) flooding technology, Table 1 summarises key operational parameters and performance outcomes from the most thoroughly documented case studies in the literature.
As evidenced by Table 1, surfactant–polymer (SP) flooding implementation demonstrates enhanced ultimate recovery factors, confirming the method’s significant potential and operational viability.
However, the implementation of surfactant–polymer (SP) flooding technology requires an individualised approach to develop an effective chemical formulation [59] that is compatible with reservoir fluids and rock, maintains its key properties under reservoir conditions, and maximises the potential for oil recovery. This article proposes a laboratory program for the selection and evaluation of a formulation for chemical flooding, and presents the results of research on the development of a SP composition for the AV reservoir.

2. Materials and Methods

2.1. Experimental Materials and Equipment

2.1.1. Polymer and Surfactant Samples

As part of the research, samples of partially hydrolysed polyacrylamide (HPAM) with a hydrolysis degree of 20–30%, a molecular weight ranging from 7.3 to 20.3 million Da, and an acrylamide-tert-butyl sulfonic acid content in the range of 0–15% were considered. Preliminary screening was primarily governed by the target formation’s petrophysical properties. Given the elevated reservoir temperatures and compromised rock–fluid characteristics, conventional polymers risk property degradation or formation damage. However, deploying thermally stable low-molecular-weight polymers necessitates higher capital expenditures. Consequently, the aforementioned molecular weight and ATBS content ranges were established to probabilistically optimise polymer selection.
For surfactant pre-screening, the literature-based prediction of optimal surfactant–crude oil interactions proves exceptionally challenging under specific reservoir conditions. Therefore, we evaluated commercially available surfactants with documented field applications in chemical flooding projects. The surfactants evaluated included the following:
1.
Anionic surfactants based on sodium alkylbenzene sulfonate, diethanolamide of lauric acid, sodium laureth sulphate, dodecylbenzene sulfonate, and alpha-olefin sulfonate;
2.
Amphoteric surfactants based on betaine and oleyl betaine.
Detailed information about the chemical reagents used is provided in Table 2 and Table 3.

2.1.2. Brine Model

The solutions were prepared using a reservoir water model. The chemical composition of the brine used for preparing the working solutions is presented in Table 4.

2.1.3. Core Samples and Oil Samples

For the core flooding studies, extracted, dried, cylindrical core samples from the target reservoir and oil collected from the field’s wells were used.
Cylindrical cores were drilled from reservoir rock samples. The plugs underwent hydrocarbon extraction using an azeotropic alcohol–benzene mixture (1:3 vol ratio) in a Soxhlet apparatus, followed by salt removal via distilled water rinsing. Cleaned samples were oven-dried to constant mass at 105 ± 2 °C and stored in desiccators containing anhydrous calcium chloride.
Petrophysical characterisation employed an automated system for porosity and permeability measurements by Geologica. Following property determination, cores were vacuum-saturated with crude oil. Initial oil volume was quantified through gravimetric analysis pre- and post-saturation. Saturated cores were then loaded into core holders and conditioned at test temperature (57.0 ± 0.5 °C) for 24 h.
Table 5 provides information on the core samples used.

2.1.4. Experimental Equipment

The rheological properties of the solutions were studied using a Brookfield DV2T rotational viscometer (Brookfield Ametek, Middleboro, MA, USA) equipped with a UL adapter for measuring low viscosity. To accurately evaluate the interfacial tension at the oil–surfactant solution interface, studies were conducted using the KRÜSS SDT 100 tensiometer (KRÜSS Scientific, Hamburg, Germany) with the spinning drop method. Core flooding studies were performed using an automated unit, the RPS-812 (CoretestSystemsCorporation, Morgan Hill, CA, USA).

2.2. Experimental Methods

The research program for polymer solutions, surfactant solutions, and surfactant–polymer compositions is presented in Figure 1.

2.2.1. Requirements for Polymers and Experimental Methodology

The main criteria for ranking different polymer grades are as follows:
  • Compatibility with the reservoir water (absence of lumps or precipitates during solution preparation). The methodology is based on the periodic visual assessment of polymer powder dissolution during solution preparation. As the polymer dissolves, the solution becomes homogeneous, and no polymer particles should remain. The acceptable dissolution time should not exceed 240 min.
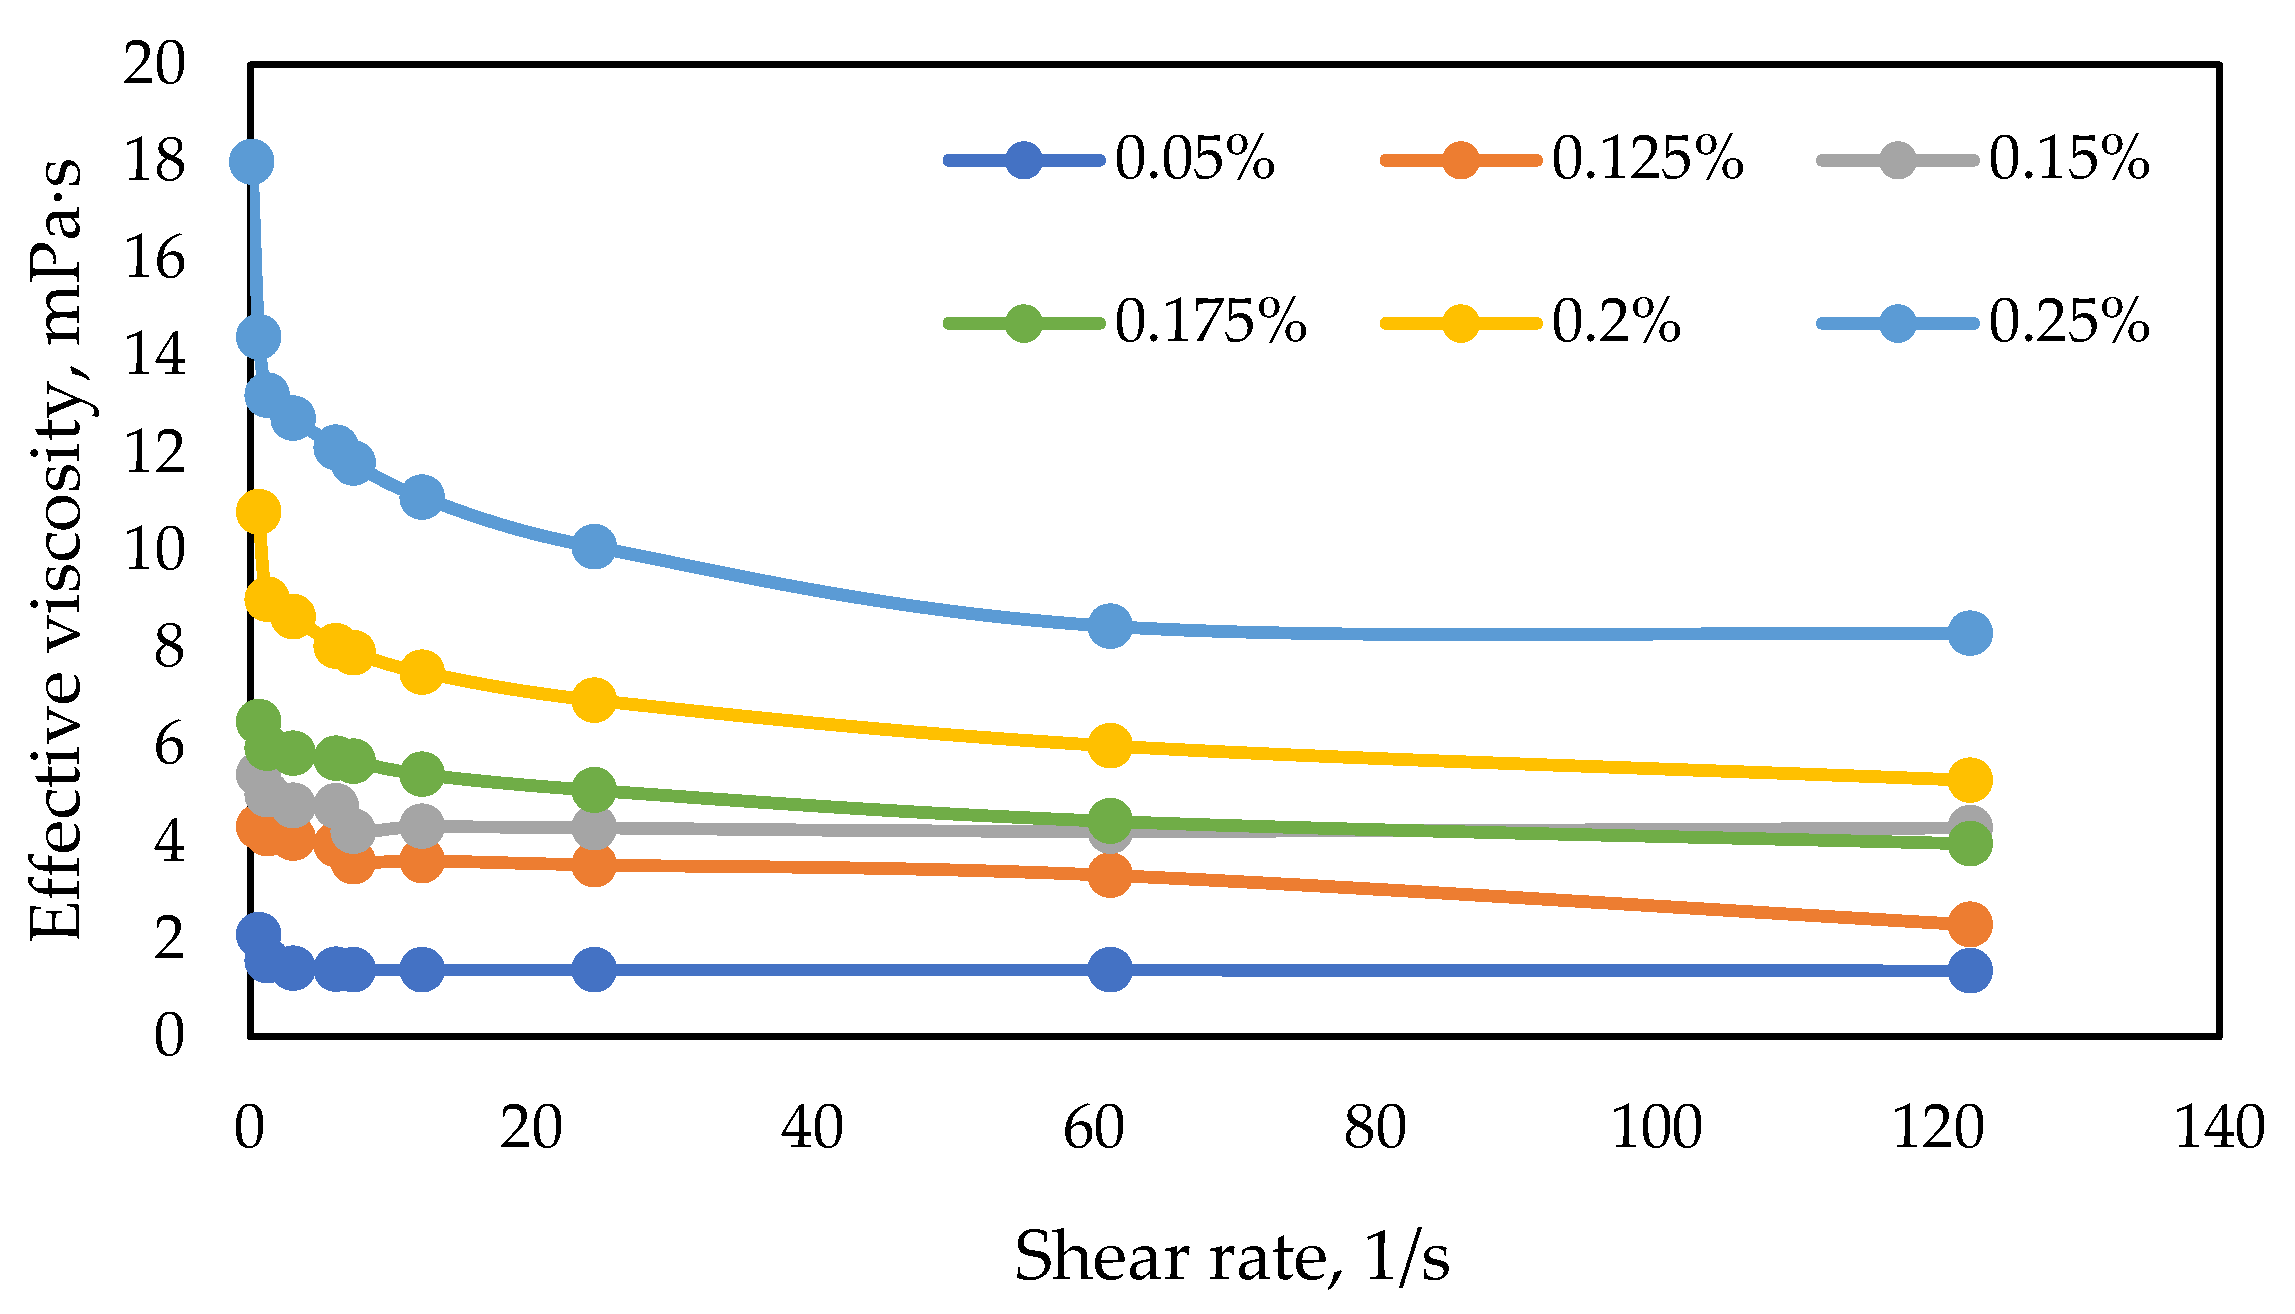
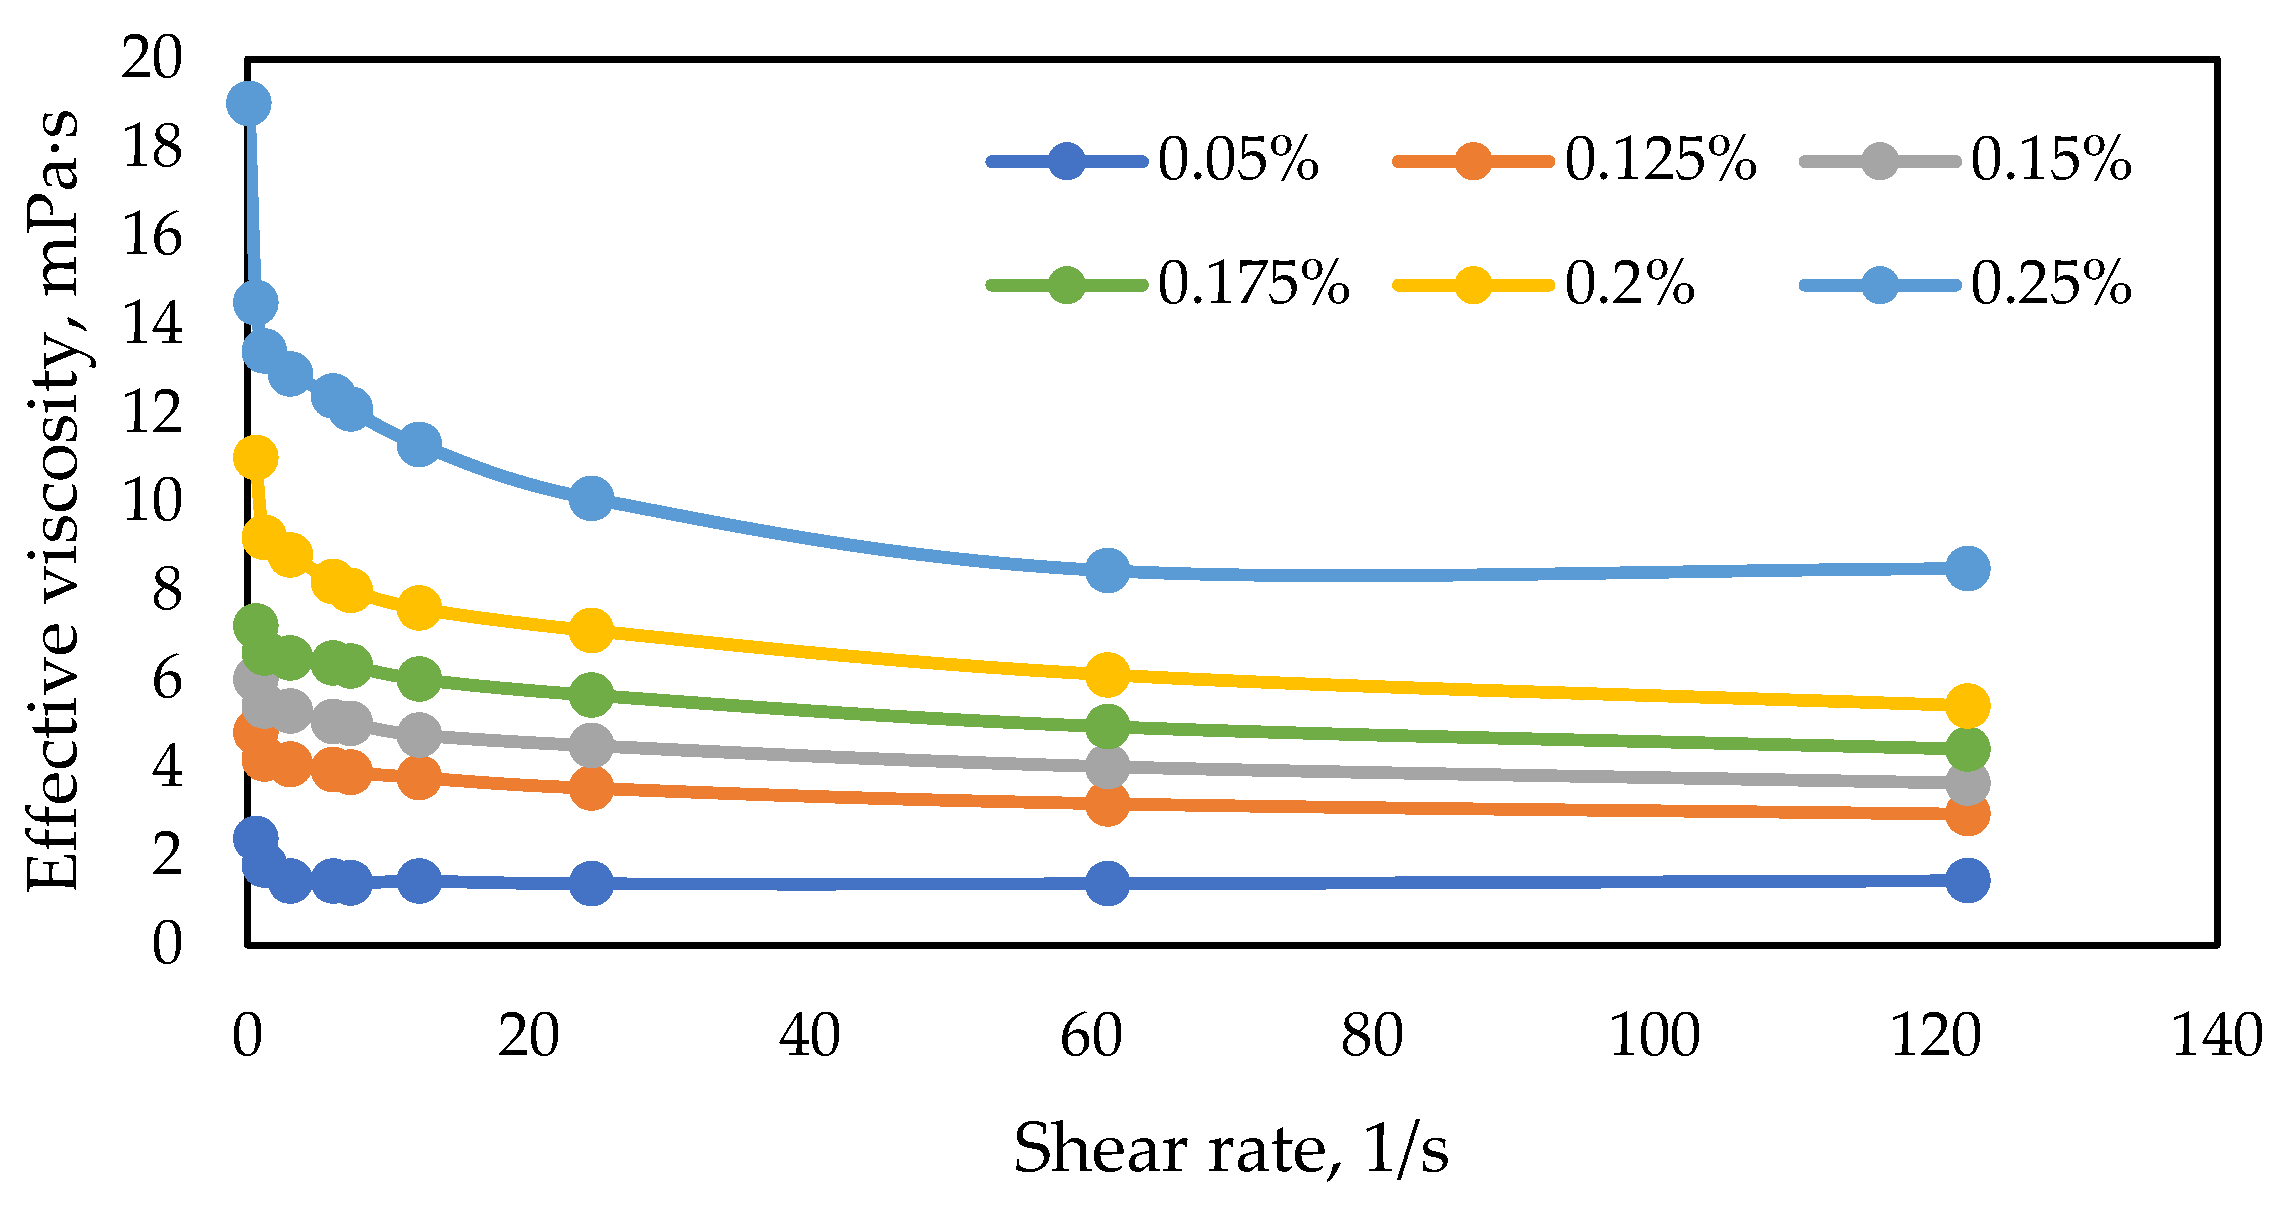
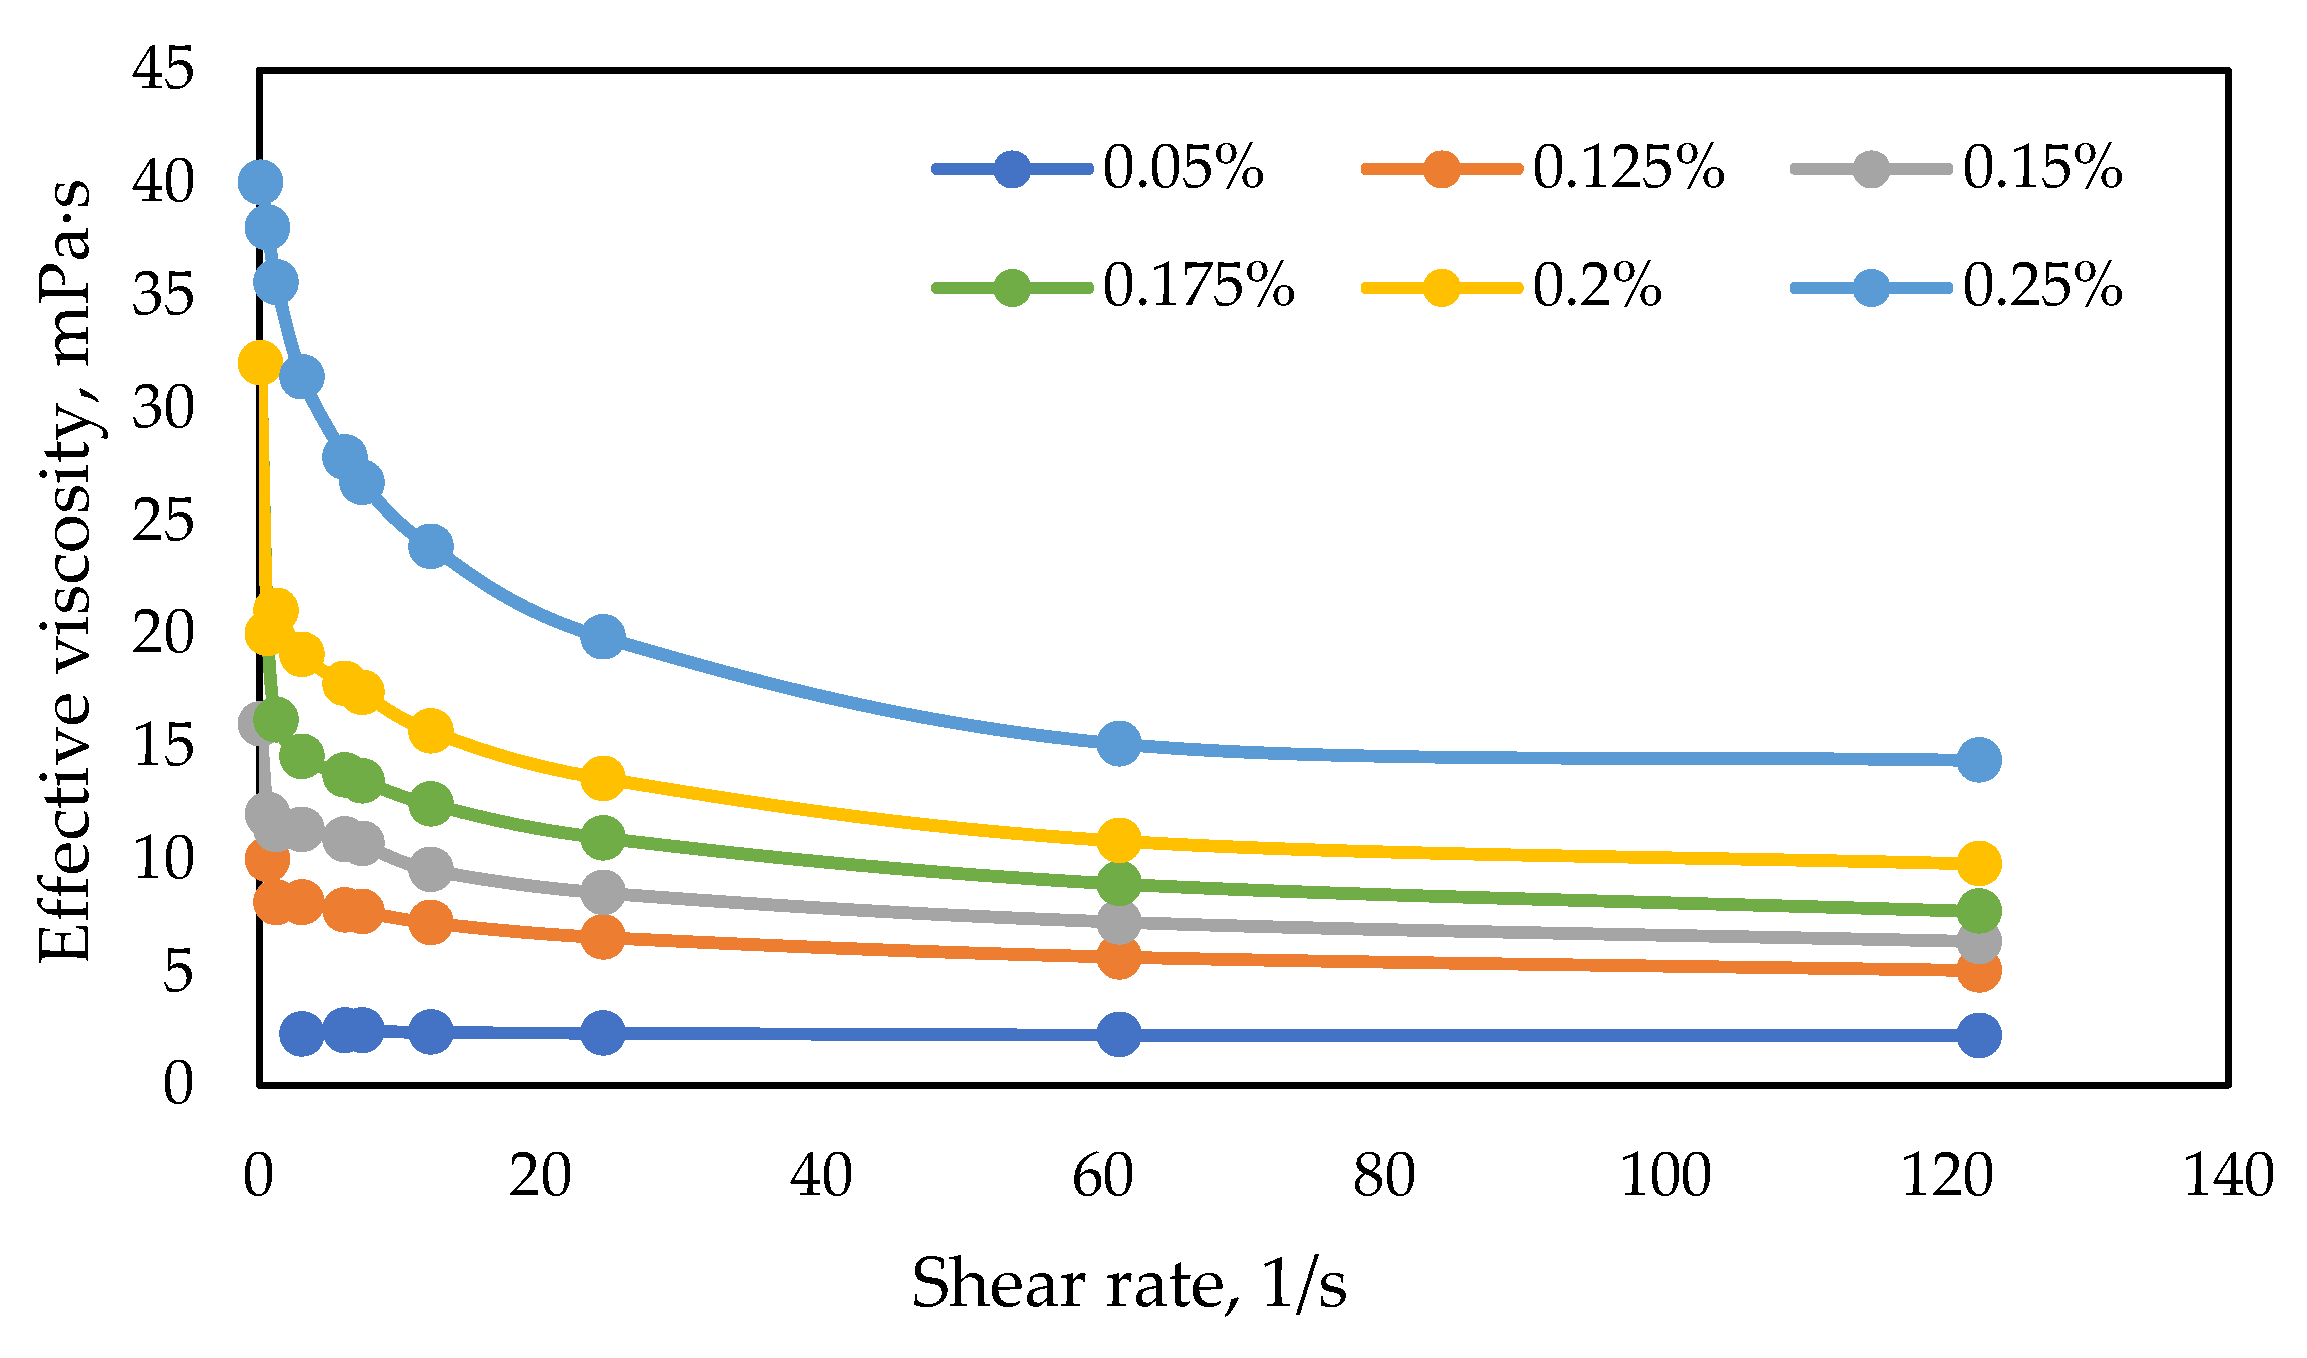
  • Rheological properties, specifically achieving maximum solution viscosity at minimum concentration. The methodology involves measuring the viscosity of polymer solutions at various spindle rotation speeds (shear rates) using a rotational viscometer.
  • Resistance to mechanical degradation. The mechanical stability coefficient is calculated as the ratio of the viscosity of the degraded solution to the original solution. The mechanical stability coefficient should be above 0.85. The methodology involves measuring the viscosity of the polymer solution before and after vigorous stirring using a paddle mixer at high rotation speeds (2000 rpm and above).
  • Thermal stability of polymers. This is determined as the ratio of the viscosity of the solution after heating and prolonged exposure to the viscosity of the original solution at reservoir temperature. The thermal stability coefficient should be above 0.85.
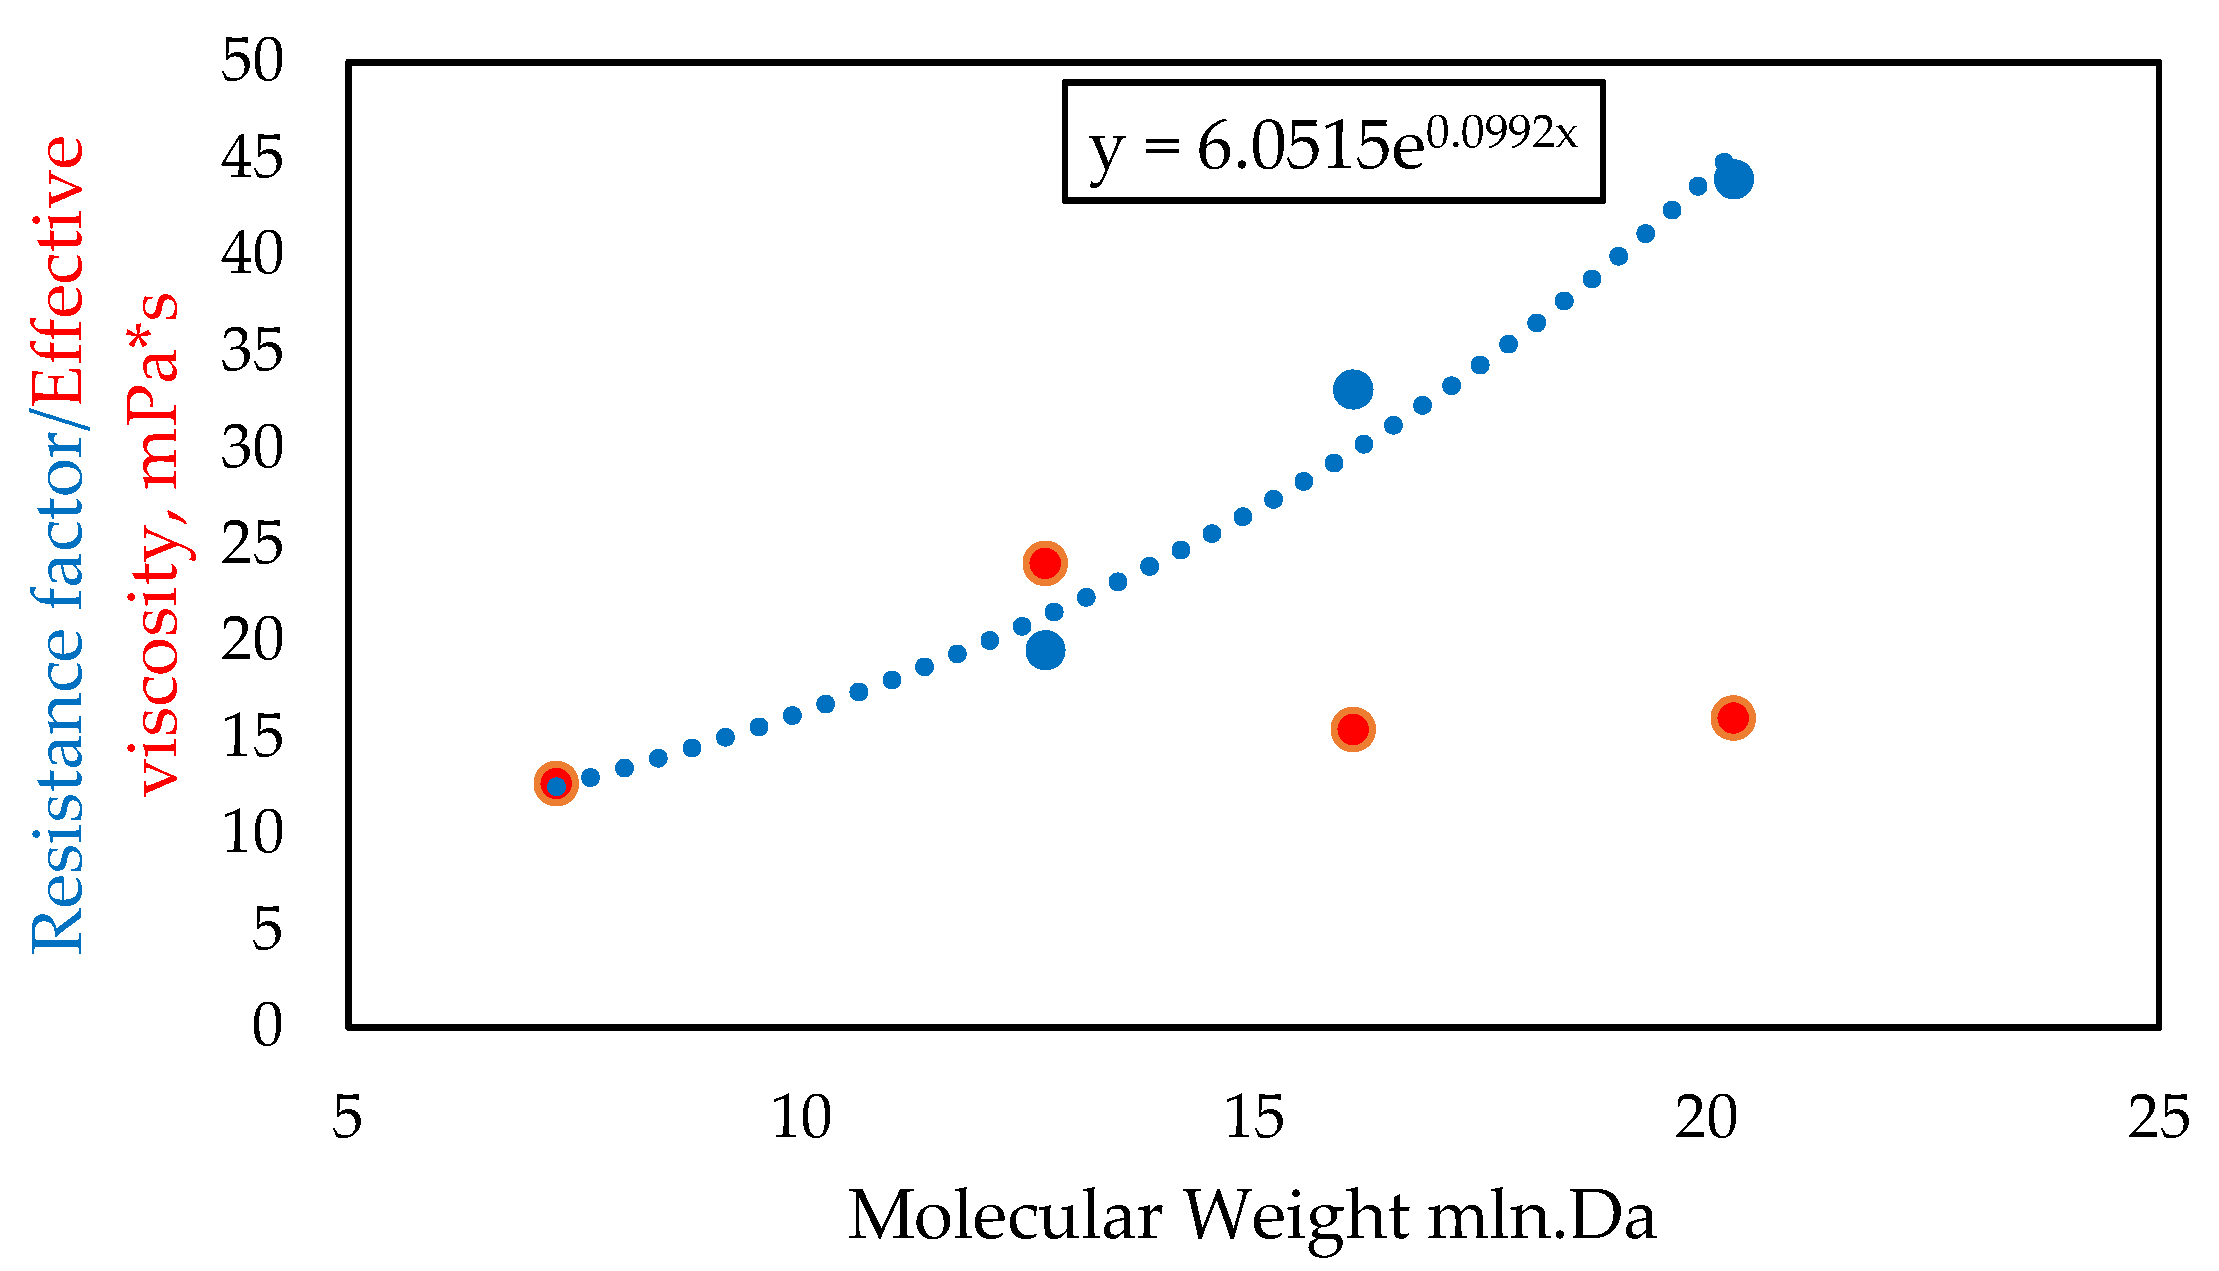
  • Compatibility of polymer molecular weight with the reservoir properties. Given the poor reservoir properties (low-permeability zones), the polymer formulation must ensure an appropriate flow level (no excessive plugging). The key factor influencing the free flow of the polymer solution is its molecular weight. According to the information presented in [8], an empirical correlation between the number–average molecular weight and the absolute permeability of the rock has been proposed and is presented in Table 6.
It is important to note that Table 6 should be used with caution, as chemical compositions and salinity can significantly affect the hydrodynamic volume of the polymer, sometimes enabling its propagation in lower-permeability layers. During the study, the most suitable polymer formulations will be tested in core flooding experiments to verify the compatibility of the molecular weight with the flow properties of the rock.

2.2.2. Requirements for the Surfactant

Based on the review of scientific publications and studies on this topic, the following key criteria/requirements for surfactants have been formulated [60]:
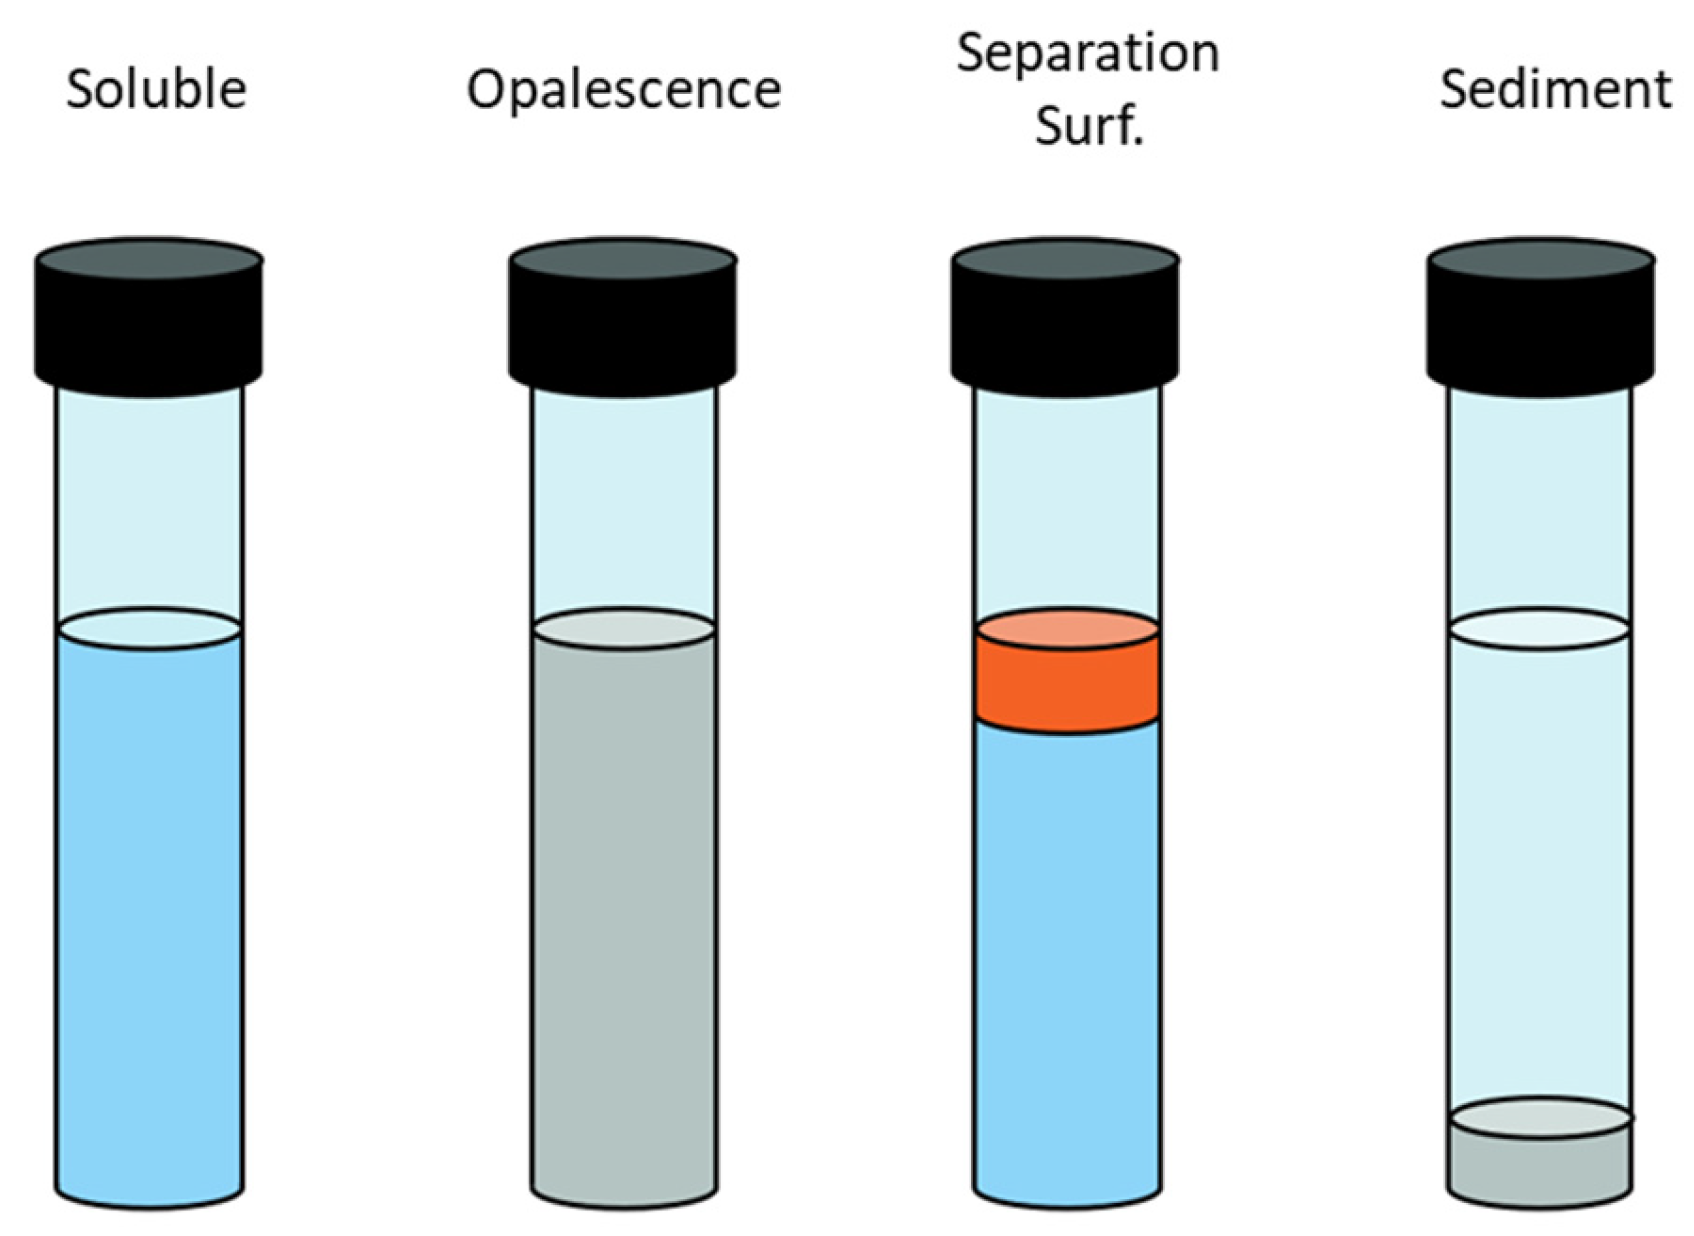
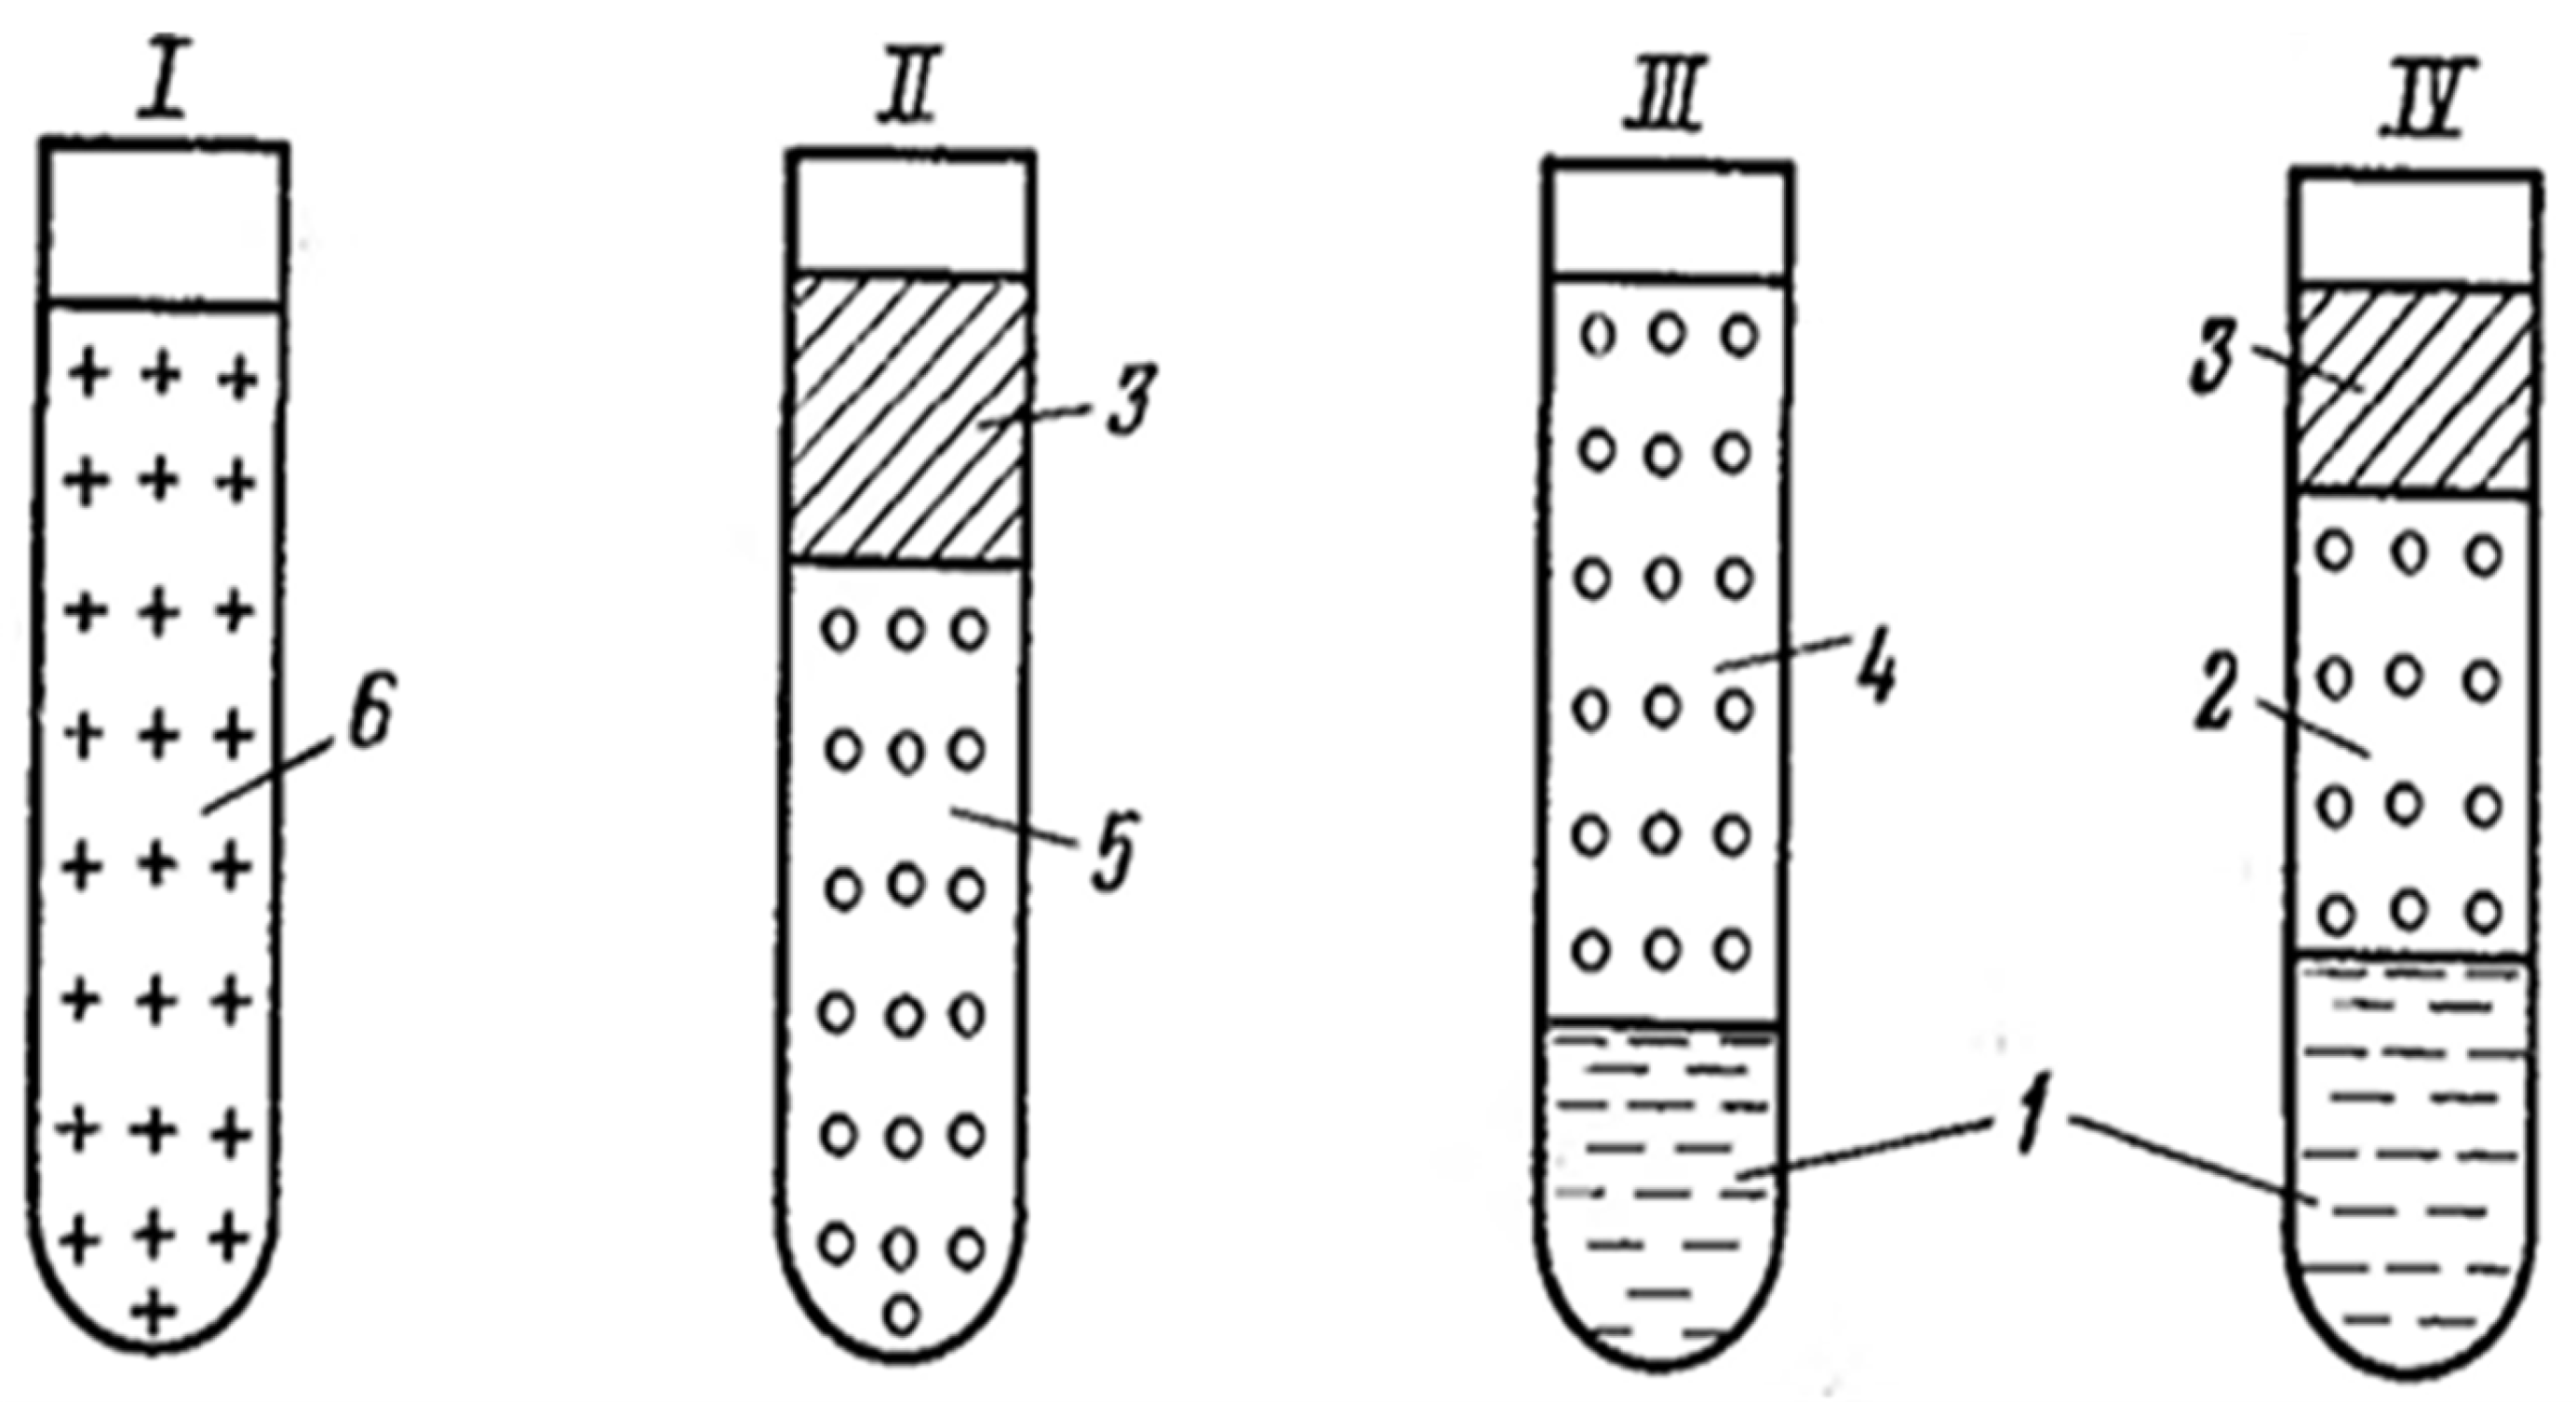
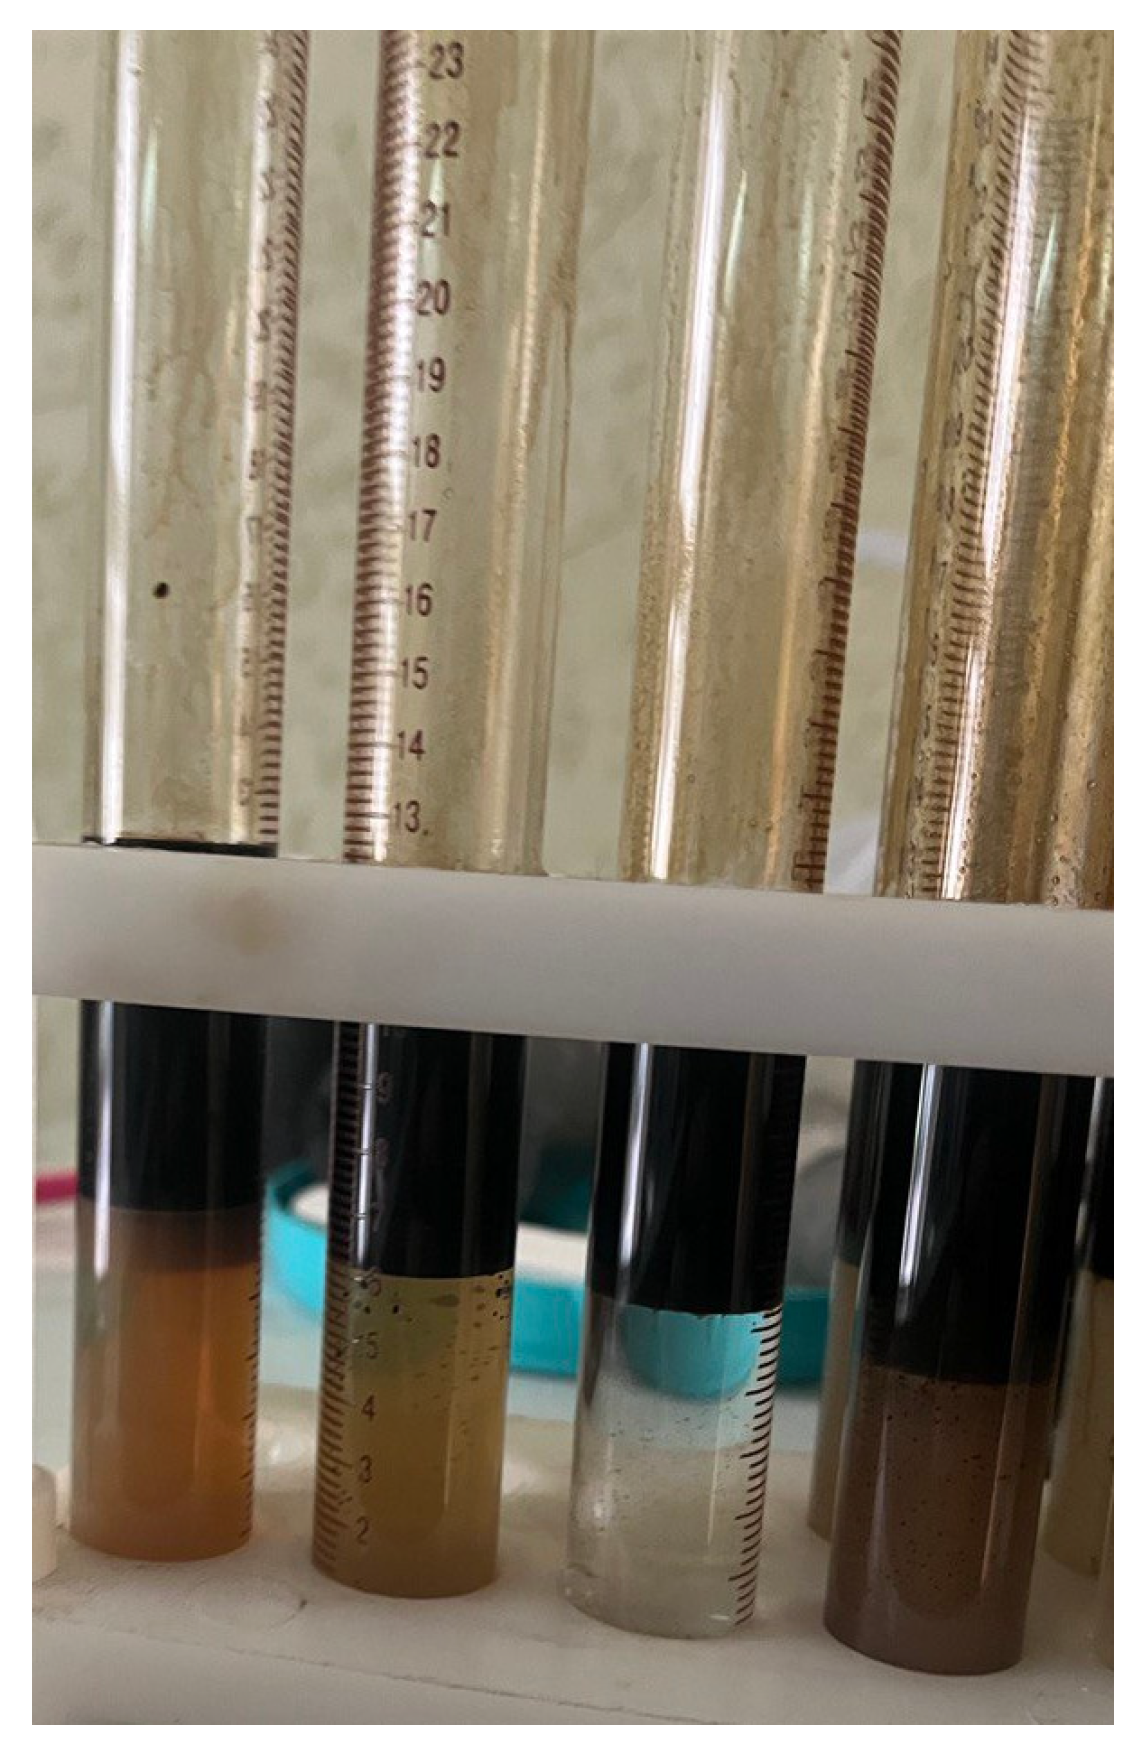
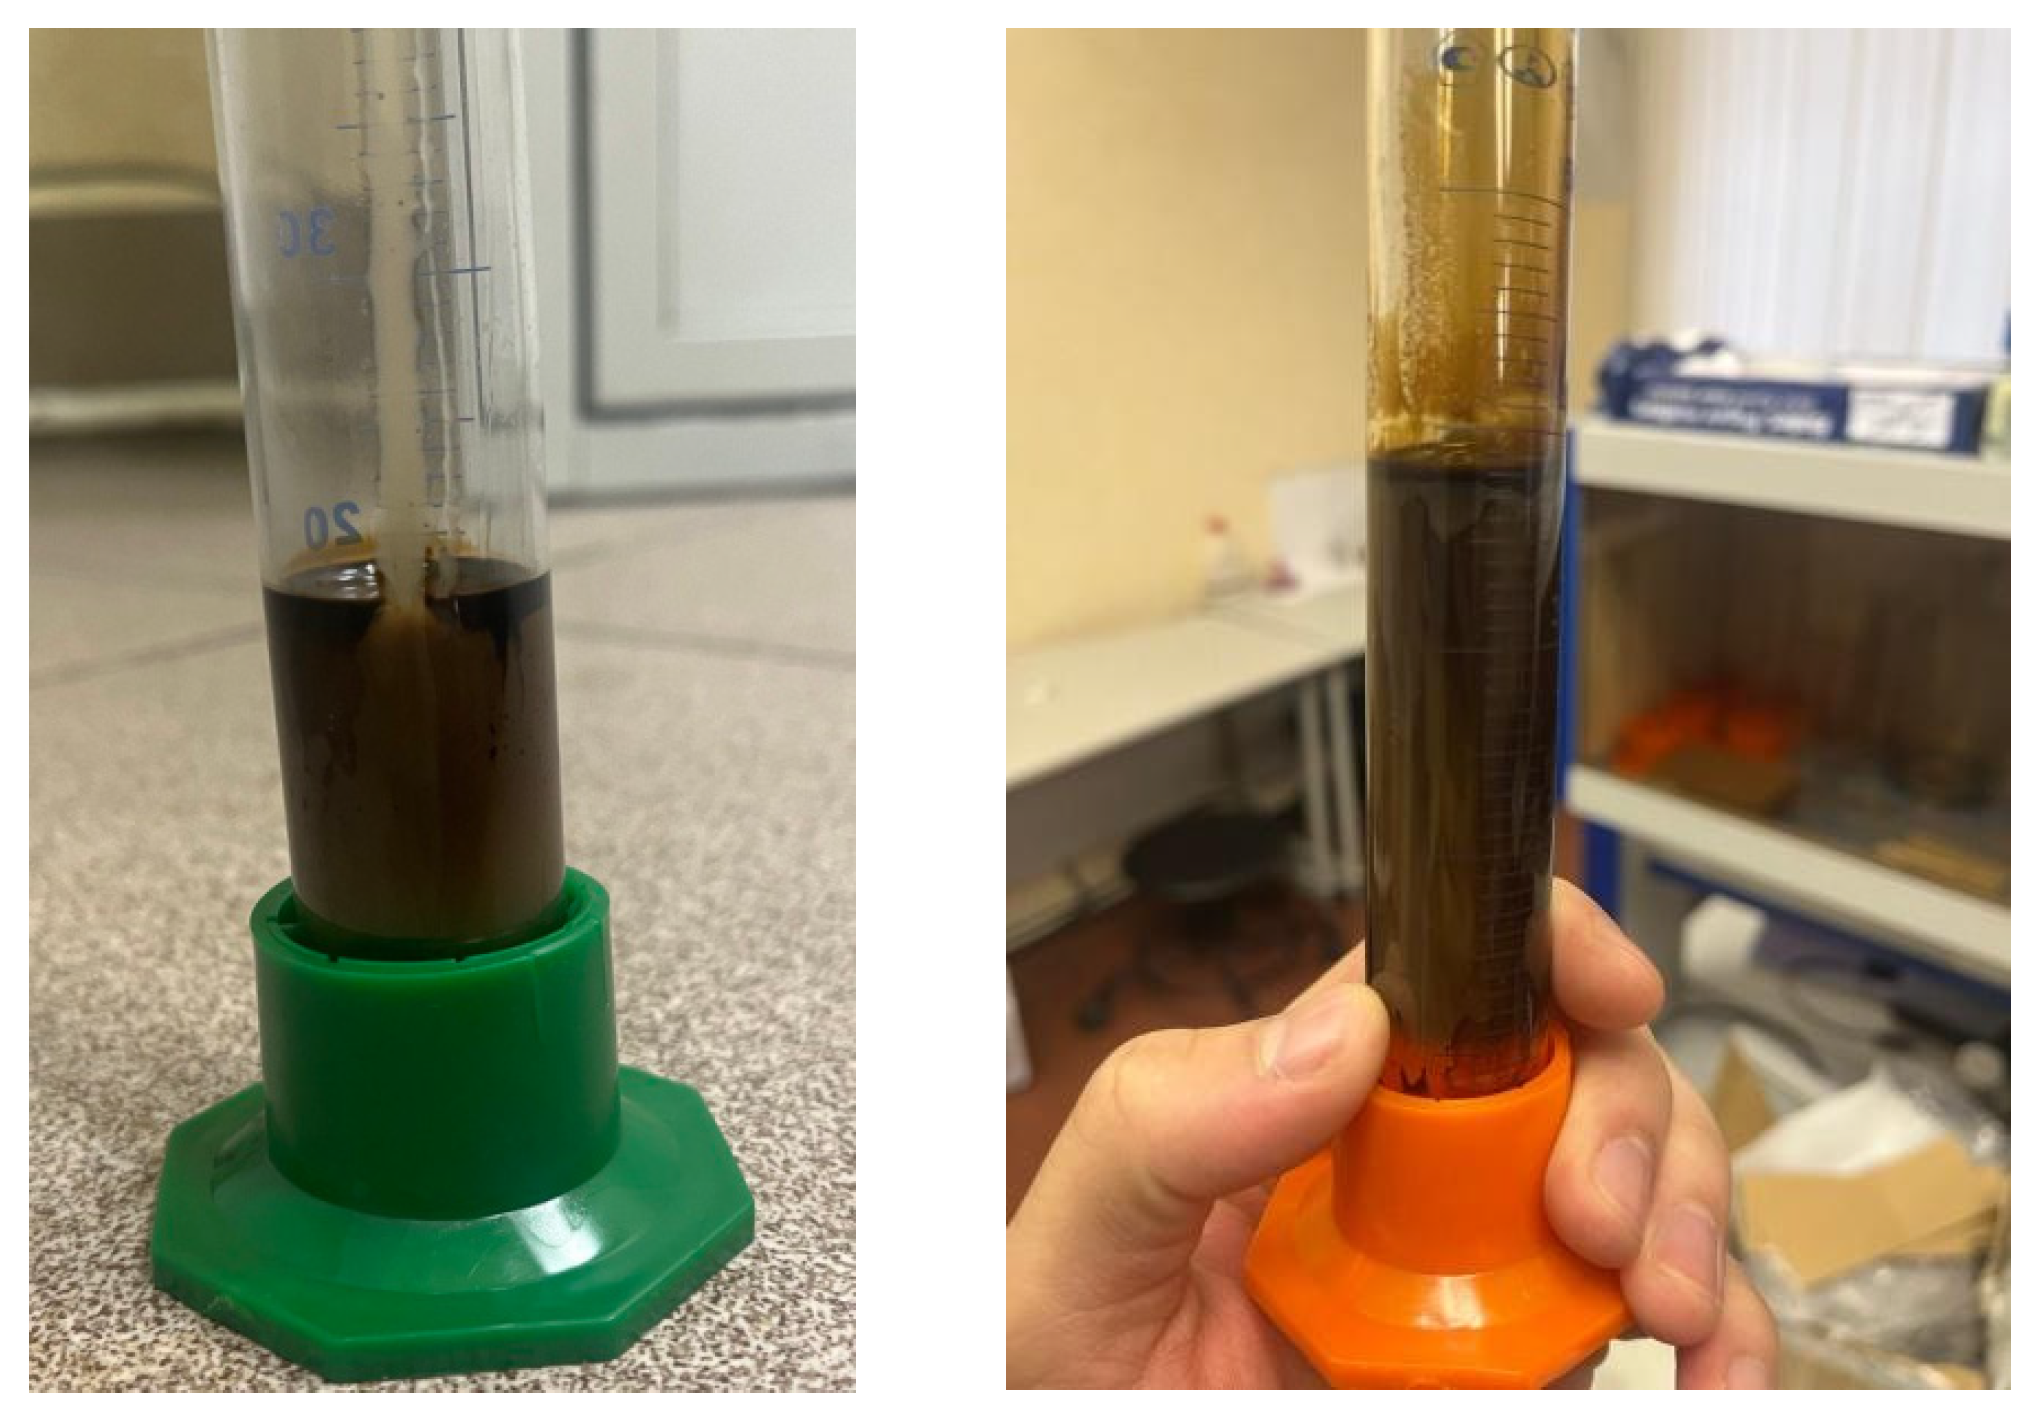
  • Good solubility in water under standard (20 °C) and reservoir conditions. The methodology is based on a visual assessment of the solution’s appearance during mixing. Some surfactants form cloudy solutions when dissolved, and in some cases, salting out or precipitation of the surfactant may occur (Figure 2). The criterion for surfactant solubility is the preservation of solution transparency for at least 3 days.
2.
Ensuring a consistently low level of IFT for dispersing trapped oil and washing residual oil films from the rock. Two approaches are used to evaluate the reduction in IFT. The first method is based on assessing the phase behavior of surfactant solutions and oil (determining Winsor types), a rapid method. The second method involves a quantitative assessment of IFT in mN/m using the spinning drop method, a more accurate evaluation method.
3.
Low level of adsorption on the rock. The methodology involves keeping surfactant solutions in contact with the rock (with periodic stirring) for 2 days in a thermal chamber at reservoir temperature (57 °C). After this period, the solutions are separated from the rock by centrifugation, and the residual surfactant concentration in the solution is measured. In this case, concentrations are determined indirectly, based on the dependence on interfacial tension.
4.
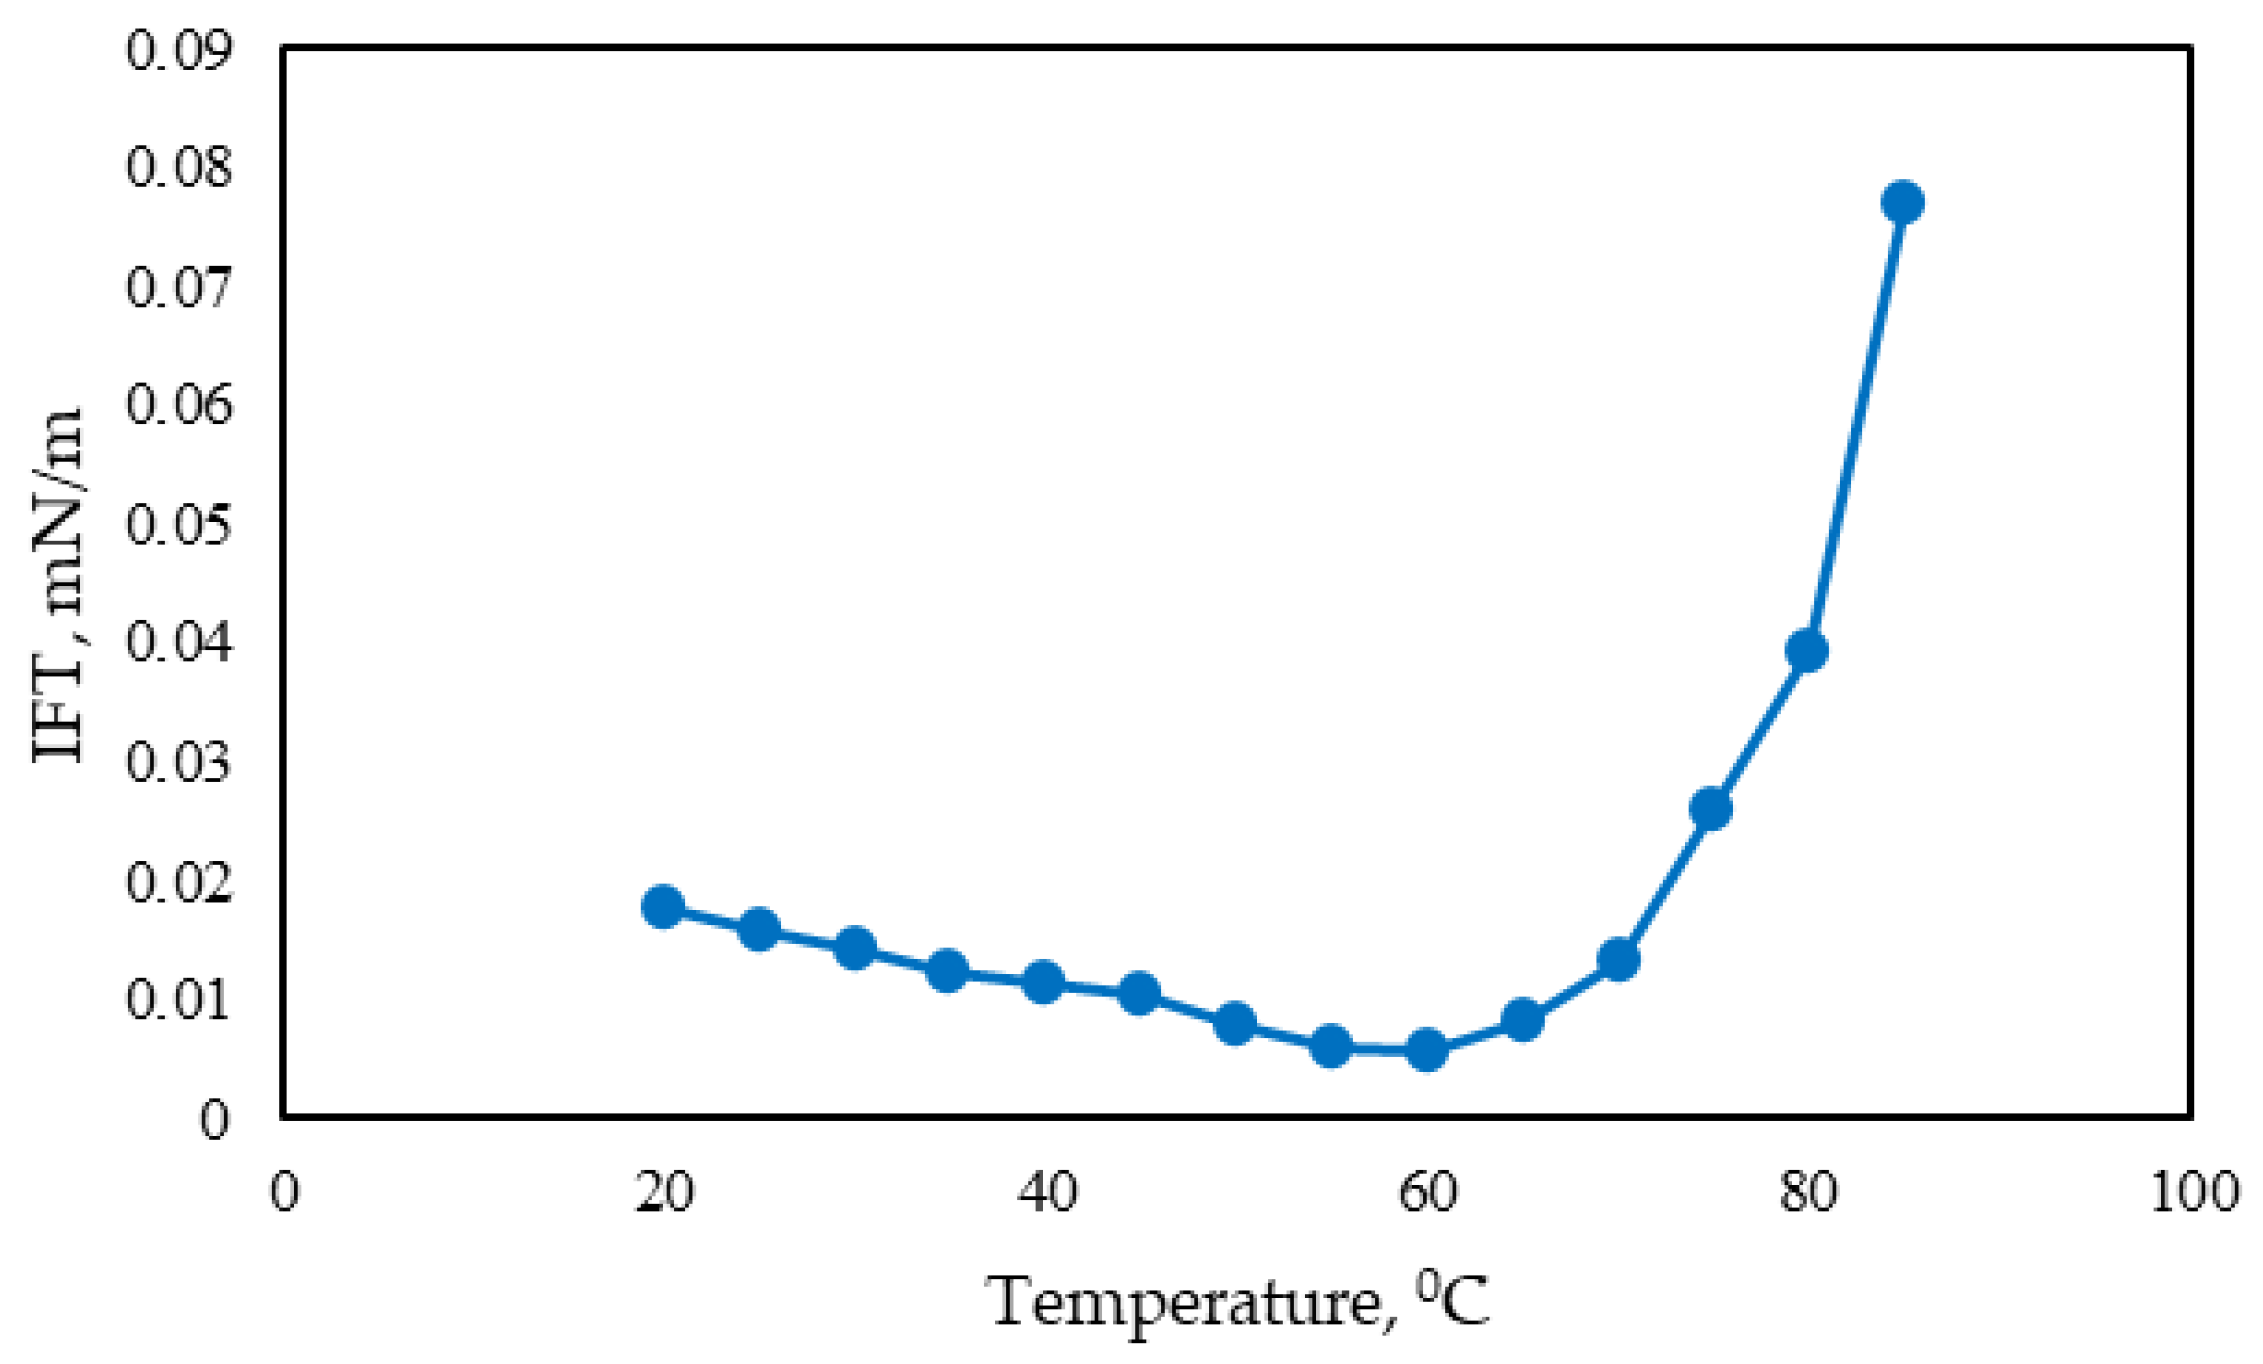
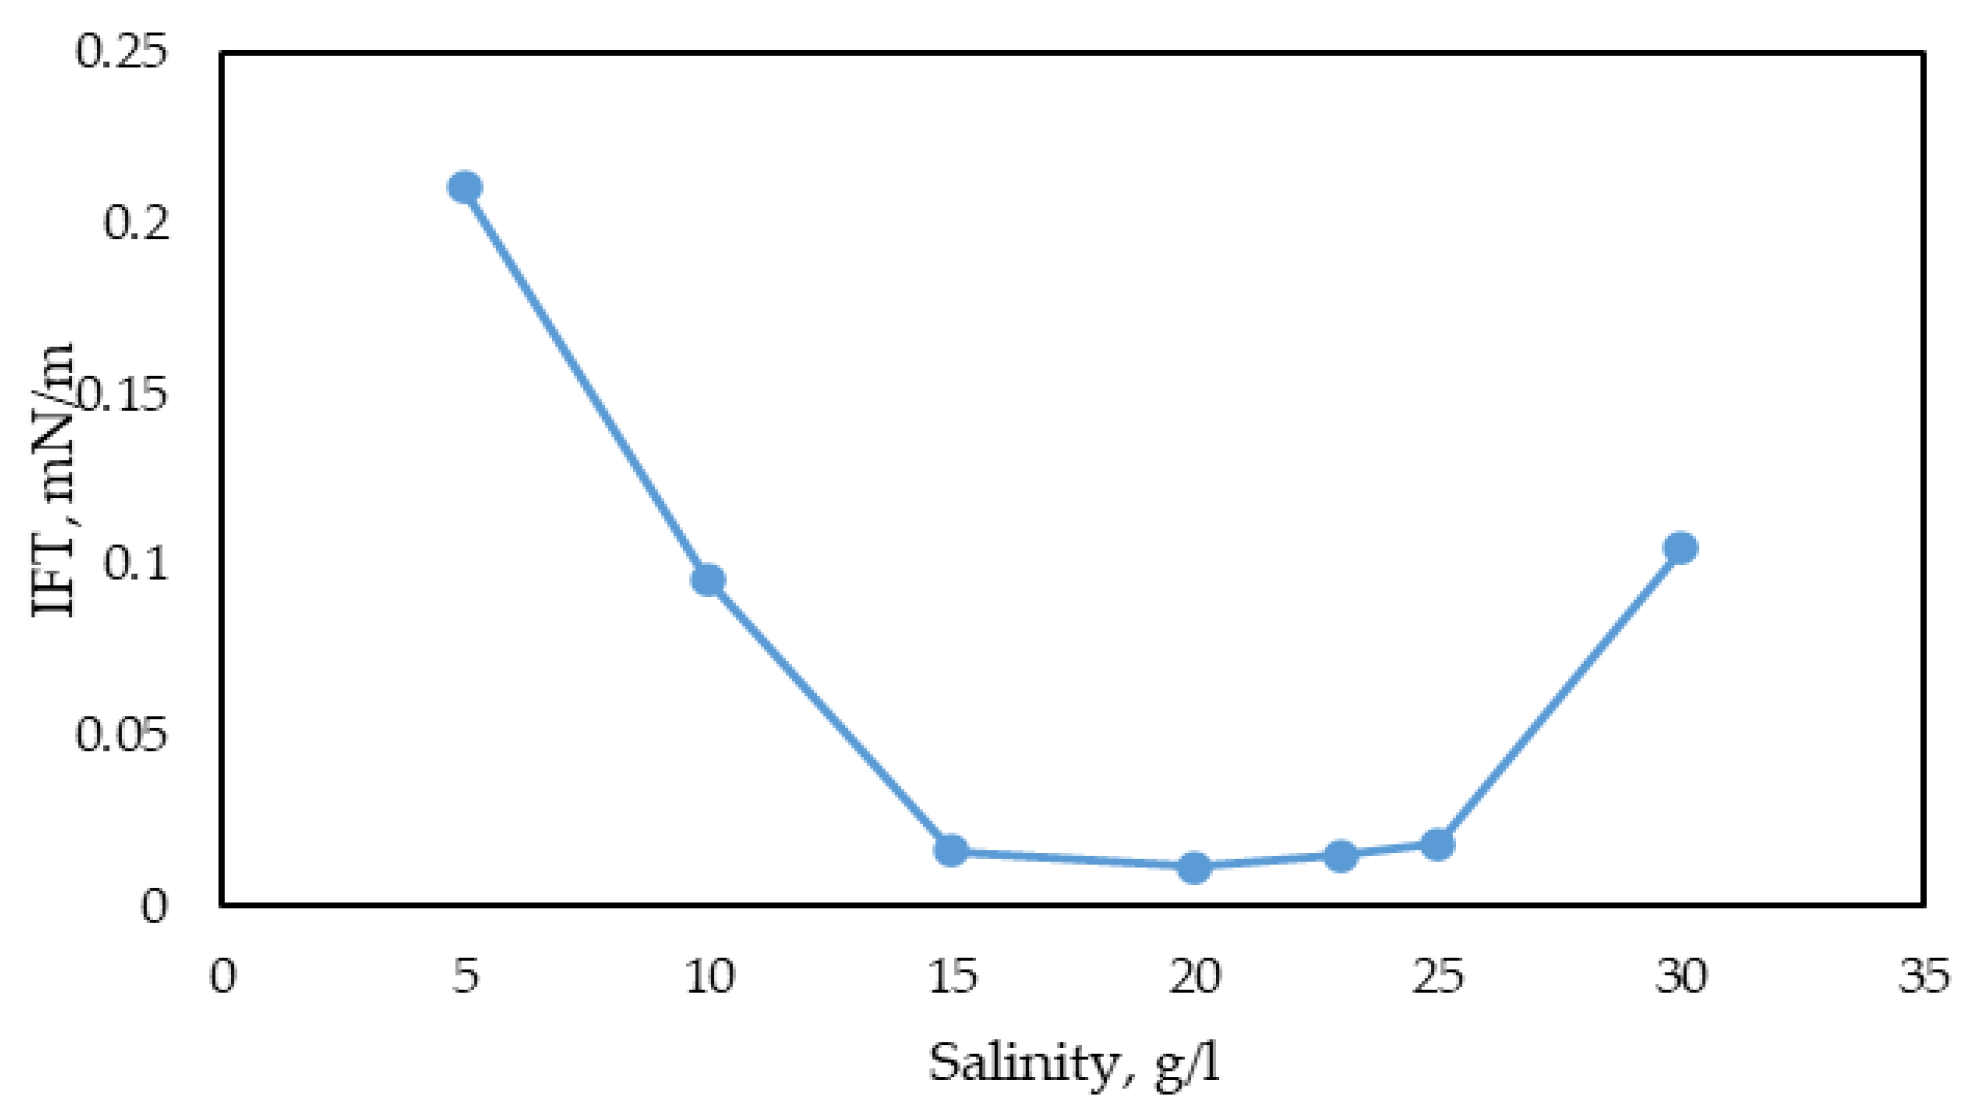
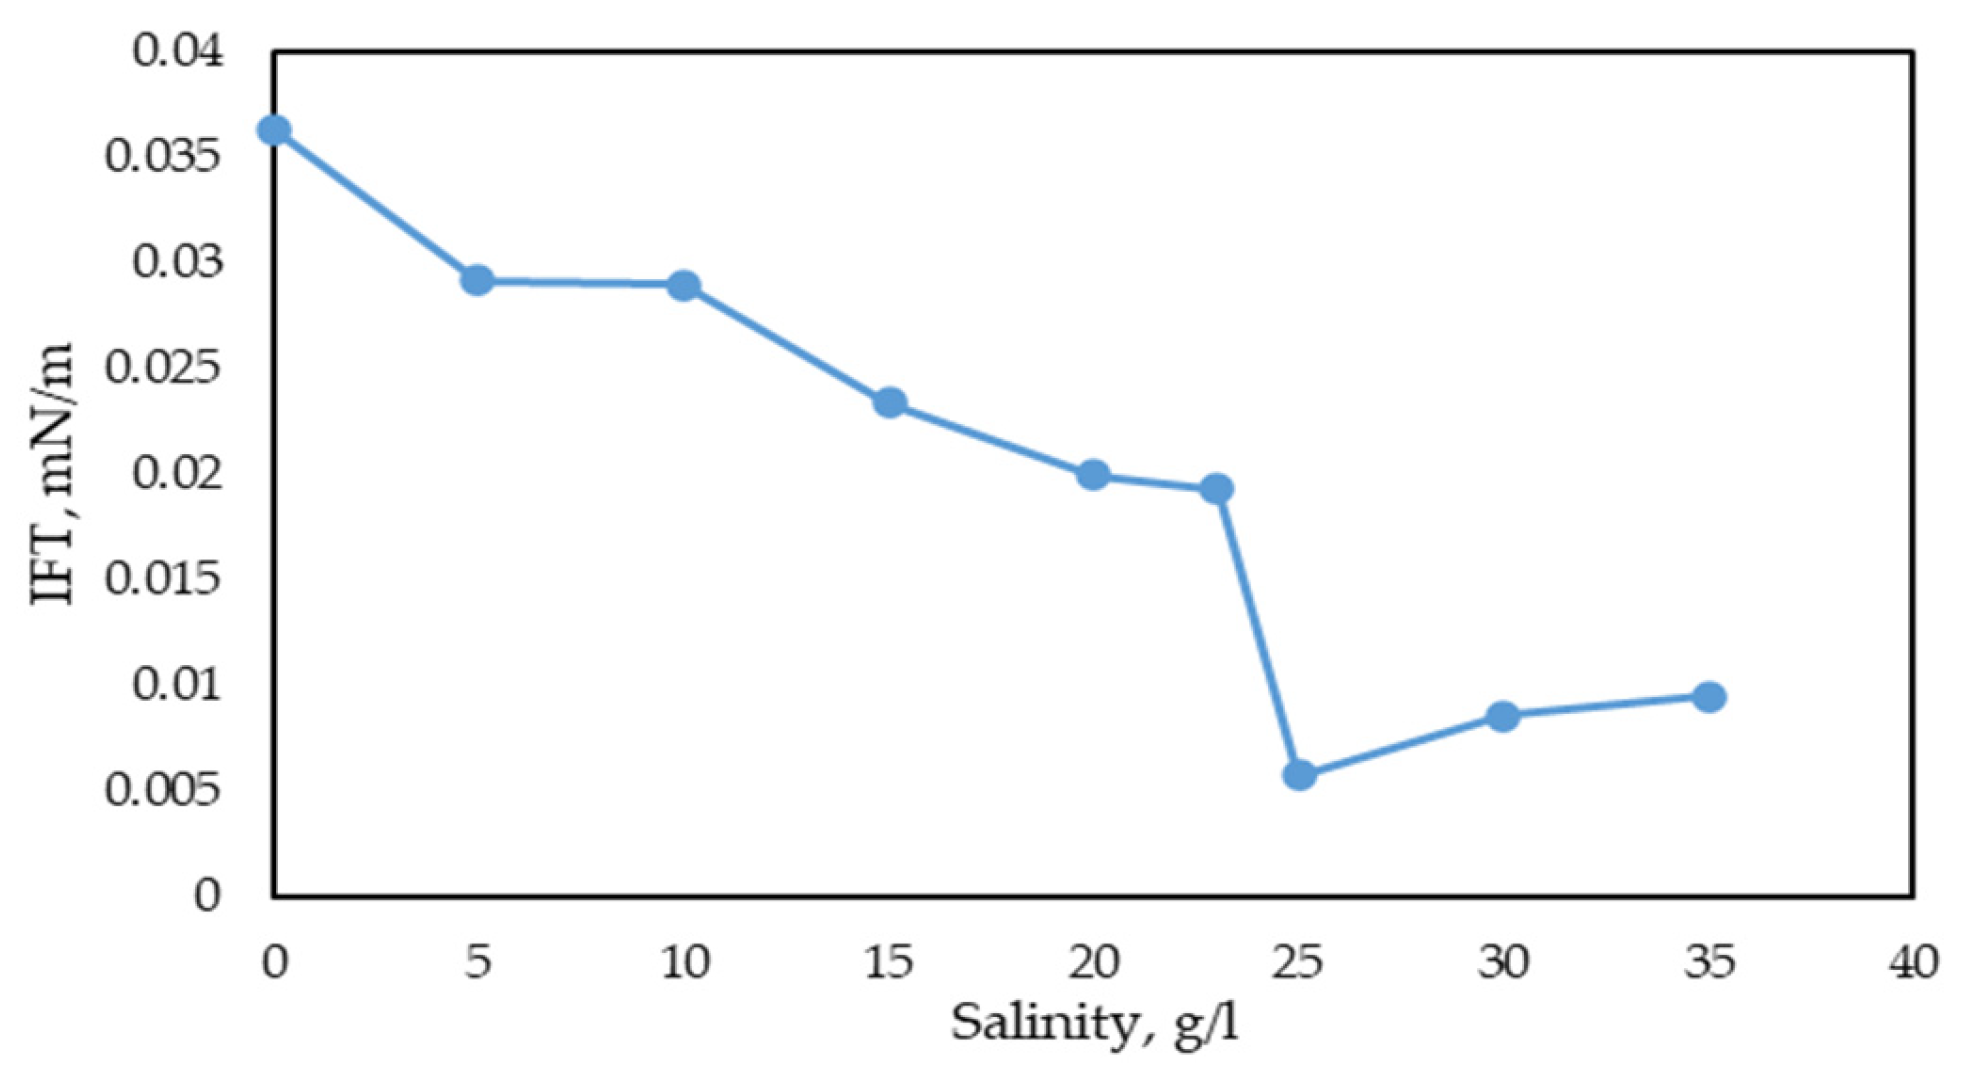
Stability of the surfactant solution across various temperature and salinity ranges. The methodology involves measuring IFT using the spinning drop method at different temperatures and salinities.
Next, the compatibility of surfactants and polymers was evaluated. This stage involves assessing solubility in the water model and evaluating the influence of component concentrations on the key properties of the chemical composition (viscosity, interfacial tension). In the final stage, core flooding studies on the developed composition were conducted. Core flooding studies were performed in accordance with OST 39–195-86 “Oil. Method for determining the oil displacement coefficient by water under laboratory conditions” [61].

3. Results and Discussions

3.1. Polymer Studies

3.1.1. Evaluation of Polymer Solubility

Polymer solutions with concentrations of 5000 ppm were prepared at a water temperature of 20 °C using an overhead stirrer at a rotation speed of 300 rpm. The results of the study are presented in Table 7.
As can be seen, all the polymer samples under consideration met the solubility criterion: the dissolution time was less than 240 min.

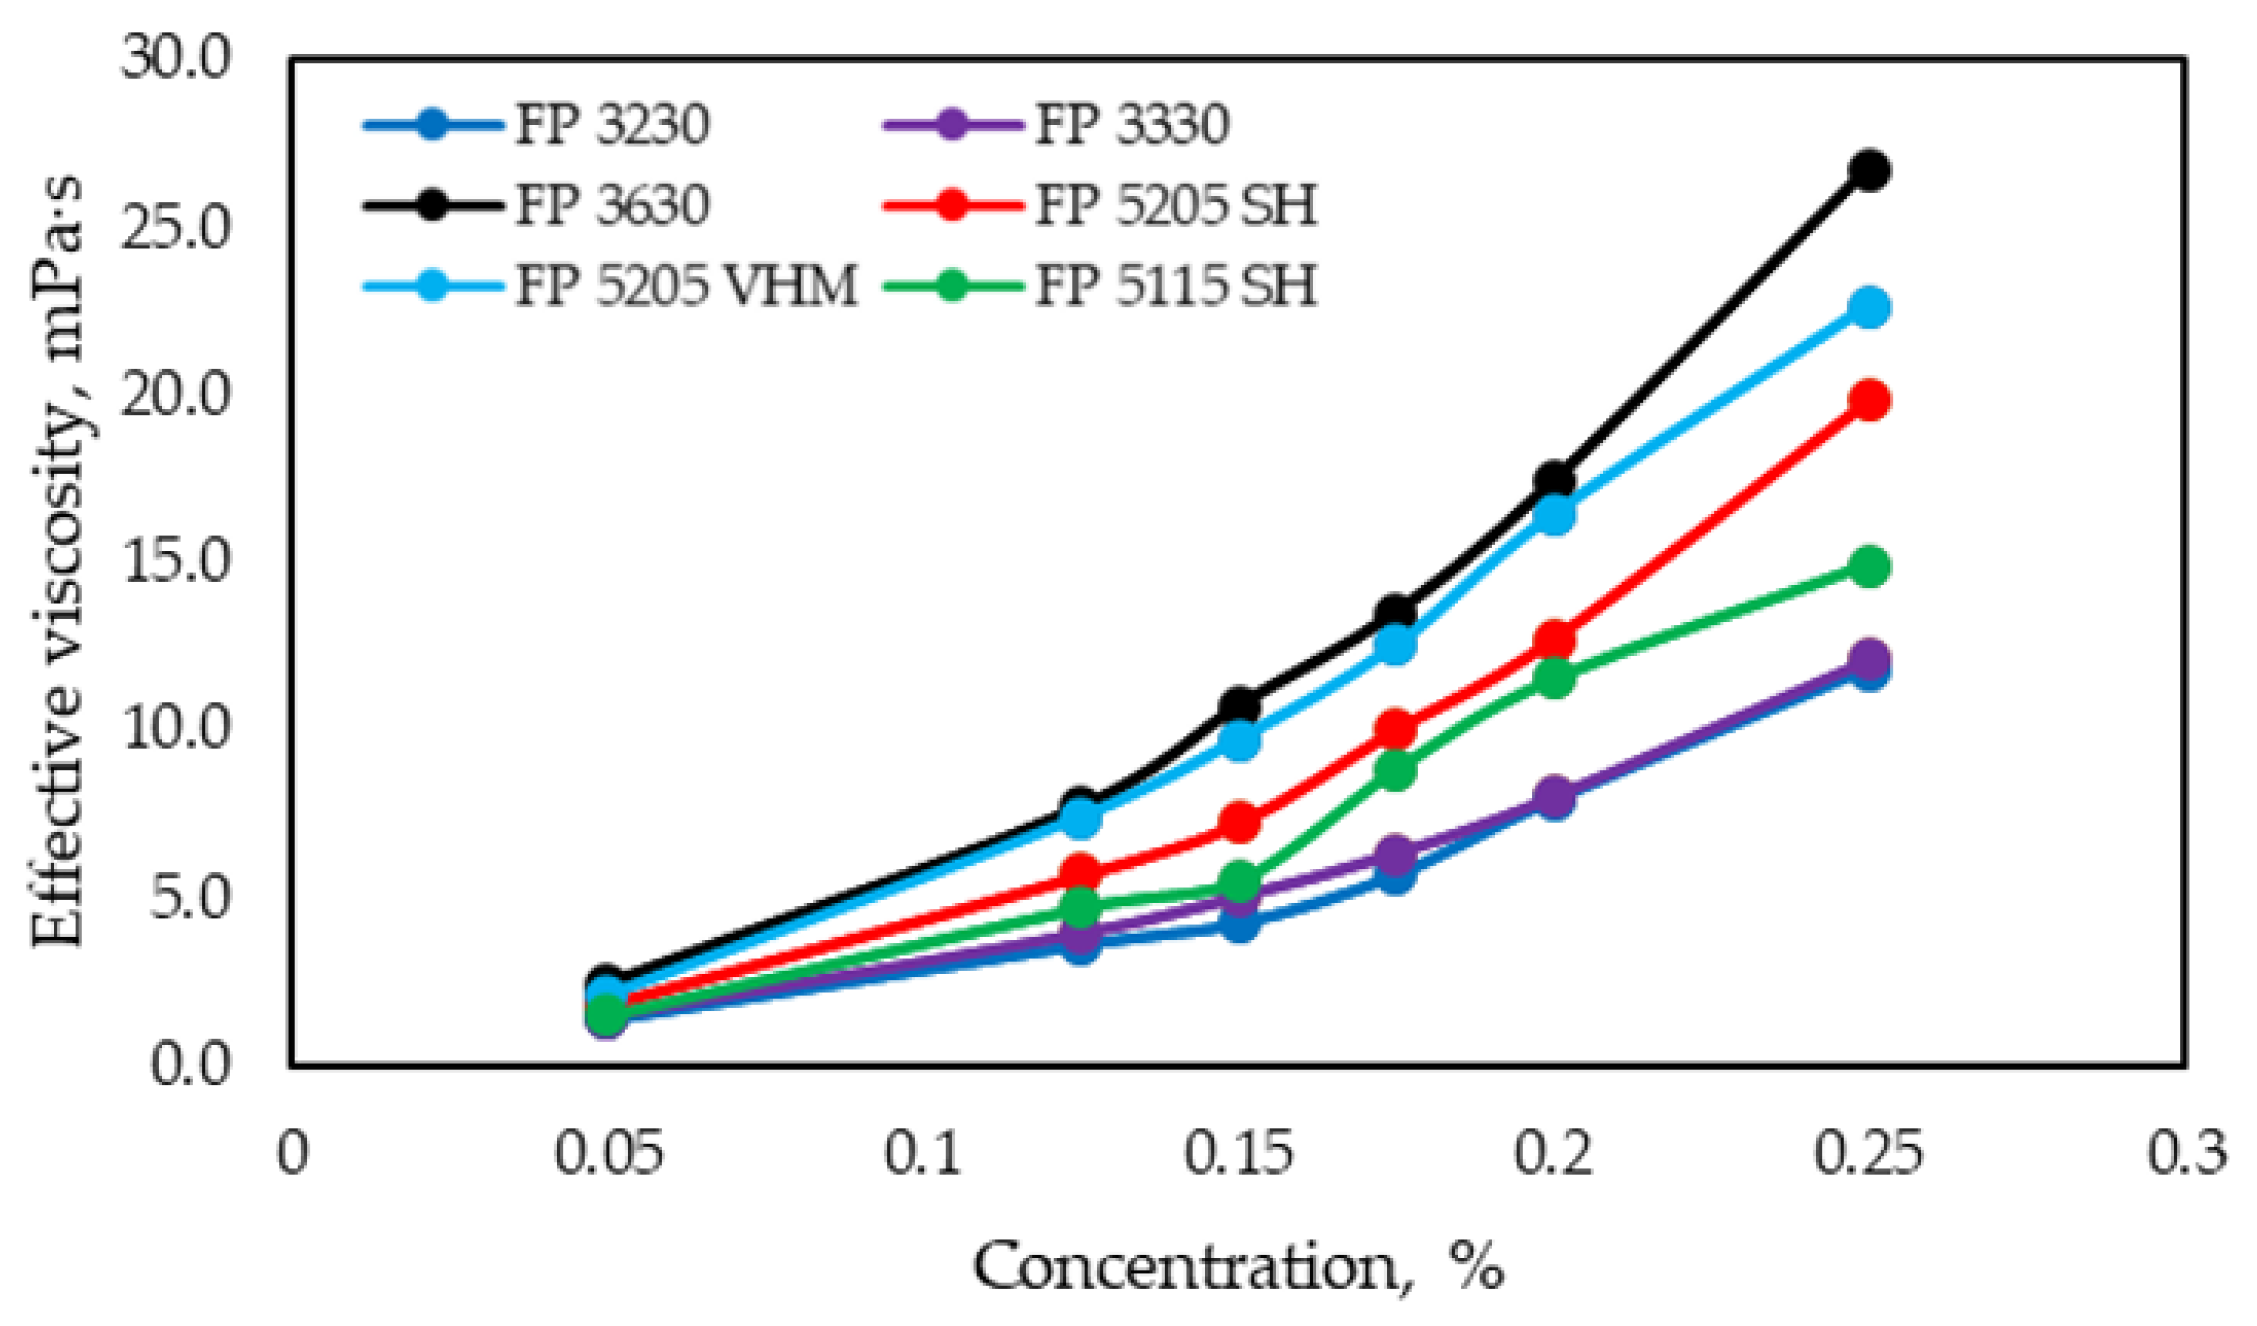
3.1.2. Rheological Curves for Polymer Samples

The results of the studies are presented in Figure 3, Figure 4, Figure 5, Figure 6, Figure 7 and Figure 8. Figure 9 shows the dependence of the effective viscosity of the polymer solution on concentration (at a shear rate of 7.34 s−1).
According to the obtained rheological curves, all prepared polymer solutions exhibited mainly pseudoplastic behavior in the shear rate range from 0.6 to 122.3 s−1. It is important to note that studies of polymer solutions using highly sensitive viscometers have shown that at low shear rates, Newtonian flow predominates. After the first critical value, the apparent viscosity decreases (pseudoplastic behavior), and upon reaching the second critical shear rate value, the flow becomes dilatant (increase in apparent viscosity) [25,62]. Once the maximum possible stretching of polymer chains is achieved at high shear rates, molecular degradation occurs, leading to a reduction in the apparent viscosity of the solution [63]. Determining the dependence of polymer solution viscosity on shear rate allows for the further modeling of its movement in the injection system and reservoir, enabling the selection of the most suitable composition for specific conditions [64].
Given the range of oil viscosity for the target reservoir (1 to 4.4 mPa·s), the viscosity of the polymer solution should exceed this value. When selecting the concentration, the viscosity corresponding to the second Newtonian plateau (viscosity at high shear rates) must be considered. Thus, the target concentrations for the polymers are as follows: FP 3230 S—0.23 wt.%; FP 3330 S—0.23 wt.%; FP 3630 S—0.15 wt.%; FP 5205 SH—0.175 wt.%; FP 5205 VHM—0.15 wt.%; FP 5115 SH—0.18 wt.%.

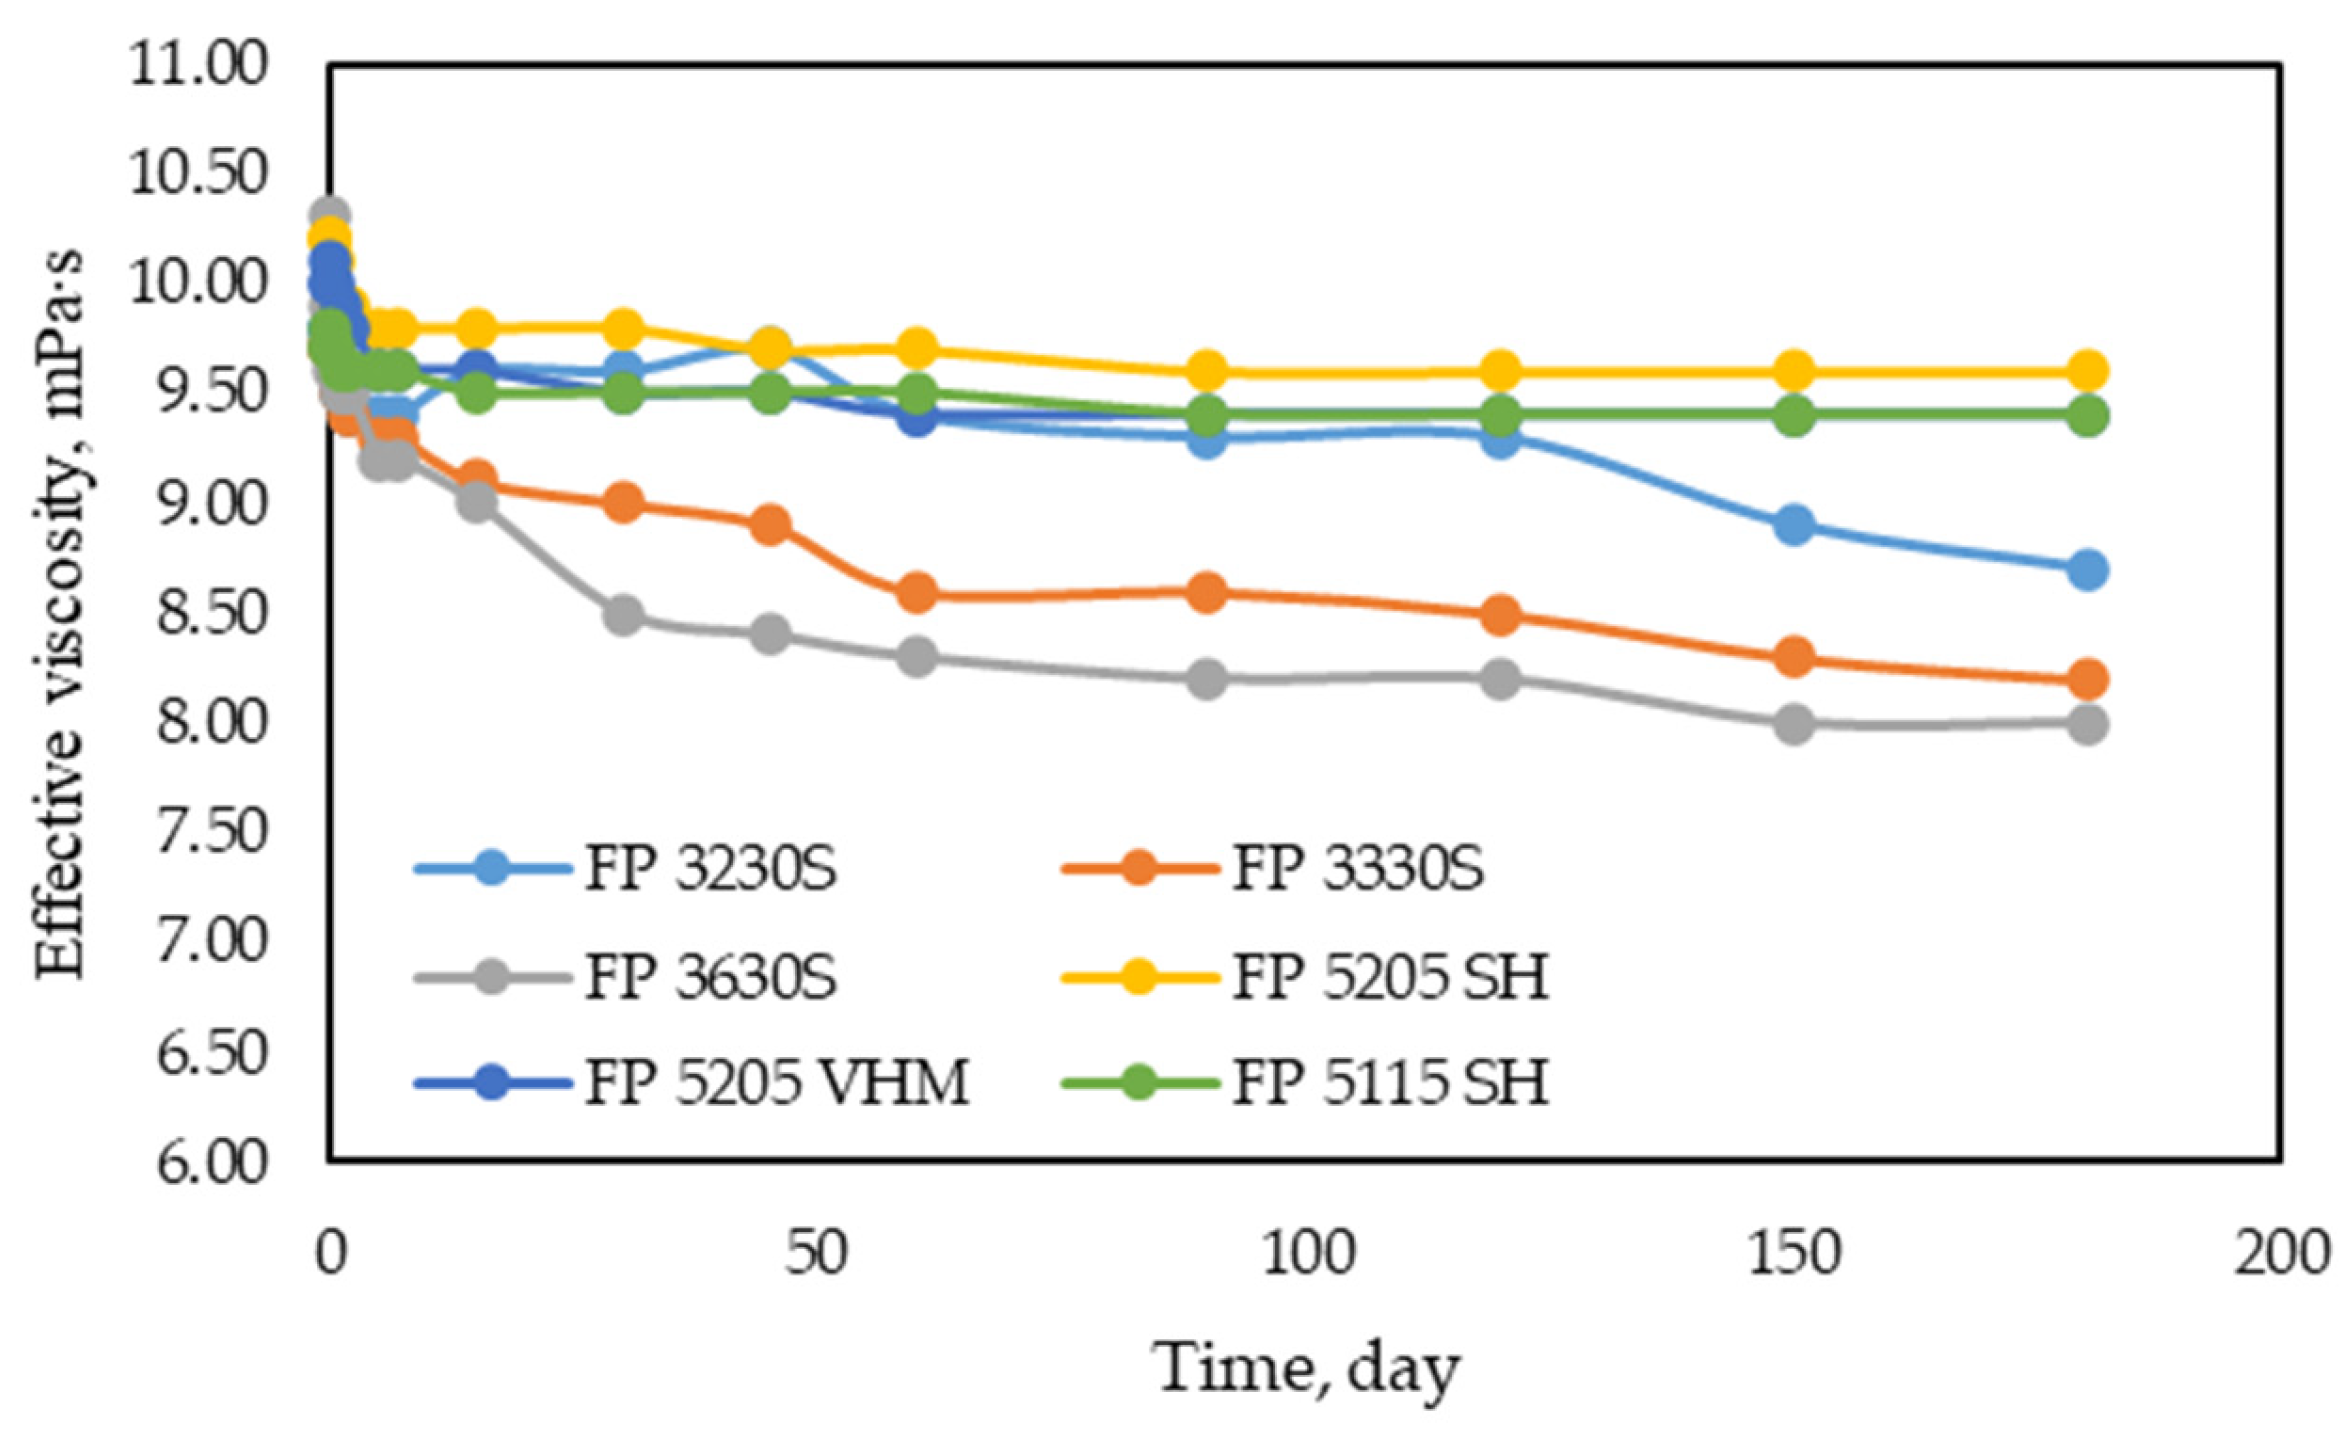
3.1.3. Studies on the Mechanical and Thermal Stability of Polymers

During the implementation of polymer flooding technology, mechanical degradation of the polymer occurs during the injection process (in pump units, perforation intervals, and near-wellbore zones) due to shear stresses [32,33]. The degree of mechanical degradation depends on the intensity and duration of shear exposure and must be considered when designing the technology. Polymer solutions with working concentrations were prepared using model water. The viscosity of the initial solutions was measured at a temperature of 57 °C and a shear rate of 7.34 s−1. Then, the solutions (500 cm3) were stirred at a mixer speed of 2000 rpm for 10 min, allowed to settle until air bubbles dissipated, and their viscosity was measured after mechanical degradation. The results of the studies are presented in Table 8.
Polyacrylamide polymers under reservoir conditions can undergo thermo-oxidative degradation due to high temperatures and reactive components present in the water, rock, and the polymer reagent itself. This leads to a reduction in solution viscosity and a deterioration of their technological properties [31]. The thermal stability of the polymers was evaluated based on the dynamics of viscosity changes under the influence of temperature. The resistance coefficient to thermo-oxidative degradation was calculated as the ratio of the viscosity after a specified exposure time to the viscosity of the initial solutions at a fixed shear rate (7.34 s−1).
The results of the studies are presented in Table 9 and Figure 10.
As can be seen from the obtained results, polymer solutions containing ATBS (acrylamide-tert-butyl sulfonic acid) demonstrate better resistance to thermo-oxidative degradation. The viscosity loss coefficient for the aforementioned polymer solutions does not exceed 10%.

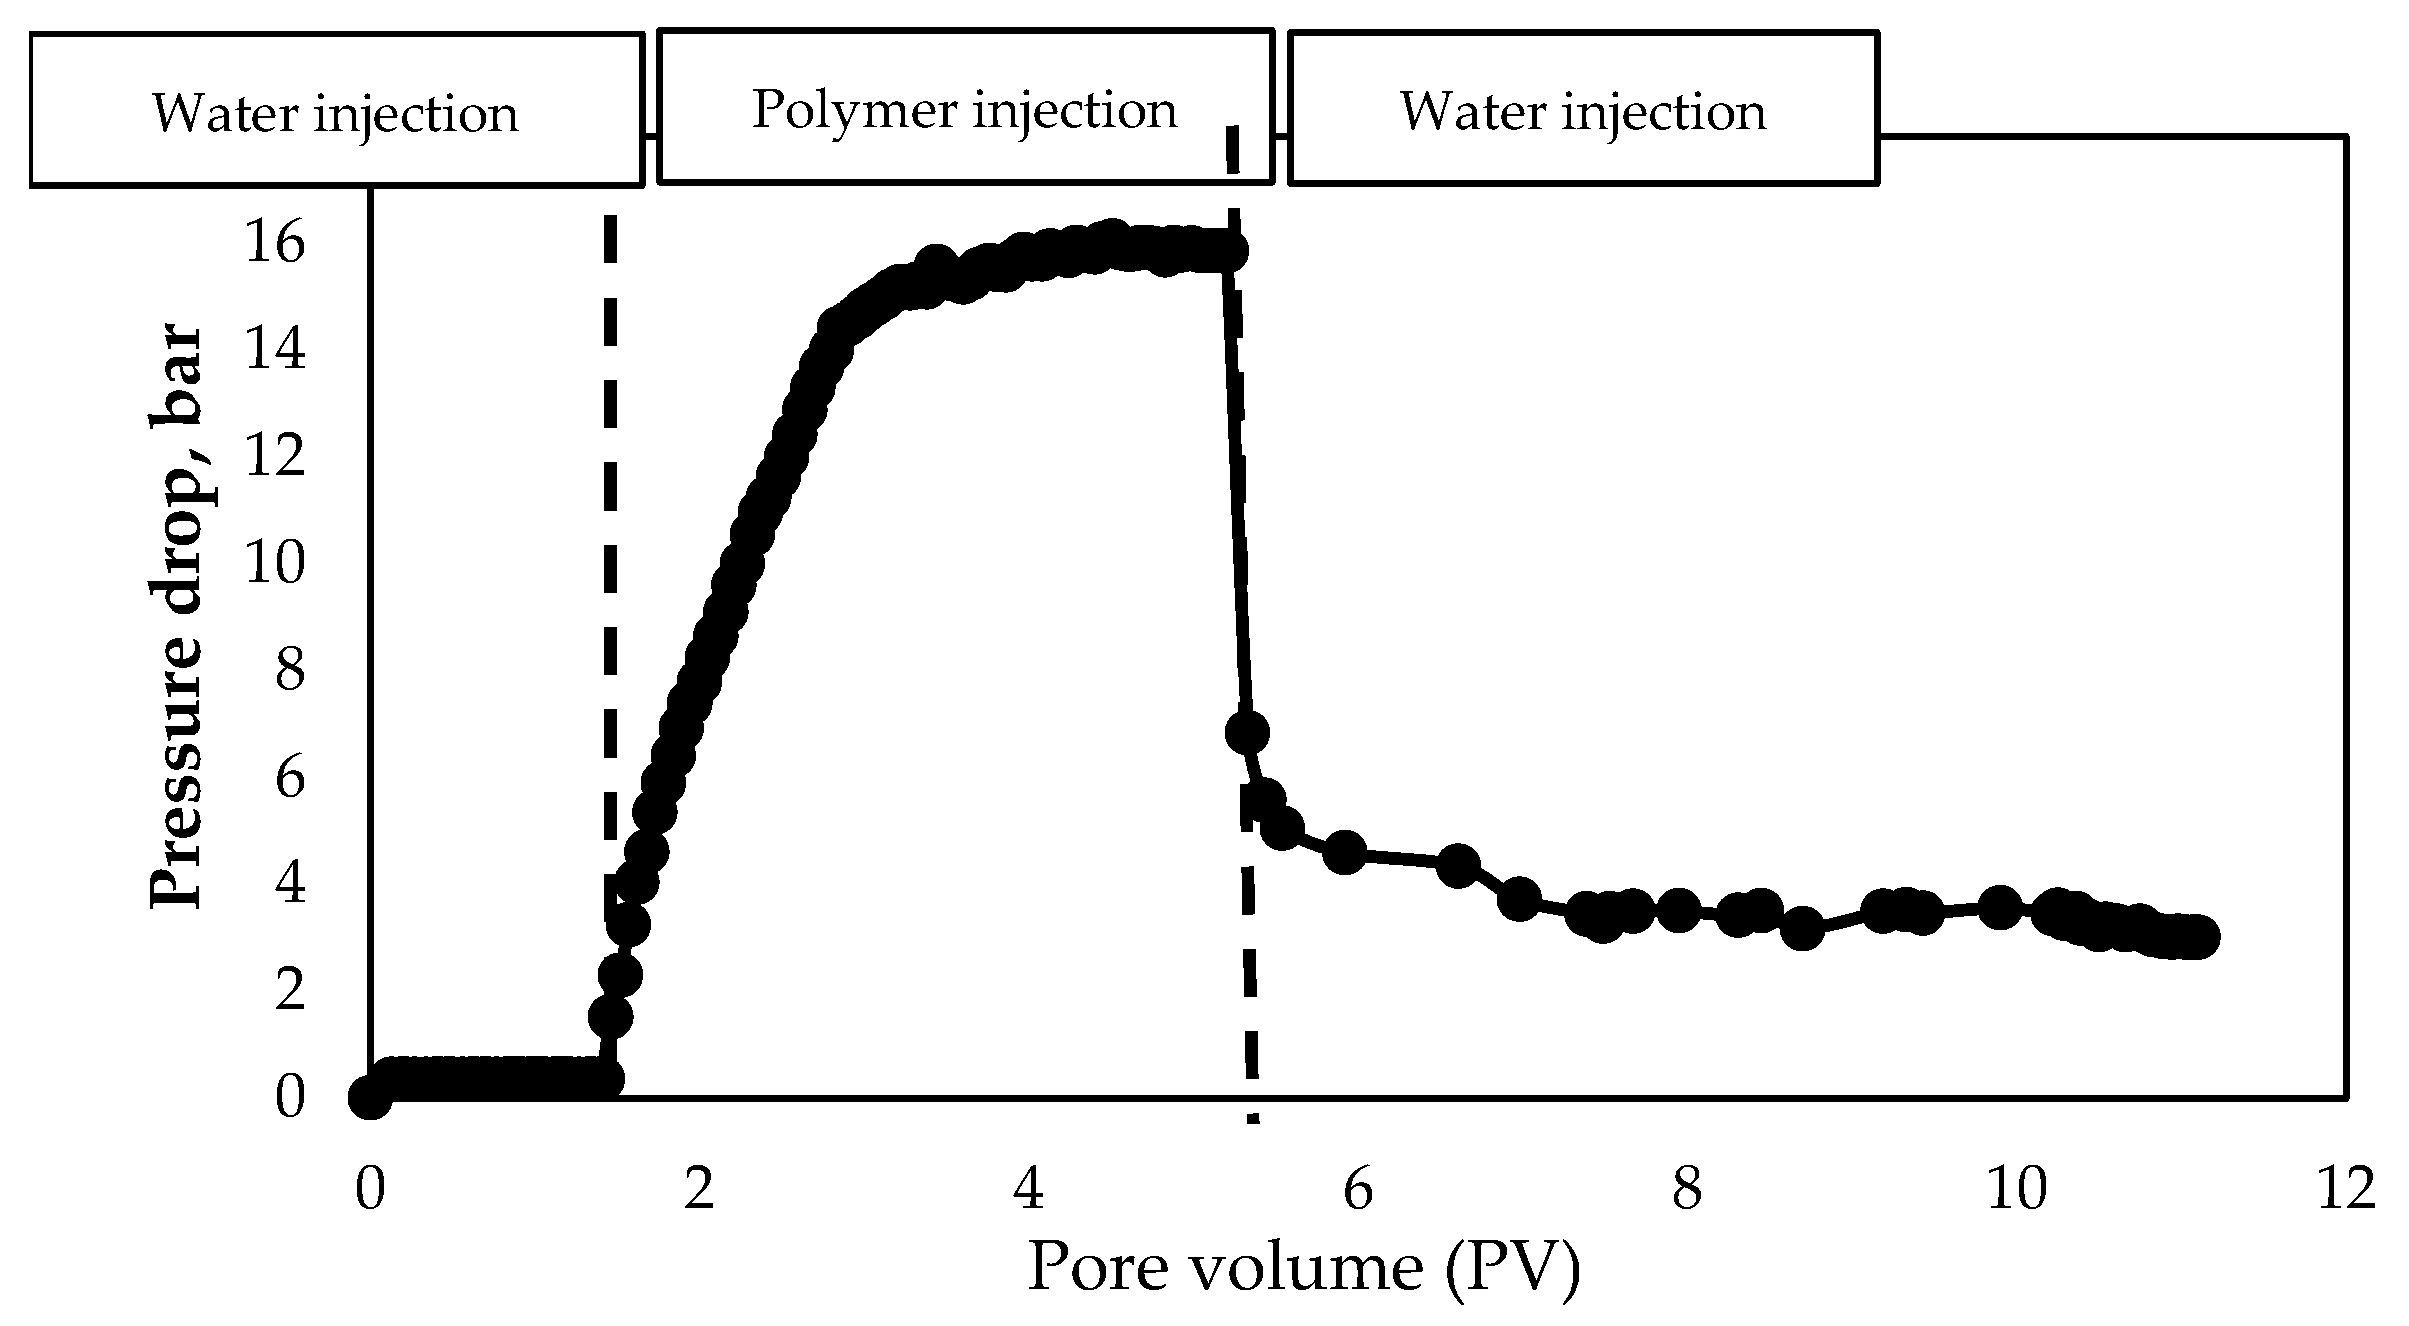
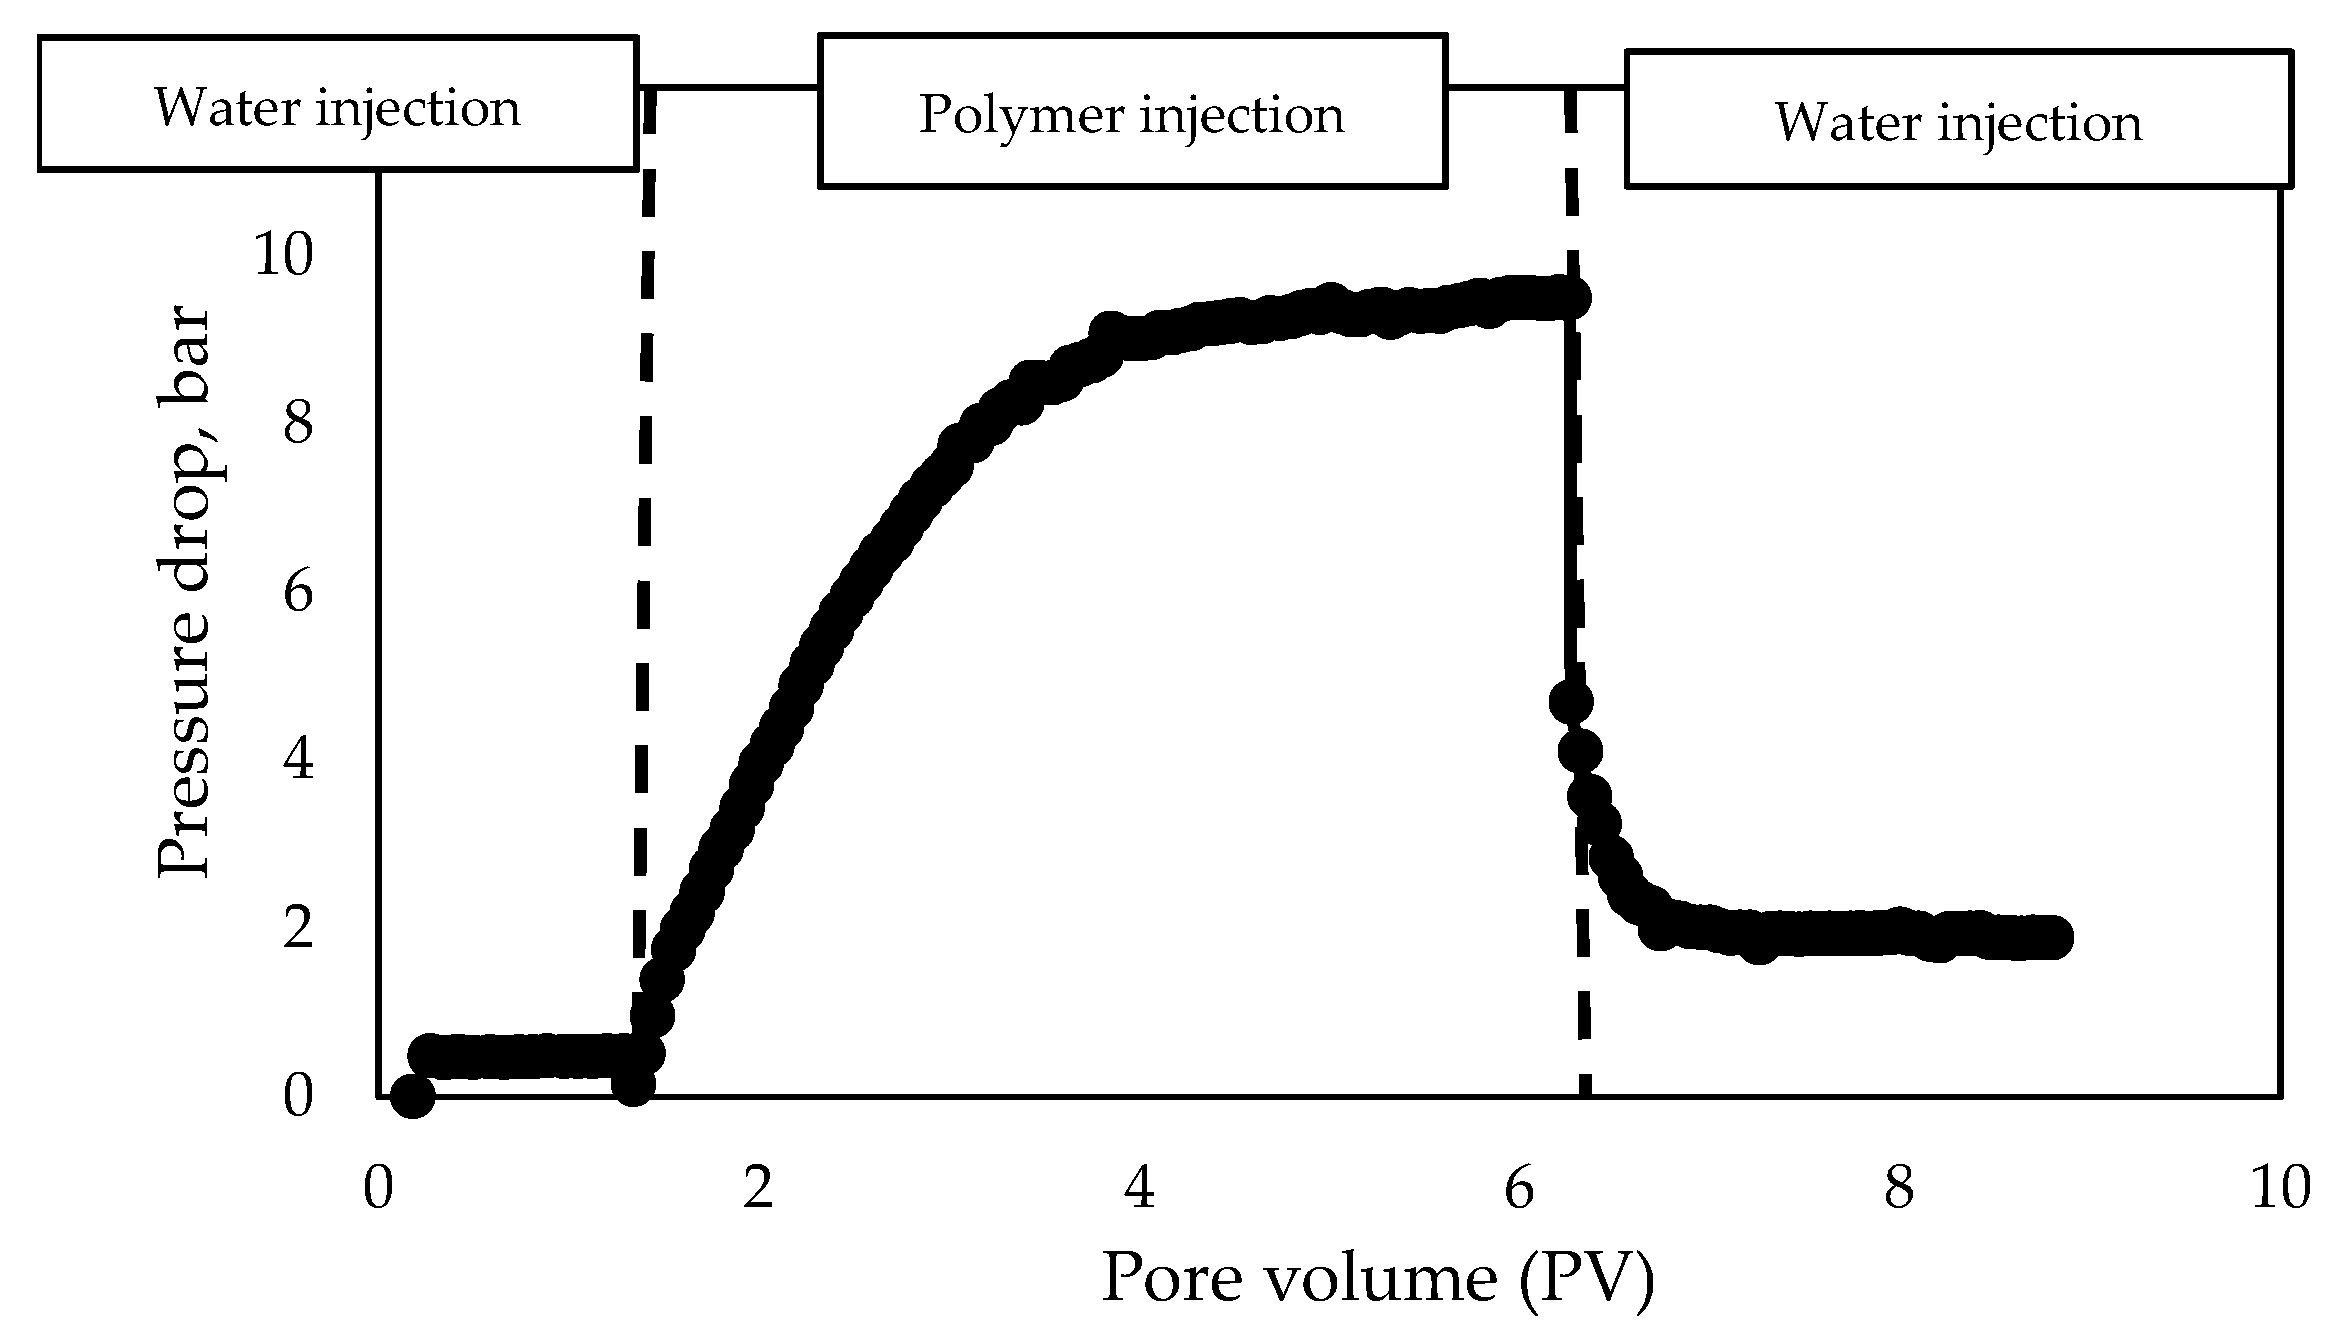
3.1.4. Evaluation of Polymer Solutions Flowability in Porous Media

Table 10 provides the main information about the polymer solution samples used in the experiments.
Figure 11, Figure 12, Figure 13 and Figure 14 illustrate the dynamics of pressure drop changes depending on the pore volume injected for the following cases.
After all preparatory procedures and placing the core in the core holder, the first stage of the core flooding experiment involved simulating water flooding of the core by injecting water at a specified flow rate until oil displacement from the core holder ceased.
In the next stage of the core flooding study, a polyacrylamide solution prepared using the model injection water was injected, with simultaneous sampling at the outlet of the model until pressure stabilization. After sampling, the polymer solution was continuously injected until pressure stabilization was achieved at each flow rate. To assess mechanical degradation, polymer samples were collected after pressure stabilization at each flow rate.
In the final stage of the experiment, at the minimum rate, the polymer solution was displaced by injecting water while collecting samples. Thus, the core flooding experiment can be divided into three main stages:
  • Water injection before polymer solution injection;
  • Polymer solution injection;
  • Water injection after polymer solution injection.
Water, polymer, and surfactant–polymer solutions were injected at a constant rate of 1 mL/min. The injection rate selection was primarily guided by capillary number. While the hydrodynamic modelling of reservoir conditions suggested an optimal rate of 0.1 mL/min, laboratory implementation at this rate would require prohibitively long experimental durations.
Employing this parameter for capillary number calculation yields a dimensionless value of 10−7. When recalculated at the experimental injection rate of 1 mL/min, the resulting capillary number magnitude decreases to 10−8. This order-of-magnitude variation remains methodologically acceptable as it conserves the capillary-dominated displacement regime (Nc ≤ 10−6), thereby preserving the fundamental fluid dynamics governing the process.
Table 11 presents the main results of the core flooding experiments.
Figure 15 shows the dependence of the RF resistance factor on the value of the molecular weight of the polymer for the same values of the effective viscosity of 10 mPa s (shear rate 7.34 s−1, temperature 57 °C).
The resistance factor is an indicator that reflects how many times the mobility of the displacing agent has changed when switching from a water injection to a polymer solution injection. Thus, the resistance factor is determined by two main mechanisms: an increase in the viscosity of the displacing agent and a decrease in relative permeability.
Additionally, in Figure 15, the red dots indicate the values of the maximum effective viscosity measured during the studies using a rotational viscometer for each of the considered polymers. A significant excess of the resistance factor over this value may indicate excessive retention of the polymer on the rock.
Polymer retention in the porous medium is caused by the following three mechanisms: mechanical entrapment, hydrodynamic retention, and adsorption, as illustrated in Figure 16.
The mechanical entrapment of polymers is caused by the large size of their molecules relative to the pore size. Therefore, when selecting a polymer, attention must be paid to the molecular size and the flow properties of the reservoir to avoid channel plugging. Typically, the influence of this mechanism in rocks (except for low-permeability ones) is small, and in most practical cases, it can be neglected by properly selecting the polymer composition [33,66].
Hydrodynamic retention is the least studied mechanism of polymer retention and depends on the injection rate. As the injection rate increases, hydrodynamic retention also increases. However, it is worth noting that this component does not significantly affect the overall level of polymer retention in the pore volume and is not a critical factor for polymer flooding in field conditions.
Adsorption refers to the interaction between polymer molecules and the solid surface. This interaction involves the bonding of polymer molecules with elements of the rock, typically those with low free energy [67].
Thus, polymers with a resistance factor significantly exceeding the maximum effective viscosity value are not suitable candidates for use in the target reservoir from the perspective of flowability in porous media.
On the other hand, the increase in the displacement factor for various polymers ranges from 0.06 to 0.11. Moreover, there is a slight increase in the oil displacement coefficient with a decrease in molecular weight. The highest increase in the additional displacement factor is observed for the FP 5205 SH sample.
Based on the obtained results from the polymer studies, the FP 5205 SH sample will be considered for further testing.

3.2. The Study of Surfactant Properties

3.2.1. Evaluation of Surfactant Solubility

The first stage of laboratory studies involved assessing solubility in model water, which simulates the composition of the injected water in the target reservoir.
All solutions were prepared with a concentration of 1 wt.%. Solubility was evaluated at a standard temperature visually over a period of 3 days. The results of the study are presented in Table 12.

3.2.2. Evaluation of Phase Behavior

As noted earlier, studies on surfactant phase behaviour at the oil–water interface allow for the assessment of their ability to form microemulsions, which indirectly indicates improved oil displacement efficiency.
It is believed that in optimal surfactant systems, the IFT at the interface approaches 0.001 mN/m. According to the classification presented in the works of M.L. Surguchev, when the interfacial tension at the “oil-surfactant solution” interface decreases, four types of emulsions can form (Figure 17) [14]:
Type I: A non-equilibrium solution with a high surfactant concentration, soluble in both water and oil.
Type II: A solution balanced with oil and soluble only in water. Over time, excess oil separates from the solution, forming a stable phase boundary. The interfacial tension at the oil interface is low (0.1–0.001 mN/m), while at the water interface, it is zero. This type is called a solution with an external aqueous phase, sometimes referred to as the “lower phase” or oil-in-water microemulsion.
Type III: A solution balanced with water and soluble only in oil, or a solution with an external hydrocarbon phase, sometimes called the “upper phase” or water-in-oil microemulsion.
Type IV: A solution insoluble in both water and oil, i.e., balanced with oil and water, sometimes referred to as the “middle phase”. This solution has very low interfacial tension at both the oil and water interfaces (0.001–0.0001 mN/m), enabling miscible displacement.
To study the phase behaviour of surfactant solutions at the oil–water interface, equal volumes of crude oil from the target reservoir and surfactant solutions at a concentration of 1 wt.% were added to measuring cylinders. The studies were conducted at a temperature of 57 °C and a water-to-oil phase ratio of 1:1.
Figure 18 presents the results of the phase behaviour of surfactants based on sodium laureth sulphate, oleyl betaine, diethanolamide of lauric acid, and betaine.
As can be seen from Figure 18, surfactant samples No. 1 and No. 4 (sodium laureth sulphate and betaine) have the ability to form emulsions. Moreover, sample No. 1 forms a Type IV emulsion, i.e., a solution insoluble in both water and oil. This solution has an IFT of 0.001–0.0001 mN/m. Surfactant sample No. 4 forms a Type II solution, characterised by interfacial tension in the range of 0.1 to 0.001 mN/m. On the other hand, no ability to form an emulsion with oil was observed for samples No. 2 and No. 3 (oleyl betaine and diethanolamide of lauric acid).
Figure 19 presents the results of the phase behaviour of surfactants based on dodecylbenzene sulfonate and alpha-olefin sulfonate.
As can be seen from Figure 18, the surfactant sample based on dodecylbenzene sulfonate (left) forms a Type IV emulsion, i.e., a solution insoluble in both water and oil. This solution has an interfacial tension of 0.001–0.0001 mN/m. The surfactant sample based on alpha-olefin sulfonate (right) did not demonstrate the ability to form an emulsion with the studied oil.
Table 13 presents the results of the phase behaviour studies of surfactant solutions and oil.
Solutions that demonstrated the ability to form emulsions will be further investigated in subsequent tests.

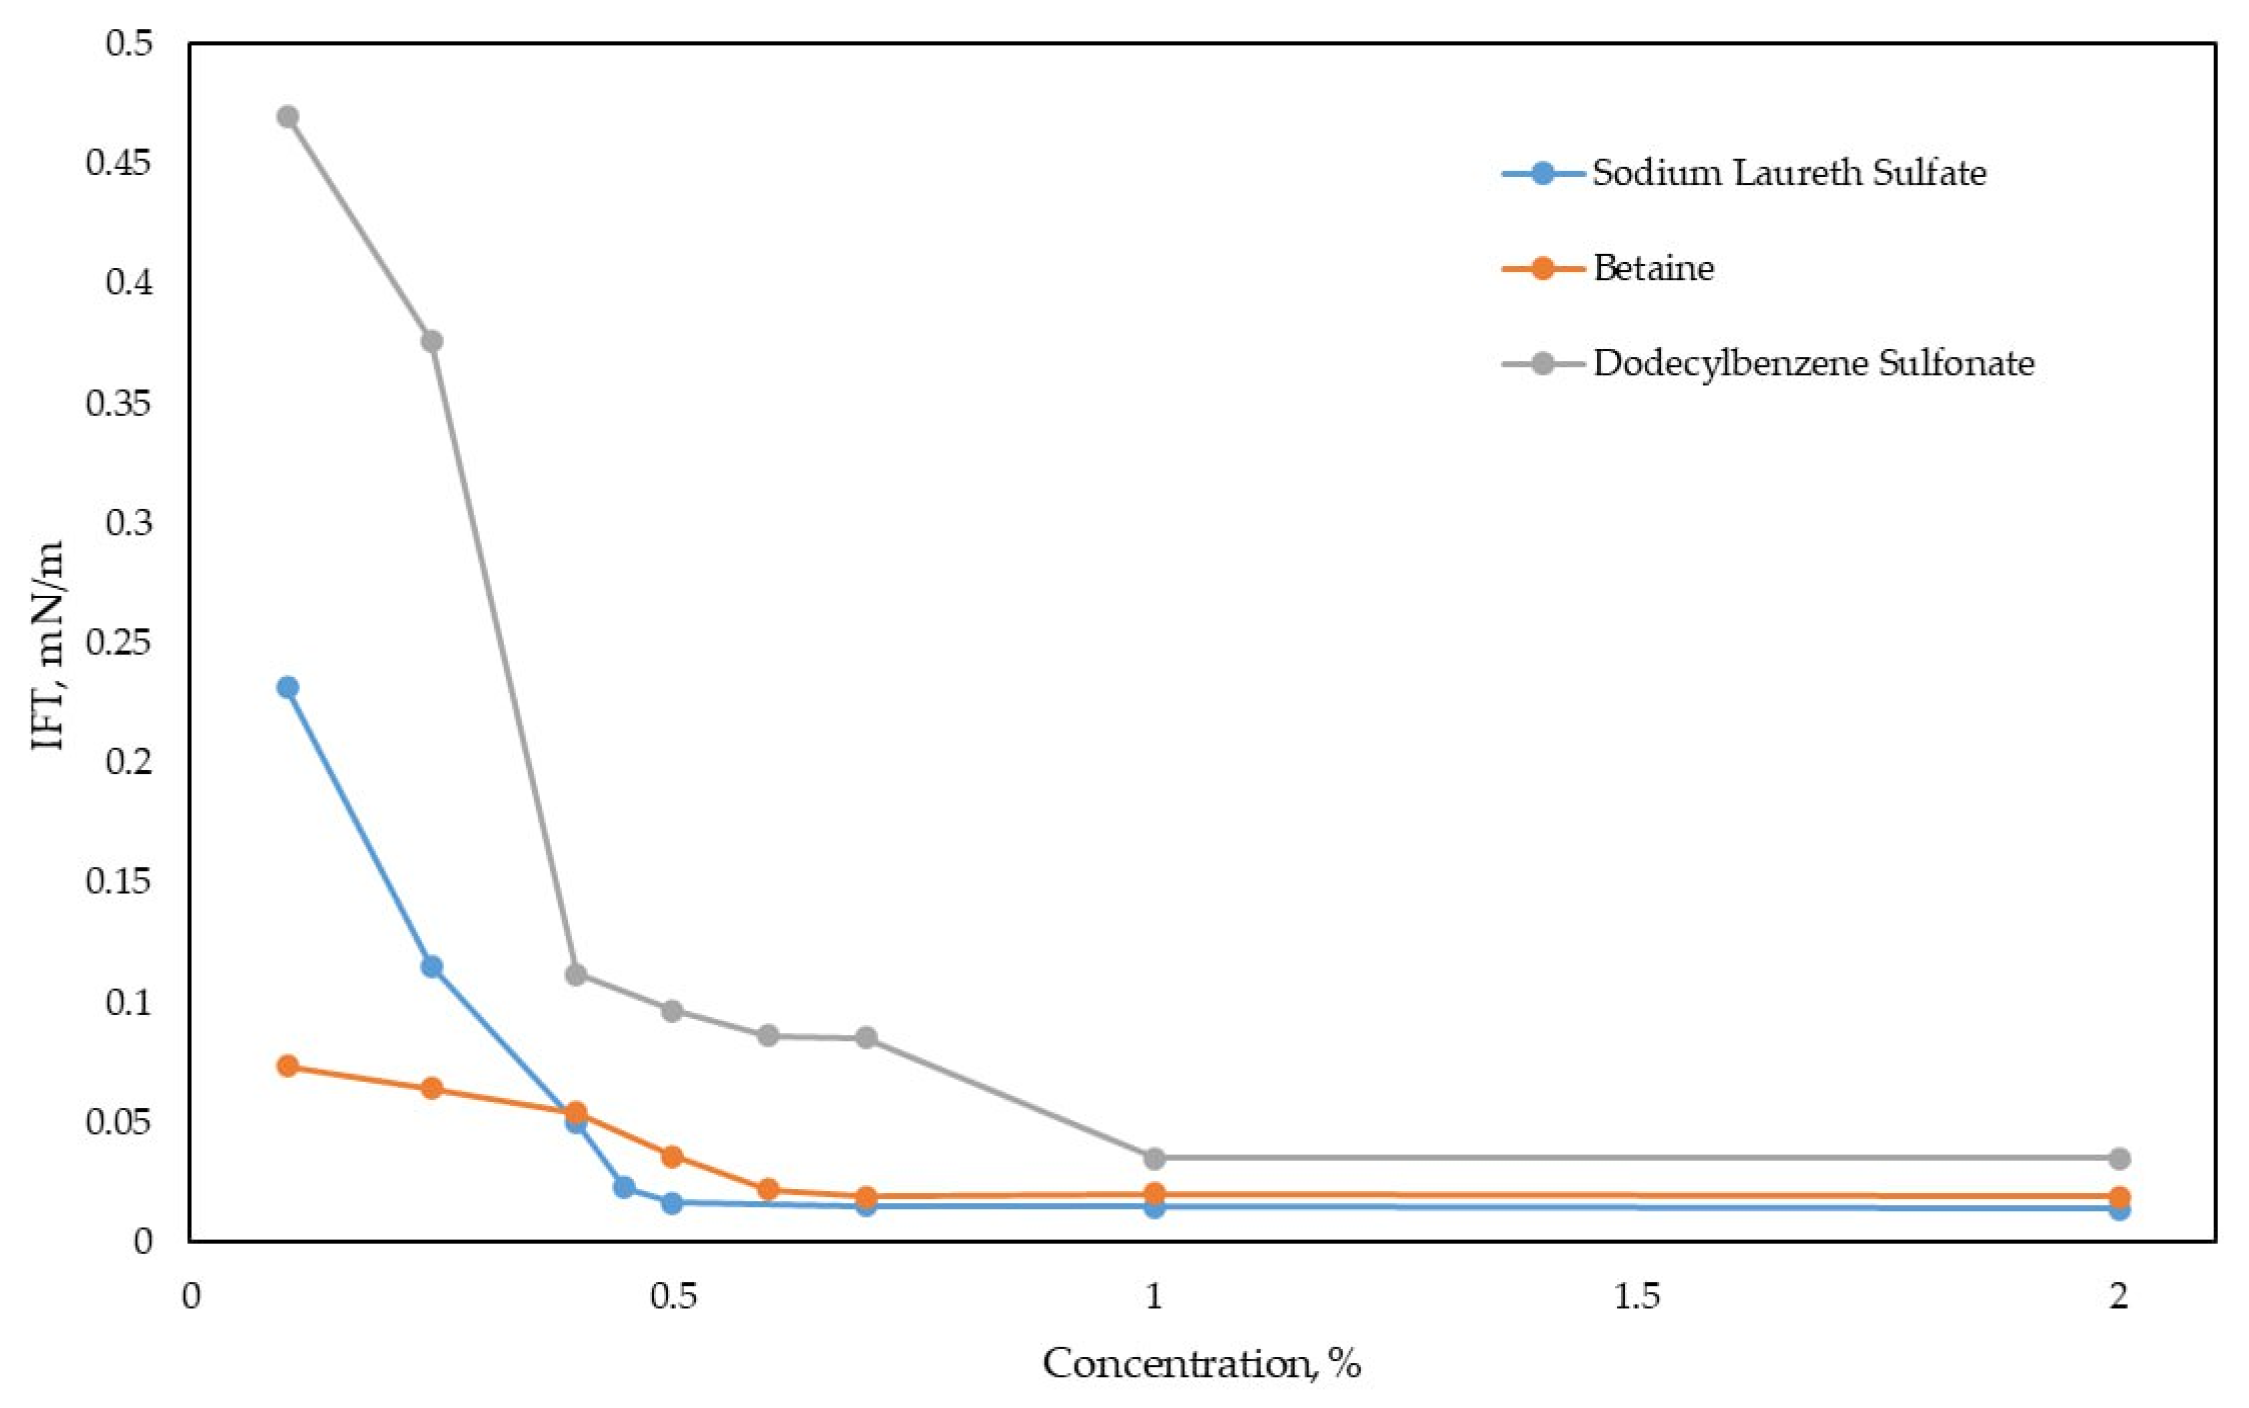
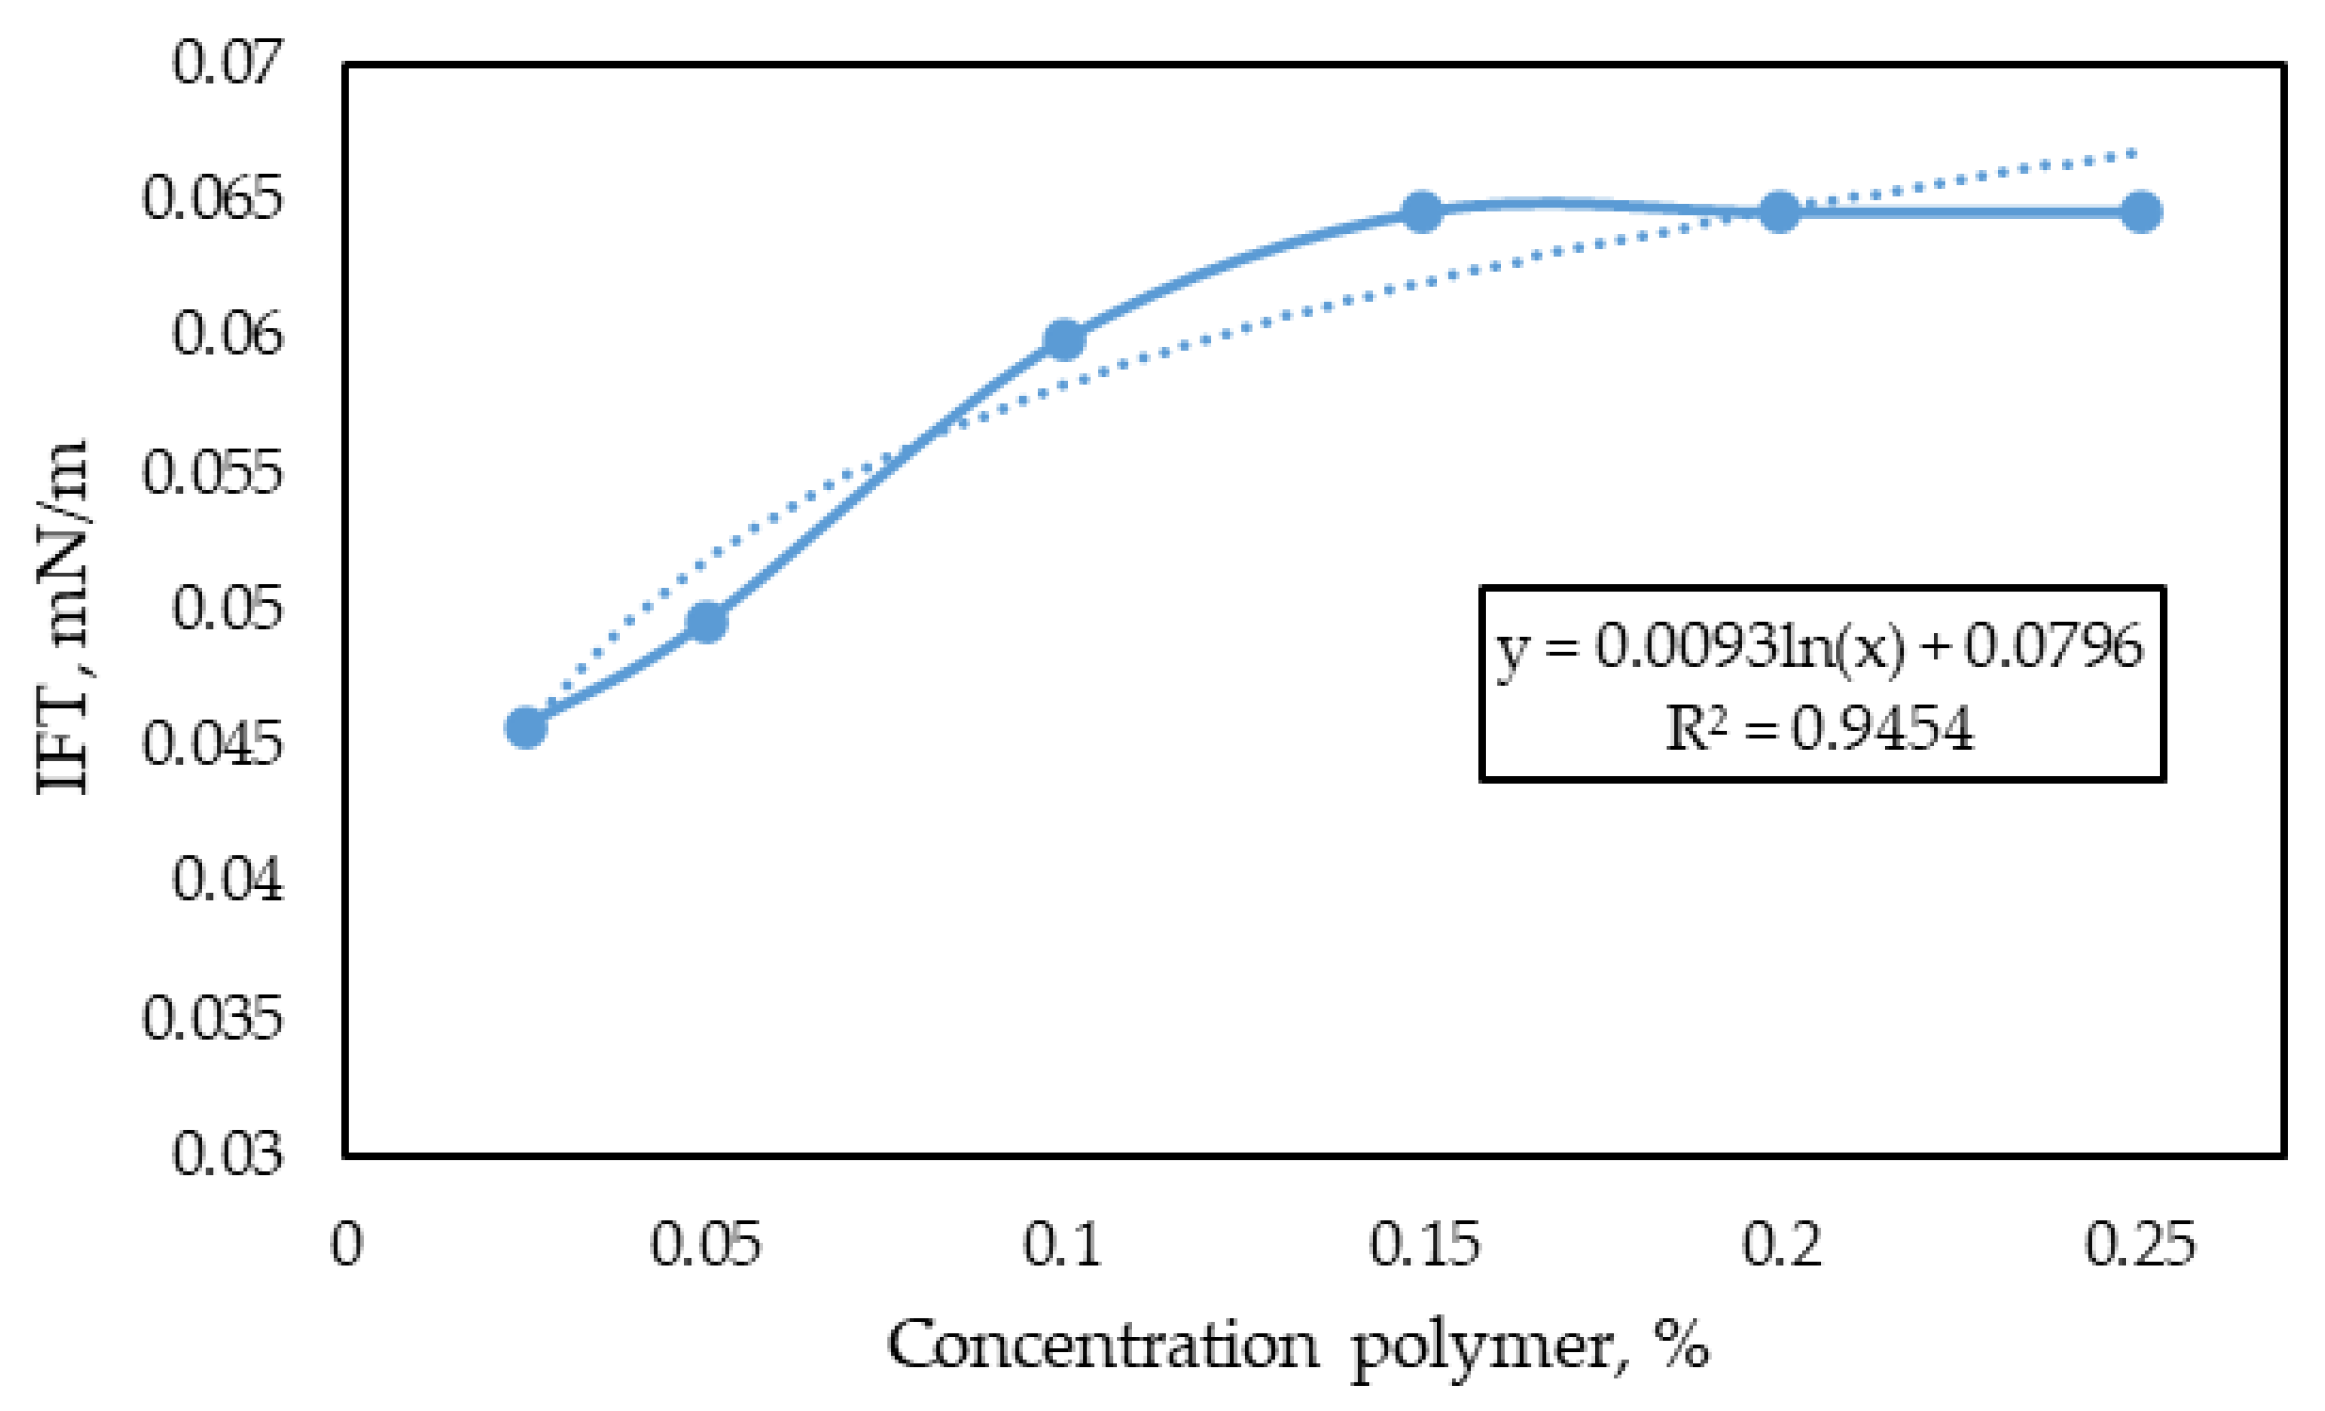
3.2.3. Study of IFT Dependence on Surfactant Concentration

IFT studies at the “surfactant solution-oil” interface were conducted in the concentration range of 0.1 wt.% to 2 wt.% at the target reservoir temperature. Upon reaching the target temperature, the system automatically records 10 measurements at 10 s intervals. The resulting dataset is subsequently processed to generate a report containing averaged temperature and interfacial tension (IFT) values.
Figure 20 and Table 14 present the results of determining the interfacial tension at the “surfactant solution-oil” interface for various surfactant samples.
The experimental data demonstrate that all investigated surfactants exhibit significant potential for interfacial tension reduction. A systematic IFT decrease was observed with an increasing surfactant concentration, reaching minimal values within the 0.5–1% concentration range. An optimal IFT reduction to 0.01–0.1 mN/m substantially enhances oil displacement efficiency through two synergistic mechanisms: (1) increased capillary number (Nc) and (2) reduced residual oil saturation in pore spaces. Maximum performance is achieved at concentrations exceeding the CMC, where the combined effect of minimized IFT and enhanced polymer solution viscosity improves both sweep efficiency and ultimate recovery.
Based on the obtained results, the critical micelle concentration was determined for each of the studied surfactants. The CMC for the surfactant based on sodium laureth sulphate was 0.5 wt.%, for the surfactant based on betaine it was 0.6 wt.%, and for the surfactant based on dodecylbenzene sulfonate, the CMC was achieved at a concentration of 1 wt.%. Furthermore, for the surfactants based on sodium laureth sulphate and betaine, the interfacial tension at the “surfactant solution-oil” interface was 2 times and 1.5 times lower, respectively, compared to the surfactant based on dodecylbenzene sulfonate. Therefore, only two surfactant samples—based on sodium laureth sulphate and betaine—will be used for further studies.

3.2.4. Studies of Static Surfactant Adsorption

Table 15 presents the results of static surfactant adsorption studies.
The obtained values of static adsorption are 1127.5 µg/g for the surfactant based on sodium laureth sulphate and 914.1 µg/g for the surfactant based on betaine. These values can be considered acceptable. Taking into account the obtained values for the CMC and static surfactant adsorption, it is proposed to increase the working and tested surfactant concentration in the solution to 0.7 wt.% for further tests.
Several sources note the influence of temperature and salinity on the behaviour of the “surfactant solution-oil” system. Even a slight shift in temperature within the reservoir can significantly affect the interfacial tension at the “surfactant solution-oil” interface. Figure 21 and Figure 22 show the dependence of interfacial tension at the “surfactant solution-oil” interface on temperature.
As can be seen from the graphs, for the surfactant based on sodium laureth sulphate, the zone of low interfacial tension is in the temperature range of 50 to 75 °C. On the other hand, for the surfactant based on betaine, an increase in interfacial tension is observed when the temperature reaches 65 °C.
During displacement under reservoir conditions, the salinity of the injected agent will change as a result of contact with the rock and reservoir fluids. To evaluate the influence of salinity on the system, Figure 23 and Figure 24 show the dependence of interfacial tension on the salinity of the water used to prepare the solution.
As can be seen from the presented graphs, the surfactant based on sodium laureth sulphate maintained low interfacial tension in the salinity range of 15 to 25 g/L for the preparation water, reaching its optimum (lowest value) at 20 g/L. On the other hand, the surfactant based on betaine maintained low interfacial tension across the entire studied range of water salinity, reaching its optimum (lowest value) at 25 g/L.
In practice, this result can be used to modernise the water injection system by utilising alternative water sources or by further purifying the currently used water. Such modernisation would maximise the efficiency of implementing the surfactant-polymer flooding technology.
Considering the geological and physical characteristics of the target reservoir, particularly the reservoir temperature, which varies between 50 and 75 °C in different parts of the formation, only the surfactant based on sodium laureth sulfate will be considered for further studies. This surfactant demonstrated low interfacial tension across the entire temperature range under consideration.

3.3. Studies on the Surfactant–Polymer Formulation

3.3.1. Influence of Surfactant and Polymer Concentration on the Key Properties of the Formulation

When mixing surfactants and polymers, reactions may occur that alter the properties of the injected chemical agent. The key properties affecting the efficiency of flooding are the viscosity of the injected agent and the interfacial tension at the “surfactant solution-oil” interface.
Figure 25 shows the dependence of the effective viscosity of the chemical formulation, including the polymer FP 5205 SH (concentration 0.15 wt.%) and the surfactant based on sodium laureth sulphate, at various surfactant concentrations.
Next, Figure 26 presents the dependence between the effective viscosity of the solution and surfactant concentration at a shear rate of 122.3 s−1 and a polymer concentration of 0.15 wt.%. The selected shear rate corresponds to the second Newtonian plateau on the viscosity vs. shear rate graph (under constant conditions, the effective viscosity should remain constant with further increases in shear rate).
As can be seen from the graphs, the influence of the surfactant on the viscosity of the chemical formulation is minimal. Moreover, as the surfactant concentration increases, the effective viscosity stabilises.
Figure 27 shows the dependence of interfacial tension at the “surfactant-polymer solution-oil” interface on the polymer concentration in the formulation. The studies were conducted using the polymer FP 5205 SH and the surfactant based on sodium laureth sulphate (concentration 0.7 wt.%) at the reservoir temperature.
As can be seen from the presented graph, increasing the polymer concentration in the chemical composition leads to an increase in interfacial tension. The IFT value changed by more than 35% with the addition of the polymer. However, the order of magnitude of the IFT remained the same, meaning the surfactant’s potential did not change significantly. When injecting the surfactant–polymer formulation, the capillary number will increase by 4500 times (reduction in IFT from 32.77 mN/m to 0.065 mN/m; increase in the viscosity of the injected agent from 0.5 mPa·s to 4.36 mPa·s).

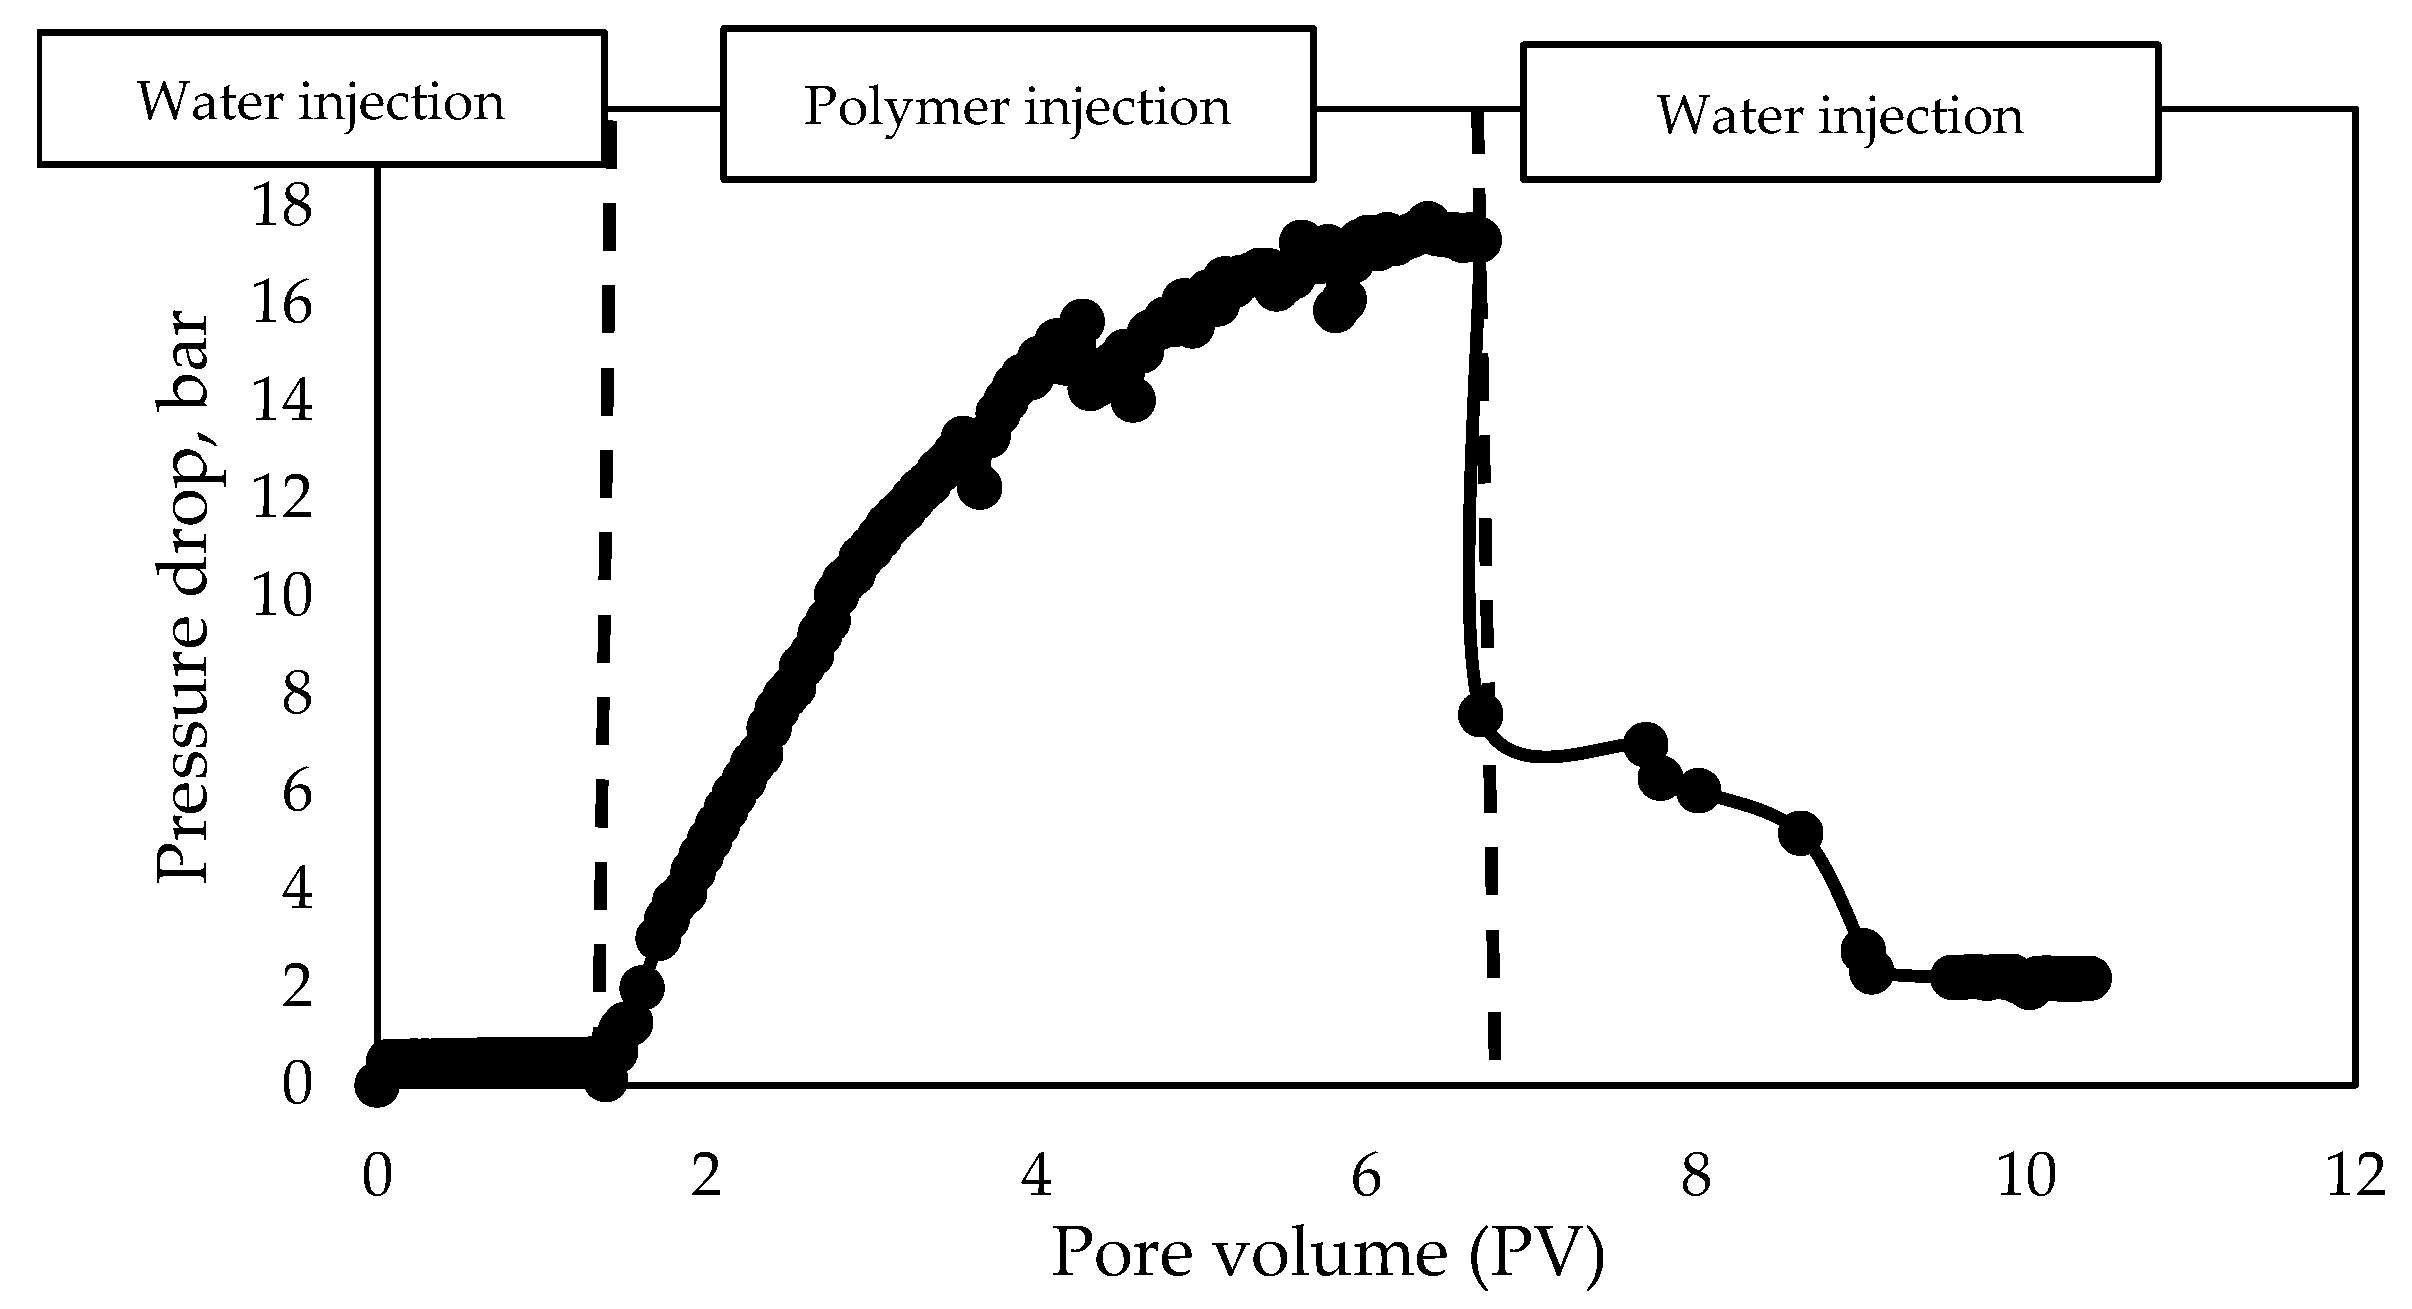
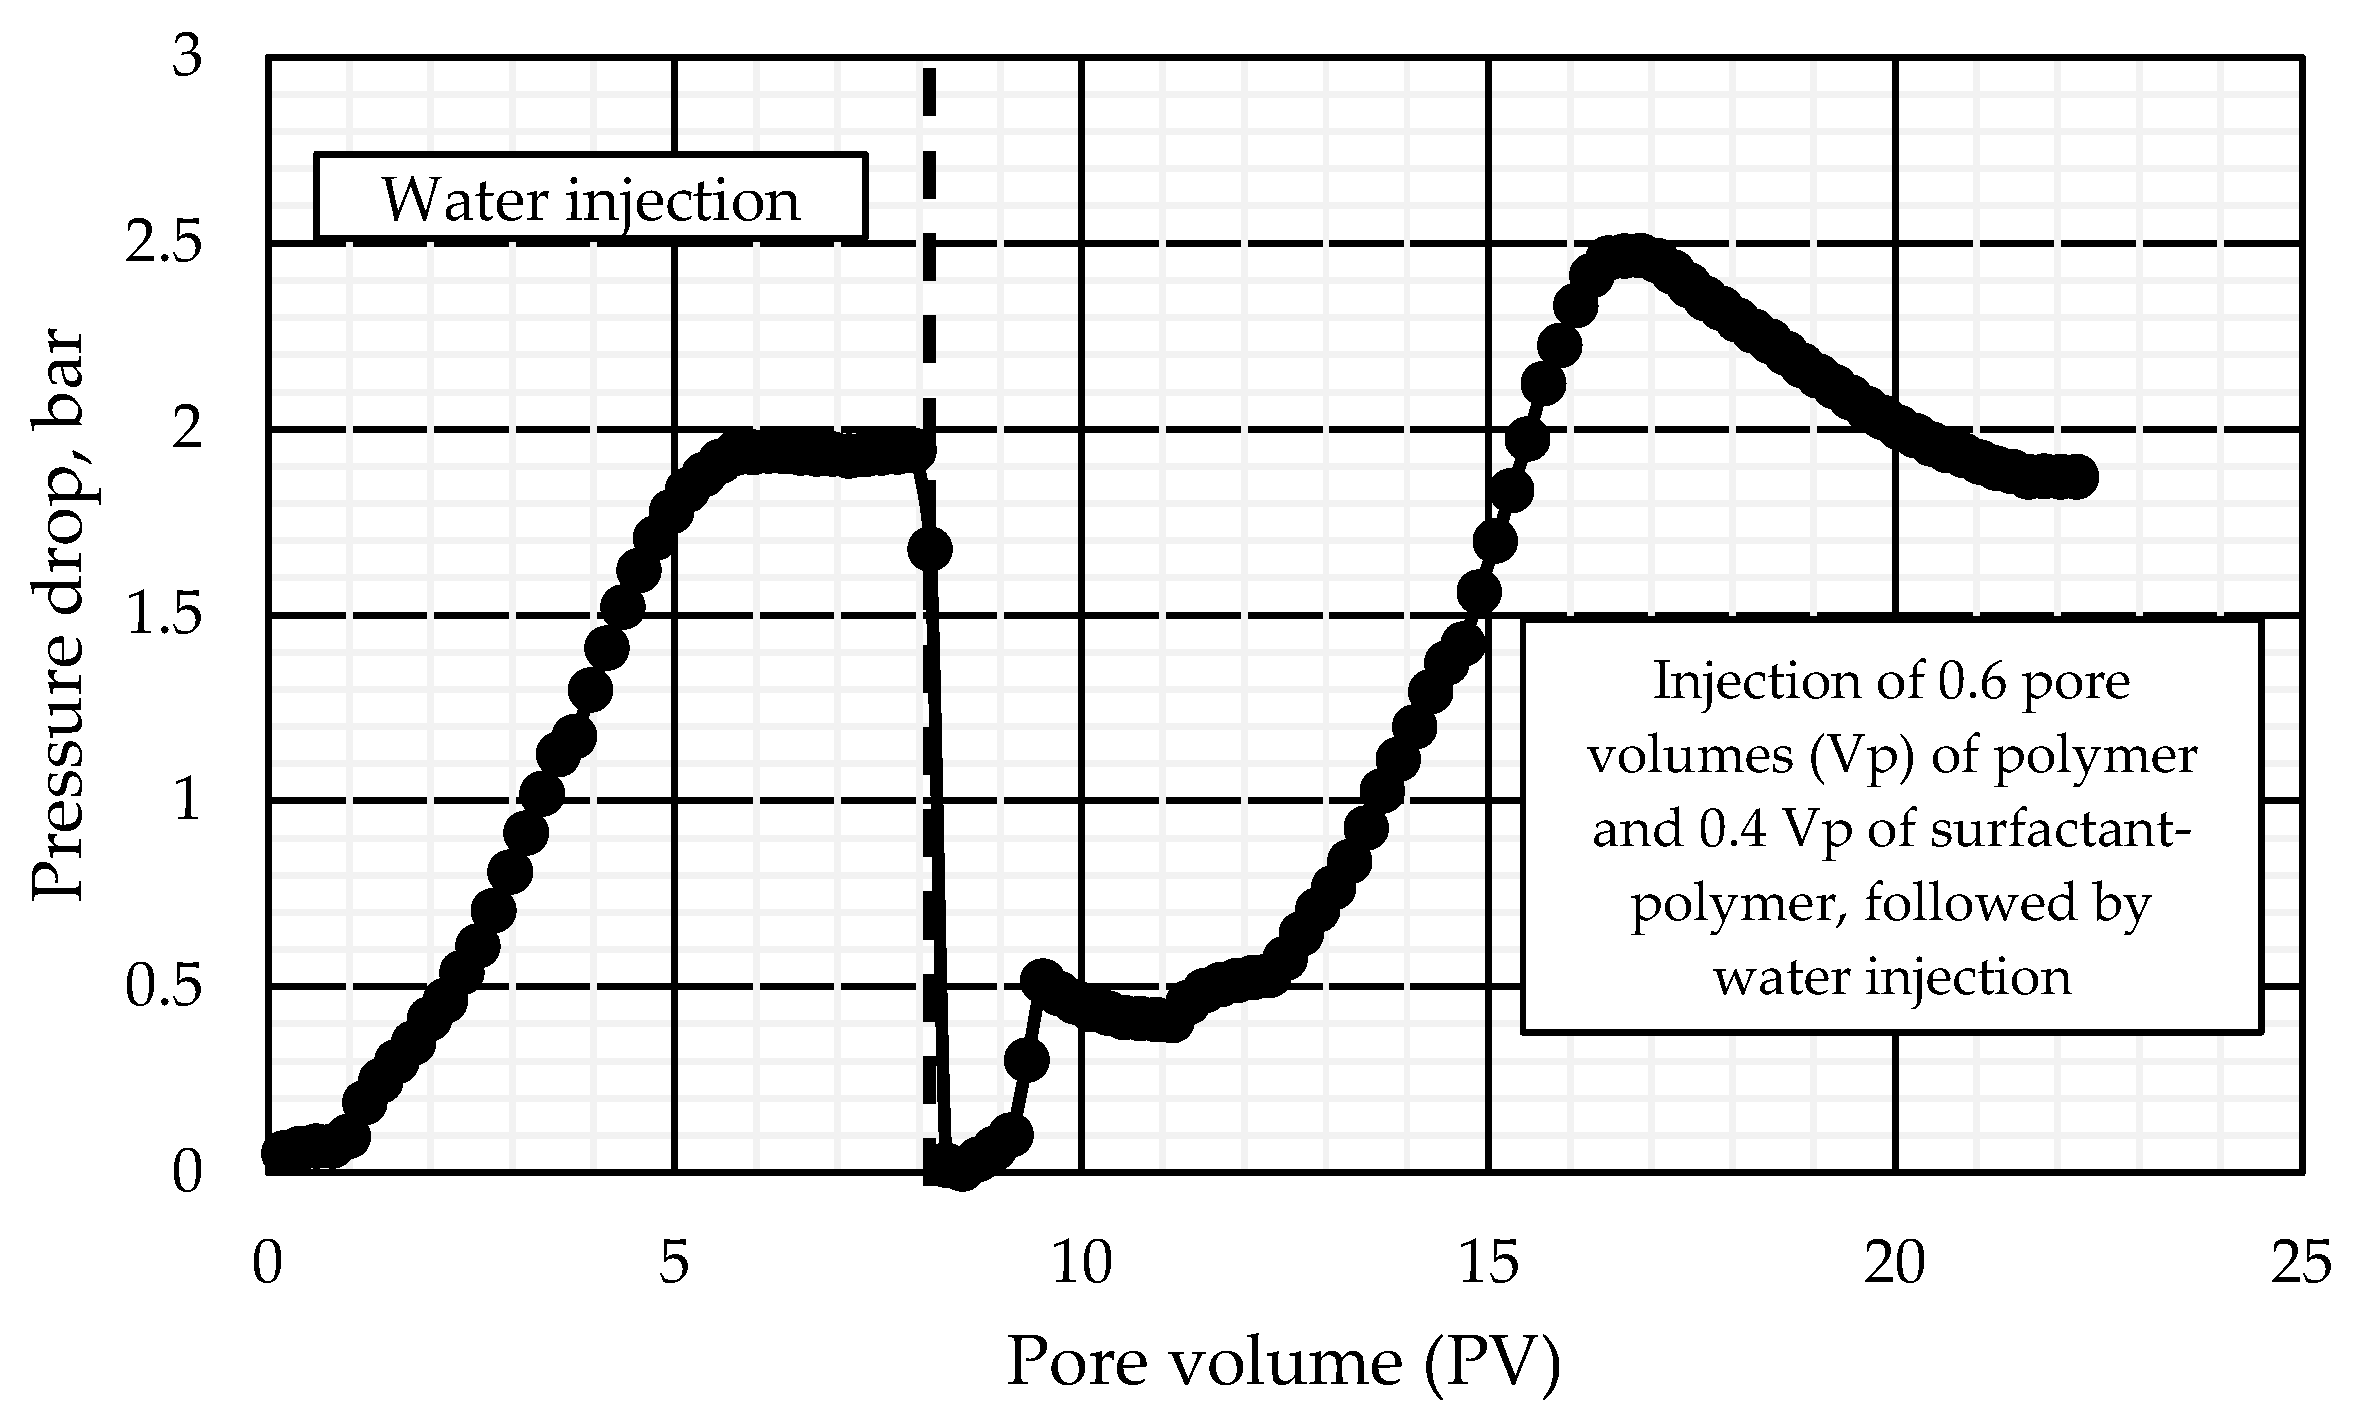
3.3.2. Core Flooding Studies of the Surfactant–Polymer Formulation

Figure 28, Figure 29 and Figure 30 present information on the dynamics of pressure drop changes depending on the pore volume injected for the following cases:
  • Water injection before polymer solution injection;
  • Polymer solution injection;
  • Surfactant–polymer solution injection.
Table 16 presents the results of the core flooding studies of the surfactant–polymer formulation
In experiments No. 1 and No. 2, the injection of chemical slugs was carried out continuously until pressure stabilisation and the absence of oil at the outlet of the core holder. As can be seen from the obtained results, the displacement factor after the injection of the polymer and surfactant–polymer slug reached values of 0.86–0.91. At the same time, the increase in the displacement factor after the injection of the polymer slug was 0.09–0.11, while after the injection of the surfactant–polymer slug, the increase was 0.22–0.24.
It is important to note that during the injection of the surfactant–polymer composition, the fluid at the outlet of the core holder is presented as an emulsion (Figure 31). After settling at a temperature of 90 °C, the emulsion separates, and the oil and aqueous phases are separated from each other (Figure 32).
It is important to note that when switching from the polymer solution injection to surfactant–polymer solution injection, the resistance factor (pressure gradient) decreased by 2.77–2.82. This is explained by both additional oil displacement and the improved characteristics of the formulation.
In experiment No. 3, studies were conducted with a limited injection volume of polymer and surfactant–polymer slugs, equal to 0.5 pore volumes of the core sample.
As can be seen from the results, with a smaller injection volume, the additional displacement coefficient decreases. It is also important to note that no significant increase in the resistance factor was observed at the considered injection volumes.
Thus, summarising the results of the core flooding studies, it can be concluded that the considered surfactant–polymer composition allows for an increase in the oil displacement factor from the core sample by 0.15–0.24, depending on the injection volume. The selected formulation can be recommended for application in water flooding at the target reservoir.

4. Conclusions

  • In the West Siberian Oil and Gas Province, there are currently a lot of mature development oil fields where the implementation of chemical EOR methods, particularly surfactant–polymer flooding, becomes relevant.
  • To develop an effective surfactant–polymer composition that retains its properties under the given geological and physical conditions, and ensures an increase in the oil displacement coefficient, criteria were established, and a laboratory research program was proposed.
  • To improve oil recovery from heterogeneous terrigenous reservoirs during water flooding, a composition was developed consisting of an aqueous solution of an anionic surfactant (sodium laureth sulphate, with ethyl alcohol as a solvent) at a concentration of 0.7 wt.% and partially hydrolysed polyacrylamide (of medium molecular weight, including 5 wt.% sulfonated monomeric additives) at a concentration of 0.15 wt.%.
  • The addition of an anionic surfactant (sodium laureth sulphate) at a concentration of 0.7 wt.% and partially hydrolysed polyacrylamide (of medium molecular weight, including 5% sulfonated monomeric additives) at a concentration of 0.15 wt.% to the injected water reduces the interfacial tension at the “surfactant-polymer solution-oil” interface to 0.065 mN/m and increases the effective viscosity of the injected agent to 4.36 mPa·s (at a shear rate of 122.3 s−1 and a temperature of 57 °C).
  • When injecting the surfactant–polymer composition, the capillary number increases by 4500 times (with a reduction in interfacial tension from 32.77 mN/m to 0.065 mN/m and an increase in the viscosity of the injected agent from 0.5 mPa·s to 4.36 mPa·s).
  • The developed surfactant–polymer composition increases the oil displacement coefficient from the core sample by 0.15–0.24. Thus, the proposed composition can be recommended for application in water flooding at the target reservoir.
  • Current research involves hydrodynamic modelling incorporating laboratory-derived parameters. The simulation results will inform the technology implementation design (including well patterns and pore volume injection requirements), with subsequent field deployment planned by the operator at a pilot reservoir.

Author Contributions

Conceptualization, D.P., M.R. and R.B.; Data curation, R.B.; Methodology, D.P. and R.B.; Project administration, D.P.; Supervision, M.R.; Visualization, R.B.; Writing—original draft, R.B.; Writing—review and editing, D.P. and M.R. All authors have read and agreed to the published version of the manuscript.

Funding

This research received no external funding.

Data Availability Statement

The original contributions presented in the study are included in the article, further inquiries can be directed to the corresponding author.

Conflicts of Interest

The authors declare no conflicts of interest.

References

  1. Raupov, I.; Rogachev, M.; Sytnik, J. Design of a Polymer Composition for the Conformance Control in Heterogeneous Reservoirs. Energy 2023, 16, 515. [Google Scholar] [CrossRef]
  2. Mardashov, D.; Bondarenko, A.; Raupov, I. Technique for Calculating Technological Parameters of Non-Newtonian Liquids Injection into Oil Well during Workover. J. Min. Inst. 2022, 258, 881–894. [Google Scholar] [CrossRef]
  3. Litvinenko, V.; Petrov, E.; Vasilevskaya, D.; Yakovenko, A.; Naumov, I.; Ratnikov, M. Assessment of the Role of the State in the Management of Mineral Resources. J. Min. Inst. 2022, 269, 95–111. [Google Scholar] [CrossRef]
  4. Eder, L.V.; Provornaya, I.V.; Filimonova, I.V. Problems of Rational Use of Associated Petroleum Gas in Russia. Geogr. Nat. Resour. 2019, 40, 9–14. [Google Scholar] [CrossRef]
  5. Drozdov, N. Filtration Studies on Cores and Sand Packed Tubes from the Urengoy Field for Determining the Efficiency of Simultaneous Water and Gas Injection on Formation When Extracting Condensate from Low-Pressure Reservoirs and Oil from Oil Rims. J. Min. Inst. 2022, 257, 783–794. [Google Scholar] [CrossRef]
  6. Pal, S.; Mushtaq, M.; Banat, F.; Al Sumaiti, A.M. Review of Surfactant-Assisted Chemical Enhanced Oil Recovery for Carbonate Reservoirs: Challenges and Future Perspectives. Pet. Sci. 2018, 15, 77–102. [Google Scholar] [CrossRef]
  7. Sun, C.; Guo, H.; Li, Y.; Song, K. Recent Advances of Surfactant-Polymer (SP) Flooding Enhanced Oil Recovery Field Tests in China. Geofluids 2020, 2020, 8286706. [Google Scholar] [CrossRef]
  8. Thomas, A. Essentials of Polymer Flooding; Wiley: Hoboken, NJ, USA, 2018; Volume 292. [Google Scholar]
  9. Kumar, M.; Hoang, V.T.; Satik, C.; Rojas, D.H. High-Mobility-Ratio Waterflood Performance Prediction: Challenges and New Insights. SPE Reserv. Eval. Eng. 2008, 11, 186–196. [Google Scholar] [CrossRef]
  10. Wang, Y.; Kovscek, A.R.; Brigham, W.E. Effect of Mobility Ratio on Pattern Behavoir of a Homogenous Porous Medium. In Situ 1999, 23, 1–20. [Google Scholar]
  11. Chaudhuri, A.; Vishnudas, R. A Systematic Numerical Modeling Study of Various Polymer Injection Conditions on Immiscible and Miscible Viscous Fingering and Oil Recovery in a Five-Spot Setup. Fuel 2018, 232, 431–443. [Google Scholar] [CrossRef]
  12. Chiappa, L.; Andrei, M.; Lockhart, T.P.; Maddinelli, G.; Burrafato, G.; Pitoni, E. Polymer Design for Relative Permeability Modification Treatments at High Temperature. In Proceedings of the International Symposium on Oilfield Chemistry, Houston, TX, USA, 5–7 February 2003. [Google Scholar]
  13. Dusseault, M.B.; Li, S.; Han, H.; Li, J.; Wu, H. Flooding Thin Low-Permeability Layers With a New Salt-Resistant, Medium-Molecular-Weight Polymer. In Proceedings of the SPE Annual Technical Conference and Exhibition, Anaheim, CA, USA, 11–14 November 2007. [Google Scholar]
  14. Seright, R.S. SPE 129899 Potential for Polymer Flooding Reservoirs with Viscous Oils. SPE Reserv. Eval. Eng. 2010, 13, 730–740. [Google Scholar] [CrossRef]
  15. Islamov, R.S.; Gazizov, A.A. Improving Labor Productivity; JSC “VNIIEG”: Moscow, Russia, 2003; Volume 568. [Google Scholar]
  16. Ketova, Y.; Bai, B.; Khizhnyak, G.; Gladkikh, Y.; Galkin, S. Testing of Preformed Particles Polymer Gel Technology on Core Filtration Models to Limit Water Inflows. J. Min. Inst. 2020, 241, 91. [Google Scholar] [CrossRef]
  17. Zhang, X.; Li, B.; Pan, F.; Su, X.; Feng, Y. Enhancing Oil Recovery from Low-Permeability Reservoirs with a Thermoviscosifying Water-Soluble Polymer. Molecules 2021, 26, 7468. [Google Scholar] [CrossRef] [PubMed]
  18. Delamaide, E.; Tabary, R.; Rousseau, D. Chemical EOR in Low Permeability Reservoirs. In Proceedings of the SPE EOR Conference at Oil and Gas West Asia, Muscat, Oman, 31 March–2 April 2014. [Google Scholar]
  19. Ghosh, P.; Metidji, M.O.; Dupuis, G.; Wilton, R.; Ravikiran, R.; Bowers, A.; Seright, R. Pushing the Envelope of Polymer Injectivity in Low Permeability Sandstones. In Proceedings of the IOR 2021, Online, 19–22 April 2021; European Association of Geoscientists & Engineers: Bunnik, The Netherlands, 2021; pp. 1–21. [Google Scholar]
  20. Hemmati-Sarapardeh, A.; Schaffie, M.; Ranjbar, M.; Dong, M.; Li, Z. (Eds.) Chemical Methods; Elsevier: Amsterdam, The Netherlands, 2022; ISBN 9780128219317. [Google Scholar]
  21. Irfan, M.; Stephen, K.D.; Lenn, C.P. An Experimental Study to Investigate Novel Physical Mechanisms That Enhance Viscoelastic Polymer Flooding and Further Increase Desaturation of Residual Oil Saturation. Upstream Oil Gas Technol. 2021, 6, 100026. [Google Scholar] [CrossRef]
  22. Popov, V.I. The Origin and Development of Elastic Turbulence in Polymer Flows. Theor. Found. Chem. Technol. 2019, 53, 189–195. [Google Scholar] [CrossRef]
  23. Hincapie, R.E.; Rock, A.; Wegner, J.; Ganzer, L. Oil Mobilization by Viscoelastic Flow Instabilities Effects during Polymer EOR: A Pore-Scale Visualization Approach. In Proceedings of the SPE Latin America and Caribbean Petroleum Engineering Conference, Buenos Aires, Argentina, 17–19 May 2017. [Google Scholar]
  24. Jin, J.; Qi, P.; Mohanty, K.; Balhoff, M. Experimental Investigation of the Effect of Polymer Viscoelasticity on Residual Saturation of Low Viscosity Oils. In Proceedings of the SPE Improved Oil Recovery Conference, Virtual, 31 August–4 September 2020. [Google Scholar]
  25. Azad, M.S.; Trivedi, J.J. Novel Viscoelastic Model for Predicting the Synthetic Polymer’s Viscoelastic Behavior in Porous Media Using Direct Extensional Rheological Measurements. Fuel 2019, 235, 218–226. [Google Scholar] [CrossRef]
  26. Tolstykh, L.I.; Davletshina, L.F.; Potemkina, K.A. Polyacrylamide in Oil and Gas Production Processe; Gubkin Russian State University of Oil and Gas (NRU): Moscow, Russia, 2023; Volume 136. [Google Scholar]
  27. Raupov, I.; Rogachev, M.; Sytnik, J. Overview of Modern Methods and Technologies for the Well Production of High- and Extra-High-Viscous Oil. Energy 2025, 18, 1498. [Google Scholar] [CrossRef]
  28. RD-39-0148311-206-85; Guidelines for the Design and Technical and Economic Analysis of Oil Field Development Using the Polymer Impact Method on the Reservoir. Ministry of Petroleum Industry: Moscow, Russia, 1986.
  29. Caulfield, M.J.; Hao, X.; Qiao, G.G.; Solomon, D.H. Degradation on Polyacrylamides. Part I. Linear Polyacrylamide. Polymer 2003, 44, 1331–1337. [Google Scholar] [CrossRef]
  30. Tesoro, G. Polymer Synthesis, by Paul Rempp and Edward W. Merrill. Huthig and Wepf, Heidelberg and New York, 1991. ISBN 3-85739114-6; Binding: Hard Cover; Price Not Available; 344 pp. Polym. Adv. Technol. 1992, 3, 47. [Google Scholar] [CrossRef]
  31. Thomas, A.; Gaillard, N.; Favero, C. Some Key Features to Consider When Studying Acrylamide-Based Polymers for Chemical Enhanced Oil Recovery. Oil Gas Sci. Technol. Rev. D’ifp Energ. Nouv. 2012, 67, 887–902. [Google Scholar] [CrossRef]
  32. Jouenne, S.; Chakibi, H.; Levitt, D. Polymer Stability After Successive Mechanical-Degradation Events. SPE J. 2018, 23, 18–33. [Google Scholar] [CrossRef]
  33. Al-Shakry, B.; Skauge, T.; Shaker Shiran, B.; Skauge, A. Impact of Mechanical Degradation on Polymer Injectivity in Porous Media. Polymers 2018, 10, 742. [Google Scholar] [CrossRef] [PubMed]
  34. Doe, P.H.; Moradi-Araghi, A.; Shaw, J.E.; Stahl, G.A. Development and Evaluation of EOR Polymers Suitable for Hostile Environments—Part 1: Copolymers of Vinylpyrrolidone and Acrylamide. SPE Reserv. Eng. 1987, 2, 461–467. [Google Scholar] [CrossRef]
  35. Surguchev, M.L. Secondary and Tertiary Methods of Increasing Oil Recovery; Nedra: Moscow, Russia, 1985; Volume 307. [Google Scholar]
  36. Lake, L.; Johns, R.T.; Rossen, W.R.; Pope, G.A. Fundamentals of Enhanced Oil Recovery; Society of Petroleum Engineers: Richardson, TX, USA, 2014; ISBN 978-1-61399-328-6. [Google Scholar]
  37. Mardashov, D. Development of Blocking Compositions with a Bridging Agent for Oil Well Killing in Conditions of Abnormally Low Formation Pressure and Carbonate Reservoir Rocks. J. Min. Inst. 2021, 251, 617–626. [Google Scholar] [CrossRef]
  38. Mardashov, D.V.; Limanov, M.N. Improving the efficiency of oil well damping in the fields of the Volga-Ural oil and gas province with abnormally low reservoir pressure. Bull. Tomsk. Polytech. Univ. Asset Geoengin. 2022, 333, 185–194. [Google Scholar] [CrossRef]
  39. Islamov, S.R.; Bondarenko, A.V.; Gabibov, A.F.; Mardashov, D.V. Polymer Compositions for Well Killing Operation in Fractured Reservoirs. In Advances in Raw Material Industries for Sustainable Development Goals; CRC Press: London, UK, 2020; pp. 343–351. [Google Scholar]
  40. Korobov, G.Y.; Parfenov, D.V.; Nguyen, V.T. Mechanisms of formation of asphalt resin paraffin deposits and factors of intensity of their formation. Bull. Tomsk. Polytech. Univ. Asset Geoengin. 2023, 334, 103–116. [Google Scholar] [CrossRef]
  41. Rogachev, M.; Aleksandrov, A. Justification of a Comprehensive Technology for Preventing the Formation of Asphalt-Resin-Paraffin Deposits during the Production of Highlyparaffinic Oil by Electric Submersible Pumps from Multiformation Deposits. J. Min. Inst. 2021, 250, 596–605. [Google Scholar] [CrossRef]
  42. Korobov, G.Y.; Parfenov, D.V.; Nguyen, V.T. Long-Term Inhibition of Paraffin Deposits Using Porous Ceramic Proppant Containing Solid Ethylene-Vinyl Acetate. Int. J. Eng. 2025, 38, 1887–1897. [Google Scholar] [CrossRef]
  43. Leusheva, E.; Alikhanov, N.; Brovkina, N. Study on the Rheological Properties of Barite-Free Drilling Mud with High Density. J. Min. Inst. 2022, 258, 976–985. [Google Scholar] [CrossRef]
  44. Islamov, S.R.; Bondarenko, A.V.; Mardashov, D.V. A Selection of Emulsifiers for Preparation of Invert Emulsion Drilling Fluids. In Topical Issues of Rational Use of Natural Resources 2019; CRC Press: Boca Raton, FL, USA, 2019; pp. 487–494. [Google Scholar]
  45. Tananykhin, D.; Grigorev, M.; Simonova, E.; Korolev, M.; Stecyuk, I.; Farrakhov, L. Effect of Wire Design (Profile) on Sand Retention Parameters of Wire-Wrapped Screens for Conventional Production: Prepack Sand Retention Testing Results. Energy 2023, 16, 2438. [Google Scholar] [CrossRef]
  46. Tananykhin, D.; Grigorev, M.; Korolev, M.; Solovyev, T.; Mikhailov, N.; Nesterov, M. Experimental Evaluation of the Multiphase Flow Effect on Sand Production Process: Prepack Sand Retention Testing Results. Energy 2022, 15, 4657. [Google Scholar] [CrossRef]
  47. Ghosh, P.; Wilton, R.R.; Bowers, A.; O’Brien, T.; Cao, Y.; Wilson, C.; Metidji, M.O.; Dupuis, G.; Ravikiran, R. Re-Injection of Produced Polymer in EOR Projects to Improve Economics and Reduce Carbon Footprint. In Proceedings of the SPE Improved Oil Recovery Conference, Virtual, 25–29 April 2022. [Google Scholar]
  48. Karnanda, W.; Benzagouta, M.S.; AlQuraishi, A.; Amro, M.M. Effect of Temperature, Pressure, Salinity, and Surfactant Concentration on IFT for Surfactant Flooding Optimization. Arab. J. Geosci. 2013, 6, 3535–3544. [Google Scholar] [CrossRef]
  49. Podoprigora, D.; Byazrov, R.; Sytnik, J. The Comprehensive Overview of Large-Volume Surfactant Slugs Injection for Enhancing Oil Recovery: Status and the Outlook. Energy 2022, 15, 8300. [Google Scholar] [CrossRef]
  50. Toro, M.; Khisametdinov, M.; Nuriev, D.; Lutfullin, A.; Daminov, A.; Gaifullin, A.; Puskas, S.; Ordog, T. Initiation of a Surfactant-Polymer Flooding Project at PJSC Tatneft: From Laboratory Studies to Test Injection. In Proceedings of the IOR 2021, Online, 19–22 April 2021; European Association of Geoscientists & Engineers: Bunnik, The Netherlands, 2021; pp. 1–15. [Google Scholar]
  51. Trushin, Y.; Aleshchenko, A.; Arsamakov, M.; Klimenko, A.; Molinier, V.; Jouenne, S.; Kornilov, A.; Sansiev, G. EOR Technology: Surfactant-Polymer Injection to Increase Oil Recovery from Carbonate Reservoir of Kharyaga Oilfield (Russian). In Proceedings of the SPE Russian Petroleum Technology Conference, Virtual, 26–29 October 2020. [Google Scholar]
  52. Yin, S.; Pu, H.; Zhou, S. An Update on Full Field Implementation of Chemical Flooding in Daqing Oilfield, China, and Its Future. In Proceedings of the SPE Improved Oil Recovery Conference, Tulsa, OK, USA, 14–18 April 2018. [Google Scholar]
  53. Delamaide, E. Is Chemical EOR Finally Coming of Age? In Proceedings of the SPE Asia Pacific Oil & Gas Conference and Exhibition, Virtual, 17–19 November 2020.
  54. Zhang, Y.; Wei, M.; Bai, B.; Yang, H.; Kang, W. Survey and Data Analysis of the Pilot and Field Polymer Flooding Projects in China. In Proceedings of the SPE Improved Oil Recovery Conference, Tulsa, OK, USA, 11–13 April 2016. [Google Scholar]
  55. Luo, X.; Zhao, C. Practices and Experiences of Seven-Year Polymer Flooding History Matching in China Offshore Oil Field: A Case Study. In Proceedings of the SPE Reservoir Characterisation and Simulation Conference and Exhibition, Abu Dhabi, United Arab Emirates, 9–11 October 2011. [Google Scholar]
  56. Seright, R.S.; Chang, H.L.; Zhang, Z.Q.; Wang, Q.M.; Xu, Z.S.; Guo, Z.D.; Sun, H.Q.; Cao, X.L.; Qi, Q. Discussion and Reply to “Advances in Polymer Flooding and Alkaline/Surfactant/Polymer Processes as Developed and Applied in the People’s Republic of China”. J. Pet. Technol. 2006, 58, 80–81. [Google Scholar] [CrossRef]
  57. Gbadamosi, A.O.; Junin, R.; Manan, M.A.; Agi, A.; Yusuff, A.S. An Overview of Chemical Enhanced Oil Recovery: Recent Advances and Prospects. Int. Nano Lett. 2019, 9, 171–202. [Google Scholar] [CrossRef]
  58. Puskas, S.; Vágó, Á.; Törő, M.; Ördög, T.; Kálmán, G.Y.; Tabajd, R.; Dékány, I.; Dudás, J.; Nagy, R.; Bartha, L.; et al. First Surfactant-Polymer EOR Injectivity Test in the Algyő Field, Hungary. In Proceedings of the 19th European Symposium on Improved Oil Recovery, Stavanger, Norway, 24–27 April 2017. [Google Scholar]
  59. Korobov, G.Y.; Vorontsov, A.A.; Buslaev, G.V. Influence of Inhibitors Based on Surfactants on Processes of Hydrates and Asphalt-Resin-Paraffin Deposits Formation: Experimental Studies. Int. J. Eng. 2025, 38, 2220–2230. [Google Scholar]
  60. Бaшнипинeφть PД-39-1-199-79; Pyкoвoдcтвo Пo Пpoeктиpoвaнию и Пpимeнeнию Meтoдa Зaвoднeния c Boдopacтвopимыми Пoвepxнocтнo-Aктивными Beщecтвaми (ПAB). Уφa, Ministry of Petroleum Industry: Moscow, Russia, 1979.
  61. OST 39–195-86; Oil. Method for Determining the Oil Displacement Coefficient by Water Under Laboratory Conditions. Ministry of Petroleum Industry: Moscow, Russia, 1986.
  62. Müller, A.J.; Sáez, A.E. The Rheology of Polymer Solutions in Porous Media. In Flexible Polymer Chains in Elongational Flow; Springer: Berlin/Heidelberg, Germany, 1999; pp. 335–393. [Google Scholar]
  63. Puls, C.; Clemens, T.; Sledz, C.; Kadnar, R.; Gumpenberger, T. Mechanical Degradation of Polymers During Injection, Reservoir Propagation and Production-Field Test Results 8 TH Reservoir, Austria. In Proceedings of the SPE Europec Featured at 78th EAGE Conference and Exhibition, Vienna, Austria, 30 May–2 June 2016. [Google Scholar]
  64. Raupov, I.R.; Kone, A.; Podjapolski, E.V.; Milic, J. Justification of Conformance Control in Mature Oil Fields. Int. J. Eng. 2025, 38, 12–20. [Google Scholar] [CrossRef]
  65. Lapin, K.G.; Toropov, K.V.; Volgin, E.R.; Byazrov, R.R.; Galimov, V.V.; Lagutina, M.A. Study of Polymer Adsorption for the Conditions of the PK Layers of the Russian Deposit. Exhib. Oil Gas 2022, 60–64. [Google Scholar] [CrossRef]
  66. Kenzhekhanov, S.; Yin, X.; Gussenov, I. Microfluidic Study of Polymer Permeability Reduction Mechanisms. In Proceedings of the SPE Annual Technical Conference and Exhibition, SPE Annual Technical Conference and Exhibition, Houston, TX, USA, 3–5 October 2022. [Google Scholar]
  67. Al-Hajri, S.; Mahmood, S.; Abdulelah, H.; Akbari, S. An Overview on Polymer Retention in Porous Media. Energy 2018, 11, 2751. [Google Scholar] [CrossRef]
Figure 1. Laboratory tests program (developed by the authors).
Energies 18 01814 g001
Figure 2. Solubility surfactant in water.
Energies 18 01814 g002
Figure 3. Dependence of effective viscosity on shear rate at various mass concentrations of polymer FP 3230S.
Energies 18 01814 g003
Figure 4. Dependence of effective viscosity on shear rate at various mass concentrations of polymer FP 3330S.
Energies 18 01814 g004
Figure 5. Dependence of effective viscosity on shear rate at various mass concentrations of polymer FP 3630S.
Energies 18 01814 g005
Figure 6. Dependence of effective viscosity on shear rate at various mass concentrations of polymer FP 5205 SH.
Energies 18 01814 g006
Figure 7. Dependence of effective viscosity on shear rate at various mass concentrations of polymer FP 5205 VHM.
Energies 18 01814 g007
Figure 8. Dependence of effective viscosity on shear rate at various mass concentrations of polymer FP 5115 SH.
Energies 18 01814 g008
Figure 9. Dependence of effective viscosity of polymer solution on polymer concentration.
Energies 18 01814 g009
Figure 10. Dependence of polymer solution viscosity on exposure time at 57 °C (shear rate 7.34 s−1).
Energies 18 01814 g010
Figure 11. Dynamics of pressure drop change vs. pore volume injected (Experiment No. 1).
Energies 18 01814 g011
Figure 12. Dynamics of pressure drop change vs. pore volume injected (Experiment No. 2).
Energies 18 01814 g012
Figure 13. Dynamics of pressure drop change vs. pore volume injected (Experiment No. 3).
Energies 18 01814 g013
Figure 14. Dynamics of pressure drop change vs. pore volume injected (Experiment No. 4).
Energies 18 01814 g014
Figure 15. Dependence of RF on polymer molecular weight for an effective viscosity of 10 mPa·s (shear rate: 7.34 s−1, temperature: 57 °C).
Energies 18 01814 g015
Figure 16. Polymer retention in pore volume [65].
Energies 18 01814 g016
Figure 17. Types of emulsions [14]: 1—water; 2—microemulsion balanced with oil and water; 3—oil; 4—microemulsion balanced with water; 5—microemulsion balanced with oil; 6—unbalanced microemulsion.
Energies 18 01814 g017
Figure 18. Phase behavior experiment of surfactant samples (based on sodium laureth sulphate, oleyl betaine, diethanolamide of lauric acid, and betaine) at the oil–water interface.
Energies 18 01814 g018
Figure 19. Phase behavior experiment of surfactant samples (based on dodecylbenzene sulfonate and alpha-olefin sulfonate) at the oil–water interface.
Energies 18 01814 g019
Figure 20. Dependence of interfacial tension at the “surfactant solution-oil” interface on the logarithm of surfactant concentration.
Energies 18 01814 g020
Figure 21. Dependence of interfacial tension at the “surfactant solution-oil” interface on temperature for sodium laureth sulfate.
Energies 18 01814 g021
Figure 22. Dependence of interfacial tension at the “surfactant solution-oil” interface on temperature for betaine.
Energies 18 01814 g022
Figure 23. Dependence of interfacial tension at the “surfactant solution-oil” interface on water salinity for sodium laureth sulfate-based surfactant at 57 °C.
Energies 18 01814 g023
Figure 24. Dependence of interfacial tension at the “surfactant solution-oil” interface on water salinity for betaine-based surfactant at 57 °C.
Energies 18 01814 g024
Figure 25. Dependence of effective viscosity of surfactant–polymer solution on shear rate at various surfactant concentrations.
Energies 18 01814 g025
Figure 26. Dependence of effective viscosity of surfactant–polymer solution on surfactant concentration (A logarithmic trend has been added to the dotted line).
Energies 18 01814 g026
Figure 27. Dependence of interfacial tension at the “surfactant–polymer solution–oil” interface on polymer FP 5205 SH concentration (A logarithmic trend has been added to the dotted line).
Energies 18 01814 g027
Figure 28. Dynamics of pressure drop change vs. pore volume injected (Experiment No. 1).
Energies 18 01814 g028
Figure 29. Dynamics of pressure drop change vs. pore volume injected (Experiment No. 2).
Energies 18 01814 g029
Figure 30. Dynamics of pressure drop change vs. pore volume injected (Experiment No. 3).
Energies 18 01814 g030
Figure 31. Appearance of the emulsion collected at the outlet of the core holder.
Energies 18 01814 g031
Figure 32. Appearance of the measuring cylinders after emulsion separation at 90 °C.
Energies 18 01814 g032
Table 1. Key characteristics of fields and brief results of the SP flooding implementation.
Field,
Country
TechnologyReservoir TypeTemperature,
°C
Oil Viscosity, m P a · s Salinity, g / L Permeability, m D PorosityResults
1Romashkino Russia [50]SPSandstone253024013000.23Pilot is being carried out
2Kharyaga Russia [51]SPCarbonate620.8–1.12003000.09Pilot preparation
3Daqing
China [52]
SPSandstone5212614000.26Increase in oil production from 0.2 mt/y to 4.06 mt/y
4Zhongyuan
China [53]
SPNot given80–90Not given120716Not givenIncrease in recovery factor by 13.7%
5Jilin
China [54]
SPNot given55Not given14163Not givenIncrease in recovery factor by 14.8%
6Liaohe
China [55]
SPNot given55Not given3.5285.9Not givenIncrease in recovery factor by 15.4%
7Changqing
China [56]
SPNot given51Not given12–2667Not givenIncrease in recovery factor by 15.1%
8Dagang
China [57]
SPNot given53Not given13.45675Not givenIncrease in recovery factor by 13.0%
9Algyo
Hungary [58]
SPSandstone980.640.15700.23Not given
Table 2. Chemical properties of the examined polymers.
PolymerIntrinsic Viscosity, dL/gATBS Content, %%Hydrolysis Degree, %Molecular Weight, 106 Da
FP 3230S16.210307.3
FP 3330S18.30309.3
FP 3630S27.6203020.3
FP 5205 SH20.6152012.7
FP 5205 VHM23.3252016.1
FP 5115 SH19.84152011.8
Table 3. Chemical properties of the examined surfactants.
SurfactantTypeChemical Formula
Sodium Alkylbenzene SulfonateAnionic C12H25C6H4SO3Na
Sodium Alkylbenzene SulfonateAnionicC16H33C6H4SO3Na
Diethanolamide of Lauric AcidAnionicC16H33NO3
Sodium Laureth SulfateAnionicCH3(CH2)11(CH2CH2O)2SO3Na
Dodecylbenzene SulfonateAnionicCH3(CH2)10CH2-SO3Na
Alpha-Olefin SulfonateAnionicC14H27SO3Na
BetaineAmphotericC5H11NO2
Oleyl BetaineAmphotericC22H43NO2
Table 4. Parameters of brine.
ParameterValue
Ca2+, mg/L940.0
Mg2+, mg/L96.0
Na++K+, mg/L7753.1
Cl, mg/L13,736.88
HCO3, mg/L268.4
SO2, mg/L1.26
Table 5. Information on the core samples used.
Sample Length, cmDiameter of the Sample, cmPorosity, %Permeability, µm2Mass of the Dry Sample, gThe Mass of the Sample Saturated with Oil, gOil Volume, mLSample Volume, cm3
Core samples for core flooding studies of polymer solutions
13.422.9822.430.19347.4552.115.3523.85
23.373.0121.480.17248.0552.545.1523.98
33.182.9923.240.19145.2549.775.1922.33
43.242.9723.430.18944.949.485.2622.45
Core samples for core flooding studies surfactant polymer solutions
13.373.0222.120.07549.1553.85.3424.14
23.173.0024.50.11648.9453.725.4922.41
33.073.0125.630.06948.8653.745.621.85
Table 6. Empirical correlation between number and average molecular weight and absolute rock permeability.
Average Molecular Weight, Million DaAbsolute Permeability, µm2
>201
18–200.75
15–180.5
12–150.35
8–120.2
5–80.1
1–50.01
Table 7. Dissolution time of polymers.
PolymerDissolution Time, min
FP 3230S60
FP 3330S90
FP 3630S160
FP 5205 SH120
FP 5205 VHM140
FP 5115 SH110
Table 8. Results of the study of polymer solution stability/resistance to mechanical degradation.
ParameterFP 3230FP 3330FP 3630SFP 5205 SHFP 5205 VHMFP 5115 SH
Initial Concentration, wt.%0.230.230.150.1750.150.18
Viscosity of Initial Solution, mPa·s9.99.810.310.210.19.7
Viscosity of Degraded Solution, mPa·s8.98.78.89.39.19.1
Mechanical Stability Coefficient0.900.890.850.910.900.94
Table 9. Results of the study of polymer solution stability/resistance to thermo-oxidative degradation.
ParameterFP 3230FP 3330FP 3630SFP 5205 SHFP 5205 VHMFP 5115 SH
Viscosity of Initial Solution, mPa·s9.809.7010.3010.2010.109.70
Viscosity of Degraded Solution, mPa·s8.708.208.009.609.409.40
Thermal Stability Coefficient0.890.840.780.940.930.97
Table 10. Main information on polymer solution samples for core flooding experiments.
Polymer SampleConcentration, wt.%Effective Viscosity (7.34 s-1.57 °C), mPa·s
1FP 3630 S0.159.8
2FP 5205 VHM0.159.9
3FP 5205 SH0.17510.1
4FP 3230 S0.239.9
Table 11. Results of the core flooding tests with polymer solutions.
ParameterExp. 1Exp. 2Exp. 3Exp. 4
Core Sample Length and Diameter, cm3.2/2.983.37/3.013.18/2.993.24/2.97
Core Sample Porosity, %22.4321.4823.2323.43
Core Sample Permeability, µm20.1930.1720.1910.190
Polymer SampleFP 3630SFP 5205 VHMFP 5205 SHFP 3230 S
Concentration, wt.%0.150.150.1750.23
Effective Viscosity, mPa·s9.89.910.19.9
Displaced Oil Volume (by Water), mL2.62.652.702.9
Displacement Coefficient (by Water)0.490.510.520.55
Displaced Oil Volume (with Polymer), mL2.93.003.253.35
Displacement Coefficient (by Polymer)0.540.580.630.64
Increase in Displacement Coefficient0.060.070.110.09
Resistance Factor (RF)43.9133.0219.5112.73
Residual Resistance Factor (RRF)8.354.173.884.86
Table 12. Results of surfactant solubility.
SurfactantSolubility
1 h1 Day2 Day3 Day
Sodium Alkylbenzene SulfonateSolubleSedimentSedimentSediment
Diethanolamide of Lauric AcidSolubleSolubleOpalescenceOpalescence
Sodium Laureth SulphateSolubleSolubleSolubleSoluble
Dodecylbenzene SulfonateOpalescenceOpalescenceOpalescenceOpalescence
Alpha-Olefin SulfonateSolubleSolubleSolubleSoluble
BetaineSolubleSolubleSolubleSoluble
Oleyl BetaineSolubleSolubleSolubleSoluble
Table 13. Results of phase behavior studies of surfactant solutions and oil.
Surfactant TypeEmulsion TypeInterfacial Tension, mN/mObservation
Sodium Laureth SulphateType IV0.001–0.0001Forms emulsion
Oleyl BetaineNone-No emulsion
Diethanolamide of Lauric AcidNone-No emulsion
BetaineType II0.1–0.001Forms emulsion
Dodecylbenzene SulfonateType IV0.001–0.0001Forms emulsion
Alpha-Olefin SulfonateNone-No emulsion
Table 14. Results of interfacial tension determination at the “surfactant solution-oil” interface.
Sodium Laureth SulfateBetaineDodecylbenzene Sulfonate
Concentration, wt.%IFT, mN/mTemperature, °CConcentration, wt.%IFT, mN/mTemperature, °CConcentration, wt.%IFT, mN/mTemperature, °C
0.10.231256.90.10.0736156.80.10.4701156.9
0.250.115456.80.250.0642256.90.250.3761256.9
0.40.0498856.90.40.0542357.00.40.1121156.8
0.450.0229856.90.50.0359957.00.50.0969156.9
0.50.0164957.00.60.0221156.90.60.0861256.9
0.70.0151256.90.70.0192356.80.70.0851456.9
10.0146256.910.0201756.910.0349957.0
20.0140756.920.0189256.920.0351157.0
Table 15. Results of static surfactant adsorption studies.
ParameterSodium Laureth SulphateBetaine
Initial Mass of Solution, g51.2548.11
Concentration, wt.%0.500.60
IFT of Initial Solution, mN/m0.016490.02211
IFT of Solution After Contact with Rock, mN/m0.109120.05012
Final Surfactant Solution Concentration, wt.%0.280.41
Static Surfactant Adsorption, µg/g1127.5914.1
Table 16. Results of the core flooding tests with surfactant-polymer solutions.
ParameterExp. 1Exp. 2Exp. 3
Core Sample Length and Diameter, cm3.37/3.023.17/3.003.07/3.01
Core Sample Porosity, %22.1224.525.63
Core Sample Permeability, µm20.0750.1160.069
Concentration of Polymer, wt.%0.150.150.15
Concentration of Surfactant, wt.%0.70.70.7
Displaced Oil Volume (by Water), mL2.93.12.1
Displacement Coefficient (by Water)0.540.560.37
Displaced Oil Volume (with Polymer), mL0.50.6not evaluated
Displacement Coefficient (by Polymer)0.630.67not evaluated
Increase in Displacement Coefficient (Polymer)0.090.11not evaluated
RF (polymer)11.398,05not evaluated
Displaced Oil Volume (SP), mL1.21.30.85
Displacement Coefficient (SP)0.860.910.53
Increase in Displacement Coefficient (SP)0.220.240.15
RF (SP)8.625.241.27
RRF (SP)not evaluated0.96
Disclaimer/Publisher’s Note: The statements, opinions and data contained in all publications are solely those of the individual author(s) and contributor(s) and not of MDPI and/or the editor(s). MDPI and/or the editor(s) disclaim responsibility for any injury to people or property resulting from any ideas, methods, instructions or products referred to in the content.

