
The Role of Alternate Oxic–Anoxic Cycles in Full-Scale Sludge Stabilization for Energy Savings


Abstract

1. Introduction
2. Materials and Methods
2.1. The Study Site
2.2. Experimental Tests
2.3. Model and Comparison in Homogeneous Conditions
- Modeling the stabilization kinetics;
- Defining homogeneous conditions and scenarios;
- Simulating performance under homogeneous conditions.
2.3.1. Modeling the Stabilization Kinetics
2.3.2. Definition of Homogeneous Conditions and Scenarios
2.3.3. The Performance Simulation Under Homogeneous Conditions
3. Results and Discussion
3.1. Plant Performance
3.2. Experimental Tests
3.3. Stabilization Kinetics and Comparison Parameters
3.4. Performance Simulations Under Homogeneous Conditions
4. Conclusions
Supplementary Materials
Author Contributions
Funding
Data Availability Statement
Acknowledgments
Conflicts of Interest
Abbreviations
| WWTP | Wastewater treatment plant |
| AC | Alternate cycles |
| DO | Dissolved Oxygen |
| ORP | Oxidation-reduction potential |
| VSS | Volatile suspended solids |
| TSS | Total suspended solids |
| PLC | Programmable logic controller |
| ARPA | Agency for Environmental Protection |
| BOD | biochemical oxygen demand |
| COD | total chemical oxygen demand |
| TN | Total nitrogen |
| P | Phosphorus |
References
- Morello, R.; Di Capua, F.; Esposito, G.; Pirozzi, F.; Fratino, U.; Spasiano, D. Sludge minimization in mainstream wastewater treatment: Mechanisms, strategies, technologies, and current development. J. Environ. Manag. 2022, 319, 115756. [Google Scholar] [CrossRef] [PubMed]
- Domini, M.; Bertanza, G.; Vahidzadeh, R.; Pedrazzani, R. Sewage sludge quality and management for circular economy opportunities in Lombardy. Appl. Sci. 2022, 12, 10391. [Google Scholar] [CrossRef]
- Eurostat. Sewage Sludge Production and Disposal. Available online: https://ec.europa.eu/eurostat/databrowser/view/ENV_WW_SPD__custom_863447/bookmark/table?lang=en&bookmarkId=5758a478-af17-400c-9e31-2c73b4cc6903 (accessed on 4 April 2024).
- ISPRA. Rapporto Rifiuti Speciali. Edizione 2024 [Report on Special Waste, 2024]; 2024 Rapporti 402/2024; Istituto Superiore per la Protezione e la Ricerca Ambientale: Rome, Italy, 2024; ISBN 978-88-448-1219-5.
- Bertanza, G.; Canato, M.; Laera, G. Towards energy self-sufficiency and integral material recovery in waste water treatment plants: Assessment of upgrading options. J. Clean. Prod. 2018, 170, 1206–1218. [Google Scholar] [CrossRef]
- Scrinzi, D.; Ferrentino, R.; Fiori, L.; Andreottola, G. Hydrothermal post-treatment of anaerobic digestate. In Anaerobic Digestate Management; IWA Publishing: London, UK, 2022; pp. 293–308. [Google Scholar] [CrossRef]
- Campo, G.; Cerutti, A.; Lastella, C.; Leo, A.; Panepinto, D.; Zanetti, M.; Ruffino, B. Production and destination of sewage sludge in the Piemonte region (Italy): The results of a survey for a future sustainable management. Int. J. Environ. Res. Public Health 2021, 18, 3556. [Google Scholar] [CrossRef]
- Collivignarelli, M.C.; Abbà, A.; Carnevale Miino, M.; Torretta, V. What advanced treatments can be used to minimize the production of sewage sludge in WWTPs? Appl. Sci. 2019, 9, 2650. [Google Scholar] [CrossRef]
- Kelessidis, A.; Stasinakis, A.S. Comparative study of the methods used for treatment and final disposal of sewage sludge in European countries. Waste Manag. 2012, 32, 1186–1195. [Google Scholar] [CrossRef]
- Foladori, P.; Andreottola, G.; Ziglio, G. Sludge Reduction Technologies in Wastewater Treatment Plants; IWA Publishing: London, UK, 2010; ISBN 9781843392781. [Google Scholar]
- Semblante, G.U.; Hai, F.I.; Ngo, H.H.; Guo, W.; You, S.J.; Price, W.E.; Nghiem, L.D. Sludge cycling between aerobic, anoxic and anaerobic regimes to reduce sludge production during wastewater treatment: Performance, mechanisms, and implications. Bioresour. Technol. 2014, 155, 395–409. [Google Scholar] [CrossRef]
- Pilli, S.; Bhunia, P.; Yan, S.; LeBlanc, R.J.; Tyagi, R.D.; Surampalli, R.Y. Ultrasonic pretreatment of sludge: A review. Ultrason. Sonochem. 2011, 18, 1–18. [Google Scholar] [CrossRef]
- Wang, Q.; Wei, W.; Gong, Y.; Yu, Q.; Li, Q.; Sun, J.; Yuan, Z. Technologies for reducing sludge production in wastewater treatment plants: State of the art. Sci. Total Environ. 2017, 587, 510–521. [Google Scholar] [CrossRef]
- Cieślik, B.M.; Namieśnik, J.; Konieczka, P. Review of sewage sludge management: Standards, regulations and analytical methods. J. Clean. Prod. 2015, 90, 1–15. [Google Scholar] [CrossRef]
- Maktabifard, M.; Zaborowska, E.; Makinia, J. Achieving energy neutrality in wastewater treatment plants through energy savings and enhancing renewable energy production. Rev. Environ. Sci. Bio/Technol. 2018, 17, 655–689. [Google Scholar] [CrossRef]
- Domini, M.; Volpi, A.; Bertanza, G. Potential of aerobic stabilization in drastic sludge reduction: A full-scale experiment. Environ. Eng. Manag. J. 2023, 22, 1717–1727. [Google Scholar] [CrossRef]
- Directive (EU) 2024/3019 of the European Parliament and of the Council of 27 November 2024 Concerning Urban Wastewater Treatment (Recast) (Text with EEA Relevance). Available online: https://eur-lex.europa.eu/legal-content/EN/TXT/?uri=CELEX%3A32024L3019&qid=1734080677883 (accessed on 5 April 2025).
- IRER Depurazione Delle Acque Reflue Urbane: Tecnologie Innovative Idonee a Contesti Molto Urbanizzati [Municipal Wastewater Treatment: New Technologies Suitable for Highly Urbanised Contexts]. Istituto Regionale di Ricerca della Lombardia, Milan, Italy, Report n. 2009B007. pp. 121–137. Available online: https://www.isprambiente.gov.it/it/progetti/cartella-progetti-in-corso/suolo-e-territorio-1/uso-dei-fanghi-di-depurazione-in-agricoltura-attivita-di-controllo-e-vigilanza-del-territorio/files/IRER_2010_rapportofinale.pdf (accessed on 4 April 2025).
- Battistoni, P.; De Angelis, A.; Boccadoro, R.; Bolzonella, D. An automatically controlled alternate oxic− anoxic process for small municipal wastewater treatment plants. Ind. Eng. Chem. Res. 2003, 42, 509–515. [Google Scholar] [CrossRef]
- Martín de la Vega, P.T.; Jaramillo-Morán, M.A. Multilevel Adaptive Control of Alternating Aeration Cycles in Wastewater Treatment to Improve Nitrogen and Phosphorous Removal and to Obtain Energy Saving. Water 2019, 11, 60. [Google Scholar] [CrossRef]
- Doan, H.; Lohi, A. Intermittent aeration in biological treatment of wastewater. Am. J. Eng. Appl. Sci. 2009, 2, 260–267. [Google Scholar] [CrossRef]
- HanHan, O.; Insel, G.; Yagci, N.O.; Artan, N.; Orhon, D. Mechanism and design of intermittent aeration activated sludge process for nitrogen removal. J. Environ. Sci. Health 2011, 46 Pt A, 9–16. [Google Scholar] [CrossRef]
- Hashimoto, T.; Stedinger, J.R.; Loucks, D.P. Reliability, resiliency, and vulnerability criteria for water resource system performance evaluation. Water Resour. Res. 1982, 18, 14–20. [Google Scholar] [CrossRef]
- Matsua, A.; Ide, T.; Fuji, S. Behavior of nitrogen and phosphorus during batch aerobic digestion of waste-activated sludge-continuous aerobic and intermittent aeration by control of DO. Water Res. 1998, 22, 1495–1501. [Google Scholar] [CrossRef]
- Hao, O.J.; Kim, M.H. Continuous pre-anoxic and aerobic digestion of waste-activated sludge. J. Environ. Eng. Div. Am. Soc. Civ. Eng. 1990, 116, 863–879. [Google Scholar] [CrossRef]
- Jenkins, C.J.; Mavinic, D.S. Anoxic/aerobic digestion of waste activated sludge: Part II––supernatant characteristics, ORP monitoring results and overall rating system. Environ. Technol. Lett. 1989, 10, 355–370. [Google Scholar] [CrossRef]
- Hao, O.J.; Kim, M.H.; Al-Ghusain, I. Alternating aerobic and anoxic digestion of waste-activated sludge. J. Chem. Technol. Biotechnol. 1991, 52, 457–472. [Google Scholar] [CrossRef]
- Al-Ghusain, I.; Hamoda, M.F.; El-Ghany, M.A. Nitrogen transformations during aerobic/anoxic sludge digestion. Bioresour. Technol. 2002, 85, 147–154. [Google Scholar] [CrossRef] [PubMed]
- Holenda, B.; Domokos, E.; Rédey, A.; Fazakas, J. Aeration optimization of a wastewater treatment plant using genetic algorithm. Optim. Control Appl. Methods 2007, 28, 191–208. [Google Scholar] [CrossRef]
- Jung, S.J.; Miyanaga, K.; Tanji, Y.; Unno, H. Nitrogenous compounds transformation by the sludge solubilization under alternating aerobic and anaerobic conditions. Biochem. Eng. J. 2004, 21, 207–212. [Google Scholar] [CrossRef]
- Tchobanoglus, G.; Burton, F.; Stensel, H.D. Wastewater Engineering: Treatment and Reuse, 4th ed.; McGraw-Hill: Boston MA, USA, 2003. [Google Scholar]
- Morello, R.; Di Capua, F.; Sahinkaya, E.; Esposito, G.; Pirozzi, F.; Fratino, U.; Spasiano, D. Operational strategies enhancing sewage sludge minimization in a combined integrated fixed-film activated sludge–oxic settling anaerobic system. J. Environ. Manag. 2023, 345, 118808. [Google Scholar] [CrossRef]
- Gong, B.; Zhang, K.; Su, M.; Yang, J.; Peng, C.; Wang, Y. Efficient nitrogen and phosphorus removal performance and microbial community in a pilot-scale anaerobic/anoxic/oxic (AOA) system with long sludge retention time: Significant roles of endogenous carbon source. Environ. Res. 2024, 263, 120164. [Google Scholar] [CrossRef]
- Balku, S. Comparison between alternating aerobic-anoxic and conventional activated sludge systems. Water Res. 2007, 41, 2220–2228. [Google Scholar] [CrossRef]
- Akın, B.; Ugurlu, A. Monitoring and control of biological nutrient removal in a sequencing batch reactor. Process Biochem. 2005, 40, 2873–2878. [Google Scholar] [CrossRef]
- Cheng, C.; Geng, J.; Hu, H.; Shi, Y.; Gao, R.; Wang, X.; Ren, H. In-situ sludge reduction performance and mechanism in an anoxic/aerobic process coupled with alternating aerobic/anaerobic side-stream reactor. Sci. Total Environ. 2021, 777, 145856. [Google Scholar] [CrossRef]
- Yu, G.H.; He, P.J.; Shao, L.M. Characteristics of extracellular polymeric substances (EPS) fractions from excess sludges and their effects on bioflocculability. Bioresour. Technol. 2009, 100, 3193–3198. [Google Scholar] [CrossRef]
- Huang, L.; Jin, Y.; Zhou, D.; Liu, L.; Huang, S.; Zhao, Y.; Chen, Y. A review of the role of extracellular polymeric substances (EPS) in wastewater treatment systems. Int. J. Environ. Res. Public Health 2022, 19, 12191. [Google Scholar] [CrossRef] [PubMed]
- Hamed, H.B.; Mainardis, M.; Moretti, A.; Toye, D.; Léonard, A. Extracellular polymeric substances (EPS) in sewage sludge management: A call for methodological standardization. J. Environ. Manag. 2025, 376, 124407. [Google Scholar] [CrossRef] [PubMed]
- Karlikanovaite-balıkçı, A.; Yağcı, N. A review on promising strategy to decrease sludge production: Oxic-settling-anoxic/anaerobic process. Environ. Res. Technol. 2020, 3, 81–91. [Google Scholar] [CrossRef]
- Semblante, G.U.; Phan, H.V.; Hai, F.I.; Xu, Z.Q.; Price, W.E.; Nghiem, L.D. The role of microbial diversity and composition in minimizing sludge production in the oxic-settling-anoxic process. Sci. Total Environ. 2017, 607, 558–567. [Google Scholar] [CrossRef]
- Karlikanovaite-Balikci, A.; Ozbayram, E.G.; Yagci, N.; Ince, O. Microbial community shifts in the oxic-settling-anoxic process in response to changes to sludge interchange ratio. Heliyon 2019, 5, e01517. [Google Scholar] [CrossRef]
- Zhang, C.; Zhang, H.; Yang, F. Granulation of non-filamentous bulking sludge directed by pH, ORP and DO in an anaerobic/Aerobic/Anoxic SBR. Appl. Biochem. Biotechnol. 2016, 178, 184–196. [Google Scholar] [CrossRef]
- Ferrentino, R.; Langone, M.; Fiori, L.; Andreottola, G. Full-scale sewage sludge reduction technologies: A review with a focus on energy consumption. Water 2023, 15, 615. [Google Scholar] [CrossRef]
- Nardelli, P.; Gatti, G.; Eusebi, A.L.; Battistoni, P.; Cecchi, F. Full-scale application of the alternating oxic/anoxic process: An overview. Ind. Eng. Chem. Res. 2009, 48, 3526–3532. [Google Scholar] [CrossRef]
- Ranieri, E.; Giuliano, S.; Ranieri, A.C. Energy consumption in anaerobic and aerobic based wastewater treatment plants in Italy. Water Pract. Technol. 2021, 16, 851–863. [Google Scholar] [CrossRef]


| Test | Period | Duration [Days] | Note |
|---|---|---|---|
| AC1 | 1 December 2022–22 December 2022 (winter) | 22 | Alternate cycle off during the night; blowers frequency: 30 Hz (50 Hz the first 3 days) |
| AC2 | 11 April 2024–2 May 2024 (spring) | 22 | Blowers frequency: 30 Hz (3 days), 50 Hz (7 days), 30 Hz (the remaining 12 days). Manual dewatering data collection |
| AC3 | 24 June 2024–15 July 2024 (summer) | 22 | Blowers frequency: 27 Hz. Manual dewatering data collection |
| AC4 | 2 September 2024–23 September 2024 (autumn) | 22 | Blowers frequency: 27 Hz. Manual dewatering data collection |
| Test | Tair [°C] Min–Max | Average Tsludge [°C] | VSSi–VSSf [g/L] Δ (%) | (VSS/TSS)i–(VSS/TSS)f [%] | Δdis [%] | TSSi–TSSf [%] | TNi–TNf [mg/L] | Ec [kWh/m3] |
|---|---|---|---|---|---|---|---|---|
| AC1 | 1.3–8.5 | 16.3 | 9.3–7.0 (25) | 75–71 | 15 | 21–22 | 65–38 | 5.3 |
| AC2 | 6.3–17.9 | 26.9 | 13.4–9.1 (32) | 69–59 | 28 | 21–23 | 117–49 | 12.5 |
| AC3 | 19.3–28.7 | 33.5 | 14.6–11.2 (23) | 62–56 | 24 | 24–27 | 93 –14 | 9.2 |
| AC 4 | 25.0–31.4 | 28.5 | 9.4–8.0 (15) | 65–61 | 17 | 18–20 | 130–20 | 7.1 |
| Parameter | Scenarios | ||
|---|---|---|---|
| Summer | Winter | Autumn/Spring | |
| Sludge temperature [°C] | 25 | 15 | 20 |
| VSS/TSS [%] | 65 | 75 | 70 |
| TSS [kg/m3] | 20 | 20 | 20 |
| VSS [kg/m3] | 13 | 15 | 14 |
| Dewaterability [%] | 21.32 | 21.32 | 21.32 |
| TN [g/m3] | 100 | 100 | 100 |
| k20° [d−1] | 0.15 | 0.15 | 0.15 |
| mTSS [kg/(m3 d)] | 0.1 | 0.1 | 0.1 |
| mTN [g/(m3 d)] | −2.29 | −2.29 | −2.29 |
| Daily specific energy consumption [kWh/(m3 d)] | 1.16 | 1.16 | 1.16 |
| Difference Between Continuous Aeration and Alternate Cycles (%) | Summer | Scenarios Winter | Autumn/Spring | |||
|---|---|---|---|---|---|---|
| 2 Weeks | 5 Weeks | 2 Weeks | 5 Weeks | 2 Weeks | 5 Weeks | |
| VSS abatement—batch | 4 | 8 | 2 | 6 | 3 | 7 |
| TSS abatement—batch | 2 | 4 | 2 | 4 | 2 | 4 |
| VSS abatement—continuous feeding | 3 | 5 | 2 | 4 | 2 | 5 |
| TSS abatement—continuous feeding | 2 | 3 | 1 | 3 | 2 | 3 |
| VSS/TSS | 2 | 4 | 1 | 2 | 1 | 3 |
| Dewaterability | 11 | 24 | 11 | 23 | 11 | 24 |
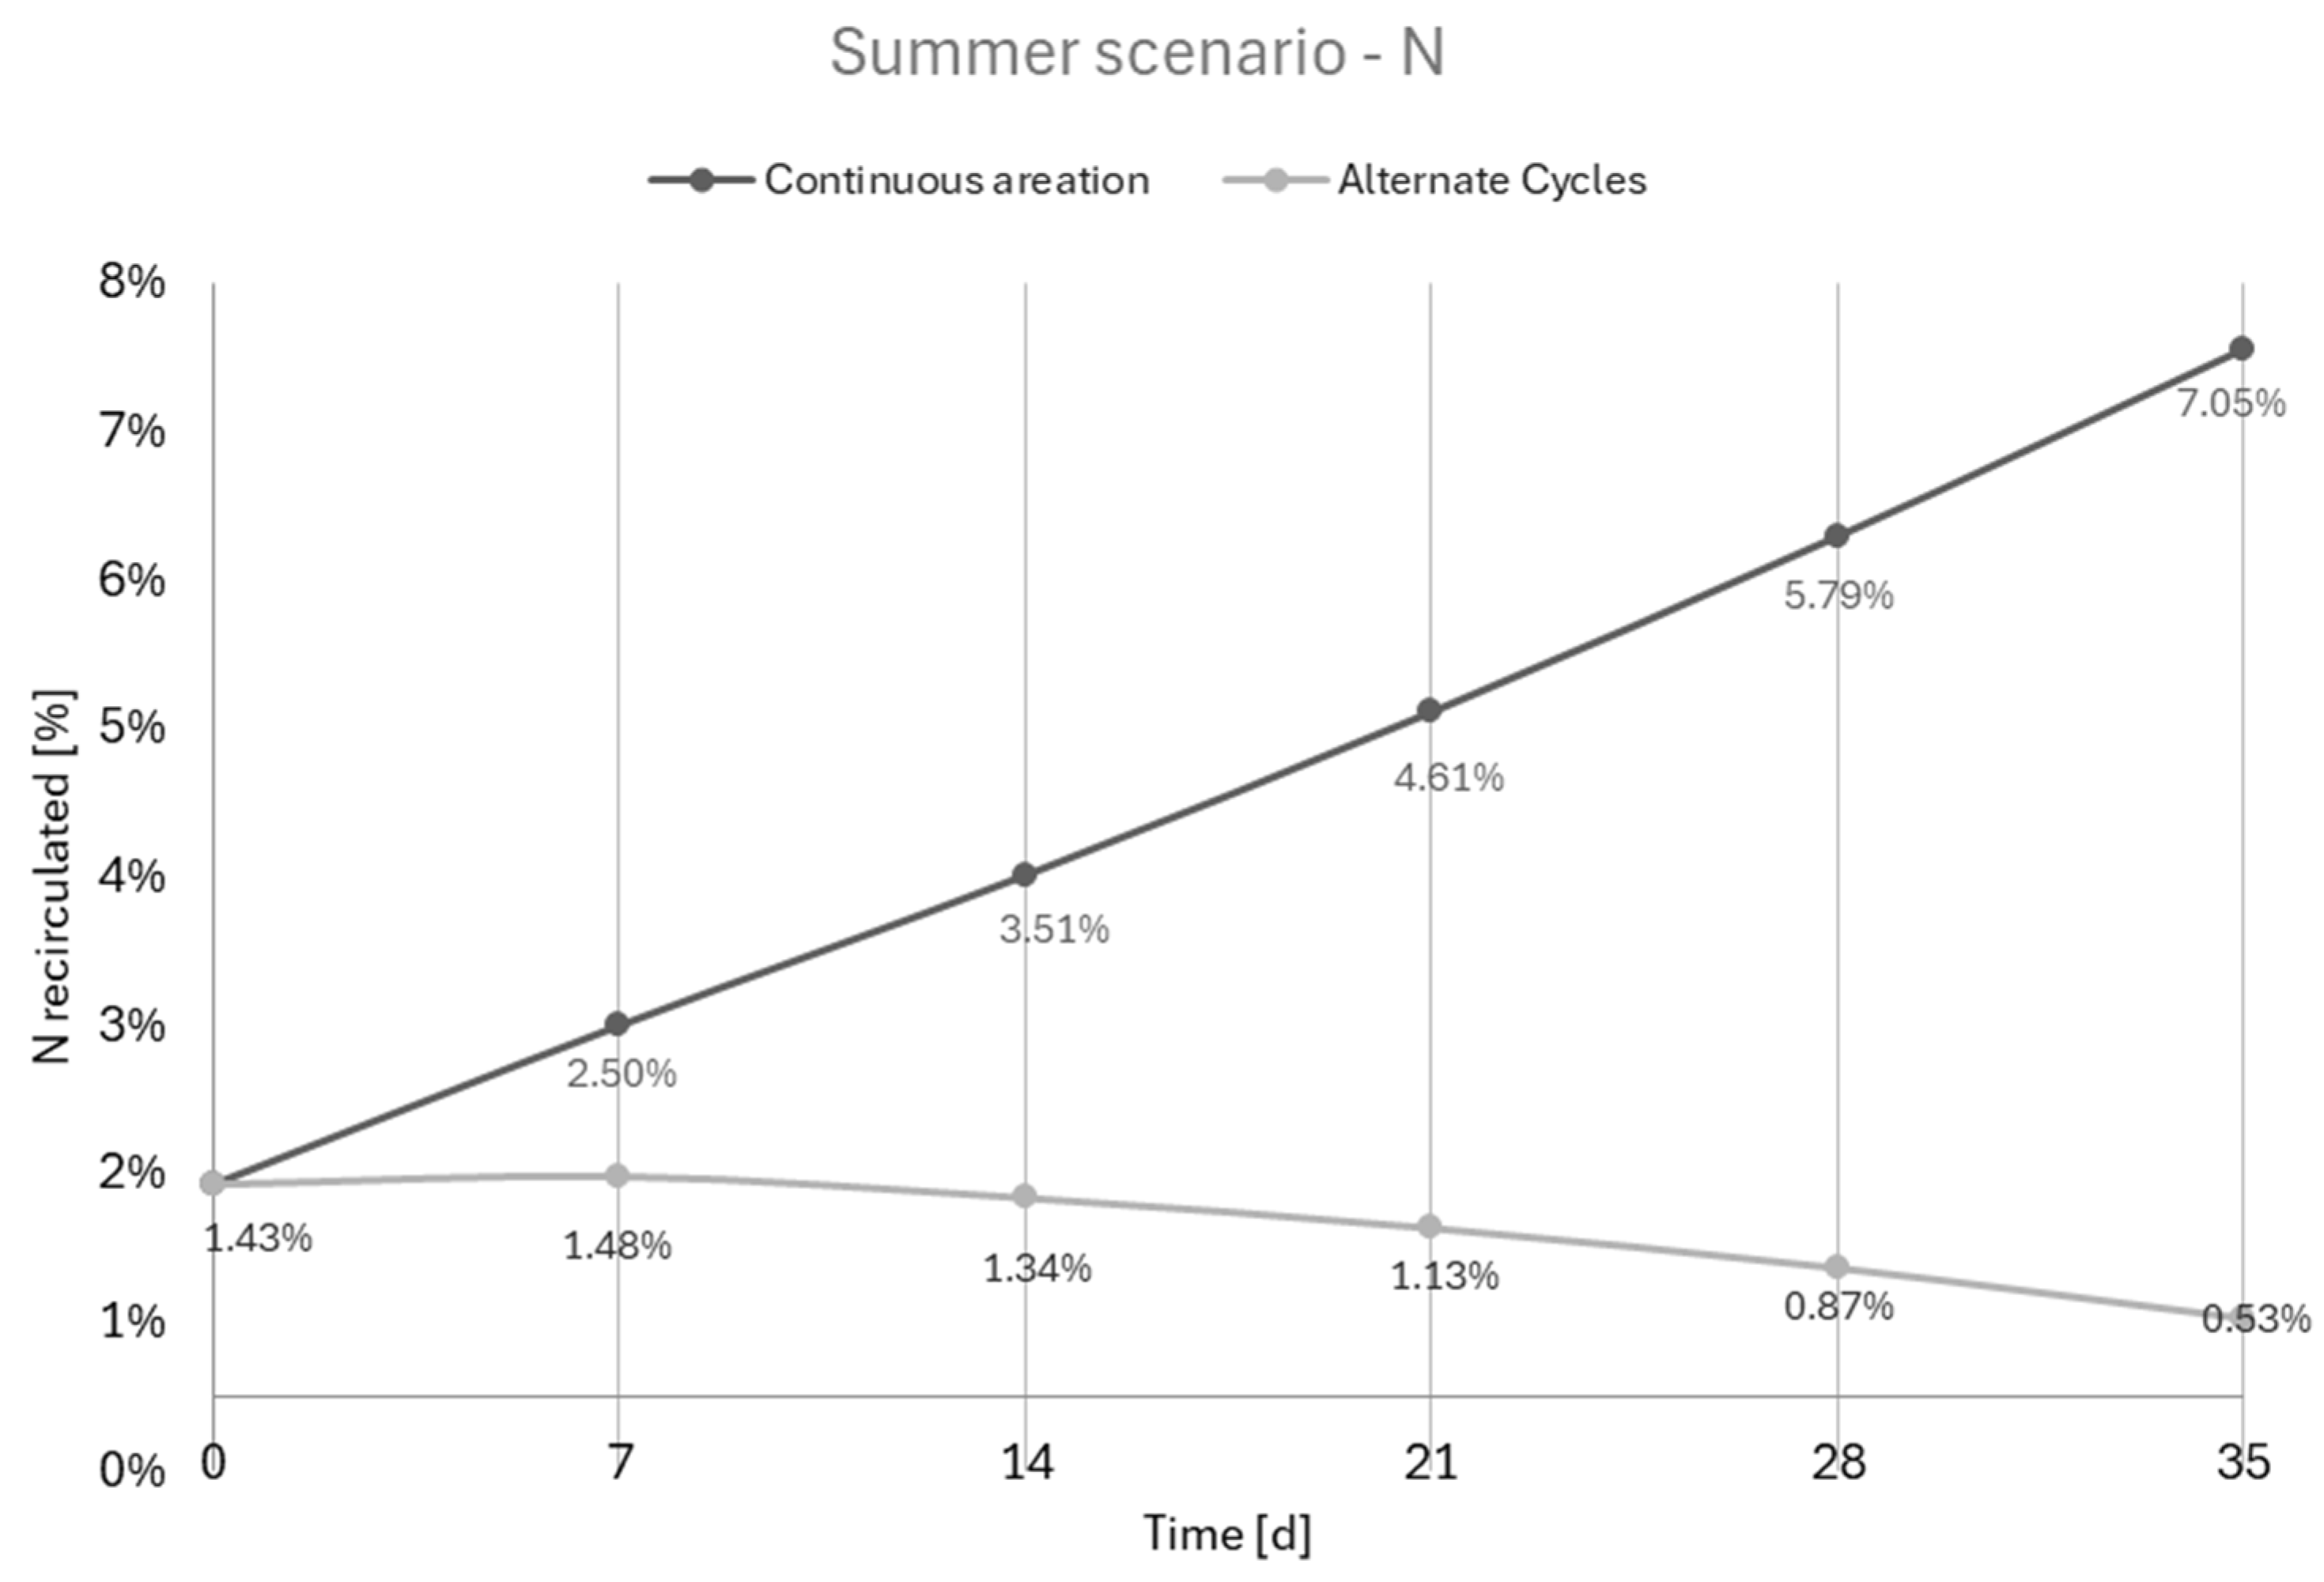
| TN recirculated | 62 | 92 | 62 | 92 | 62 | 93 |
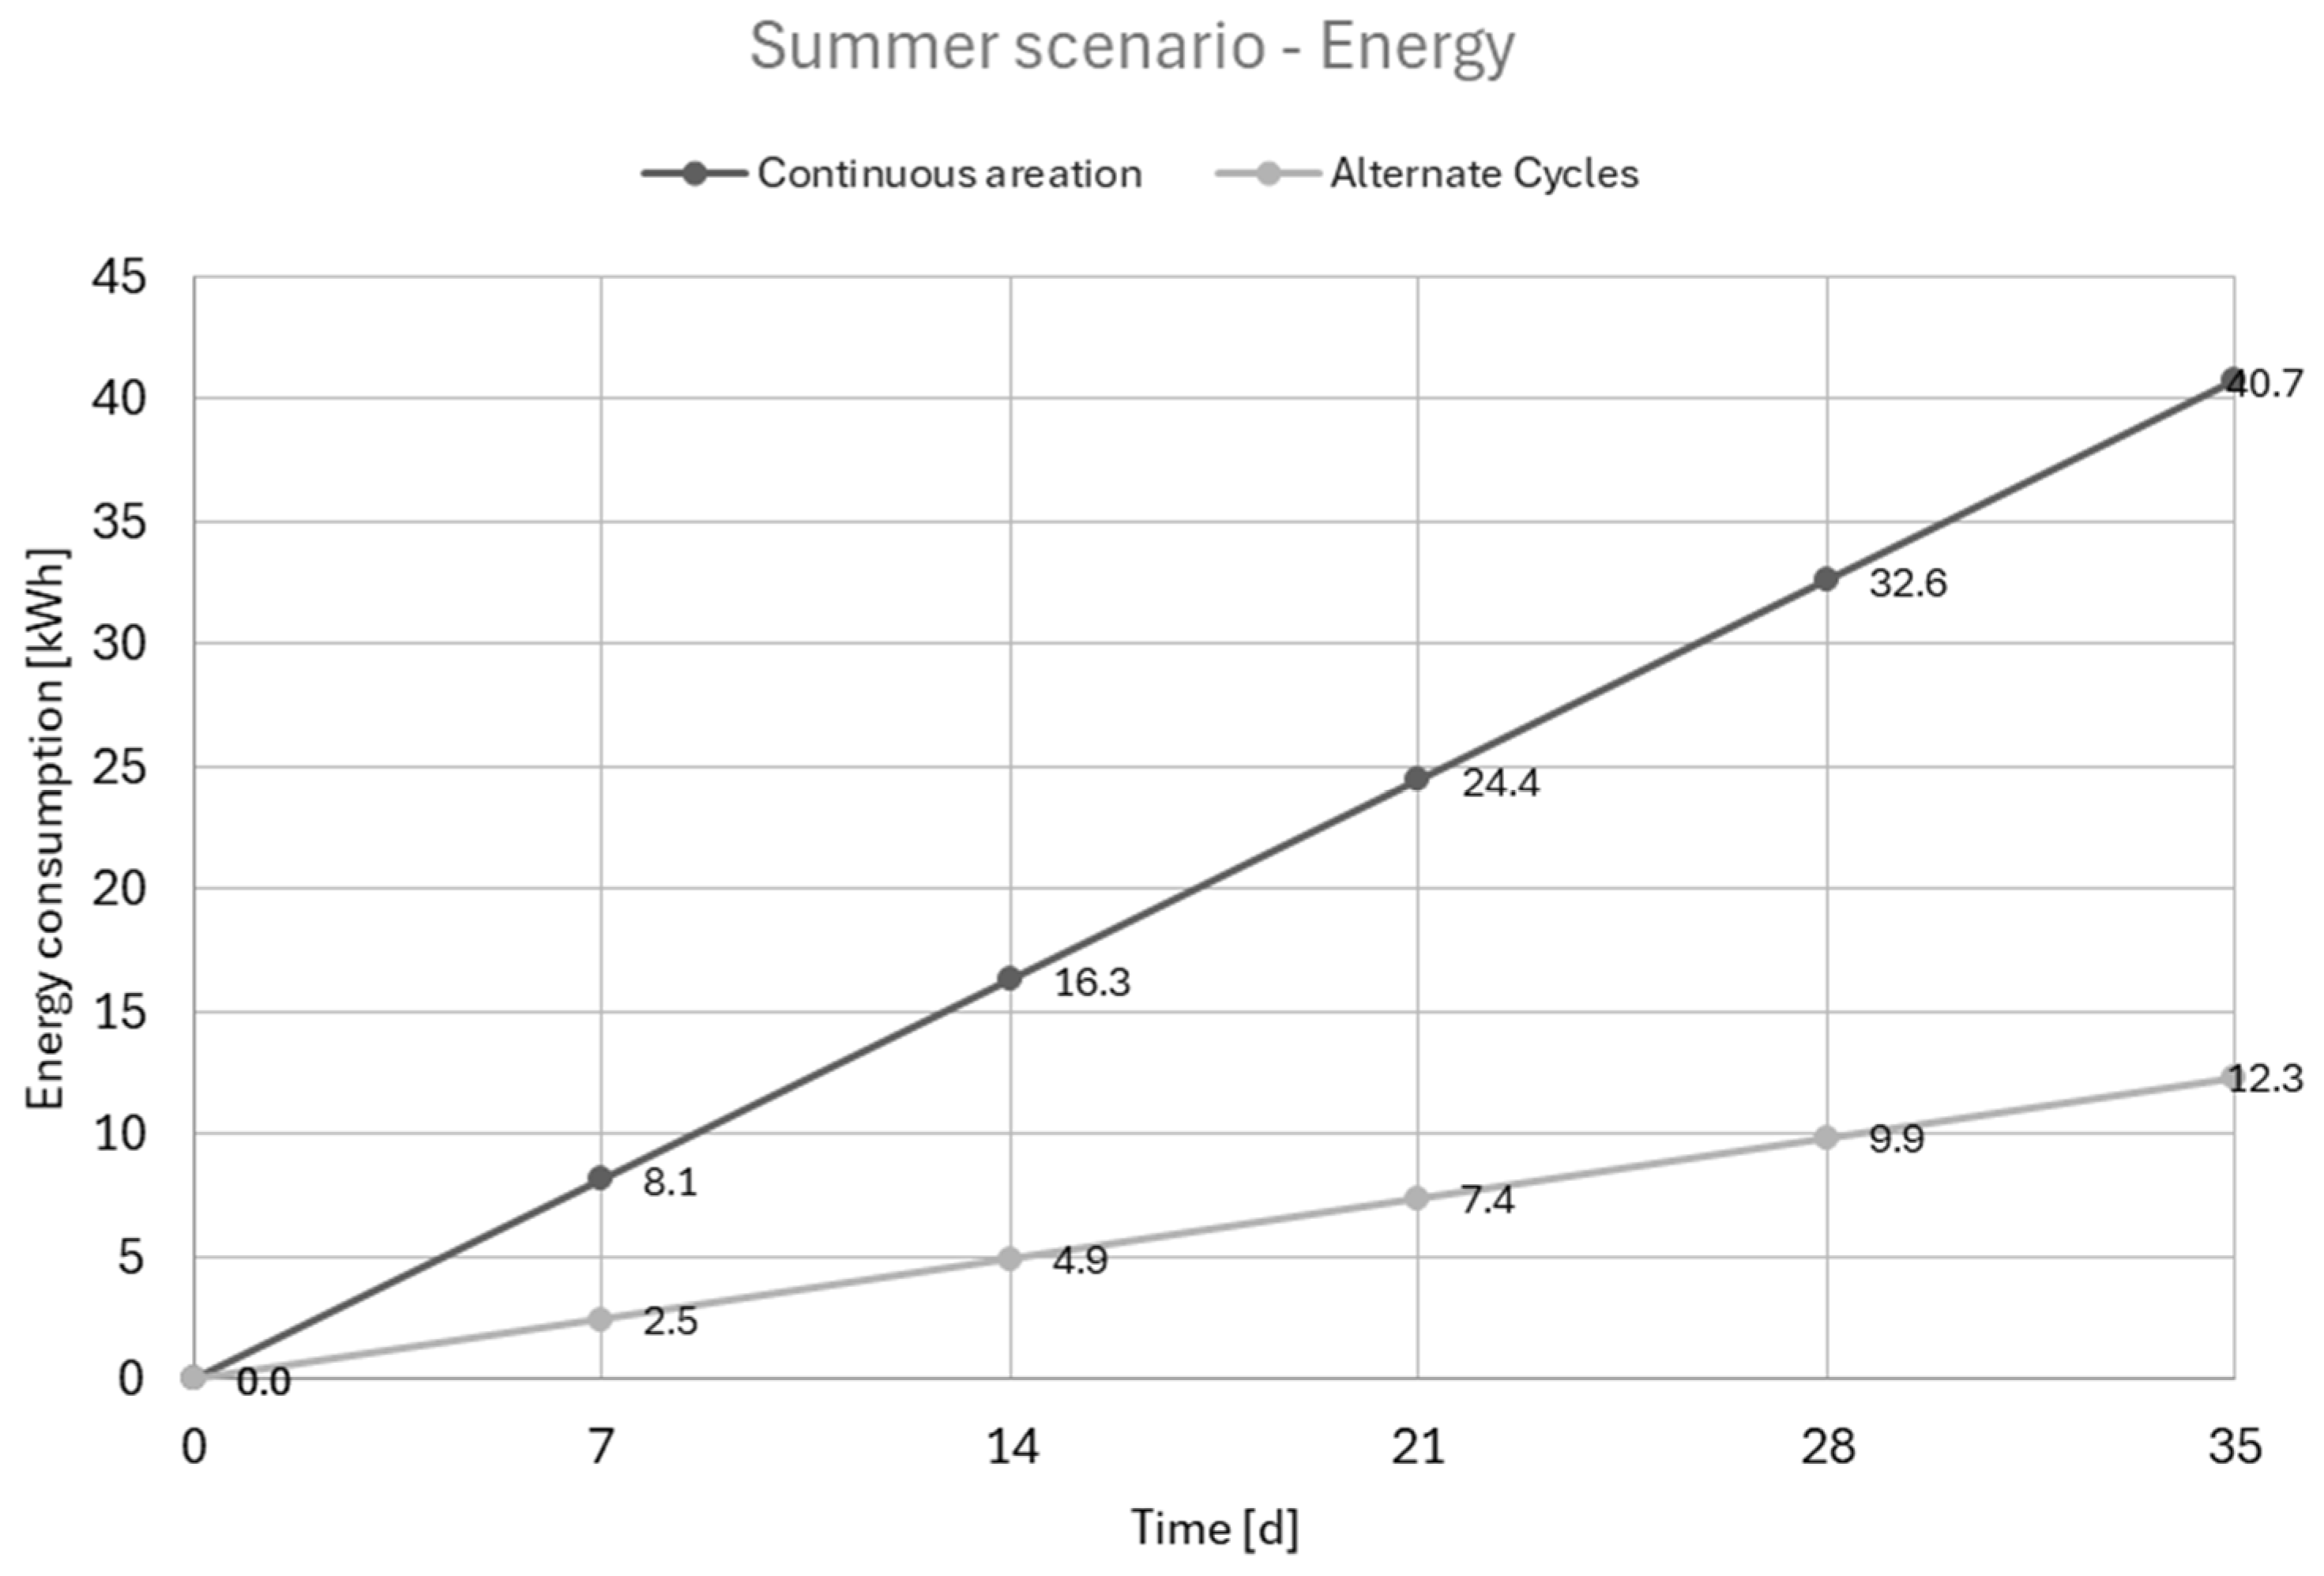
| Energy consumption | 70 | 70 | 70 | 70 | 70 | 70 |
Disclaimer/Publisher’s Note: The statements, opinions and data contained in all publications are solely those of the individual author(s) and contributor(s) and not of MDPI and/or the editor(s). MDPI and/or the editor(s) disclaim responsibility for any injury to people or property resulting from any ideas, methods, instructions or products referred to in the content. |
© 2025 by the authors. Licensee MDPI, Basel, Switzerland. This article is an open access article distributed under the terms and conditions of the Creative Commons Attribution (CC BY) license (https://creativecommons.org/licenses/by/4.0/).
Share and Cite
Domini, M.; Bertanza, G. The Role of Alternate Oxic–Anoxic Cycles in Full-Scale Sludge Stabilization for Energy Savings. Energies 2025, 18, 2514. https://doi.org/10.3390/en18102514
Domini M, Bertanza G. The Role of Alternate Oxic–Anoxic Cycles in Full-Scale Sludge Stabilization for Energy Savings. Energies. 2025; 18(10):2514. https://doi.org/10.3390/en18102514
Chicago/Turabian StyleDomini, Marta, and Giorgio Bertanza. 2025. "The Role of Alternate Oxic–Anoxic Cycles in Full-Scale Sludge Stabilization for Energy Savings" Energies 18, no. 10: 2514. https://doi.org/10.3390/en18102514
APA StyleDomini, M., & Bertanza, G. (2025). The Role of Alternate Oxic–Anoxic Cycles in Full-Scale Sludge Stabilization for Energy Savings. Energies, 18(10), 2514. https://doi.org/10.3390/en18102514