Article

Experimental Investigation of Heat Pump Modules Limited to 150 g of Refrigerant R290 and a Dedicated Test Rig

1
Ochsner Wäermepumpen GmbH, 4021 Linz, Austria
2
AIT—Austrian Institute of Technology, 1210 Vienna, Austria
*
Author to whom correspondence should be addressed.
Energies 2025, 18(10), 2455; https://doi.org/10.3390/en18102455
Submission received: 4 April 2025 / Revised: 25 April 2025 / Accepted: 30 April 2025 / Published: 10 May 2025
(This article belongs to the Special Issue Advances in Refrigeration and Heat Pump Technologies)

Abstract

:
Heat pumps are widely regarded as a key technology for sustainable heating, offering a pathway to significantly reduce fossil fuel dependency and combat the climate crisis. However, replacing individual gas boilers with heat pumps in multi-unit residential buildings remains a substantial challenge despite its immense potential to lower urban greenhouse gas emissions. To address this, the following paper describes the development of a compact, modular heat pump system designed to replace conventional gas boilers, focusing on the building and testing of a prototype for such a modular heat pump system. The prototype supports multiple functionalities, including space heating, cooling, and domestic hot water production. The performance advantages of two different compressor technologies were exploited to optimize the efficiency of the complete system and the pressure lifts associated with applications for heating and domestic hot water production. Thus, measurements were conducted across a range of operating points, comparing different heat pump module types. In the case of the piston compressor module, the Carnot efficiency was in the range of 47.2% to 50.4%. The total isentropic efficiency for floor heating and domestic hot water production was above 0.45 for both piston and rotary compressors.

1. Introduction

Human-induced climate change is already showing its effects in many weather and climate extremes. This includes the frequency and intensity of heatwaves, heavy precipitation, droughts, and tropical cyclones. Global warming of 2 °C will be exceeded in this century unless CO2 emissions are cut drastically [1].
In Austria, the installation of new heating systems based on fossil fuels has been prohibited in newly constructed buildings since February 2024 in the form of the “Erneuerbare-Wäerme-Gesetz” (BGBl. Nr.8/2024) [2]. Based on EU law (DIRECTIVE (EU) 2024/1275), before 2040, existing heating systems based on fossil fuels must be taken out of service or fuelled by a renewable alternative such as biogas [3]. Nevertheless, refurbishment rates have been low for years and reached levels of less than 2% in 2013 [4]. Thus, in the heating season of 2021/2022, over a third of all homes were still using a heating system based on fossil fuels, whereas gas boilers were the main decentralized solution [5].
Gas boilers today offer a compact, cost-efficient, and high-power solution for thermal energy delivery in multi-family houses. Replacement of gas boilers requires thermal energy to be delivered for two different purposes: room heating and domestic hot water (DHW). These two can be differentiated by their time profile and temperature requirements: on the one hand, room heating permits low power, and thermal mass is relatively high due to, for example, the walls, furniture, and the air inside a house. On the other hand, DHW requires high power, and thermal mass is only available if a hot water tank is connected. On a different dimension, one can distinguish them by the temperature level at which the thermal energy has to be delivered.
Room heating with heat pumps is most efficient with low flow temperatures, for example, 35 °C , as the lift for the refrigerant circuit is minimized. Hence, legacy radiators with a small surface to the surrounding heat carrier air are not recommended and should be replaced by modern solutions such as floor heating, fan coils, or large surface heating solutions integrated into walls or ceilings. In contrast, DHW applications require temperatures above 50 °C combined with a regular boost up to 60 °C for hygienic reasons.
Adapting to the two different temperature levels, the design of the refrigerant circuit can be optimized for each application. In this study, for each purpose, a different compressor technology was selected to optimize isentropic efficiency: a rotary compressor for heating and a piston compressor for DHW.
As heat pumps use electricity to lift the temperature level of thermal energy, a source for this thermal energy is needed. For multi-family houses, centralized solutions are already available on the market to decarbonize heating and DHW supply by extracting thermal energy from the air, groundwater, or soil. While a centralized supply for heating, at, for example, 35 °C , causes limited thermal losses, a centralized supply for DHW at high temperatures leads to significant thermal losses until it reaches individual consumer taps. Thus, a hybrid model with decentralized DHW supply can be used instead, which can be based upon small heat pumps or simple electric heaters [6,7].
Decentralized heating and DHW solutions are required if the ownership of flats is fragmented in a building. This is a significant problem for Austria as 440,000 flats, which are owned by one individual, are situated in buildings with three or more flats. This number is even higher if cooperative ownership is included, which adds 640,000 flats to buildings with three or more flats [8]. As the decarbonization of heating systems comes with higher initial costs, the reluctance of flat owners is increased, and individual considerations dominate [9]. An easily accessible decentralized thermal energy source would be the surrounding air. Still, several disadvantages are prevalent: noise emissions in densely populated areas, modifications to the piping as the connection point of the original gas boiler is relocated, aesthetic considerations, overheating during summer, and lower efficiency in winter. Another energy source is wastewater, which was studied in detail in [10].
Nevertheless, decentralized heating and DHW solutions do not require a decentralized source but can connect to a centralized source as long as it can be accessed without infringing the rights of other owners. Early adapters can initiate the installation of a thermal energy source, which can be extended as more decentralized heat pumps are connected to it later on. Three different options are depicted in Figure 1. Utilizing abandoned chimneys is necessary to connect them to a thermal borehole or the roof. Based on the source temperature, thermal boreholes are expected to be the most efficient solution, and the source can be considered centralized due to the high fixed costs to drill a borehole independent of its length. The installation of an air-to-water heat exchanger mounted either on a roof or on an outside wall will be less efficient overall, especially in peak load times of winter, and can lead to higher variable costs. Still, decentralized sources can be realized with lower fixed costs for an individual flat owner. Installation costs can be reduced even further with this option if flat owners invest in a centralized source together.
Flat sizes in Austria typically vary within one order of magnitude (e.g., 20 m2 to 200 m2) [5], while the required specific heating energy demand (specific heating energy demand is provided by the unit heating energy demand (kWh) divided by area to be heated (m−2) and the reference period of a calendar year (a−1)) for a flat with a gas boiler can be assumed to be within a smaller range of 40 to 200 kWh m−2 a−1, depending on the thermal characteristics of the building itself [9]. Hence, the required heating energy demand for one flat in a multi-family house can differ by a factor of 50 to 1 in another building. Fully adapting to this variability is considered economically inefficient, while a modular approach can allow covering most of the range. Opposite to an inverter-driven heat pump, a modular concept can use a small number of module types to adapt to different needs of heat capacity in combination with temperature levels.
Within the aim of this study, the restriction of refrigerant mass to 150 g plays a key role. Compressor data from manufacturers do not adhere to this limit, and an optimal refrigerant charge can be expected. Still, in the development of heat pump modules and the comparison of different compressor types, an efficiency gap depending on the ratio between condensation pressure and evaporator pressure can be expected.

2. Methodology

In this section, the heat pump test stand for testing individual heat pump modules is described, and the investigated configurations and the refrigeration circuits are presented. The data recording and processing method used is defined, and the rack for combinations of multiple heat pump modules and the dedicated hydraulics are introduced. Finally, equations for assessing the performance of the modules are provided.

2.1. Heat Pump Test Stand

The experimental part of this work was conducted in the heat pump laboratory on the AIT premises in Vienna. The heat pump test stand used for the measurements for the single modules is mobile and only needs a three-phase voltage supply and a freshwater supply for operation.
Figure 2 shows the hydraulic design of the test stand. It consists of three hydraulic circuits, two of which supply the heat pump (11, in the center). The container or water reservoir (10) filled with water acts as a heat source and heat sink at the same time. The temperature of the heating circuit is regulated via the three-way-valve V2, reaching the required temperature by mixing water from the container and the return coming from the heat pump. The circuit for the heat source is filled with brine; therefore, it cannot be mixed with the water from the container. This is why an additional circuit powered by pump P3 is used in combination with a brine-to-water heat exchanger (1) in order to heat up the brine coming from the heat pump to the required flow temperature. The mass flow rates through the heat pump can be regulated using the regulating valves V1 and V3 or using manually operated valves in series. With manually operated balancing valves, a baseline flow limit can be set. Then, the electric regulating valves fine-tune or dynamically adjust the flow within that pre-set range. This avoids overflows and ensures the electric valves operate within their optimal control range. Note that the temperature of the water in the container has to always be higher than the source inlet and colder than the flow inlet temperatures. This condition requires the operator to add cold or hot water to the container in some states of operation. The test stand is completed by the safety group (3) and the expansion vessel (5).

2.2. Configurations and Refrigeration Circuits of the Heat Pump Modules

To allow for different pressure lifts in the modular concept, two types of modules (see Figure 3) with a similar refrigerant circuit layout (see Figure 4) were used in this study. For the module GTZ 1.2 [11], a fixed-speed piston compressor running at a compressor frequency of 50 Hz with a displacement of about 10 cm3 was used. For modules 2.0, 2.2, and 2.3 [12], a fixed-speed rotary compressor running at the same frequency of 50 Hz with a displacement of 17 cm3 was selected. After testing module GTZ 1.2, the insulation of the heat exchangers was removed to allow better visual access to the components (see Figure 3). Operating without insulation also shows condensation of humidity and icing on the outside of the evaporator (top image), clearly visible on the heat exchanger in the front.
One key parameter to change within the refrigerant circuit is the number of plates of the heat exchanger (HEX) and, therefore, their corresponding sizes. The HEX used for both the condenser and the evaporator side of the prototype modules have been selected as brazed plate heat exchangers (PHE). Figure 3 shows two types of modules. Modules GTZ 1.2, 2.0, and 2.3 have symmetric setups with identical numbers of plates on the condenser and the evaporator. For comparison, module GTZ 2.2 has pronounced asymmetric plate numbers of 18 on the condenser side and 22 on the evaporator side. Module GTZ 2.1, which is a variant of module GTZ 2.0, including a sight glass and a filter dryer, is not included.
Table 1 depicts the selected combination of different PHE types and numbers of plates for each of the heat pump modules.
In addition to the number of plates of the condenser and evaporator HEX, the refrigerant circuits of modules 2.3, 2.2, and 2.0 are identical and shown in Figure 4. Note that the piping section is before and after the expansion valve. The pipes are soldered together (with the short vertical double blue line above the expansion valve), creating an internal heat exchanger. This sub-cooling loop ensures that the working fluid is sub-cooled, without any bubbles, before entering the expansion valve. If bubbles were to enter the expansion valve, its mass flow could not be maintained and the control system would not be able to regulate the circuit properly.

2.3. Rack for Multiple Heat Pump Modules and Dedicated Hydraulics

Figure 5 shows an image of the complete heat pump rack (see the left-hand side without piping). This substitutes the single heat pump module shown as (11) in Figure 2. The rack allows for 8 modules in total, while the hydraulic connections (see the right side) were designed for this work for 4 modules only. For ease of use and reduction in cost, the piping was carried out with the Multiplast system by the company Multitherm, Vienna, Austria based upon the material polypropylene random crystallinity temperature.
For better control of the complex hydraulics in the modular concept of the heat pump test rig, the source side connections were placed in one plane, i.e., the front plane. In a second plane closer to the rack, i.e., the back plane, the sink side connections were situated. This is depicted in Figure 6, which also shows the schematics of the hydraulic connections of the modules. The complete heat pump rack allows for different heat transfer fluids (HTF) on the source and sink side, therefore yielding accessible temperature levels below and above freezing point. Rack positions are marked as H and C/DHW, as further variation is achieved for the C/DHW rack positions as they can connect to a third circuit with another independent temperature level. Thus, the 3-way valves (denoted as a and b in Figure 6) allow access to different temperature levels, while the flow is measured for each module individually and can be adjusted with the valves (yellow).
In Figure 7, the setup and information flows of data collection are depicted, showing a distinct temperature level for HUS and HSS each. Information is collected locally on two different laptops, accessing test stand and module data individually, which allows us to easily swap modules and maintain data coherence. To characterize the heat pump’s performance, the measurement of temperatures and volume flows of the HTF was necessary. Furthermore, the compressor’s power consumption was recorded with a Yokogawa power meter, and the LabVIEW program of the test stand was utilized. The refrigerant circuit’s additional sensors allowed a detailed understanding of pressures and temperatures, which were recorded by the module’s printed circuit boards (PCBs), two auxiliary controllers, and the main controller itself. The PCBs and controllers communicated with the main controller via a bus system. On-site data were displayed on a laptop and uploaded to a server for remote access and storage.
The test stand was designed to be fully capable of measuring all the required parameters for the analysis of a heat pump module during run-time and in post-processing, including sensors for temperature, pressure, and volume flow. Table 2 shows the most important components used for the hydraulics of the rack. The temperature sensors were installed with thermal paste into immersion sleeves. The immersion sleeves were placed in 90° bends using tee connectors. The electrical power consumption was measured using a Yokogawa WT230 (Yokogawa GmbH, Vienna, Austria).

2.4. Performance Indicators for Heat Pumps

The efficiency of a heat pump is described using the energy flows and is called coefficient of performance (COP). It is defined by the ratio of the heat delivered to the heating system and the electric power consumed by the compressor (see Equation (1)). However, the COP can only be used for comparing operational points of identical temperatures on the source and sink side. These points are indicated by the media and their corresponding temperatures, e.g., B25/W60 means that heat was taken up at 25 °C from brine and delivered at 60 °C to water [13]:
C O P = Q ˙ c o n d W e l .
To ensure efficient use of electric energy, the COP should be as high as possible and will always be higher than 1 in any theoretical heat pump model. Assuming a COP of 1 would be equivalent to heating with an electric heating rod ( C O P = 1 is equal to Q ˙ c o n d = W e l ) and thus directly using electric power. The electric power W e l can be measured directly, whereas the heat flow rate Q ˙ c o n d is based on the HTF mass flow rate m ˙ HTF s i n k through the condenser as well as temperature measurements upstream T HTF s i n k , i n and downstream T HTF s i n k , o u t (Equation (2)) of the condenser. The characteristics of the HTF enter as the specific heat capacity c p HTF s i n k at constant pressure.
Q ˙ c o n d = m ˙ HTF c o n d c p HTF c o n d ( T HTF c o n d , o u t T HTF c o n d , i n ) .
The COP of a theoretically reversible heat pump, limited only by the second law of thermodynamics, is called the reversed Carnot-COP [14] and can be defined using the temperature at the inlet of the source T s o u r c e , i n and outlet of the sink T s i n k , o u t as follows:
C O P C a r n o t = T s i n k , o u t T s i n k , o u t T s o u r c e , i n .
Forming the quotient with the COP of a real heat pump, one can define the Carnot efficiency of a heat pump [14]. This definition is common in heat pumps and refrigerators and has its roots in the definition of exergy efficiency, which is also known as the second-law efficiency:
η C = C O P C O P C a r n o t .
The Carnot efficiency also has the advantage of being comparable among different evaporation and condensation temperatures. It is usually between 0.4 and 0.6 [15].
A commonly used performance parameter for the compressor is the comparison of the compression to the isentropic process, which can be carried out in two ways, using either the total or the internal isentropic efficiency. The latter is calculated by using the electric power consumption of the compressor (see Equation (5)). h 2 s is the enthalpy corresponding to a point with pressure after compression and the same specific entropy as point 1; therefore, the compression from 1 to 2 s is isentropic and the refrigerant mass flow rate m ˙ w f is maintained.
η i s , t o t = ( h 2 s h 1 ) m ˙ w f W e l .
As the enthalpy h 2 s corresponds to the same specific entropy as h 1 , a property database can be used to find h 2 s . In the case of this work, CoolProp 6.6.0 [16] was used.
Compared to generic heat pump cycle log(p)-h diagrams, the log(p)-h diagram of the GTZ modules has two more points of state (points 4 and 5 in Figure 8). These are the points that arise due to additional sub-cooling by the sub-cooling loop, as explained in the last paragraph. Expansion through the expansion valve now takes place between points 4 and 5 at lower enthalpy to ensure sub-cooling. The heat taken from point 3 to point 4 is then transferred to the working fluid between points 5 and 6. At point 6, the working fluid enters the evaporator. Specifically, the state points at operating point B0/W35 are shown. Suction gas super-heating at point 1 is controlled by the expansion valve ranging from 8 to 10 K. Compression takes place from point 1 to point 2. The green line shows the isentropic compression. In the liquid line, the sub-cooling at point 3 is approximately 7 K with a further increase of approximately 30 K at point 4 due to the sub-cooling loop.

3. Results and Discussion

In this work, a modular approach was chosen to cover the central parts of the widely varying combination of flat sizes and specific heat loads in Austria. A modular concept can use a small number of module types to adapt to different heat capacity needs in combination with temperature levels. Two distinct types were chosen with modules 1.2 and 2.X, respectively, using a piston compressor and a rotary compressor.

3.1. Heating Capacity
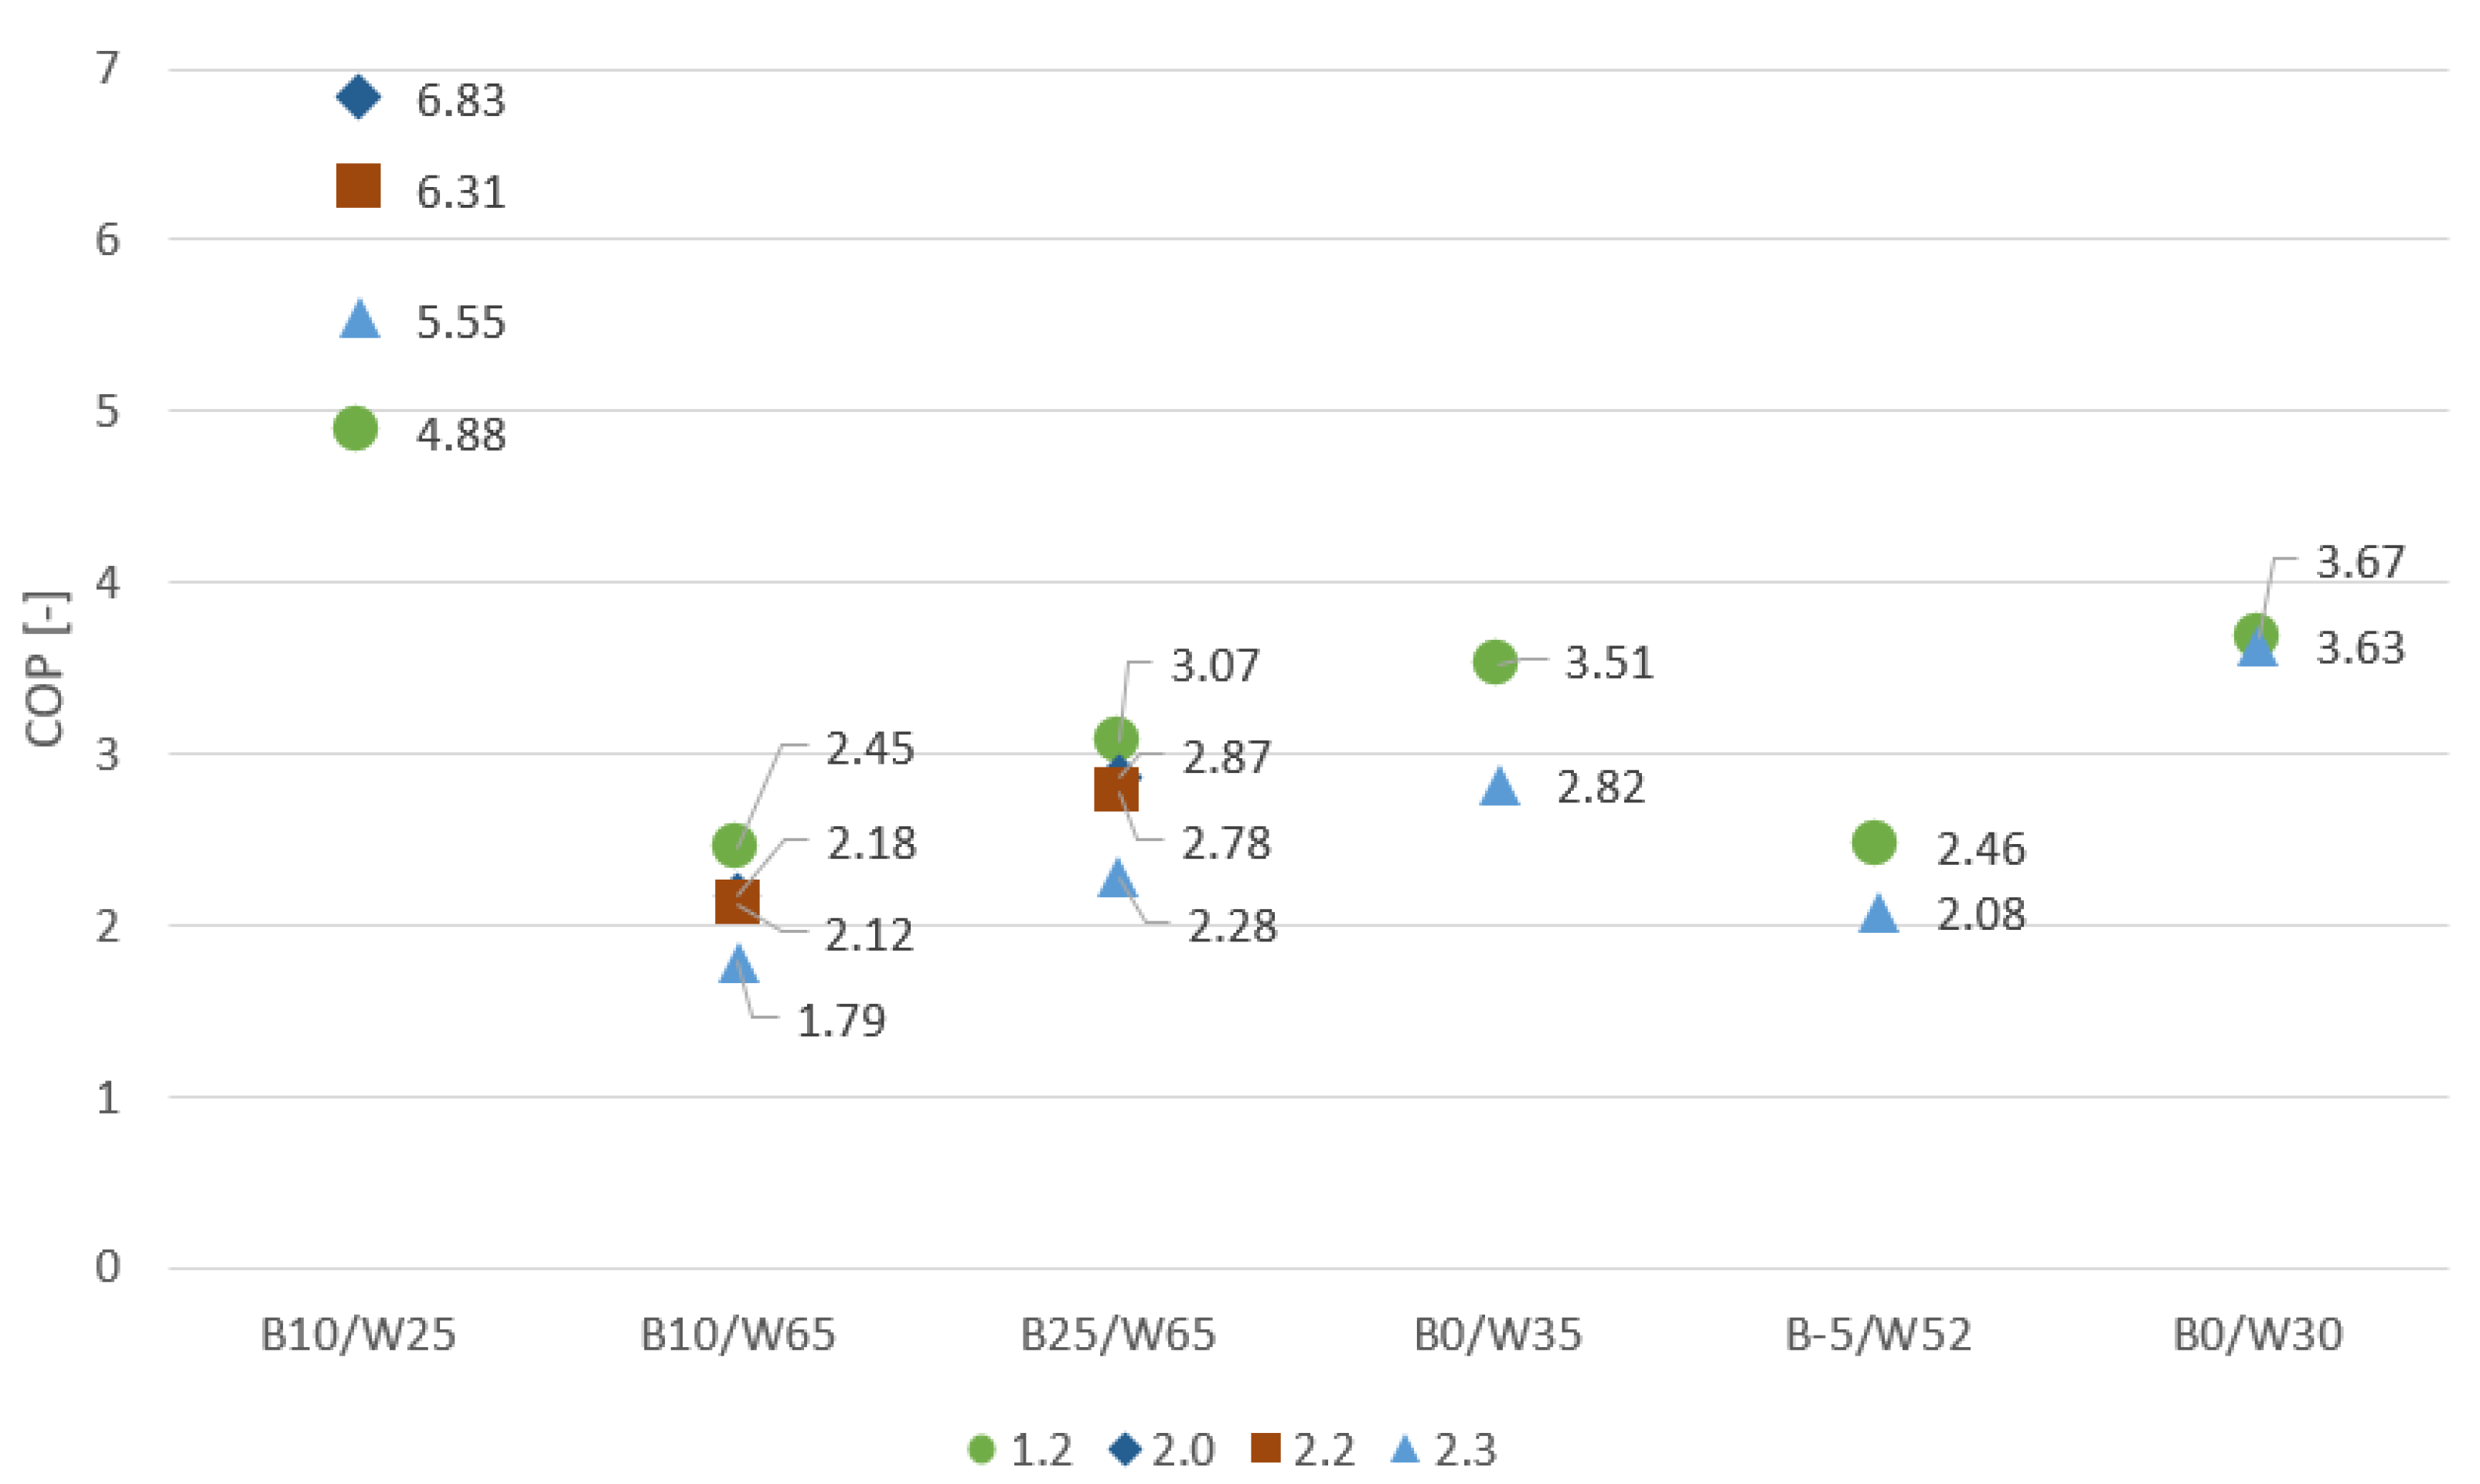
Figure 9 shows a comparison of the heating capacities of the tested modules. Module 1.2 is based upon a 10 cm3 piston compressor, while module 2.X employs a 17 cm3 rotary compressor. Modules 2.0 and 2.2 used water on the source side and hence temperatures close to 0 °C could not be tested to avoid freezing of water in the evaporator. As the compressor of the 2.X modules has a significantly higher displacement and power consumption, the expected result would be higher values for the heating capacity as well. One can see that for every measured point, only B25/W65 stands out, as the heating capacity of module 1.2 is slightly higher than that of module 2.3. Comparing the 2.X modules, 2.0 has the highest heating capacity. This is the module with symmetric heat exchangers and 20 plates each. Modules 2.0 and 2.2 used water on the source side and hence temperatures close to 0 °C could not be tested to avoid freezing of water in the evaporator and damaging the component.

3.2. COP Comparison

The comparison of the efficiency data of the manufacturers of the piston and the rotary compressors shows the rotary compressor performs significantly better at smaller pressure ratios and, therefore, smaller lifts. The gathered data show this effect only for point B10/W25 with the smallest lift. In Figure 10, the measured points are compared in terms of their COPs. One can observe that for the B10/W25 point with the smallest lift, the results show the expected outcome of the 2.X modules performing significantly better. The 2.3 module shows the lowest COPs of the 2.X modules for all measured points, even being below 1.2 most of the time.
From the interpretation of the results, the lack of a refrigerant cycle, including a sight glass, is unfortunate. The sub-cooling is also measured with a PT1000 thermocouple (Sontec Sensorbau GmbH, Lennestadt, Germany), but this measurement is subject to some inaccuracy as the sensor is housed in a copper pipe soldered to the pipe of the refrigerant circuit. Thus, to be certain that there are no bubbles present after the condenser, the measured temperature must be some Δ T below the condensation temperature. As the control system for the expansion valve uses super-heating after the evaporator as a feedback value, sub-cooling depends on the operating conditions. For the tests shown in Figure 10, sub-cooling was in between 1.3 K and 7.3 K; therefore, the formation of bubbles cannot be ruled out for all operation points.
Super-heating is also measured via a thermocouple on the outside of the refrigerant circuit’s pipe. To ensure that there is at least some amount of super-heating present, the setpoint for the super-heating is generally set to 7 K. Again, this is to make sure that the compressor is not damaged by liquid parts in the vapor. During some measurements, the feedback control system of the expansion valve led to a static oscillation in the expansion valve opening, and, therefore, also during super-heating. These oscillations were partially tamed by altering the super-heating setpoint by about 2 K–4 K.

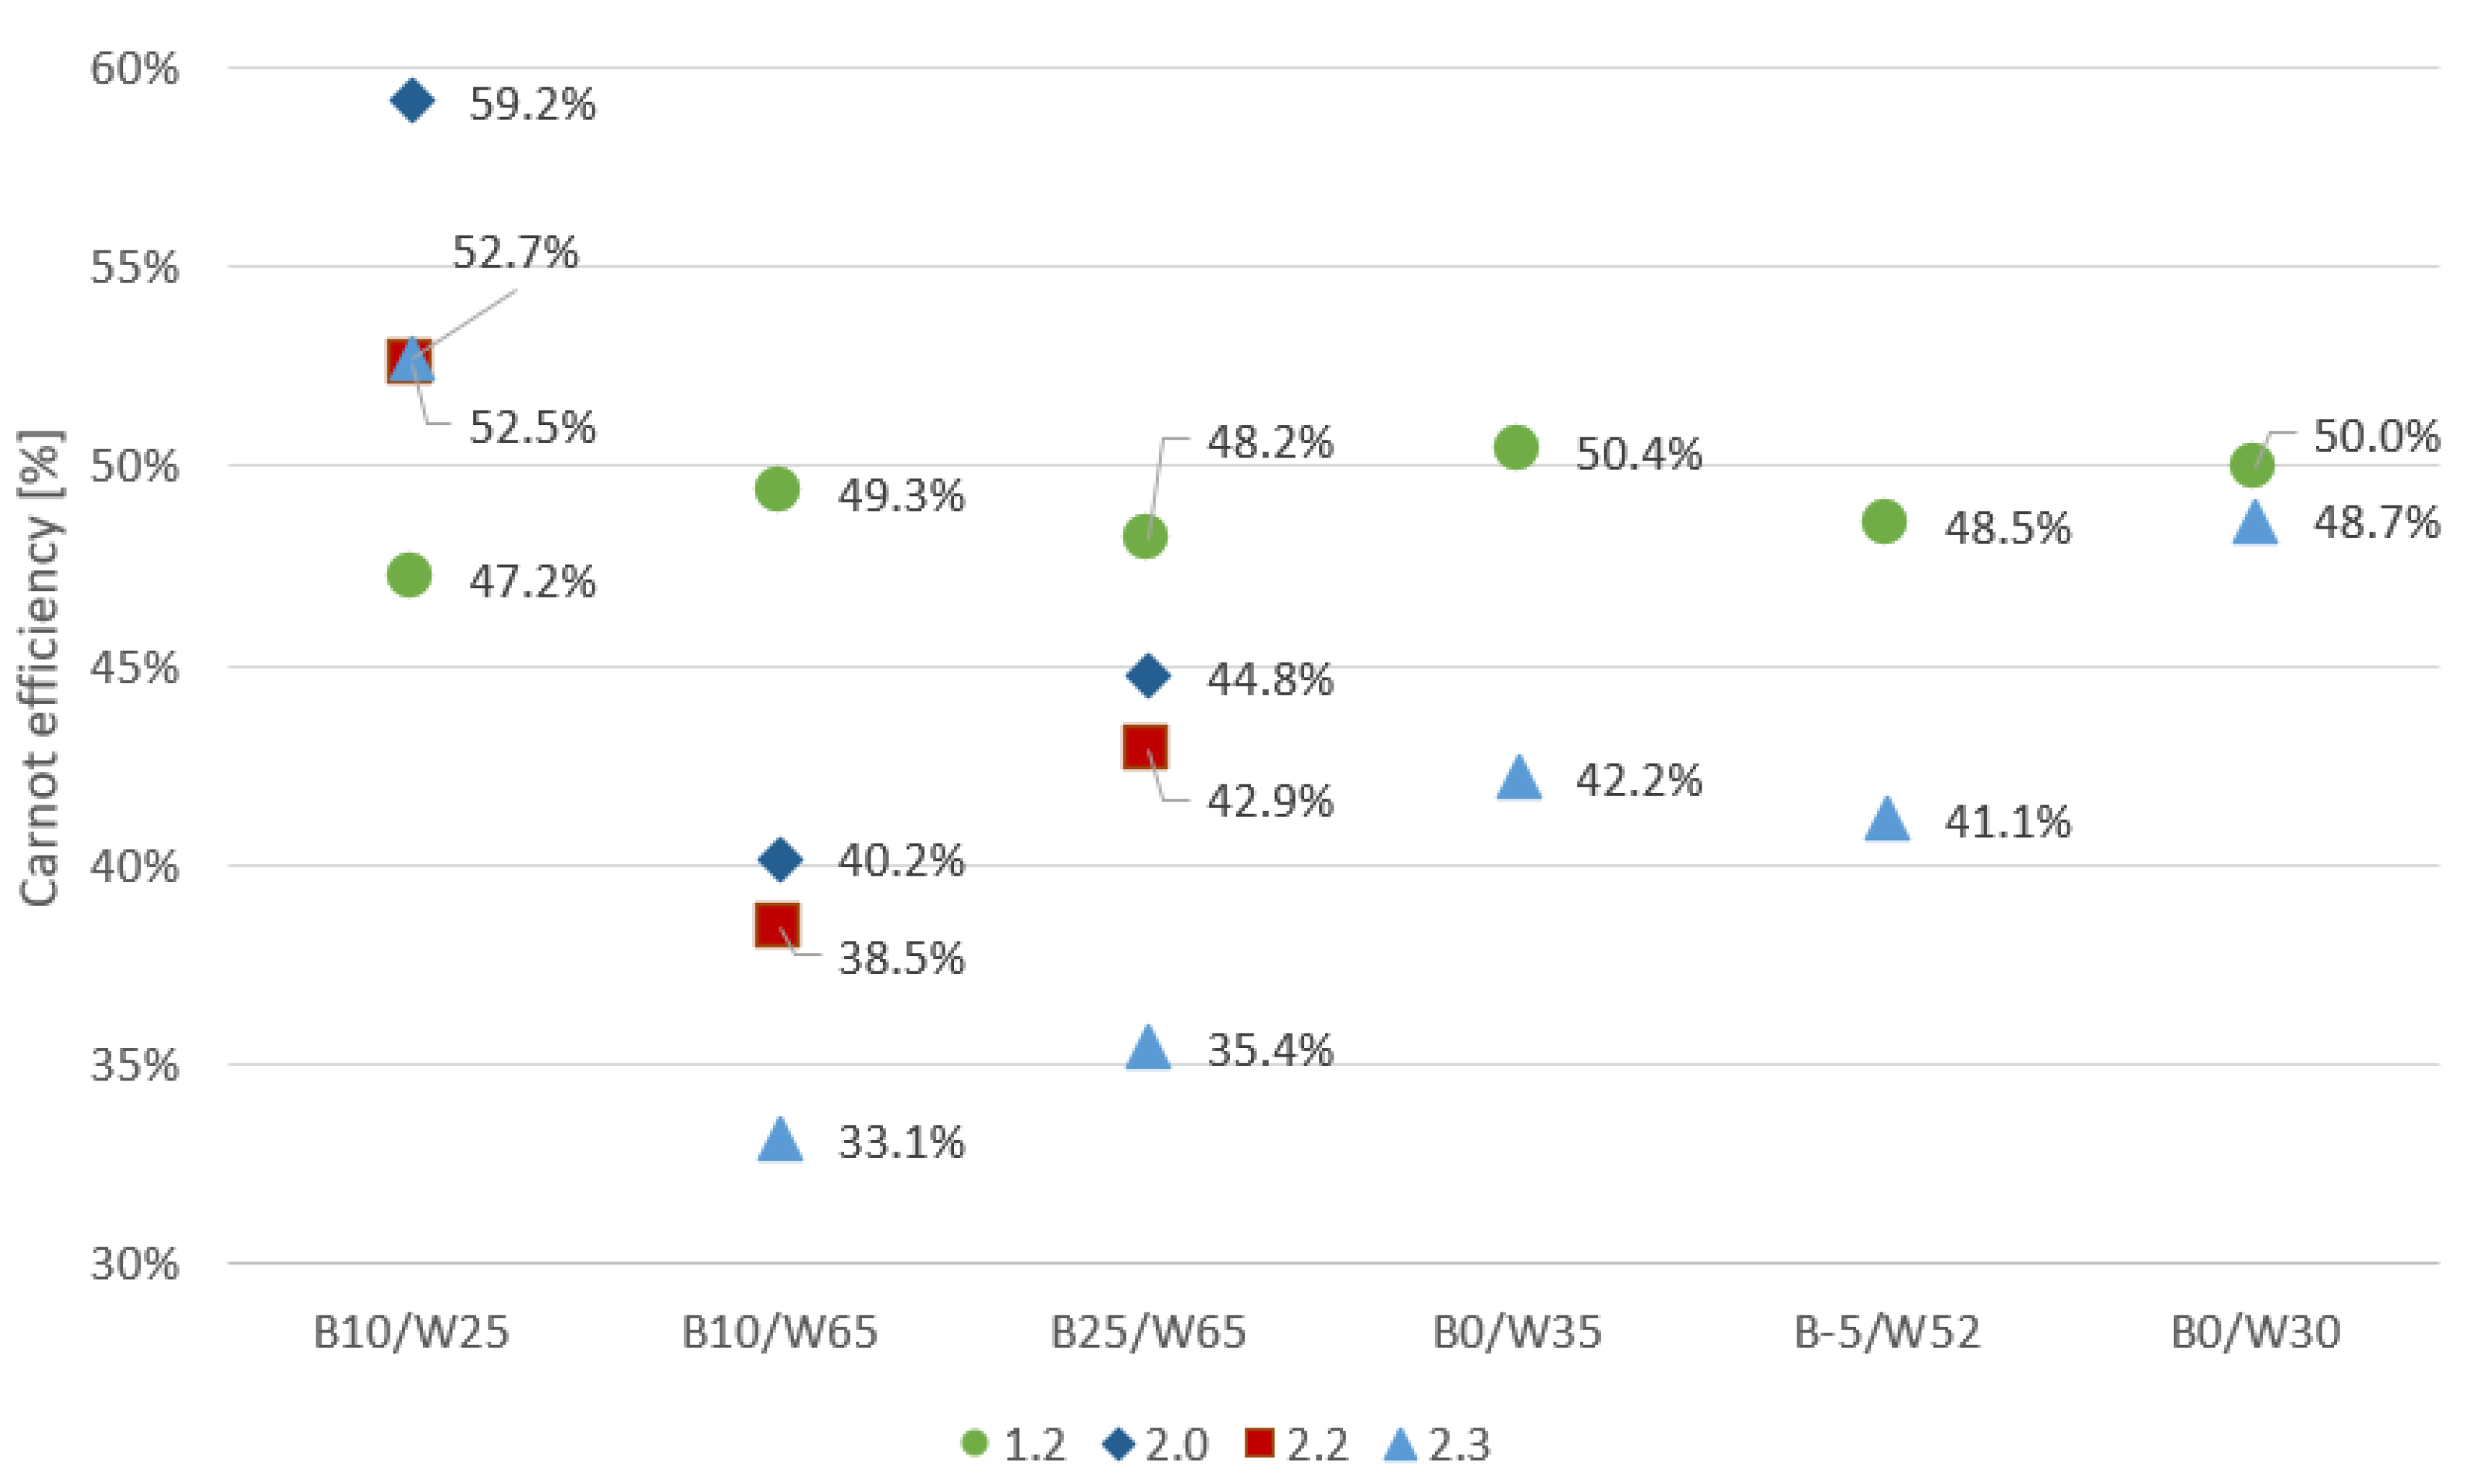
3.3. Carnot Efficiencies

The results for the Carnot efficiencies, as defined in Equation (4), are depicted in Figure 11. Module 2.3 performs badly compared to the other modules, just as in the COP comparison. For all points except B10/W25, 1.2 performs better than the 2.X modules, and the Carnot efficiency is in a range from 47.2 % to 50.4 %. The slight difference between 2.0 and 2.2 indicates that a symmetric configuration on the condenser side yields better performance than an increase in plates in the evaporator.

3.4. Isentropic Efficiencies

The isentropic efficiency helps us to understand how well the compressors used in the study approximate a corresponding isentropic device. Thus, it facilitates the comparison of the presented measurement results independent from compressor displacement. Data supplied by the manufacturers of the piston and rotary compressor are used to derive performance data corresponding to our sink and source characteristics. Moreover, the super-heating and sub-cooling settings of the manufacturer data must be corrected to conform to our application. Nevertheless, they can be interpreted as upper limits to the performance of the implementation of a compressor in a refrigeration circuit.
Figure 12 shows the isentropic efficiencies versus the pressure ratio of condensation to evaporation. For the 2.X modules, the results are far from the expected range of the manufacturer’s data. In particular, at low pressure ratios, the performance peak of the rotary compressor cannot be reconstructed while being significantly better than the piston in that area. On the contrary, module 1.2 is much closer to the optimal compressor performance based on manufacturer data in the range of pressure ratio of 2 to 4. For the use case, when heating with an HSS temperature of 0 °C (4.7 bar for R290), the pressure ratio of condensation to evaporation is 2.6 if floor heating at 35 °C (12.1 bar for R290) is used. Only then does the isentropic efficiency show an increasing deviation from the manufacturer’s data and creates a hump in the measurement data centered around a ratio of 3.5. Still, the reason for this deviation from the expected values cannot be fully explained. In the case of DHW with a slightly decreased HSS temperature of −5 °C (4.1 bar for R290), the pressure ratio is 4.4 for the production of DHW at 52 °C (17.9 bar for R290). If the temperature level of DHW has to be increased further, for example, for hygienic reasons to 65 °C , the pressure ratio of condensation to evaporation will be close to 6. Higher pressure ratios will be measured in a follow-up study. The general trend supports the assessment that rotary compressors perform better at lower pressure ratios.

4. Conclusions and Outlook

In this work, a rack for a modular heat pump system is presented, which allows us to access the heat capacity and performance of each of the modules for different temperature levels and media. A total of up to eight modules can be installed, while currently, the connections are prepared for four different heat pump modules. A main feature of the rack is the varying combinations, which can be easily realized with pre-installed three-way valves, for example, connecting modules in parallel or serial.
Two distinct types of modules were designed and manufactured, namely module 1.2 and 2.X, using a piston compressor and a rotary compressor, respectively. The heating capacity and COP as indicators for performance were compared. This showed that module 1.2 performed better than 2.X for all lifts aside from the operating condition B10/W25. For the rotary compressor modules, module 2.3 performed worse than 2.0 and 2.2, which allows us to conclude that the evaporator with 18 plates was the limiting factor in this design.
The total isentropic efficiency for floor heating and domestic hot water production was above 0.45 for both piston and rotary compressors. Still, the measurements indicate that the piston compressor outperforms the rotary compressor, especially at higher pressure ratios.
One part of the deviation of measurements from manufacturer data can be attributed to thermal losses of the refrigeration and hydraulic piping, which were not insulated. At high flow temperatures and low heating capacities, these losses have an increased impact on the results. In addition, the potential for optimization of sub-cooling and super-heating was identified, which would allow us to achieve an increase in capacity and performance, while the general trend is expected to be maintained.
As the performance data for the piston and rotary compressor as received from the manufacturers were measured at different conditions, some interpretation was necessary to allow a comparison with the measurements in this work. Thus, the compressor data were taken with some degree of uncertainty and interpreted as upper limits to the performance. On the one hand, the rotary compressor performance could not be realized, and the modules performed significantly below expectations. On the other hand, the piston compressor module performance was much closer to the manufacturer’s data. Still, at higher pressure ratio values, the deviation to measurements increased as well.
In future studies, measurements can be extended to higher pressure ratios to include an assessment for extreme applications of the refrigerant circuit at, for example, 3 bar evaporation (−15 °C) and 27 bar condensation (+72 °C). This would allow us to further detail the difference between compressor technologies for the modular heat pump concept. In addition, the newly developed rack for heat pump modules allows us to exploit the modularity in parallel and serial configurations. Therefore, a more sophisticated use of temperature levels reflecting the energy sources available in multi-family houses can be achieved and experimentally evaluated in this setup.

Author Contributions

Conceptualization, S.P., M.L. and C.R.; methodology, M.S., S.F., S.P., C.R. and M.L.; software, S.P., S.K. and M.L.; validation, S.P., M.S., H.M., C.R. and M.L.; formal analysis, S.P., H.M. and M.L.; investigation, S.F., M.S., S.P., H.M., S.K., C.R. and M.L.; resources, S.P. and C.R.; data curation, S.P. and M.L.; writing—original draft preparation, S.P., M.S., M.L. and C.R.; writing—review and editing, S.P., M.L. and C.R.; visualization, S.P., S.F., M.S., M.L. and C.R.; supervision, S.P. and C.R.; project administration, S.P. and C.R.; funding acquisition, S.P. and C.R. All authors have read and agreed to the published version of the manuscript.

Funding

This research was funded by the Austrian Research Promotion Agency (FFG) under grant no. 886973 (program line ‘Stadt der Zukunft’, project ‘Gasthermenersatz’).

Data Availability Statement

Datasets are available on request from the authors.

Conflicts of Interest

The authors declare no conflicts of interest. The funders had no role in the design of the study; in the collection, analyses, or interpretation of data; in the writing of the manuscript; or in the decision to publish the results.

Abbreviations and Nomenclature

The following abbreviations, symbols, and subscripts are used in this manuscript:
DHW    domestic hot water
GTZGasthermenersatz (project name)
HEXheat exchanger
HSSheat source side
HTFheat transfer fluid
HUSheat utilization side
PCBprinted circuit board
PLCprogrammable logic controller
PHEplate heat exchanger
C O P coefficient of performance (-)
Q ˙ heat flow rate (J s−1 = W)
m ˙ mass flow rate (kg s−1)
c p specific heat capacity at constant pressure (J kg−1 K−1)
hspecific enthalpy (J kg−1)
Ttemperature (K)
ppressure (Pa)
η i s , t o t total isentropic efficiency (-)
Ppower (J s−1 = W)
in,outinlet, outlet
condcondenser
elelectrical
wfworking fluid
1–6points in log(p)-h diagram
sisentropic, suction gas
lliquid
ddischarge gas
H high
Llow
EVexpansion valve
H heating module
C/DHW cooling / domestic hot water module

References

  1. IPCC. The Physical Science Basis Summary for Policymakers Working Group I Contribution to the Sixth Assessment Report of the Intergovernmental Panel on Climate Change; IPCC: Geneva, Switzerland, 2021. [Google Scholar]
  2. 8. Bundesgesetz über die Erneuerbare Wärmebereitstellung in Neuen Baulichkeiten (Erneuerbare-Wärme-Gesetz—EWG); Bundeskanzleramt der Republik Österreich: Vienna, Austria, 2024.
  3. The European Parliament; The Council of the European Union. Directive (EU) 2024/1275 of the European Parliament and of the Council of 24 April 2024 on the Energy Performance of Buildings (Recast); European Union: Brussels, Belgium, 2024. [Google Scholar]
  4. Amann, W.; Storch, A.; Schieder, W. Definition und Messung der Thermisch-Energetischen Sanierungsrate in Österreich; IIBW—Institut für Immobilien, Bauen und Wohnen GmbH: Vienna, Austria, 2020. [Google Scholar]
  5. Statistik Austria. Energieeinsatz der Haushalte—STATISTIK AUSTRIA—Die Informationsmanager; Statistik Austria: Vienna, Austria, 2023.
  6. Vollmerv, R.; Wapler, J.; Hess, S. Quellen-Verfügbarkeit für Wärmepumpen-Systeme in Mehrfamilienhäusern im Bestand; Fraunhofer-Institut für Solare Energiesysteme ISE: Freiburg im Breisgau, Germany, 2019. [Google Scholar]
  7. Wimmer, F.; Holzer, P. Gebäudebestand Gasfrei Machen—Untersuchung der Technischen Möglichkeiten, Bestandsgebäude Gasfrei zu Machen, Hrsg. Magistratsabteilung 20 Energieplanung der Stadt Wien; Hrsg.: Vienna, Austria, 2020. [Google Scholar]
  8. Statistik Austria. Tabellenband Wohnen 2020; Statistik Austria: Vienna, Austria, 2021.
  9. Müller, A. Energy Demand Assessment for Space Conditioning and Domestic Hot Water: A Case Study for the Austrian Building Stock. Ph.D. Thesis, Technische Universität Wien, Vienna, Austria, 2015. [Google Scholar]
  10. Brunk, M.; Seybold, C.; Osebold, R.; Beyert, J.; Vosen, G. Dezentrale Wärmerückgewinnung aus häuslichem Abwasser. [Abschlussbericht]; Fraunhofer IRB Verlag: Stuttgart, Germany, 2013. [Google Scholar]
  11. Micha, S. Experimental Investigation of a Modular Heat Pump for Residential Applications. Master’s Thesis, Technische Universität Wien, Vienna, Austria, 2025. [Google Scholar]
  12. Sebastian, F. Experimental Investigation of a Modular Heat Pump with a PCM Storage for Residental Applications. Master’s Thesis, Technische Universität Wien, Vienna, Austria, 2025. [Google Scholar]
  13. Dohmann, J. Thermodynamik der Kälteanlagen und Wärmepumpen; Springer: Berlin/Heidelberg, Germany, 2016. [Google Scholar] [CrossRef]
  14. Baehr, H.D.; Kabelac, S. Thermodynamik, 16th ed.; Springer Vieweg: Berlin/Heidelberg, Germany, 2016. [Google Scholar] [CrossRef]
  15. Dott, R.; Genkinger, A.; Kobler, R. Wärmepumpen Planung|Optimierung|Betrieb|Wartung; Bundesamt für Energie, Dienst Ausund Weiterbildung: Ittigen, Switzerland, 2018.
  16. Bell, I.H.; Wronski, J.; Quoilin, S.; Lemort, V. Pure and Pseudo-pure Fluid Thermophysical Property Evaluation and the Open-Source Thermophysical Property Library CoolProp. Ind. Eng. Chem. Res. 2014, 53, 2498–2508. [Google Scholar] [CrossRef] [PubMed]
Figure 1. Schematic representation of three different heat sources in multi-family houses for refurbishment projects: a thermal borehole (left), and an air–water heat exchanger mounted on the roof (center) or on a wall (right). For connection to the thermal borehole and the roof, an abandoned chimney is utilized.
Energies 18 02455 g001
Figure 2. Hydraulic scheme of the heat pump test stand used for the measurements. The heat pump module to be tested is positioned in the center (11), and the main components are numbered and referenced in the text.
Energies 18 02455 g002
Figure 3. Module GTZ 1.2 (top) and module GTZ 2.0 (bottom).
Energies 18 02455 g003
Figure 4. Schematic of the refrigerant circuit, including positions for pressure and temperature sensors, listed in the table on the right-hand side.
Energies 18 02455 g004
Figure 5. GTZ modules connected with piping and further hydraulic accessories.
Energies 18 02455 g005
Figure 6. Schematics of hydraulic connections of modules to the source (left) and the sink (right). Positions on the rack are denoted as H and C/DHW to differentiate their connection options.
Energies 18 02455 g006
Figure 7. Schematic of the data acquisition setup.
Energies 18 02455 g007
Figure 8. Pressure–enthalpy log(p)-h diagram of the GTZ module for the refrigerant circuit, including a sub-cooling loop at operating point B0/35. Total isentropic efficiency can be calculated by utilizing the difference between the enthalpy before compression at point 1 ( h 1 ) and isentropic compression related to point 2 ( h 2 s ), dividing it by the electric power consumption of the compressor.
Energies 18 02455 g008
Figure 9. Heat capacity comparison of different types of modules.
Energies 18 02455 g009
Figure 10. Comparing COPs of different types of modules. Module 1.2 outperforms module 2.X for all operating points aside from B10/W25. Just comparing the symmetric PHE setups at 20 plates (module 1.2 and 2.0) indicates an advantageous configuration relative to the asymmetric setup.
Energies 18 02455 g010
Figure 11. Comparison of the Carnot efficiency of different types of modules. As in the COP comparison, module 1.2 outperforms 2.X modules in all temperature combinations aside from B10/W25.
Energies 18 02455 g011
Figure 12. Comparison of the total isentropic efficiencies with data provided by manufacturers.
Energies 18 02455 g012
Table 1. Combination of different plate heat exchanger types and numbers of plates (in parenthesises) for each of the heat pump modules reported. The height of PHE Type 1 and PHE Type 2 were different (cf. Figure 3) and adjusted to the different mass flow rates of the compressors.
Condenser (Rows), Evaporator (Columns)PHE Type 1 (20)PHE Type 2 (18)PHE Type 2 (20)PHE Type 2 (22)
PHE Type 1 (20)GTZ 1.2---
PHE Type 2 (18)-GTZ 2.3-GTZ 2.2
PHE Type 2 (20)--GTZ 2.0-
PHE Type 2 (22)----
Table 2. Components used for the hydraulics of the rack.
ComponentManufacturerDescriptionUncertainty
pressure sensorHuba control AG, Würenlos, SwitzerlandTyp 505±0.06 bar
ball valveBelimo Automation Handelsgesellschaft m.b.H, Vienna, AustriaCQC230A-
expansion vesselReflex Winkelmann GmbH, Ahlen, GermanyROM24-
line regulating valvesOventrop GmbH & Co. KG, Olsberg, GermanyHydrocontrol VTR-
temperature sensorsSontec Sensorbau GmbH, Lennestadt, GermanySIL NTC10K±0.25 K
temperature sensorsSontec Sensorbau GmbH, Lennestadt, GermanySIL PT1000±0.31 K
safety valveCaleffi S.P.A, Fontaneto d‘Agogna, Italy312430-
Disclaimer/Publisher’s Note: The statements, opinions and data contained in all publications are solely those of the individual author(s) and contributor(s) and not of MDPI and/or the editor(s). MDPI and/or the editor(s) disclaim responsibility for any injury to people or property resulting from any ideas, methods, instructions or products referred to in the content.

