Article

Thermodynamic Reactivity Study during Deflagration of Light Alcohol Fuel-Air Mixtures with Water

1
Faculty of Energy and Fuels, AGH University of Krakow, 30-059 Kraków, Poland
2
Knowledge Center for Explosion and Hydrogen Safety, Dutch Armed Forces, The Netherlands
3
Faculty of Environmental Engineering, Geomatics and Renewable Energy Kielce, Kielce University of Technology, 25-314 Kielce, Poland
4
Faculty of Power and Aeronautical Engineering, Institute of Heat Engineering, Warsaw University of Technology, 00-661 Warsaw, Poland
*
Authors to whom correspondence should be addressed.
Energies 2024, 17(6), 1466; https://doi.org/10.3390/en17061466
Submission received: 25 January 2024 / Revised: 2 March 2024 / Accepted: 12 March 2024 / Published: 19 March 2024
(This article belongs to the Special Issue Advances in Fuels and Combustion)

Abstract

:
In this paper, a thermodynamic and reactivity study of light alcohol fuels was performed, based on experimental and numerical results. We also tested the influence of water addition on fundamental properties of the combustion reactivity dynamics in closed vessels, like the maximum explosion pressure, maximum rate of pressure rise and the explosion delay time of alcohol–air mixtures. The substances that we investigated were as follows: methanol, ethanol, n-propanol and iso-propanol. All experiments were conducted at initial conditions of 323.15 K and 1 bar in a 20 dm3 closed testing vessel. We investigated the reactivity and thermodynamic properties during the combustion of liquid fuel–air mixtures with equivalence ratios between 0.3 and 0.7 as well as some admixtures with water, to observe water mitigation effects. All light alcohol samples were prepared at the same initial conditions on a volumetric basis by mixing the pure components. The volumetric water content of the admixtures varied from 10 to 60 vol%. The aim of water addition was to investigate the influence of thermodynamic properties of light alcohols and to discover to which extent a water addition may accomplish mitigation of combustion dynamics and thermodynamic reactivity.

1. Introduction

At present, the global energy industry is strongly dependent on fossil fuels [1,2,3,4,5]. Over 80% of global energy production comes from petroleum, coal and natural gas combustion. As the resources of fossil fuels are definitely exhaustible, there is a need to find an applicable solution to substitute the fossil fuels in conventional combustion systems. Moreover, from an ecological point of view, the conventional fuels that are used in both automotive and power industries have a poor impact on the environment and generate environmental pollution. The current condition of the atmosphere requires a limitation in the emission of the factors that are ecologically harmful. Lower alcohols appear to have great potential as a supplement in a mixture with conventional fuels or even as independent fuels in combustion systems that are currently used [6]. All of this has caused a rising interest in the combustion properties of alcohols; however, there is still only a relatively small number of published papers concerning the experimental data. Most of the published results present the overview of the general phenomena of the alcohol combustion process or are mainly focused on the ability of alcohol use in conventional combustion systems.
Sarathy et al. [7] reviewed the fundamental combustion chemistry of alcohol fuels, considering various experimental setups. Alcohols blend well with petroleum fuels due to similar boiling points and offer benefits like high octane ratings and improved fuel economy. Alcohols could be particularly effective in advanced combustion engines. Li’s exploration of alcohol–air mixtures revealed that alcohols show promise in combustion dynamics, with parameters like peak explosion pressure and the rate of pressure rise being sensitive to temperature changes.
Alcohols can also be successfully applied in modern LTC (low-temperature combustion) and DI SI (direct injection, spark ignition) engines in which the high sensitivity fuels can be of great importance. These authors focused on the chemical kinetics of alcohol fuels during combustion. There are many processes during combustion, such as the reactions in the flame region, resulting in the heat release, reactions that control the ignition process and combustion pollution formation, which can take place when the temperature and the pressure rapidly changes. These processes can strongly depend on the chemical kinetics, ruled by the temperature, pressure and concentrations of reactants and products. Therefore, the complex kinetic chemical reactivity models are also needed to understand the thermodynamic properties of alcohols as good energy fuels.
The development of the alcohol combustion models requires the understanding of the basis of the hydrocarbon oxidation process in closed combustion systems like vessels, chambers, engines, turbines, etc. [7]. Li and others investigated the explosion characteristics of alcohol–air mixtures [8]. Explosion characteristics of five alcohol–air mixtures were investigated, including the following light alcohol fuels: ethanol, 1-butanol, 1-pentanol, 2-pentanol and 3-pentanol. They performed the combustion experiments under several different initial conditions as follows: three temperature values, three pressure values and equivalence ratios (ϕ) between 0.8 and 1.8. The experimental data was composed of a constant volume cylinder vessel with centrally located electrodes, a data acquisition system and an inlet and exhaust system. Experiments showed that during the thermodynamic process (combustion dynamics), the fundamental combustion reactivity parameter, like peak explosion pressure (Pmax), decreases with the temperature increasing, while the other parameter, like the maximum rate of pressure rise (dP/dt)max, varies and the time intervals between the ignition and peak explosion pressure decrease.
The adiabatic flame temperature and the flame speed have their maximum values at the alcohol mixture equivalence ratio of 1:1, which can correspond to the peak values of the explosion pressures at the equivalence ratios of 1.0–1.2. The maximum rate of explosion pressure rise and the deflagration index KG are sensitive to the temperature changes as the key important parameters of combustion reactivity. The whole time period of the combustion phenomenon increases with the decrease in temperature and the increase in pressure, while the flame speed decreases.
Among all pentanol–air mixtures, 1-pentanol gives the largest flame speed and the highest adiabatic temperature and yields the higher Pmax and also (dP/dt)max and KG. Among the ethanol, butanol and pentanol mixtures with air, ethanol gives the highest (dP/dt)max while 1-pentanol gives the lowest, but the difference is relatively small. Then, the value of Pmax decreases monotonically in rich fuel mixtures of pentanol, butanol and ethanol. For lean mixtures, the ethanol gives the lowest adiabatic temperature and the highest flame speed [8].
Weber and others focused on the auto-ignition of n-butanol [9]. The goal of their study was to provide the auto-ignition data, as another fundamental thermodynamic reactivity property, of n-butanol at elevated pressures and low temperatures. Auto-ignition delay measurements were performed in a rapid compression machine (RCM), which compresses mixed fuel and oxidizer to a given temperature and pressure (over 25–35 ms). The uncertainty in the compressed temperature is dependent of the initial conditions of the experiment. It was found that the ignition delay decreases monotonically with the increase in compressed temperature. Two-stage ignition was not noted. The total uncertainty in the compressed temperature was about 0.7–1.7%. The reactivity increase due to an increasing equivalence ratio (due to an increasing fuel mole fraction) was noted. The uncertainty is estimated at about 5 ms in the ignition delay time. Results demonstrate that the higher the pressure of the experiment, the shorter the ignition delays are. The fuel and oxygen concentrations can decrease the ignition delay time [10].
Zhu and others investigated the ignition delay times of 1-butanol using two methods as follows: a conventional one and the constrained-reaction-volume strategy [11]. The 1-butanol-O2-N2 ignition delay times were measured, at various temperatures, pressures and equivalence ratios, behind the shockwaves. The well-known Stanford University high-purity and high-pressure shock tube (HPST) was used. Pressure during ignition was recorded by five transducers and time-interval counters measured the incident shock speed. They observed that while using the conventional filling method, at the highest temperature (1014 K), the pressure trace was flat, and then rapidly and smoothly rose exponentially to ignition (sharp or strong ignition). At the lowest temperature (792 K), the pressure trace was flat for only 2 ms and then slowly rose to ignition (mild ignition). There were multiple rumps or humps at the pre-ignition pressure rise that can be regarded as a mild-to-strong transition ignition mode. Such pre-ignition effects are pressure dependent.
Experiments performed with the use of the CRV showed that the energy released during chemical induction dissipates instead of creating a pressure ramp—an absence of any detonation such as pressure ringing. The ignition delay time was longer than in the conventional-filling experiment and remote ignition did not occur. The CRV approach enables the unambiguous, quantitative modelling of the ignition delay time, using P, H and gas-dynamic constraints. Conventional-filling experiments with pre-ignition perturbations are difficult to interpret and it is uncertain which gas-dynamic model to use in simulations. The CRV experiment concept resolved this problem. There are more confident comparisons of data with simulations from existing 1-butanol detailed reaction mechanisms.
Unlike fossil fuels, ethanol is a renewable fuel that can be produced from many raw materials such as corn, cassava, sugarcane and waste biomass materials. Furthermore, ethanol has a higher miscibility with diesel through using an emulsification technique [12]. It is reported that the diesel–methanol dual-fuel combustion can not only reduce CO2 emissions, but also decrease NOx and particulate matter (PM) emissions at most operating conditions [13,14].
Overall, extensive experimental and numerical data on the thermodynamic and reactivity properties of light alcohols is needed. This knowledge could guide the energy market towards safe and environmentally friendly use of alcohols in various industries. There’s also a gap in understanding the reactivity of alcohol–air mixtures at very low equivalence ratios, which could have significant environmental benefits when used as additives to traditional fuels.

2. Experimental Study

All experiments were conducted in the 20 L combustion testing vessel shown in Figure 1. The vessel enables us to investigate the deflagration mode of combustion, often called the “explosion phenomenon” as well as associated explosion parameters of alcohol–air mixtures, including explosion pressure (Pex), maximum rate of explosion pressure rise (dp/dt)max or explosion delay time (tdel). Where:
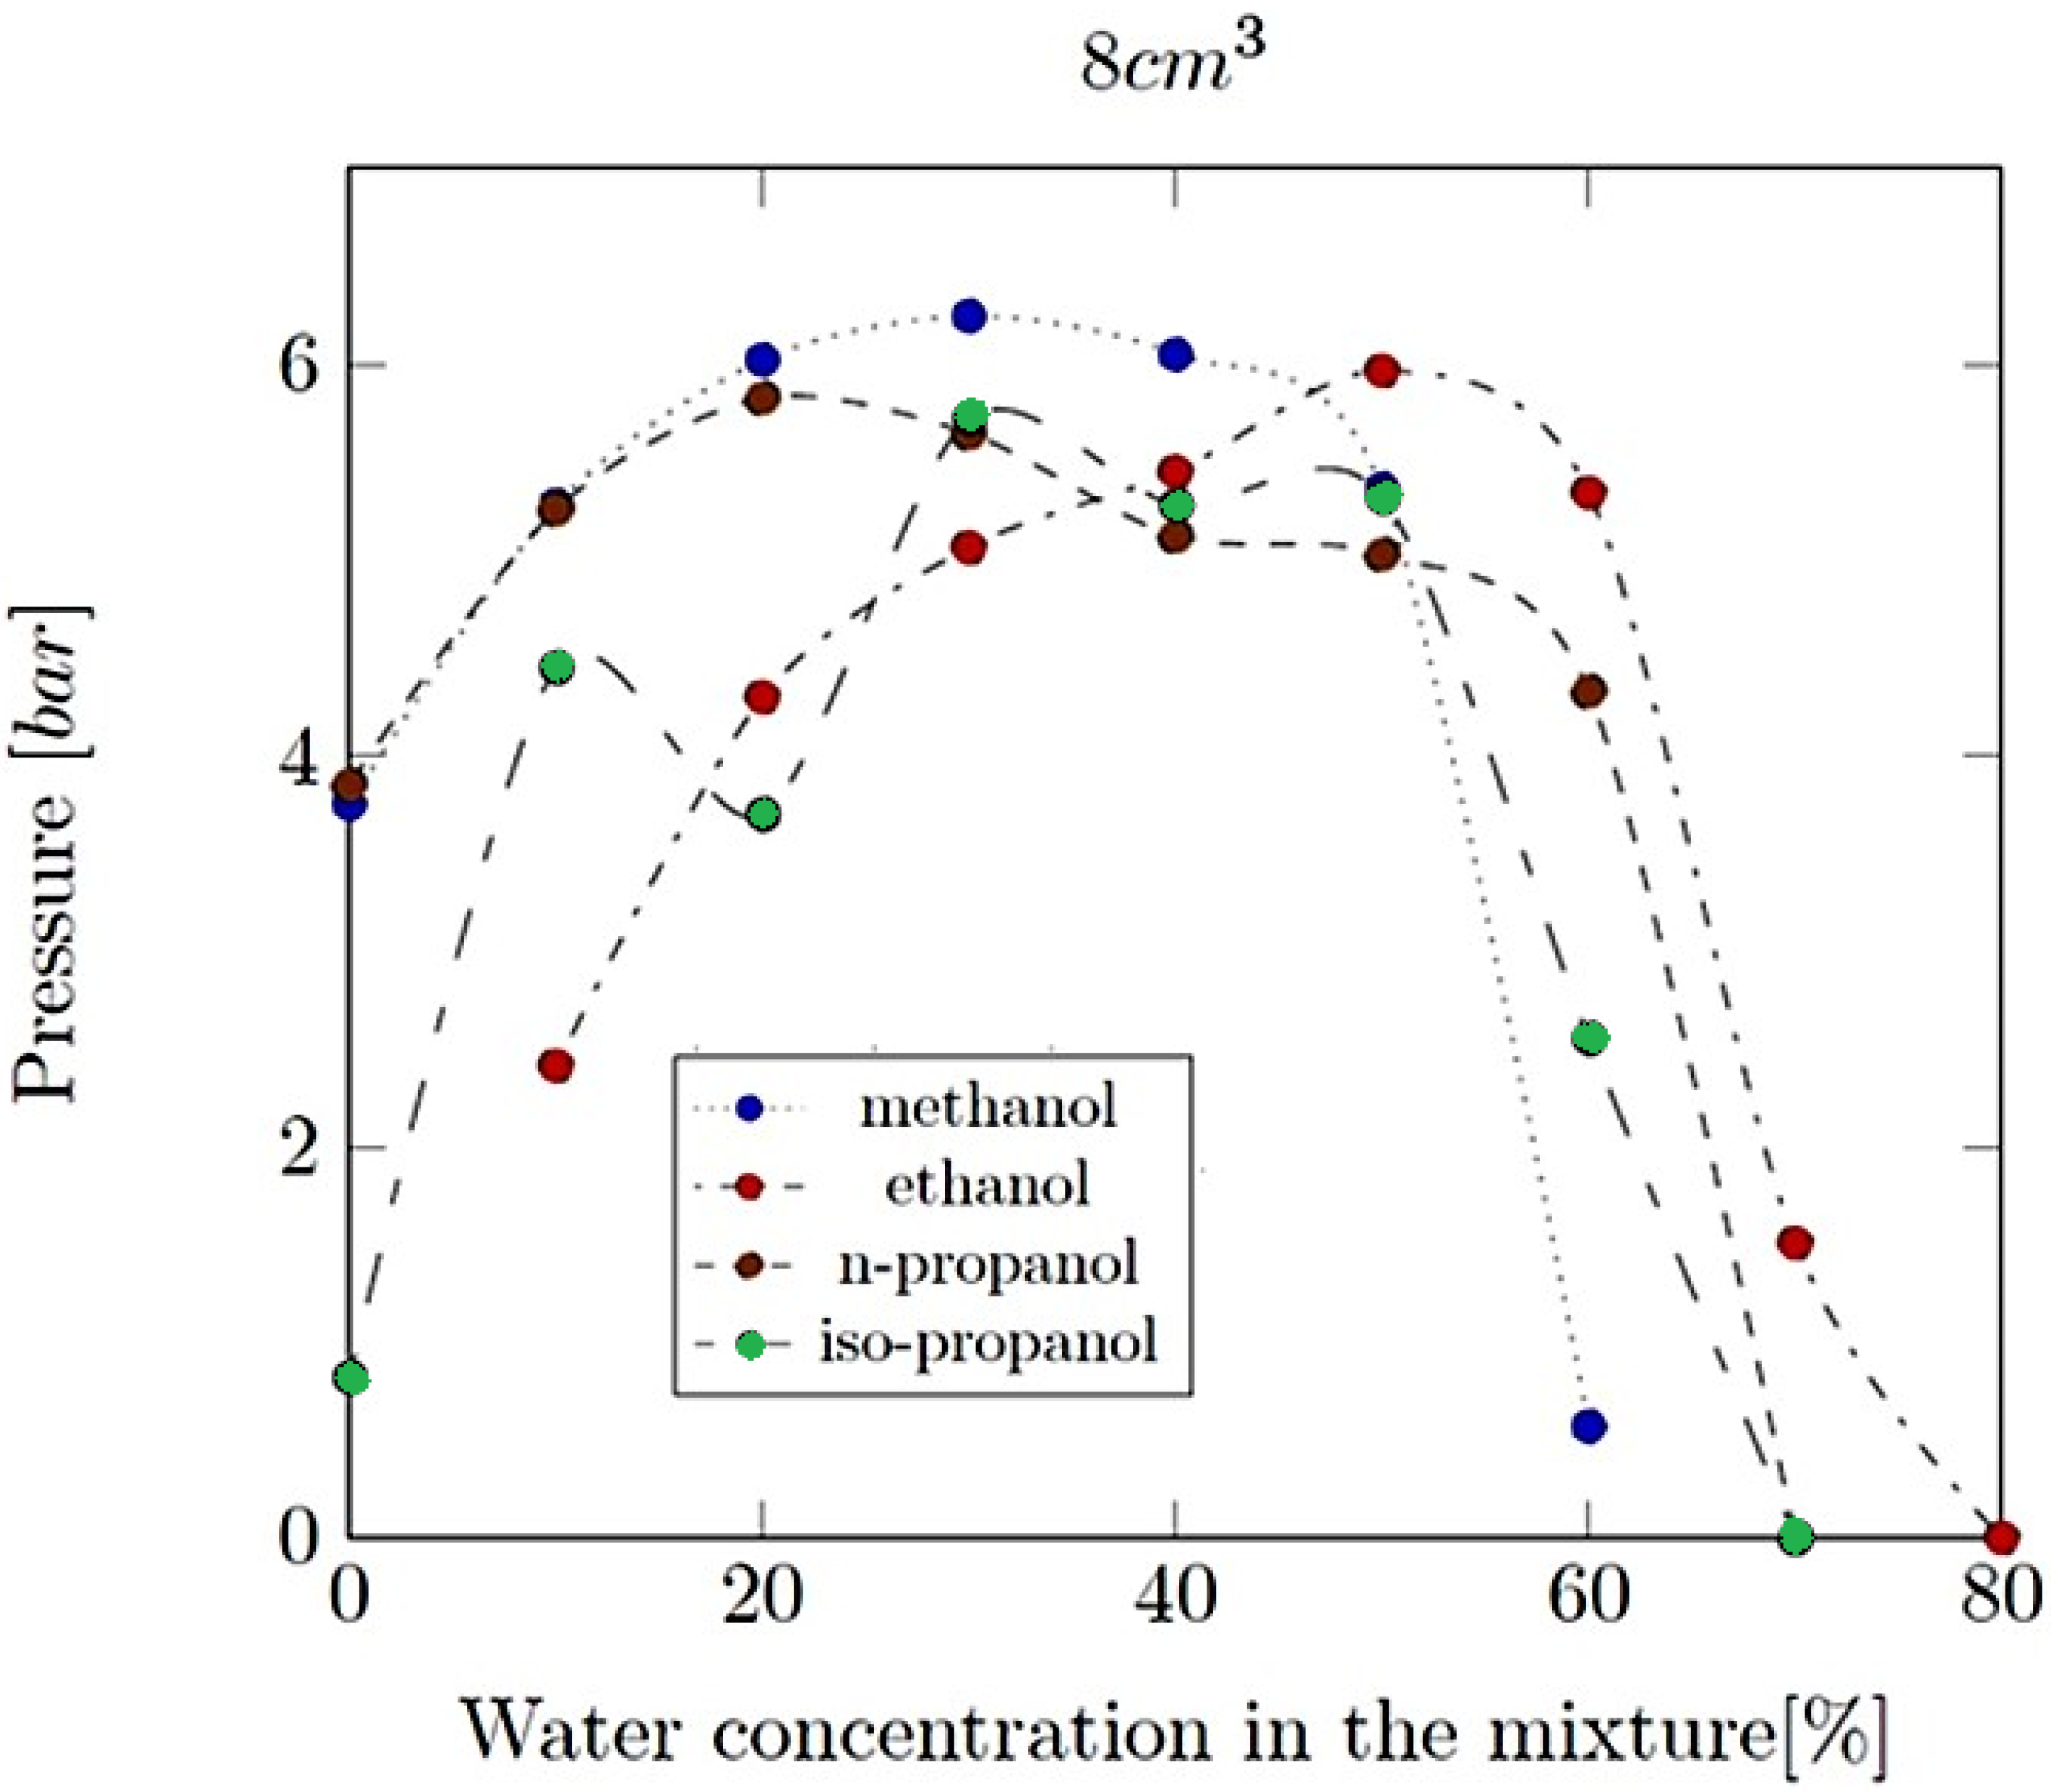
Explosion pressure (Pex): This is typically the peak pressure reached during the explosion, measured relative to the initial atmospheric pressure. It is an excess pressure that is additional to the atmospheric baseline.
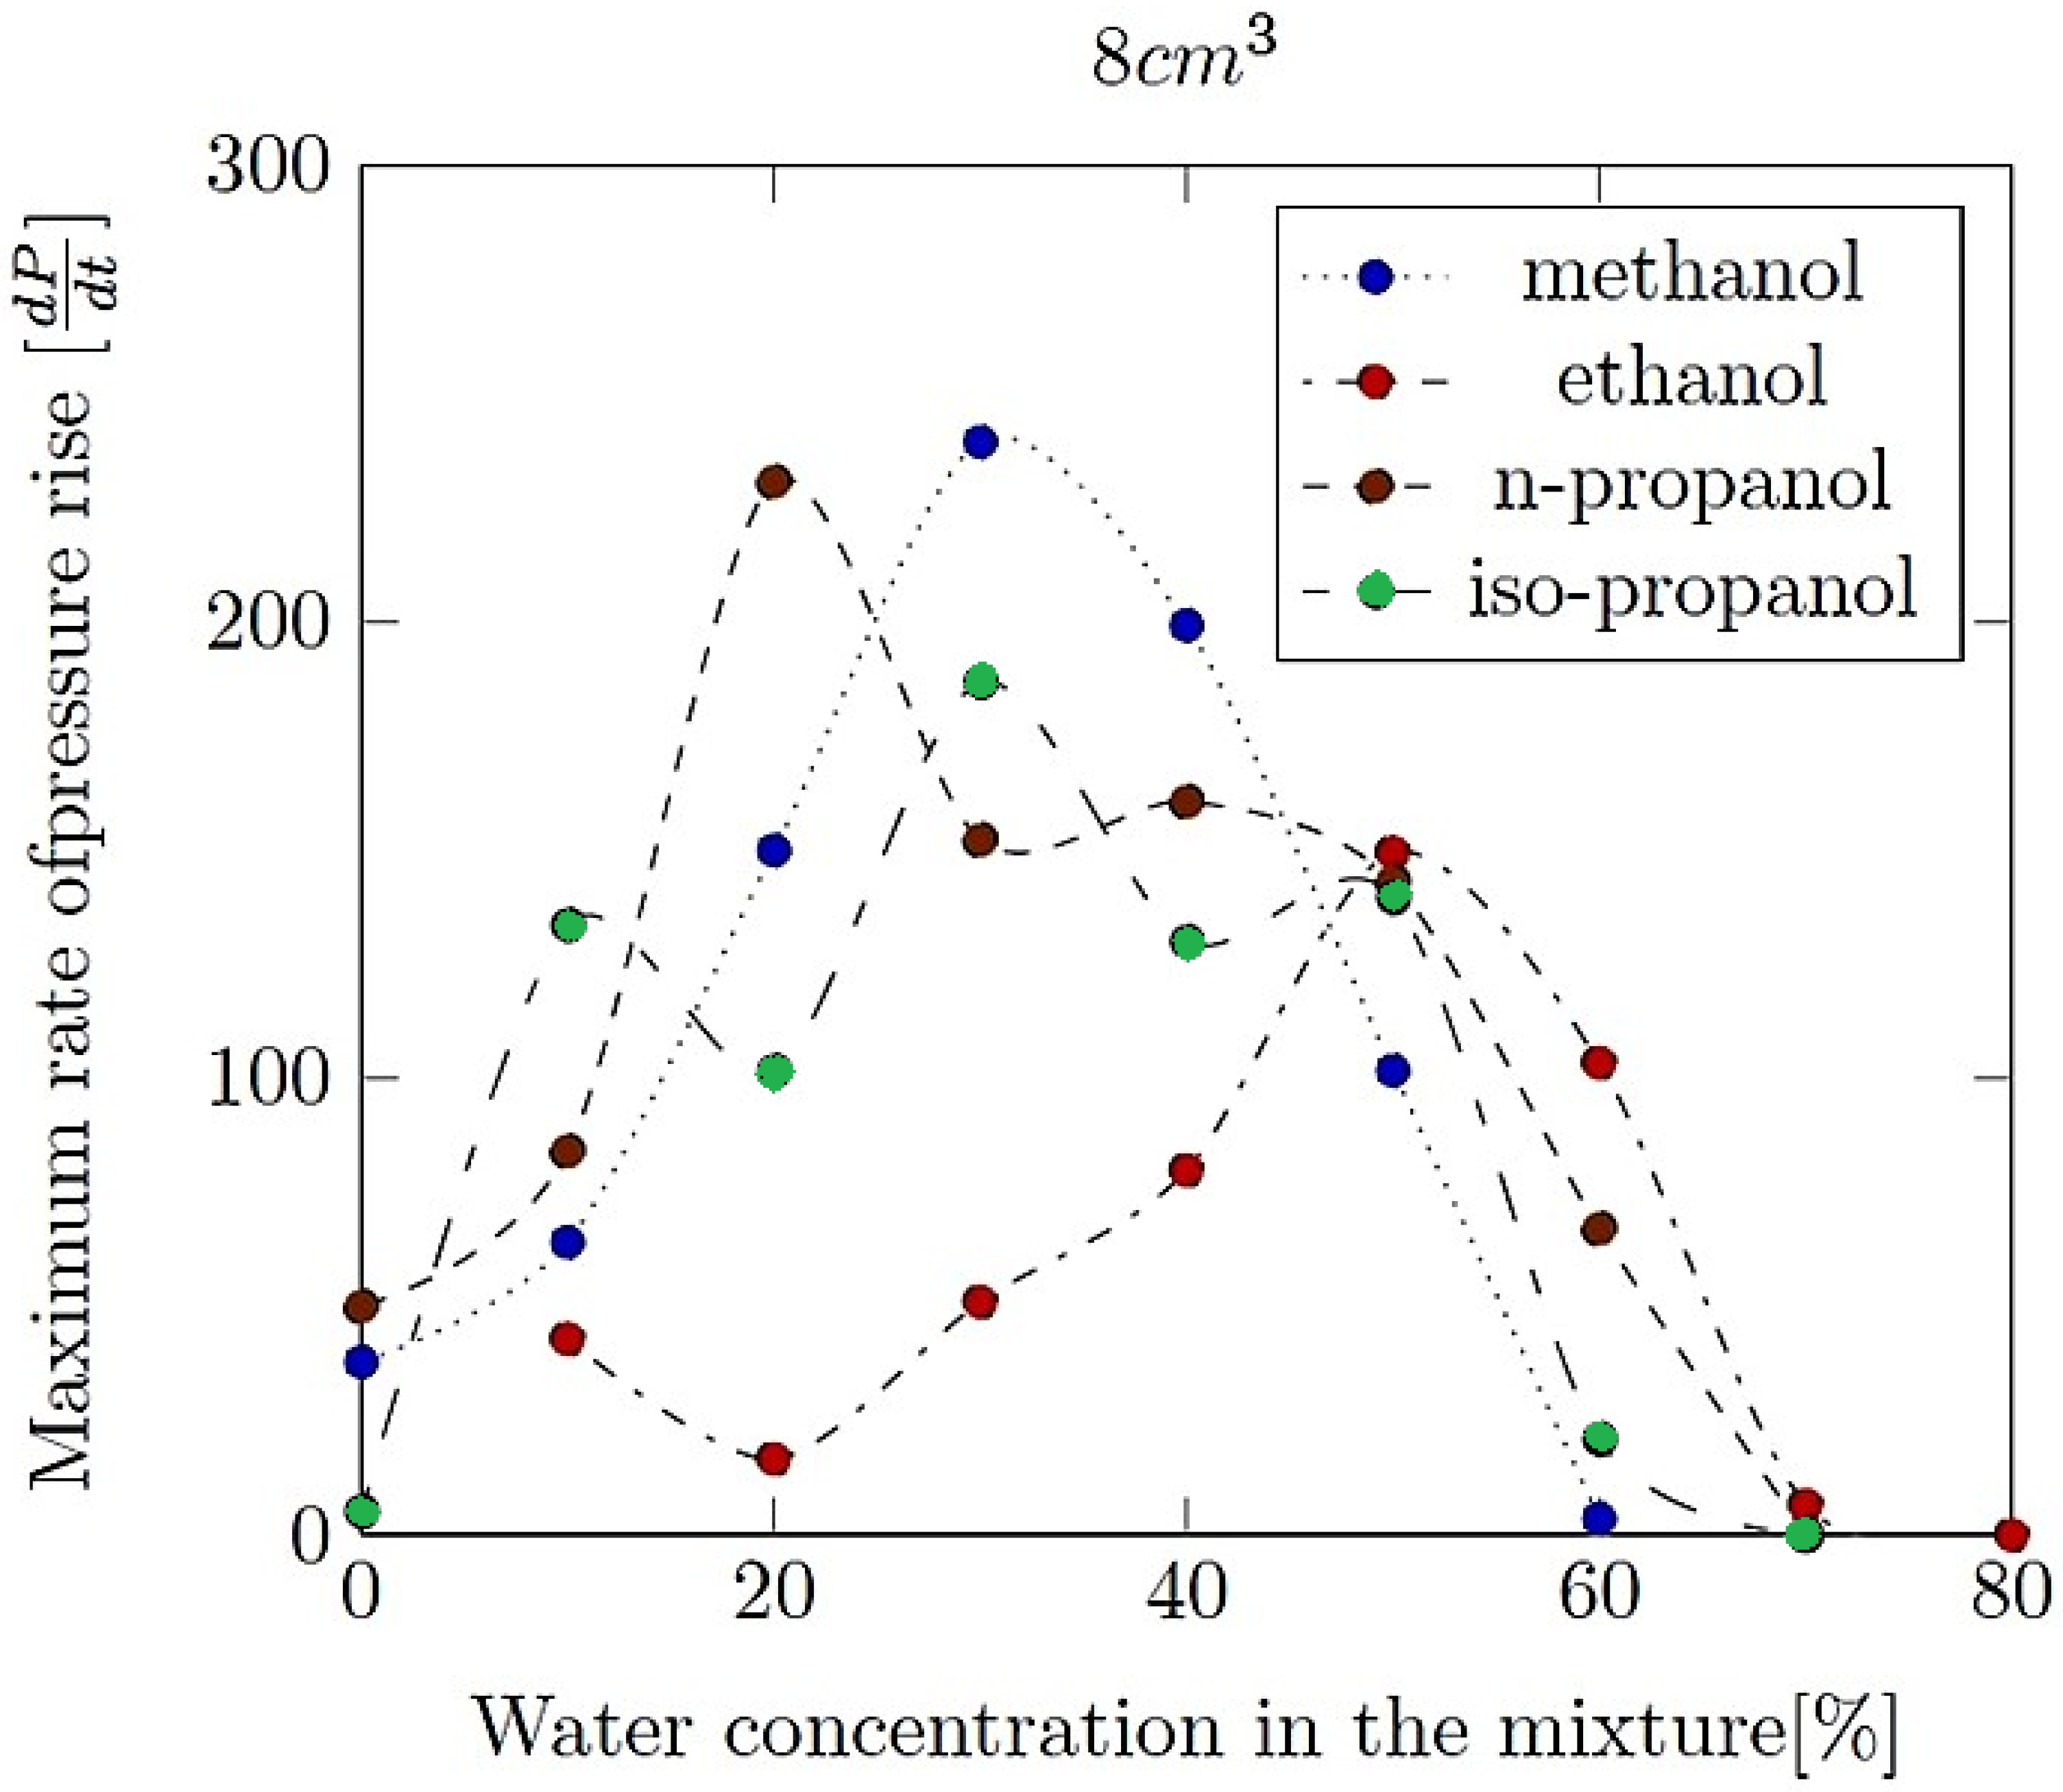
Maximum rate of pressure rise (dP/dt)max: This is the highest rate at which pressure increases inside the vessel or engine during the combustion event. It is often associated with the intensity of the explosion and is a critical parameter for safety and engine design.
Explosion delay time (tdel): This is the time interval between the initiation of the combustion process (such as the introduction of a spark or reaching the auto-ignition temperature) and the occurrence of the maximum explosion pressure. It reflects the reactivity of the fuel–air mixture and is influenced by the composition of the mixture, the temperature, the pressure and the presence of any diluents like water vapour.
The vessel was equipped with an ignition system including an exploding wire, a pressure measurement system comprising the pressure sensor and the pressure signal recording system as well as a temperature measurement system with two thermocouples: one at the bottom plate and one at the vessel wall. It was also equipped with a vacuum pump, a device for magnetic mixing mounted near the top of the vessel and safety measures to prevent premature ignition during the preparation of combustible mixtures.
The combustion vessel allowed deflagration (explosion) experiments to be carried out even at initial temperatures of up to 393.15 K. At this temperature condition, the combustion vessel is capable of withstanding the maximum explosion pressure of 16 bar (the design pressure is 20 bar). Experimental data were recorded at a sampling rate of 150 kHz. The measurement range of the dynamic pressure sensor was 13.8 bar. Pressure and temperature data were recorded and processed by ANKO dedicated software (ANKO FLDplotter 2.0), involving data acquisition. The combustion vessel was equipped with an injection device to permit a liquid sample into the testing vessel. Measurements were carried out with initially quiescent combustible mixtures at initial conditions of 323.15 K and 1 bar. The air was used as the oxidizer and the light alcohol samples tested were as follows:
  • methanol, ethanol, n-propanol and iso-propanol at ϕ = 0.3–0.7;
  • mixtures of alcohols and water, such that the volumetric content of the latter ranged from 10 to 60 vol%.
Liquid light alcohol samples were admitted into the combustion vessel mixed with air, including ϕ = 0.3–0.7 as determined at experimental conditions. Specific details on the samples, their composition and volumetric water content are given in Table A1. Each sample was tested at least three times. The procedure to create initially quiescent combustible mixtures in the combustion vessel was strongly followed. First, liquid sample volumes of 4 cm3 (ϕ = 0.3), 6 cm3 (ϕ = 0.5) and 8 cm3 (ϕ = 0.7), including alcohol–air mixtures as well as alcohol–water–air mixtures were rendered at initial experimental conditions. Next, the combustion vessel was heated up to a temperature of 323.15 K and evacuated to such an extent that the pressure became less than 1 millibar. Also, the dedicated injection device was applied to provide the liquid samples of light alcohols to be placed at the bottom of the combustion vessel. The heating plate was mounted and kept at a temperature of 333.15 K. The magnetic mixing device was also deployed for at least 3 min to allow the liquid sample of light alcohols to evaporate. The heating plate’s temperature was decreased to 323.15 K and the air was slowly administered to bring the pressure in the testing vessel to a pressure of 1 bar. During this step, the magnetic stirring device was continuously used to ensure thermal homogeneity throughout the combustion vessel and to assist with mixing within the combustible mixtures.
After disengaging the magnetic stirrer, a time span of at least 5 min was permitted to elapse prior to ignition. A spark was deployed to ignite the combustible mixtures to the deflagration mode of the combustion process (explosion phenomenon). The pressure development during the combustion reaction dynamics was measured by means of a piezoelectric pressure transducer while the pressure signal was recorded at a sample rate of 150 kHz by the data acquisition system. The combustion vessel was properly cleaned and thoroughly flushed with air after each experiment. All experimental combustion dynamics curves thus experimentally obtained are presented in Figure 2.
Nevertheless, there are also some exemplary plots of thermodynamic reactivity parameters during the experiments of tested alcohols, including the explosion pressure (Pex), the maximum rate of pressure rate (dP/dt)max and the explosion delay time (tdel) and also the influence of water addition on thermodynamic reactivity of alcohol–air mixtures. The below figures were created based on the arithmetic mean of the values measured during the tests of each volume sample (three times). Our plots show the dynamics of the deflagration mode of the combustion phenomenon in a closed vessel, indicating that some factors can strongly influence the thermodynamic reactivity of alcohol–air mixtures as well as with water addition.
Methanol–water mixtures appeared to be combustible in the range between 0% and 60% of water addition, except for the 4 cm3 samples. The exemplary profile of the pressure during the experiment is shown in Figure 2. Usually, the pressure runs during the test of a certain sample were similar, with several exceptions during the test of extreme amounts of water addition and volumes of alcohol samples. The explosion pressure of 6.88 bar was reached during the test of 4 cm3 (ϕ = 0.3) of pure methanol–air mixture. The maximum rate of pressure rise of 365.29 bar/s was observed during the same reaction, which indicates that this is the most reactive one between all methanol–water mixtures. The reaction of 4 cm3 of pure alcohol–air mixture appeared to be the most reactive, where the delay time was about 69 ms. The dependence of the reaction delay times on the water addition in methanol–air mixtures is illustrated in Figure 3.
The explosion delay time values of methanol–air mixtures (ϕ = 0.3) increased with an increase in water concentration. For the 6 cm3 samples (ϕ = 0.5), tdel reached the minimum in 30% of water addition in the mixture and for the 8 cm3 samples (ϕ = 0.7), tdel is the minimum when there is 20% of water concentration in the mixture. The ethanol–water mixtures appeared to be combustible in the range between 0% and 60% of water addition.
The exemplary profiles of the combustion pressure during the experiment are shown in Figure 4.
Usually, the pressure profiles during the test of certain ethanol samples were similar, except for several exceptions during the test of extreme amounts of water addition and volumes of samples. The results obtained during the tests of 8 cm3 of pure alcohol (ϕ = 0.7) were random and only one test qualified as the explosion phenomenon (with the overpressure more than 0.5 bar). Thus, the estimation of the explosion delay time or Pex and (dP/dt)max is meaningless. The explosion pressure of 6.70 bar was reached during the test of 4 cm3 of pure ethanol (ϕ = 0.3). The maximum rate of pressure rise of about 260.05 bar/s was for the same mixture but with 10% water content, which indicates that it was the most reactive one between all ethanol–water mixtures. The reaction of 4 cm3 of 10% water mixture appeared to be the most reactive one, with the tdel about 79 ms.
The dependence of the reaction delay times on the water addition of the ethanol–air mixtures is shown in Figure 5. In the case of the 4 cm3 samples of n-propanol (ϕ = 0.3), the reaction delay time increases with the increase in the water concentration in the sample. For the 6 cm3 of n-propanol samples (ϕ = 0.5), the tdel reached a minimum at 30–40% of water concentration. The explosion delay time decreases with the increase in the water concentration in 8 cm3 of n-propanol samples (ϕ = 0.7). The exemplary profiles of the pressure are shown in Figure 6.
Usually, the pressure profiles during the test of certain samples were similar, except for several tests with the extreme amounts of water addition and volumes of samples. The explosion pressure of n-propanol–air mixtures was 6.57 bar, including the equivalence ratio ϕ = 0.3. The maximum rate of pressure rise of 260 bar/s was observed for ϕ = 0.3. It indicates that this mixture was the most reactive one of all n-propanol–water mixtures tested during this study.
The reaction of 6 cm3 of 10% water mixture appeared as the most reactive one, and the delay time was about 81 ms. The dependence of the reaction delay times on the water addition in the samples is shown in Figure 7. In the case of lower volumes of iso-propanol–air mixtures, the tdel increased when the water concentration increased. In the case of the higher volumes of iso-propanol–air mixtures, tdel initially decreased, then remained constant and finally decreased again with 40% of water addition. The exemplary profiles of the pressure for iso-propanol–air mixtures are shown in Figure 8.
The maximum explosion pressure was recorded as 5.87 bar for 4 cm3 of 10% water mixture. The maximum rate of pressure rise was observed as 248 bar/s for ϕ = 0.3. This indicates that the iso-propanol–air mixture was the most reactive one of all n-propanol mixtures. The reaction of 4 cm3 and 10% water mixture appeared to be the most reactive one, with the tdel about 88 ms. The dependence of the explosion delay time on the water addition is shown in Figure 9. In the case of lower volumes of iso-propanol mixtures, the tdel increased when the water concentration increased. For higher volumes, the tdel initially decreased, then reached a minimum at 30% of water addition and then finally increased.
Every profile of the explosion pressure and the maximum rate of pressure rise was prepared as the arithmetic average of the experimental results for each alcohol–air mixture. From Figure 10, it can be observed that for methanol–air mixtures with ϕ = 0.3, the highest explosion pressure was recorded.
Experimental results of the Pex of all mixtures with ϕ = 0.3 are similar, except for the explosion pressure of iso-propanol, which is slightly lower than the other results. In general, the values of the Pex of ethanol–water mixtures are the highest for all variants of water concentration. The Pex of the methanol–air mixtures decrease the fastest with the water addition increasing. In the case of all propanol–water mixtures, the results of the explosion pressure of n-propanol are slightly higher than those of the iso-propanol. This can be found as the fundamental reason of thermodynamic reactivity difference between propanol–air mixtures. The results of maximum rate of pressure rise for the mixtures with ϕ = 0.3 are shown in Figure 11. The highest (dP/dt)max values were reached during the thermodynamic reaction of methanol–air mixture with no water. However, the (dP/dt)max of the methanol–water mixtures is very sensitive to the water addition and sharply decreases when the water concentration increases. For the results of ethanol–air mixtures, the (dP/dt)max values appear to be the highest among the maximum rates of pressure rise of all alcohol–air mixtures, with ϕ = 0.3.
Figure 12 shows a comparison of tdel results. Between 0 and 20% of water content, the tdel values are similar for all alcohol–air mixtures. Then, the tdel starts to increase. The smallest values are obtained for the ethanol–water mixtures.
Figure 13 shows the explosion pressure results of all alcohol–air mixtures, with ϕ = 0.5. This shows that the peak explosion pressures of methanol and ethanol decrease with increasing water addition. For n-propanol and iso-propanol with no water, the peak values of Pex are the lowest ones. Between 0 and 30% of water addition, the ethanol–air mixtures reach the highest Pex for all tested alcohol–air mixtures. Experimental results also clearly show that for alcohol–air mixtures with 50–60% of water addition, the highest Pex values appear for the iso-propanol–air mixtures and the lowest for the ethanol–air mixtures.
Figure 14 shows the results of the maximum burst pressure rise rate for all alcohol–air mixtures with ϕ = 0.5. Between 0 and 30% of the water content in the mixtures, the (dP/dt)max of methanol–air mixtures are the highest, and the lowest values are for the ethanol–air mixtures. But between 30 and 70% of the water content, the above relations are opposite. This is also a very important observation for the thermodynamic reactivity of these alcohols, where the number of C and H in the chemical structure is of great importance. The unexpected low value of (dP/dt)max of the 20% of the water content in iso-propanol–air mixtures can be probably assumed as a random error during the experiments, because these results do not fit to any thermophysical or chemical reactivity theories. For all alcohol–air mixtures, the water addition also increases the maximum rate of explosion pressure rise.
Figure 15 shows the explosion delay time results for all mixtures tested. The lowest values appear for methanol–water mixtures, especially when testing alcohol-rich samples. When there is 30% of water addition in mixtures of an equivalence ratio of 0.5, values of the explosion delay time for all alcohols are extremely close to each other.
The values of explosion pressure for 8 cm3 samples (ϕ = 0.7) are shown in Figure 16. Ethanol has the widest range of flammability, because even the 70% of water addition samples thermodynamically reacted as the deflagration mode of combustion. In up to 40% of water addition, the methanol–air mixtures reach the highest explosion pressure, but then they start to decrease. For ethanol–air mixtures, the situation is quite the opposite. For all alcohol–air mixtures with ϕ = 0.7, the water addition causes the explosion pressure to increase relatively the same as the Pex of the pure substance.
In Figure 17, some scatter in the values of the maximum rate of pressure increase during the combustion of the 8 cm3 samples is observed (ϕ = 0.7). The (dP/dt)max values are mostly the lowest for the ethanol–water mixtures. The (dP/dt)max of the methanol–water mixtures monotonically increases with the water addition increase until the 30% of water concentration in the mixture and then monotonically decreases. It is much more complicated in the case of the n-propanol and iso-propanol samples. In general, for all alcohol–air mixtures, it is observed that the increase of the (dP/dt)max values, together with the water addition, increase.
For the tdel results for all alcohol mixtures at ϕ = 0.7, all of these values are quite similar to each other when the water addition reaches up to 50%. In the case of alcohol-rich mixtures, tdel is the shortest for the n-propanol mixtures. The idea of our experiments was to investigate the thermodynamic reactivity of alcohol–air mixtures, including water addition. In order to look more closely at the chemical composition of alcohol–water–air mixtures, it is necessary to perform some kind of reactivity calculation based on the same initial conditions. Therefore, a thermodynamic analysis of the liquid-phase composition of alcohol–water mixtures was also prepared based on the experimental results, as well as an analysis of the density of liquid samples, the excess volume of liquid mixtures and vapour pressure calculations of pure liquids, in order to observe more details in the thermodynamic reactivity of light alcohol–air–water mixtures.

3. Liquid Phase Composition of the Alcohol–Water Mixtures

As stated before, liquid samples were created by mixing the alcohols with water at thermodynamic conditions of 298.15 K and 1 bar. Relevant physical properties of the pure substances at these conditions are given in Table 1. These properties were used to compute the sample features in Table A1: the volume of the alcohol–H2O admixtures V S t , the volume ratio of H2O to alcohol prior to mixing q, the alcohol mass fraction in the liquid and gaseous phases (ȳAlc and Alc), the H2O mass fraction in the liquid and gaseous phases ( y ¯ H 2 O and y ~ H 2 O ), the alcohol mole fraction in the liquid and gaseous phases ( x ¯ Alc and x ~ Alc) and the H2O mole fraction in the liquid and gaseous phases ( x ¯ H 2 O and x ~ H 2 O ) [15,16].
V S t = n Alc   V Alc + n H 2 O V H 2 O
  n t V S = n Alc   V Alc + n H 2 O V H 2 O
where vs. = ( V S t /nt) is the molar volume of the binary liquid sample, VAlc and V H 2 O , the molar volume of the pure species, nAlc and n H 2 O , the amount of pure species prior to mixing, nt = nAlc + n H 2 O , the total number of moles constituting the mixture sample and Alc = CH3OH, C2H5OH, i-C3H7OH or n-C3H7OH [17]. Dividing Equation (2) by nt results in
vs .   =   x ¯ Alc V Alc + x ¯ H 2 O   V H 2 O
where x ¯ Alc and x ¯ H 2 O are the liquid phase mole fractions of the individual species. Moreover,
vs .   =   x ¯ Alc   V ¯ A l c     + x ¯ H 2 O   V ¯ H 2 O  
where V ¯ A l c   and V ¯ H 2 O represent the partial molar volumes of the individual species within the mixture, and would become identical to Equation (4) if the alcohol–water mixtures were ideal solutions. Then, V ¯ A l c and VAlc would be identical, and the same is true for V ¯ H 2 O   and V H 2 O ; thereby rendering Equations (3) and (4) equivalent. In reality, the mixing of pure fluids involves a volume defect, VE
V E = vs .   [ x ¯ Alc   V Alc + x ¯ H 2 O   V H 2 O ]
which is a negative quantity. This is called the excess volume of mixing. Immediate consequences of this phenomenon are as follows:
Equations (1)–(3) become invalid for calculating mixture properties such as the liquid sample density and specific volume. Instead, Equation (5) should be applied, provided that VE is known on an a priori basis from experiments or theoretical predictions.
The partial molar volumes of the species in the mixture are no longer equal to the molar volumes of the pure species: V ¯ A l c   ≠ VAlc and V ¯ H 2 O V H 2 O . Furthermore, for real mixtures, V ¯ A l c   and V ¯ H 2 O   become nonlinear functions of x ¯ i   and x ¯ H 2 O . Equation (12), further on, establishes a thermodynamic relationship between the partial molar volume of a species, V ¯ i , and the total volume V of a mixture as a function of varying composition. Hence, although Equation (4) remains valid for both ideal and real mixtures, its application to the latter requires precise a priori knowledge of the nonlinear dependence of x ¯ i ( V / x ¯ i ), i.e., x k ( M / x k ), in Equation (12), on the mixture composition [18].
For a mixture comprising m components, thermodynamics [19,20] provides a formal mathematical connection between an extensive total property Mt (=ntM) and the corresponding partial molar properties M ¯ i. That is
M ¯ i = ( n t M ) n i P , T , n j i f o r   j = 1 , , m i = 1 , , m
where M and M ¯ i are intensive properties. The molar property M and the partial molar property M ¯ i are functions of the intensive properties P, T, and m mole fractions x i = ni/nt. A practical relationship between M ¯ i, M and x i may be obtained by expanding Equation (6) into
( n t M ) n i P , T , n j i = M n t n i + n t ( M n i ) P , T , n j i  
and using ( n t / n i ) P , T , n j i = 1 so that
M ¯ i = M + n t ( M n i ) P , T , n j i
The fact that there are only m − 1 independent mole fractions (because the x i sum up to unity) permits the total differential of M to be expressed as
d M = k = 1 m M x k P , T , x l k , i d x k   f o r   k     i
where the summation over k excludes i and the index l indicates that all mole fractions other than xi and xk are held constant. Combined with the constant nji restriction, division by dni yields
( M n i ) P , T , n j i = k = 1 m M x k P , T , x l k , i ( x k n i )
for ki. Given that xk = nk/nt and hence
( x k n i ) n j i   = n k n t 2 = x k n t   f o r   k     i
combination of Equations (8), (10) and (11) finally results in
M ¯ i = M k = 1 m x k M x k P , T , x l k , i   f o r   k     i  
As stated earlier, application Equation (4) to the sample volume requires accurate a priori knowledge of the x k ( M / x k ) term.
Since the samples were created by mixing the pure liquids on a volumetric basis, it would be convenient to characterize them as the volumetric water to alcohol ratio, q, for further thermodynamic and reactivity studies. But the nonlinear dependence of VE on the binary mixture composition (Figure 18) renders q arbitrary. Nonetheless the volumetric ratio q is kept in the second column of Table A1 to characterize the samples for the sake of bookkeeping. Unequivocal characterization of the samples requires aforementioned quantities to be known.
Using the physical properties in Table 1, it is straightforward to compute the alcohol and water mass fractions {ȳAlc, y ¯ H 2 O } and mole fractions { x ¯ Alc, x ¯ H 2 O } in the liquid phase when q, VAlc and/or V H 2 O prior to mixing are known. These liquid phase mass and mole fractions can be obtained via
y ¯ A l c = ρ A l c V A l c ρ A l c V A l c + ρ H 2 O V H 2 O   = ρ A l c ρ A i c + q ρ H 2 O
y ¯ H 2 O = ρ H 2 O V H 2 O ρ A l c V A l c + ρ H 2 O V H 2 O = q ρ H 2 O ρ A l c + q ρ H 2 O
x ¯ A l c = ρ A l c V A l c / Μ A l c ρ A l c V A l c / Μ A l c + ρ H 2 O V H 2 O / Μ H 2 O = ρ A l c ρ A l c + q ρ H 2 O ( Μ A l c / Μ H 2 O )
x ¯ H 2 O = ρ H 2 O V H 2 O / Μ H 2 O ρ A l c V A l c / Μ A l c + ρ H 2 O V H 2 O / Μ H 2 O = q ρ H 2 O ( Μ A l c / Μ H 2 O ) ρ A l c + q ρ H 2 O ( Μ A l c / Μ H 2 O )
When q is known beforehand, Equations (13)–(16) permit the calculation of ȳAlc, y ¯ H 2 O , x ¯ Alc and x ¯ H 2 O   from the physical properties listed in Table 1 only. The values thus obtained are presented in the third, fourth, seventh and eighth column of Table A1. The liquid phase mass fractions {ȳAlc, y ¯ H 2 O } and mole fractions { x ¯ Alc, x ¯ H 2 O   } are interchangeable via
y ¯ A l c = x ¯ A l c Μ A l c x ¯ A l c Μ A l c + ( 1 x ¯ A l c ) Μ H 2 O
y ¯ H 2 O = x ¯ H 2 O Μ H 2 O x ¯ H 2 O Μ H 2 O + ( 1 x ¯ H 2 O ) Μ A l c
x ¯ A l c = y ¯ A l c y ¯ A l c + ( 1 y ¯ A l c ) y ¯ A l c / Μ H 2 O
x ¯ H 2 O = y ¯ H 2 O y ¯ H 2 O + ( 1 y ¯ H 2 O ) Μ H 2 O / Μ A l c
The same interchangeability applies equally well to the vapour phase mass and mole fractions through the substitutions {ȳAlc ← ỹAlc  y ¯ H 2 O y ~ H 2 O ; x ¯ Alc x ~ Alc; x ¯ H 2 O   x ~ H 2 O } into Equations (17)–(20).
The binary alcohol–water mixtures were administered into the combustion vessel on a volumetric basis at initial conditions of 298.15 K and 1 bar. While the sample volumes are known, the density of these liquid mixtures, ρS, is affected by the excess volume VE. To determine the species mass and mole fractions in the liquid and vapour phase, there are two possibilities:
The application of models that predict ρS directly.
The deployment of Equation (5) in conjunction with models that predict VE.

4. Density of the Liquid Samples and the Excess Volume of Liquid Mixtures

It is fortuitous that tabulations of experimental liquid density and excess volume data exist for the alcohol–water mixtures studied in this work (see Figure 18). Table 2 shows the polynomials for interpolation between the experimental pS and VE data for Figure 2.
Since these experimental data are available for discrete values of the mixture composition, it would be helpful to have a mathematical relationship to reconstruct the liquid densities of the samples studied in this paper. Although various models have been proposed to predict the density of pure liquids and liquid mixtures directly [18,28,29,30,31,32], their deployment as a correlation for interpolating experimental data turns out to be laborious, prone to curve-fitting inaccuracies and susceptible to polynomial oscillations. For this reason, it was attempted to deploy a polynomial of the form ρS = a0 x ¯ Alc + a1(1 − x ¯ Alc) + a2 x ¯ Alc(1 − x ¯ Alc) +… a n x ¯ A l c n 1 (1 − x ¯ Alc)n–1 whereby its order was kept to a minimum [33,34,35,36].
When the excess volume VE is known, the density of the liquid samples S can be obtained from Equation (5) by noting that vs. = [ x ¯ Alc ΜAlc + (1 − x ¯ Alc) Μ H 2 O ]/ρS and Vi = Μi/ρi. Henceforth:
V E = x ¯ A l c Μ A l c + ( 1 x ¯ A l c ) Μ H 2 O ρ S x ¯ A l c Μ A l c ρ A l c + ( 1 x ¯ A l c ) Μ H 2 O ρ H 2 O
ρ S = x ¯ A l c Μ A l c + ( 1 x ¯ A l c ) Μ H 2 O V E + x ¯ A l c Μ A l c ρ A l c   ( 1 x ¯ A l c ) Μ H 2 O ρ H 2 O
in conjunction with Equation (17), Table 1 and Equation (14).

5. Vapour Pressures of the Pure Liquids

To quantify the composition of the gaseous binary alcohol–air and ternary alcohol–water–air mixtures, it is necessary to know the vapour pressure of the pure substances. The Clapeyron equation [18,37,38,39], which is an exact thermodynamic relation, provides a fundamental connection between the vapour pressure of a pure substance and varying temperature:
ln ( P Sat ) = A B T
However, despite its derivation from first principles and usefulness for many purposes, this expression does not represent PSat versus T data sufficiently well. For it predicts a linear dependence of PSat on 1/T, whereas all experimental data in Figure 19, when plotted against 1/T, exhibit a deviation from linearity. For the accurate representation of vapour-pressure data, and to overcome accuracy limitations of Equation (24) over a wide range of temperatures for a large number of species, various equations of greater complexity have been proposed. Examples are the Antoine equation [40,41,42,43]
ln ( P Sat ) = A B T + C
and the Riedel equation [25]
ln ( P Sat ) = A B T + C + D ln ( T ) + E T 6
where A, B, C, D and E in aforementioned expressions are substance-specific model constants whose values are readily available in tabulations for many species. There is an even more accurate formula for interpolation between PSat values that are reasonably spaced. That is the so-called extended Antoine equation [44,45,46]:
log 10 ( P Sat ) = A     B T + C 273.15   +   D x n   +   E x p   +   F x q
where
x = T t 0 273.15 T c
In the aforesaid expression, PSat is in bar, T in K, D = 0.43429 and the exponents p and q assume distinct values for alcohols and water. For alcohols, {p = 8, q = 12}, whereas {p = 3, q = 6} for water. The substance specific values of A, B, C, E, F, t0 and n are given in Table 3. Notice that the extended Antoine equation is a superset of the classical Antoine equation and the Riedel equation [2,47,48,49]. The set of coefficients for the species involved in this work causes it to become identical to the latter two equations. Nonetheless, the extended Antoine equation is resorted to because the required coefficients are provided in its 10log-form by Ref. [2]. The reason for resorting to Antoine-type equations is their ability to handle polar species. Another model for correlating experimental vapour pressures is the Wagner equation [2,50,51,52,53,54,55,56]
ln ( P S a t P c ) = T c T ( a τ + b τ 3 / 2 + c τ 3 + d τ 6 )
where
τ = 1 T T c
where PSat is in the same units as Pc and T in K. For water, only the last two terms in Equation (28) are 3 and 6. This expression is also capable of handling polar species. Figure 3 shows an inter-comparison between the values predicted by the extended Antoine equation, the Wagner equation and experimental PSat data retrieved from the literature. Evidently, despite their very distinct mathematical forms, there is very close agreement amongst the models. The black and red solid curves in Figure 19 are almost indistinguishable. Both models are also able to correlate the experimental data accurately. In the present work, the extended Antoine equation was deployed for the calculation and interpolation of the species vapour pressures. With non-polar substances, the Lee–Kesler [57] equation is
ln ( P S a t P c ) = f ( 0 ) + ω f ( 1 )
where
f ( 0 ) = a 0 + a 1 ( T / T c ) a 2 ln ( T T c ) + a 3 ( T T c ) 6
f ( 1 ) = b 0 + b 1 ( T / T c ) b 2 ln ( T T c ) + b 3 ( T T c ) 6
would also suffice. Here, ω denotes the acentric factor and {a0 = 5.92714, a1 = −6.09648, a2 = −1.28862, a3 = 0169347; b0 = 15.2518, b1 = −15.6875, b2 = −13.4721, b3 = 0.43577}. The solid blue curves in Figure 3 show a comparison between saturation pressures predicted by the Lee–Kesler equation [57] and experimental data.
Figure 19. Experimental vapour pressures from Refs. [1,8,29,30,31,32,33,34,35,36,37,38,39,40,41,42,43,44,45,46,47,48,49,50,58]: (○) CH3OH, (◊) C2H5OH, (▽) n-C3H7OH, (△) i-C3H7OH, (●) H2O. Solid black curve: extended Antoine Equation (26). Solid red curve: Wagner Equation (28). Solid blue curve: Lee–Kesler Equation (30). The coefficients of the extended Antoine and Wagner equations are given in Table 3.
Energies 17 01466 g019

6. Conclusions

This paper presents the results of experimental studies and numerical calculations on the thermodynamic reactivity of selected alcohol fuel mixtures with air, as well as the addition of water to these mixtures. The substances tested were methanol, ethanol, n-propanol and iso-propanol. All experiments were conducted at initial conditions of 323.15 K and 1 bar in a closed combustion test vessel. The reactivity and thermodynamic properties were investigated during the combustion of liquid fuel–air mixtures at ϕ = 0.3–0.7, as well as some admixtures with water, in order to observe water mitigation effects.
For propanol–water mixtures, the explosion pressures of n-propanol are slightly higher than those of iso-propanol. This phenomenon clearly indicates the theory of the branching process of alcohol molecules for thermodynamic reactivity. N-propanol has a linear structure and is therefore more thermodynamically reactive than branched isopropanol. It was observed that the larger the sample volume was, the less ordered the results recorded were. For larger volume samples, it was observed that the thermodynamic reactivity of methanol mixtures was very dynamic in the range of 10–30% water addition to the mixtures, while the reaction dynamics of ethanol mixtures were rather less intense. The smallest explosion delay time varies with the volume of the alcohol–air mixtures. For samples with a volume of 4 cm3 (ϕ = 0.3), the explosion delay time is shortest when testing alcohol–air mixtures without water. For samples with volumes of 6 cm3 (ϕ = 0.5) and 8 cm3 (ϕ = 0.7), the explosion delay time profiles are more complicated, with the extreme points being different for each alcohol. Furthermore, in the chemical structure of the mixtures studied, the functional group is the hydroxyl group (OH), which is also responsible for the thermodynamic reactivity of all alcohol–air mixtures.
It can be concluded that a slight deviation in saturation pressure of less than 4% occurred. However, in the case of water, there was a very large discrepancy between the predictions and the experimental observations. The reason for this discrepancy is that the acentric factor, designed to correlate interactions between molecular force fields that deviate from spherical symmetry in order to improve the accuracy of the correlation of the respective states, becomes progressively inaccurate as the polarity of the molecules involved increases. For water, there were specific equations whose predictions deviated less than 0.4% from experimental observations in the temperature range from 293.15 K to 323.15 K: the August–Roche–Magnus equation [59], the Tetens equation [60], the Buck equation [61,62] and the Goff–Gratch equation [63,64]. Furthermore, like many hydrocarbon derivatives, methanol, ethanol and propanol undergo combustion in combination with heat and oxygen. This reaction releases energy, carbon dioxide and water. The addition of water to the alcohol–air reaction system can strongly affect the thermodynamic properties of light alcohols and drastically reduce the combustion reactivity of such fuels [65,66]. Knowledge of the thermodynamic data and reactivity of fuels from light alcohols can help the energy market to build appropriate strategies to use such fuels in good and safe technologies in the process industries.

Author Contributions

Conceptualization, R.P., A.D. and R.K.; Software, R.P. and J.S.; Validation, K.Z.; Formal analysis, A.D.; Investigation, J.S. and K.Z.; Resources, R.P., J.S. and K.Z.; Writing—original draft, R.P.; Writing—review & editing, R.P. and R.K.; Supervision, A.D.; Project administration, R.K. All authors have read and agreed to the published version of the manuscript.

Funding

This work was supported by the research project of the program “Excellence initiative—Research University” for the AGH University of Krakow in Poland as well as this research was founded by the Research Subsidy of the AGH University of Krakow for the Faculty of Drilling, Oil and Gas (No. 16.16.190.779).

Data Availability Statement

Data is contained within the article.

Acknowledgments

The authors would like to acknowledge the ANKO company in Poland and Andrzej Kołaczkowski who produced and delivered our combustion testing vessel and supporting devices. This work was funded by the research project supported by the program “Excellence initiative—Research University” for the AGH University of Krakow.

Conflicts of Interest

The authors declare no conflicts of interest.

Appendix A. Thermodynamic Quantities and Properties

Table A1. Sample compositions and properties of methanol, ethanol, n-propanol and i-propanol admixtures with water.
Methanol–Water
V S t  (cm3)q (vol%) y ¯ A l c  
(-)
y ¯ H 2 O
(-)
y ~ A l c  (-) y ~ H 2 O  (-) x ¯ Alc
(-)
x ¯ H 2 O
(-)
x ~ A l c
(-)
x ~ H 2 O  (-) V E  (cm3 mol−1)ρs (kg m−3)Ignition
4.001.0000.000--1.0000.000----3 × y
4.0100.8880.112--0.8170.183----3 × y
4.0200.7980.202--0.6910.309----3 × y
4.0300.7250.275--0.5990.401----3 × y
4.0400.6640.336--0.5280.472----3 × y
4.0500.6120.388--0.4720.528----2 × n
4.0600.5680.432--0.4270.573----3 × n
6.001.0000.000--1.0000.000----3 × y
6.0100.8880.112--0.8170.183----3 × y
6.0200.7980.202--0.6910.309----3 × y
6.0300.7250.275--0.5990.401----3 × y
6.0400.6640.336--0.5280.472----3 × y
6.0500.6120.388--0.4720.528----3 × y
6.0600.5680.432--0.4270.573----3 × y
8.001.0000.000--1.0000.000----3 × y
8.0100.8880.112--0.8170.183----3 × y
8.0200.7980.202--0.6910.309----3 × y
8.0300.7250.275--0.5990.401----3 × y
8.0400.6640.336--0.5280.472----3 × y
8.0500.6120.388--0.4720.528----3 × y
8.0600.5680.432--0.4270.573----3 × y
Ethanol–Water
V S t  (cm3)q (vol%) y ¯ A l c  
(-)
y ¯ H 2 O  
(-)
y ~ A l c  (-) y ~ H 2 O  (-) x ¯ A l c
(-)
x ¯ H 2 O
(-)
x ~ A l c
(-)
x ~ H 2 O  (-) V E  (cm3 mol−1)ρs (kg m−3)Ignition
4.001.0000.000--1.0000.000----3 × y
4.0100.8880.112--0.7570.243----3 × y
4.0200.7980.202--0.6090.391----3 × y
4.0300.7250.275--0.5090.491----3 × y
4.0400.6640.336--0.4380.562----3 × y
4.0500.6120.388--0.3840.616----2 × y
4.0600.5680.432--0.3410.659----3 × n
6.001.0000.000--1.0000.000----3 × y
6.0100.8880.112--0.7570.243----3 × y
6.0200.7980.202--0.6090.391----3 × y
6.0300.7250.275--0.5090.491----3 × y
6.0400.6640.336--0.4380.562----3 × y
6.0500.6120.388--0.3840.616----3 × y
6.0600.5680.432--0.3410.659----3 × y
8.001.0000.000--1.0000.000----3 × y
8.0100.8880.112--0.7570.243----3 × y
8.0200.7980.202--0.6090.391----3 × y
8.0300.7250.275--0.5090.491----3 × y
8.0400.6640.336--0.4380.562----3 × y
8.0500.6120.388--0.3840.616----3 × y
8.0600.5680.432--0.3410.659----3 × y
n-Propanol–Water
V S t  (cm3)q (vol%) y ¯ A l c  
(-)
y ¯ H 2 O  
(-)
y ~ A l c  (-) y ~ H 2 O  (-) x ¯ A l c
(-)
x ¯ H 2 O
(-)
x ~ A l c
(-)
x ~ H 2 O  (-) V E  (cm3 mol−1)ρs (kg m−3)Ignition
4.001.0000.000--1.0000.000----3 × y
4.0100.8880.112--0.7080.292----3 × y
4.0200.7980.202--0.5480.452----3 × y
4.0300.7250.275--0.4470.553----3 × y
4.0400.6640.336--0.3780.622----3 × y
4.0500.6120.388--0.3270.673----2 × n
4.0600.5680.432--0.2880.712----3 × n
6.001.0000.000--1.0000.000----3 × y
6.0100.8880.112--0.7080.292----3 × y
6.0200.7980.202--0.5480.452----3 × y
6.0300.7250.275--0.4470.553----3 × y
6.0400.6640.336--0.3780.622----3 × y
6.0500.6120.388--0.3270.673----3 × y
6.0600.5680.432--0.2880.712----3 × y
8.001.0000.000--1.0000.000----3 × y
8.0100.8880.112--0.7080.292----3 × y
8.0200.7980.202--0.5480.452----3 × y
8.0300.7250.275--0.4470.553----3 × y
8.0400.6640.336--0.3780.622----3 × y
8.0500.6120.388--0.3270.673----3 × y
8.0600.5680.432--0.2880.712----3 × y
i-Propanol–Water
V S t  (cm3)q (vol%) y ¯ A l c  
(-)
y ¯ H 2 O  
(-)
y ~ A l c  (-) y ~ H 2 O  (-) x ¯ A l c
(-)
x ¯ H 2 O
(-)
x ~ A l c
(-)
x ~ H 2 O  (-) V E  (cm3 mol−1)ρs (kg m−3)Ignition
4.001.0000.000--1.0000.000----3 × y
4.0100.8880.112--0.7030.297----3 × y
4.0200.7980.202--0.5420.458----3 × y
4.0300.7250.275--0.4410.559----3 × y
4.0400.6640.336--0.3720.628----3 × y
4.0500.6120.388--0.3220.678----2 × n
4.0600.5680.432--0.2830.717----3 × n
6.001.0000.000--1.0000.000----3 × y
6.0100.8880.112--0.7030.297----3 × y
6.0200.7980.202--0.5420.458----3 × y
6.0300.7250.275--0.4410.559----3 × y
6.0400.6640.336--0.3720.628----3 × y
6.0500.6120.388--0.3220.678----3 × y
6.0600.5680.432--0.2830.717----3 × y
8.001.0000.000--1.0000.000----3 × y
8.0100.8880.112--0.7030.297----3 × y
8.0200.7980.202--0.5420.458----3 × y
8.0300.7250.275--0.4410.559----3 × y
8.0400.6640.336--0.3720.628----3 × y
8.0500.6120.388--0.3220.678----3 × y
8.0600.5680.432--0.2830.717----3 × y

References

  1. Lide, D.R. (Ed.) CRC Handbook of Chemistry and Physics, 84th ed.; CRC Press: Boca Raton, FL, USA, 2004. [Google Scholar]
  2. Poling, B.E.; Prausnitz, J.M.; O’Connell, J.P. The Properties of Gases and Liquids, 5th ed.; McGraw-Hill: New York, NY, USA, 2001. [Google Scholar]
  3. Perry, R.H.; Green, D.W.; Maloney, J.O. Perry’s Chemical Engineers’ Handbook, 7th ed.; McGraw-Hill: New York, NY, USA, 1999. [Google Scholar]
  4. The Dortmund Data Bank. Thermophysical Properties of Pure Components and Their Mixtures. 2018. Available online: http://www.ddbst.com/ (accessed on 6 September 2023).
  5. Arce, A.; Blanco, A.; Soto, A.; Vidal, I. Densities, refractive indices, and excess molar volumes of the ternary systems water + methanol + 1-octanol and water + ethanol + 1-octanol and their binary mixtures at 298.15 K. J. Chem. Eng. Data 1993, 38, 336–340. [Google Scholar] [CrossRef]
  6. Vilcu, R.; Simion, A. Grandeurs d’exces par des Mesures Acoustiques, dans les Systemes Binaires de Liquides. Rev. Roum. Chim. 1976, 21, 177–186. [Google Scholar]
  7. Sarathy, S.M.; Oßwald, P.; Hansen, N.; Kohse-Hoinghaus, K. Alcohol combustion chemistry. Prog. Energy Combust. Sci. 2014, 44, 40–102. [Google Scholar] [CrossRef]
  8. Li, Q.; Cheng, Y.; Huang, Z. Comparative assessment of the explosion characteristics of alcohol-air mixtures. J. Loss Prev. Process Ind. 2015, 37, 91–100. [Google Scholar] [CrossRef]
  9. Bryan, W.W.; Kumar, K.; Zhang, Y.; Sung, C.-J. Autoignition of n-butanol at elevated pressure and low to intermediate temperature. Combust. Flame 2011, 158, 809–819. [Google Scholar]
  10. Zhu, Y.; Davidson, D.F.; Hanson, R.K. 1-butanol ignition delay times at low temperatures: An application of the constrained-reaction-volume strategy. Combust. Flames 2013, 161, 634–643. [Google Scholar] [CrossRef]
  11. Douheret, G.; Khadir, A.; Pal, A. Thermodynamic characterization of the water + methanol system, at 298.15 K. Thermochim. Acta 1989, 142, 219–243. [Google Scholar] [CrossRef]
  12. Grolier, J.-P.E.; Wilhelm, E. Excess volumes and excess heat capacities of water + ethanol at 298.15 K. Fluid Phase Equilibria 1981, 6, 283–287. [Google Scholar] [CrossRef]
  13. Ott, J.B.; Sipowska, J.T.; Gruszkiewicz, M.S.; Woolley, A.T. Excess volumes for (ethanol + water) at the temperatures (298.15 and 348.15) K and pressures (0.4, 5, and 15) MPa and at the temperature 323.15 K and pressures (5 and 15) MPa. J. Chem. Thermodyn. 1993, 25, 307–318. [Google Scholar] [CrossRef]
  14. Davis, M.I.; Ham, E.S. Part 2. Comparisons of the propanol isomers in their aqueous mixtures. Thermochim. Acta 1991, 190, 251–258. [Google Scholar] [CrossRef]
  15. Langdon, W.M.; Keyes, D.B. Isopropyl alcohol-water system. Ind. Eng. Chem. 1943, 35, 459–464. [Google Scholar] [CrossRef]
  16. Yamamoto, H.; Ichikawa, K.; Tokunaga, J. Solubility of helium in methanol + water, ethanol + water, 1-propanol + water, and 2-propanol + water solutions at 25 °C. J. Chem. Eng. Data 1994, 39, 155–157. [Google Scholar] [CrossRef]
  17. Benson, G.C.; Kiyohara, O. Thermodynamics of aqueous mixtures of nonelectrolytes. I. Excess volumes of water—N-alcohol mixtures at several temperatures. J. Solut. Chem. 1980, 9, 791–804. [Google Scholar] [CrossRef]
  18. Smith, J.M.; Van Ness, H.C.; Abbott, M.M. Introduction to Chemical Engineering Thermodynamics, 7th ed.; McGraw-Hill: New York, NY, USA, 2007. [Google Scholar]
  19. Battino, R. Volume changes on mixing for binary mixtures of liquids. Chem. Rev. 1971, 71, 5–45. [Google Scholar] [CrossRef]
  20. Abbott, M.M.; Van Ness, H.C. Theory and Problems of Thermodynamics; Schaum’s Outline Series; McGraw-Hill: New York, NY, USA, 1972. [Google Scholar]
  21. Press, W.H.; Teukolsky, S.A.; Vetterling, W.T.; Flannery, B.P. Numerical Recipes, The Art of Scientific Computing, 3rd ed.; Cambridge University Press: Cambridge, UK, 2007. [Google Scholar]
  22. Marquardt, D.W. An algorithm for least-squares estimation of nonlinear parameters. SIAM J. Appl. Math. 1963, 11, 431–441. [Google Scholar] [CrossRef]
  23. Dahoe, A.E.; Skjold, T.; Roekaerts, D.J.E.M.; Pasman, H.J.; Eckho, R.K.; Hanjalic, K.; Donze, M. On the application of the Levenberg-Marquardt method in conjunction with an explicit Runge-Kutta and an implicit Rosenbrock method to assess burning velocities from confined deflagrations. Flow Turbul. Combust. 2013, 91, 281–317. [Google Scholar] [CrossRef]
  24. Rackett, H.G. Equation of state for saturated liquids. J. Chem. Eng. Data 1970, 15, 514–517. [Google Scholar] [CrossRef]
  25. Lydersen, A.L.; Greenkorn, R.A.; Hougen, O.A. Generalized thermodynamic properties of pure fluids. In Engineering Experiment Station Report 4; College of Engineering, University of Wisconsin: Madison, WI, USA, 1955. [Google Scholar]
  26. Gunn, R.D.; Yamada, T. A corresponding states correlation of saturated liquid volumes. AIChE J. 1971, 17, 1341–1345. [Google Scholar] [CrossRef]
  27. Yen, L.C.; Woods, S.S. A generalized equation for computer calculation of liquid densities. AIChE J. 1966, 12, 95–99. [Google Scholar] [CrossRef]
  28. Yamada, T.; Gunn, R. Saturated liquid molar volumes. Rackett Equ. J. Chem. Eng. Data 1973, 18, 234–236. [Google Scholar] [CrossRef]
  29. The National Institute of Standards and Technology (NIST). The NIST ChemistryWebBook. Data Compiled under the Standard Reference Data Program. 2018. Available online: https://webbook.nist.gov/ (accessed on 6 September 2023).
  30. Kotsarenko, A.A.; Yarym-Agaev, N.L. Sättigungsdampfdruck von Methanol im Temperaturbereich von 251.9 bis 298.15 k. Izv. Vyss. Uchebnykh Zaved. Neft Gaz 1990, 6, 59–61. [Google Scholar]
  31. Gibbard, H.F.; Creek, J.L. Vapor pressure of methanol from 288.15 to 337.65 k. J. Chem. Eng. Data 1974, 19, 308–310. [Google Scholar] [CrossRef]
  32. Dever, D.F.; Finch, A.; Grunwald, E. The Vapor Pressure of Methanol. J. Phys. Chem. 1955, 59, 668–669. [Google Scholar] [CrossRef]
  33. Chun, K.W.; Davison, R.R. Thermodynamic properties of binary mixtures of triethylamine with methyl and ethyl alcohol. J. Chem. Eng. Data 1972, 17, 307–310. [Google Scholar] [CrossRef]
  34. Ambrose, D.; Sprake, C.H.S. Thermodynamic properties of organic oxygen compounds. XXV. Vapour pressures and normal boiling temperatures of aliphatic alcohols. J. Chem. Thermodyn. 1970, 2, 631–645. [Google Scholar] [CrossRef]
  35. Ambrose, D.; Sprake, C.H.S.; Townsend, R. Thermodynamic properties of organic oxygen compounds. XXXVII. Vapour pressures of methanol, ethanol, pentan-1-ol, and octan-1-ol from the normal boiling temperature to the critical temperature. J. Chem. Thermodyn. 1975, 7, 185–190. [Google Scholar] [CrossRef]
  36. Hirata, M.; Suda, S. Vapor pressure on methanol in high pressure regions. J. Chem. Thermodyn. 1967, 31, 339–342. [Google Scholar] [CrossRef]
  37. Mishchenko, K.P.; Subbotina, V.V. Dampfdruck von Ethanol bei Temperaturen von 4 bis 46 °C. Zhurnal Pikladnoi Khimii 1967, 40, 1156–1159. [Google Scholar]
  38. Kahlbaum, G.W.A.; von Wirkner, C.G. Studien uber Dampfspannkraftsmessungen. Monograph, 1897; Reprint in 2012 under ISBN-9785883729552. [Google Scholar]
  39. Scatchard, G.; Raymond, C.L. II. Chloroform-ethanol mixtures at 35, 45 and 55 °C. J. Am. Chem. Soc. 1938, 60, 1278–1287. [Google Scholar] [CrossRef]
  40. Scatchard, G.; Satkiewicz, F.G. XII. The system ethanol-cyclohexane from 5 to 65 °C. J. Am. Chem. Soc. 1964, 86, 130–133. [Google Scholar] [CrossRef]
  41. Kretschmer, C.B.; Wiebe, R. Liquid-vapor equilibrium of ethanol-toluene solutions. J. Am. Chem. Soc. 1949, 71, 1793–1797. [Google Scholar] [CrossRef]
  42. Dejoz, A.; Gonzalez-Alfaro, V.; Miguel, P.J.; Vazquez, M.I. Isobaric vapor-liquid equilibria of tetrachloroethylene + 1-propanol and + 2-propanol at 20 and 100 kpa. J. Chem. Eng. Data 1996, 41, 1361–1365. [Google Scholar] [CrossRef]
  43. Shulgin, I.L.; Belousov, V.P.; Baglai, A.K. Eine tensimetrische Untersuchungsmethode des Dampf-flussig-Gleichgewichtes in binaren Systemen. Termodin. Org. Soedin. 1989, 32, 32–35. [Google Scholar]
  44. Daubert, T.E.; Jalowka, J.W.; Goren, V. Vapor pressure of 22 pure industrial chemicals. AIChE Symp. Ser. 1987, 32, 128–156. [Google Scholar]
  45. Ambrose, D.; Townsend, R. Thermodynamic properties of organic oxygen compounds. the critical properties and vapour pressures, above five atmospheres, of six aliphatic alcohols. Part IX. J. Chem. Soc. 1963, 54, 3614–3625. [Google Scholar] [CrossRef]
  46. Biddiscombe, D.P.; Collerson, R.R.; Handley, R.; Herington, E.F.G.; Martin, J.F.; Sprake, C.H.S. Thermodynamic properties of organic oxygen compounds. Part XIII. J. Chem. Soc. 1963, 54, 1954–1957. [Google Scholar] [CrossRef]
  47. Kemme, H.R.; Kreps, S.I. Vapor pressure of primary n-alkyl chlorides and alcohols. J. Chem. Eng. Data 1969, 14, 98–102. [Google Scholar] [CrossRef]
  48. Gudkov, A.N.; Fermor, N.A.; Smirnov, N.I. Communication I. Zurnal Prikl. Chim. 1964, 37, 2204–2210. [Google Scholar]
  49. Bridgeman, O.C.; Aldrich, E.W. Vapor pressure tables for water. J. Heat Transf. 1964, 86, 279–286. [Google Scholar] [CrossRef]
  50. Stull, D.R. Vapor pressure of pure substances. Organic and inorganic compounds. Ind. Eng. Chem. 1947, 39, 517–540. [Google Scholar] [CrossRef]
  51. Clapeyron, E. M’emoire sur la Puissance Motrice de la Chaleur. J. L’ecole R. Polytech. 1834, 14, 153–191. [Google Scholar]
  52. Wisniak, J. Historical development of the vapor pressure equation from Dalton to Antoine. J. Phase Equilibria 2001, 22, 622–630. [Google Scholar] [CrossRef]
  53. Wagner, W. New vapour pressure measurements for argon and nitrogen and a new method for establishing rational vapour pressure equations. Cyrogenics 1973, 13, 470–482. [Google Scholar] [CrossRef]
  54. Wagner, W. A New Correlation Method for Thermodynamic Data Applied to the Vapor-Pressure Curve of Argon, Nitrogen, and Water; Watson, J.T.R., Ed.; IUPAC Thermodynamic Tables Project Centre: London, UK, 1977. [Google Scholar]
  55. Ambrose, D. The corelation and estimation of vapour pressures IV. Observations on Wagner’s method of fitting equations to vapour pressures. J. Chem. Thermodyn. 1986, 18, 45–51. [Google Scholar] [CrossRef]
  56. Ambrose, D. Vapour pressures and critical temperatures and critical pressures of some alkanoic acids: C1 to C10. J. Chem. Thermodyn. 1987, 19, 505–519. [Google Scholar] [CrossRef]
  57. Lee, B.I.; Kesler, M.G. A generalized thermodynamic correlation based on three-parameter corresponding states. AIChE J. 1975, 21, 510–527. [Google Scholar] [CrossRef]
  58. Barr-David, F.; Dodge, B.F. The systems ethanol–water and 2-propanol–water. J. Chem. Eng. Data 1959, 4, 107–121. [Google Scholar] [CrossRef]
  59. Alduchov, O.A.; Eskridge, R.E. Improved Magnus form approximation of saturation vapor pressure. J. Appl. Meteorol. 1996, 35, 601–619. [Google Scholar] [CrossRef]
  60. Alduchov, O.A.; Eskridge, R.E. Über einige meteorologische Begriffe. Z. Fur Geophys. 1930, 6, 207–309. [Google Scholar]
  61. Buck, A.L. New equations for computing vapor pressure and enhancement factor. J. Appl. Meteorol. 1981, 20, 1527–1532. [Google Scholar] [CrossRef]
  62. Murphy, D.M.; Koop, T. Review of the vapour pressures of ice and supercooled water for atmospheric applications. Q. J. R. Meteorol. Soc. 2005, 131, 1539–1565. [Google Scholar] [CrossRef]
  63. Dethlefsen, C.; Sørensen, P.G.; Hvidt, A. Excess volumes of propanol-water mixtures at 5, 15, and 25 °C. J. Solut. Chem. 1984, 13, 191–202. [Google Scholar] [CrossRef]
  64. Soetens, J.C.; Bopp, P.A. Water-methanol mixtures: Simulations of mixing properties over the entire range of mole fractions. J. Phys. Chem. B 2015, 119, 8593–8599. [Google Scholar] [CrossRef]
  65. McGlashan, M.L.; Williamson, A. Isothermal liquidvapor equilibria for system methanol-water. J. Chem. Eng. Data 1976, 21, 196–199. [Google Scholar] [CrossRef]
  66. Van Ness, H.C. Thermodynamics in the treatment of vapor/liquid equilibrium (VLE) data. Pure Appl. Chem. 1995, 67, 859–872. [Google Scholar] [CrossRef]
Figure 1. Photograph (left) and schematic (right) of the 20 L combustion vessel provided by ANKO.
Energies 17 01466 g001
Figure 2. Pressure increase of 6 cm3 of methanol and 20% water addition (ϕ = 0.5).
Energies 17 01466 g002
Figure 3. Influence of the water addition on the explosion delay time of methanol–air mixtures.
Energies 17 01466 g003
Figure 4. Pressure increase of 6 cm3 of ethanol and 20% water addition (ϕ = 0.5).
Energies 17 01466 g004
Figure 5. Influence of the water addition on the explosion delay time of ethanol–air mixtures.
Energies 17 01466 g005
Figure 6. Pressure increase of 4 cm3 of n-propanol and 20% water addition (ϕ = 0.3).
Energies 17 01466 g006
Figure 7. Influence of the water addition on the explosion delay time of n-propanol–air mixtures.
Energies 17 01466 g007
Figure 8. Pressure increase of 4 cm3 of iso-propanol and 20% water addition (ϕ = 0.3).
Energies 17 01466 g008
Figure 9. Influence of the water addition on the explosion delay time of iso-propanol mixtures.
Energies 17 01466 g009
Figure 10. Influence of water addition on the explosion pressure for investigated alcohol–air mixtures (ϕ = 0.3).
Energies 17 01466 g010
Figure 11. Influence of water addition on the (dP/dt)max for all alcohol–air mixtures (ϕ = 0.3).
Energies 17 01466 g011
Figure 12. Influence of water addition on the explosion delay time for all alcohol–air mixtures (ϕ = 0.3).
Energies 17 01466 g012
Figure 13. Influence of water addition on the explosion pressure of all alcohol–air mixtures (ϕ = 0.5).
Energies 17 01466 g013
Figure 14. Influence of the water addition on (dP/dt)max for all alcohol–air mixtures (ϕ = 0.5).
Energies 17 01466 g014
Figure 15. Influence of the water addition on the explosion delay time for all alcohol–air mixtures (ϕ = 0.5).
Energies 17 01466 g015
Figure 16. Influence of the water addition on the explosion pressure for all alcohol–air mixtures (ϕ = 0.7).
Energies 17 01466 g016
Figure 17. Influence of water addition on the maximum rate of pressure rise (dP/dt)max for all alcohol–air mixtures (ϕ = 0.7).
Energies 17 01466 g017
Figure 18. (Left) Density ρS of binary alcohol–water liquid samples. Experimental data from Ref. [7]: (○) CH3OH–H2O at T = 293.15 K and 1 bar, (◊) C2H5OH–H2O at T = 298.15 K and 1 bar, (▽) n-C3H7OH–H2O at T = 293.15 K and 1 bar, (△) i-C3H7OH–H2O at T = 303.15 K and 1 bar. The dashed coloured curves are polynomial interpolations based on Equation (13). The solid coloured curves are interpolations based on Equations (24) and (14). (Right) Excess volumes VE of binary alcohol–water liquid mixtures at T = 298.15 K and 1 bar. Experimental data from Refs. [20,21,22,23,24,25]: (○) CH3OH–H2O, (◊) C2H5OH–H2O, (▽) n-C3H7OH–H2O, (△) i-C3H7OH–H2O. The solid coloured curves are polynomial interpolations based on Equation (14). Additional data was collected from the literature [20] but is not included in the determination of the polynomial coefficients: (×).
Energies 17 01466 g018
Table 1. Molecular mass (M) density (ρ), critical temperature (Tc), critical pressure (Pc), critical volume (Vc), acentric factor (ω), boiling point (Tb) and vapour pressure (PSat) of CH3OH, C2H5OH, n-C3H7OH, i-C3H7OH, H2O and air [1,2].
SubstanceM (kg mol−1)Ρ (†)
(kg m−3)
Tc(⊕)
(K)
Pc(⊕)
(bar)
Vc(⊕)
(cm3 mol−1)
ω
(-)
Tb ()
(K)
PSat (*)
(bar)
Fl. lim. (y) (vol%)
CH3OH32.04 × 10−3787.2512.1680.92117.880.565338.150.176–37
C2H5OH46.07 × 10−3787.3513.961.37167.100.649351.150.0793–19
n-C3H7OH60.10 × 10−3802.0536.851.70218.410.629370.150.0282–14
i-C3H7OH60.10 × 10−3782.7508.347.62220.100.665355.150.0612–12
H2O18.015 × 10−3(a) 997.05647.10220.6456.020.344(a) 373.13(a) 0.0317
Air(b) 28.964 × 10−31.161(c) 132.63(c) 37.85892.35
(†) At 298.15 K and 1 bar. (‡) At 1 bar. (*) At 298.15 K. (⊕) These quantities permit the calculation of the critical density ρc = MPc/RTc and the critical compressibility Zc = PcVc/RTc. (y) Flammability limits in air at 298.15 K and 1 bar as tabulated in Ref. [1]. Notice that the upper flammability limit in air supersedes the vapour pressure of the pure substances at these conditions. (a) From Ref. [3]. (b) From Ref. [4]. (c) From Ref. [5].
Table 2. Polynomials for interpolation between the experimental ρS and VE data in Figure 2. The polynomial coefficients were determined by the Levenberg–Marquardt method [13,14,26,27,28].
Polynomial: VE = ρAlc  x ¯ Alc + ρH2O(1 − x ¯ Alc) + a0  x ¯ Alc(1 − x ¯ Alc)
MixtureRangea0
CH3OH–H2O0.0 ≤ x ¯ Alc ≤ 1.0−25.2 × 100
C2H5OH–H2O0.0 ≤ x ¯ Alc ≤ 1.0−124.7 × 100
n-C3H7OH–H2O0.0 ≤ x ¯ Alc ≤ 1.0−242.1 × 100
i-C3H7OH–H2O0.0 ≤ x ¯ Alc ≤ 1.0−19.6 × 101
Polynomial: VE = a0 x ¯ Alc + a1(1 − x ¯ Alc) + a2  x ¯ Alc(1 − x ¯ Alc) + a3 x ¯ 2 (1 − x ¯ Alc)2
MixtureRangea0a1a2a3
CH3OH–H2O0.0 ≤ x ¯ Alc ≤ 1.00.3 × 10−317.0 × 10⁻³−370.1 × 10⁻²−16.7 × 10⁻¹
C2H5OH–H2O0.0 ≤ x ¯ Alc < 0.2
0.2 ≤ x ¯ Alc ≤ 1.0
25.2 × 100
1.3 × 10⁻³
8.0 × 10⁻³
−41.6 × 10⁻²
−29.5 × 100
−36.3 × 10⁻¹
−46.6 × 100
8.1 × 10⁻¹
n-C3H7OH–H2O0.0 ≤ x ¯ Alc < 0.1
0.1 ≤ x ¯ Alc < 0.6
0.6 ≤ x ¯ Alc ≤ 1.0
20.7 × 100
5.9 × 10⁻²
−10.1 × 10⁻³
25.6 × 10⁻³
−324.8 × 10⁻³
16.0 × 10⁻²
−28.4 × 100
−208.3 × 10⁻²
−27.3 × 10⁻¹
0.0
0.0
0.0
i-C3H7OH–H2O0.0 ≤ x ¯ Alc < 0.1
0.1 ≤ x ¯ Alc < 0.6
0.6 ≤ x ¯ Alc ≤ 1.0
2.4 × 100
5.0 × 10⁻¹
−1.9 × 10⁻²
12.3 × 10⁻³
−41.1 × 10⁻²
−1.4 × 10⁻¹
−10.2 × 100
−39.8 × 10⁻¹
−31.9 × 10⁻¹
0.0
0.0
0.0
Table 3. Coefficients of the extended Antoine Equation (26) and the Wagner Equation (28) for the pure sample constituents [2].
SpeciesExtended Antoine EquationWagner Equation
ABCEFt0npqabcd
CH3OH5.202771580.080239.500812−8.635711.17982−2.4790−1.0240
C2H5OH5.336751648.220230.918812−8.685871.17831−4.87621.5880
n-C3H7OH4.99991512.940205.807812−8.537061.96214−7.69182.9450
i-C3H7OH5.242681580.920219.610812−8.736562.16240−8.707854.77927
H2O5.115641687.537230.1736−7.772241.45684−2.71942−1.41336
Disclaimer/Publisher’s Note: The statements, opinions and data contained in all publications are solely those of the individual author(s) and contributor(s) and not of MDPI and/or the editor(s). MDPI and/or the editor(s) disclaim responsibility for any injury to people or property resulting from any ideas, methods, instructions or products referred to in the content.

