
Techno-Economic Comparison of Low-Carbon Energy Carriers Based on Electricity for Air Mobility

Abstract
1. Introduction
Previous Work
2. Materials and Methods
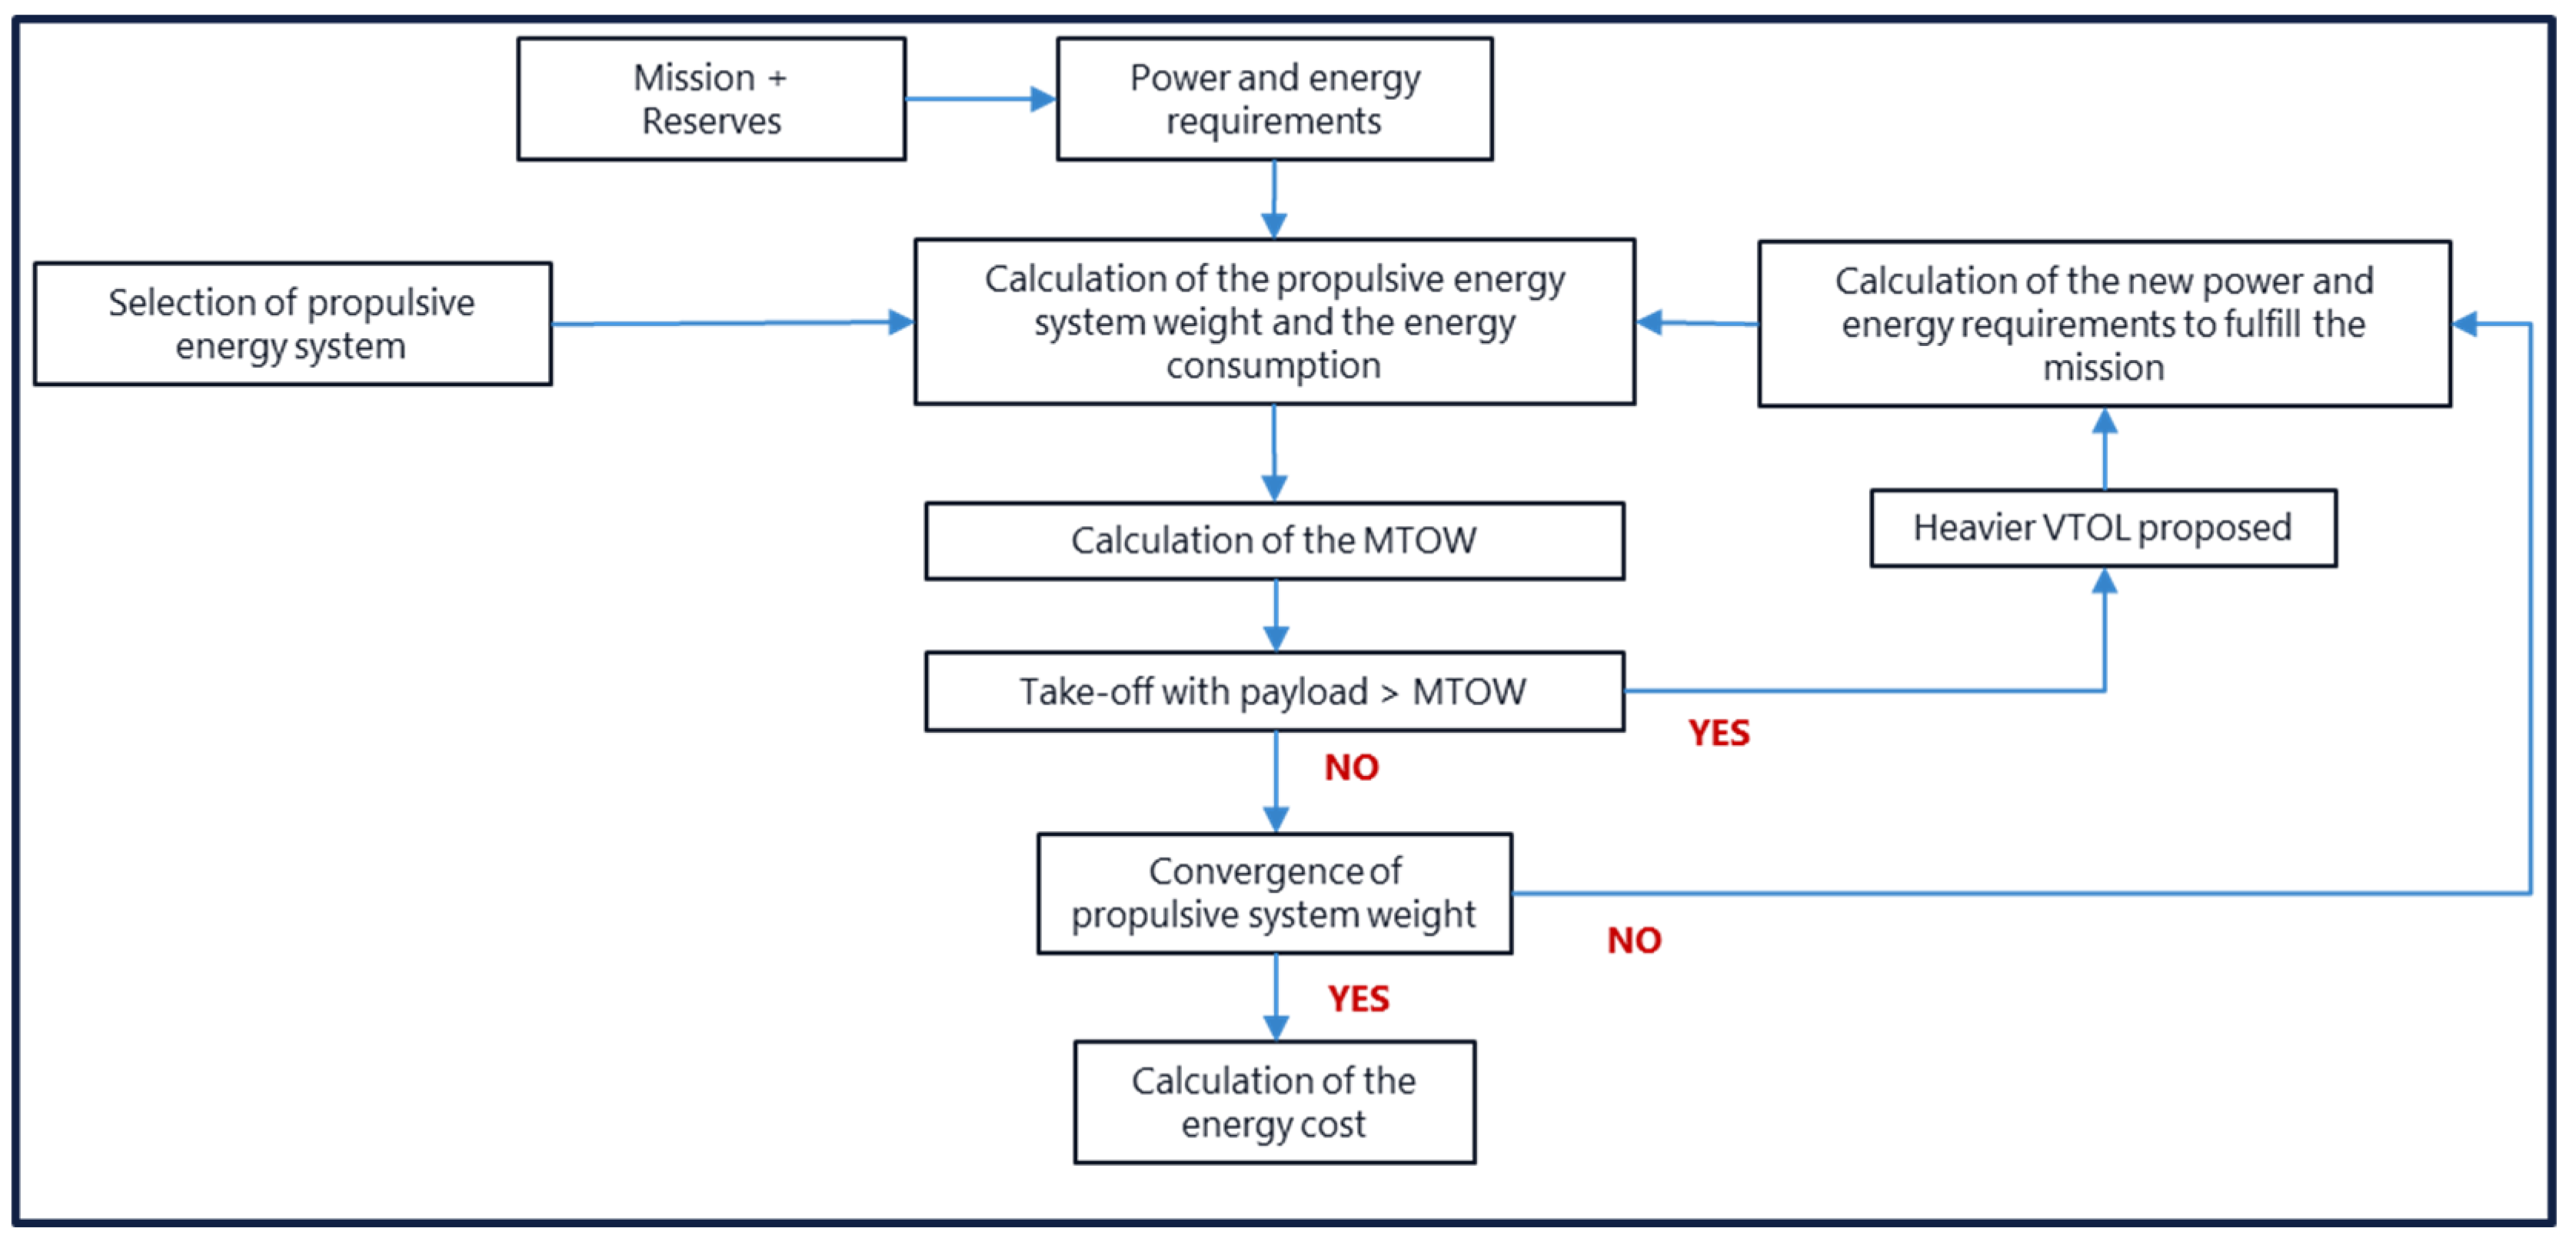
2.1. Methodology
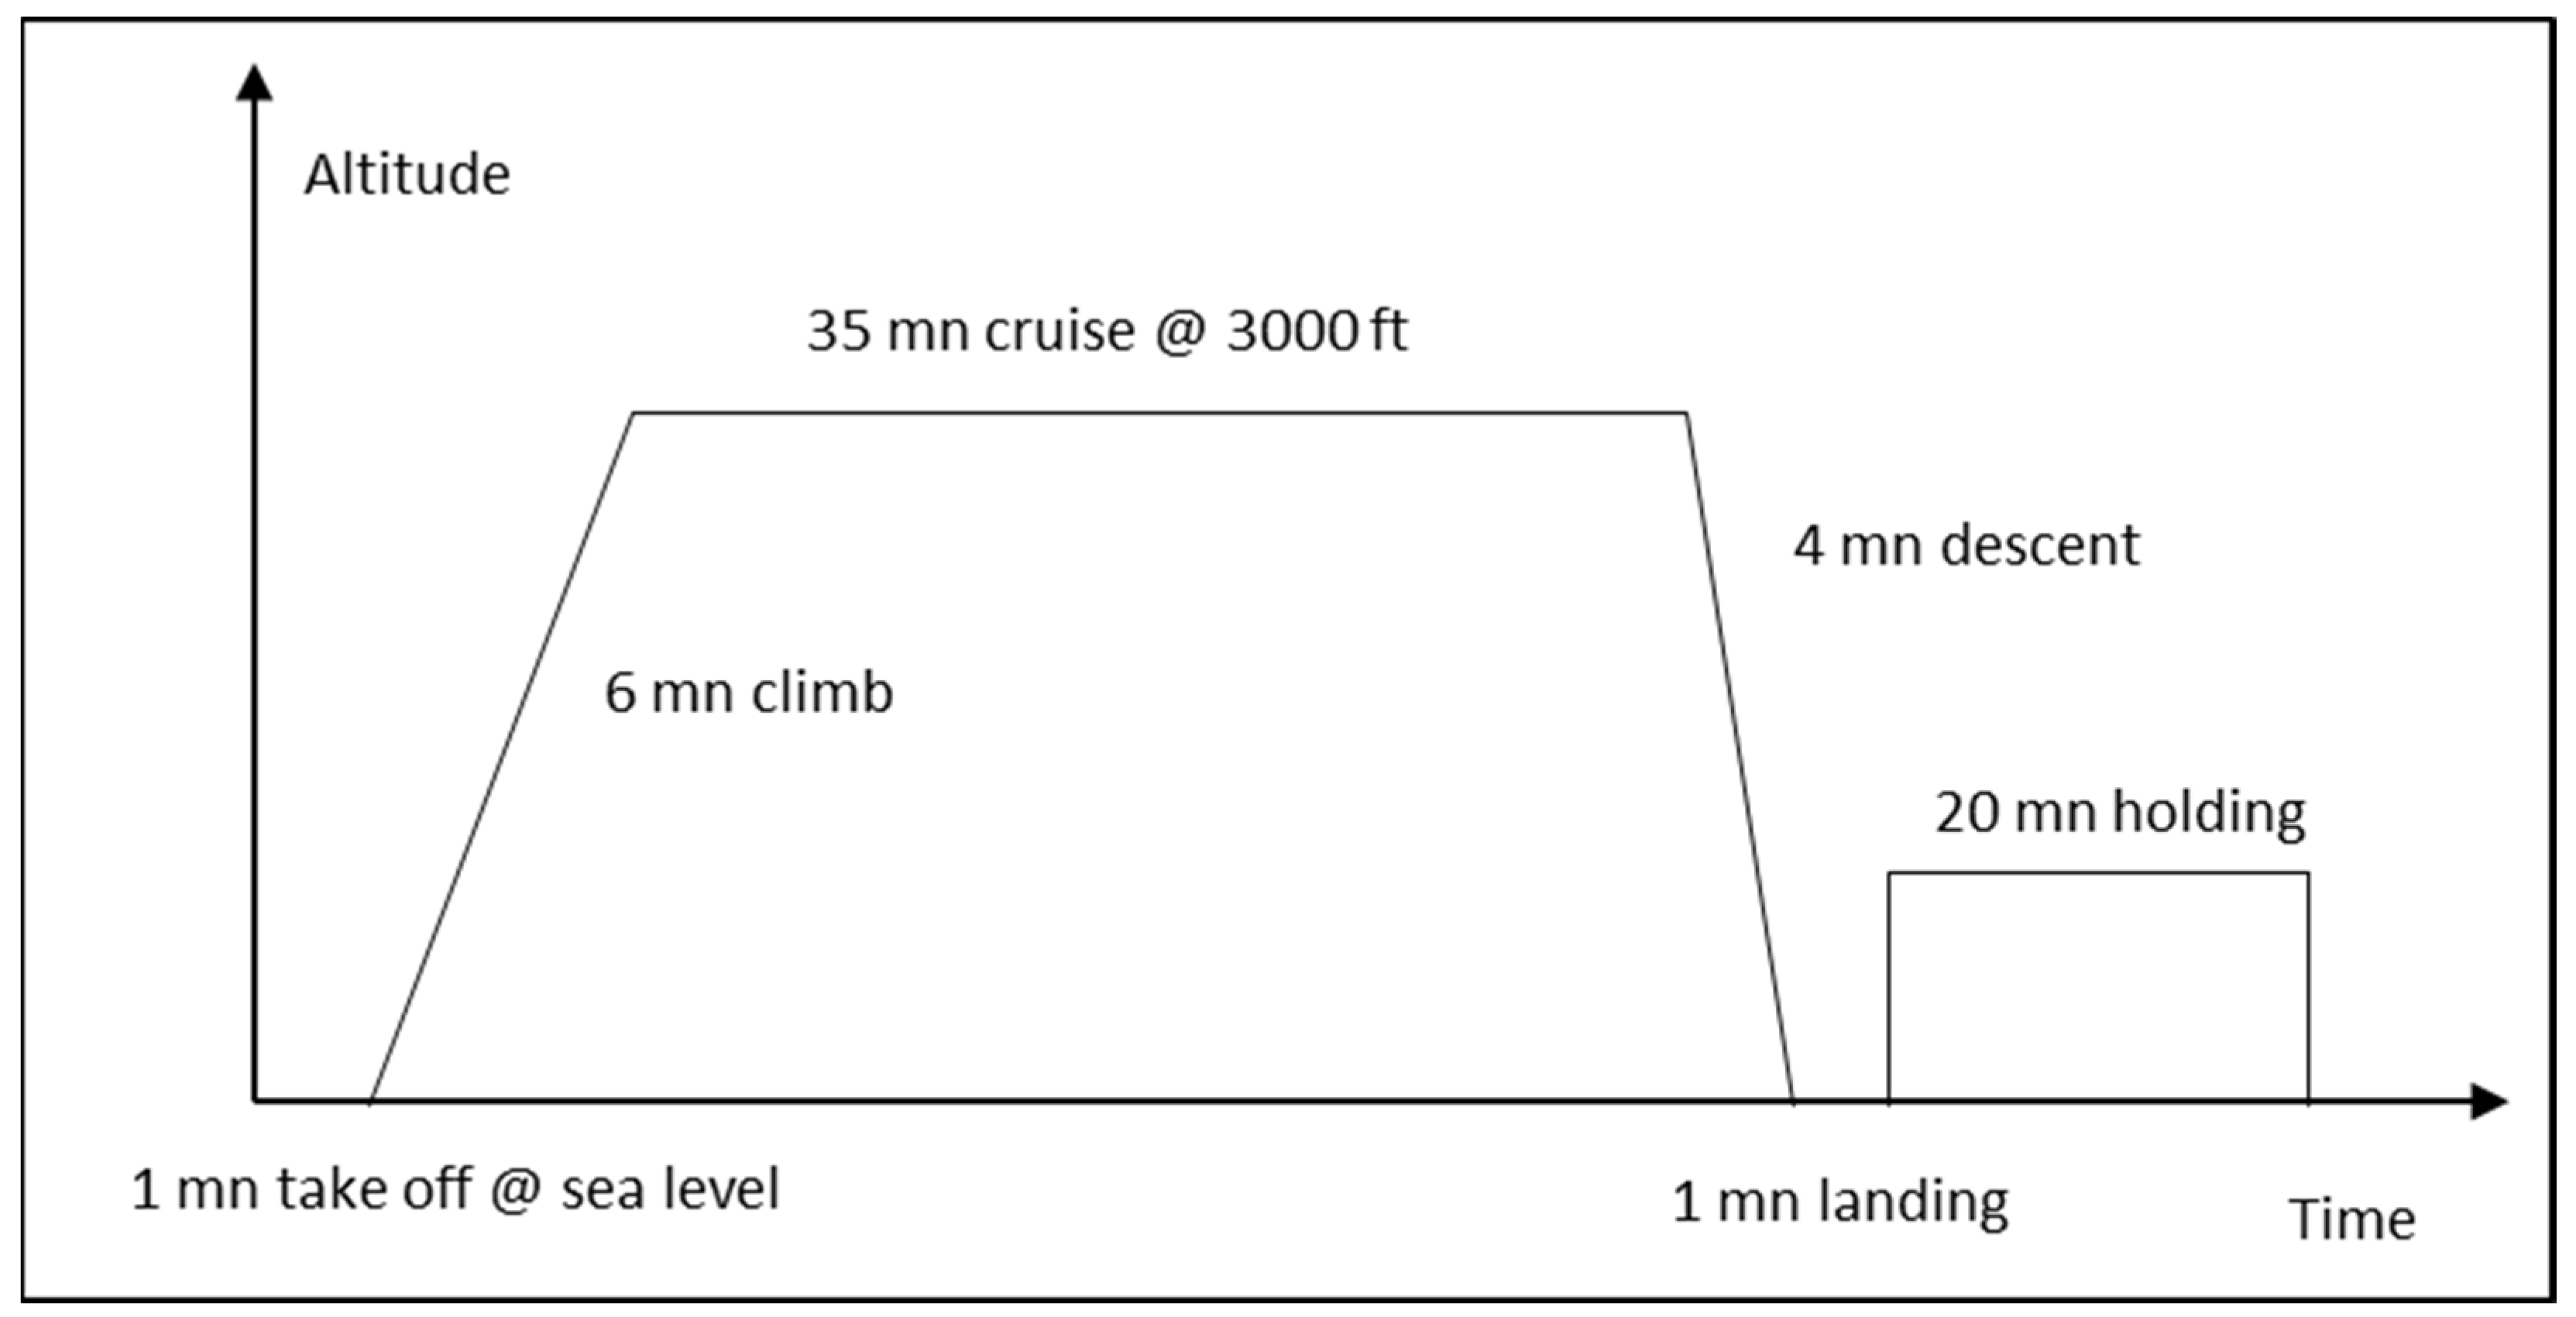
2.2. Design of VTOL
- Fuel cell efficiency: This has a direct impact on the quantity of LH2 onboard the VTOL aircraft and, thus, the size and weight of the LH2 tanks and, thus, the power requirements and, thus, the energy consumption. In our model, a proton exchange membrane (PEM) is preferred to solid-oxide fuel cells (SOFC) as a PEM can operate at low temperatures. Lower temperatures allow quick response times while SOFC, which operate at higher temperatures (600 to 1000 °C), require some time to start up and shut down: “at least 10 min, and maybe an hour or more” as highlighted by Adler and Martins [7] and, therefore, are inappropriate with most VTOL operations such as emergency medical services or search and rescue. The same article from Adler and Martins [7] mentions 50% efficiency for the fuel cell, which is the value used in this study.
- Battery cell energy density: Electricity is electrochemically stored. Li-ion batteries are currently the main technology used in electric vehicles and are still progressing. “Li-ions and electrons travel between cathode and anode during charge-discharge cycles repeatedly and the process goes on throughout the life cycle” [20]. While the current cell energy density is close to 300 Whkg−1, the target for 2030 is 500 Wh−1/kg by 2030 [21] and we have assumed a further improvement to 600 Wh−1/kg when associated with an integration factor of 1.35.
2.3. Energy Carriers
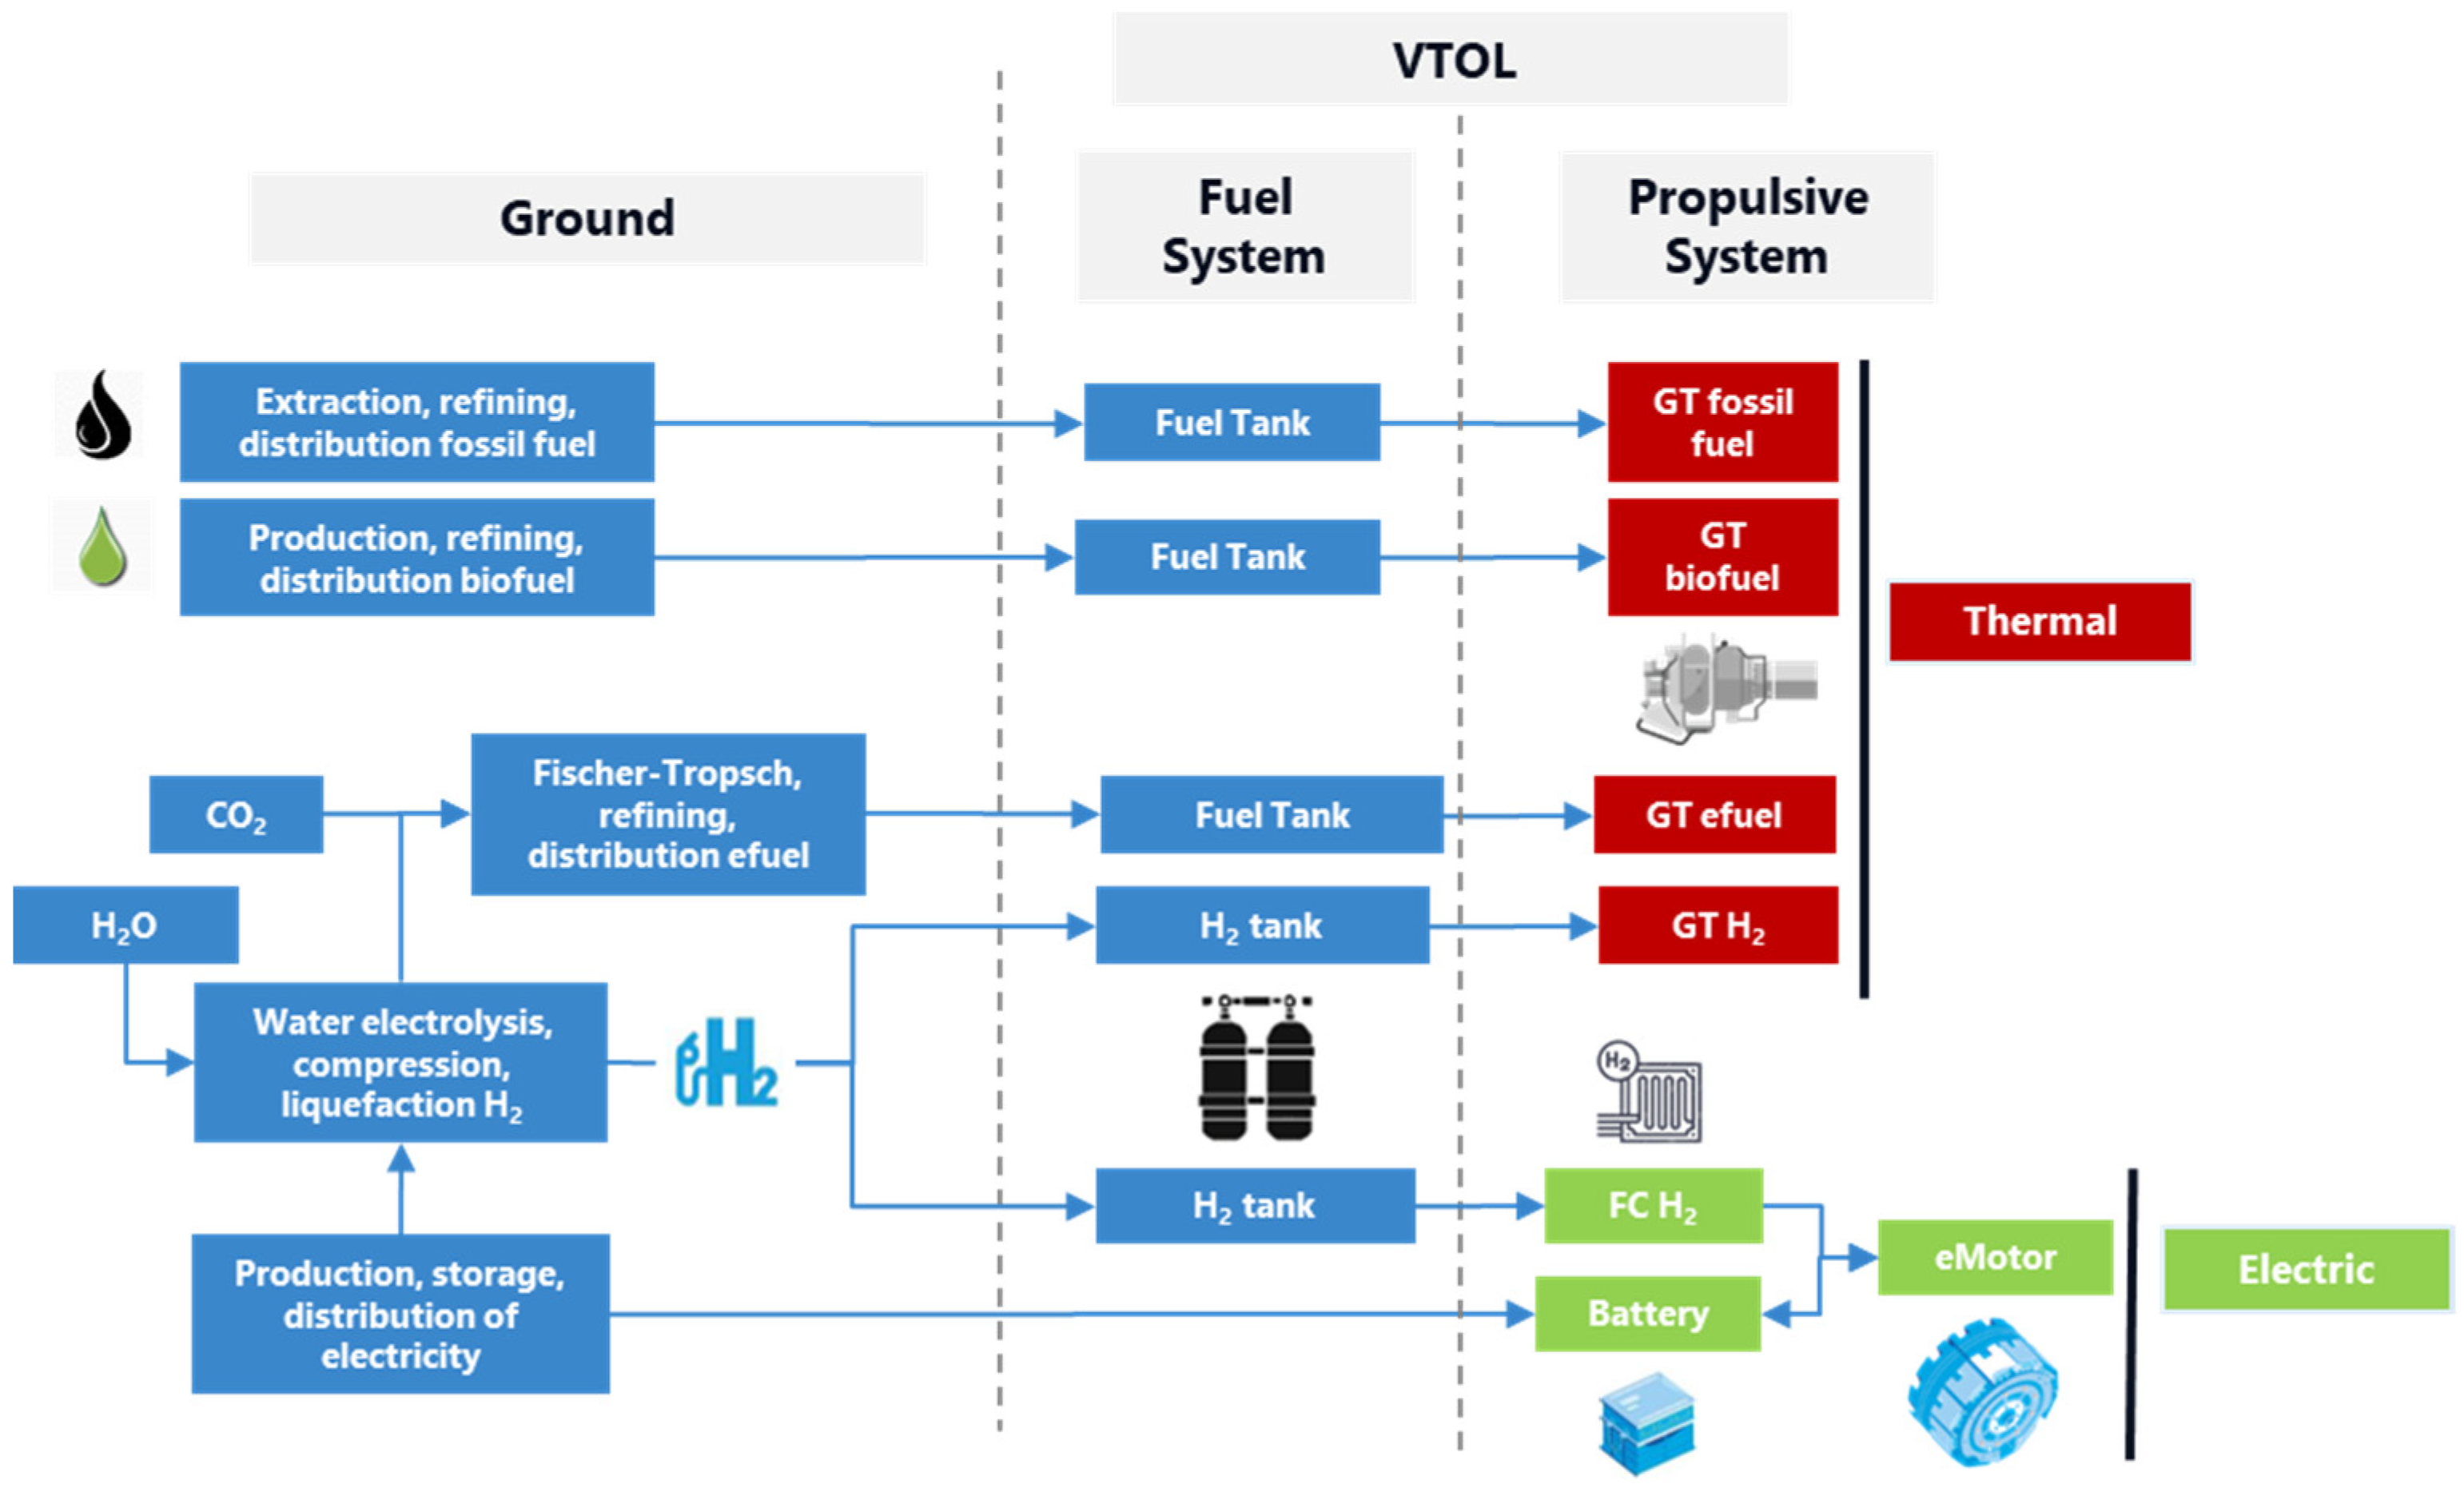
- Electricity: used for battery electrification (BE), the production of liquid H2 and eFuels. Electricity is considered as the raw material for all energy carrier/propulsive system combinations studied here as described in Figure 1. We assume that electricity is supplied by the grid with no consideration of load factor: electricity is always available either for charging a BE VTOL or to produce LH2 or eFuel. The carbon intensity is expressed in gCO2/kWh and costs in €/kWh.
- ○
- Electricity for BE: 10% charging losses are added to the energy required to fulfill the mission, a figure slightly above the best mean efficiency of 87% found by Reick et al. in 2021 [26] to reflect a 2030 state of the art.
- ○
- Electricity for liquid H2: LH2 produced from water electrolysis will be either used in a gas turbine or in a fuel cell. Our assumptions is that LH2 will be directly manufactured on site to avoid any long-distance transportation as carrying hydrogen significantly impacts the cost and CO2 emissions [16]. The value for electrolysis is 20 g/kWh or 50 kWh per kg of H2 as proposed by Younas et al. in “An Overview of Hydrogen Production: Current Status, Potential, and Challenges” [15] while the energy cost for liquefaction adds 15 kWh per kg of H2 as highlighted by Al Ghafri et al. in “Hydrogen liquefaction: a review of the fundamental physics, engineering practice and future opportunities” [27]. A total of 65 kWh of electricity per kg of LH2 is, therefore, considered in this study.
- ○
- Electricity for eFuel: as for LH2, electricity is the dominant factor when producing eFuel [11,17,28]. eFuel will require an optimized unit of production as proposed in [11,17] using either direct air capture or biogenic CO2 [28]. As for LH2, H2 is produced using water electrolysis but collocated with Fischer–Tropsch and direct air capture (DAC) units to optimize the efficiency of eFuel production. This significantly improves the efficiency as described by Peters et al. in “a techno-economic assessment of Fischer-Tropsch fuels based on syngas from co-electrolysis” [17]. The efficiency ranges from 46 to 67% and we used the value refined by the Académie des Technologies in 2023 of 22.2 kWh per kg of eFuel, an efficiency of 55% [11]. This figure considers a selectivity of 60%, which means 40% of co-products such as diesel or naphtha [11,17].
2.4. Life Cycle Assessment (LCA)
3. Results
3.1. VTOL Energy Requirements per Energy Carrier
- ○
- ○
- The gas turbine, while lighter, must accommodate a complex fuel system to allow the stored LH2 @ 21 °K to reach the combustion chamber without safety issues, leading to heavier pipes and additional monitoring and safety components [36].
3.2. Energy Requirements “Well to Rotor” in kWh
- Battery electrification: charging losses are added, so 10% of 360 kWh: 400 kWh of electricity will be used from the grid.
- eFuel: the electricity required for the Fischer–Tropsch process (H2 + CO2 + H2O) is 22.2 kWh per kg of eFuel. Since 63 kg of eFuel is required to fulfill the mission, this leads to 1399 kWh of electricity used from the grid.
- LH2: 65 kWh of electricity is required to produce 1 kg of LH2:
- ○
- GTH2: 36 kg of LH2 is required to fulfill the mission, so 2340 kWh of electricity will be used from the grid.
- ○
- FCH2: 41 kg of LH2 is required to fulfill the mission, so 2665 kWh of electricity will be used from the grid.
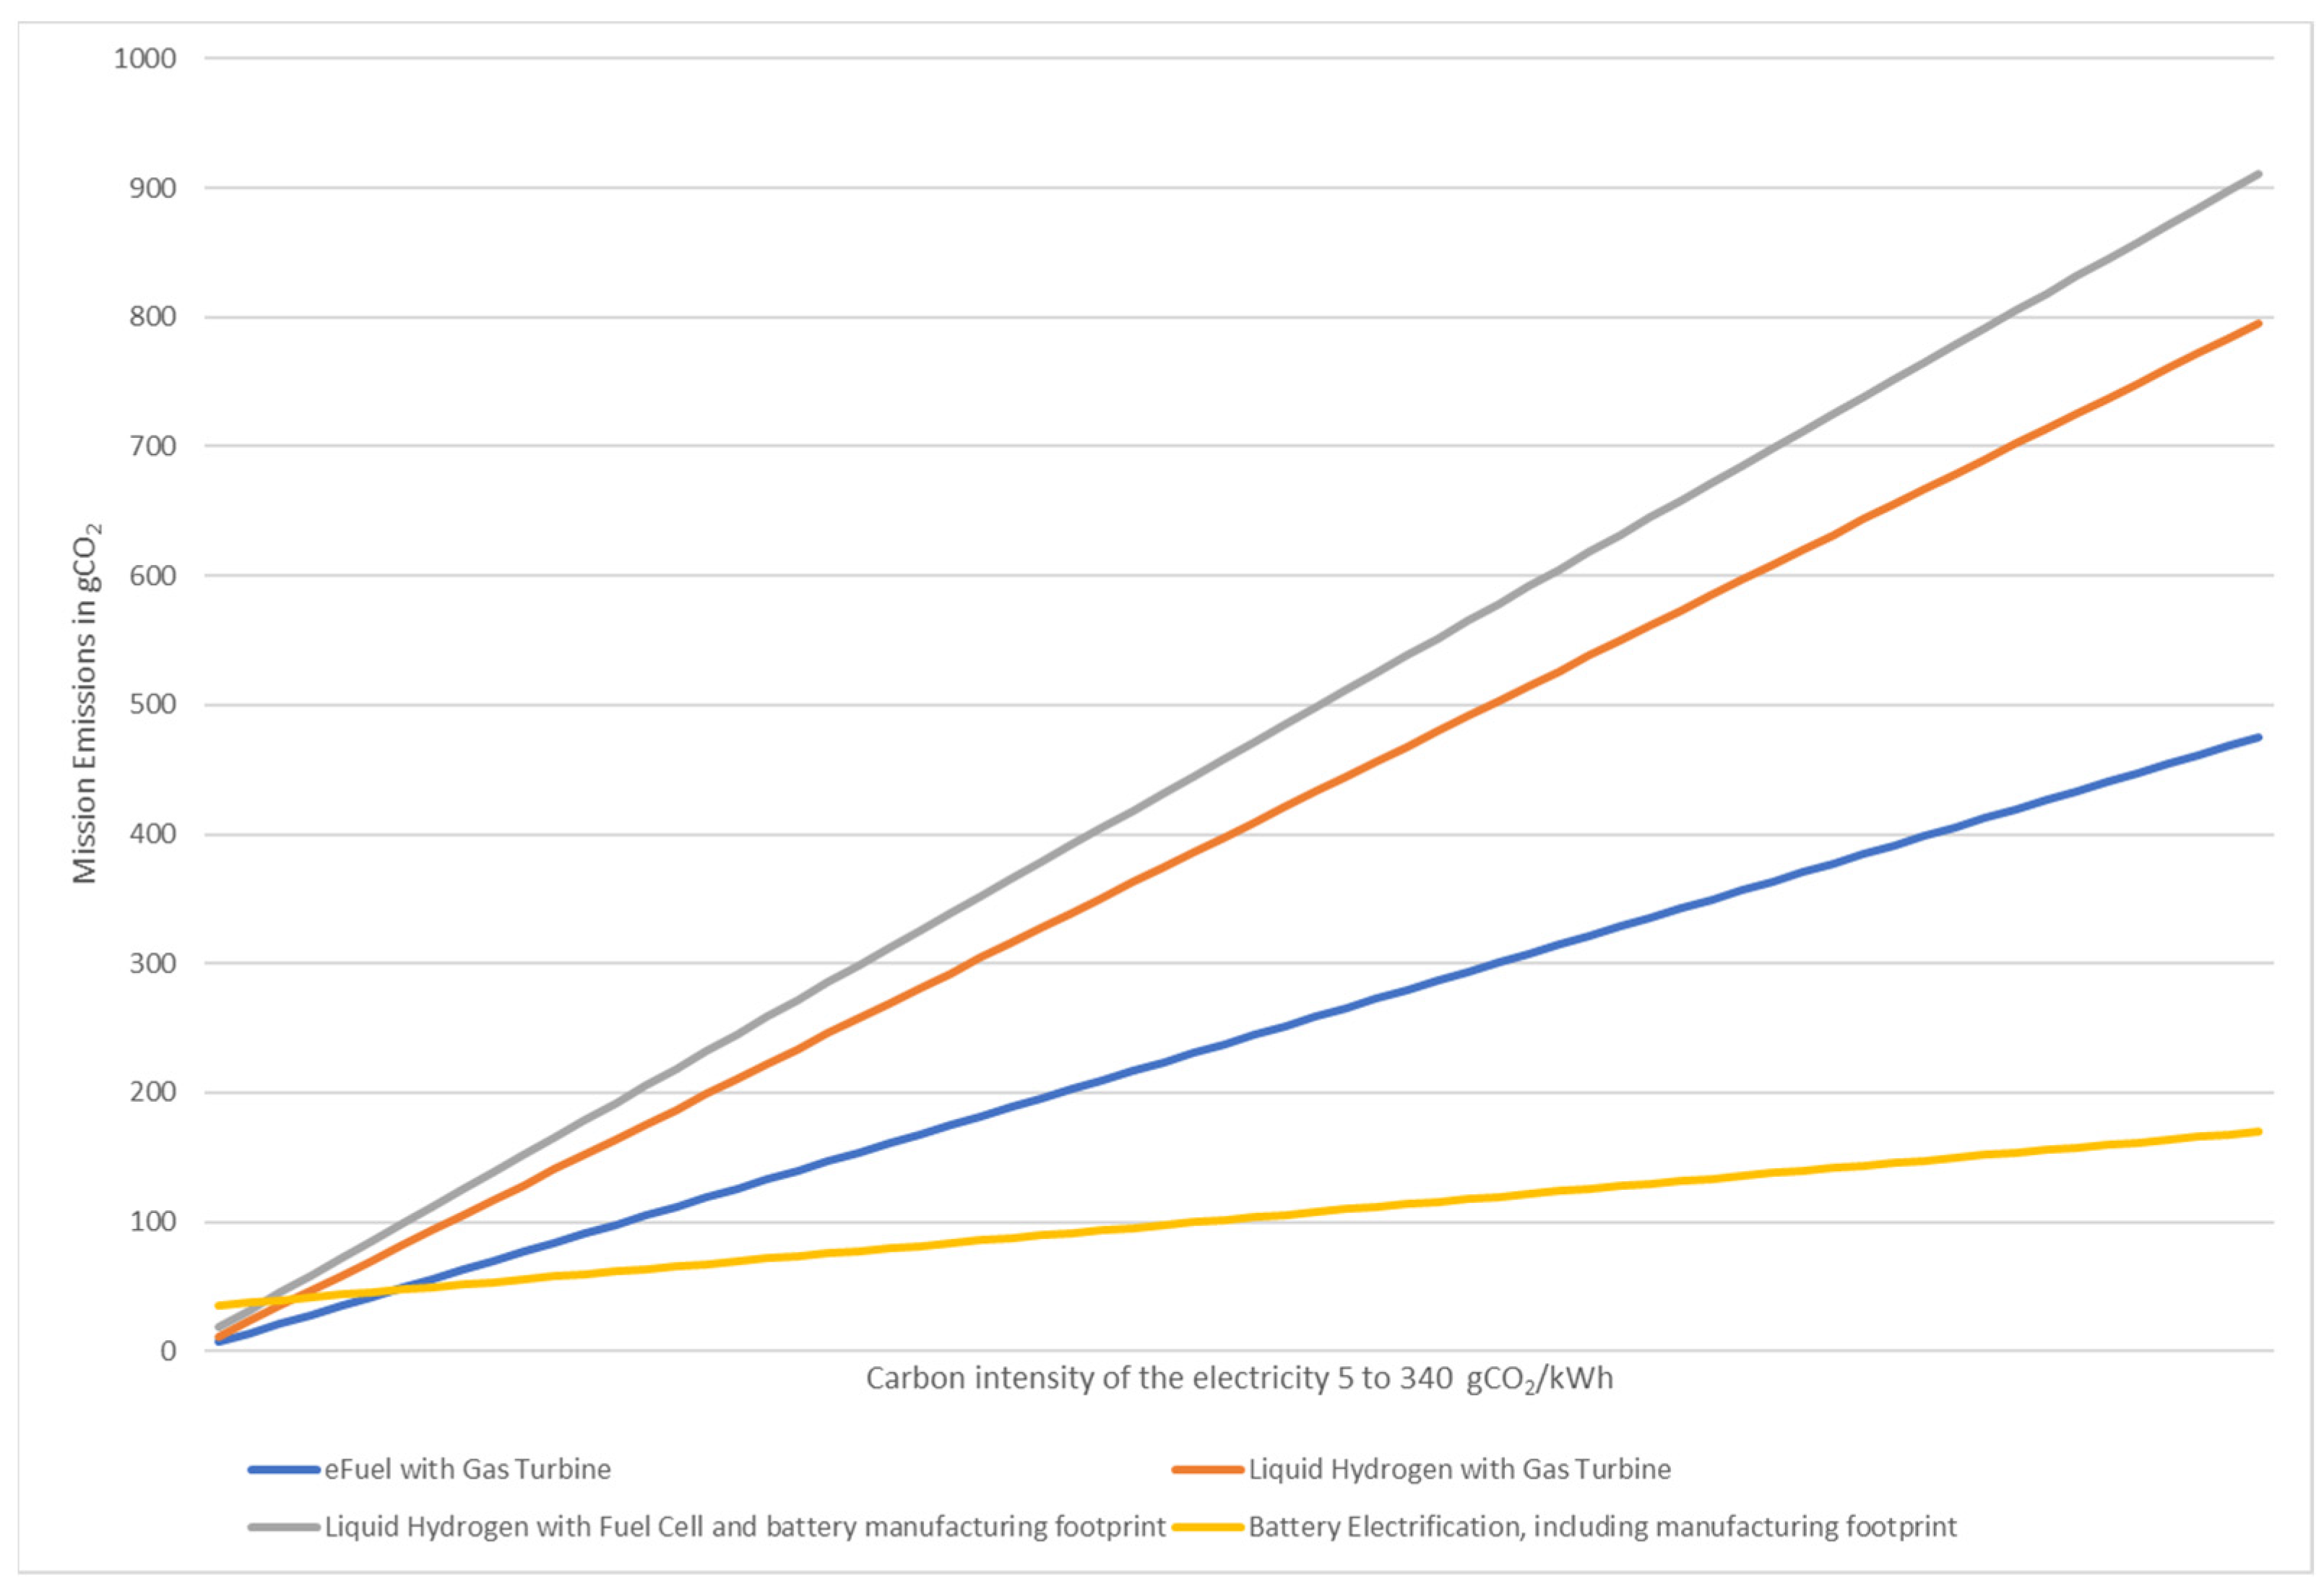
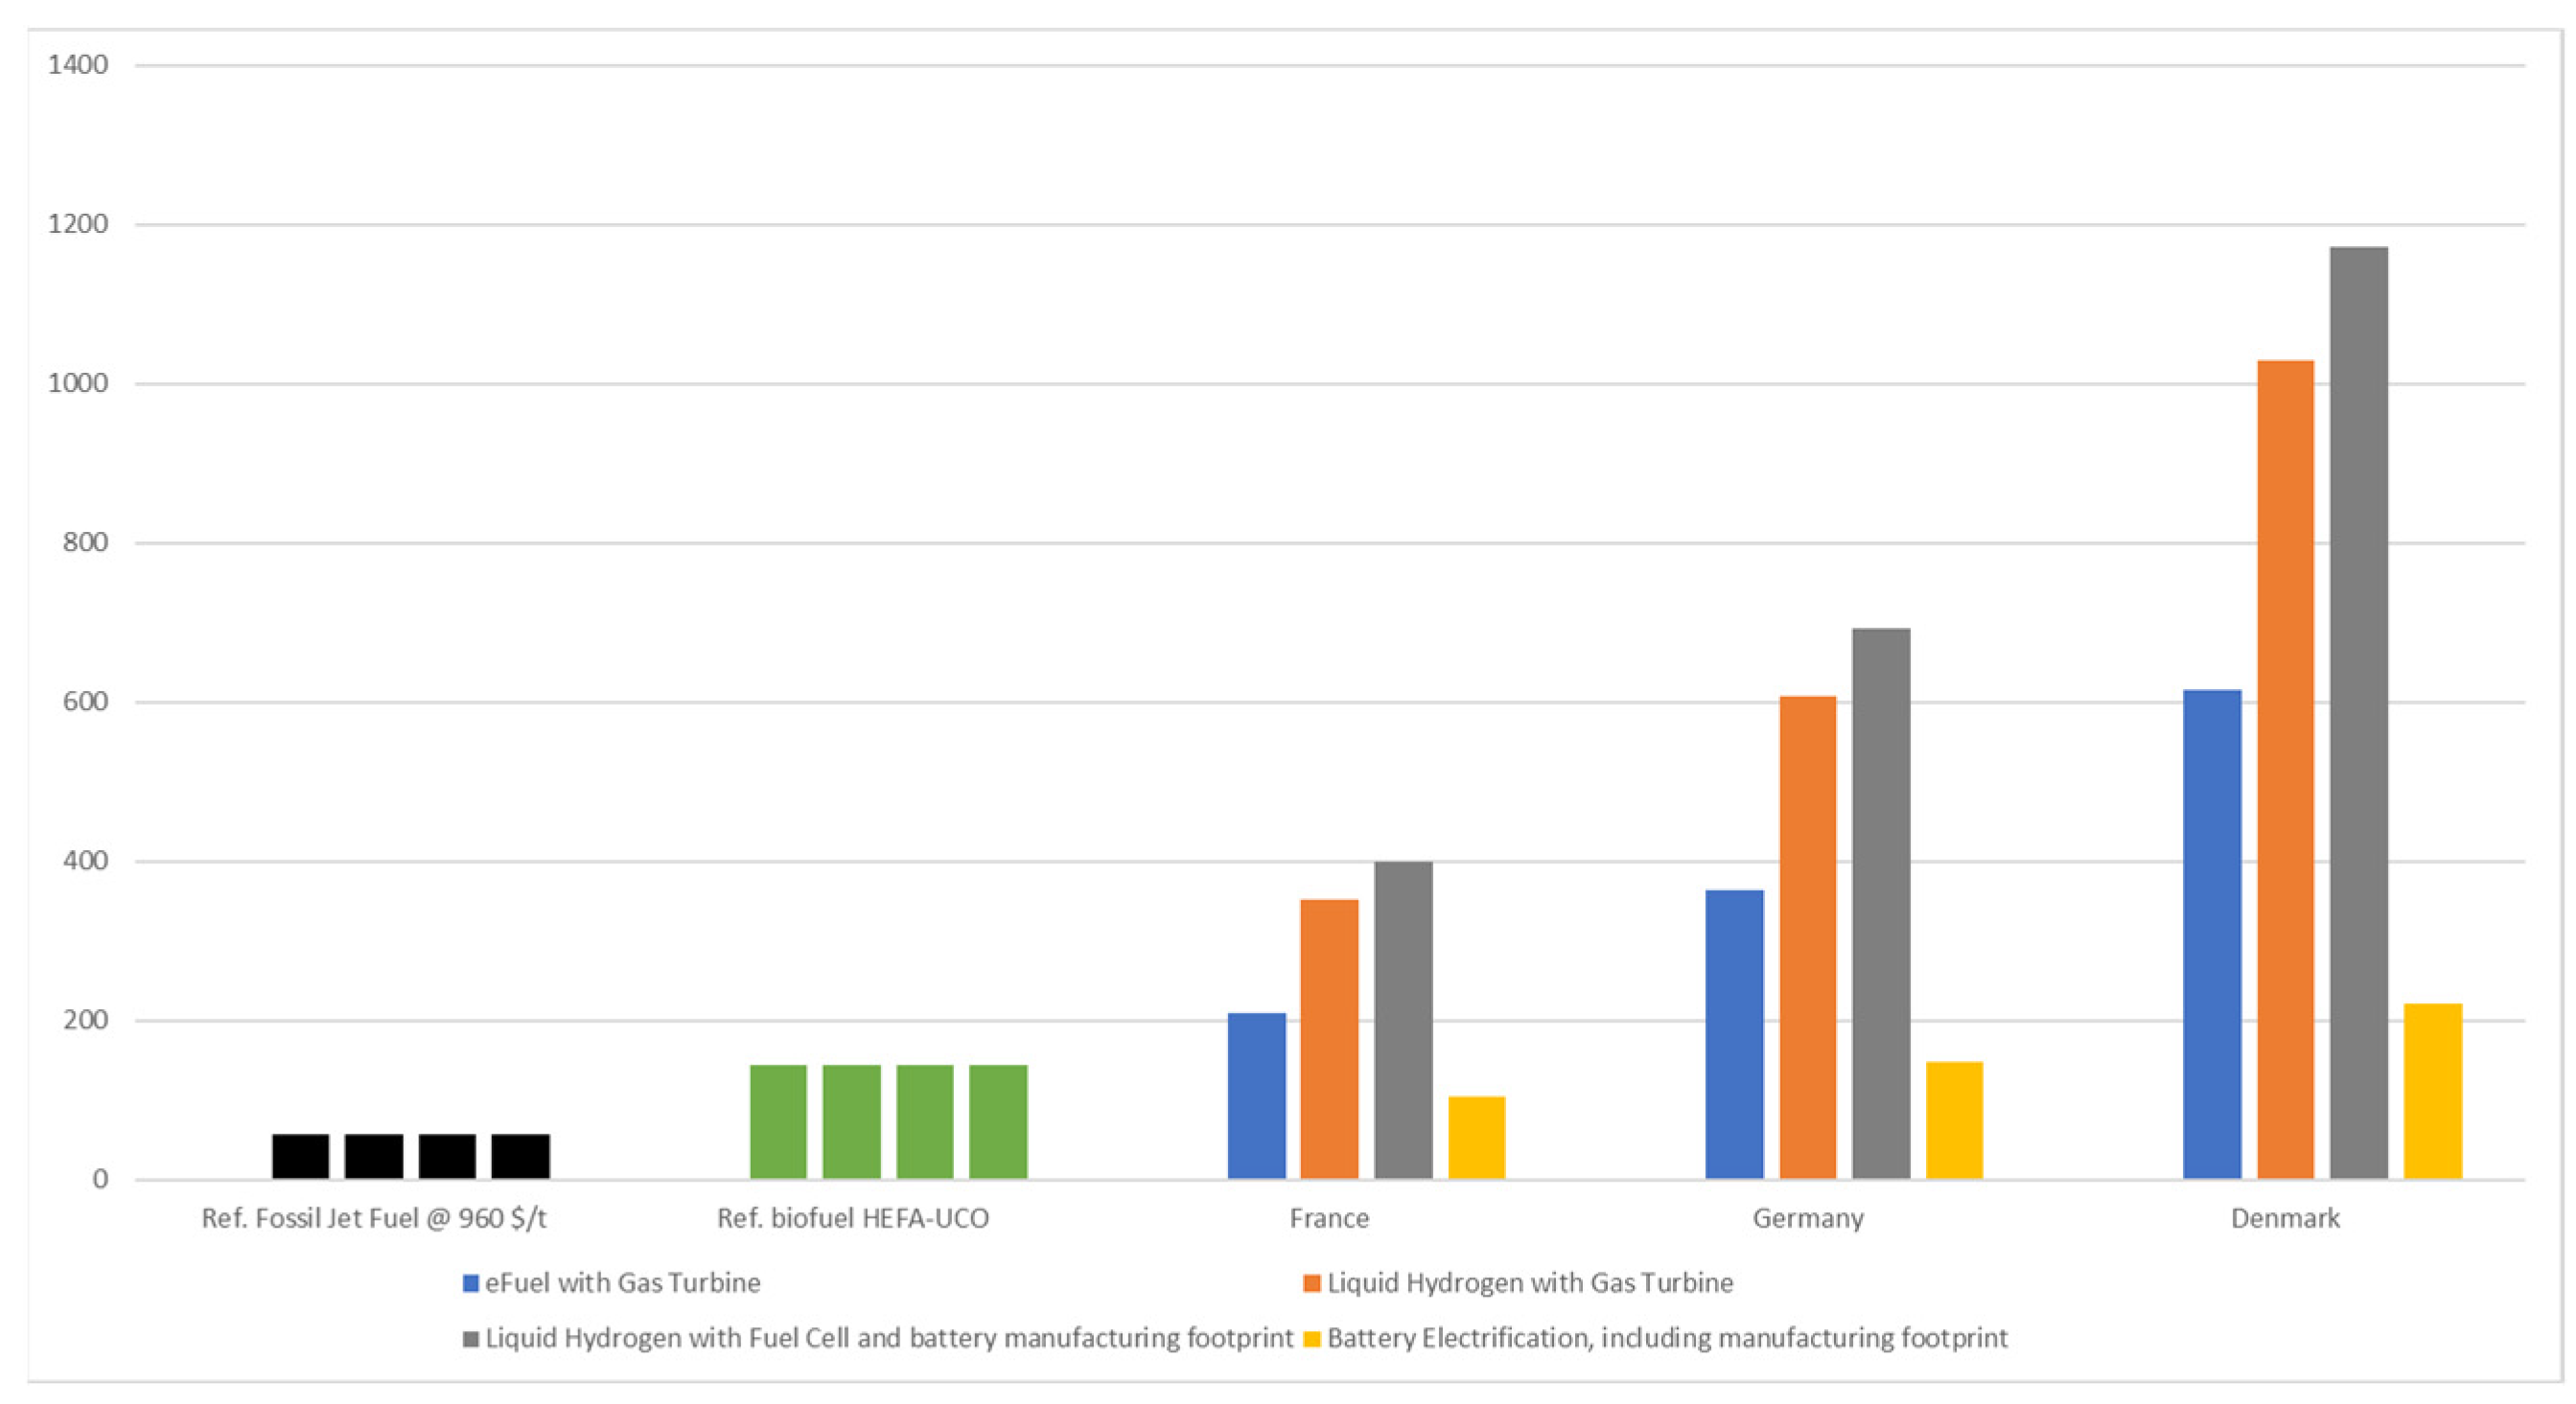
3.3. CO2 Emissions
3.4. Cost of Electricity for the Mission
4. Discussion and Conclusions
Author Contributions
Funding
Data Availability Statement
Acknowledgments
Conflicts of Interest
Abbreviations
| aDW | Downwash coefficient (-) |
| aTR | Tail rotor coefficient (-) |
| BAT | Battery |
| hPGB | Gearbox efficiency (%) |
| m | Advance ratio (-) |
| rair | Air density (kg/m3) |
| bMR | Number of blade of the main rotor (-) |
| CMR | Main rotor chord (m) |
| CAF | Conventional Aviation Fuel |
| DMR | Main rotor diameter (m) |
| FC | Fuel Cell |
| GT | Gas Turbine |
| PWBLD | Blade profile power (kW) |
| PWFUS | Fuselage power (kW) |
| PWIND | Induced power (kW) |
| SAF | Sustainable Aviation Fuel |
| SMR | Main rotor surface (m2) |
| SCx | Helicopter drag (m2) |
| T | Rotor vertical thrust (N) |
| UMR | End tip blade velocity (m/s) |
| Vi | Induced velocity (m/s) |
| Vi0 | Induced velocity in hover (m/s) |
| Vx | Aircraft horizontal speed (m/s) |
| Vz | Aircraft vertical speed (m/s) |
| WCR | Crew Weight (kg) |
| WEP | Empty Weight (kg) |
References
- Lee, D.S.; Fahey, D.W.; Skowron, A.; Allen, M.R.; Burkhardt, U.; Chen, Q.; Doherty, S.J.; Freeman, S.; Forster, P.M.; Fuglestvedt, J.; et al. The contribution of global aviation to anthropogenic climate forcing for 2000 to 2018. Atmos. Environ. 2021, 244, 117834. [Google Scholar] [CrossRef]
- ATAG Waypoint 2050 Report. 2021, p. 5. Available online: https://aviationbenefits.org/media/167418/w2050_v2021_27sept_summary.pdf (accessed on 4 April 2023).
- Tjandra, A.; Basset, P.M.; Vincent, R.; Chishty, W.; Bérat, C.; Peluso, R. GHG Reduction Study for the Rotorcraft Industry. In Proceedings of the 76th Annual Forum & Technology Display Vertical Flight Society, Online, 5–8 October 2020; p. 7. Available online: https://hal.science/hal-03225084 (accessed on 15 September 2022).
- Dahal, K.; Brynolf, S.; Xisto, C.; Hansson, J.; Grahn, M.; Grönstedt, T.; Lehtveer, M. Techo-economic review of alternative fuels and propulsion systems for the aviation sector. Renew. Sustain. Energy Rev. 2021, 151, 111564. [Google Scholar] [CrossRef]
- Kuśmierek, A.; Galiński, C.; Stalewski, W. Review of the hybrid gas—Electric aircraft propulsion systems versus alternative systems. Prog. Aerosp. Sci. 2023, 141, 100925. [Google Scholar] [CrossRef]
- Brejle and Martins, Electric, hybrid, and turboelectric fixed-wing aircraft: A review of concepts, models, and design approaches. Prog. Aerosp. Sci. 2019, 104, 1–19. [CrossRef]
- Adler and Martins, Hydrogen-powered aircraft: Fundamental concepts, key technologies, and environmental impacts. Prog. Aerosp. Sci. 2023, 141, 100922. [CrossRef]
- Lark, T.J.; Hendricks, N.P.; Smith, A.; Pates, N.; Spawn-Lee, S.A.; Bougie, M.; Booth, E.G.; Kucharik, C.J.; Gibbs, H.K. Environmental Outcomes of the US Renewable Fuel Standard. Proc. Natl. Acad. Sci. USA 2022, 119, e2101084119. Available online: https://www.pnas.org/doi/full/10.1073/pnas.2101084119 (accessed on 19 April 2023). [CrossRef]
- Becken, S.; Mackey, B.; Lee, D.S. Implications of preferential access to land and clean energy for Sustainable Aviation Fuels. Sci. Total. Environ. 2023, 886, 163883. [Google Scholar] [CrossRef]
- Grahn, M.; Malmgren, E.; Korberg, A.D.; Taljegard, M.; Anderson, J.E.; Brynolf, S.; Hansson, J.; Skov, I.R.; Wallington, T.J. Review of electrofuels feasibility. Prog. Energy 2022, 4, 032010. [Google Scholar] [CrossRef]
- Rapport de l’Académie des Technologies. La Décarbonation du Secteur Aérien par la Production de Carburants Durables. 2023, pp. 54–58. Available online: https://www.academie-technologies.fr/wp-content/uploads/2023/03/Rapport-decarbonation-secteur-aerien-production-carburants-durables-AT-Mars-2023.pdf (accessed on 27 March 2023).
- European Parliament, September. 2023. Available online: https://www.europarl.europa.eu/news/en/press-room/20230911IPR04913/70-of-jet-fuels-at-eu-airports-will-have-to-be-green-by-2050 (accessed on 4 October 2023).
- Rojas-Michaga, M.F.; Michailos, S.; Cardozo, E.; Akram, M.; Hughes, K.J.; Ingham, D.; Pourkashanian, M. Sustainable aviation fuel production through power-to-liquid: A combined techno-economic and life cycle assessment. Energy Convers. Manag. 2023, 292, 117427. [Google Scholar] [CrossRef]
- Schmidt, P.; Batteiger, V.; Roth, A.; Weindorf, W.; Raksha, T. Power to Liquids as renewable fuel option for aviation. Chem. Ing. Tech. 2018, 90, 127–140. [Google Scholar] [CrossRef]
- Younas, M.; Shafique, S.; Hafeez, A.; Javed, F.; Rehman, F. An Overview of Hydrogen Production: Current Status, Potential, and Challenges. Fuel 2022, 316, 123317. [Google Scholar] [CrossRef]
- Galimova, T.; Fasihi, M.; Bogdanov, D.; Breyer, C. Impact of international transportation chains on cost of green e-hydrogen: Global cost of hydrogen and consequences for Germany and Finland. Appl. Energy 2023, 347, 121369. [Google Scholar] [CrossRef]
- Peters, R.; Wegener, N.; Samsun, R.C.; Schorn, F.; Riese, J.; Grünewald, M.; Stolten, D. A techno-economic assessment of Fischer-Tropsch fuels based on syngas from co-electrolysis. Processes 2022, 10, 699. [Google Scholar] [CrossRef]
- Liberacki, A.; Trincone, B.; Duca, G.; Aldieri, L.; Vinci, C.P.; Carlucci, F. The Environmental Life Cycle Costs of Urban Air Mobility as an input for sustainable urban mobility. J. Clean. Prod. 2023, 389, 136009. [Google Scholar] [CrossRef]
- Tremolet, Modèles et Méthodes Numériques les Études Conceptuelles D’aéronefs à Voilure Tournante within “the Concepts of Rotorcraft Enhanced Assessment through Integrated Optimization Network Project”. 2014. Available online: https://theses.hal.science/tel-00952559 (accessed on 3 June 2022).
- Tian, W.; Liu, L.; Zhang, X.; Shao, J.; Ge, J. A coordinated optimization method of energy management and trajectory optimization for hybrid electric UAVs with PV/Fuel Cell/Battery. Int. J. Hydrogen Energy 2024, 50, 1110–1121. [Google Scholar] [CrossRef]
- Khan, F.M.N.U.; Rasul, M.G.; Sayem, A.; Mandal, N.K. Design and optimization of lithium-ion battery as an efficient energy storage device for electric vehicles: A comprehensive review. J. Energy Storage 2023, 71, 108033. [Google Scholar] [CrossRef]
- Seber, G.; Escobar, N.; Valin, H.; Malina, R. Uncertainty in life cycle greenhouse gas emissions of sustainable aviation fuels from vegetable oils. Renew. Sustain. Energy Rev. 2022, 170, 112945. [Google Scholar] [CrossRef]
- Shahriar, M.F.; Khanal, A. The current techno-economic, environmental, policy status and perspectives of sustainable aviation fuel (SAF). Fuel 2022, 325, 124905. [Google Scholar] [CrossRef]
- Commission Delegated Regulation, EC Europa. 2023, p. 2. Available online: https://energy.ec.europa.eu/system/files/2023-02/C_2023_1086_1_EN_annexe_acte_autonome_part1_v4.pdf (accessed on 9 October 2023).
- Boehm, R.C.; Yang, Z.; Bell, D.C.; Feldhausen, J.; Heyne, J.S. Lower heating value of jet fuel from hydrocarbon class concentration data and thermo-chemical reference data: An uncertainty quantification. Fuel 2021, 311, 122542. [Google Scholar] [CrossRef]
- Reick, B.; Konzept, A.; Kaufmann, A.; Stetter, R.; Engelmann, D. Influence of Charging Losses on Energy Consumption and CO2 Emissions of Battery-Electric Vehicles. Vehicles 2021, 3, 736–748. [Google Scholar] [CrossRef]
- Al Ghafri, S.Z.; Munro, S.; Cardella, U.; Funke, T.; Notardonato, W.; Trusler, J.P.M.; Leachman, J.; Span, R.; Kamiya, S.; Pearce, G.; et al. Hydrogen liquefaction: A review of the fundamental physics, engineering practice and future opportunities. Energy Environ. Sci. 2022, 15, 2690–2731. [Google Scholar] [CrossRef]
- Pio, D.; Vilas-Boas, A.; Araújo, V.; Rodrigues, N.; Mendes, A. Decarbonizing the aviation sector with Electro Sustainable Aviation Fuel (eSAF) from biogenic CO2 captured at pulp mills. Chem. Eng. J. 2023, 463, 142317. [Google Scholar] [CrossRef]
- Howe, S.; Kolios, A.; Brennan, F. Environmental life cycle assessment of commercial passenger jet airliners. Transp. Res. Part D Transp. Environ. 2013, 19, 34–41. [Google Scholar] [CrossRef]
- Jakovljević, I.; Mijailović, R.; Mirosavljević, P. Carbon dioxide emission during the life cycle of turbofan aircraft. Energy 2018, 148, 866–875. [Google Scholar] [CrossRef]
- Ellingsen, L.A.-W.; Thorne, R.J.; Wind, J.; Figenbaum, E.; Romare, M.; Nordelöf, A. Life cycle assessment of battery electric buses. Transp. Environ. 2022, 112, 103498. [Google Scholar] [CrossRef]
- Dai, Q.; Kelly, J.C.; Gaines, L.; Wang, M. Life Cycle Analysis of Lithium-Ion Batteries for Automotive Applications. Batteries 2019, 5, 48. [Google Scholar] [CrossRef]
- Su-Ungkavatin, P.; Tiruta-Barna, L.; Hamelin, L. Biofuels, electrofuels, electric or hydrogen: A review of current and emerging sustainable aviation systems. Prog. Energy Combust. Sci. 2023, 96, 101073. [Google Scholar] [CrossRef]
- Lutsey, N.; Nicholas, M. Update on electric vehicle costs through 2030. In Proceedings of the ICCT, Washington, DC, USA, 2 April 2019. [Google Scholar] [CrossRef]
- Graf, T.; Fonk, R.; Paessler, S.; Bauer, C.; Kallo, J.; Willich, C. Low pressure influence on a direct fuel cell battery hybrid system for aviation. Int. J. Hydrogen Energy 2023, 50, 672–681. [Google Scholar] [CrossRef]
- Manigandan, S.; Praveenkumar, T.; Ryu, J.I.; Verma, T.N.; Pugazhendhi, A. Role of hydrogen on aviation sector: A review on hydrogen storage, fuel flexibility, flame stability, and emissions reduction on gas turbines engines. Fuel 2023, 352, 129064. [Google Scholar] [CrossRef]
- Park, S.-W.; Son, S.-Y. Techno-economic analysis for the electric vehicle battery aging management of charge point operator. Energy 2023, 280, 128095. [Google Scholar] [CrossRef]
- You, H.; Zhu, J.; Wang, X.; Jiang, B.; Wei, X.; Dai, H. Nonlinear aging knee-point prediction for lithium-ion batteries faced with different application scenarios. eTransportation 2023, 18, 100270. [Google Scholar] [CrossRef]
- Scarlat, N.; Prussi, M.; Padella, M. Quantification of the carbon intensity of electricity produced and used in Europe. Appl. Energy 2021, 305, 117901. [Google Scholar] [CrossRef]
- Regulation of the European Parliament and of the Council on Ensuring a Level Playing Field for Sustainable Air Transport. Available online: https://eur-lex.europa.eu/resource.html?uri=cellar:00c59688-e577-11eb-a1a5-01aa75ed71a1.0001.02/DOC_1&format=PDF (accessed on 16 January 2023).
- Idel, R. Levelized Full System Costs of Electricity. Energy 2022, 259, 124905. [Google Scholar] [CrossRef]
- Connolly, D.; Mathiesen, B.; Ridjan, I. A comparison between renewable transport fuels that can supplement or replace biofuels in a 100% renewable energy system. Energy 2014, 73, 110–125. [Google Scholar] [CrossRef]
- Zhang, J.; Roumeliotis, I.; Zhang, X.; Zolotas, A. Techno-economic-environmental evaluation of aircraft propulsion electrification: Surrogate-based multi-mission optimal design approach. Renew. Sustain. Energy Rev. 2023, 175, 113168. [Google Scholar] [CrossRef]
- Statista. The Price of Electricity in Most European Countries. Available online: https://fr.statista.com/infographie/30253/comparaison-prix-electricite-pour-les-industriels-entreprises-par-pays-en-europe/ (accessed on 4 October 2023).
- European Council. How Is Electricity Produced and Sold. Available online: https://www.consilium.europa.eu/en/infographics/how-is-eu-electricity-produced-and-sold/ (accessed on 4 October 2023).


| Property | Jet Fuel | LH2 |
|---|---|---|
| Specific energy (MJ/kg) | 43.2 | 120 |
| Energy density (MJ/L) | 34.9 | 8.5 |
| Storage temperature (K) | Ambient | 21 °K |
| Storage pressure (bar) | Ambient | 2 |
| Tank gravimetric efficiency (%) | 100% | 30% |
| H2 and Fuel Cell | Batteries | Power Distribution |
|---|---|---|
| H2 LHV: 33 kWh/kg LH2 density @ 21 °K 1 atm: 71 kg/m3 LH2 max usable fuel in tank: 80% | Max C Rate: 6 Depth of discharge: 90% Cell energy density @ 2C: 600 Whkg−1 Integration factor: 1.35 | Distribution efficiency: 99% eMotor efficiency: 95% eMotor power density: 8 kW/kg |
| LH2 gravimetric index: 30% Fuel Cell efficiency: 50% Fuel Cell power density: 1.5 kW/kg |
| Propulsive System | Component Weight in kg | Propulsive System Weight | VTOL TOW | Energy Required to Perform the Mission | ||||
|---|---|---|---|---|---|---|---|---|
| Turbine/Fuel Cell | Tank | Battery | Electric Motor | Others | ||||
| Gas Turbine with eFuel | 120 | 20 | N/A | 190 | 1400 | 63 kg of eFuel | ||
| Gas Turbine with LH2 | 160 | 210 | 670 | 1040 | 2500 | 36 kg of LH2 | ||
| Fuel Cell with LH2 | 800 | 220 | 160 | 80 | 40 | 1300 | 2900 | 41 kg of LH2 |
| Battery Electrification | 870 | 80 | 100 | 1050 | 2700 | 360 kWh of electricity | ||
| Mission: 4 Pax, 80 NM | VTOL Energy Carrier Requirement | Electricity Required to Produce the Energy Vector | Total Electricity Consumption, kWh |
|---|---|---|---|
| Gas Turbine with eFuel | 63 kg | 22.2 kWh/kg | 1399 |
| Gas Turbine with LH2 | 36 kg | 65 kWh/kg | 2340 |
| Fuel Cell with LH2 | 41 kg | 65 kWh/kg | 2665 |
| Battery Electrification | 360 kWh | 10% charging losses | 400 |
Disclaimer/Publisher’s Note: The statements, opinions and data contained in all publications are solely those of the individual author(s) and contributor(s) and not of MDPI and/or the editor(s). MDPI and/or the editor(s) disclaim responsibility for any injury to people or property resulting from any ideas, methods, instructions or products referred to in the content. |
© 2024 by the authors. Licensee MDPI, Basel, Switzerland. This article is an open access article distributed under the terms and conditions of the Creative Commons Attribution (CC BY) license (https://creativecommons.org/licenses/by/4.0/).
Share and Cite
Jarin, J.-B.; Beddok, S.; Haritchabalet, C. Techno-Economic Comparison of Low-Carbon Energy Carriers Based on Electricity for Air Mobility. Energies 2024, 17, 1151. https://doi.org/10.3390/en17051151
Jarin J-B, Beddok S, Haritchabalet C. Techno-Economic Comparison of Low-Carbon Energy Carriers Based on Electricity for Air Mobility. Energies. 2024; 17(5):1151. https://doi.org/10.3390/en17051151
Chicago/Turabian StyleJarin, Jean-Baptiste, Stéphane Beddok, and Carole Haritchabalet. 2024. "Techno-Economic Comparison of Low-Carbon Energy Carriers Based on Electricity for Air Mobility" Energies 17, no. 5: 1151. https://doi.org/10.3390/en17051151
APA StyleJarin, J.-B., Beddok, S., & Haritchabalet, C. (2024). Techno-Economic Comparison of Low-Carbon Energy Carriers Based on Electricity for Air Mobility. Energies, 17(5), 1151. https://doi.org/10.3390/en17051151