1. Introduction
Passenger urban transport is essential in enabling people to carry out their daily activities, such as work, education, and leisure [
1]. Every day, cities face the challenge of moving their citizens through a complex system of individual and collective modes of transportation while minimizing costs and reducing travel time [
2]. At the same time, they strive to maintain and improve transport infrastructure and mitigate noise and air pollution, which can have severe health consequences and make urban life unpleasant for residents [
2]. The health damages associated with exposure to air pollution have been estimated to cost the global economy USD 8.1 trillion, equivalent to 6.1 percent of global GDP [
3].
Cities worldwide have experienced a shift in their economic landscape, where factories have moved away from rural regions and urban areas have become dominated by service-based industries. This change has resulted in a significant number of people being displaced due to the growth of large-scale businesses in specific locations, which have attracted both workers and consumers. Unfortunately, this approach has often failed to support the development of local businesses, thereby limiting the potential for these areas to thrive.
Around 3000 people die every year as a result of air pollution, and the primary cause of this pollution is transportation [
4]. Diesel-fueled vehicles, in particular, are responsible for emitting particles that are more harmful to human health than particles from most other sources of air pollution [
3]. As a result, society has been seeking alternative solutions to reduce these emissions by implementing more sustainable energy sources.
In Poland, local governments employ reduced tax rates on means of transportation to encourage hybrid and electric vehicles [
5]. The European Union has set an ambitious target to reduce total emissions to 55% for cars and 50% for vans by 2030 because road transport contributes 25% of total annual emissions within the EU [
6]. The São Paulo City Hall, Brazil, intends to neutralize greenhouse gas (GHG) emissions by 2050, electrifying the whole bus fleet of the city using battery buses [
7]. The country has 107,000 diesel-fueled buses responsible for 85.7% of public transport journeys in cities [
8], whereas São Paulo, the most populous one with more than 11 million people, has a bus fleet of 13,309 vehicles [
7].
The emission of carbon dioxide (CO
2) in the transportation sector is a significant contributor to greenhouse gas (GHG) emissions caused by human/made activities [
9]. One solution to control and mitigate these emissions that has been around for a century to move people sustainably within cities is the trolleybus system. However, these systems are disappearing, and battery electric buses (BEBs) are being considered as a solution for reducing emissions from buses.
With those ideas in mind, this paper is seeking to provide answers to the following research questions.
RQ1—Is the trolleybus efficient enough to be considered as an alternative for the transition energy matrix in public transportation?
RQ2—In comparison to a diesel and battery electric bus, is the trolleybus system feasible?
This paper proposes a case study in the biggest city in Latin America, São Paulo, Brazil. The objective is to compare the trolleybus with diesel buses regarding no CO2, noise, and GHG emissions. Moreover, we compare trolleybus with battery electric buses, considering operational costs and environmental benefits. The city was chosen because it is a metropolis with the second most extensive trolleybus system on the American continent. Moreover, a case study allows us to have available data to compare the feasibility of public transport electrification in detail, based on figures, and to bring accurate data to academic discussion. The results of this research may motivate new studies worldwide with the objective of investigating trolleybus efficiency as an alternative to public transport in cities with these transport systems and discussing whether to maintain those systems in the energy transition matrix.
2. Literature Review
2.1. Trolleybuses
Trolleybuses are electrically powered vehicles connected to an overhead network. The term “trolleybuses” comes from the combination of the English words “trolley” (referring to the wire) and “bus”. These systems can trace their roots back to the Elekromote, created by Siemens and Holske in Germany in 1882 [
10]. The UK saw its first two trolleybus lines in operation in 1911 [
11].
In 1920, trolleybus services expanded to America, to the United States, and considerable acceptance of this type of vehicle occurred within urban transport companies [
12]. At the same time, in Eastern Europe, trolleybuses were implemented in several cities [
12].
Trolleybus systems had a fast rate of adoption in Europe, and one of the reasons was the conversion of part of the structure used by trams to the new trolleybus system. They are equipped with tires, and provide more flexibility than trams and can be easily maneuvered [
13].
The use of trolleybuses increased rapidly between the 1930s and the 1950s. The UK had the largest fleet in Western Europe, with London alone having 1764 vehicles [
12]. There were 7280 trolleybuses in the US in 1952, an increase of 329% compared to 1939 [
12]. Other countries such as Mexico, Spain, France, Italy, Yugoslavia, Greece, and Sweden also implemented new trolleybus systems during this time [
12].
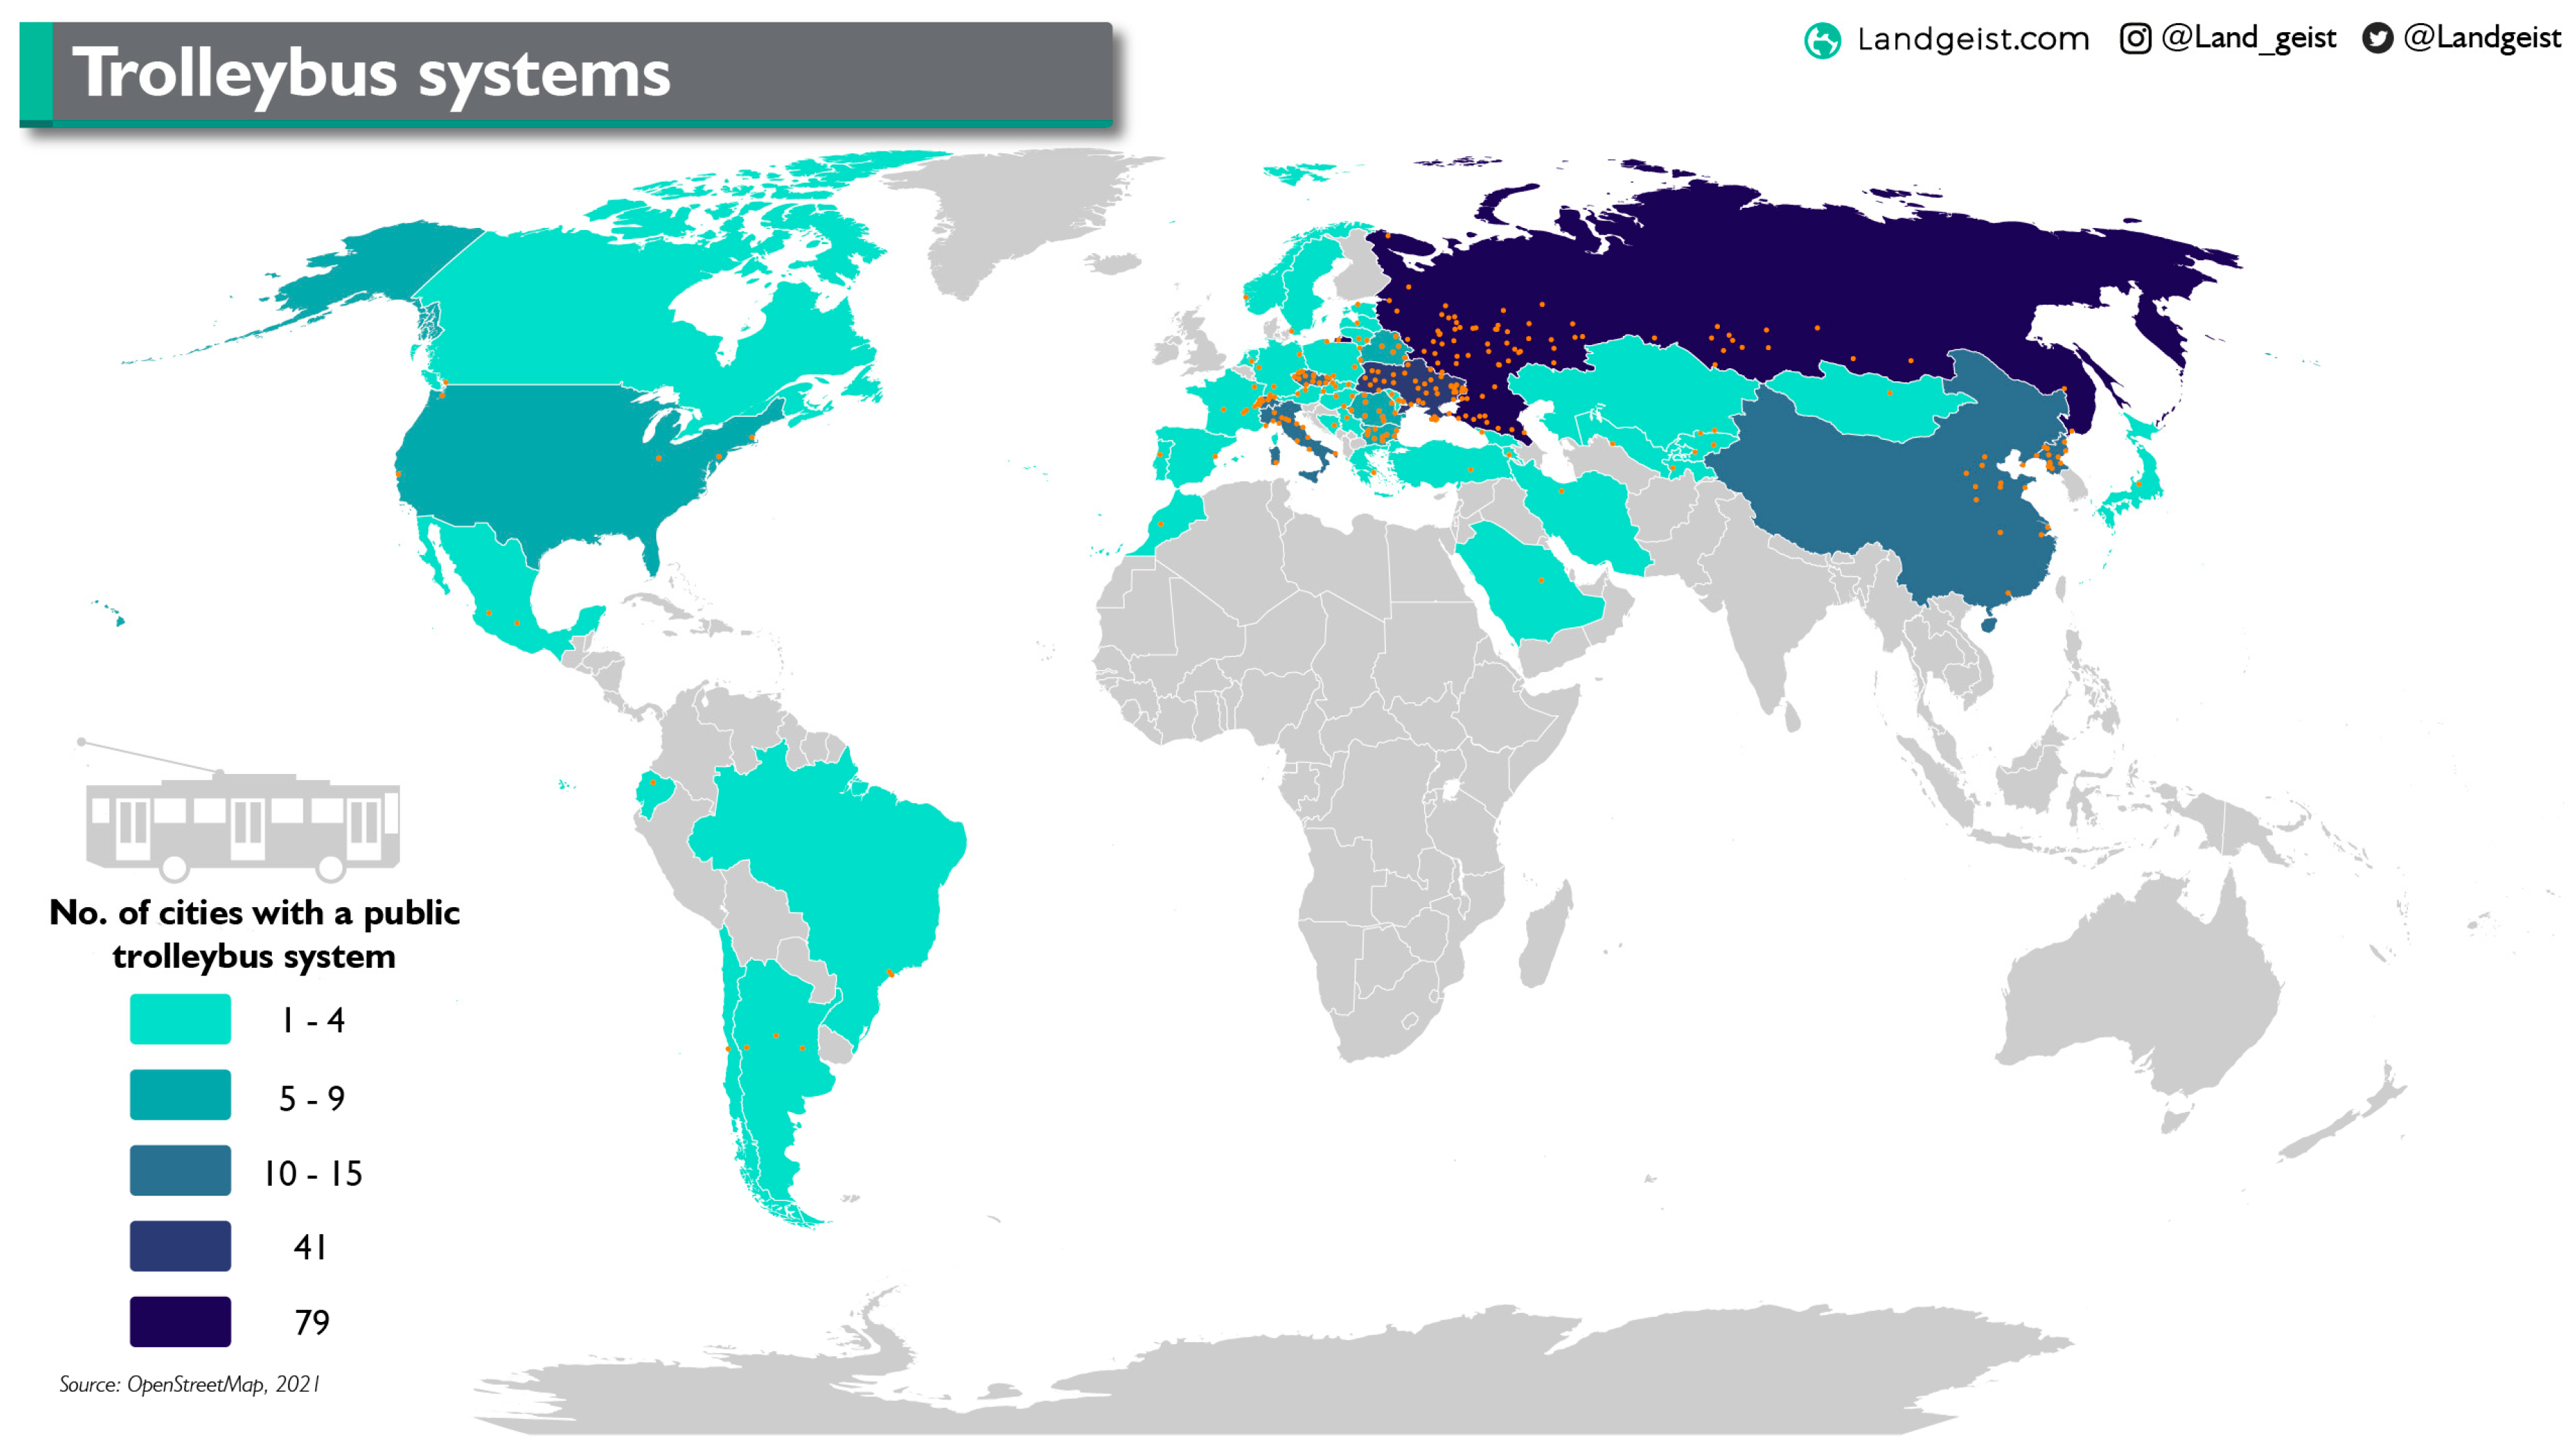
In the latter half of the 20th century, trolleybus systems experienced a decline. Currently, there are trolleybus lines in only approximately 300 cities worldwide (
Figure 1), whereas in the past there were over 800 systems (as shown in
Figure 1) [
14,
15]. However, many of these trolleybus lines serve as a complementary mode of transport alongside other forms of transportation.
Currently, the majority of trolleybus systems are located in Europe and Asia, with the highest concentration being in the former Soviet states. This is believed to be due to the sanctions imposed by the US and Western Europe during the Cold War [
16]. In Latin America, there are currently 1064 trolleybuses in operation, accounting for 21% of the total of 5084 electric buses in circulation in the region as of February 2024 [
17].
The trolleybus system in Mexico City is the largest in Latin America, boasting 500 vehicles. São Paulo city follows, with 201 vehicles [
17]. Other cities in the region that offer trolleybus services include Córdoba, Rosario, and Valparaíso in Argentina, Quito in Ecuador, Guadalajara in Mexico, and Mérida in Venezuela [
17].
Trolleybuses now operate in 150 European cities [
18,
19]. Pardubice, Lausanne, Landskrona and Salzburg are examples of public transport that are exclusively made up of these vehicles [
20]. Trolleybuses benefit from their quiet operation, zero emissions, and strong EU subsidies for green transport. Despite the many advantages of trolleybuses, their previous disadvantages are the mains harnesses and the total dependence of the vehicle on the power source.
Modern electric transport technology makes it possible not to set up another traction network, and traditional trolleybuses can replace duobuses, using the current network and moving outside it as electric buses. Electric buses are very expensive at the moment, and not every city can afford to change its rolling stock, especially cities which suffered mass liquidations in the 60s and 70s. In the 20th century, it was possible to maintain these lines; cities will continue to develop the existing infrastructure and modernize the rolling stock. It cannot be ruled out that as the manufacturer’s technology progresses, the price of the electric bus will become acceptable to individual cities and the trolleybus will “take off” its harnesses, because the idea of electric transport will develop.
Poland is one of the largest bus markets in Europe. According to the PZPM (Polish Automotive Industry Association) report, it is the third largest bus manufacturer in the union. The vast majority (more than 80 percent) of buses produced in Poland are sold on foreign markets (mainly Germany, France, and Scandinavia). EU standards clearly support the development of urban transport with reduced noise and emissions, such as electric buses and trolleybuses [
21].
In Poland the two largest producers are Ursus and Solaris. Solaris vehicles drive on the streets of dozens of cities in several countries: Austria, Bulgaria, Czech Republic, Estonia, Germany, Italy, Poland, Portugal, Romania, Spain, Sweden, and Switzerland, as well as Lithuania, Latvia and Hungary. Ursus Ekovolt trolleybuses, like Trollino Solarisa, are not tied by harnesses to electric traction. Modern vehicles also have battery systems, which allow them to move even outside the grid using electric drive. The minimum price of Ursus Ekovolt reaches PLN 1.6 million, almost two times more expensive than a traditional bus.
2.2. In-Motion-Charging Technology
Trolleybus systems are often questioned due to their higher cost compared to diesel buses and the risk of levers escaping from the overhead network, causing traffic disruptions. However, newer models of trolleybuses come equipped with batteries that enable them to travel independently from the network when necessary. These batteries are relatively small and can be easily replaced at the end of their lifespan, unlike the stationary batteries used in battery electric buses (BEBs).
Bartłomiejczyk and Połom [
22] point out that trolleybuses are an important solution for reducing the use of fossil fuels in urban public transportation. Trolleybuses use small batteries in comparison to battery electric buses and these batteries enable trolleybuses to operate without an overhead network, making the system more feasible with the help of in-motion-charging (IMC) technology.
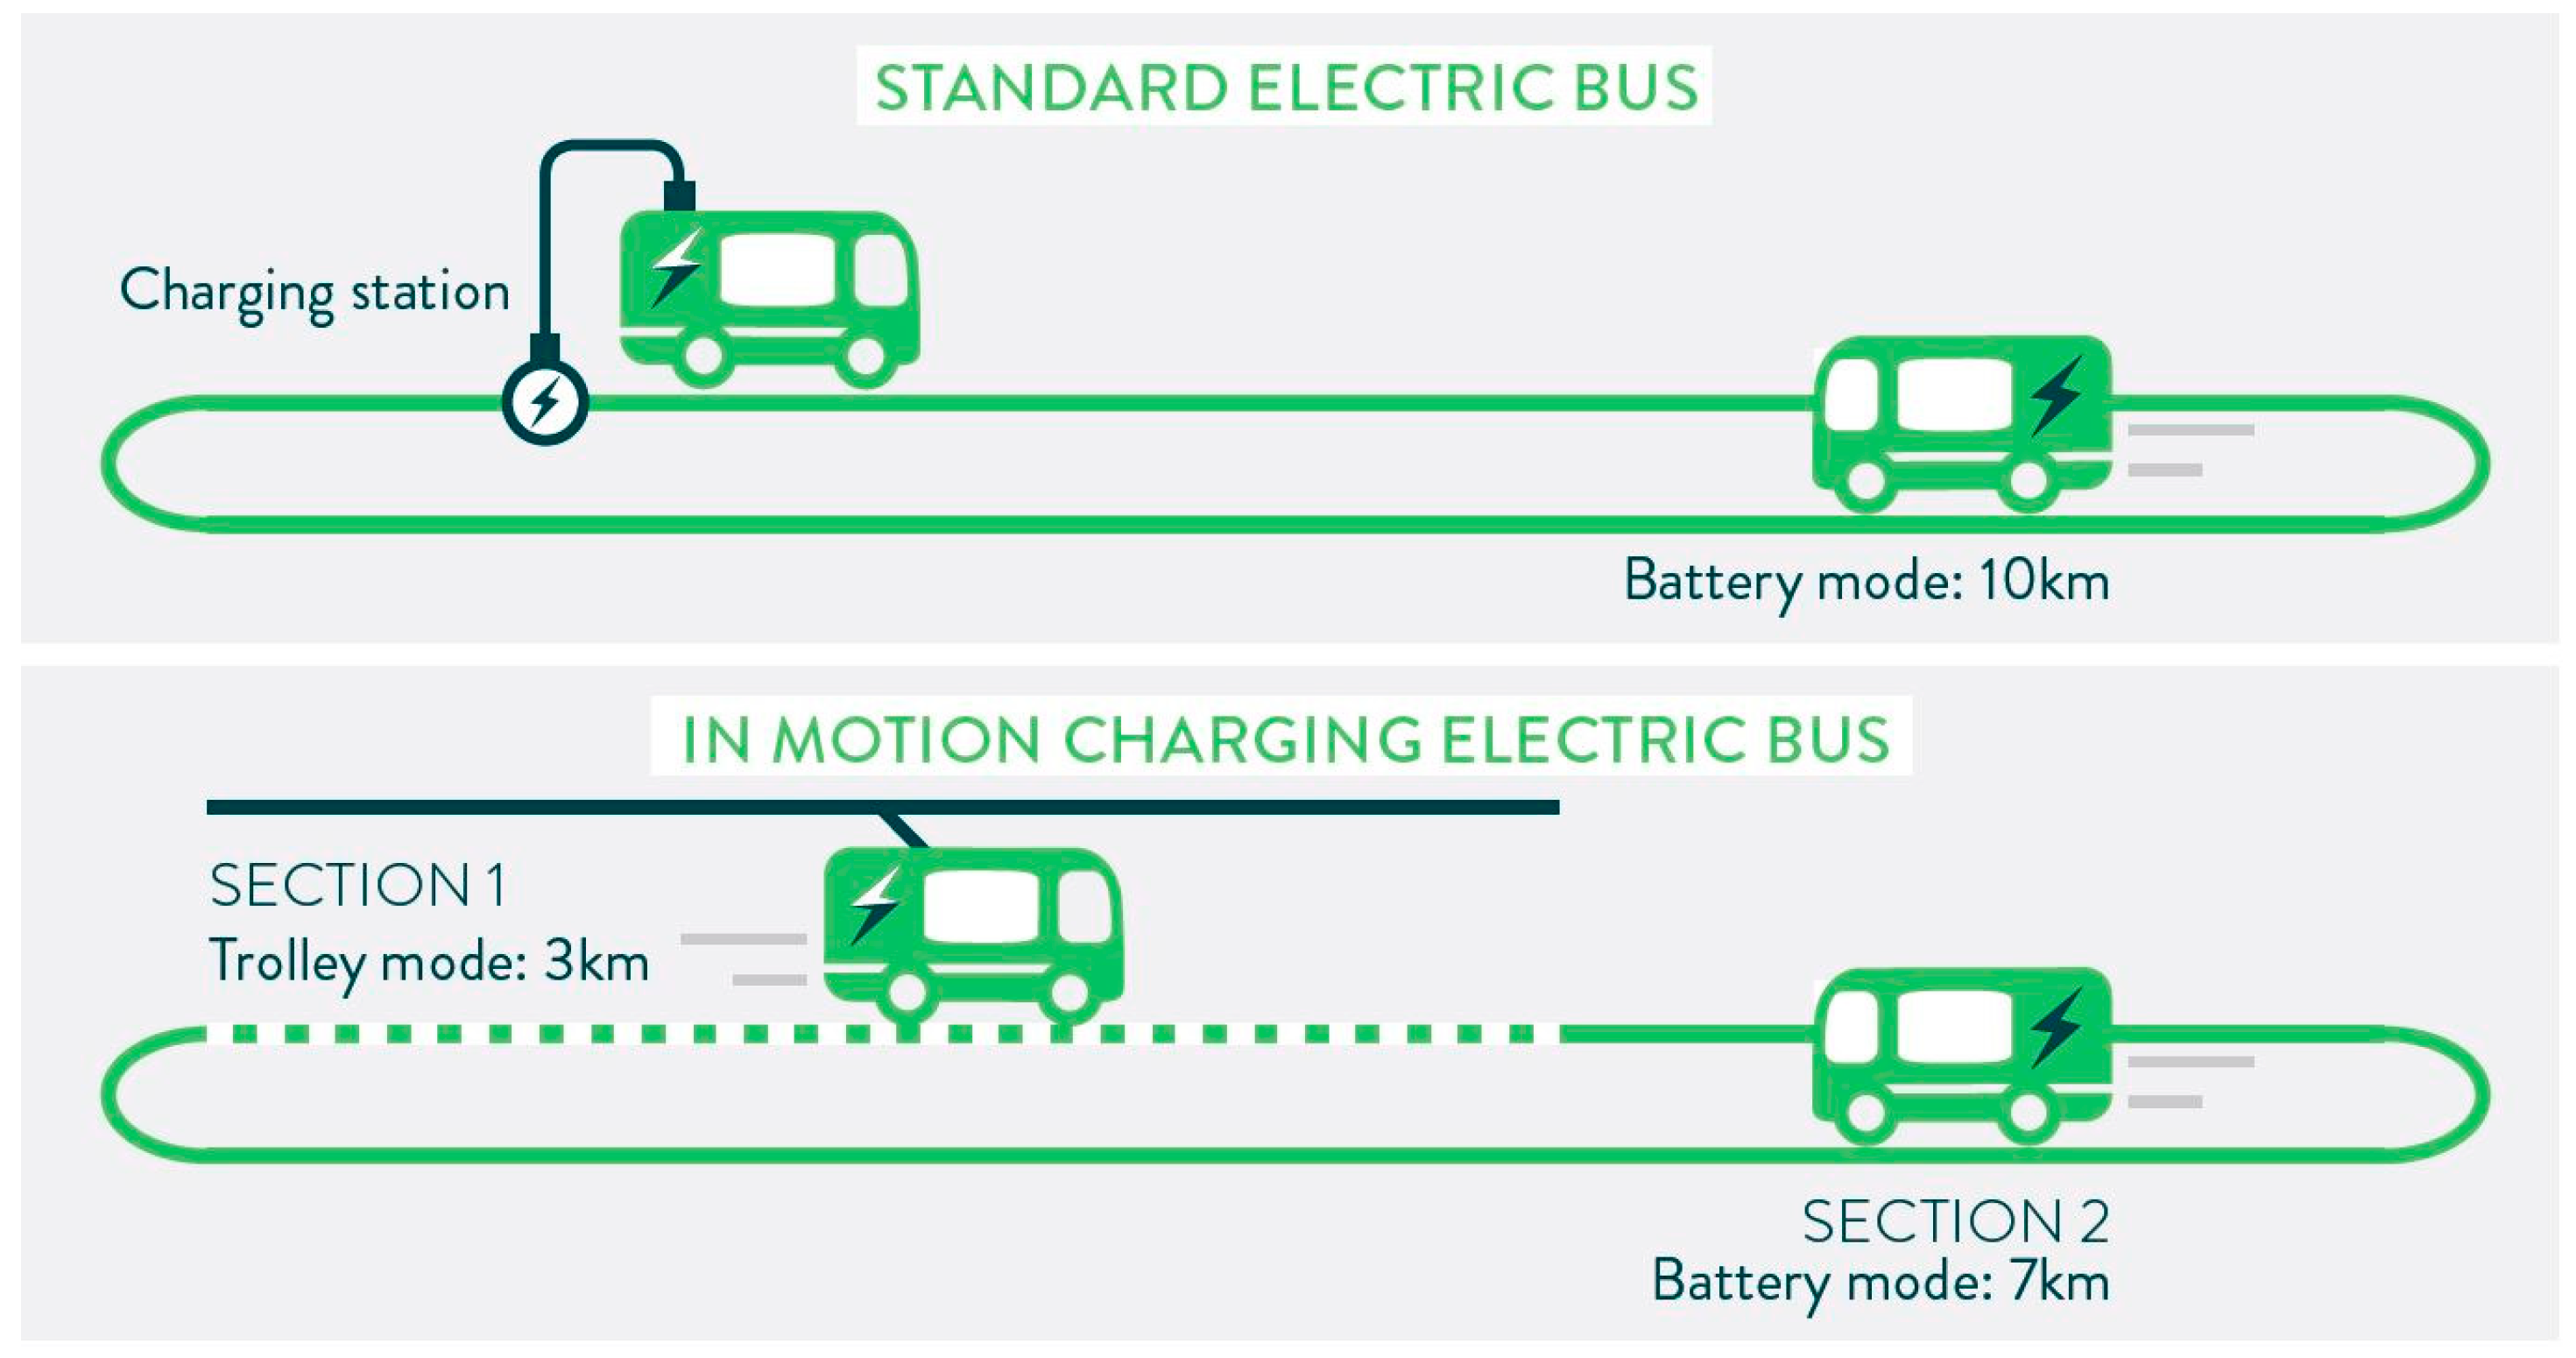
IMC technology (
Figure 2) is an efficient and interesting solution for electrifying bus systems. It works well with both battery buses and trolleybuses. In trolleybuses, the system charges the batteries while they are connected to the overhead grid. Then, the stored energy is used while traveling where there is no catenary. For every kilometer a trolleybus travels while connected, it can travel another two or three kilometers disconnected from the overhead grid, which reduces the infrastructure costs of trolleybuses. This technology also allows network sharing for rapid recharging of battery buses [
23].
According to Grygar et al. [
24], trolleybuses that can be charged while in motion are highly recommended for cities already operating this system. Electric buses have more economic, environmental, and social benefits compared to diesel buses. Moreover, they can use renewable energy sources to power up [
25].
Also, according to Grygar et al. [
24], battery-assisted trolleybuses are expected to be implemented soon. These will combine traditional trolleybuses’ advantages with conventional buses’ flexibility and mobility. However, this technology has certain limitations, such as battery capacity and ambient temperature.
For instance, the trolleybus network in Tychy, Poland, has been modernized with battery-powered trolleybuses. This upgrade has had several positive effects, including protecting the environment, saving energy, and reducing gas emissions [
16]. Furthermore, it has made the trolleybus system more flexible and accessible to other areas of the city [
16].
2.3. Electric Bus Service in Passenger Transport
Electromobility has been seen as a solution to mitigate gas emissions and environmental pollution. Countries worldwide set targets to change gasoline vehicles in favor of electric ones. However, the increased demand for electricity to power electric vehicles and other electronic devices is a bottleneck in this direction.
The transportation sector, particularly buses, is changing due to the increasing pressure from governments worldwide to adopt more eco-friendly energy sources. However, the bus sector’s biggest challenge is the lack of proper infrastructure to support the recharging of these energy sources.
Numerous studies have explored the potential of implementing a matrix transformation system in the bus industry. Kaptasila et al. [
26] analyzed the operational performance of battery-electric, hybrid, and diesel buses in Portland, OR, USA. They found that electric buses are faster than diesel buses, but they recommend deploying them on routes where ramp use is historically infrequent.
Shifting towards alternative energy sources in urban bus systems is crucial to reducing carbon footprints [
27,
28]. Moreover, Tong and Ng (24) suggest that battery electric buses are replacing traditional diesel buses in urban public transport services. They also note that over 30% of daily passenger trips in Hong Kong are made using battery electric buses.
Ribeiro et al. [
29] affirm that BEBs are an essential tool for cities to reduce carbon emissions in the transport sector. They are also more cost-effective than diesel buses. However, it is important to note that the energy used to charge BEBs’ batteries must come from renewable sources to ensure their environmental benefits. Using fossil fuel energy would offset the positive impact of BEBs.
In this sense, trolleybus services can help lessen the impact of transitioning to battery electric buses (BEBs), due to their usage of an overhead network. Because they require fewer batteries, they can be a viable option for mitigating the effects of changing the energy matrix in public transport by bus.
3. Materials and Methods
São Paulo is the main city of Brazil located in São Paulo state (a province in the southeast region of the country), and it was established in 1554 by the Jesuits [
30] During the XX century it became the most important financial and economic center of Brazil, where nowadays more than 11 million people live [
30,
31]. Located between latitude and longitude 47°0′ W to 46°20′ W and 23°15′ S to 23°60′ S, respectively, and covering an area of 5025 km, the city has a diverse and robust economy that includes finance, commerce, services, and manufacturing industries [
32].
Transportation has always been a major concern for administrators and politicians throughout its development. As the city grew, so did the need for its population to move around. In this regard, trolleybus systems were considered a solution based on foreign experiences.
In this study, we used Carvalho’s methodology to estimate the CO
2 emissions that would have been produced if trolleybus services had not been adopted in the city [
33].
where
Ekm (bus) = emissions of CO2 (kg)/km by the bus service.
Ees = emissions of the energy source in CO2 (kg)/L.
Ef = energy efficiency in km/L.
Considering the values of Ees 3.2 CO
2 (kg)/L and Ef 2.5 obtained by Carvalho [
33], it is possible to establish Ekm (bus), Equation (2):
To establish the distance traveled by the São Paulo trolleybus fleet per month, we obtained the respective itinerary and distances from São Paulo Transporte S/A, the City Hall company that manages the bus system in São Paulo city (
Table 1).
There are a total of 10 trolleybus lines currently operating, consisting of eight baselines and two services. The term “services” refers to variations of the main lines that operate on specific schedules.
Table 1 provides a comprehensive summary of these trolleybus lines that operate for a month, including 22 working days, 4 Saturdays, and 4 Sundays.
In this way, we adopted Equation (3) to determine Emissions.
where
emissions of CO2 avoided by the trolleybus, in kg.
Fm = the fleet mileage in km.
Ekm (bus) = emissions of CO2 (kg)/km bus service.
Emissions of CO
2 that were not emitted were converted into carbon credits to establish a monetary value that allows us to quantify the gains of the system. To do so, we adopted Equation (4).
where
= carbon credits in EUR.
VCC = value of carbon credits in EUR per ton.
= emissions of CO2 avoided by the trolleybus in kg.
We have calculated the negative impact on communities from the local and greenhouse gas (GHG) emissions. The negative impact on communities is a disadvantage caused by transport systems. It refers to the need for infrastructure and the environmental impacts caused by transport systems [
1,
2].
We obtained the estimated values of local gases and GHG emissions according to
Table 2 and
Table 3 and Equations (5) and (6) [
2].
where
= Local gases cost.
Dist = Distance of the displacement in kilometers per month.
Pas = Number of passengers transported per month.
where
GHGC = Greenhouse gases cost.
Dist = Distance of the displacement in kilometers per month.
Pas = Number of passengers transported per month.
We considered the values of “ordinary bus” vehicles, which are urban buses with EURO V technology in an urban area. There are two models of trolleybus in operation, the first measuring 12.5 m (100 vehicles), with capacity for 80 passengers, and the second measuring 15 m (101 vehicles), with capacity for 93 passengers. They can operate by merging into some lines, or even eventually replacing diesel vehicles, so it was agreed to use the 12.5 m trolleybus model for this study.
After establishing the environmental impact costs, we compared the operation of São Paulo trolleybus systems with conventional diesel engine vehicles and battery electric buses.
4. Results
The trolleybus network in São Paulo spans over 168.42 km and is supported by 22 Rectifying Transformer Stations (ETRs) [
34,
35]. The system is responsible for transporting 8 million passengers per month [
34,
35]. As of 15 September 2023, there were 220 electric buses in operation in São Paulo, out of which 201 were trolleybuses and the remaining 19 were battery-powered [
34,
35].
Upon converting the emissions avoided in CO
2 by the 201 trolleybuses in Sao Paulo city into carbon credits,
Table 4 and
Table 5 display the corresponding values [
36].
According to the findings, the trolleybus operation in the city of São Paulo prevents the release of 1,039,087 kg of CO2 into the atmosphere every month. This figure translates to a monthly carbon credit of EUR 66,522.29 for the city, as per Equation (4).
In 2022, the trolleybus network had energy availability 99.9% of the time and underwent 3317 interventions, of which only 194 were emergency. This proves the reliability of the São Paulo trolleybus system [
34].
Regarding negative impacts on communities,
Table 6 presents the values calculated for local gases and GHGs.
The values for local gases and GHGs not emitted by the trolleybus correspond to EUR 140,731.22 per month or EUR 1,688,774.64 per year.
The benefits of reduction in emissions in consideration of the costs of maintenance of the trolleybus system can be seen in
Table 7 [
37].
Our results indicated that 36.31% of operational costs can be paid by no emissions generated by the trolleybus operation. It is important to note that our analysis did not account for other factors, such as noise pollution and the emission of NOx, which is the primary pollutant released by diesel engines. Additionally, we need to consider the health costs associated with diesel engine operation.
In comparison, as a battery electric bus, the trolleybus could be disadvantageous to São Paulo city (
Table 8) [
37,
38].
It is essential to take into account the cost of battery disposal and shorter lifespan when considering trolleybuses versus battery buses. A trolleybus can be operated for 30 years or more, similar to subway lines, while a battery bus can only be operated for 15 years and requires battery pack replacements halfway through its lifespan [
39,
40]. Therefore, it is crucial to analyze these factors before making a final decision.
5. Discussion
The trolleybus development in São Paulo city remains in the decade of 1920, when the city of São Paulo had a population of 579 thousand inhabitants. At that time, the first studies for the implementation of “electrobuses” commenced [
41,
42]. However, only in 1939, São Paulo City Hall concluded the feasibility of implementing trolleybus systems to replace old trams operating since 1899 [
41].
Unfortunately, the project was interrupted during World War II and resumed in 1946 when São Paulo City Hall began studies for the establishment of the Municipal Public Transport Company (CMTC) that would inherit the tram system from the Light company, which decided to abandon its transport operation in Brazil [
41]. Light was an Anglo-Canadian company that had controlled transport systems in São Paulo since 1899 [
43].
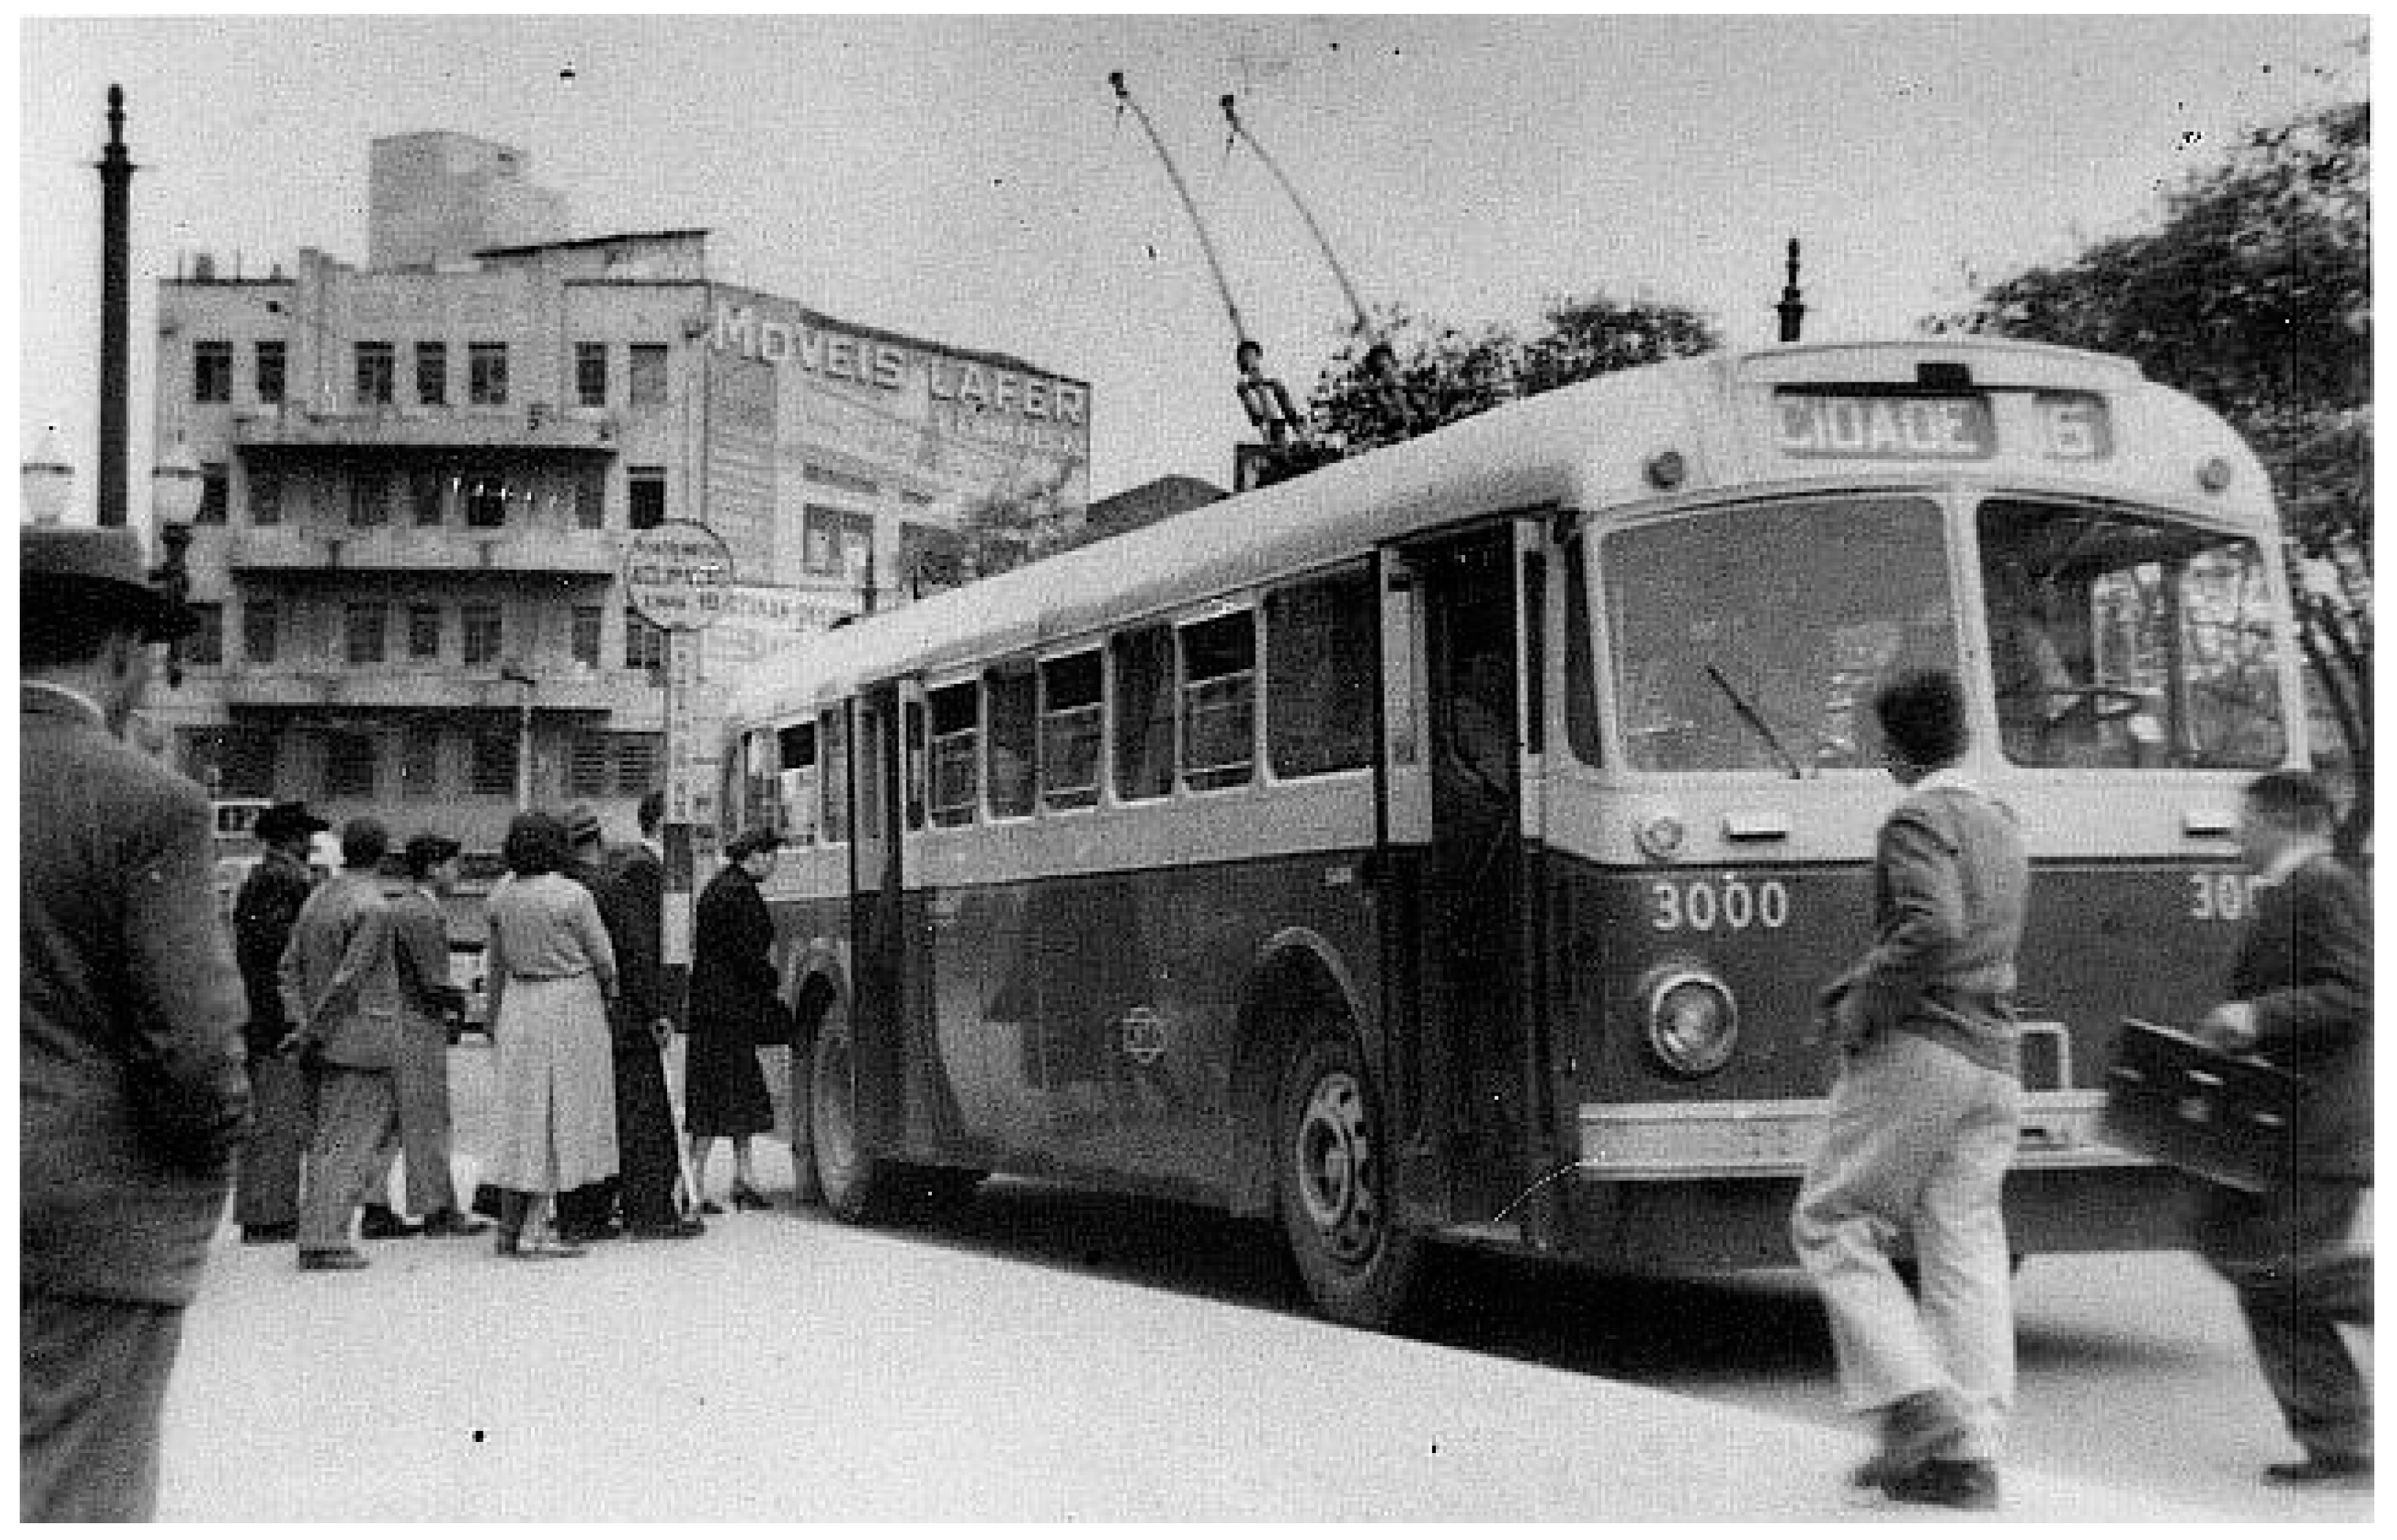
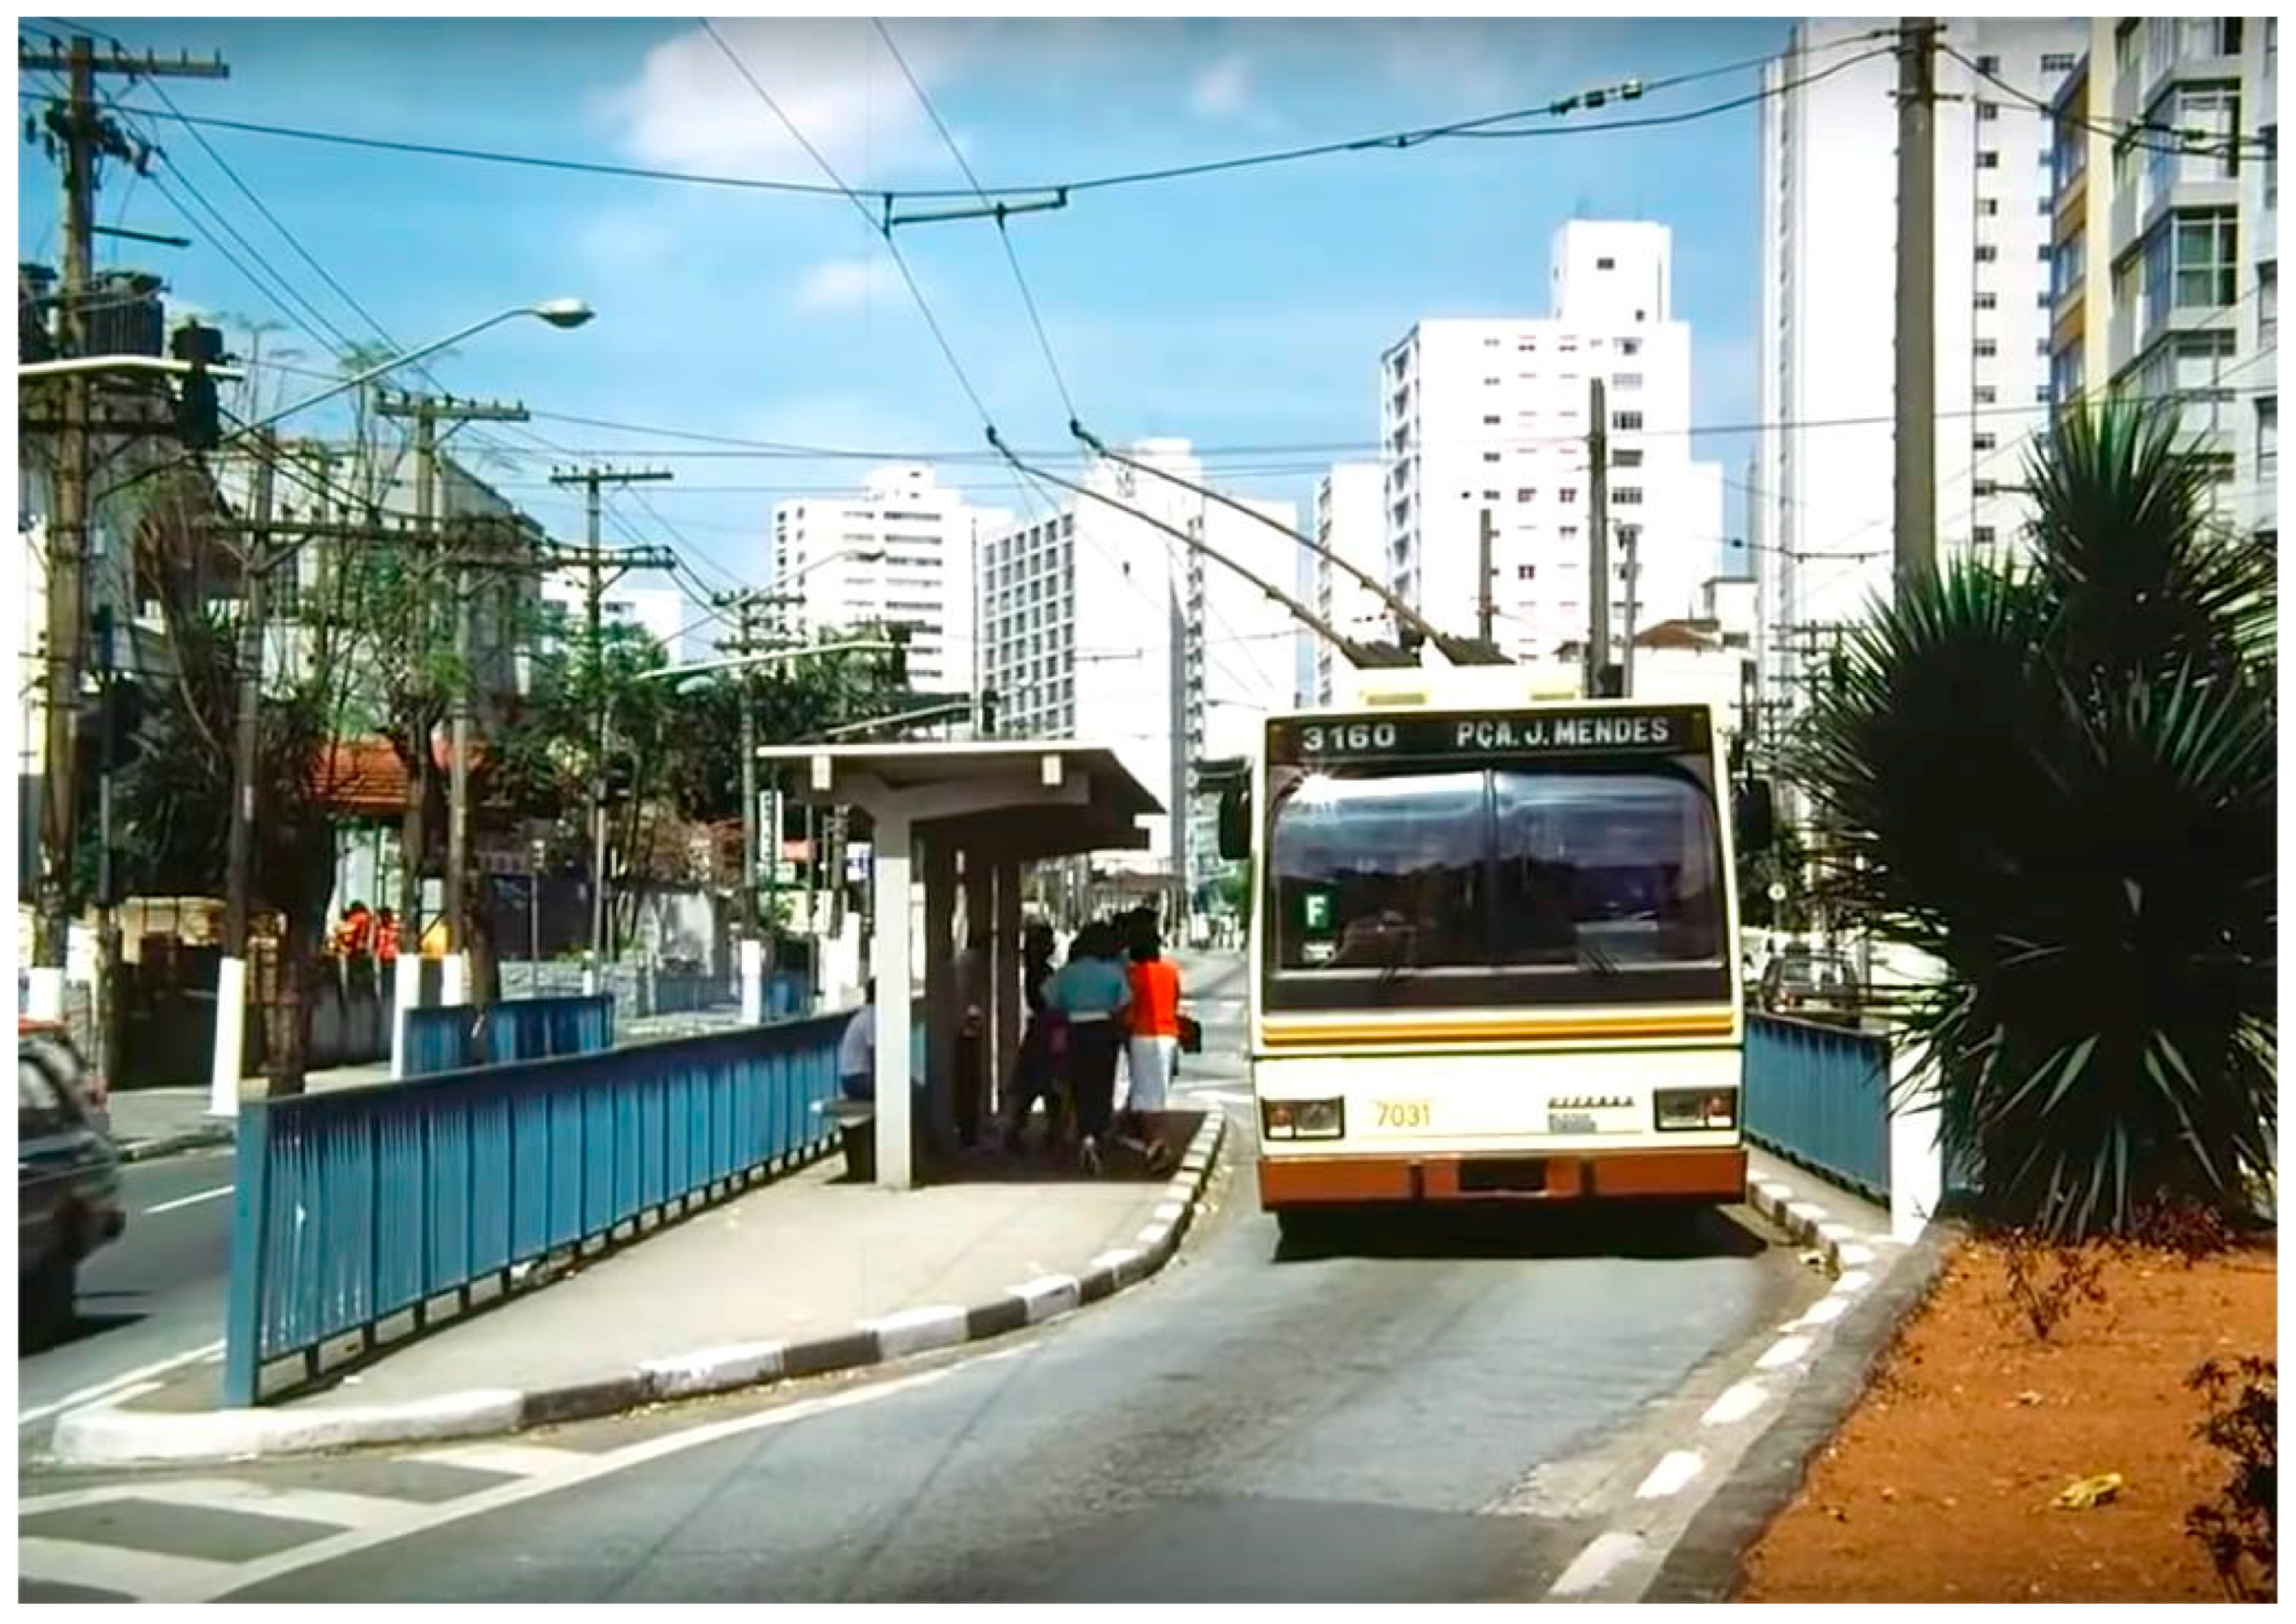
On 22 April 1949, the first line of trolleybuses was inaugurated with used vehicles acquired from an English Company BUT, connecting João Mendes Square—in the city center—to General Polidoro Square, in the neighborhood of Aclimação (
Figure 3).
The trolleybus implementation in São Paulo was a rather late process, and, in some ways, the world was discussing the system’s feasibility at that time. The UK, for instance, implemented the first line in 1911, and in 1939, 35 trolleybus systems were in operation on the isle, involving 3429 vehicles. However, in 1954 London announced its plan to replace all its trolleybuses with diesel buses—just five years after Sao Paulo’s first line—and this was completed in 1962. Due to London’s decision, the last system in the UK, in Bradford, was closed in 1972. The reasons for the trolleybus decline in the UK were a mixture of operational inflexibility and cost. Despite the discontinued trolleybus, they still outperformed the diesel buses in quiet, vibration-free operation, high performance and overload capacity, long life, and low maintenance requirements. They offered the advantages of no local pollution, due to the use of clean energy [
11].
At the time, trolleybuses were seen as a significant improvement over the existing tram system. The city’s transport planning was still in its early stages, and there was no integrated vision of the transport network that would have ensured that different modes of transport complemented each other [
42]. As a result, model changes were made without proper consideration, with people naturally assuming that the trolleybus system was a natural evolution of the transport modes [
42].
In 1958, Brazil manufactured its first national trolleybus, leading to the expansion of the trolleybus network [
42]. By 1960 the system had 15 lines, and the fleet had grown to 156 units [
42]. However, due to difficulties incorporating this technology into the existing system, trolleybuses often operated alongside small-capacity diesel buses or on roads without special treatment [
38].
In 1963 a study conducted by CMTC discovered that running trolleybuses was more cost-effective than using diesel buses or trams [
10]. However, diesel vehicles continued to dominate the fleet as trolleybuses were still considered expensive due to low demand for this type of vehicle [
10,
34,
45].
The oil crisis in the 1970s impacted the source of fossil fuels and led to a growing concern for environmental issues in society. As a result, a study plan for a Trolleybus Transport System (SISTRAN) was developed for São Paulo in 1976. The plan aimed to create a system with medium transport capacity that would prioritize trolleybuses in exclusive corridors. The pilot project was constructed on Avenida Paes de Barros in 1980 (as shown in
Figure 4) [
10,
46].
In 1993, the São Paulo City Hall privatized CMTC, and private companies took over the operation of the trolleybuses. The companies were expected to refurbish the existing vehicles and expand the fleet. By 1998 the system had reached its peak, with a network spanning 264.75 km, 31 lines, and a fleet comprising 552 vehicles [
42,
48].
Starting from 2001, efforts to reduce the trolleybus network in São Paulo, Brazil, intensified. The rationale behind this decision was that the costs of operating trolleybuses were high, and the system lacked flexibility due to the overhead network [
7]. As a result, the trolleybus transport system gradually lost its significance.
However, the trolleybus fleet was revived between 2007 and 2014 when it was renewed and expanded to 201 vehicles [
35]. Despite this, in 2023, the mayor of São Paulo city expressed the desire to deactivate the trolleybus network and switch to battery buses, due to high operational costs [
49].
Brazil is formed of 27 states, with São Paulo being the most populous and important one, accounting for 20% of the country’s population [
31]. The city of São Paulo serves as the state capital.
In order to discuss the emissions figures for the city, it is important first to present the data for the state as a whole (
Figure 5). Afterward, we can calculate the percentage of emissions specific to the city of São Paulo (
Figure 6).
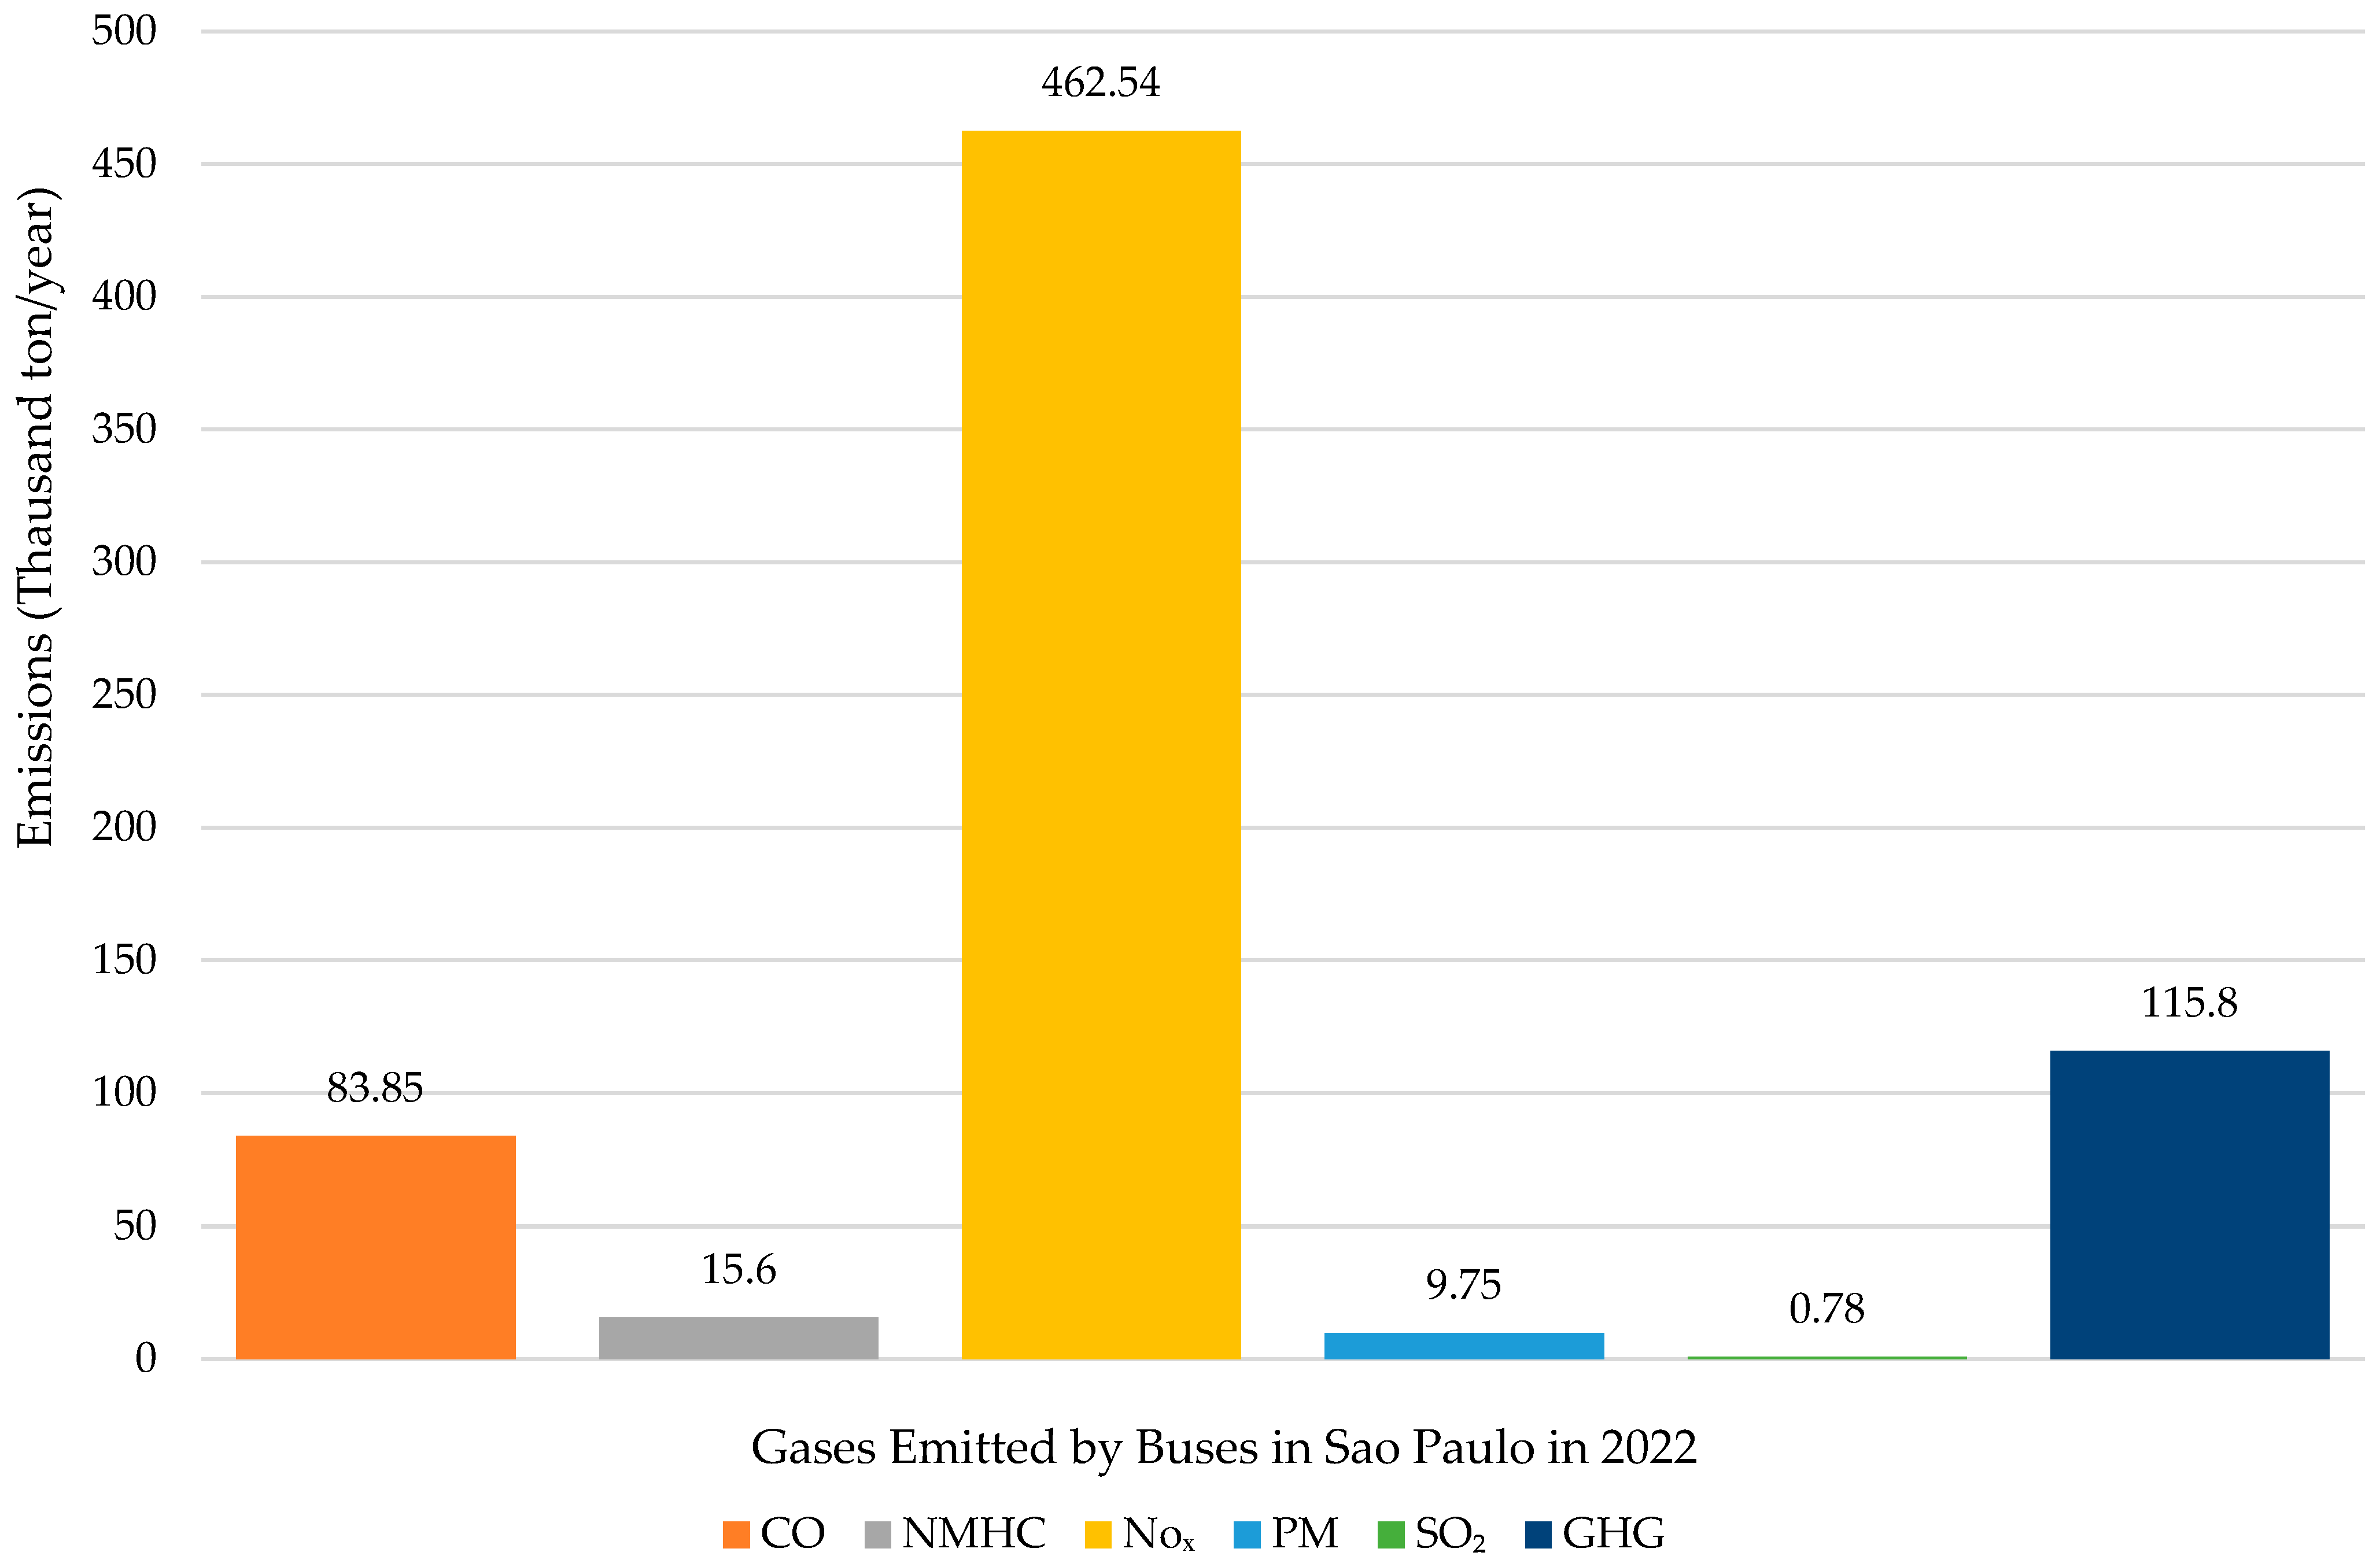
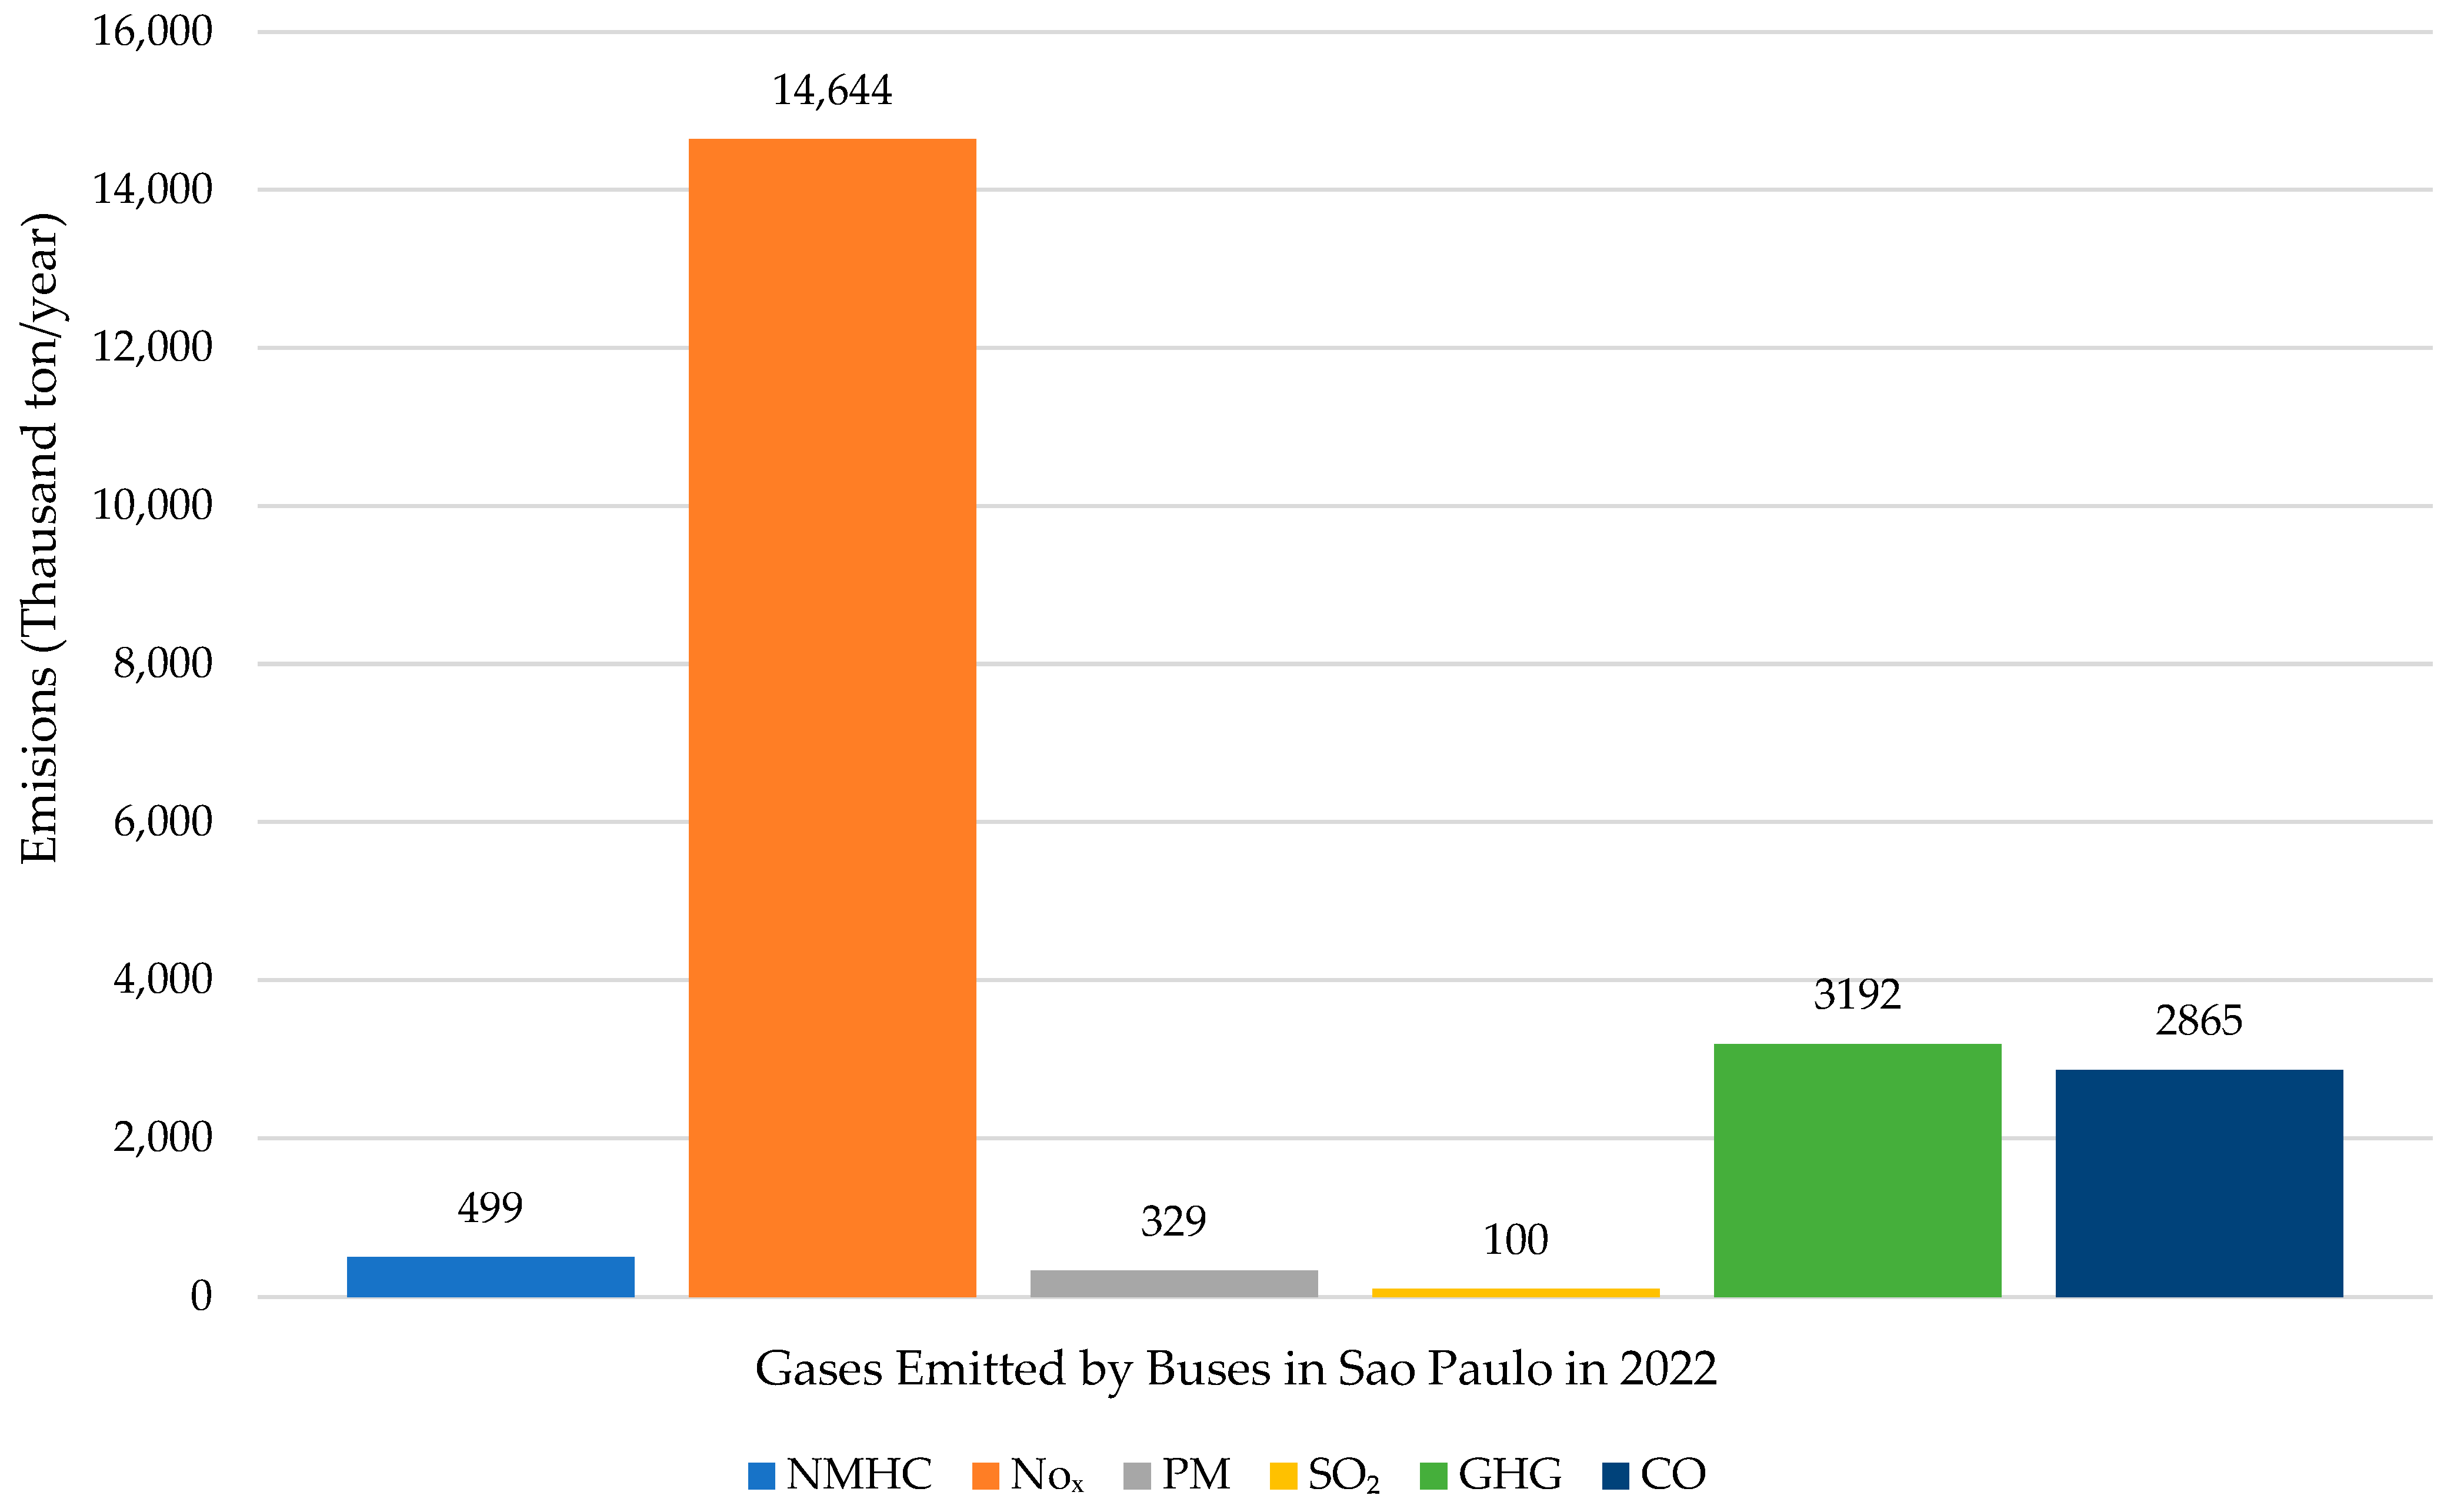
In 2022, nitrogen oxide (NOx) was the main gas emitted by diesel buses, with 14,644 thousand tons per year, followed by GHG with 3192 thousand tons per year and carbon monoxide (CO) 2865 thousand tons per year.
NOx occurs when nitrogen reacts with oxygen in a high temperature in the combustion chamber. NOx participates in the formation of photochemical “smog”, whose main pollutant is ozone. It also contributes to the formation of acid rain and particulates [
42]. CO is a gas resulting from incomplete fuel burning and, when inhaled, reduces the blood’s ability to transport oxygen [
51]. And the burning of fuels such as coal, natural gas, and petroleum derivatives emits carbon dioxide (CO
2) [
52].
A rough estimate of emissions for São Paulo city could be made by considering the fleet size. As the city has 39% of the urban bus fleet of the São Paulo state, we estimated that the same equivalence could be made for emissions. Despite the limitations, this approach allows us to have an idea regarding the emissions provoked by diesel vehicles and validate the reduction in emissions caused by trolleybus systems in the city.
The fact is that the trolleybuses have been running in about 300 cities across the globe for the past 130 years and trolleybus can operate by complementing other modes while new developments such as in-motion charging have been introduced in a range of cities to help the trolleybus fleets to advance [
53].
The trolleybus is an important source of sustainable transport for cities and should be improved instead of deactivated for diesel or battery-buses. This solution is much more profitable for the public transport authorities than introducing electric buses which are powered by large, high-capacity batteries with limited life expectancy [
22]. This can thus generate significant operating costs in the future (e.g., onboard battery replacement) and affect the performance of the public transport system [
22].
IMC trolleybuses present a promising solution for increasing the percentage of electric public transport in cities that already have catenary infrastructure [
54]. In the specific case of São Paulo, there is a local company that provides the technology and currently manages the trolleybus fleet in the city [
40], reducing the costs of implementation. However, it ultimately depends on the City Hall’s willingness to fund part of the necessary infrastructure.
Our findings regarding the feasibility of the trolleybus in São Paulo can be reinforced by the work of Kliucininkas and Matulevicius [
55], who carried out a comparative analysis of costs related to emissions from urban buses and trolleybuses in Lithuania. They conclude that replacement of the bus by the trolleybus will decrease GHG emissions by 389.69 g CO
2/km in 2009 and 287.09 g CO
2/km in 2010; at the same time, replacement will save 0.042 EUR/km and 0.039 EUR/km for each respective year. Połom and Wiśniewski [
56] comparing diesel buses and trolleybuses in Gdynia and Sopot, Poland, found that trolleybuses in public transport contribute to a reduction in the damage costs of the emission of pollutants that amount to approximately EUR (€) 30,000–60,000 per year for the analyzed lines.
According to Borowik and Cywiński [
57], trolleybuses may be an eco-efficient solution for public urban transport, and they stress the fact that public transport based on trolleybus networks provides new opportunities for sustainable development of cities. The authors describe the effects resulting from the modernization of an existing trolleybus transport system in Tychy, Poland, using IMC technology, and highlight the impact of modernization in creating a more sustainable transport system for city based on UN Agenda 2030 concepts.
São Paulo certainly can benefit from those ideas to carry on with its trolleybus system instead of deactivating, it as proposed by City Hall [
58].
6. Final Remarks
6.1. Conclusions
This study examines the trolleybus system in São Paulo, Brazil, with regard to its potential for reducing emissions and its feasibility for use by the population. Currently, the São Paulo City Hall is considering more sustainable transportation options, including the use of battery-powered buses with zero gas emissions for its fleet of over 10,000 buses. The trolleybus system, which has been in use for 74 years, could be a strategic addition to the city’s transportation network, particularly when combined with battery-powered buses.
Insofar as we move towards more sustainable modes of transport, battery-powered buses have emerged as a potential solution. However, implementing this technology presents some significant challenges. One such challenge is the disposal of the batteries, which leads to pollution. Additionally, providing sufficient energy to power these buses is difficult, given the current energy generation capacity of the city. To address these challenges, we need significant investments. However, the state does not own the energy company, which makes it challenging to implement sustainable and cost-effective urban transport systems in the short term. Furthermore, energy costs applied to companies operating urban transport systems may make this solution unsustainable in the future.
Our results show that trolleybuses are a reliable and cost-effective solution for reducing environmental emissions. In addition, trolleybuses can complement other systems for a comprehensive and sustainable approach to transportation in cities.
In-motion-charging (IMC) technology can help solve the problem of limited overhead networks, making it possible to extend trolleybus access to more areas of the city. In addition, this technology can be shared with battery electric buses, enabling their batteries to be recharged while in operation. This reduces the amount of time the bus is unavailable for recharging and makes its operation more efficient. Some cities worldwide have been benefiting from this implementation.
This study has certain limitations, as it did not have access to all emission costs of an operational diesel-bus line, which is necessary to calculate all the environmental effects and evaluate all the advantages of a trolleybus system operation. Therefore, more studies will be required to have a comprehensive understanding of how cities can be made more sustainable based on their transportation systems. However, this study is a significant first step toward achieving this goal.
6.2. Implications
Based on our research findings, we propose some directions for analyzing the implications of the bus energy-matrix change in urban transport. It is important to note that while comparing alternatives, immediate costs such as vehicle acquisition, infrastructure maintenance, autonomy, and flexibility should not be the only factors considered. A comprehensive view that takes into account the vehicle’s lifetime, energy production capabilities, and externalities for society, such as air pollution, excess of transport infrastructure, and soil contamination, is necessary.
Rodrigues et al. [
39] conducted a study comparing battery electric buses with diesel vehicles in a bus rapid-transit system. They used the analytical hierarchy process to analyze the data and found interesting results regarding the advantages of electric bus adoption. This study confirms the assumptions found in our study regarding the need for a comprehensive analysis that help to highlights the need for new methodologies that can guide policymakers towards an efficient transition to a sustainable energy matrix in urban bus transport.
Secondly, an energy transition from fossil fuels to electric energy requires the development of infrastructure to support electric vehicles. Currently, there is a shortage of equipment and energy supply to recharge the electric fleet. Our research suggests that the trolleybus system can be optimized in cities where it is already operating and can be used as a complementary system to create a sustainable transport system.
In this direction, a study conducted by Bartłomiejczyk and Połom [
22] explored the use of the catenary by trolleybuses with auxiliary power sources in Gdynia, Poland. The study found that introducing trolleybuses with onboard batteries can expand the zero-emission transport network in places with limited power supply capabilities. Therefore, it is necessary to investigate the transformation of trolleybus systems running with IMC technology adoption as a complementary sustainable transport system.
Last but not least, it is crucial to engage all stakeholders, including policymakers, governments, communities, users, and investors, in the energy transformation matrix for bus transportation. This is because transport infrastructure is expensive and requires a clear set of rules to ensure its success and attract investors. Despite the fact that the initial costs of implementing this solution may be high, its benefits, in the long run, will more than make up for it. Nevertheless, this requires a concerted effort and further research to determine the best course of action. While the trolleybus solution is a viable option, it is important to explore other alternatives as well.
Sellitto et al. [
59] proposed a tool for the assessment of the environmental performance of bus transit operators. The tool was tested in six bus transit operations of a Latin America city of about 1,500,000 inhabitants. They concluded that the more problematic criterion was atmosphere; hence, an improvement strategy should focus on it. The comprehensive methodology allows us to infer that a solution for a sustainable transport in cities requires the participation of all the stakeholders to mitigate the issue, who should corroborate regarding the necessity to develop more studies and methodologies involving different actors in the solution to the problem.


 ,
, 


