


Optimal Allocation of Photovoltaic-Green Distributed Generation for Maximizing the Performance of Electrical Distribution Networks


Abstract
1. Introduction
- (1)
- This study suggests a strategy that uses PSO techniques to maximize PV-GDG system allocation. Finding the optimal size, number, and location of the embedded PV-GDG in the same algorithm process is determined using the PSO by considering particular limitations and requirements.
- (2)
- The method used in this study can be used for any DN, depending on the data and technical specifications of the electrical equipment operating in the network. The IEEE 33 bus test system was an important standard used to make sure the algorithm and analysis were accurate and useful for different Electrical Distribution Networks (EDNs). Choosing Baghdad’s networks as a case study aims to improve the reliability of the methodology. This helps it work better for networks facing operational issues, aged equipment, and shortages in power generation, along with rising annual demands exceeding power production capacity.
- (3)
- An evaluation of this approach involves comparing PSO results with those obtained from the analysis by the CYMEDist program, which represents both the IEEE 33 bus test system and a real case of studies. Additionally, this study assesses PV-GDG parameters using PVsyst 7.2.20 designing software tailored to this network and conducts power flow analysis using the Newton–Raphson (NR) numerical technique.
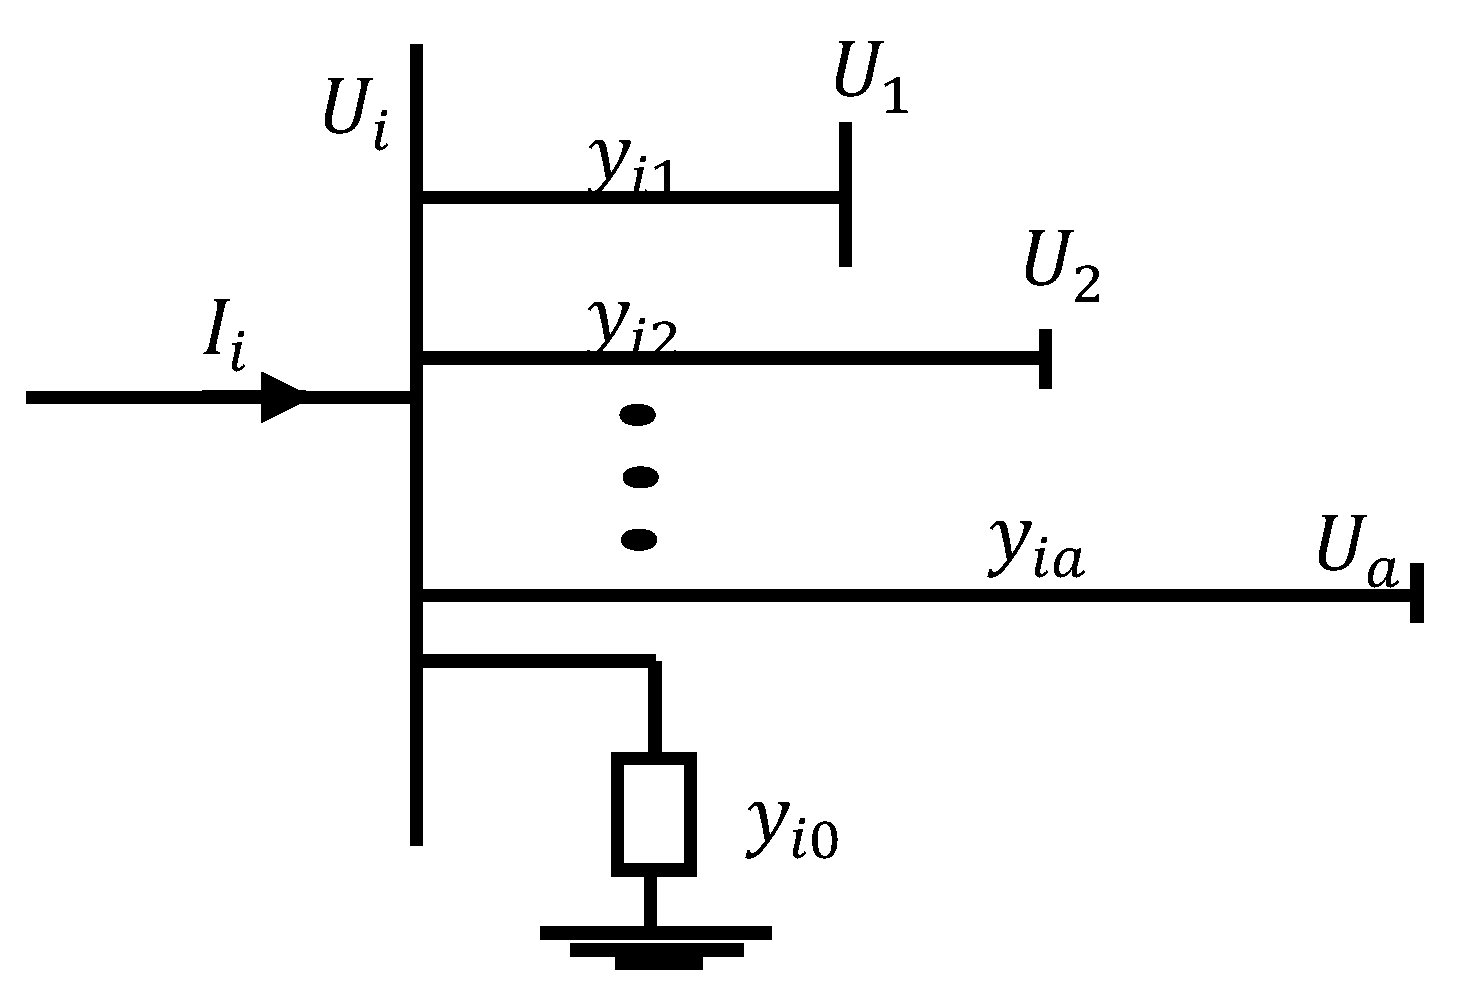
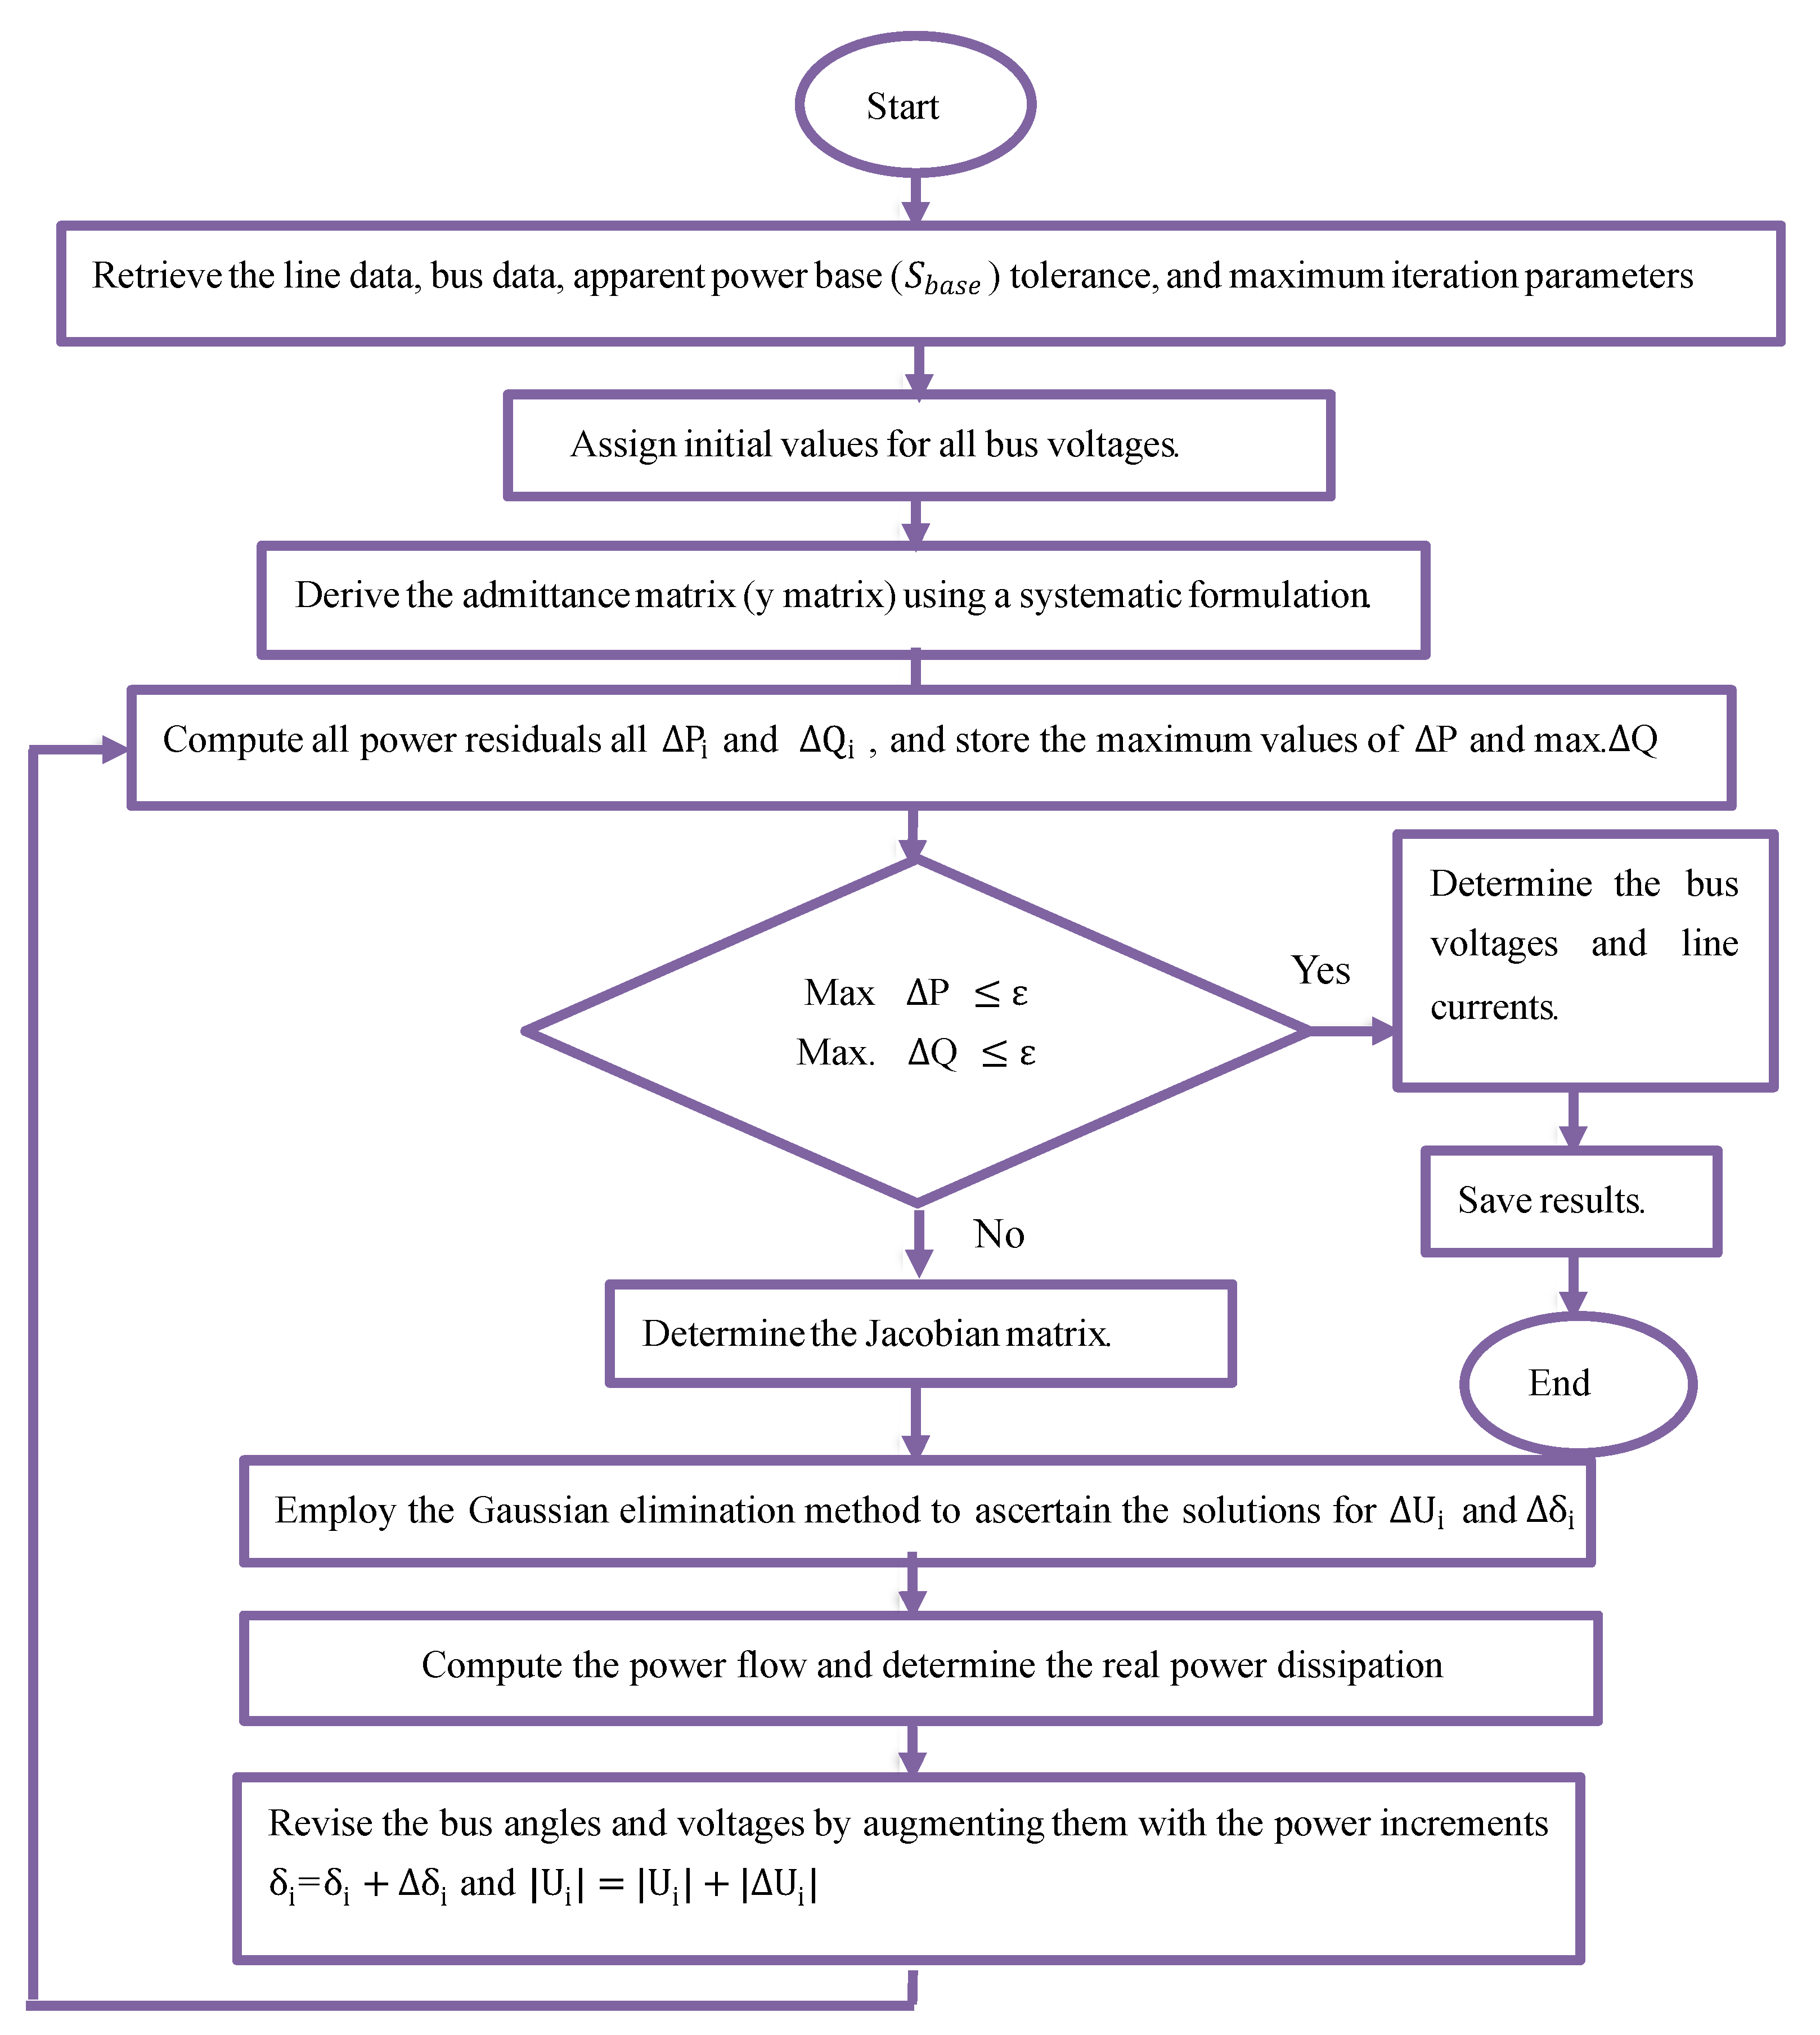
2. Power Flow Calculation [15,16,17,18,19]
- (1)
- For load buses, where and are specific voltage magnitudes and phase angle are set as the values of slack bus, or 1.0 and 0.0, ( and ) for voltage regulated buses, where and are specified, phase angles are set equal to the slack bus angle ().
- (2)
- The active power and reactive power for the load and buses.
- (3)
- and for the voltage-controlled buses.
- (4)
- The components of the Jacobian matrix (, , , and ) are computed.
- (5)
- The linearly synchronized Equation (2) is solved through a computational method.
- (6)
- In Equations (5) and (6), we computed the new voltage values with phase angles.
- (7)
- The procedure is persistent until the specified precision is more than the residuals and .
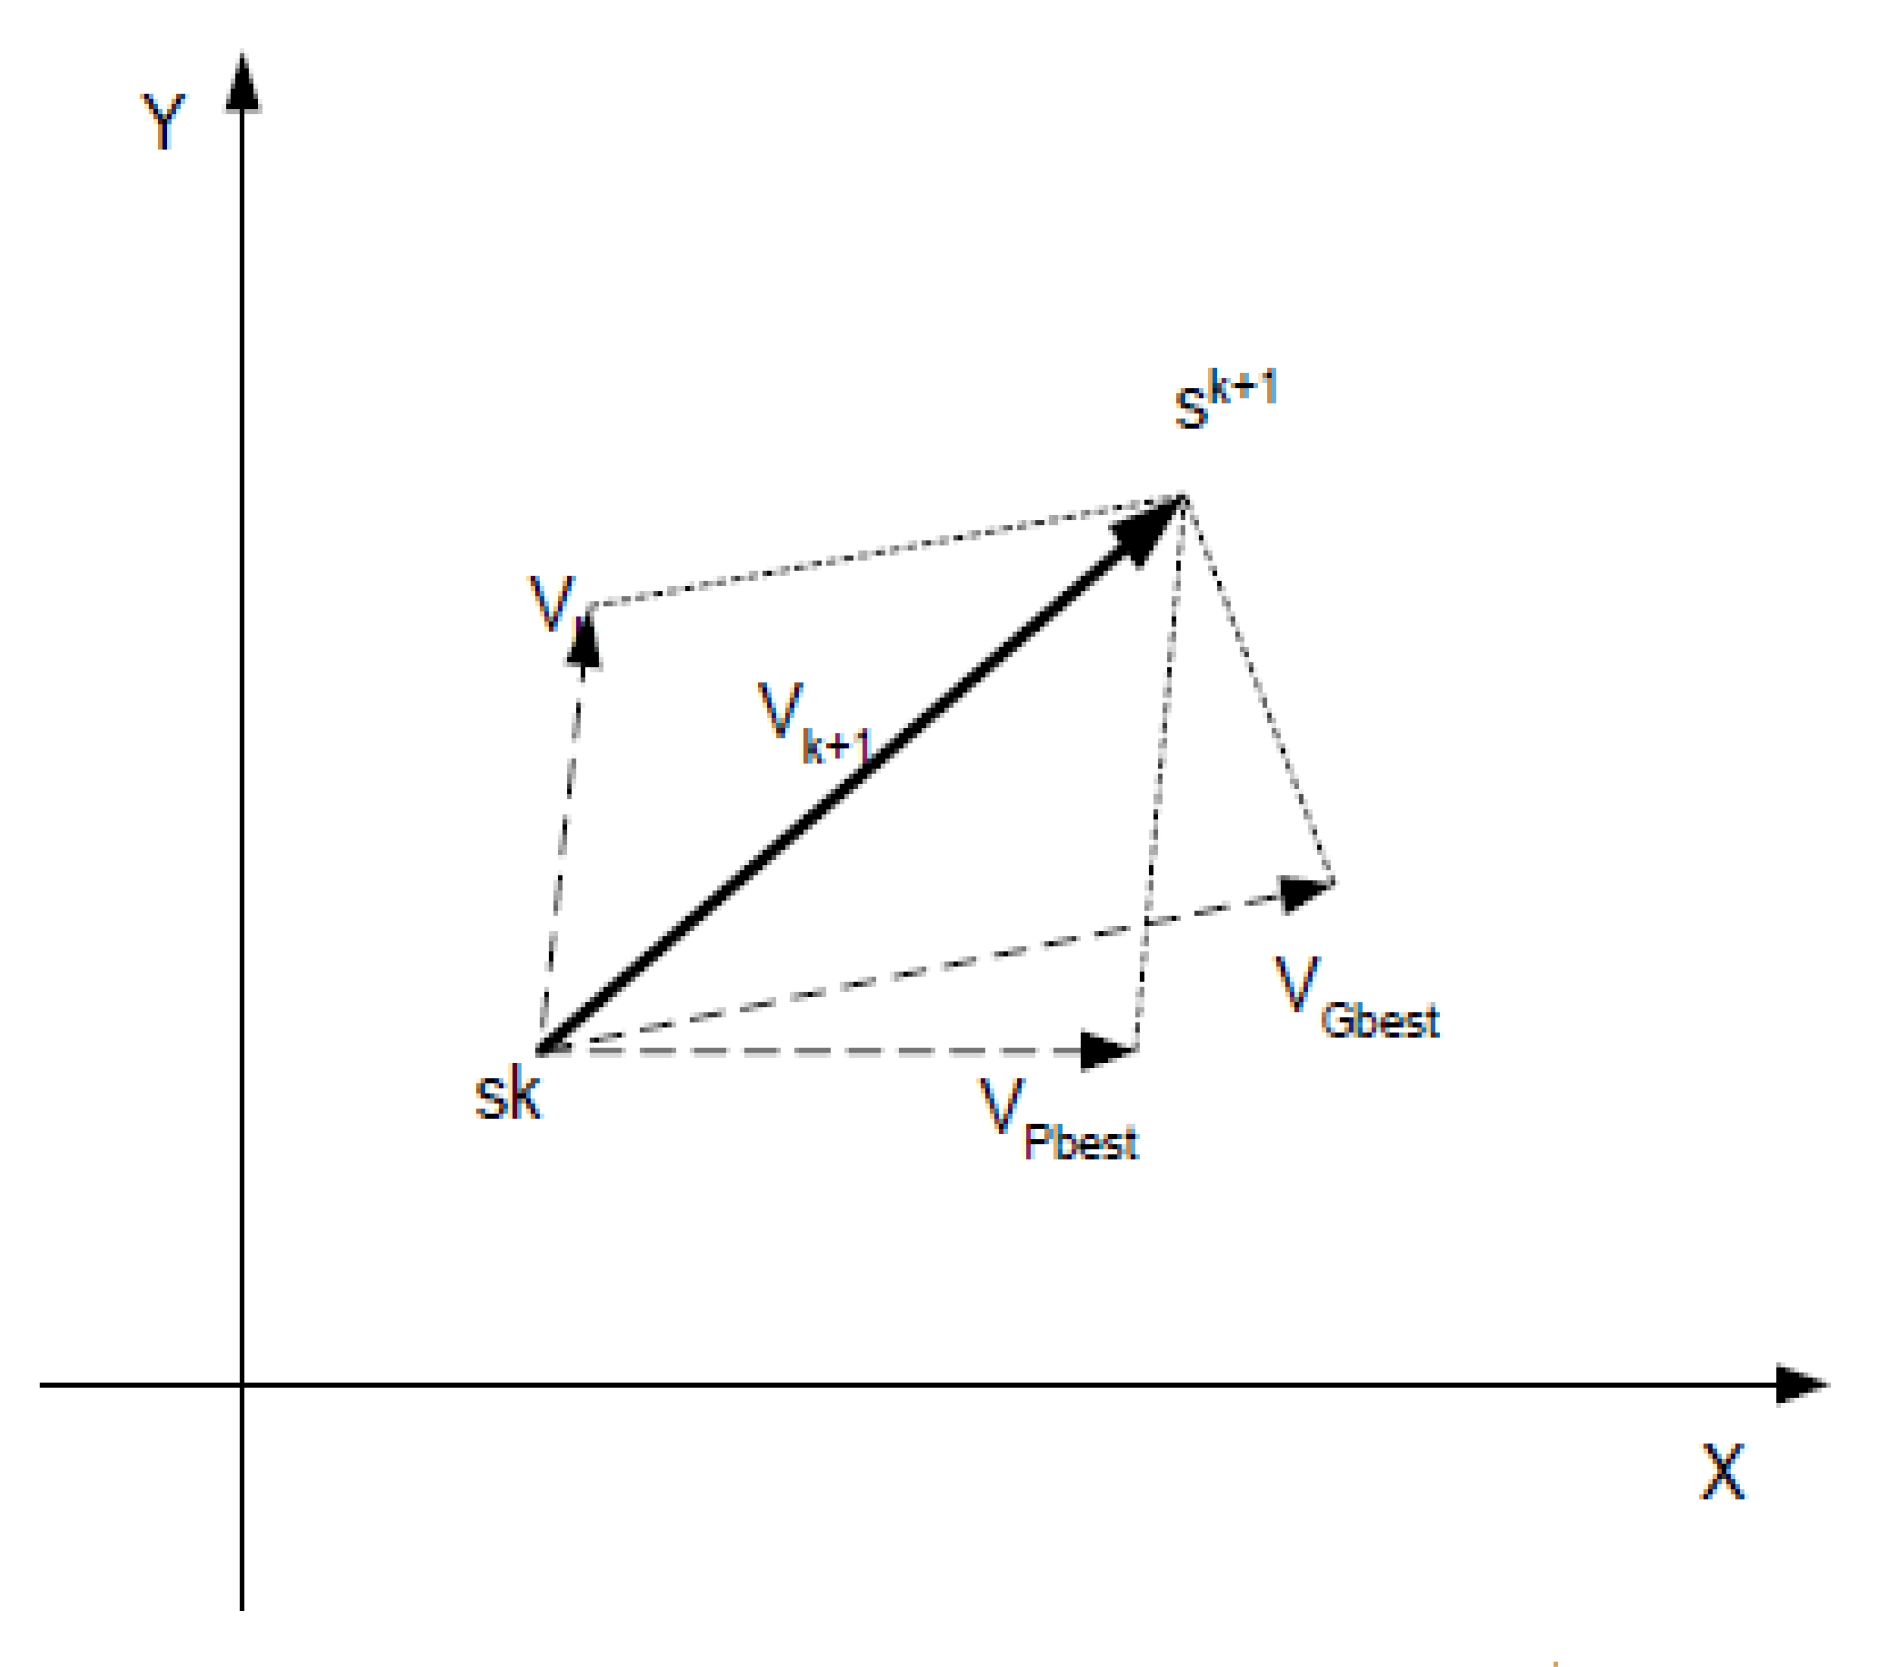
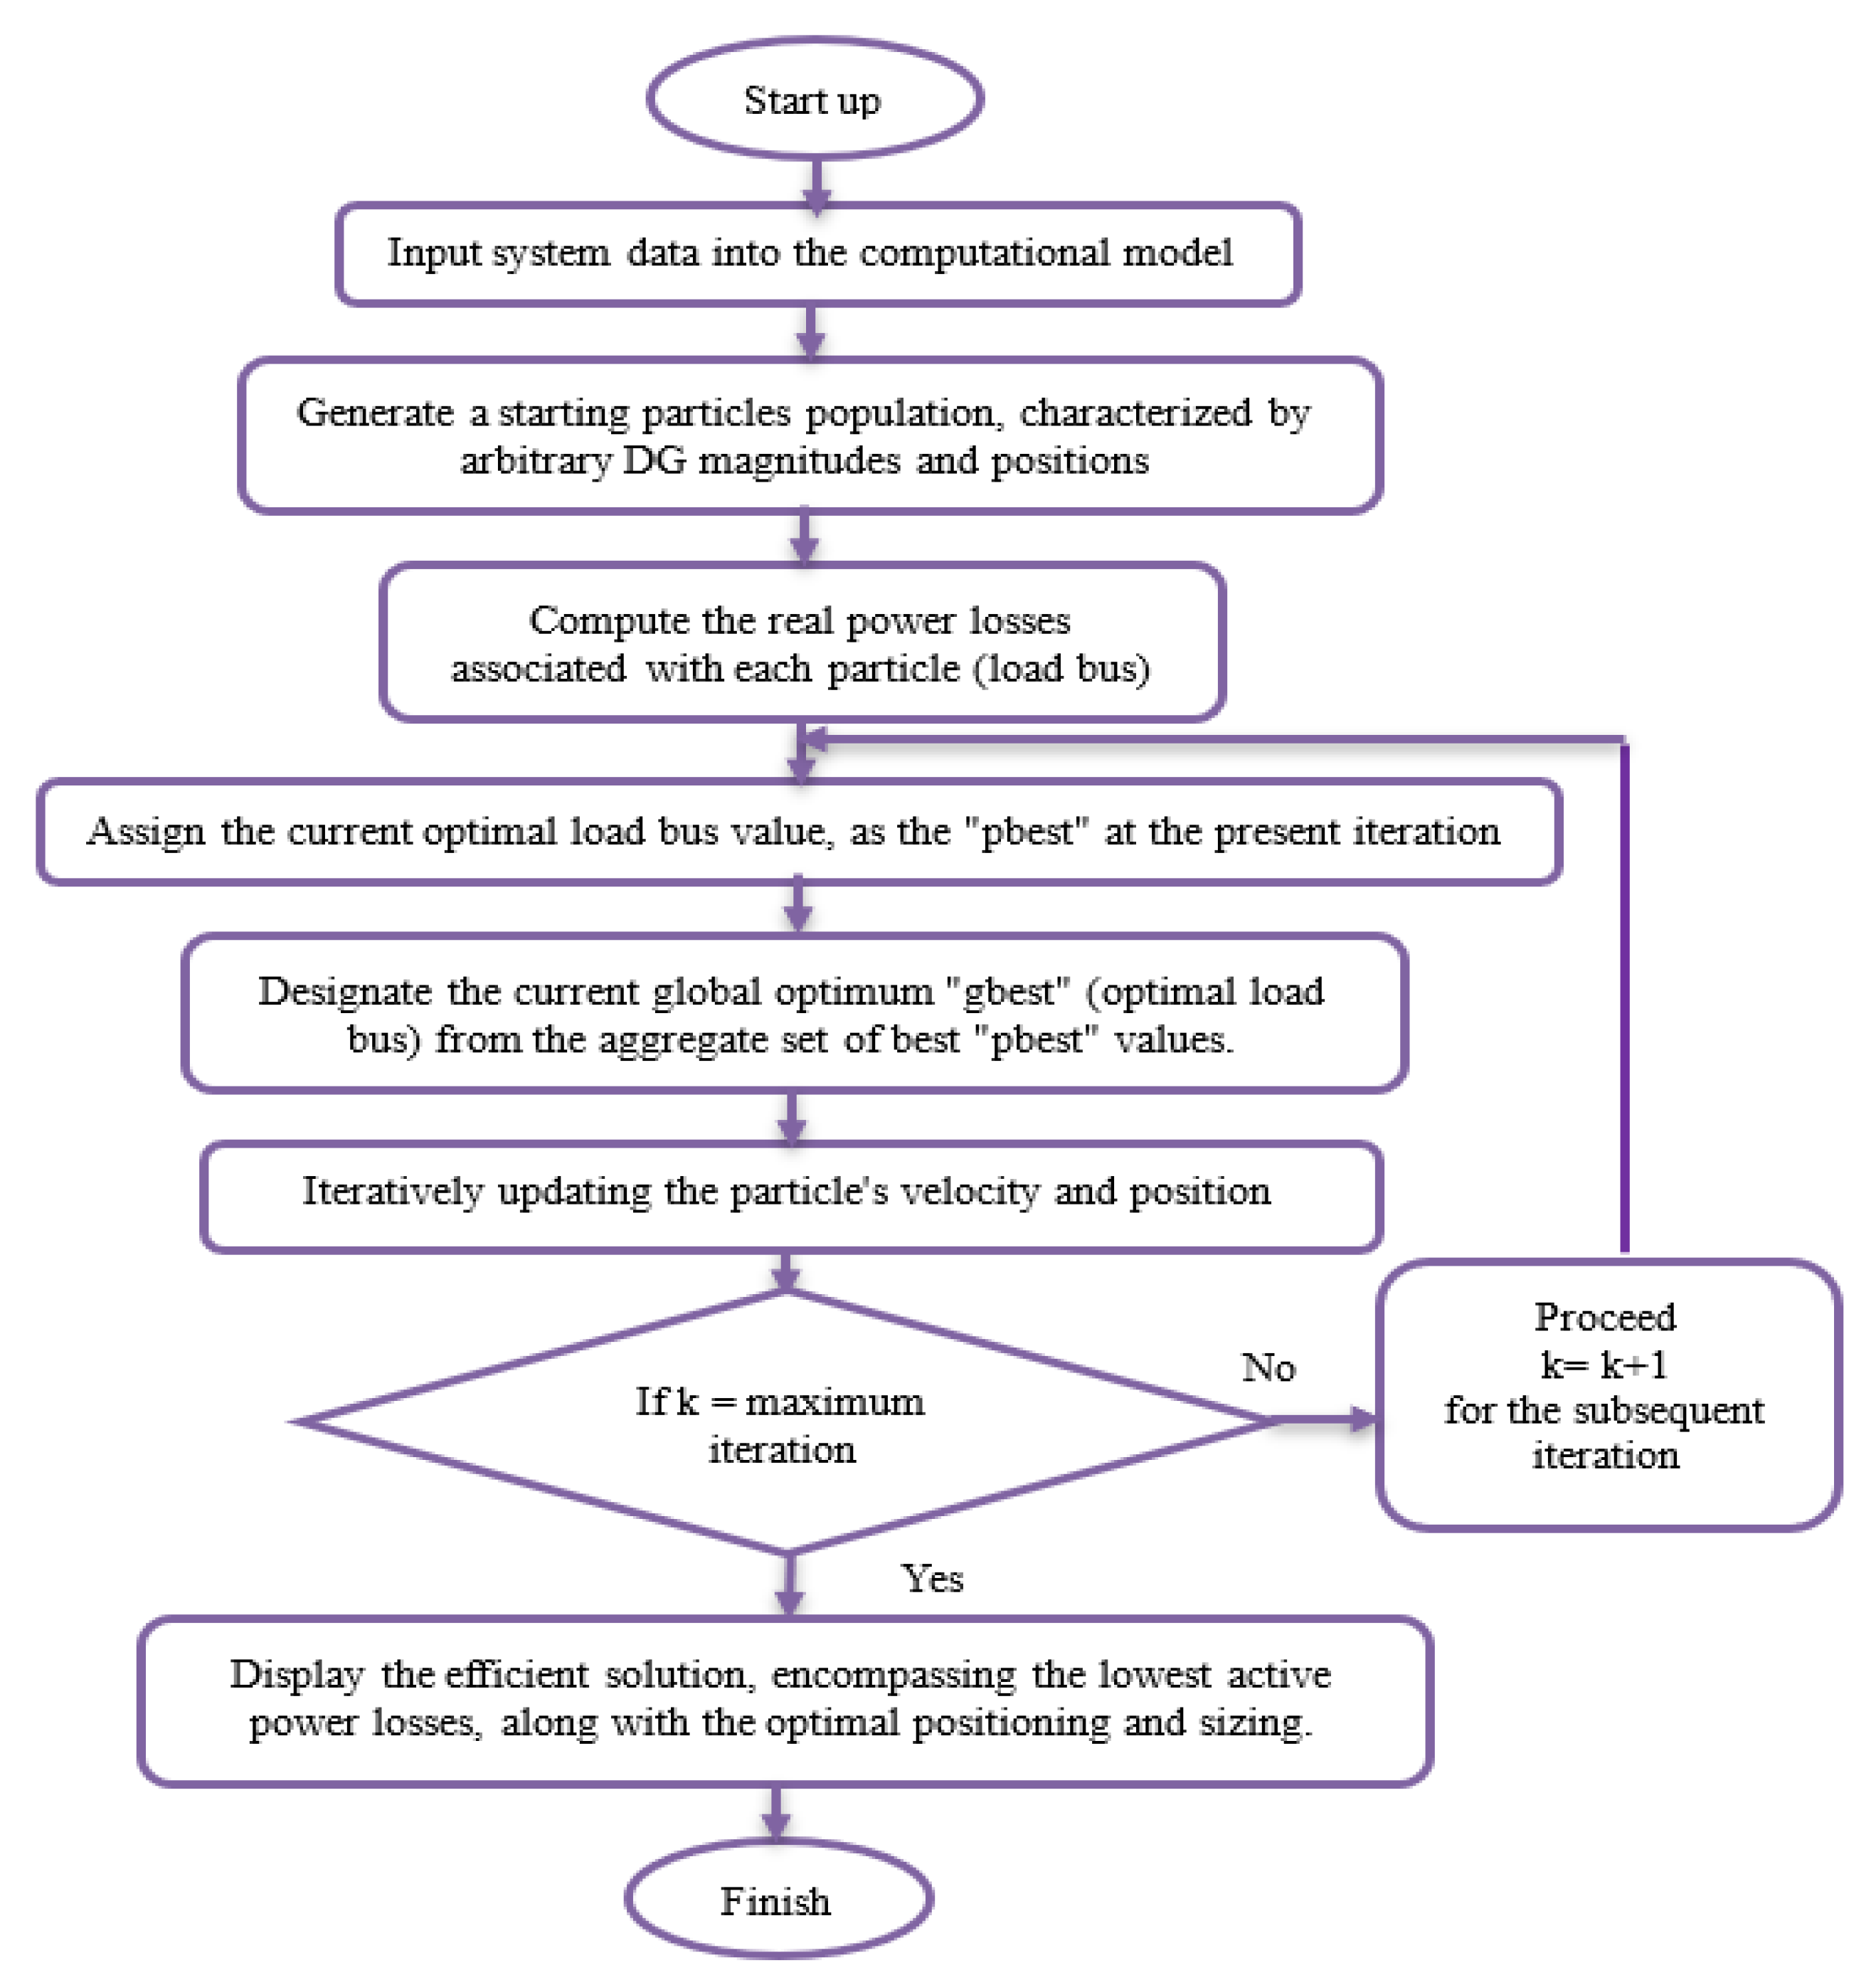
3. PSO Technique for Optimal GDG Integration in DNs
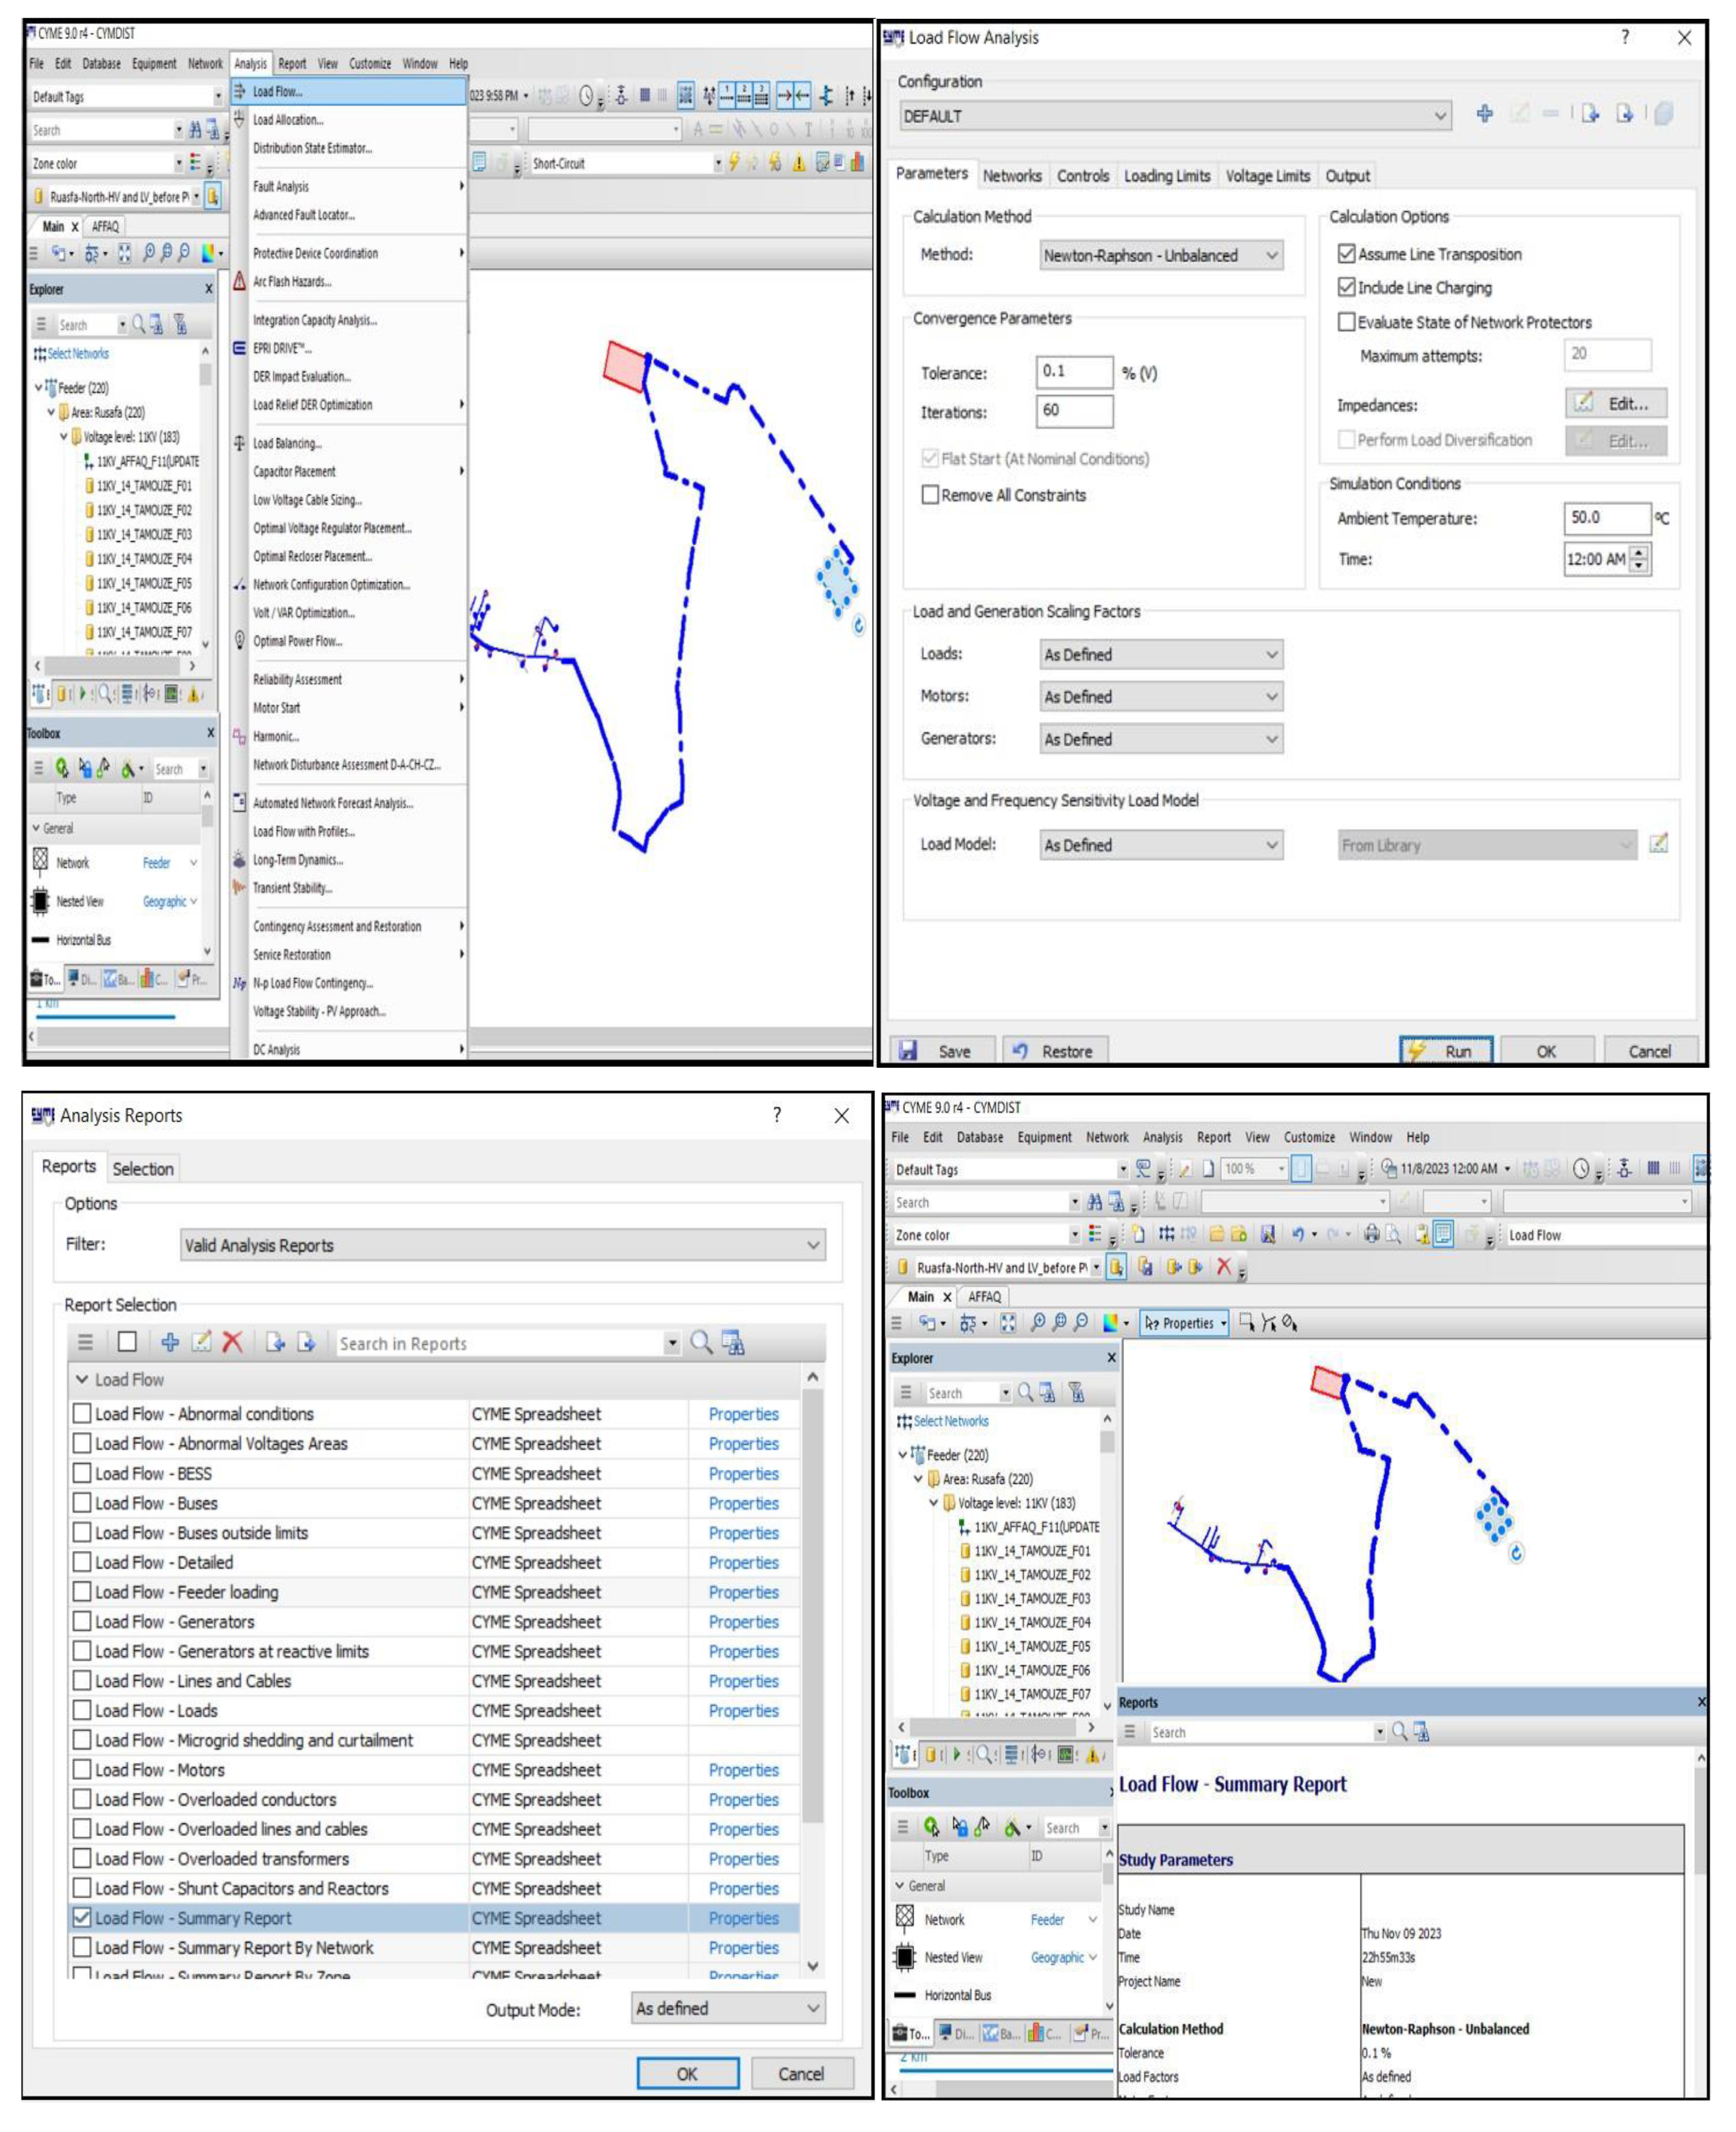
4. CYMDist Background
4.1. Databases Employed in CYMDist
4.1.1. Equipment Database
4.1.2. Network Database
5. Practical Implementation and Comparative Study
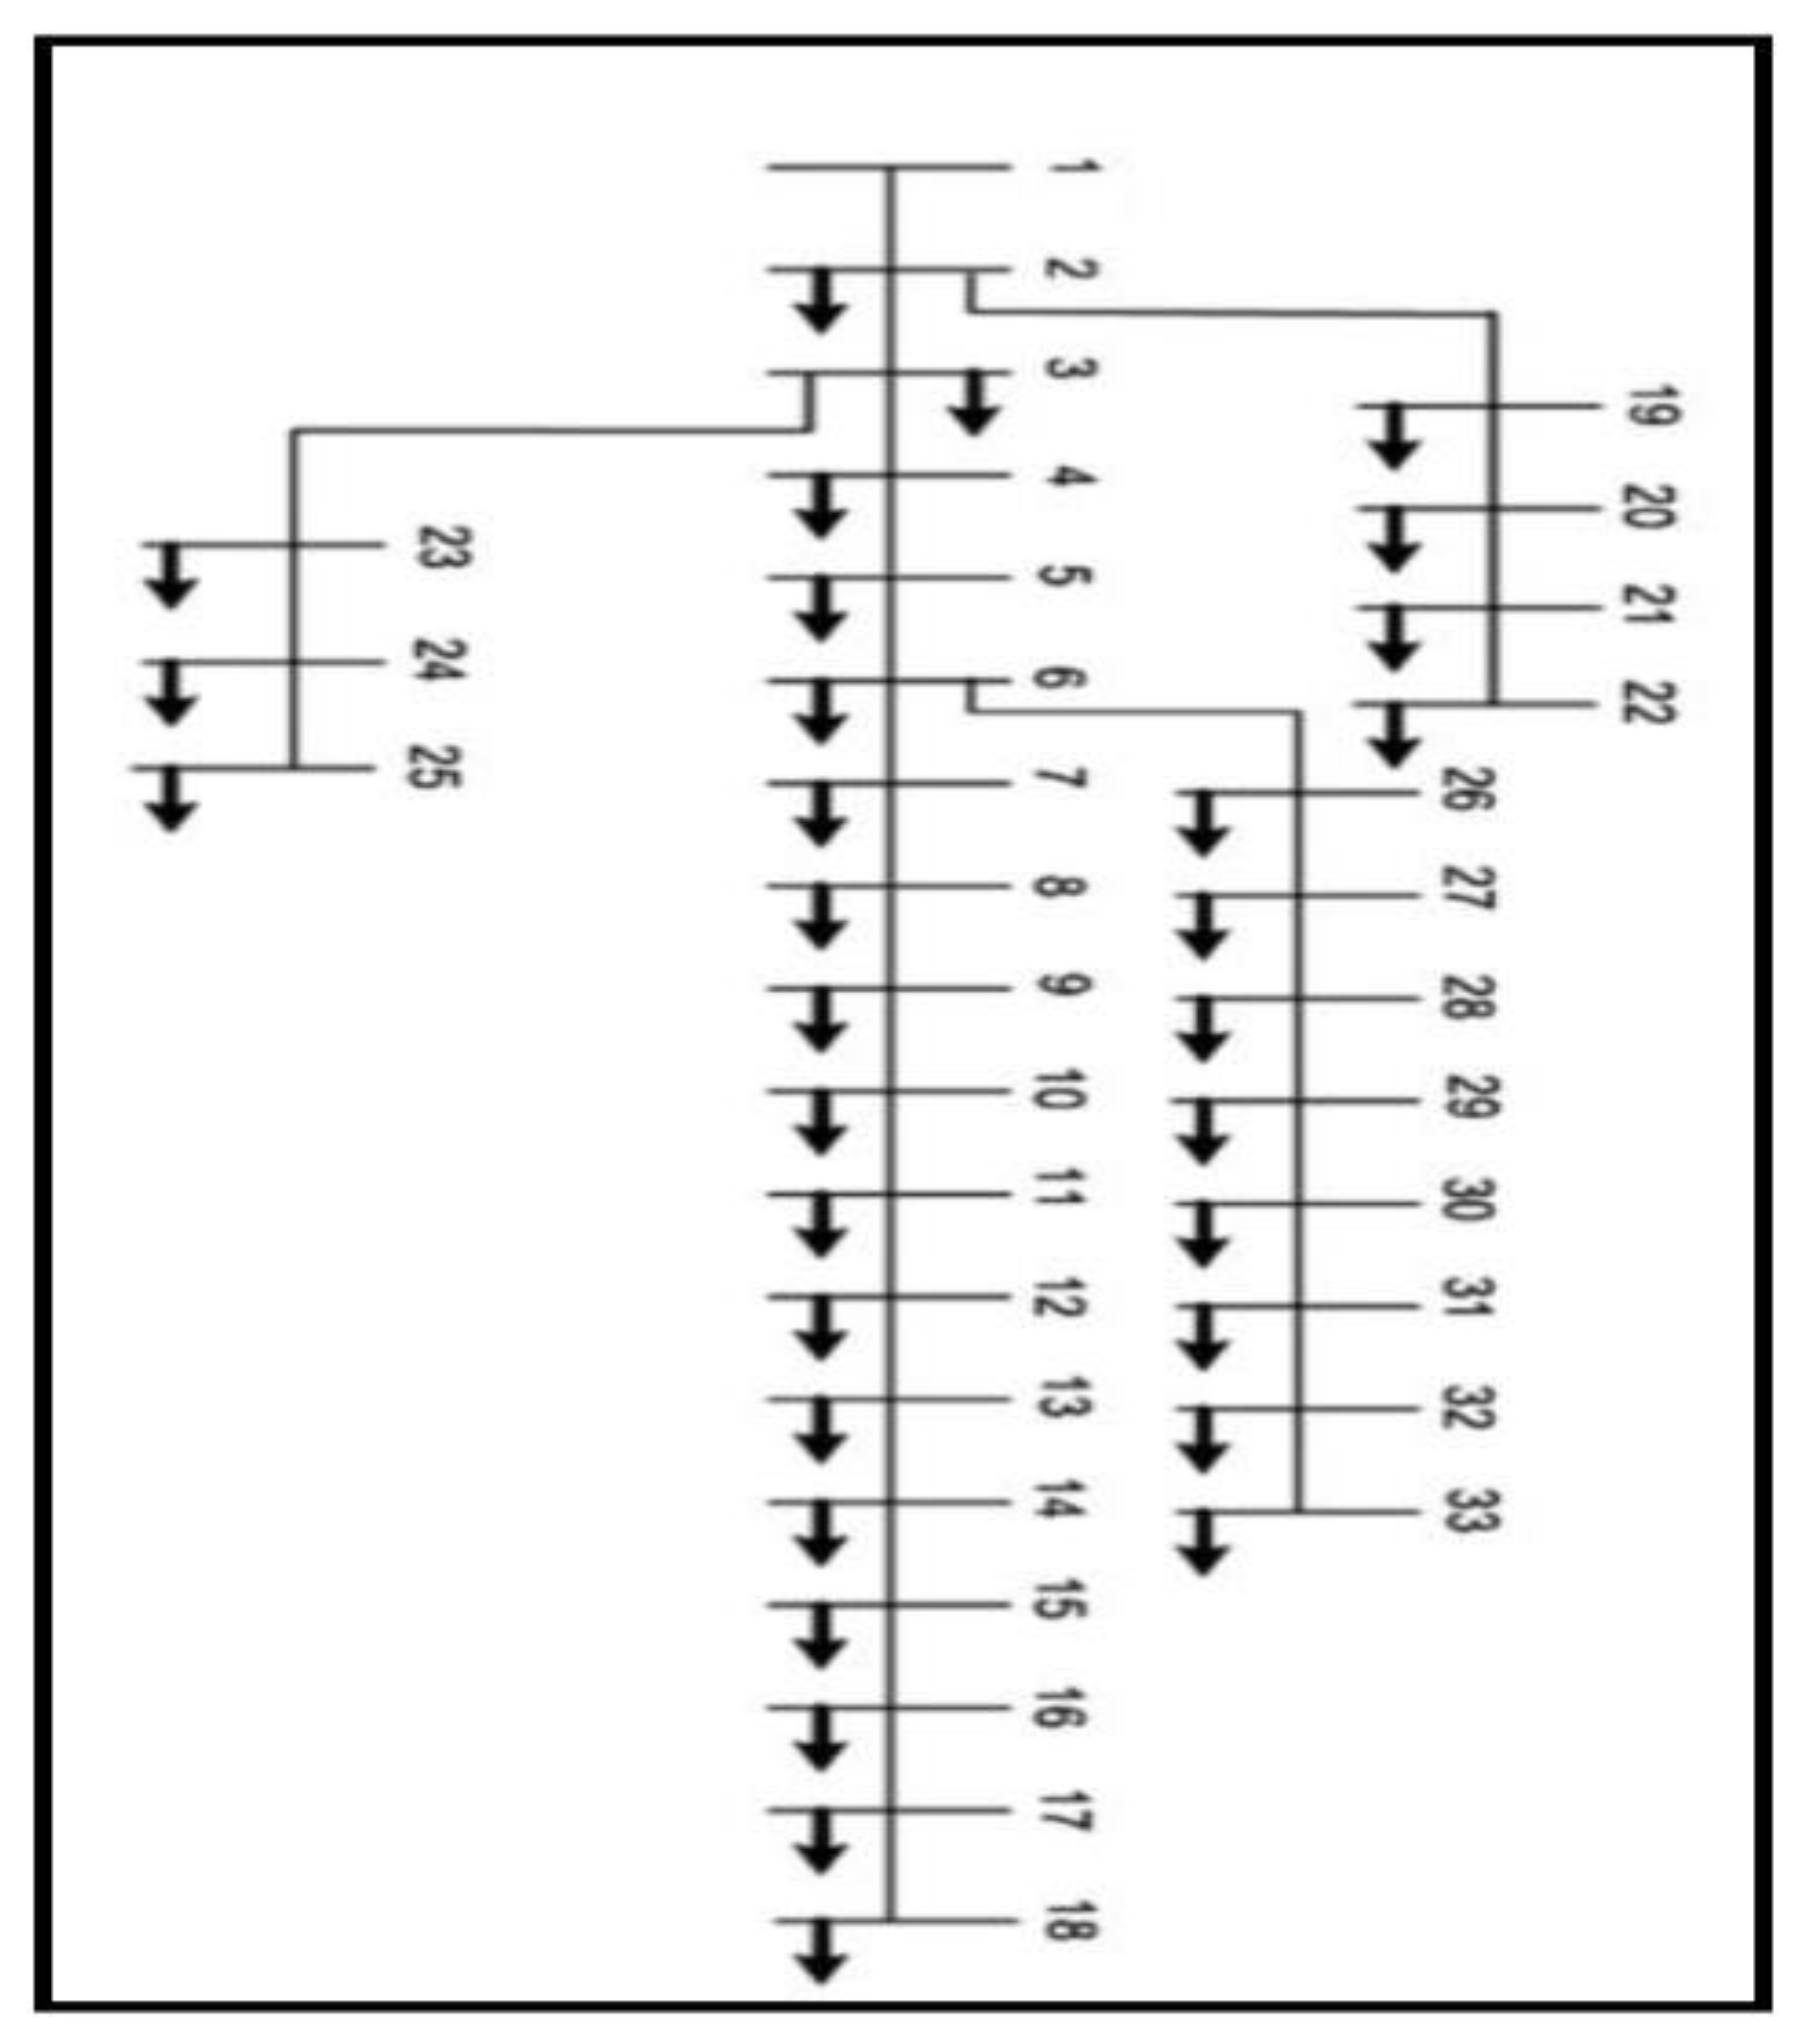
5.1. IEEE 33 Bus Distribution Test System Analysis
- (1)
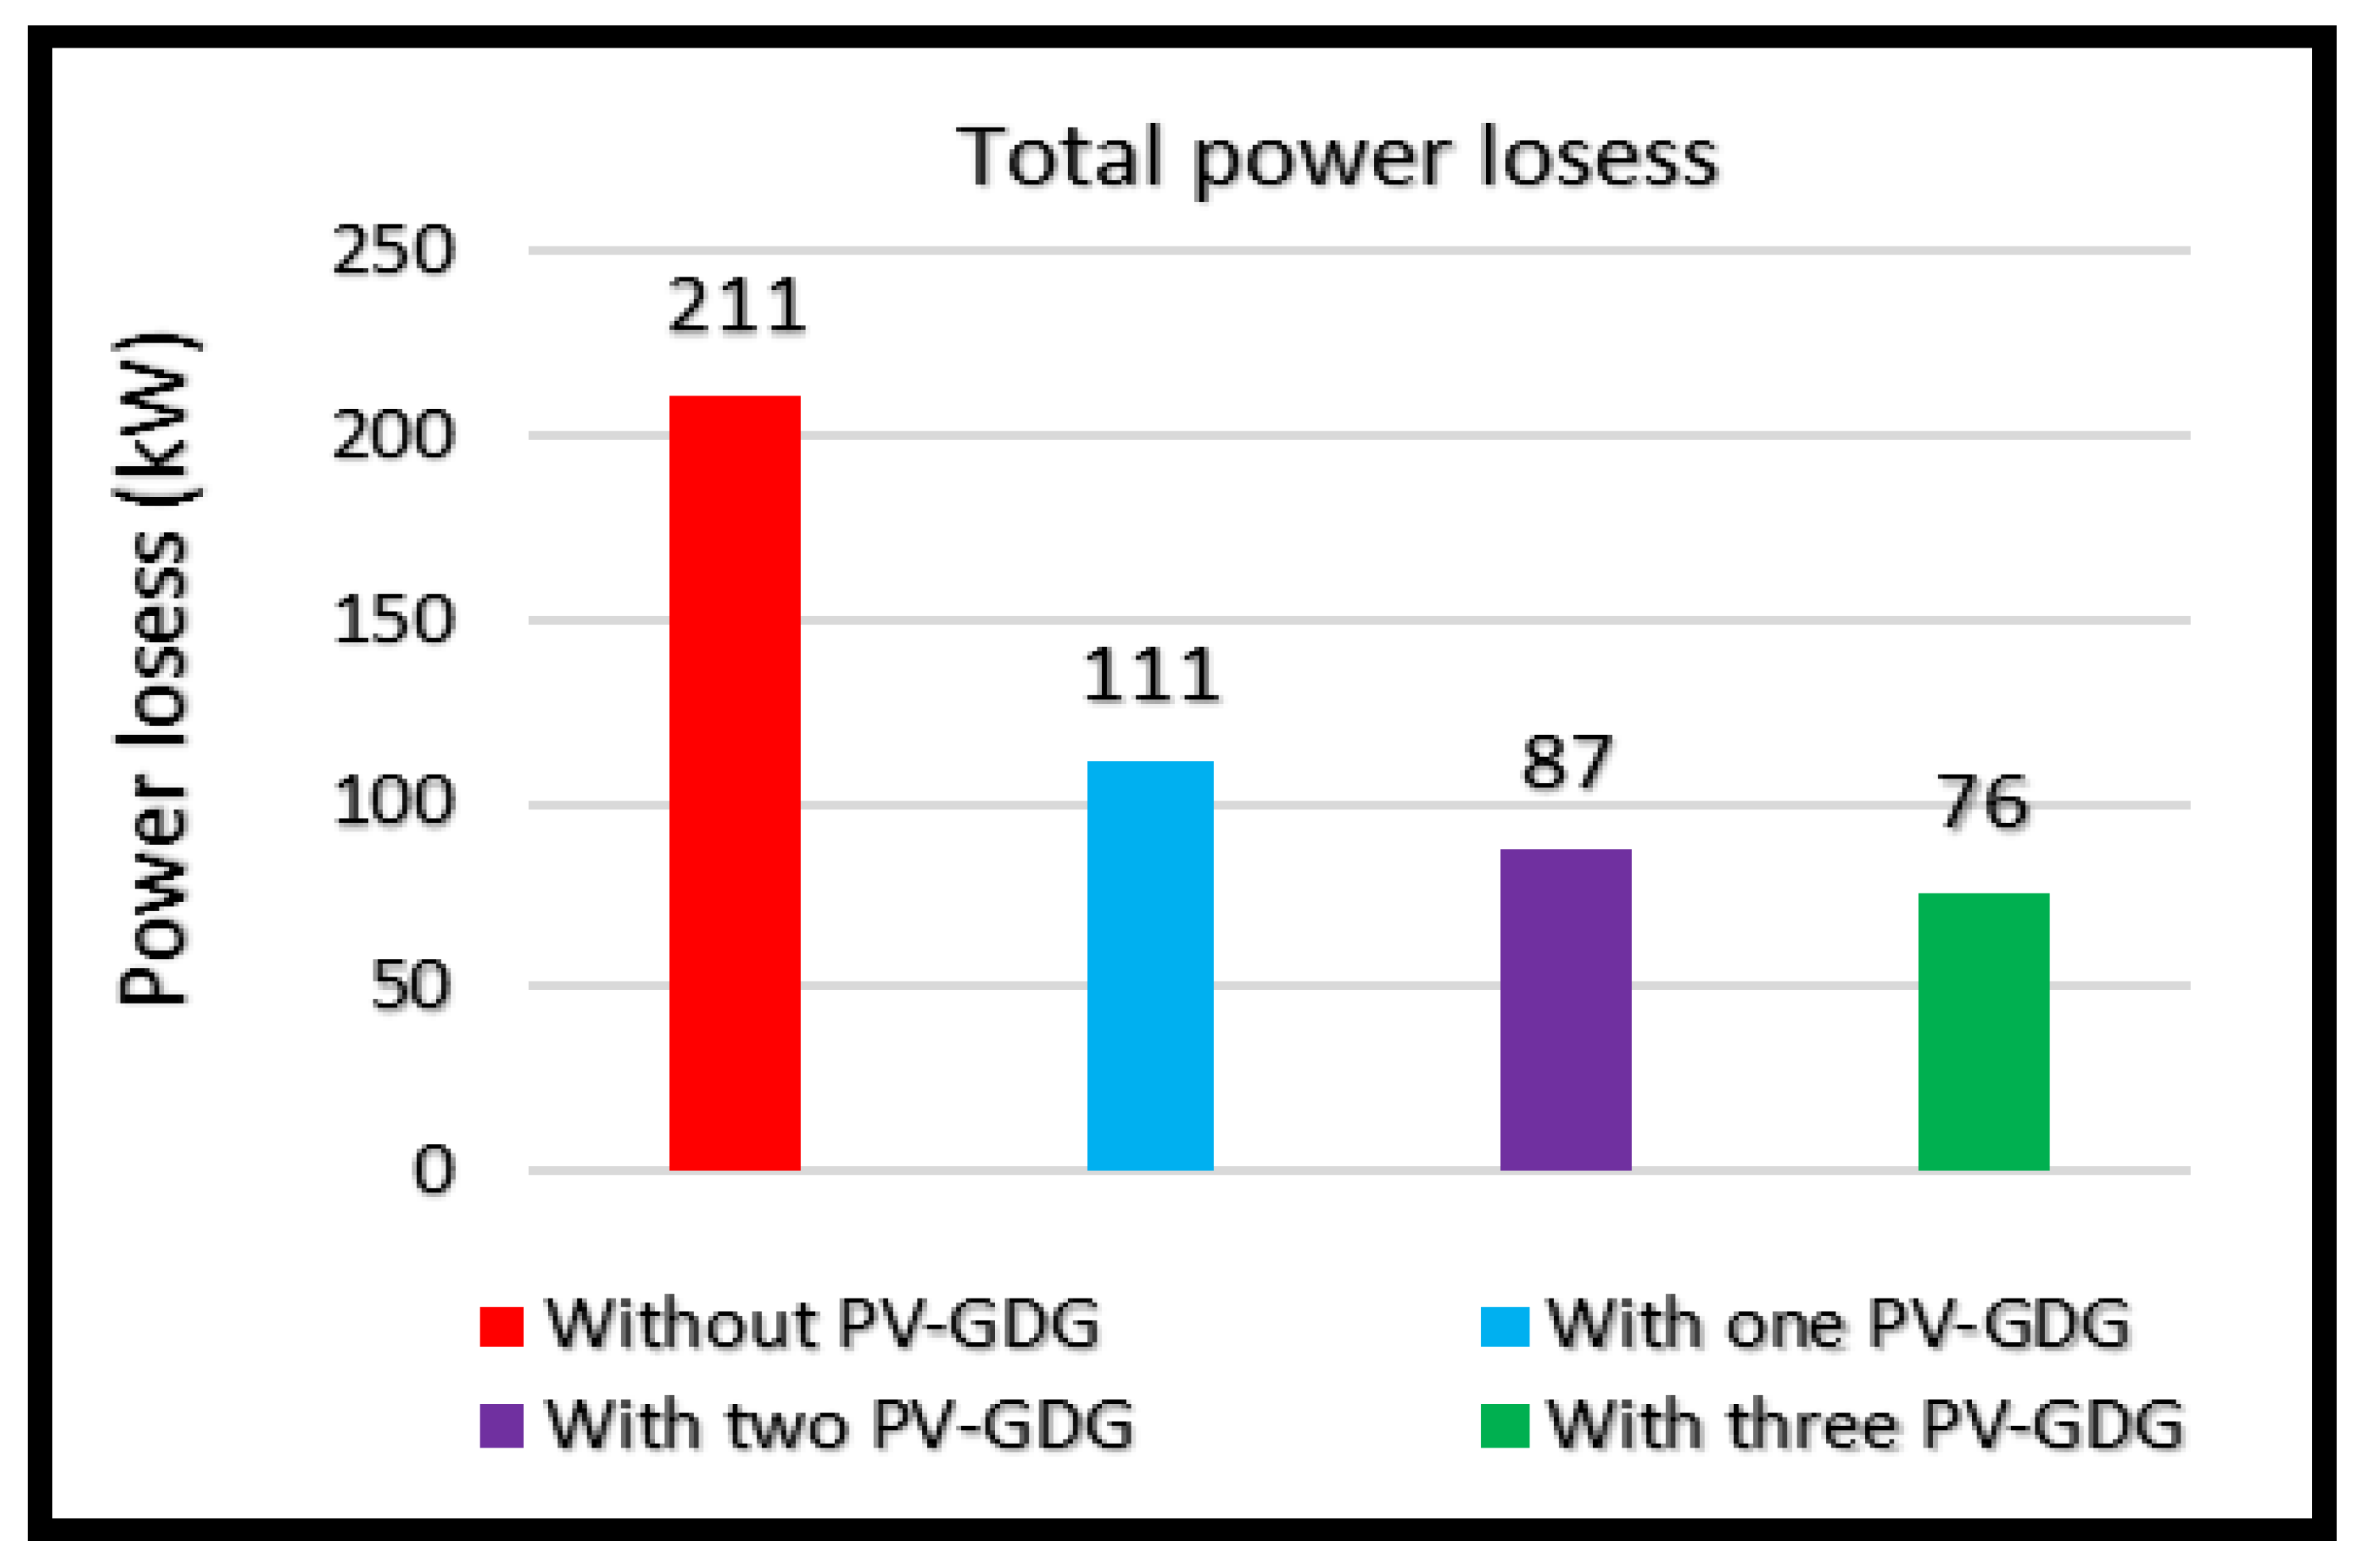
- Using CYMEDist software, a simulation of the IEEE 33 bus test system was conducted to perform load flow analysis in the absence of any PV-GDG units. Subsequently, based on the results obtained from the PSO algorithm, the generation units were connected at identified locations with suitable sizes. PV-GDG units are allowed to be installed between bus 2 and bus 33, with a rated power range of 1.0 MW 4.0 MW. Subsequent load flow analyses were repeated for configurations involving one, two, and three PV-GDG units, enabling the evaluation of active power losses and the identification of the bus with the lowest voltage level. Finally, a comparison was made between the outcomes obtained from CYMEDist and those obtained using MATLAB. Table 1 presents a comprehensive analysis of the results obtained when incorporating PV-GDG units into the test system of the IEEE 33 bus system using PSO methodology and CYMEDist software. The observations reported in [27,28,29,30,31] are consistent with the outcomes of this study. Importantly, it is worth highlighting that a comparison of these findings demonstrates a conspicuous level of similarity, as illustrated in Appendix C. The compelling results that demonstrate the effectiveness of PV-GDG units are shown in Figure 6.
- (2)
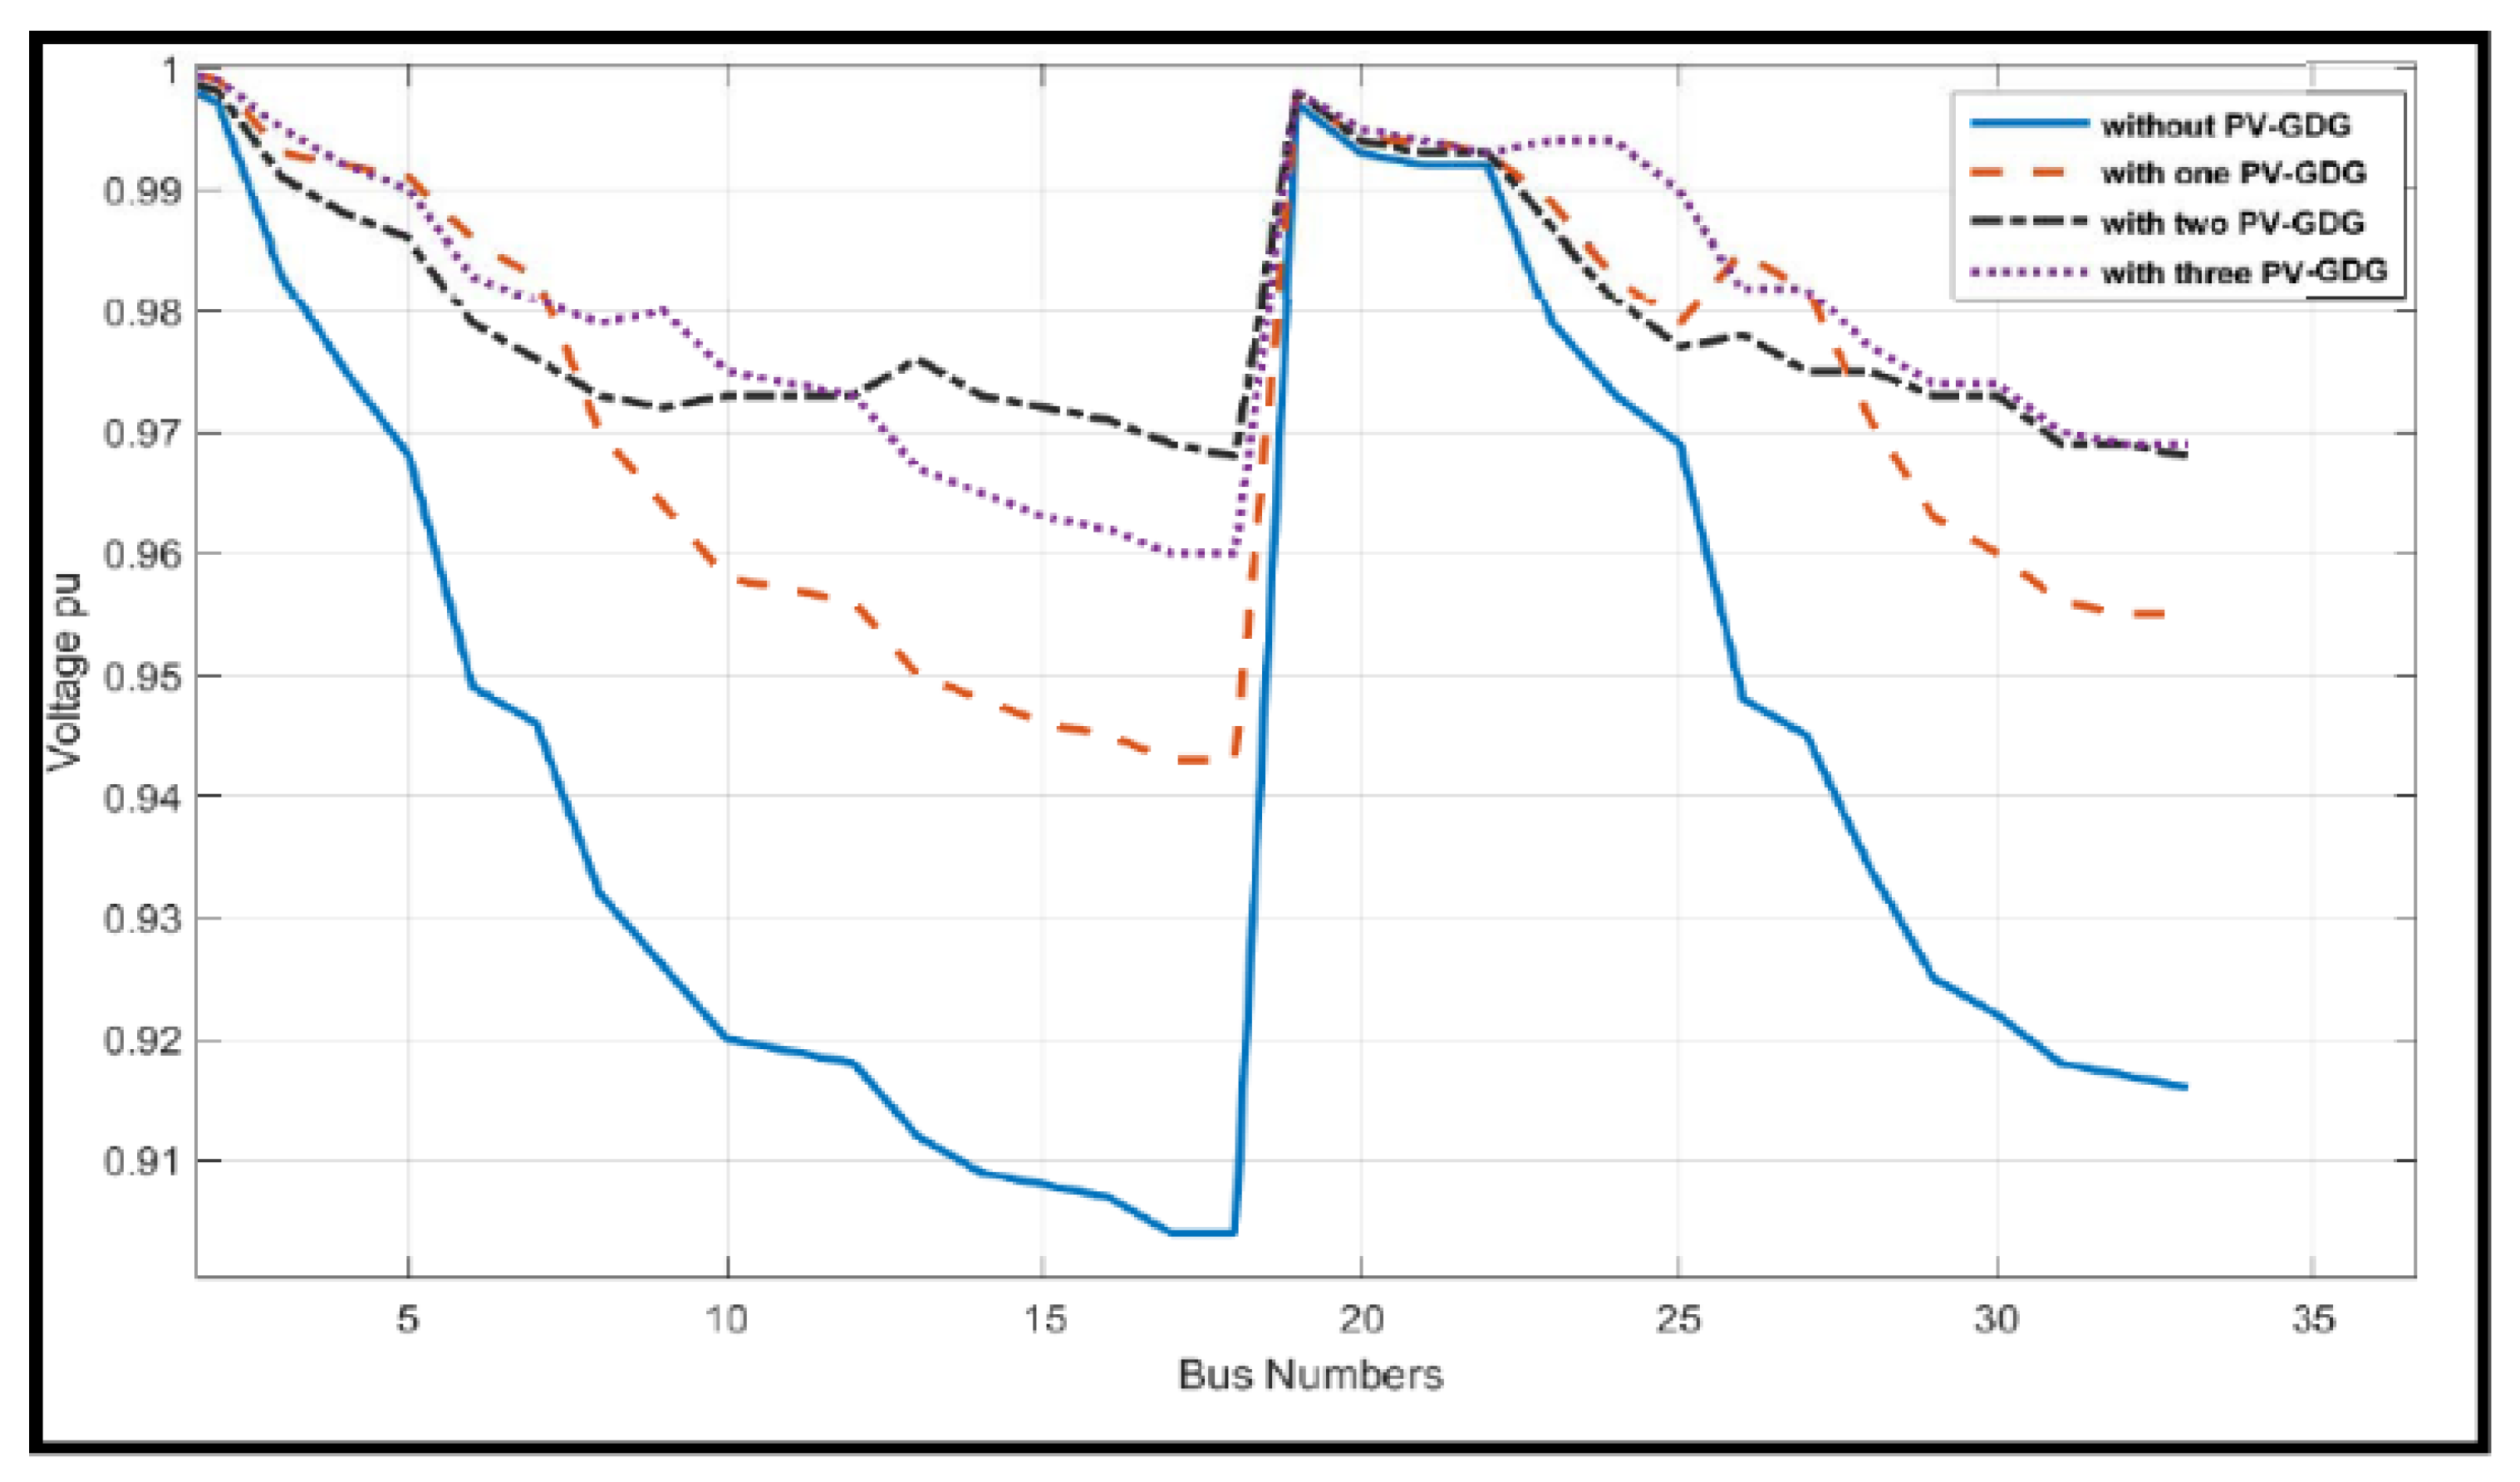
- This study evaluated the impact of integrating PV-GDG on the voltage drop in a power system, specifically focusing on bus 18. Initially, bus 18 experienced a voltage reduction of approximately 0.904 per unit before incorporating PV-GDG units. The voltage characteristics (profiles) of the IEEE 33 bus distribution system are shown in Figure 7. The figure shows the voltage scenarios when PV-GDG units are removed and added.
Discussion of the IEEE 33 Test System Results
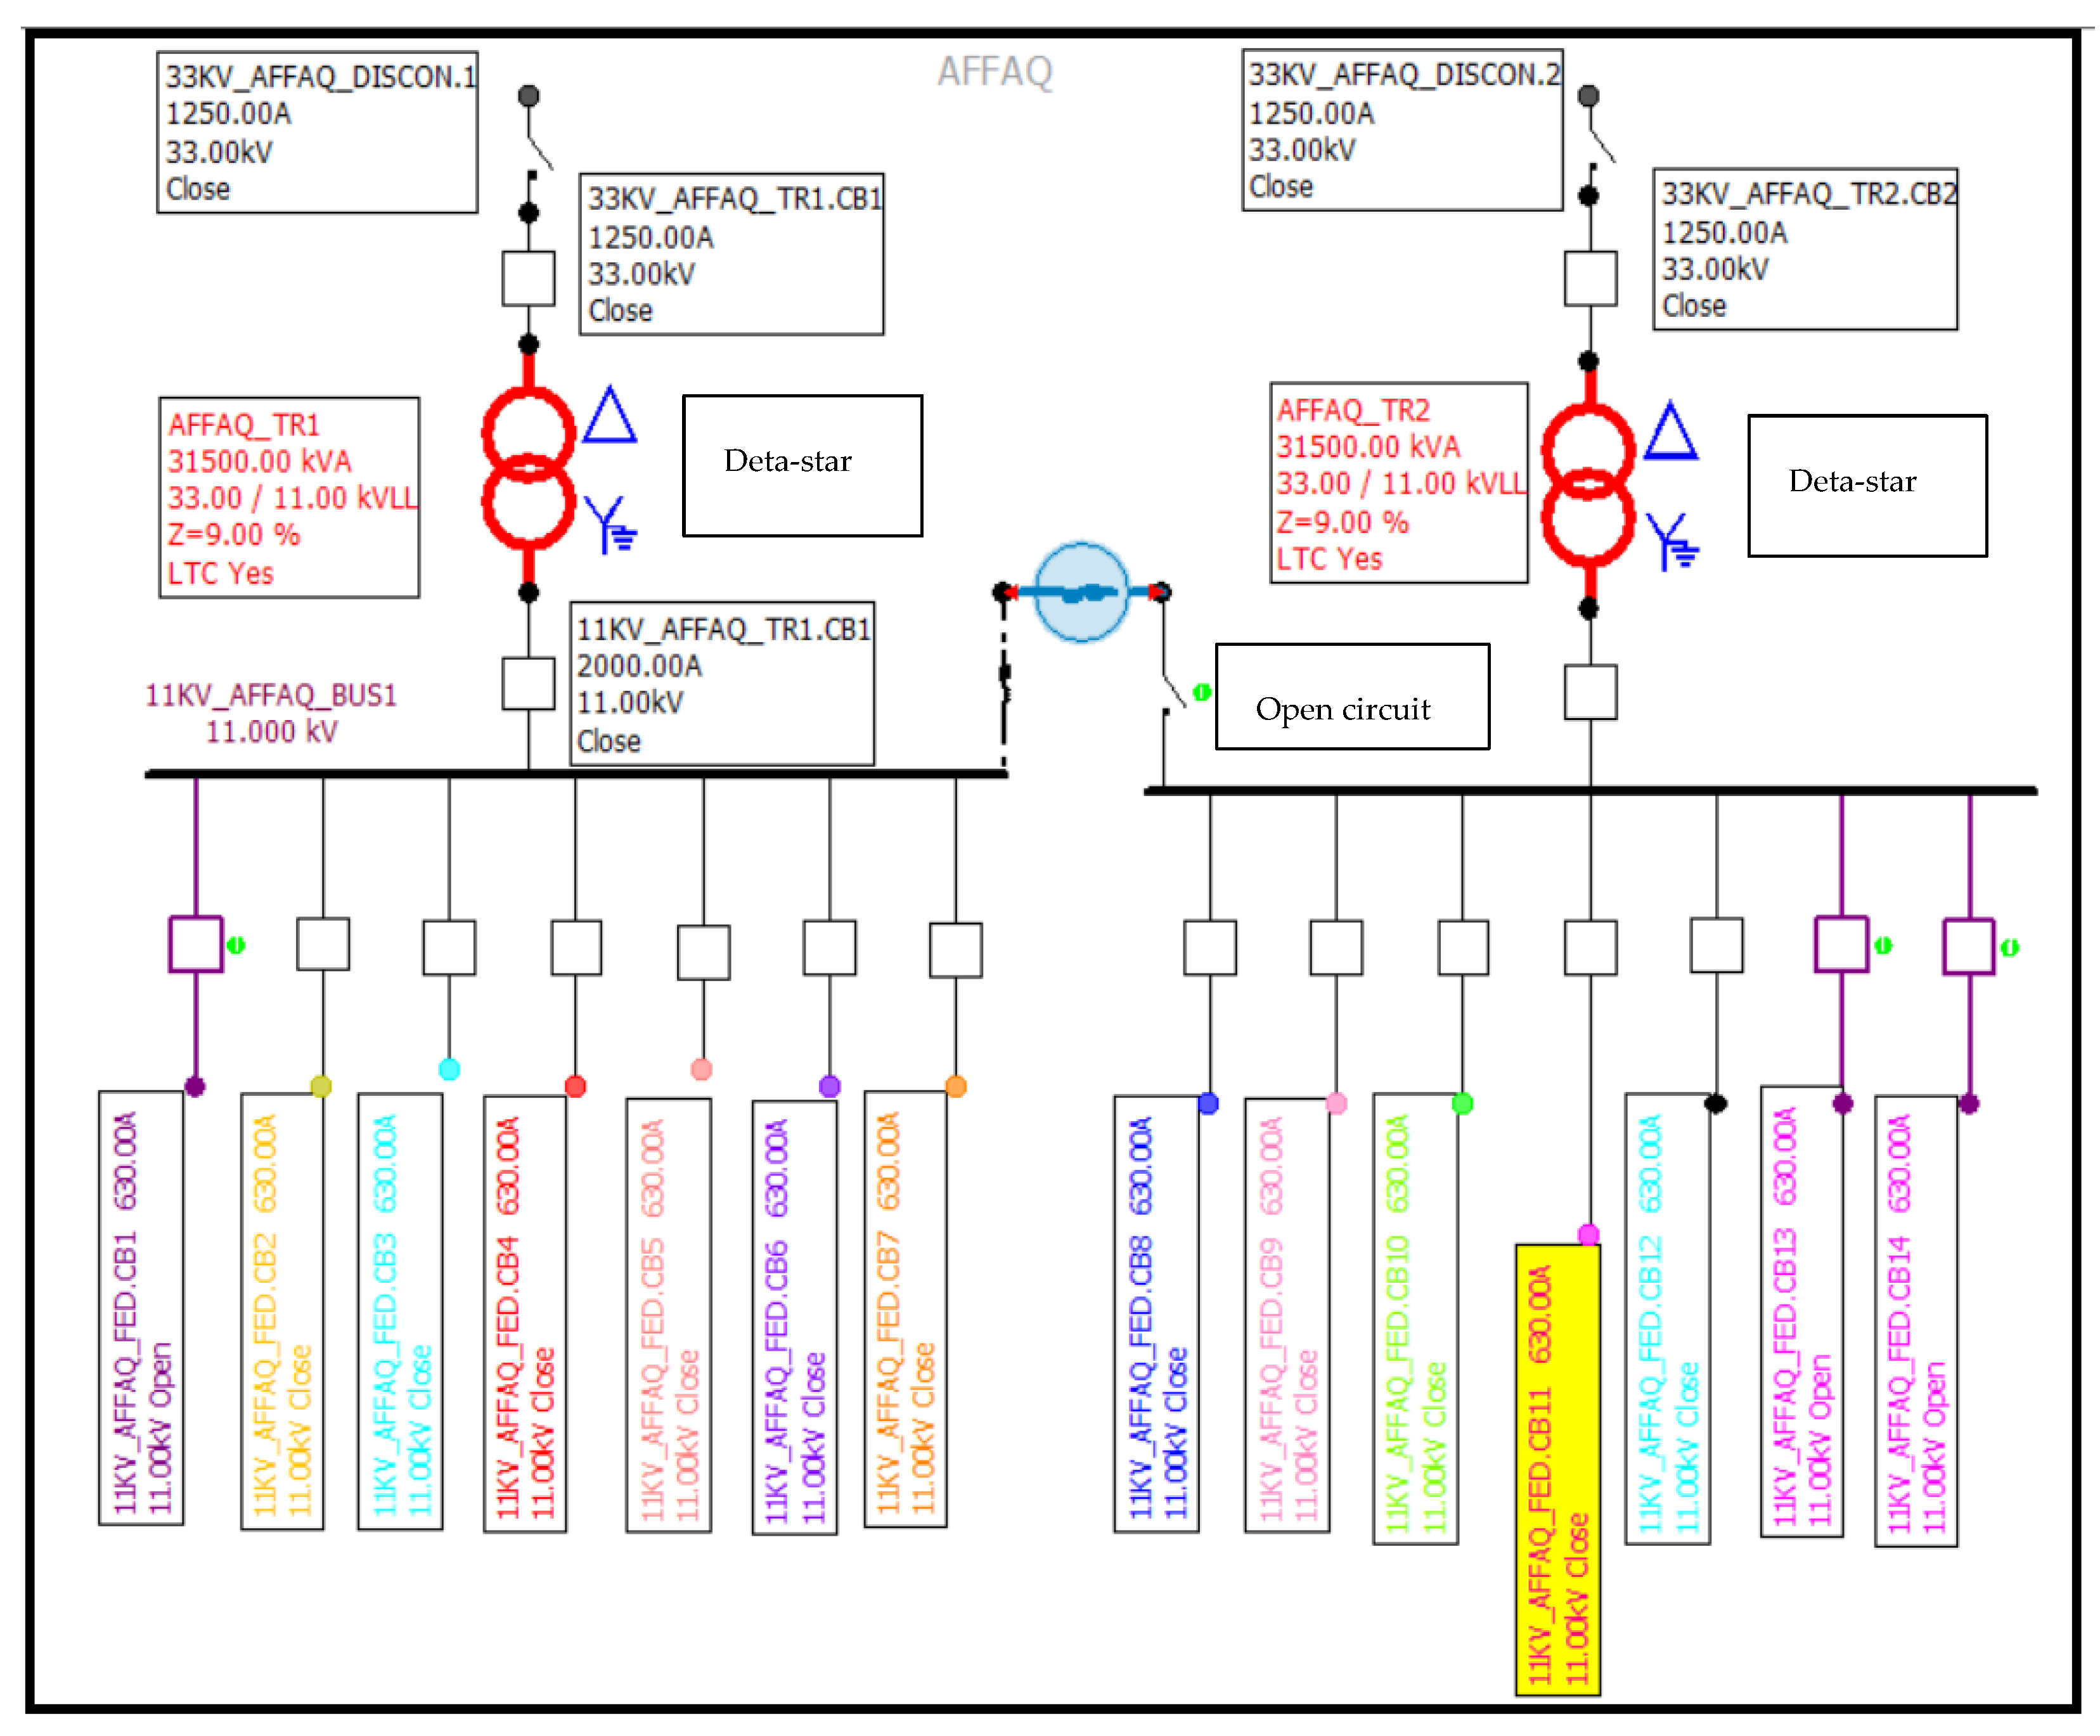
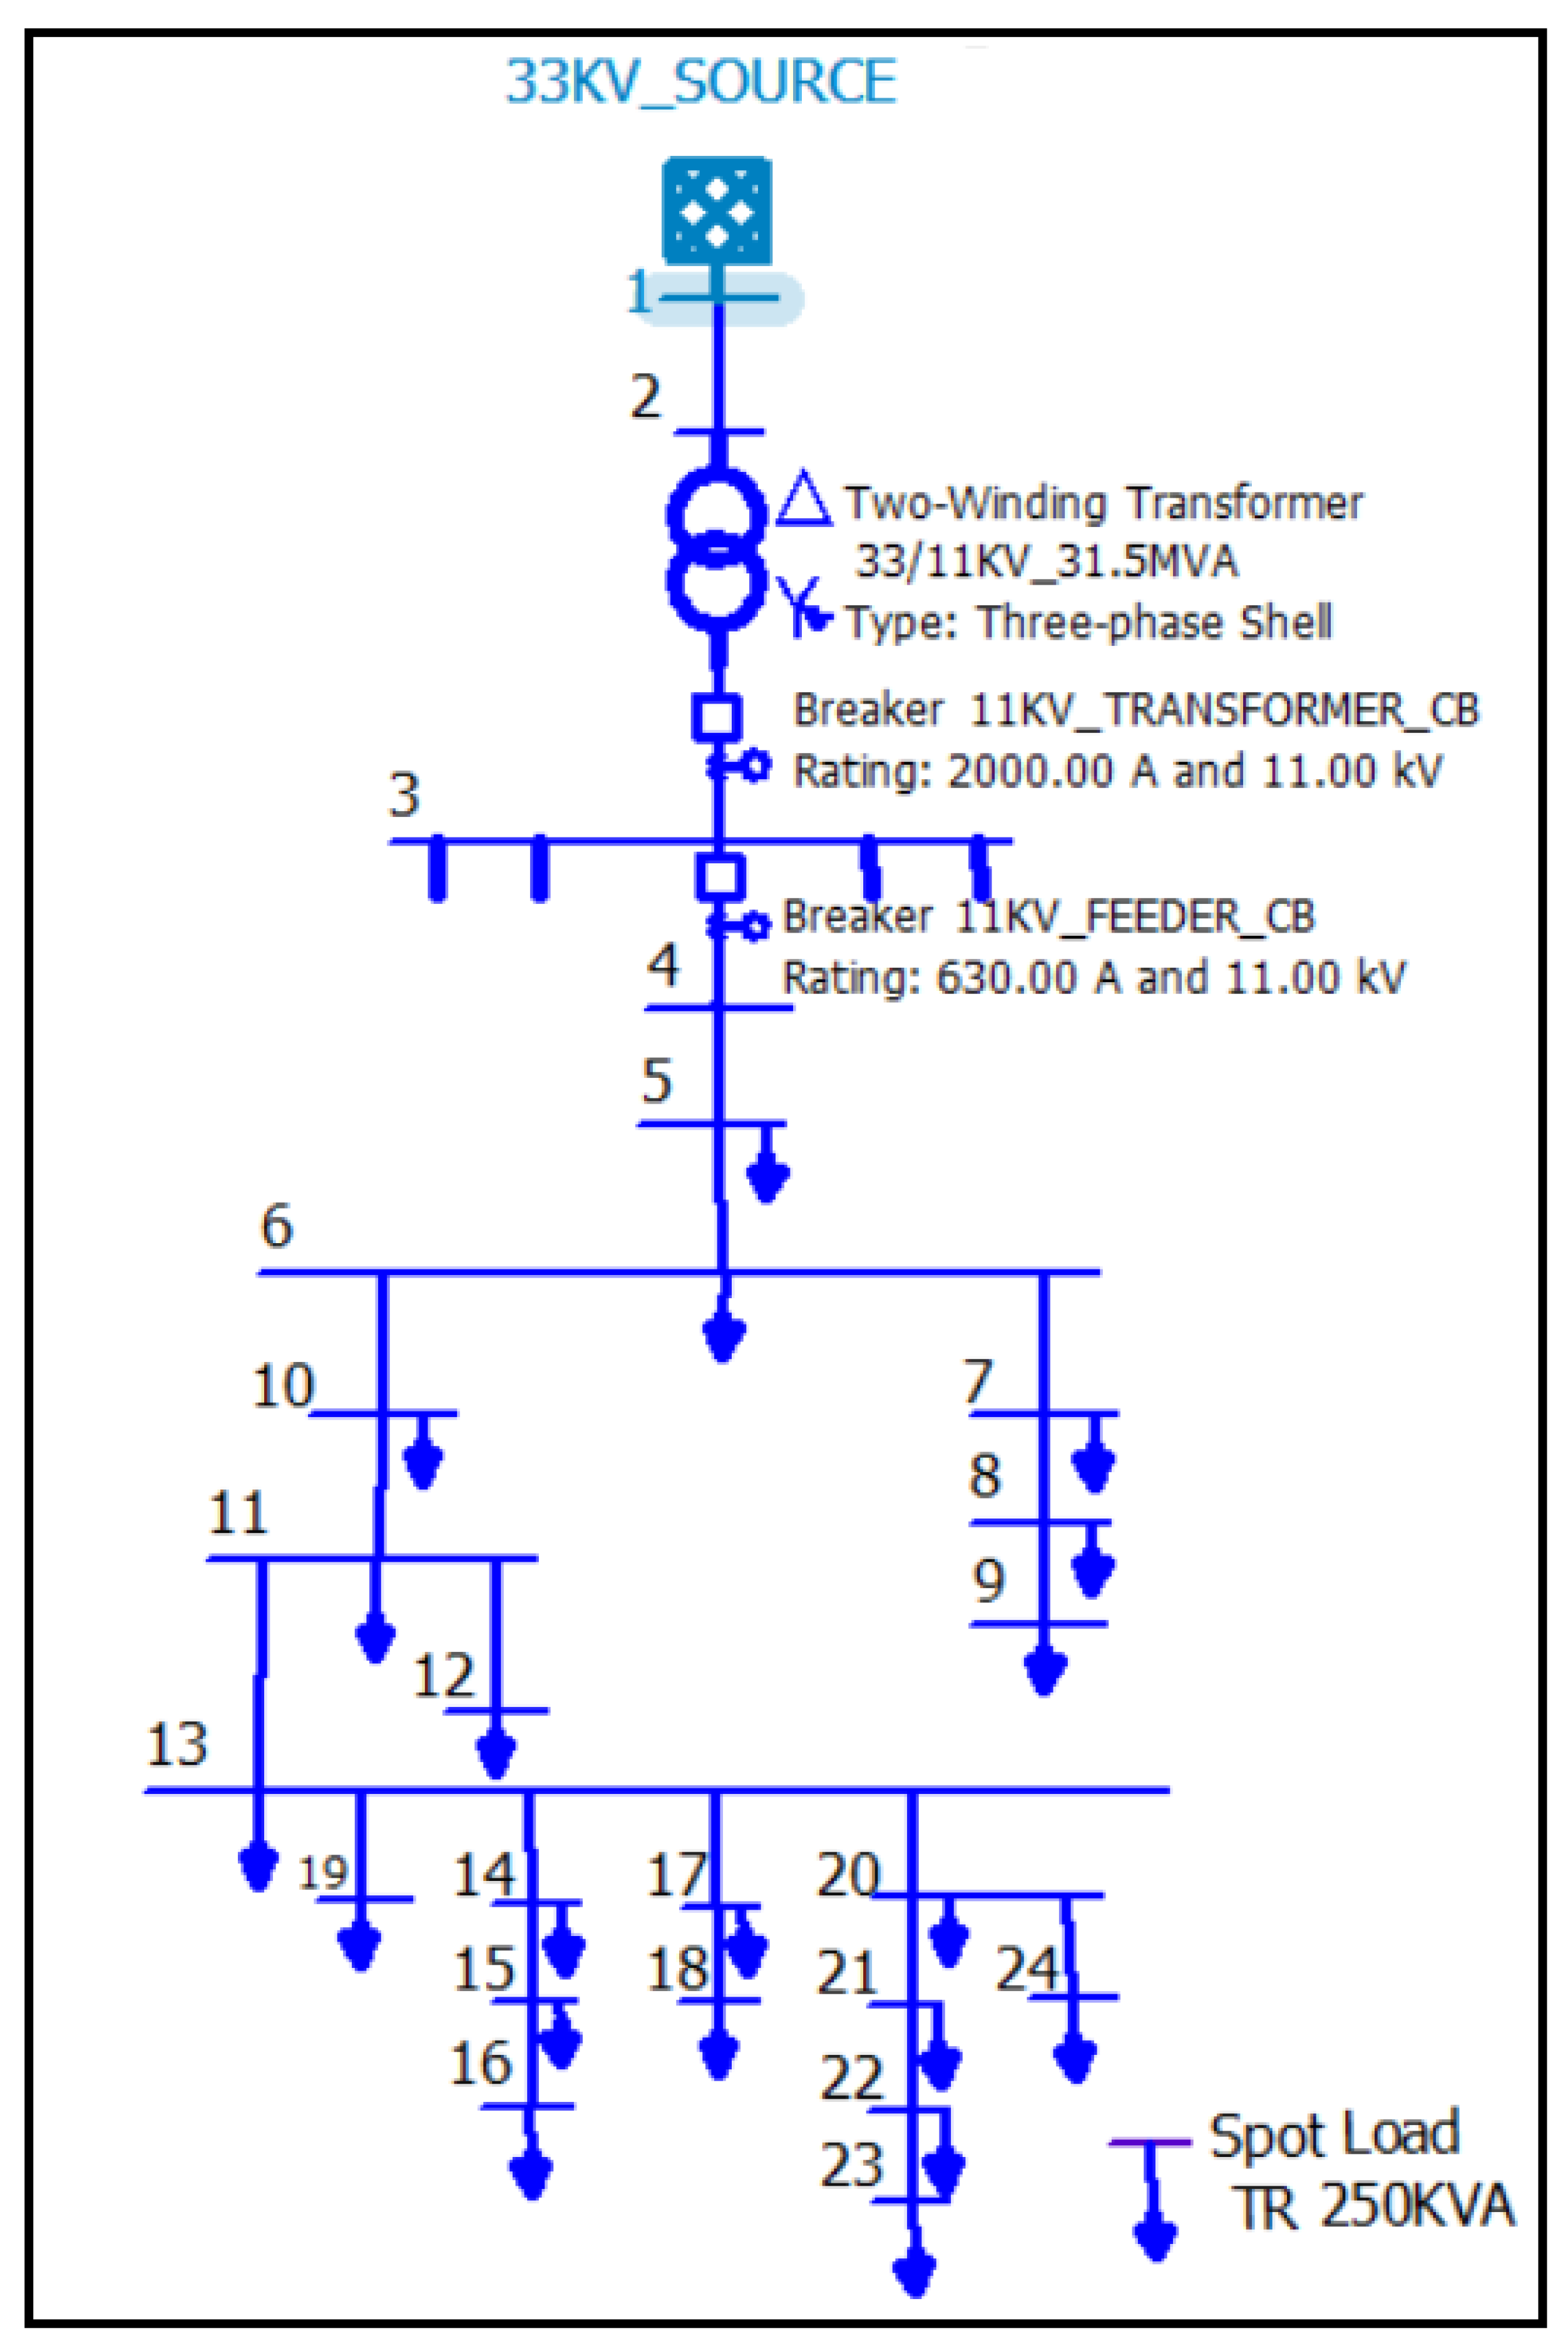
5.2. North of Al-Rusafa 11 kV Distribution Network
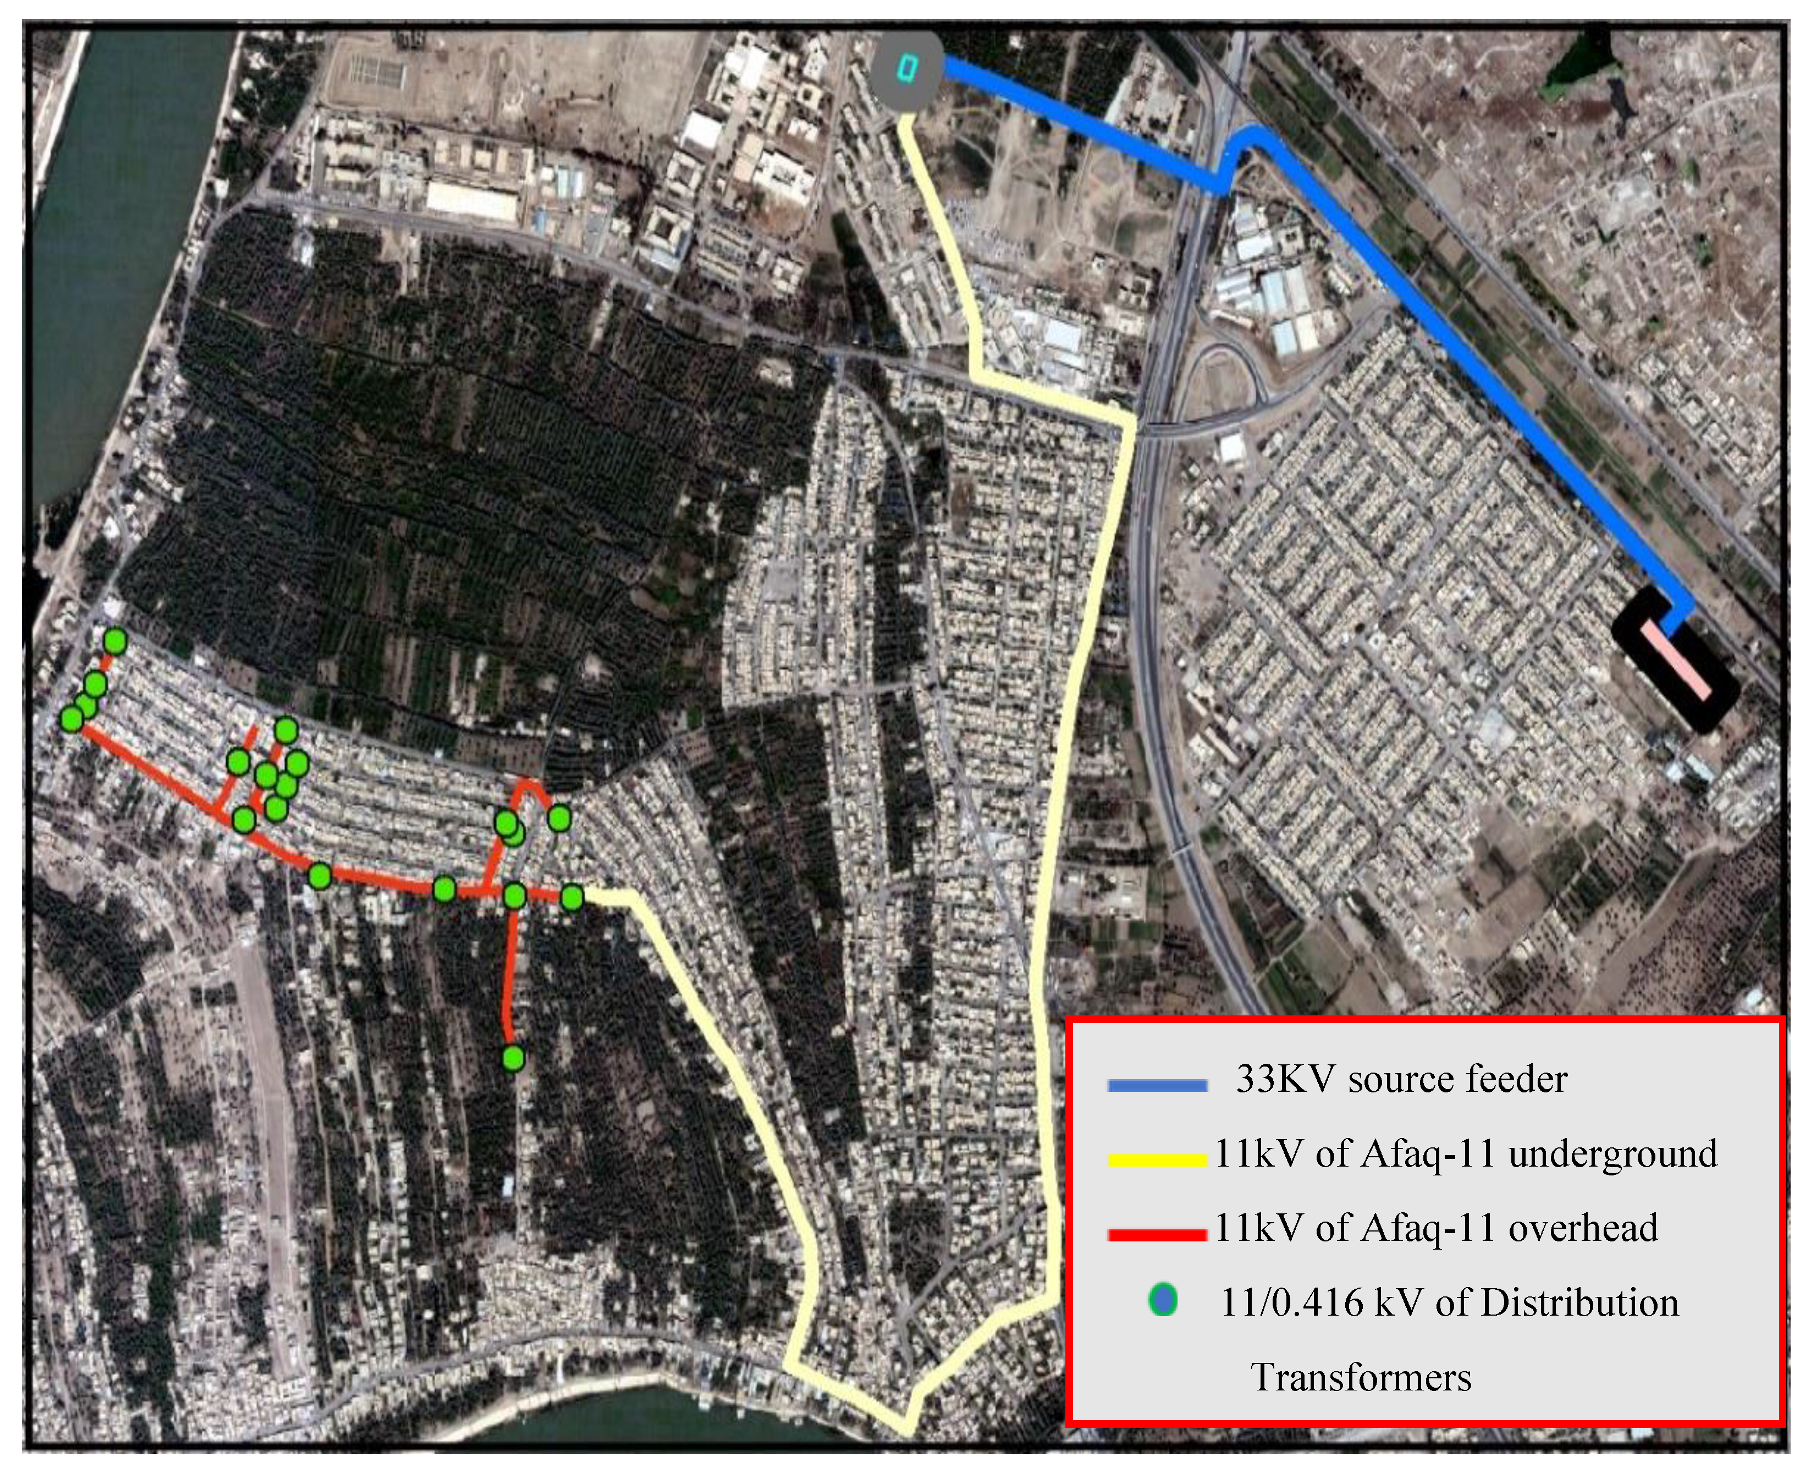
5.2.1. Feeder Description (Afaq-11)
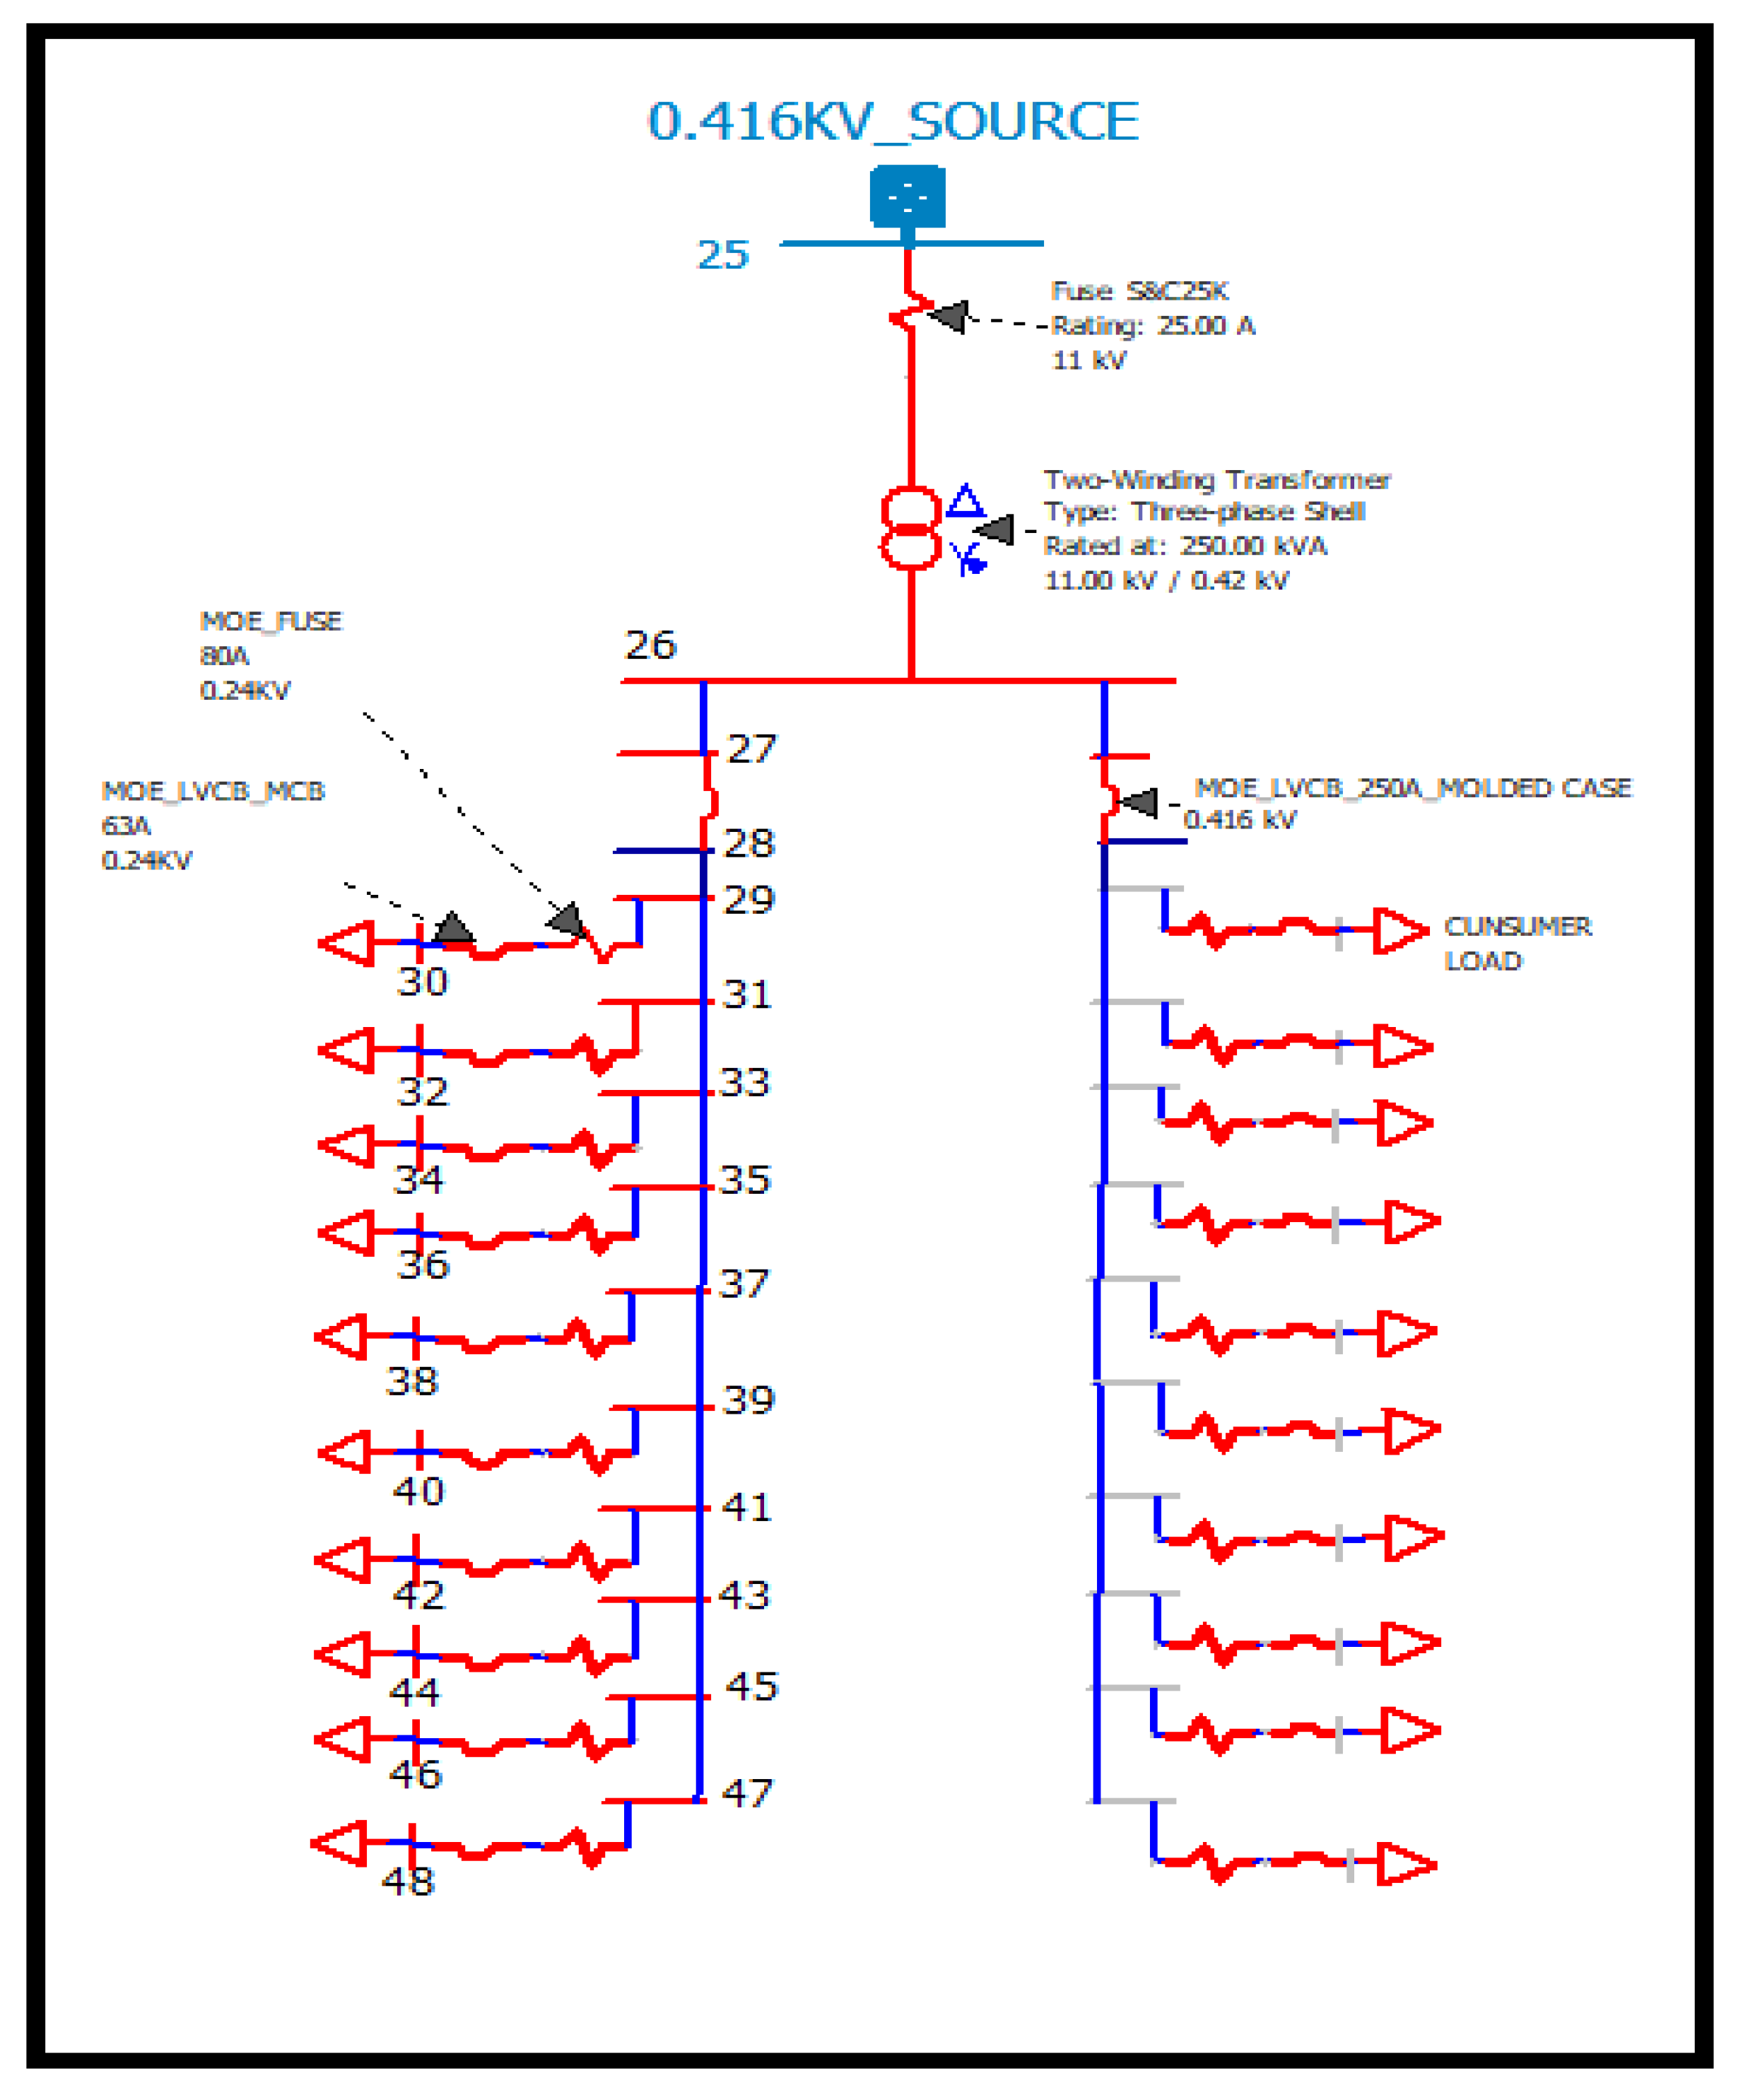
5.2.2. Low-Voltage Model
5.2.3. Grid-Connected PV-GDG Design
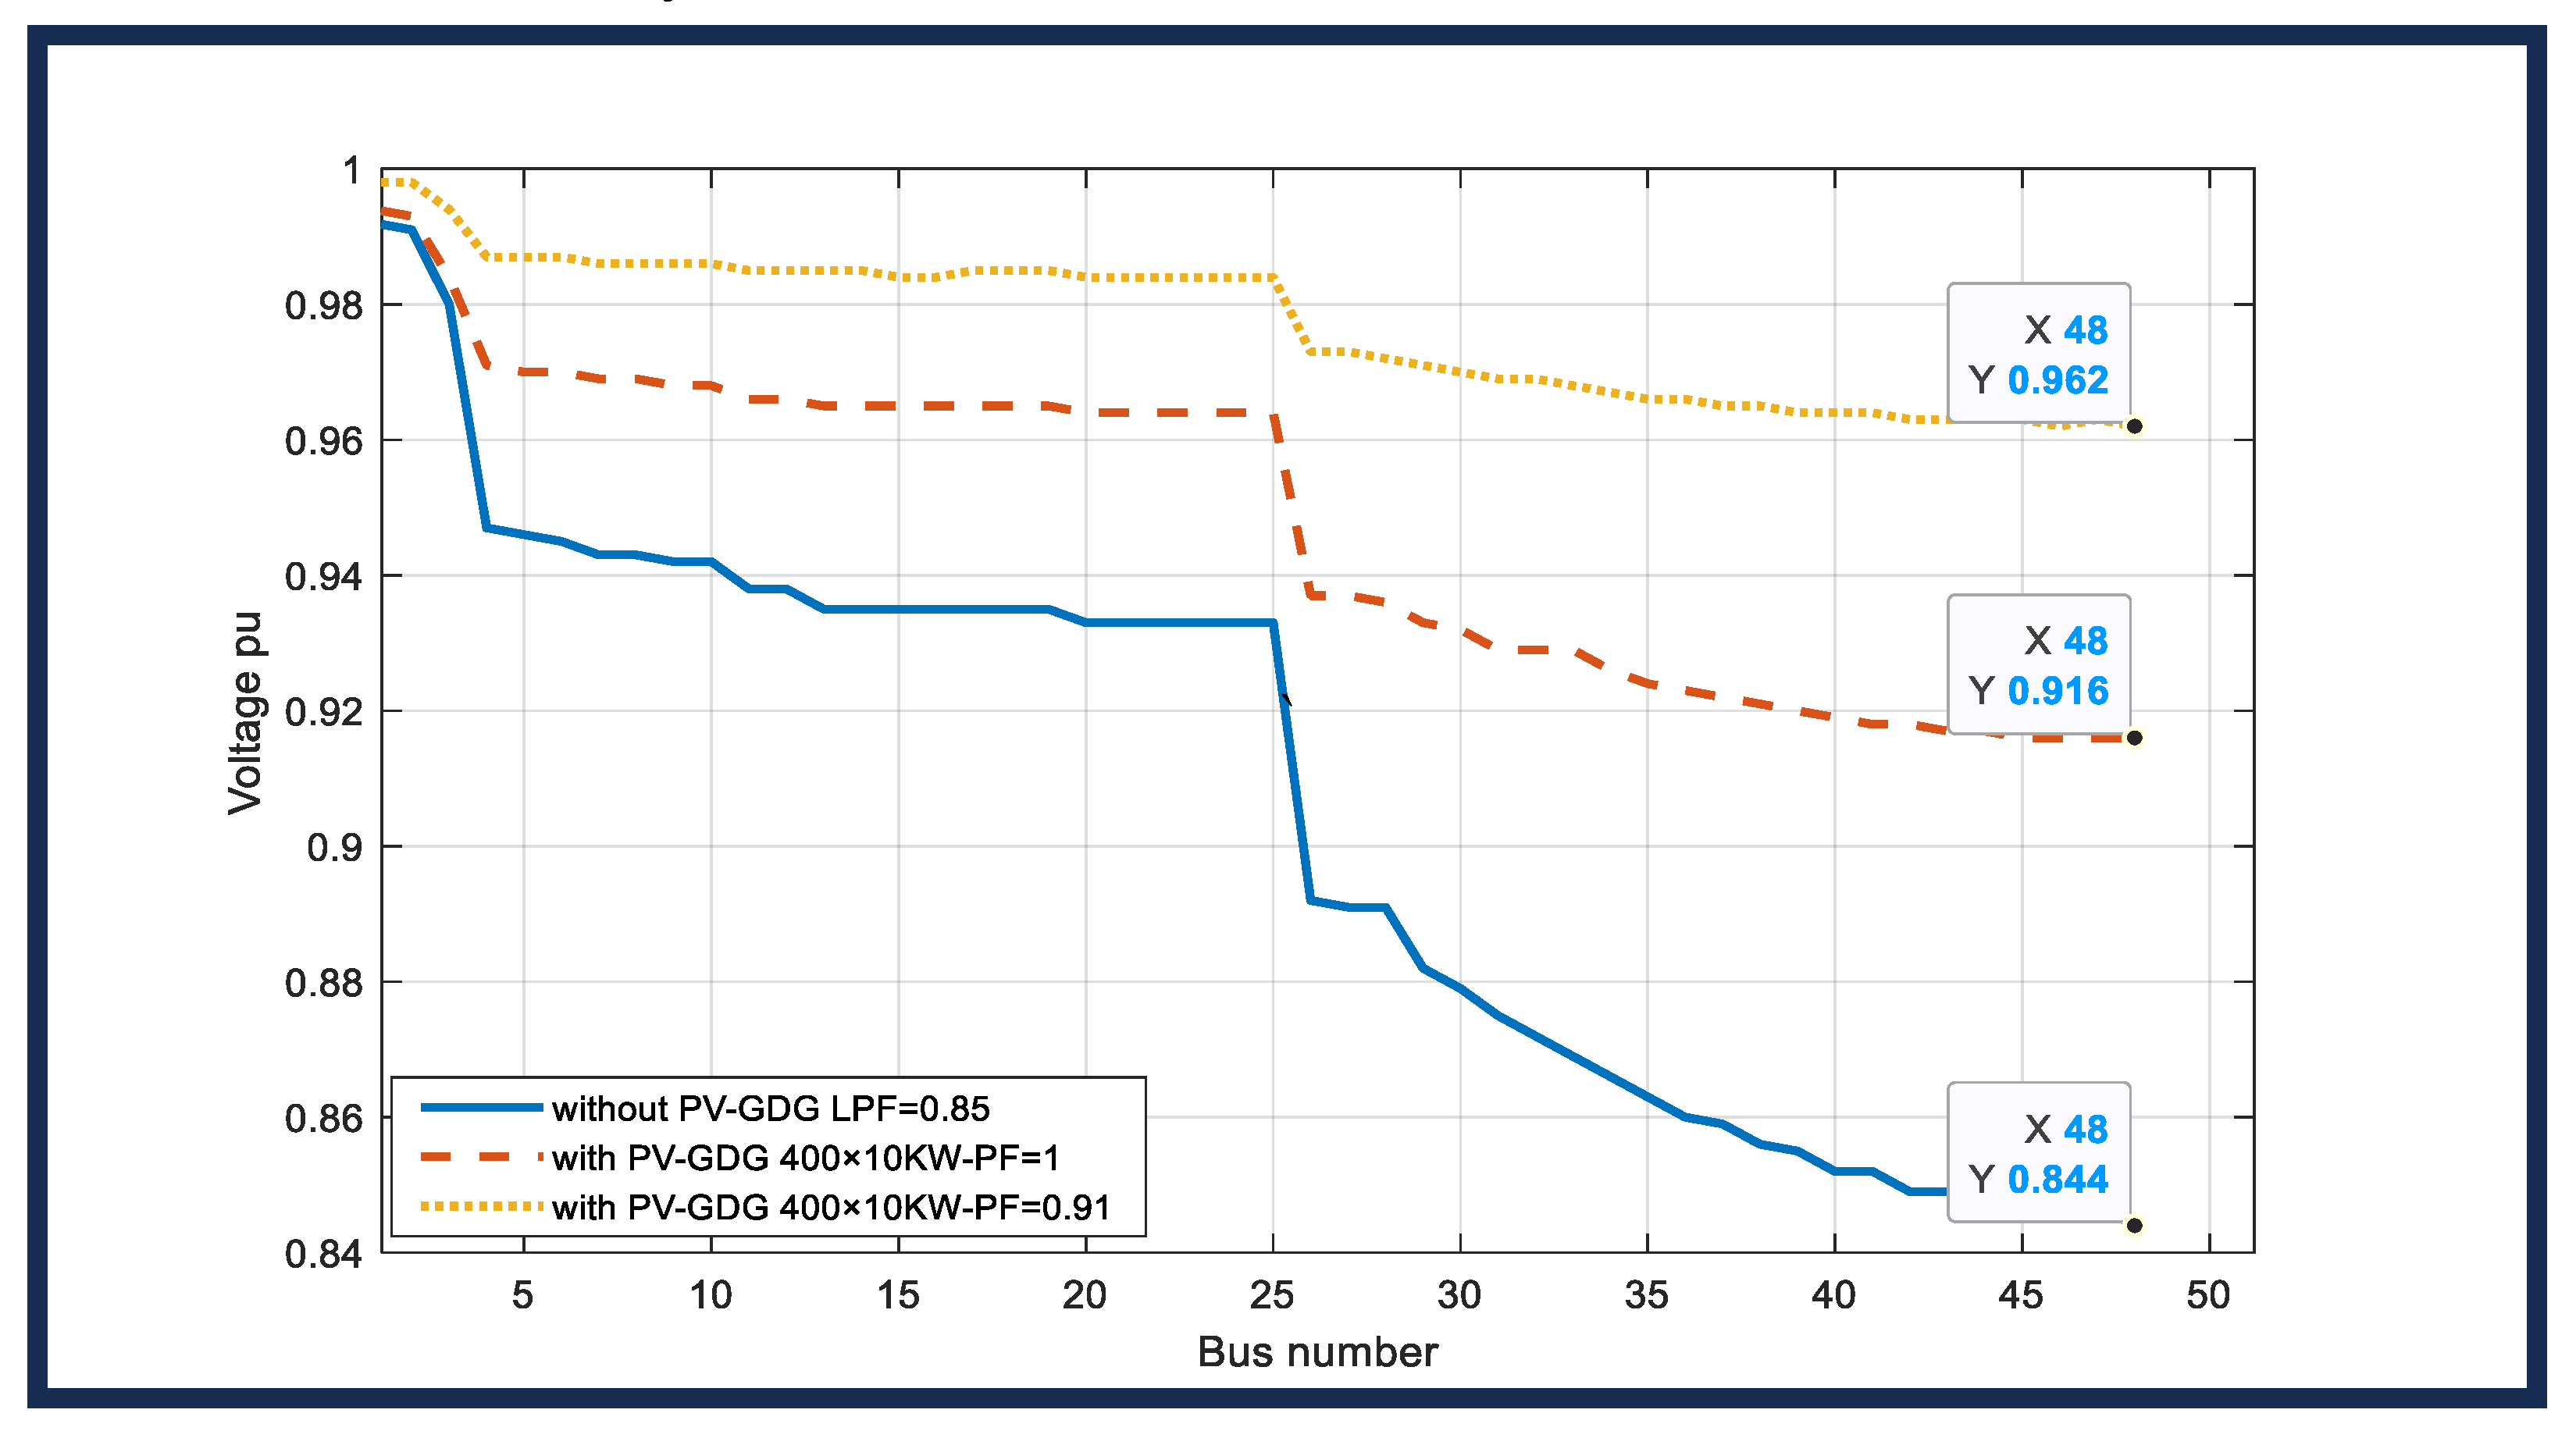
5.2.4. Consideration of LF and PSO Results and Discussion
- (1)
- Concentrated PV station at the 11 kV level feeder
- (2)
- Dispersed residential PV panels.
6. Conclusions
Author Contributions
Funding
Data Availability Statement
Conflicts of Interest
Appendix A
- Voltage drops (requires CYMDist);
- Gauss–Seidel (requires CYMFLOW).
- Newton–Raphson (requires CYMFLOW).
- Fast decoupled (requires CYMFLOW).
Appendix B

| Origin Bus | Receiving Bus | R p.u. | X p.u. | PL kW | QL kVAR | Origin Bus | Receiving Bus | R p.u. | X p.u. | PL kW | QL kVAR |
|---|---|---|---|---|---|---|---|---|---|---|---|
| 1 | 2 | 0.0575 | 0.029 | 100 | 60 | 14 | 15 | 0.37 | 0.329 | 60 | 10 |
| 2 | 3 | 0.3076 | 0.157 | 90 | 40 | 15 | 16 | 0.466 | 0.341 | 60 | 20 |
| 2 | 19 | 0.1023 | 0.098 | 90 | 40 | 16 | 17 | 0.806 | 1.076 | 60 | 20 |
| 3 | 4 | 0.228 | 0.116 | 120 | 80 | 17 | 18 | 0.456 | 0.359 | 90 | 40 |
| 3 | 23 | 0.116 | 0.192 | 90 | 50 | 19 | 20 | 0.94 | 0.847 | 90 | 40 |
| 4 | 5 | 0.238 | 0.121 | 60 | 30 | 20 | 21 | 0.256 | 0.299 | 90 | 40 |
| 5 | 6 | 0.511 | 0.441 | 60 | 20 | 21 | 22 | 0.443 | 0.586 | 90 | 40 |
| 6 | 7 | 0.117 | 0.386 | 200 | 100 | 23 | 24 | 0.561 | 0.443 | 420 | 200 |
| 6 | 26 | 0.127 | 0.065 | 60 | 25 | 24 | 25 | 0.56 | 0.438 | 420 | 200 |
| 7 | 8 | 1.068 | 0.771 | 200 | 100 | 26 | 27 | 0.178 | 0.09 | 60 | 25 |
| 8 | 9 | 0.642 | 0.462 | 60 | 20 | 27 | 28 | 0.662 | 0.584 | 60 | 20 |
| 9 | 10 | 0.633 | 0.462 | 60 | 20 | 28 | 29 | 0.503 | 0.438 | 120 | 70 |
| 10 | 11 | 0.123 | 0.041 | 45 | 30 | 29 | 30 | 0.317 | 0.162 | 200 | 600 |
| 11 | 12 | 0.234 | 0.077 | 60 | 35 | 30 | 31 | 0.609 | 0.602 | 150 | 70 |
| 12 | 13 | 0.918 | 0.722 | 60 | 35 | 31 | 32 | 0.194 | 0.226 | 210 | 100 |
| 13 | 14 | 0.339 | 0.446 | 120 | 80 | 32 | 33 | 0.213 | 0.331 | 60 | 40 |
Appendix C
References
- Shawon, S.M.R.H.; Liang, X.; Janbakhsh, M. Optimal Placement of Distributed Generation Units for Microgrid Planning in Distribution Networks. IEEE Trans. Ind. Appl. 2023, 59, 2785–2795. [Google Scholar] [CrossRef]
- Kamel, S.; Khasanov, M.; Jurado, F.; Kurbanov, A.; Zawbaa, H.M.; Alathbah, M.A. Simultaneously Distributed Generation Allocation and Network Reconfiguration in Distribution Network Considering Different Loading Levels. IEEE Access 2023, 11, 105916–105934. [Google Scholar] [CrossRef]
- Palanisamy, R.; Muthusamy, S.K. Optimal Siting and Sizing of Multiple Distributed Generation Units in Radial Distribution System Using Ant Lion Optimization Algorithm. J. Electr. Eng. Technol. 2021, 16, 79–89. [Google Scholar] [CrossRef]
- Chang, G.W.; Chinh, N.C.; Sinatra, C. Equilibrium Optimizer-Based Approach of PV Generation Planning in a Distribution System for Maximizing Hosting Capacity. IEEE Access 2022, 10, 118108–118122. [Google Scholar] [CrossRef]
- Dai, H.; Huang, G.; Zeng, H. Multi-Objective Optimal Dispatch Strategy for Power Systems with Spatio-Temporal Distribution of Air Pollutants. Sustain. Cities Soc. 2023, 98, 104801. [Google Scholar] [CrossRef]
- Dai, H.; Huang, G.; Wang, J.; Zeng, H. VAR-Tree Model Based Spatio-Temporal Characterization and Prediction of O3 Concentration in China. Ecotoxicol. Environ. Saf. 2023, 257, 114960. [Google Scholar] [CrossRef]
- Samala, R.K.; Mercy Rosalina, K. Optimal Allocation of Multiple Photo-Voltaic and/or Wind-Turbine Based Distributed Generations in Radial Distribution System Using Hybrid Technique with Fuzzy Logic Controller. J. Electr. Eng. Technol. 2021, 16, 101–113. [Google Scholar] [CrossRef]
- Ali, E.S.; Abd Elazim, S.M.; Abdelaziz, A.Y. Optimal Allocation and Sizing of Renewable Distributed Generation Using Ant Lion Optimization Algorithm. Electr. Eng. 2018, 100, 99–109. [Google Scholar] [CrossRef]
- Bujal, N.R.; Sulaiman, M.; Abd Kadir, A.F.; Khatib, T.; Eltawil, N. A Comparison Between GSA and IGSA for Optimal Allocation and Sizing of DG and Impact to Voltage Stability Margin in Electrical Distribution System. J. Electr. Eng. Technol. 2021, 16, 2949–2966. [Google Scholar] [CrossRef]
- Pandey, A.K.; Kirmani, S.; Kumar, A.; Akhtar, I. Allocation of DG in Distribution Network Using Parameter Independent JAYA Algorithm. J. Electr. Eng. Technol. 2022, 18, 1675–1692. [Google Scholar] [CrossRef]
- Coelho, F.C.R.; da Silva Junior, I.C.; Dias, B.H.; Peres, W.; Ferreira, V.H.; Marcato, A.L.M. Optimal Distributed Generation Allocation in Unbalanced Radial Distribution Networks via Empirical Discrete Metaheuristic and Steepest Descent Method. Electr. Eng. 2021, 103, 633–646. [Google Scholar] [CrossRef]
- Khenissi, I.; Sellami, R.; Fakhfakh, M.A.; Neji, R. Power Loss Minimization Using Optimal Placement and Sizing of Photovoltaic Distributed Generation Under Daily Load Consumption Profile with PSO and GA Algorithms. J. Control Autom. Electr. Syst. 2021, 32, 1317–1331. [Google Scholar] [CrossRef]
- Biazzi, R.R.; Bernardon, D.P.; Becker, E.; de Chiara, L.M.; Silva, J.A. Technical and Nontechnical Energy Loss Estimation Including Volt/Var Control for Active Distribution Systems. J. Control Autom. Electr. Syst. 2022, 33, 255–267. [Google Scholar] [CrossRef]
- dos Santos, K.V.; Higino Silva Santos, L.; Bañol Arias, N.; López, J.C.; Rider, M.J.; da Silva, L.C.P. Optimal Sizing and Allocation of Distributed Energy Resources in Microgrids Considering Internal Network Reinforcements. J. Control Autom. Electr. Syst. 2023, 34, 106–119. [Google Scholar] [CrossRef]
- Glover, J.D.; Overbye, T.J.; Sarma, M.S. Power System Analysis & Design; Cengage Learning: Chicago, IL, USA, 2017; ISBN 9781305632134. [Google Scholar]
- Weedy, B.M.; Cory, B.J.; Jenkins, N.; Ekanayake, J.B.; Strbac, G. Electric Power Systems, 5th ed.; Wiley: Chichester, UK, 2012; ISBN 9780128044483. [Google Scholar]
- Bayat, M.; Koushki, M.M.; Ghadimi, A.A.; Tostado-Véliz, M.; Jurado, F. Comprehensive Enhanced Newton Raphson Approach for Power Flow Analysis in Droop-Controlled Islanded AC Microgrids. Int. J. Electr. Power Energy Syst. 2022, 143, 108493. [Google Scholar] [CrossRef]
- Al-Roomi, A.R. Optimal Coordination of Power Protective Devices with Illustrative Examples, 1st ed.; John Wiley & Sons, Inc.: Hoboken, NJ, USA, 2022; ISBN 9781119794905. [Google Scholar]
- Jang, J.; Kim, D.; Kim, I. Singularity Handling for Unbalanced Three-Phase Transformers in Newton-Raphson Power Flow Analyses Using Moore-Penrose Pseudo-Inverse. IEEE Access 2023, 11, 40657–40674. [Google Scholar] [CrossRef]
- Manditereza, P.T.; Bansal, R. Manditereza, Patrick Tendayi Bansal, Ramesh. Renew. Sustain. Energy Rev. 2016, 58, 1457–1465. [Google Scholar] [CrossRef]
- Fayazi, H.; Fani, B.; Moazzami, M.; Shahgholian, G. An Offline Three-Level Protection Coordination Scheme for Distribution Systems Considering Transient Stability of Synchronous Distributed Generation. Int. J. Electr. Power Energy Syst. 2021, 131, 107069. [Google Scholar] [CrossRef]
- Radzi, M.Z.B.M. Optimal Allocation and Sizing of Distributed Generation Using Particle Swarm Optimization in Distribution System. Ph.D. Thesis, Universiti Tun Hussein Malaysia, Parit Raja, Malaysia, 2013. [Google Scholar]
- Bouzguenda, M.; Samadi, A.; Rajamohamed, S. Optimal Placement of Distributed Generation in Electric Distribution Networks. In Proceedings of the 2017 IEEE International Conference on Intelligent Techniques in Control, Optimization and Signal Processing (INCOS), Srivilliputtur, India, 23–25 March 2017; pp. 1–5. [Google Scholar] [CrossRef]
- El Haj Assad, M.; Rosen, M.A. Design and Performance Optimization of Renewable Energy Systems; Academic Press: Cambridge, MA, USA, 2021; ISBN 9780128216026. [Google Scholar]
- Zain, Z.M.; Sulaiman, M.H.; Mohamed, A.I.; Bakar, M.S.; Ramli, M.S. Proceedings of the 6th International Conference on Software and Computer Applications; Association for Computing Machinery: New York, NY, USA, 2021; ISBN 9789811686894. [Google Scholar]
- Baniodeh, H.M.; Zeid, S.M.; Eajal, A. The Pest Location and Size of Distributed Generation (DG) in A Radial Distribution Systems. Int. J. Adv. Res. Electr. Electron. Instrum. Eng. 2013, 2, 5160–5172. [Google Scholar]
- Santoso, D.B.; Sarjiya, S.; Sakti, F.P. Optimal Sizing and Placement of Wind-Based Distributed Generation to Minimize Losses Using Flower Pollination Algorithm. JTERA J. Teknol. Rekayasa 2018, 3, 167. [Google Scholar] [CrossRef]
- Duong, M.Q.; Pham, T.D.; Nguyen, T.T.; Doan, A.T.; Van Tran, H. Determination of Optimal Location and Sizing of Solar Photovoltaic Distribution Generation Units in Radial Distribution Systems. Energies 2019, 12, 174. [Google Scholar] [CrossRef]
- Nallagownden, P.; Mahesh, K.; Elamvazuthi, I. A Combined-Model for Uncertain Load and Optimal Configuration of Distributed Generation in Power Distribution System. Int. J. Simul. Syst. Sci. Technol. 2017, 17, 11.1–11.7. [Google Scholar] [CrossRef]
- Karimyan, P.; Vahidi, B.; Abedi, M.; Ahadi, S.M. Optimal Dispatchable DG Allocation in a Distribution Network Considering Load Growth with a Mixed-PSO Algorithm. Turk. J. Electr. Eng. Comput. Sci. 2016, 24, 3049–3065. [Google Scholar] [CrossRef]
- Nallagownden, P.; Mahesh, K.; Elamvazuthi, I. Optimal Placement and Sizing of Distributed Generation in Distribution System Using Analytical Method. Int. J. Recent Technol. Eng. 2019, 8, 6357–6363. [Google Scholar] [CrossRef]
- Guven, A.F.; Yorukeren, N.; Tag-Eldin, E.; Samy, M.M. Multi-Objective Optimization of an Islanded Green Energy System Utilizing Sophisticated Hybrid Metaheuristic Approach. IEEE Access 2023, 11, 103044–103068. [Google Scholar] [CrossRef]
- Sami, S.M.; Mahmood, A.L. Design and Simulation of Stand-Alone Photovoltaic System Supplying Bts in Iraq. Int. J. Power Electron. Drive Syst. 2021, 12, 463–473. [Google Scholar] [CrossRef]
- Atwan, A.F.; Kasim, N.K.; Jasim, N.A.; Hameed, J.S. Improvement the PV Solar Module Cooling Systems by Using Shallow Geothermal. AIP Conf. Proc. 2020, 2290, 050028. [Google Scholar] [CrossRef]

| Number of PV-GDG | Locations (Bus No.) | Size (kW) | Loss (kW) MATLAB R2022b | Loss (kW) CYME 9.04 | Min. Voltage MATLAB R2022b at Bus 18 (p.u.) | Min. Voltage CYME 9.04 at Bus 18 (p.u.) |
|---|---|---|---|---|---|---|
| Without PV-GDG | -------- | ------ | 211 | 211 | 0.9037 | 0.904 |
| 1 | 6 | 2600 | 111.03 | 111 | 0.943 | 0.943 |
| 2590 | 111 | 111 | 0.942 | 0.942 | ||
| 2492 | 111.2 | 111.16 | 0.941 | 0.941 | ||
| 2 | 13 | 849 | 87.2 | 87.17 | 0.968 | 0.965 |
| 30 | 1152 | |||||
| 3 | 9 | 1062 | 75.8 | 75.87 | 0.960 | 0.959 |
| 24 | 1045 | |||||
| 30 | 952 |
| Origin Bus | Receiving Bus | R p.u. | X p.u. | PL kW | QL kVAR |
|---|---|---|---|---|---|
| 1 | 2 | 0.1 | 0.2 | 0 | 0 |
| 2 | 3 | 0.01 | 0.09 | 0 | 40 |
| 3 | 4 | 0.42 | 0.31 | 0 | 0 |
| 4 | 5 | 0.01 | 0.02 | 240 | 149 |
| 5 | 6 | 0.01 | 0.02 | 240 | 149 |
| 6 | 7 | 0.07 | 0.09 | 240 | 149 |
| 6 | 10 | 0.07 | 0.09 | 240 | 149 |
| 7 | 8 | 0.01 | 0.02 | 240 | 149 |
| 8 | 9 | 0.06 | 0.07 | 240 | 149 |
| 10 | 11 | 0.07 | 0.09 | 240 | 149 |
| 11 | 12 | 0.03 | 0.04 | 240 | 149 |
| 11 | 13 | 0.07 | 0.09 | 240 | 149 |
| 13 | 14 | 0.02 | 0.03 | 240 | 149 |
| 13 | 17 | 0.02 | 0.03 | 240 | 149 |
| 13 | 19 | 0.05 | 0.06 | 240 | 149 |
| 13 | 20 | 0.11 | 0.15 | 240 | 149 |
| 14 | 15 | 0.01 | 0.02 | 240 | 149 |
| 15 | 16 | 0.01 | 0.02 | 240 | 149 |
| 17 | 18 | 0.02 | 0.03 | 240 | 149 |
| 20 | 21 | 0.01 | 0.02 | 240 | 149 |
| 20 | 24 | 0.01 | 0.02 | 240 | 149 |
| 21 | 22 | 0.01 | 0.02 | 240 | 149 |
| 22 | 23 | 0.02 | 0.02 | 240 | 149 |
| PV-GDG Unit Capacity kW | No. Series Module | No. Parallel Strings | E Annual Energy Yield MWh/Year | PR % | Cinv. % | Capacity Factor % | Max. String Voltage @ 50 °C V | Isc max A |
|---|---|---|---|---|---|---|---|---|
| 800 | 19 | 69 | 1517 | 84.85 | 105 | 21.6 | 658 | 1221 |
| 1000 | 19 | 87 | 1941 | 86.08 | 101 | 22.1 | 658 | 1540 |
| 1300 | 19 | 112 | 2461 | 84.79 | 106 | 21.6 | 658 | 1983 |
| 1350 | 19 | 116 | 2547 | 84.74 | 109 | 21.5 | 658 | 2053 |
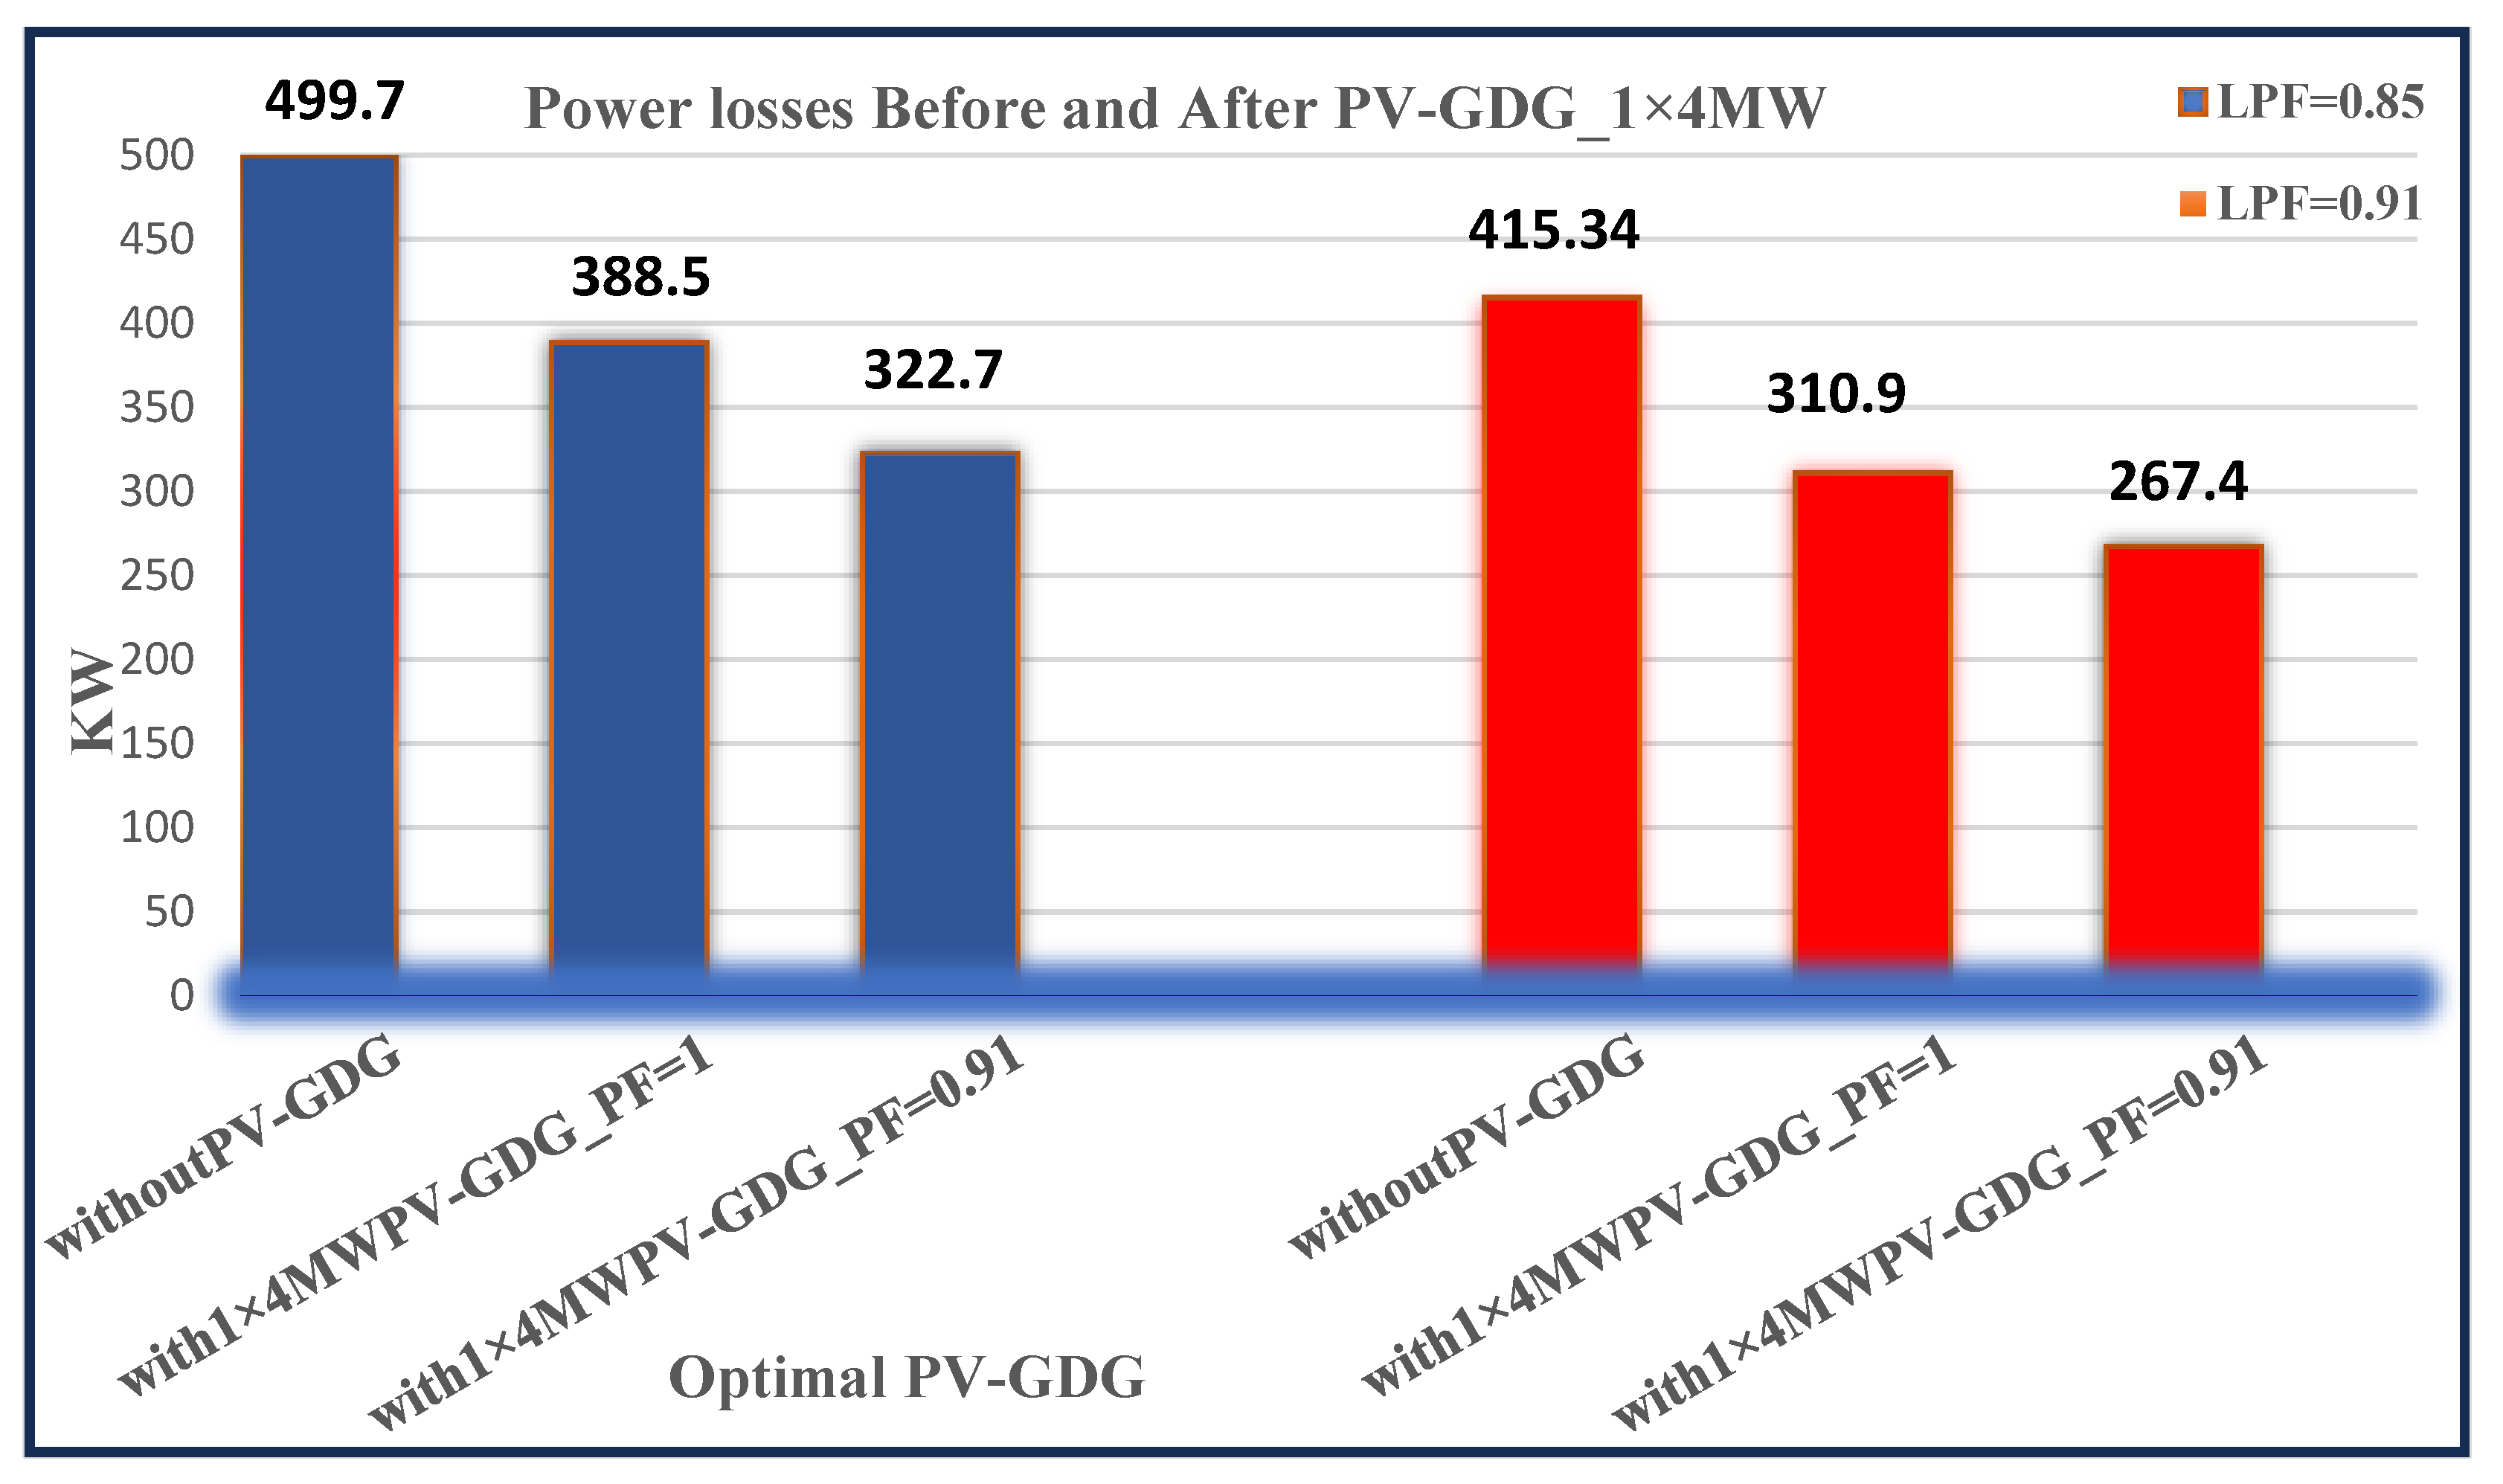
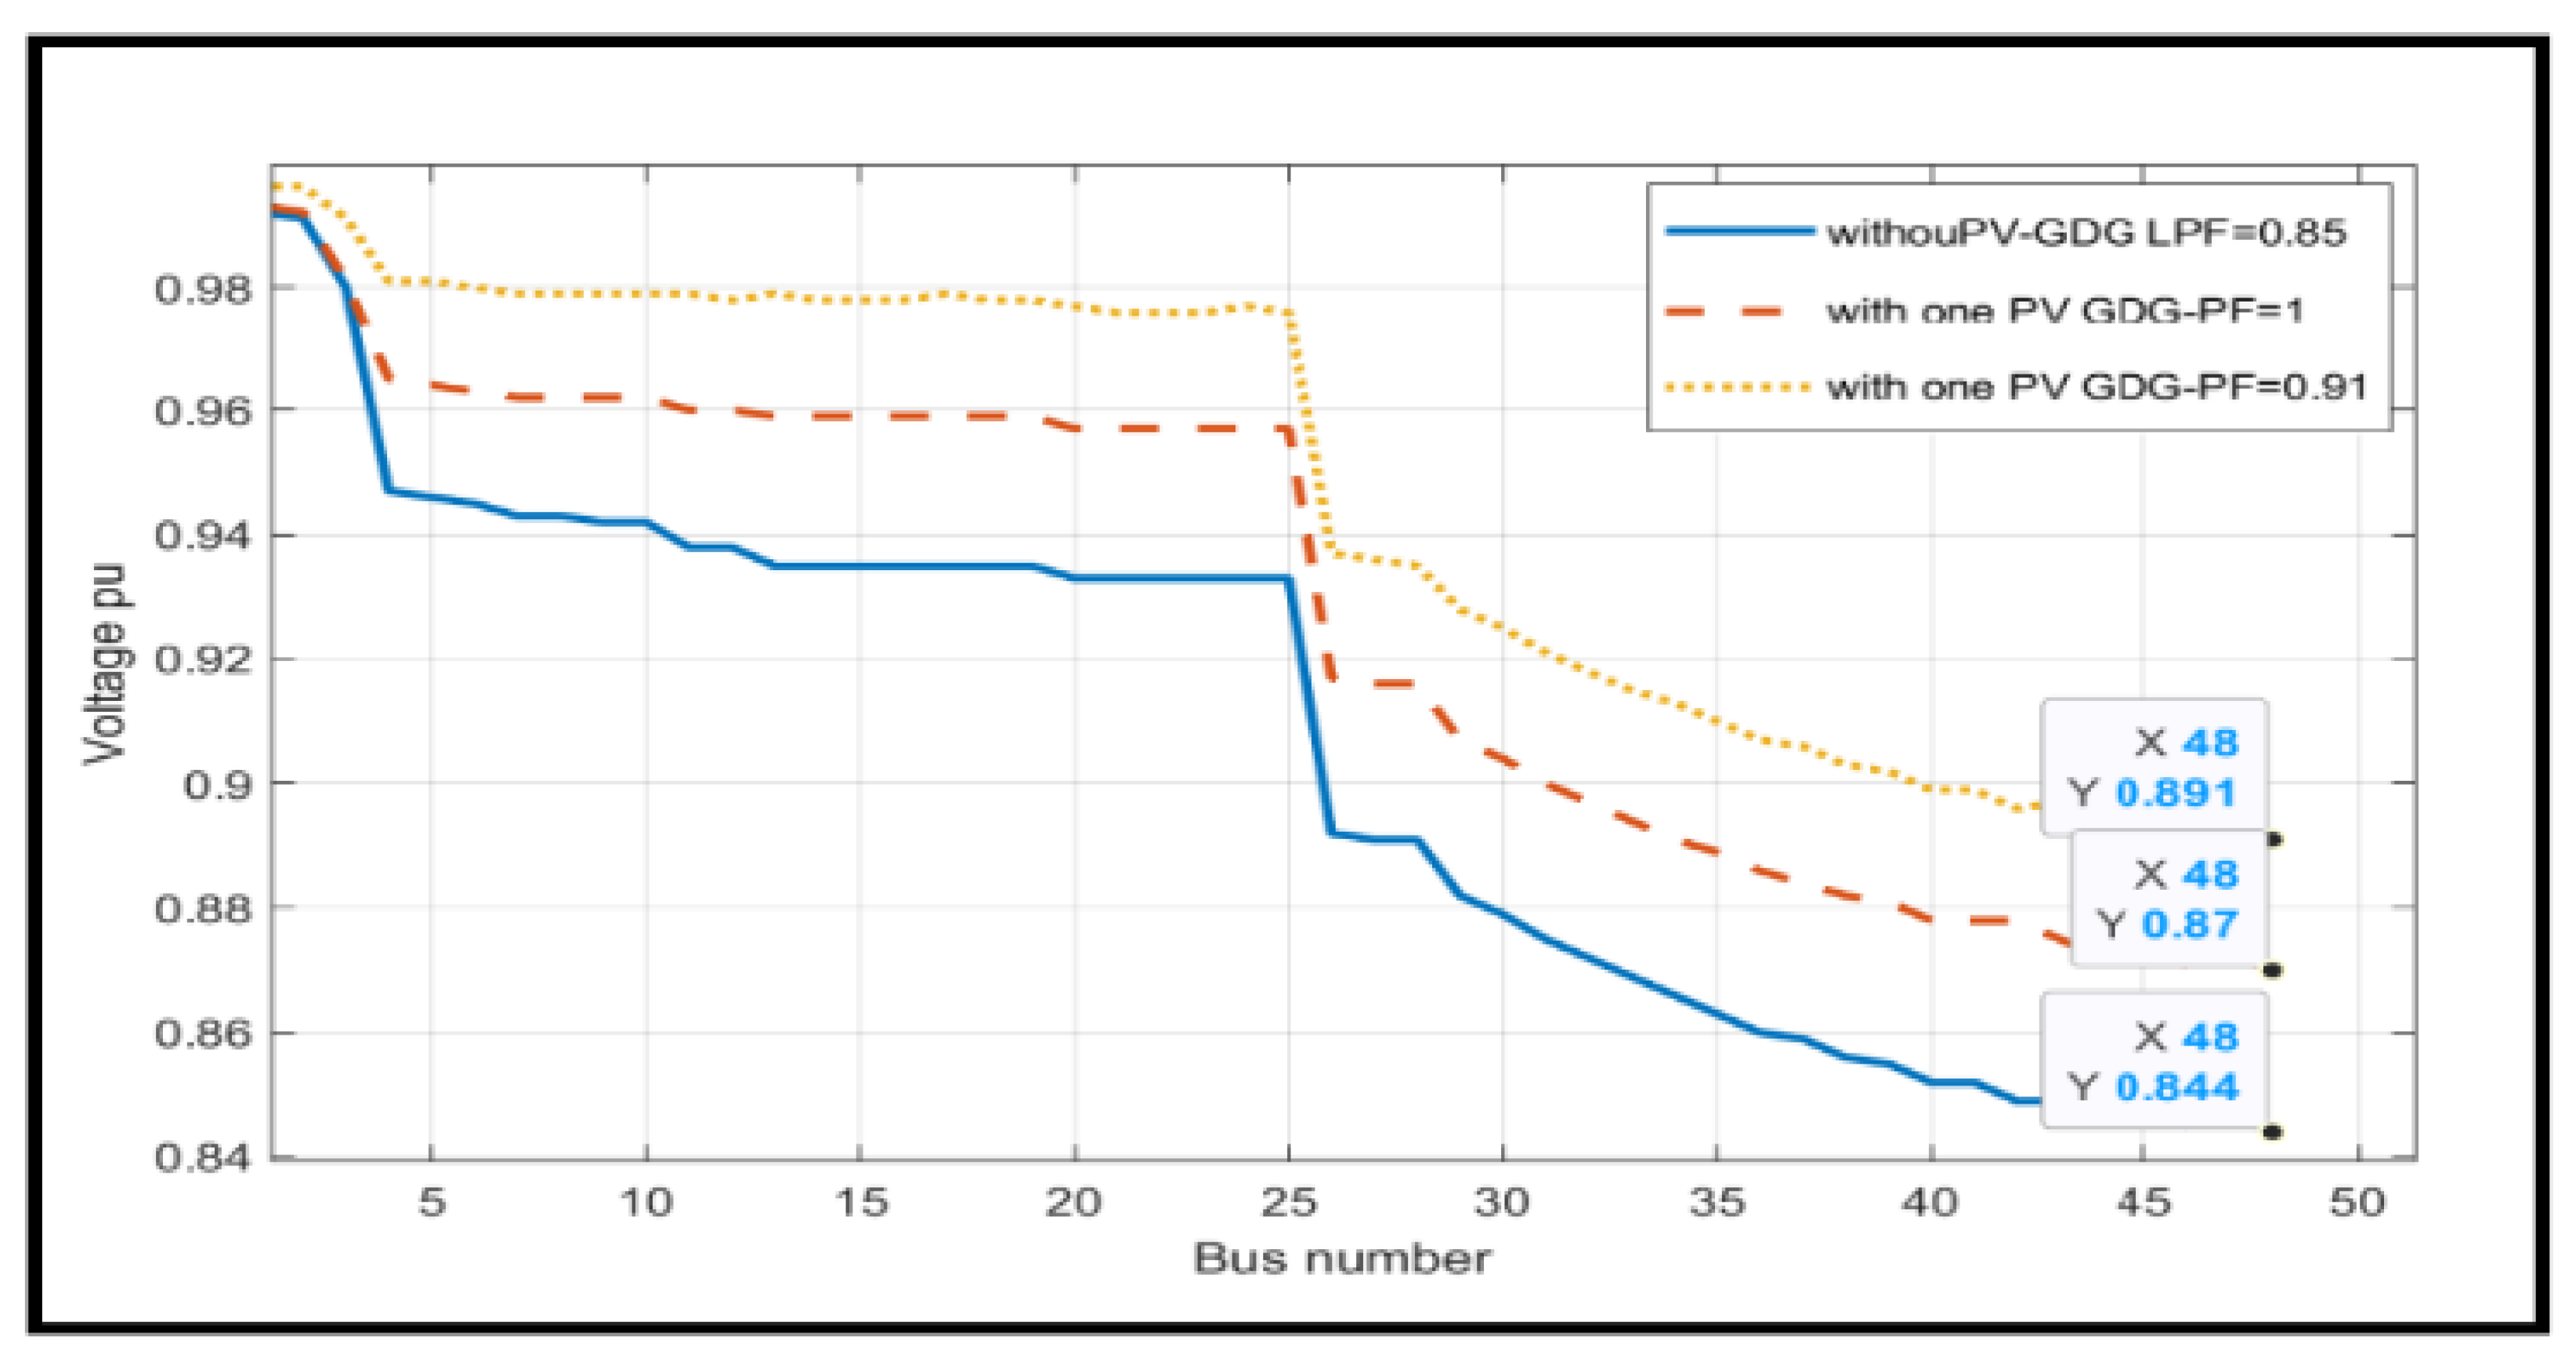
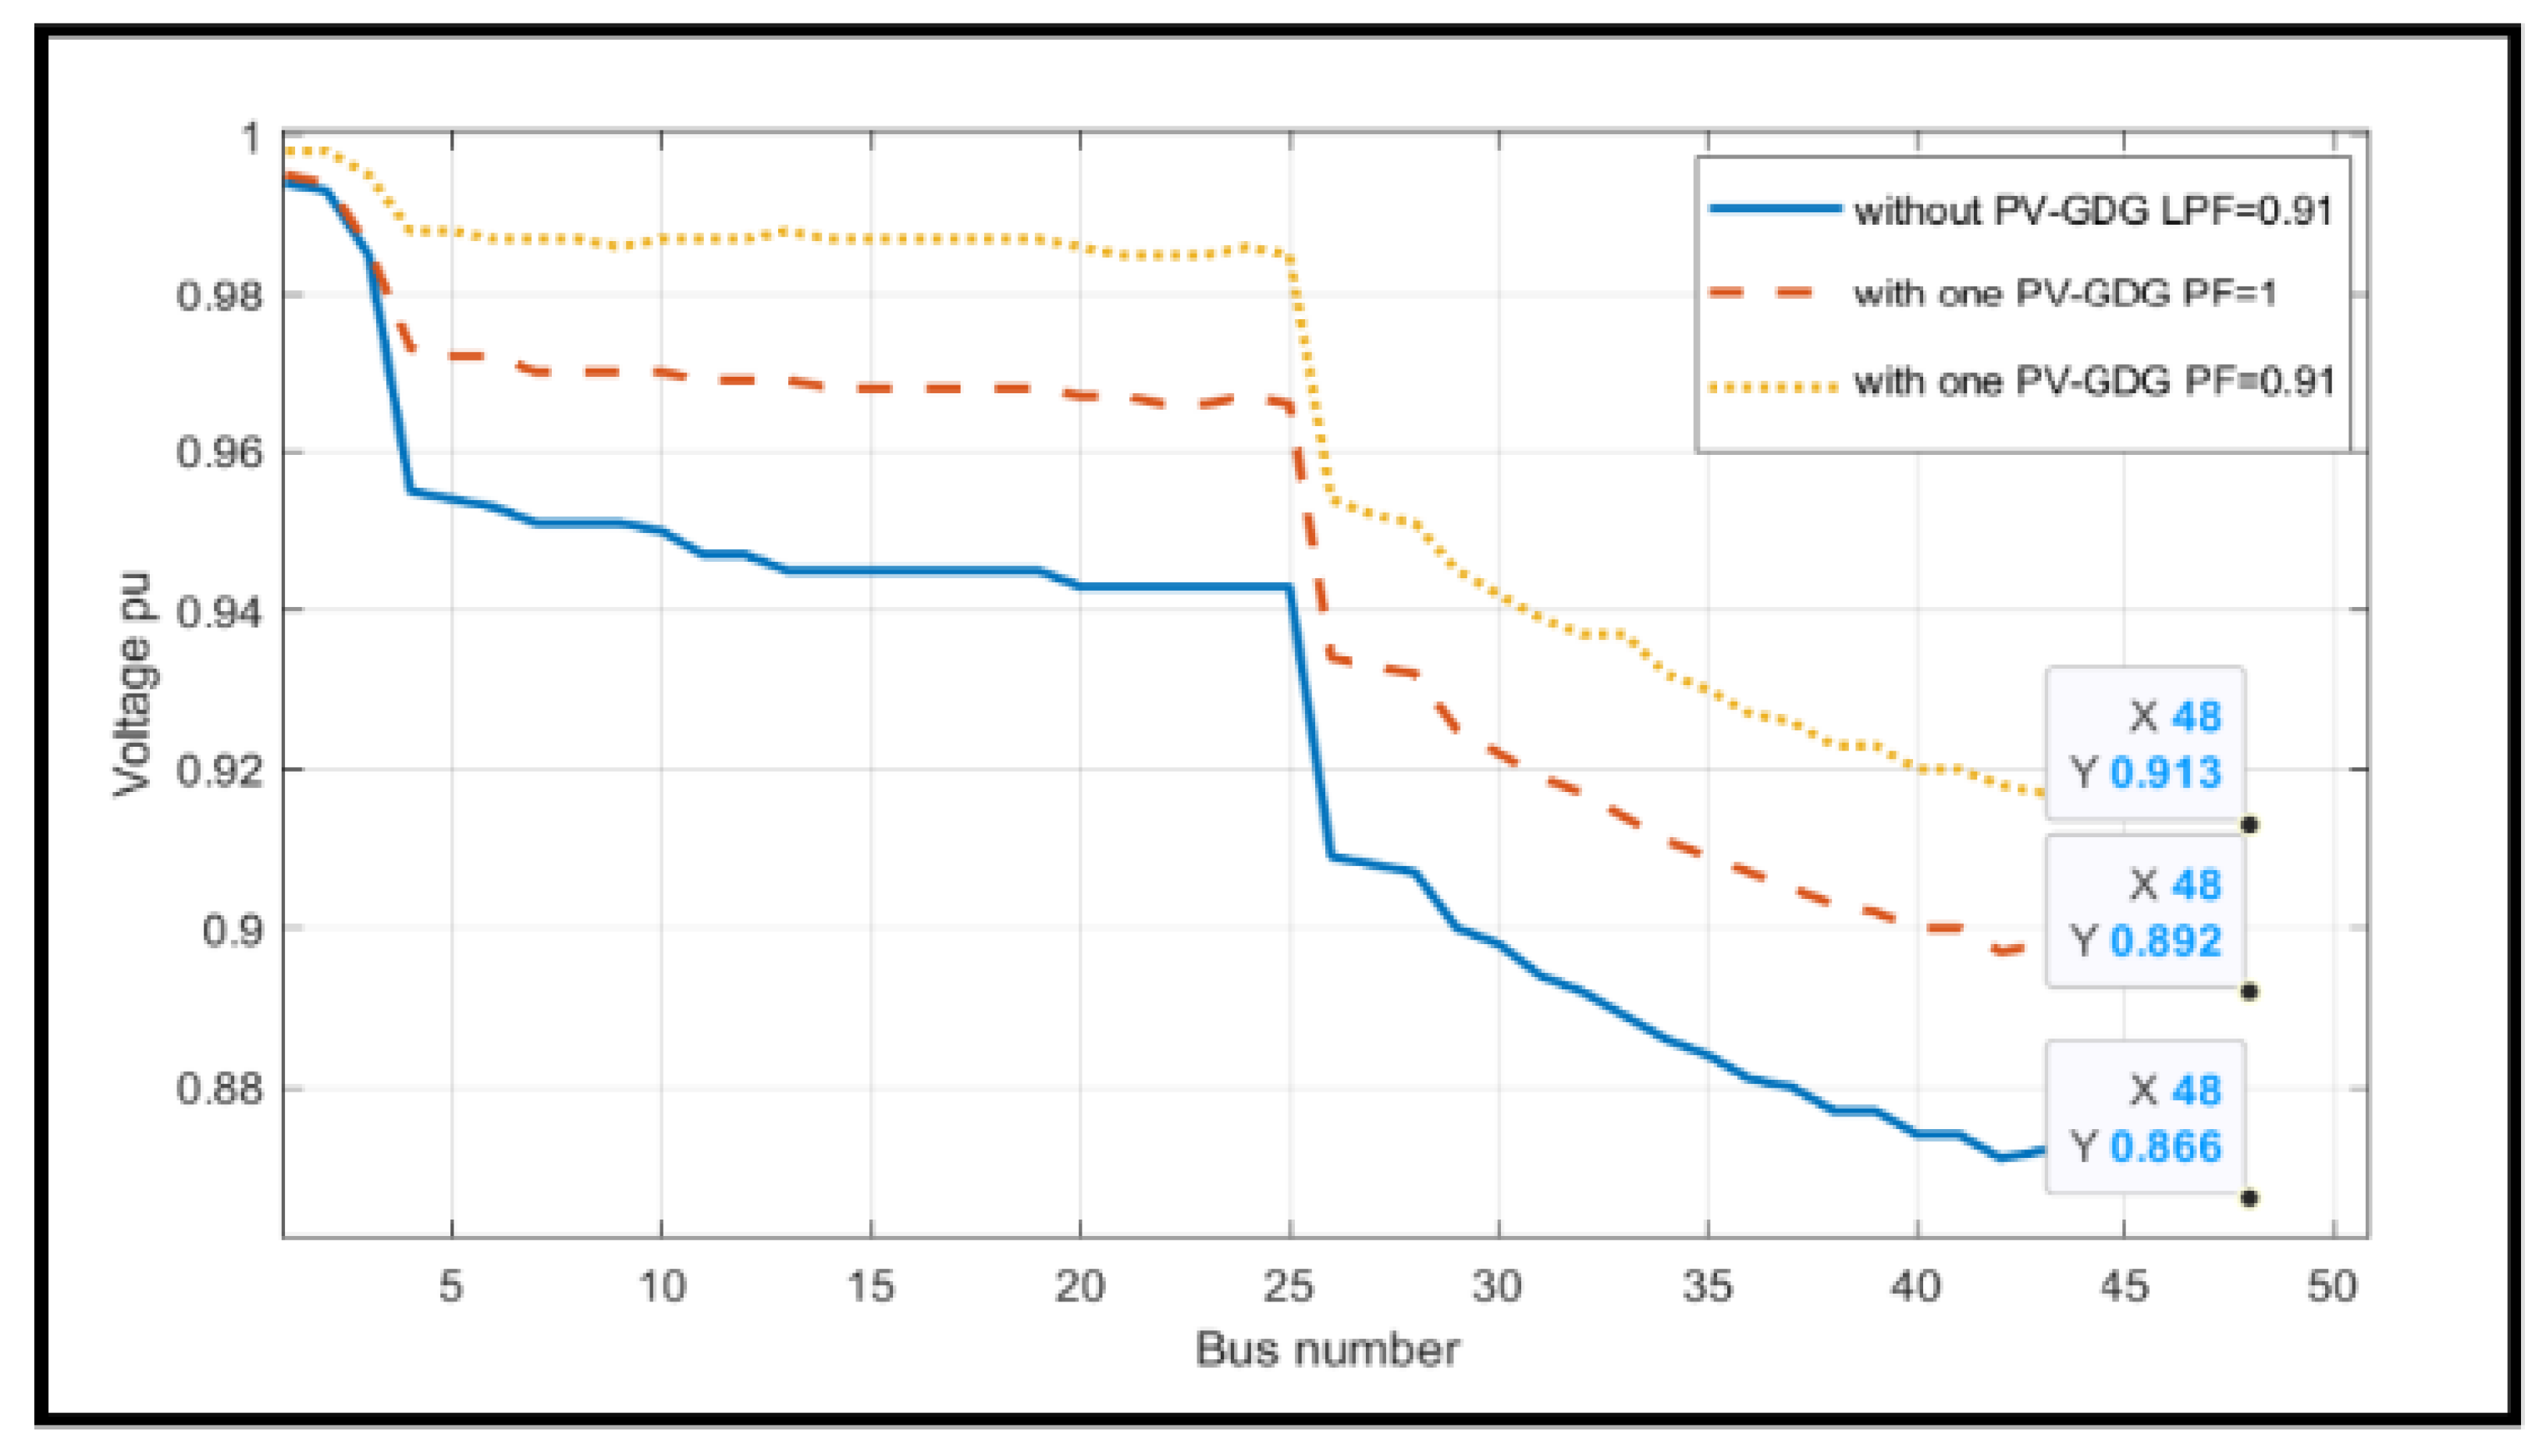
| PVGDG-Optimization | Load Power Factor (LPF = 0.85) | Load Power Factor (LPF = 0.91) | PVGDG Power Factor (PF) % | ||||||||
|---|---|---|---|---|---|---|---|---|---|---|---|
| Number | Location (Bus No.) | Capacity MW | Power Losses kW | Losses Reduction % | Voltage Profile p.u. | Voltage Drop Improvement % | Power Losses kW | Losses Reduction % | Voltage Profile p.u. | Voltage Drop Improvement % | |
| Without | ---- | ---- | 499.7 | ------ | 0.844 | ------ | 415.34 | ------ | 0.866 | ------- | ----- |
| 1 | 13 | 4 | 388.5 | 22.3 | 0.870 | 3.1 | 310.9 | 25.2 | 0.892 | 3 | 100 |
| 322.7 | 35.4 | 0.891 | 5.7 | 267.4 | 35.6 | 0.913 | 5.4 | 91 | |||
| 2 | 11 | 2 | 397 | 20.6 | 0.870 | 3.2 | 318.6 | 23.3 | 0.892 | 3 | 100 |
| 20 | 2 | 330.6 | 33.9 | 0.892 | 5.8 | 274.4 | 34 | 0.913 | 5.4 | 91 | |
| 3 | 11 | 1.35 | 400.4 333.4 | 19.9 33.3 | 0.869 0.891 | 3.1 5.7 | 321.7 277.1 | 22.5 33.3 | 0.892 0.913 | 3 5.4 | 100 91 |
| 15 | 1.35 | ||||||||||
| 24 | 1.3 | ||||||||||
| 4 | 11 | 1 | 396.3 329 | 20.7 34.2 | 0.869 0.891 | 3.1 5.7 | 317.8 272.7 | 23.5 34.3 | 0.892 0.913 | 3 5.4 | 100 91 |
| 13 | 1 | ||||||||||
| 15 | 1 | ||||||||||
| 22 | 1 | ||||||||||
| 5 | 7 | 0.8 | 399.1 334.5 | 20.1 33.1 | 0.870 0.892 | 3.2 5.8 | 321.2 278.9 | 22.7 32.9 | 0.893 0.914 | 3.1 5.5 | 100 91 |
| 16 | 0.8 | ||||||||||
| 17 | 0.8 | ||||||||||
| 21 | 0.8 | ||||||||||
| 22 | 0.8 | ||||||||||
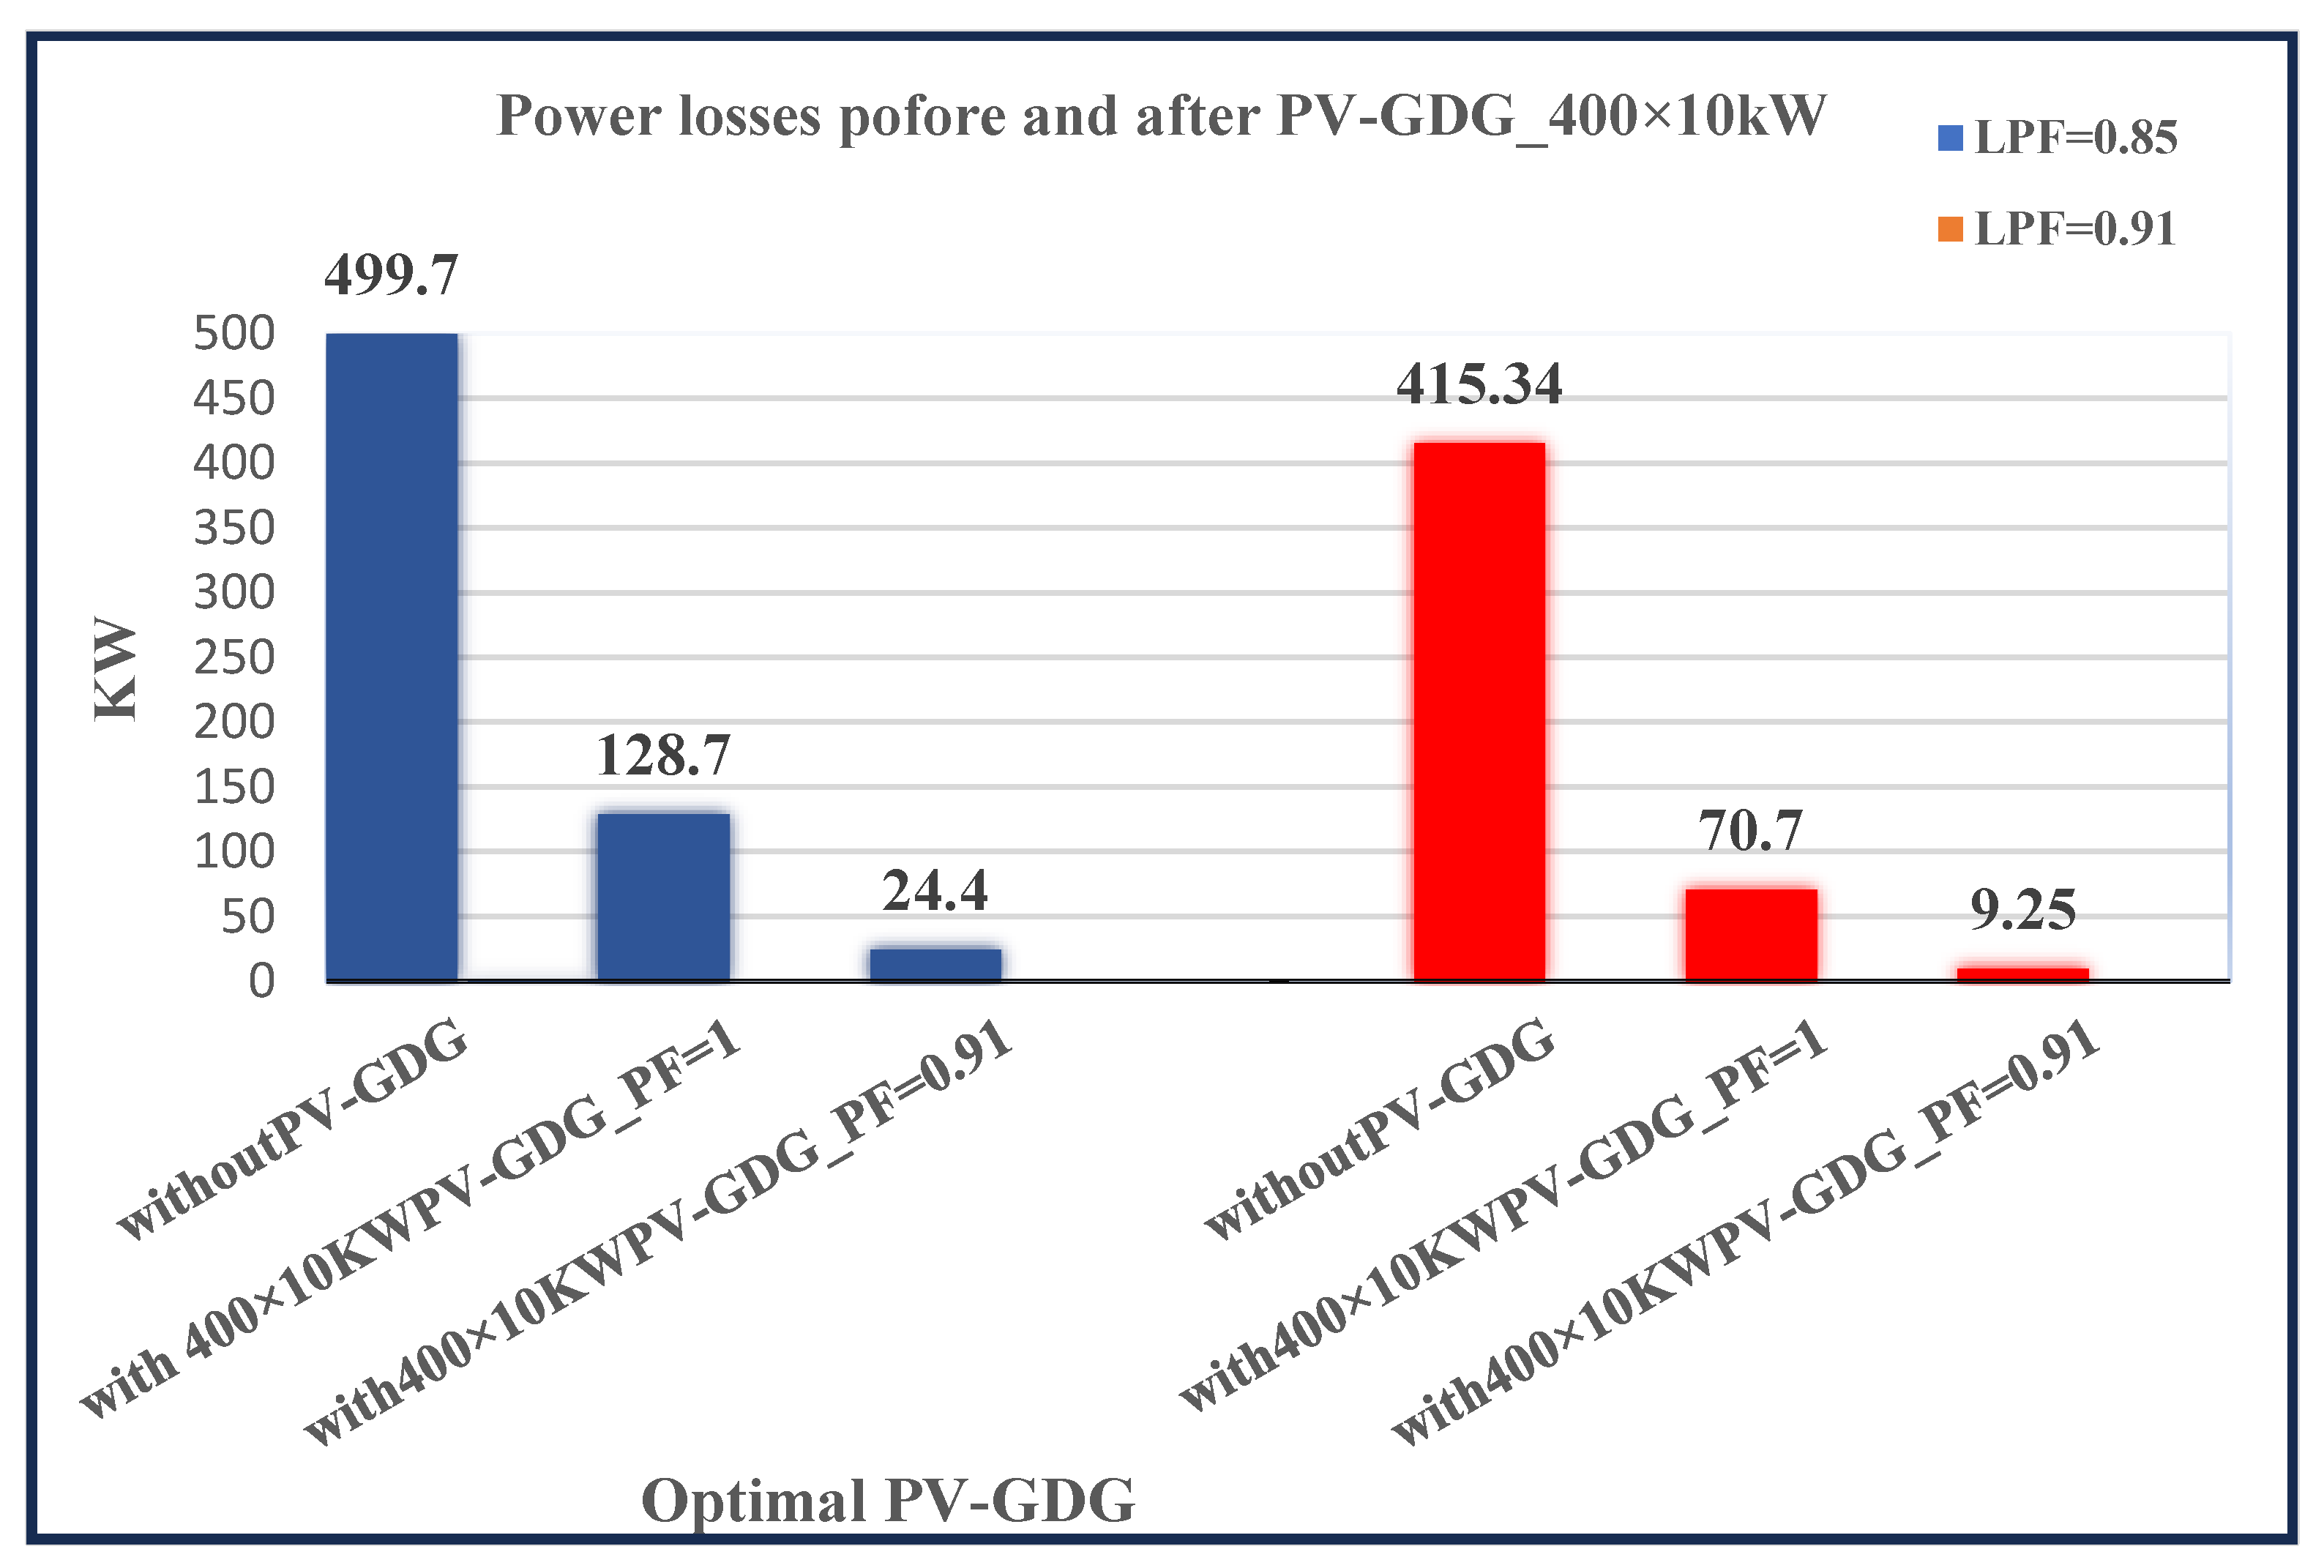
| PVGDG-Optimization | Load Power Factor (LPF = 0.85) | Load Power Factor (LPF = 0.91) | PVGDG (PF) % | ||||||||
|---|---|---|---|---|---|---|---|---|---|---|---|
| Number | Location (Bus No.) | Capacity MW | Power Losses kW | Losses Reduction % | Voltage Profile p.u. | Voltage Drop Improvement % | Power Losses kW | Losses Reduction % | Voltage Profile p.u. | Voltage Drop Improvement % | |
| Without | ---- | ---- | 499.7 | ------ | 0.844 | ------ | 415.34 | ------ | 0.866 | ------- | ----- |
| 400 | Consumers | 400 × 10 | 128.9 | 74.2 | 0.916 | 8.5 | 70.7 | 83 | 0.936 | 8 | 100 |
| 24.4 | 95.1 | 0.962 | 14.1 | 9.25 | 97.8 | 0.981 | 13.3 | 91 | |||
Disclaimer/Publisher’s Note: The statements, opinions and data contained in all publications are solely those of the individual author(s) and contributor(s) and not of MDPI and/or the editor(s). MDPI and/or the editor(s) disclaim responsibility for any injury to people or property resulting from any ideas, methods, instructions or products referred to in the content. |
© 2024 by the authors. Licensee MDPI, Basel, Switzerland. This article is an open access article distributed under the terms and conditions of the Creative Commons Attribution (CC BY) license (https://creativecommons.org/licenses/by/4.0/).
Share and Cite
Majeed, A.A.; Abderrahim, M.; Alkhazraji, A.A. Optimal Allocation of Photovoltaic-Green Distributed Generation for Maximizing the Performance of Electrical Distribution Networks. Energies 2024, 17, 1376. https://doi.org/10.3390/en17061376
Majeed AA, Abderrahim M, Alkhazraji AA. Optimal Allocation of Photovoltaic-Green Distributed Generation for Maximizing the Performance of Electrical Distribution Networks. Energies. 2024; 17(6):1376. https://doi.org/10.3390/en17061376
Chicago/Turabian StyleMajeed, Ammar Abbas, Mohamed Abderrahim, and Afaneen Anwer Alkhazraji. 2024. "Optimal Allocation of Photovoltaic-Green Distributed Generation for Maximizing the Performance of Electrical Distribution Networks" Energies 17, no. 6: 1376. https://doi.org/10.3390/en17061376
APA StyleMajeed, A. A., Abderrahim, M., & Alkhazraji, A. A. (2024). Optimal Allocation of Photovoltaic-Green Distributed Generation for Maximizing the Performance of Electrical Distribution Networks. Energies, 17(6), 1376. https://doi.org/10.3390/en17061376