Abstract
The electrification of transport is expected to progressively replace significant shares of light duty mobility, especially in large cities. The European Alternative Fuel Infrastructure Regulation (AFIR) aims to drive the adoption of electric mobility by establishing specific targets for charging point deployment. Innovative charging concepts may complement and accelerate the uptake of this fundamental part of the urban mobility transition. In this paper, one such innovative concept is described and its potential impact is assessed. The core idea involves integrating charging points into existing city tramway infrastructures. Turin’s tramway network is taken as a representative case study. The proposed technical solution encompasses a charging hub powered by four isolated DC/DC converters of 50 kW, directly connected to the DC tramway distribution line. Three of these constitute the heart of a 150 kW charger, while the fourth acts as voltage regulator. This native DC installation greatly simplifies the architecture of the DC chargers. Using a conservative approach, it was estimated that a single recharging station could charge more than 60 vehicles daily. This highly scalable and replicable solution, with the potential for over 100 conversion substations across Italy, would enable the installation of numerous high-power chargers in urban settings. Furthermore, additional benefits could be realized through enhanced recovery of kinetic energy from trams, which is currently dissipated on-board.
1. Introduction
Electrical mobility, or e-mobility, is a transformative solution that holds a great deal of promise for urban areas. With the pressing need to address issues related to air pollution, traffic congestion, and greenhouse gas emissions, electric vehicles (EVs) have emerged as a game-changing technology. The benefits of e-mobility in urban settings are numerous: firstly, EVs have zero tailpipe emissions [1], which significantly improves air quality at the urban level. Additionally, electric mobility helps ease the strain of overcrowded streets, as EVs are typically quieter, while innovations in autonomous driving and shared mobility models further promise to optimize urban transportation systems.
In Europe, the expectations for electrical mobility are exceptionally high, as the region committed to be carbon neutral in 2050 [2]. Over recent years, the number of EVs sold in the EU has been constantly and rapidly increasing, accompanied by a similar, although slower, growth in the number of recharging points [3]. Complementing this push for EVs, Europe is proposing a ban on the sale of new petrol and diesel cars from 2035 onward [4].
In this context, European countries have set ambitious targets to transition their transportation sectors towards electrification as part of a broader strategy to combat climate change and reduce their carbon footprint [5,6]. Italy translated the EU approach into its national energy and climate plan (NECP) and set a specific National Infrastructure Plan for Electric Vehicle Charging (the PNIRE [7]), aiming at establishing infrastructure networks for charging electric-powered vehicles. The plan includes initiatives for the restoration of building assets with the goal of advancing these networks.
As part of the Fit-for-55 package, the European Commission proposed a revision for the Alternative Fuel Infrastructure Regulation (AFIR). This Regulation envisages a plan for the deployment of fast recharging stations (>150 kW) from 2025 onwards. For cars and vans, a target was set to one recharging point every 60 km along the EU’s main transport corridors (the trans-European transport network, or TEN-T). Moreover, recharging stations for heavy-duty vehicles (>350 kW) need to be deployed every 60 km along the TEN-T core network, and every 100 km on the larger TEN-T comprehensive network from 2025 onwards, with complete network coverage by 2030.
The overarching goal of the AFIR is to invigorate the integration of electric mobility by fostering the growth of charging infrastructure. In fact, the adoption of low and zero emission local public transport vehicles, namely urban buses, has played a key role in the electric vehicle transition [8], progressively eliminating from city streets often old and polluting vehicles with an intensive rate of usage. At the same time, new registrations of electric passenger cars have sped up in recent years [9]. However, supporting the further growth of electric mobility will require commensurate investments in charging infrastructure in urban settings [10].
The development of an adequate charging infrastructure will face several technical and logistical challenges. The ramp-up of electric vehicle charging events is poised to affect the stability of the urban electricity grid, due to increased spike demands [11,12]. Moreover, slow-charging points can significantly impact consumers’ willingness to adopt electric vehicles, as prolonged queuing times can be inconvenient to users’ daily routines [13].
In this context, emerging recharging station concepts offer a promising avenue to fortify AFIR’s realization. Among these innovative ideas, the DC-based recharging concept emerges as particularly noteworthy [14,15], opening to the possibility of fast and ultrafast recharging [16,17]. However, the additional electrical loads required by such power-intensive technologies could have a severe impact on the operation of the distribution grid [18,19,20,21], posing a serious hindrance to their integration into the existing electric system of cities.
This paper originated from the rethinking of the already greener electric public transport network that provides passenger transport service in more than 400 cities worldwide, the tramway. In fact, urban public transport electric grids, like those which power tramways and trolleybuses, are oversized and underutilized [22], making them a great opportunity for the integration of high-power charging points, which has been investigated in several research studies [23,24,25,26,27,28,29].
In line with this innovative concept, the idea behind the Turin Use Case (UC4), inside the EU project INCIT-EV, is to exploit the existing tramway DC grid, in order to power charging hubs. This solution also allows the exploration of intramodal commuting options while coming into the city from other municipalities of the Turin Metropolitan Area. UC4 activities will take place in the Mirafiori quarter, located in the southern outskirts of Turin, whose name is deeply tied with the history of the Italian automotive industry. More specifically, the Caio Mario Park will host the experimental charging hub and all the testing operations. The outcome of the project will include the installation of 10 CCS2 low-power DC charging points (3.6 kW), and one CCS2 Ultrafast Charging point (150 kW) together with the simulation of an energy storage system.
This visionary approach capitalizes on existing urban tram infrastructure to efficiently accommodate electric vehicle charging. By tapping into the power distribution systems of tram networks, this concept holds the potential to revolutionize the charging landscape.
This paper introduces and elaborates upon this innovative DC-based recharging concept, seeking for application the city of Turin as a compelling case study. Through this application, a comprehensive assessment of the potential benefits of this solution is presented, potentially paving the way for more sustainable and convenient electric mobility in urban environments.
2. Materials and Methods
2.1. The Recharging DC-Based Concept
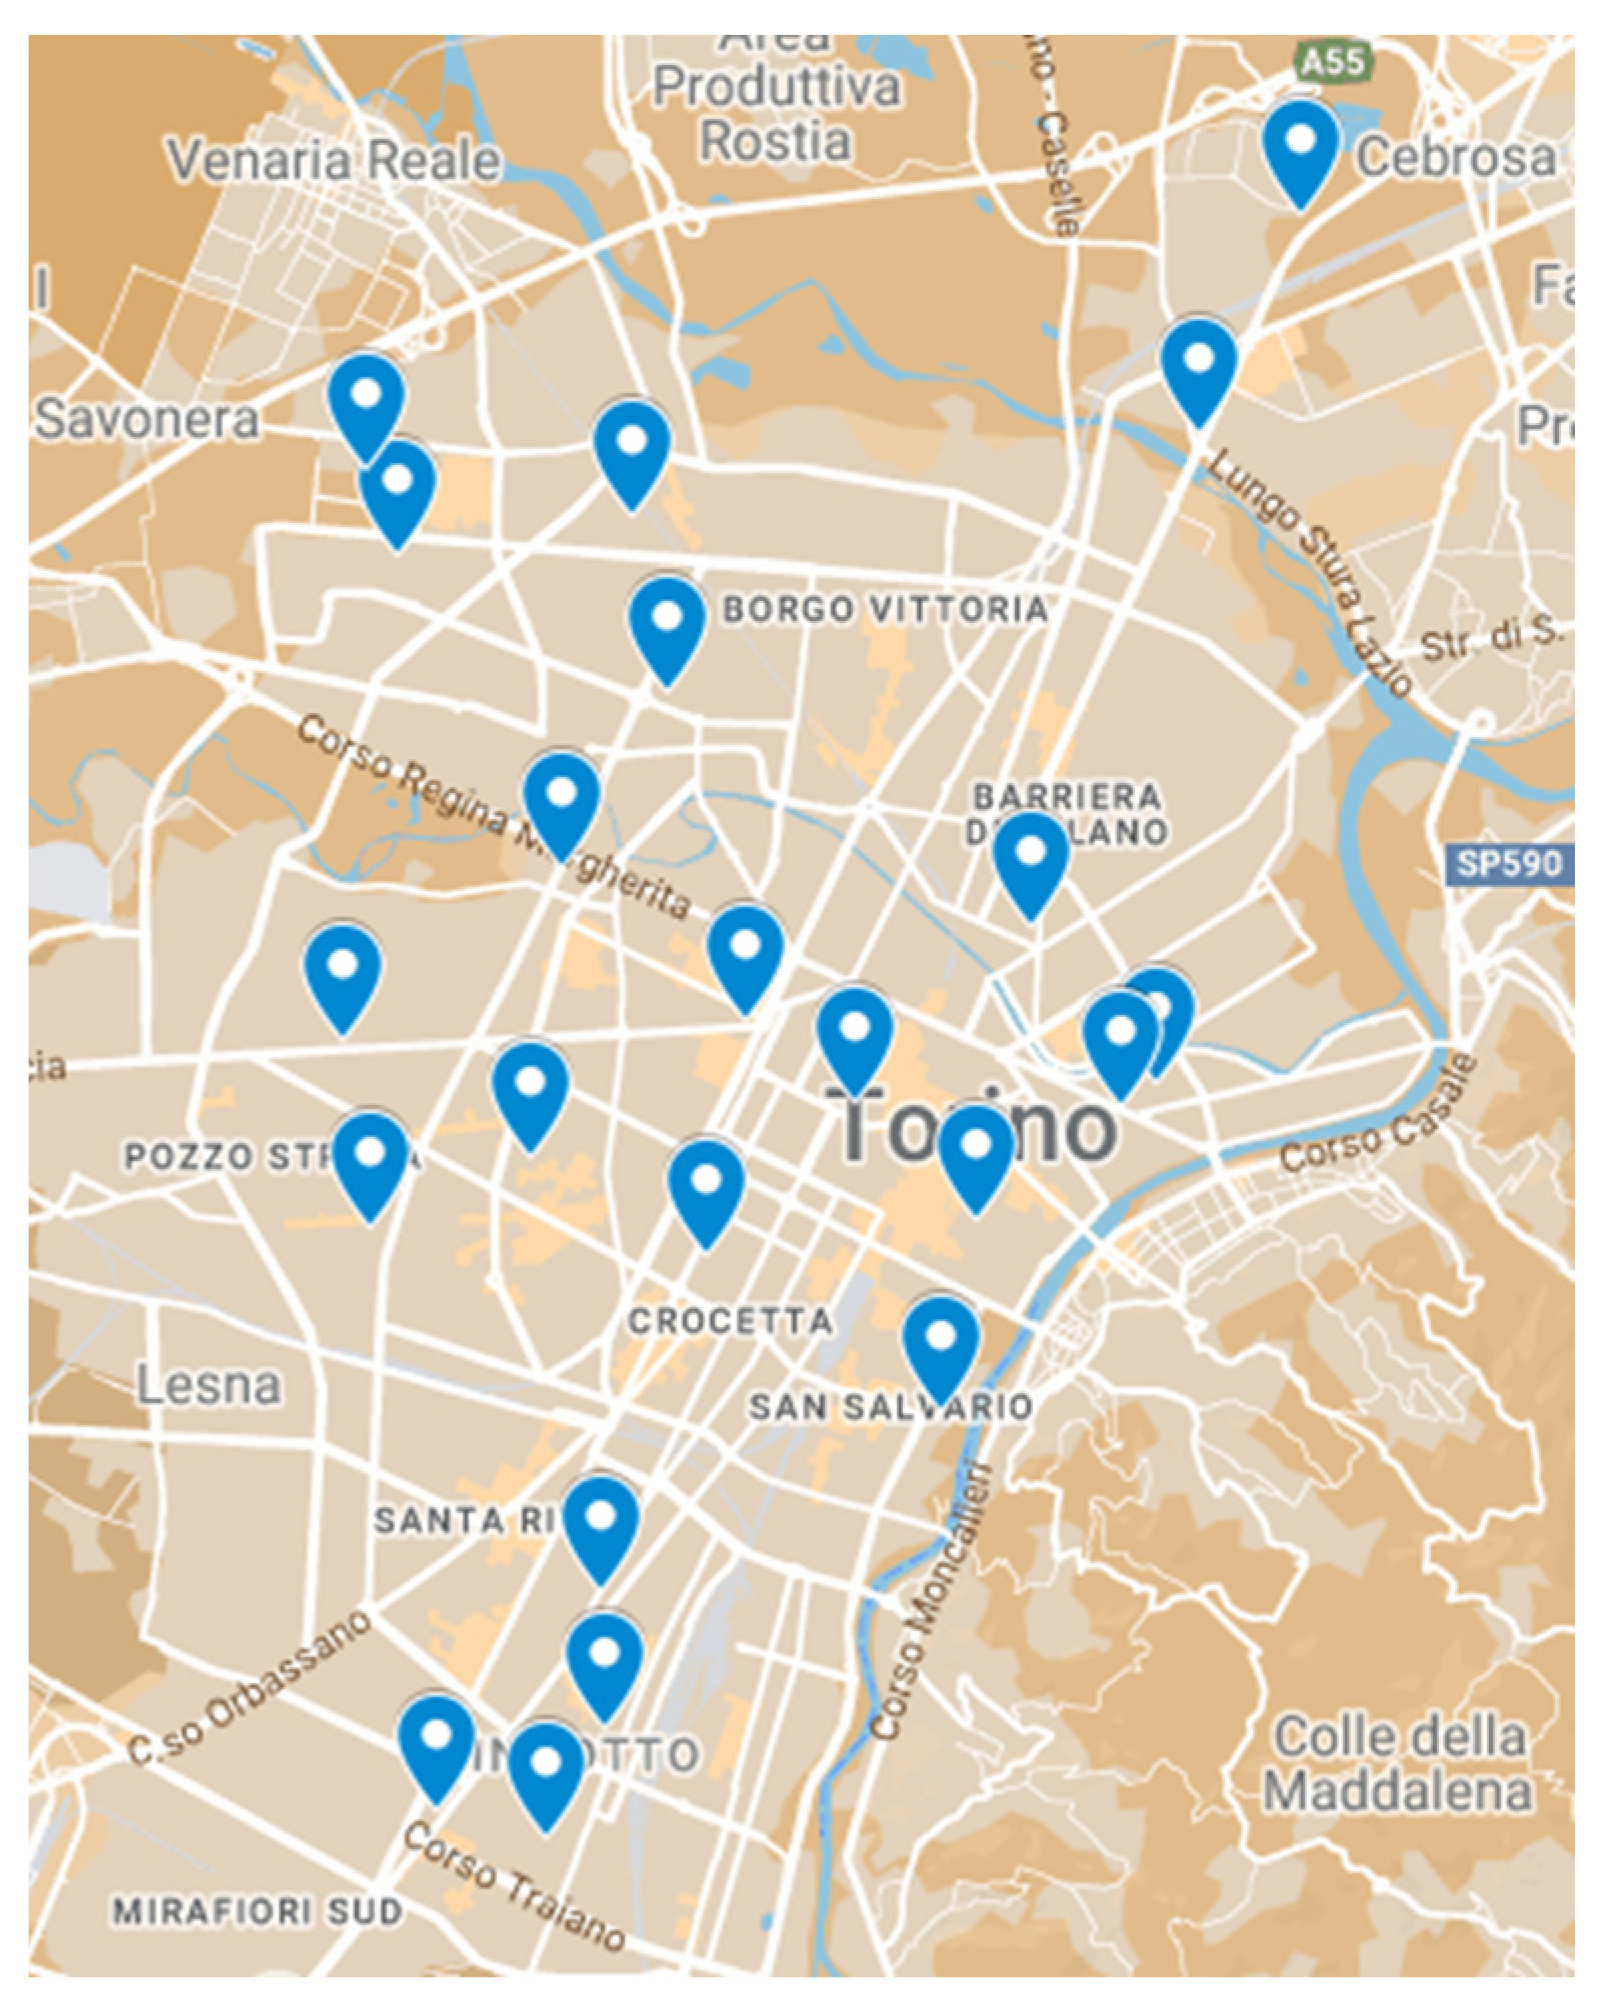
In order to properly present the structure of the innovative concept, it is necessary to briefly give an overview of a state-of-the-art of tramway networks, and in particular of Turin’s one, which is the foundation of the application. Turin’s tramway network, operated by GTT, works at a nominal voltage level of 600 V and is powered by 22 DC conversion substations spread quite evenly along the city boundaries (Figure 1).

Figure 1.
Map of the conversion substations’ locations in the metropolitan area of the city of Turin.
The substations vary in terms of power output capacity and number of lines served, but generally speaking have an MV incoming distribution rated between 22 kV and 27 kV, with rated power of the substations varying between 1 × 2.2 MVA and 2 × 3.15 MVA. The circuit breakers operate when the current values are higher than 5000 A and the substations can expand for short periods of time their load capacity by up to 200%.
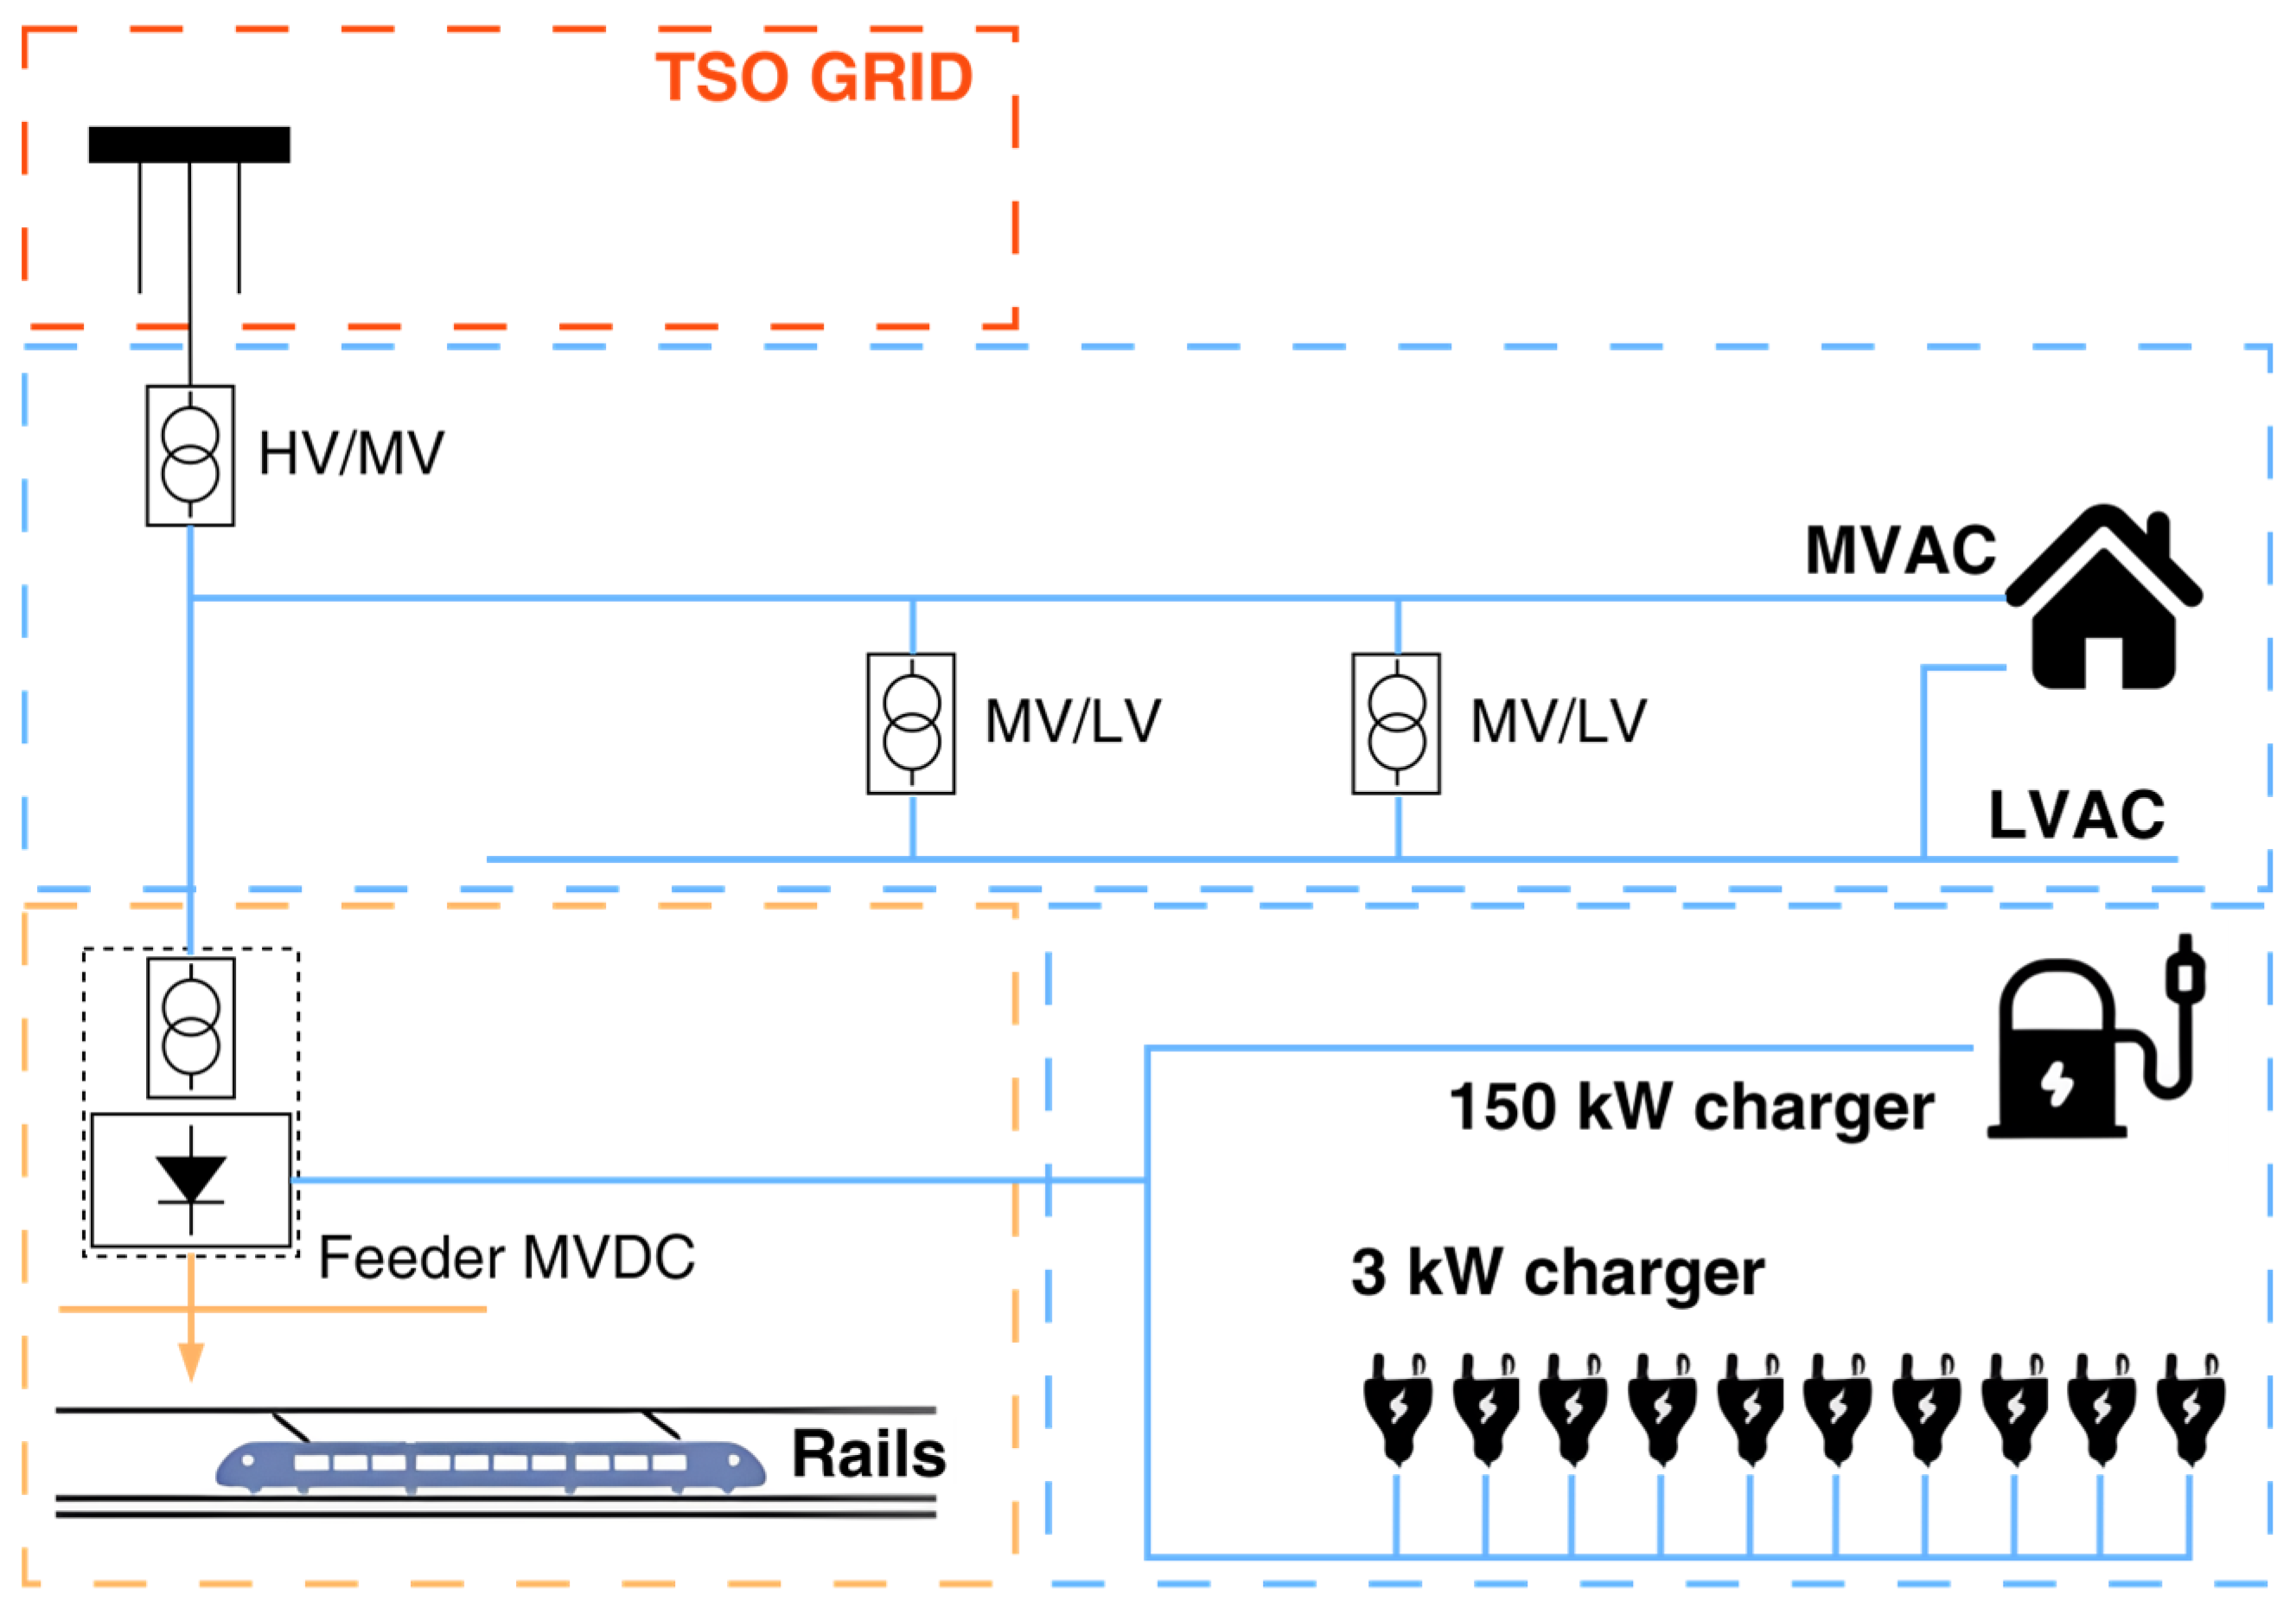
The generally low consumption of the tramway lines compared to their potential power output figures leaves room for exploitation. In order to power EV chargers with this infrastructure, the project aims at creating another distribution line from the Omnibus bar that receives the transformed and rectified 600 VDC current (Figure 2). To realize this architecture, between the distribution line and the converters powering the charging infrastructure, a circuit breaker, voltage surge arresters with a discharge voltage of 1200 V, and disconnectors have been installed for safety reasons.
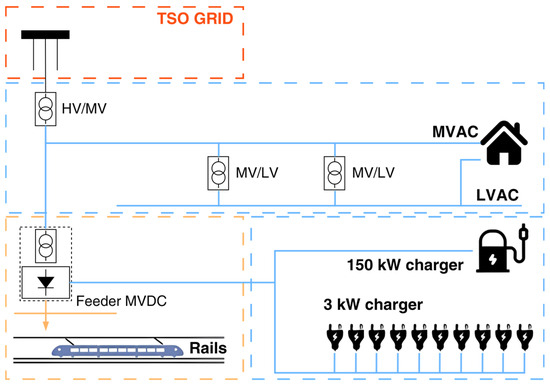
Figure 2.
General scheme of the distribution architecture of the Caio Mario substation and the charging infrastructure.
The charging points (Figure 3) will be powered by four isolated DC/DC converters of 50 kW each supplied from the circuit braker. Three of these will form the heart of the 150 kW charger, while the fourth one, to which the output of all 3.6 kW chargers will be connected, will act as a voltage regulator to regulate the input voltage of the low-power chargers. The input working voltage range of the converters is wide, from 500 V to 950 V, as tramway regulations in Italy allow significant fluctuations in voltage figures.

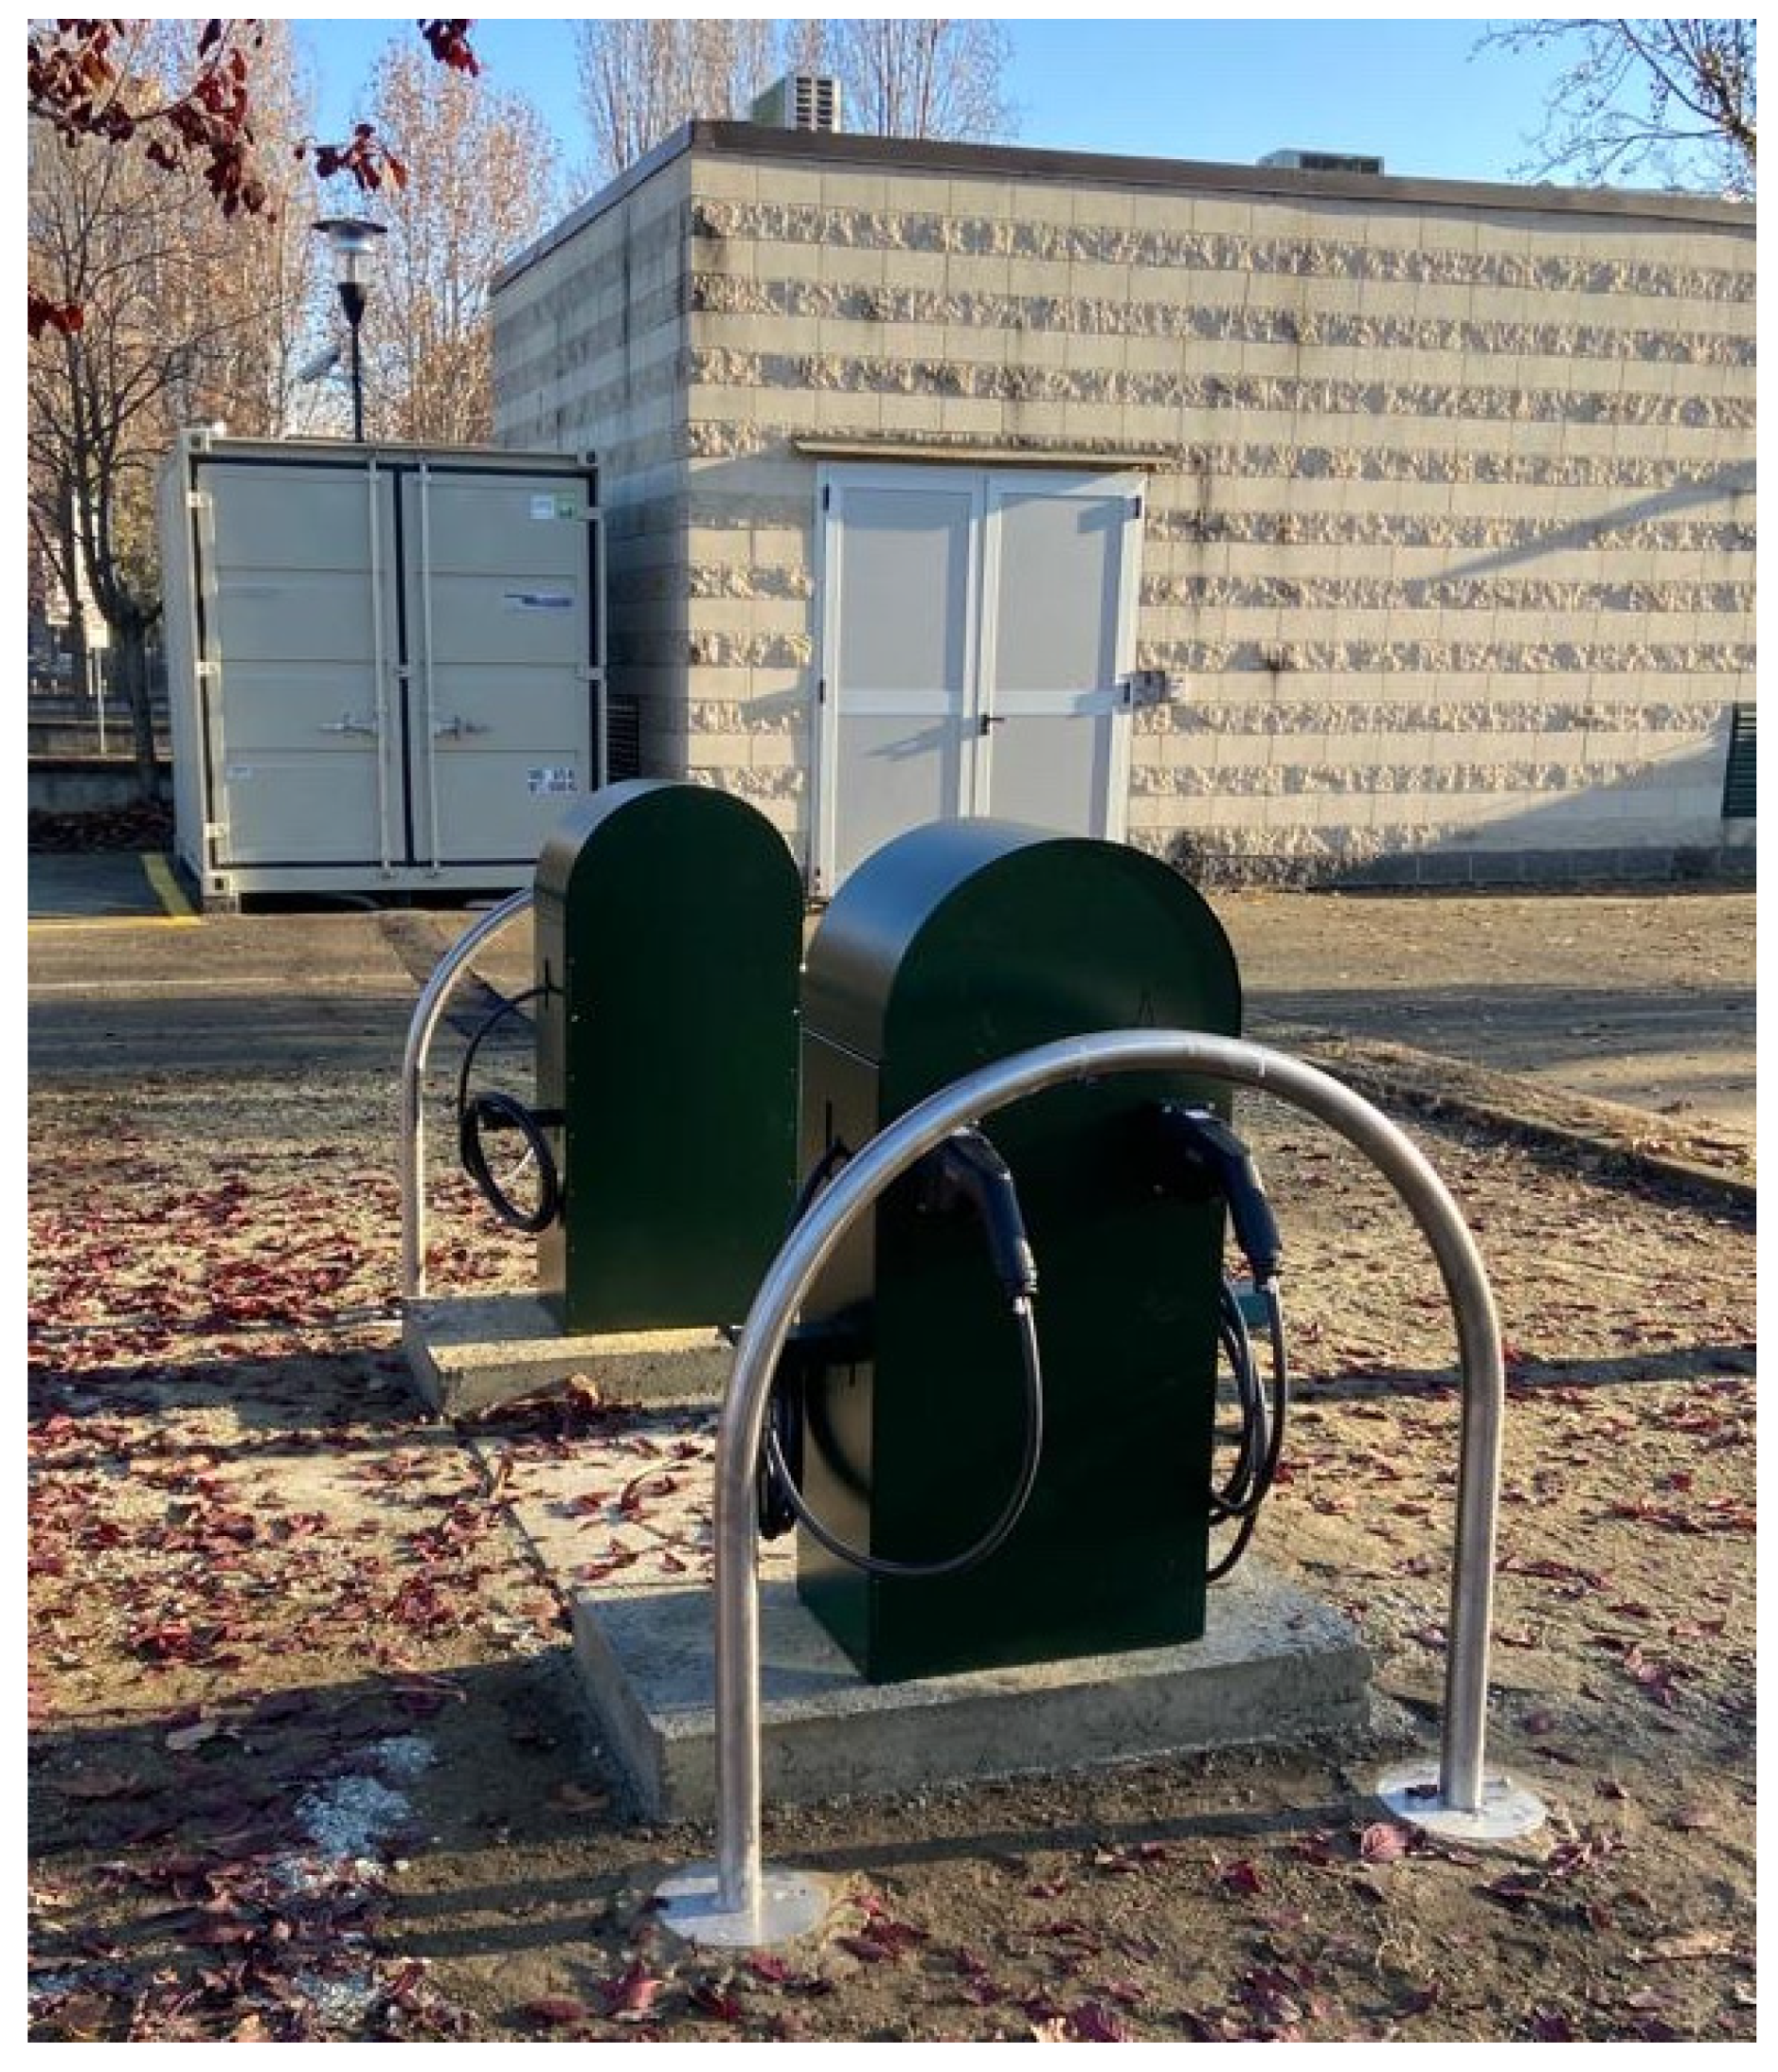
Figure 3.
Caio Mario substation and low-power chargers inspired by Turin’s iconic “Turèt” fountains [30].
In terms of layout, the ultrafast charger CCS2 plug will come out of a new small building destined to host the power electronics, and all the equipment needed to monitor the test site, while the 10 CCS2 3.6 kW chargers will be spread in the park in places near the conversion substation, and their power electronics will be hidden under the ground in manholes in order to allow a sleeker and space-saving design.
2.2. The Case Study of Turin: Current EV Charging Stations Deployment
The City of Torino is committed to contributing to the realization of a widely distributed grid of charging stations throughout the city. Currently, the number of public charging points available in the city of Turin is 562, of which 444 are currently active and 236 are planned. Seven different Charging Point Operators (CPOs) are present.
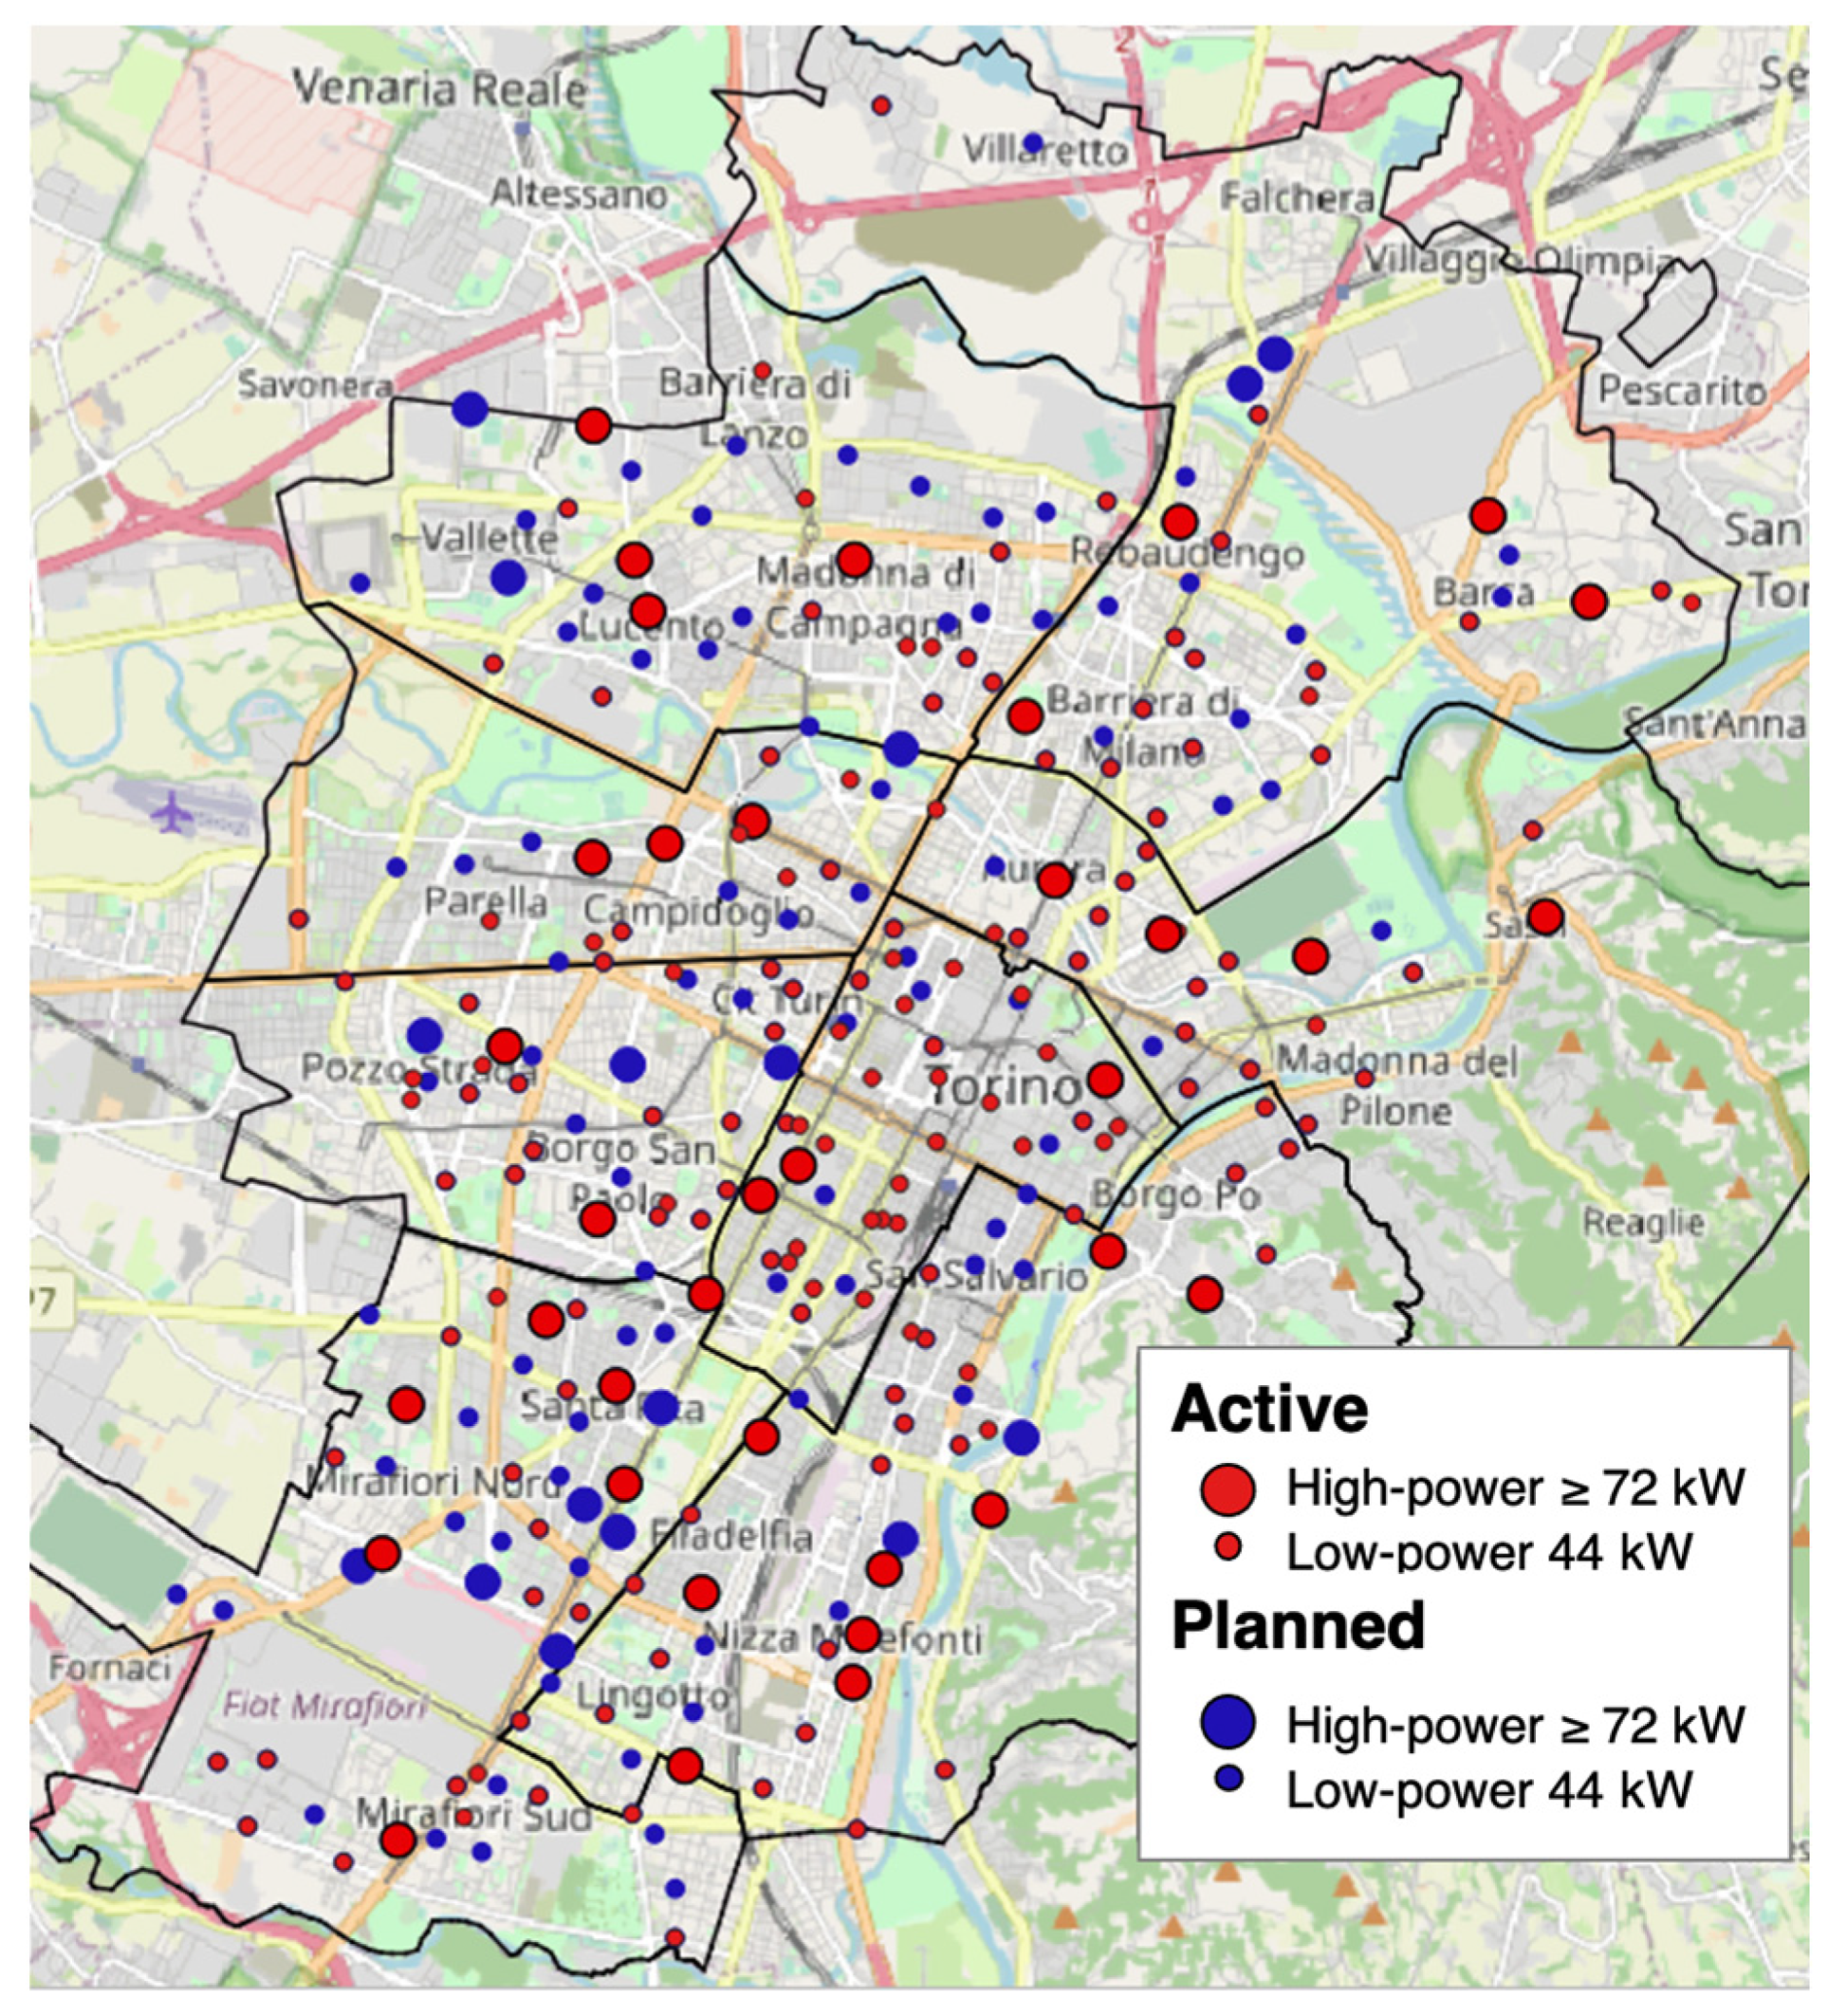
The minimum coverage objective of the City of Torino in its area, equal to one charging point for every 1000 inhabitants, is indicated by art. 57 paragraph 6 of the legislative decree of 16 July 2020 n. 76 [31]. Taking into account the fact that the population in the city is equal to 858,404 inhabitants, the need can currently be estimated at 858 charging points (Figure 4).
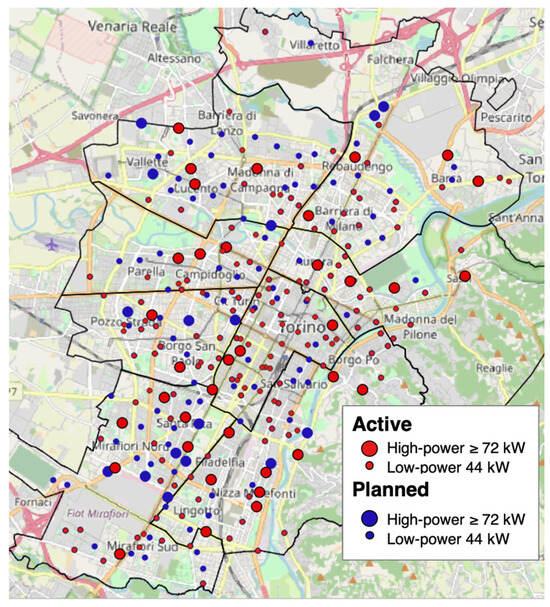
Figure 4.
Map of the active (red) and planned (blue) public charging points in Turin. Smaller circles are <50 kW, bigger circles are >50 kW.
Regarding the use of infrastructure, the charging points are currently delivering an average of approximately 26 kWh/day. By considering a 44 kW quick column as the average charging point in the city, and its 1056 kWh per day maximum capacity, the usage factor is equal to 2.5% of the theoretical maximum possible. The average occupancy data are known for only one operator, and are equal to 4.7%.
The diffusion of pure electric vehicles (BEVs) in Torino is still limited, and the data provided by ACI (Automobile Club Italiano, Turin, Italy) show that only 0.4% of vehicles registered in Turin’s metropolitan city actually fall under the full electric category [32]. Furthermore, no specific action plan for the fostering of electric mobility is currently in force at the local level. Despite being the historical capital city of the automobile sector in Italy, Torino is lagging behind in this transition. This of course is mainly attributable to the general economic conditions, rather than local policies.
The data regarding currently active charging points show a lack of ultrafast chargers, with only eight charging stations exceeding 100 kW in total power. As this is considered a key enabler for the adoption of EVs in densely populated areas that lack private parking spaces like garages, every option should be explored to help create new infrastructure.
3. Results
3.1. Typical Grid Load and Marginal Electricity Availability
In order to verify the actual feasibility of the proposed solution, it was paramount to assess the presence and the eventual amount of energy available for exploitation on-site at the Caio Mario substation. To do so, many sets of measurements were carried through during the functioning condition of the substation and for different years. The following are graphs and elaborations that come from a set of measurements that lasted several months via a dedicated device connected to the substation’s rectifier transducers. For more clarity of visualization, a random working day was selected and the corresponding data were analyzed. As indicated, the day of the measurements was Monday the 12 September 2023.
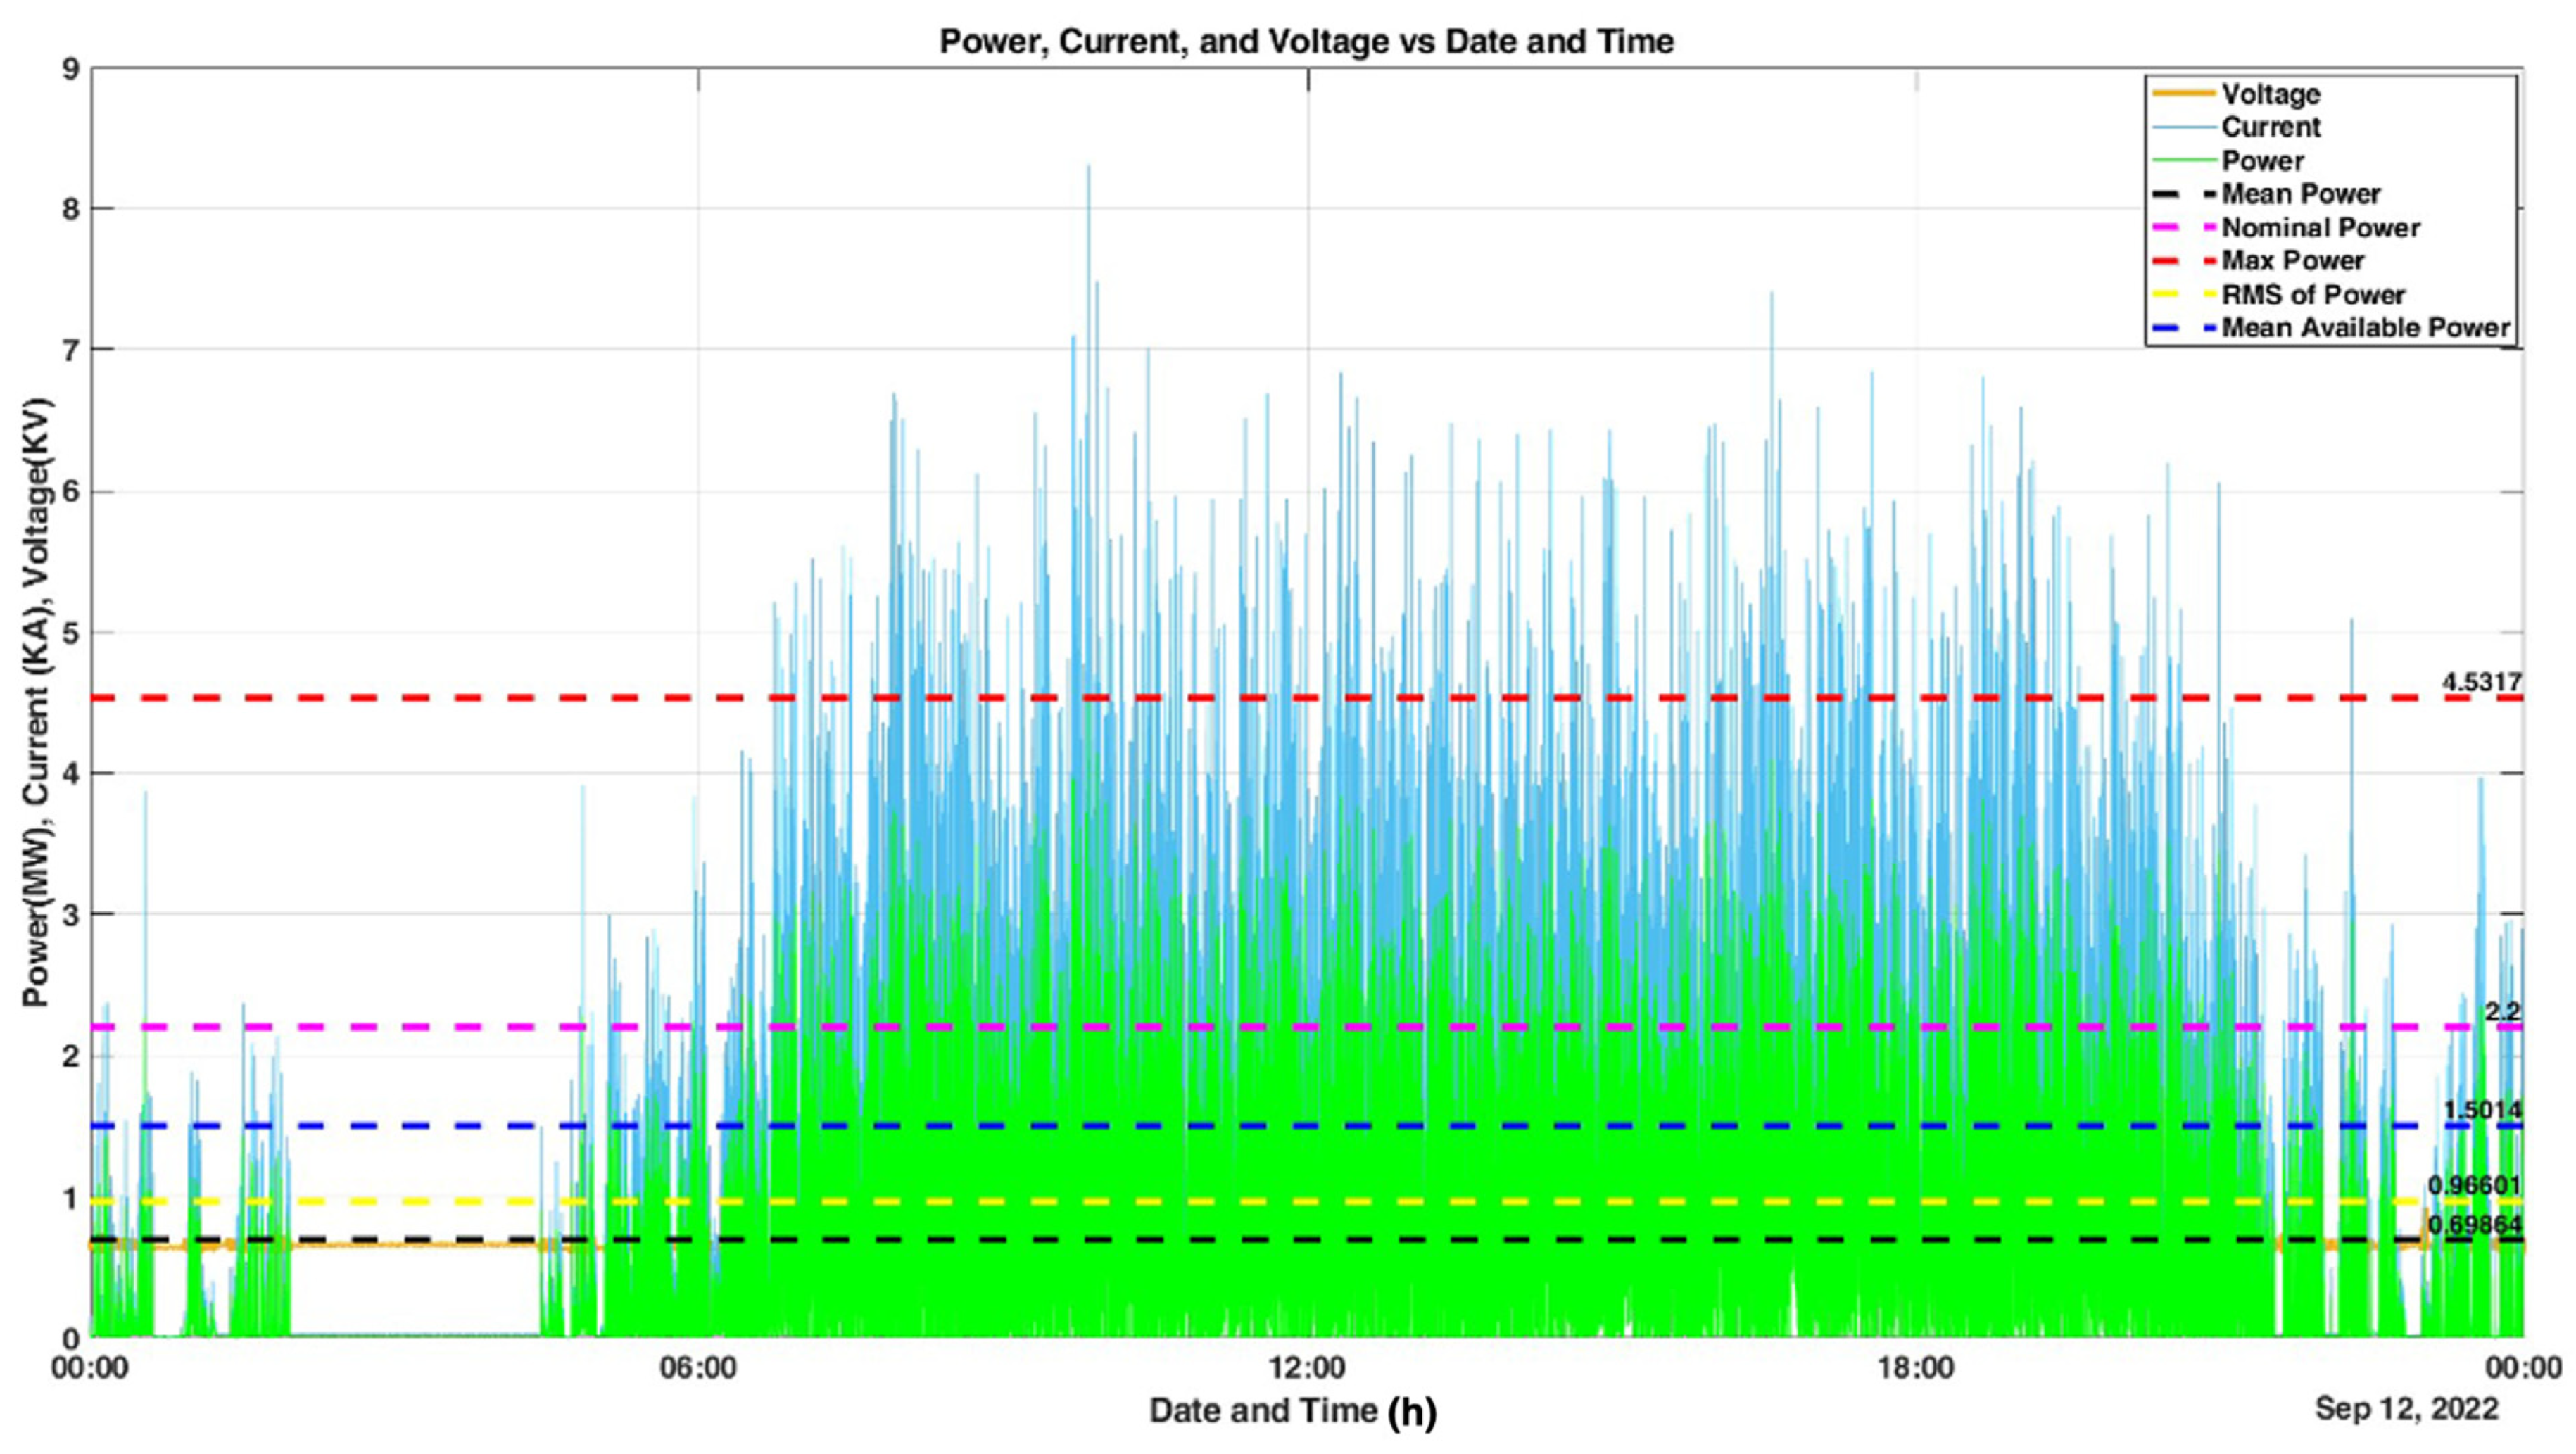
As indicated in the graph in Figure 5, the analyzed data concern voltage and current figures, and the related power output of the substation. The dotted lines indicate mean power figures, the substation’s nominal power, the max power registered, the RMS of the power, and the mean available power present. This last value is especially important in order to assess the potential of the substation to host charging infrastructure.

Figure 5.
Power figures of the SSE Caio Mario on Monday the 12 September 2022.
We can infer that there is a relevant amount of energy to be exploited in the SSE Caio Mario. Mean available power 1.5 MW is quite a high figure, as the nominal power output of the substation is only 2.2 MW. There are indeed moments with heavy loads of energy involved, but they are few and far between. From a voltage standpoint, there were no dangerously high spikes (figures above 1200 V) that could damage the EV charging hub. The current figures can reach considerable peaks, but the sizing of the substation was prudent, and the overload capacity leaves plenty of room for the charging hub to operate properly even in traffic-heavy conditions.
3.2. Assessment of the Potential of the Innovative Solution
The information illustrated in the previous section can be used to produce useful simulations. By having collected and analyzed the previously described data, it is possible to simulate the potential impact of the solution in terms of recharging potential and potential passenger equivalent km. This allows us to also assess the potential social impact of this technological innovation.
As a recap, the average rate of usage of the nominal capacity of the substation (2.2 MW) is currently 24.5%. As previously hinted, the nominal load capacity of the substation is actually expandable, namely up to 3.3 MW for 2 h and 4.4 MW for a minute. However, for further considerations, a conservative approach has been taken. A recharging station with a nominal power of 0.5 MW, which would minimize the chances of overloading the tramway substation, has been considered. Based on this conservative figure, we can estimate three 150 kW DC recharging points for each substation.
In order to estimate the number of vehicles that could be served by the substation, it is necessary to characterize the charging time of a typical vehicle using the recharging points. Table 1 shows a list of representative BEV and PHEV vehicles, divided by market segment (based on ACEA classification [33]), providing an overview of the fuel economy and battery size. These vehicles were selected from the European Environmental Agency dataset on new passenger cars registration [34], based on the largest sales volume.

Table 1.
Representative BEV and PHEV vehicles for several market segments.
As it can be observed, the listed vehicles present major differences when it comes to fuel economy and battery capacity. For the purpose of this preliminary assessment, a medium-size vehicle was selected. This has been defined by properly weighting the characteristics of the representative vehicles (see Table 1) on the market share of the different powertrains and segments [35,36]. The average vehicle so derived has an electric consumption of 16.5 kWh/100 km and a battery capacity of 42.6 kWh, corresponding to a recharging time, from 20% to 100% of the battery capacity, of about 14 min using an ultrafast charger with 150 kW power.
Regarding the operation of the recharging station, it was assumed that it would stay open to the public for 24 h a day, 7 days a week. In order to estimate the impact of this solution in terms of energy delivered to final users, it is necessary to make an assumption about the utilization rate of the station.
The utilization rate—specifically, the energy-based utilization rate—can be defined as the ratio of the actual energy delivered and the theorical energy which could be delivered if the station was fully exploited at its nominal power [37]. This parameter is influenced by several factors: first and foremost, by the amount of time for which EVs are plugged to the recharging point, but also by the extent of idle periods (idle times are those periods in which a vehicle is plugged to the recharging point, but not charging; for instance, when the vehicle is left plugged at the recharging station after the completion of the charging cycle) and by the effective power delivered to the vehicle [38,39]. The latter can differ from the nominal power of the recharging point, depending on the charging strategy (e.g., demand-driven or smart-charging), the state-of-charge of the battery, and the power acceptance of the EV [39].
The latter aspect is particularly relevant for this case study, which is centered on fast-charging points. To date, only a minor share of passenger cars can accept the power level offered by fast chargers. Consequently, fast-charging points are typically under-utilized [37]. However, this problem is expected to gradually diminish and vanish as newer cars will be designed to accept fast charging [37,39].
To date, the overall utilization rate of the slow and normal power recharging stations in the city of Turin has been estimated around 2.5% [40]. This figure, which might appear quite low when compared to other cities [41], is a telltale sign of the low penetration of EVs in the region. Numerous studies linked the development of the EVs market to the rate of utilization of the recharging infrastructure, concluding that, as an increasing number of EVs will hit the streets in future years, higher utilization rates will be observed [37,39,42,43].
Applying the same logic to the case under study, it is safe to assume that the utilization rate of the recharging infrastructure of Turin will sensibly increase in response to the diffusion of EVs, aligning to the figures of more developed markets. For the purpose of this preliminary assessment, a utilization rate of 20% was selected, which, from a review of the scientific literature and industrial reports, appears to offer an advantageous trade-off between the profitability and the manageability of the operation of the recharging station [37,44,45].
Having defined the reference vehicle and the operational parameters of the station, the potential impact of this innovative solution can be evaluated. Assuming that the substation will be in operation for 24 h a day, 7 days a week, and considering a conservative utilization factor of the station of 20%, a single recharging station could potentially charge close to 63 vehicles per day. When considering that Turin’s tramway system hosts 22 substations, and that the stock of EV in the entire Piedmont region was estimated to be around 3200 units in 2022 [46], these figures assume a great relevance. When this is translated into transport activities (total passenger km), the energy provided by the recharging station would be sufficient to cover a travel distance the equivalent of more than 13,000 km.
The main parameters used in this preliminary assessment, and the results, are shown in Table 2. The preliminary analysis confirms that this innovative solution could have a remarkable impact on the urban environment. However, it is stressed that these figures are the result of a very simplified analysis, based on raw assumptions about the future functioning of the station, and that the need for a more detailed assessment should be addressed by future studies.
Table 2.
Main parameters and results of the assessment of the impact of this novel solution during one day of operation. Two scenarios were considered: a fast-charging scenario (150 kW DC charging points) and a slow-charging scenario (3 kW DC charging points).
Table 2 also reports the comparison of the selected configuration of the charging station, using 150 kW fast-charging points, with an alternative scenario using 3 kW slow-charging points. The same utilization factor was assumed, although slow-charging points seem to be more subject to idle times [39]. Due to this choice and to the more granular exploitation of the 0.5 MW power available at the substation, the slow-charging scenario displays a higher impact than the fast-charging one.
Nevertheless, it should be considered that the major novelty of the fast-charging solution resides in the reduction in recharging time, with less than 15 min versus the more than 11 h with the slow-charging configuration. This factor could win the favor of EV users [47], contributing to bolstering the adoption of this technology. Moreover, the slow-charging solution would require the installation of up to 166 points, while the fast-charging solution would only require three of them, moderating the impact on the existing urban landscape.
3.3. Regenerative Brake Potential
To complete the overview on the tramway network, it has to be noted that part of the energy devolved to tramway traction can be recovered thanks to regenerative brake harvesting, if the tram allows such operations. As part of this work, an in-depth analysis on Turin’s tramway networks and its vehicles has been conduction, it emerged the possibility to draw a detailed picture of the general consumptions for the network, including the regenerative brake potential available. Via on-board measurements on trams, it was possible to gather information on the consumption of the different models of tramways in service. The regenerative brake harvesting potential was assessed to be 0% for the older series 2800 vehicles, 0.08% for the 5000 series, and 11% for the 6000 series. By virtue of knowing the total energy consumption for each tramway model/series, calculated by estimating the number of trips and the average consumption data gathered via the measurements, as well as the values registered by all the PODs energy meters (5000 series consume 5,937,898 kWh per year, 6000 series 9,621,994 kWh), there are currently 4750.31 kWh retrievable from the 5000 series and 1,058,419 kWh from 6000 series, for a total of 1,063,169.31 kWh per year in the entire tramway network.
Overall, around 1 GWh per year could be recovered through regenerative braking across the entire tramway network. Assuming this energy to be equally available to all substations and evenly distributed throughout the year, this would account for about 0.13 MWh of electricity per substation per day. Recalling the results presented in the previous section, estimating a demand of 2.2 MWh/day/substation, the contribution of regenerative braking to the energy delivered to EVs could be as high as 5.7%.
The figures above should be considered as a maximum technical potential, since the estimation does not account for the losses which would occur in the kinetic energy recovering and redistribution system. Such an energy management system would likely include an electric storage component, due to the fact that a large amount of energy would be released in the small braking time, so that the match between demand and supply would not be guaranteed.
Dimensioning such a hypothetical storage system could be challenging because of the different factors that have to be taken into account. In particular, the driving style of the public transport tramway operators, an underrated but very decisive factor in the load profile of a tramway substation, is hard to predict.
4. Discussion
The technical potential for the presented solution is closely related to the current grid constraints that many cities are experiencing. With the expected increase in the electric loads and the need for new substations, finding new ways to leverage existing infrastructure is paramount. Our proposal lays on this consideration, and the resulting potential can therefore be deemed significant.
Furthermore, by adding a new energy demand load to existing substations (e.g., Caio Mario, in Turin), many of the peak voltages that negatively impact Turin’s tramway grid are mitigated, resulting in economic and management advantages for the public transport company.
The nature of the proposed installation is DC native, and it simplifies the architecture of DC chargers, which are diffused as high-power charging infrastructure. The rectifiers are already present in the substation, hence providing additional potential savings, both in terms of economic costs and environmental impact. The concept utilizes consolidated standards and components, therefore already guaranteeing a high hardware TRL.
As previously mentioned, the technologies applied to the concept in terms of hardware and control are already consolidated and widespread in power electronics, and rail and control applications. The expected concept scalability is therefore significant, with the potential to further increase the economic attractiveness of the solution. The potential savings of adopting the INCIT-EV solution instead of a conventional one are difficult to estimate as of now, but the simplified nature of the installation could mean up to 15% savings on infrastructure cost, with the percentage increasing via scaling up processes and manufacturing costs falling.
Coming back to the impact comparison between the different configurations of the proposed solution, it is to be noted that the urbanistic impact as well as the optimization of costs seem to favor the higher power chargers. One of the key factors to take into account is the location of the tramway substations, with the Caio Mario use case as the lone substation located near a proper parking lot, while other locations would definitely struggle with the need to find an adequate parking place for as many low-power chargers as indicated in the previous chapter.
About the replicability of the initiative, there are more than 400 cities worldwide, across all continents, that have an urban tramway line. International voltage standards and common regulations guarantee similar conditions for testing and eventual installation processes.
Focusing on the local and national levels, the potential of application of the presented EV charging solution can be significant. If the Caio Mario substation is an indication of the average loads that a conversion substation sustains, installing 300 kW of charging power (2 × 150 kW) should be feasible. The result would be 44,150 kW chargers well spread over the surface of the city of Turin. There are currently only three charging points available in Turin with a power of 100 kW or more. This increase would allow the city to complete its charging infrastructure portfolio with ultrafast chargers already engineered for the increase in battery pack capacities. This could be the missing piece for larger scale EV adoption in densely populated urban contexts [48,49] like Italian cities, where only a minority of inhabitants have access to a personal garage to be fitted with private charging infrastructure.
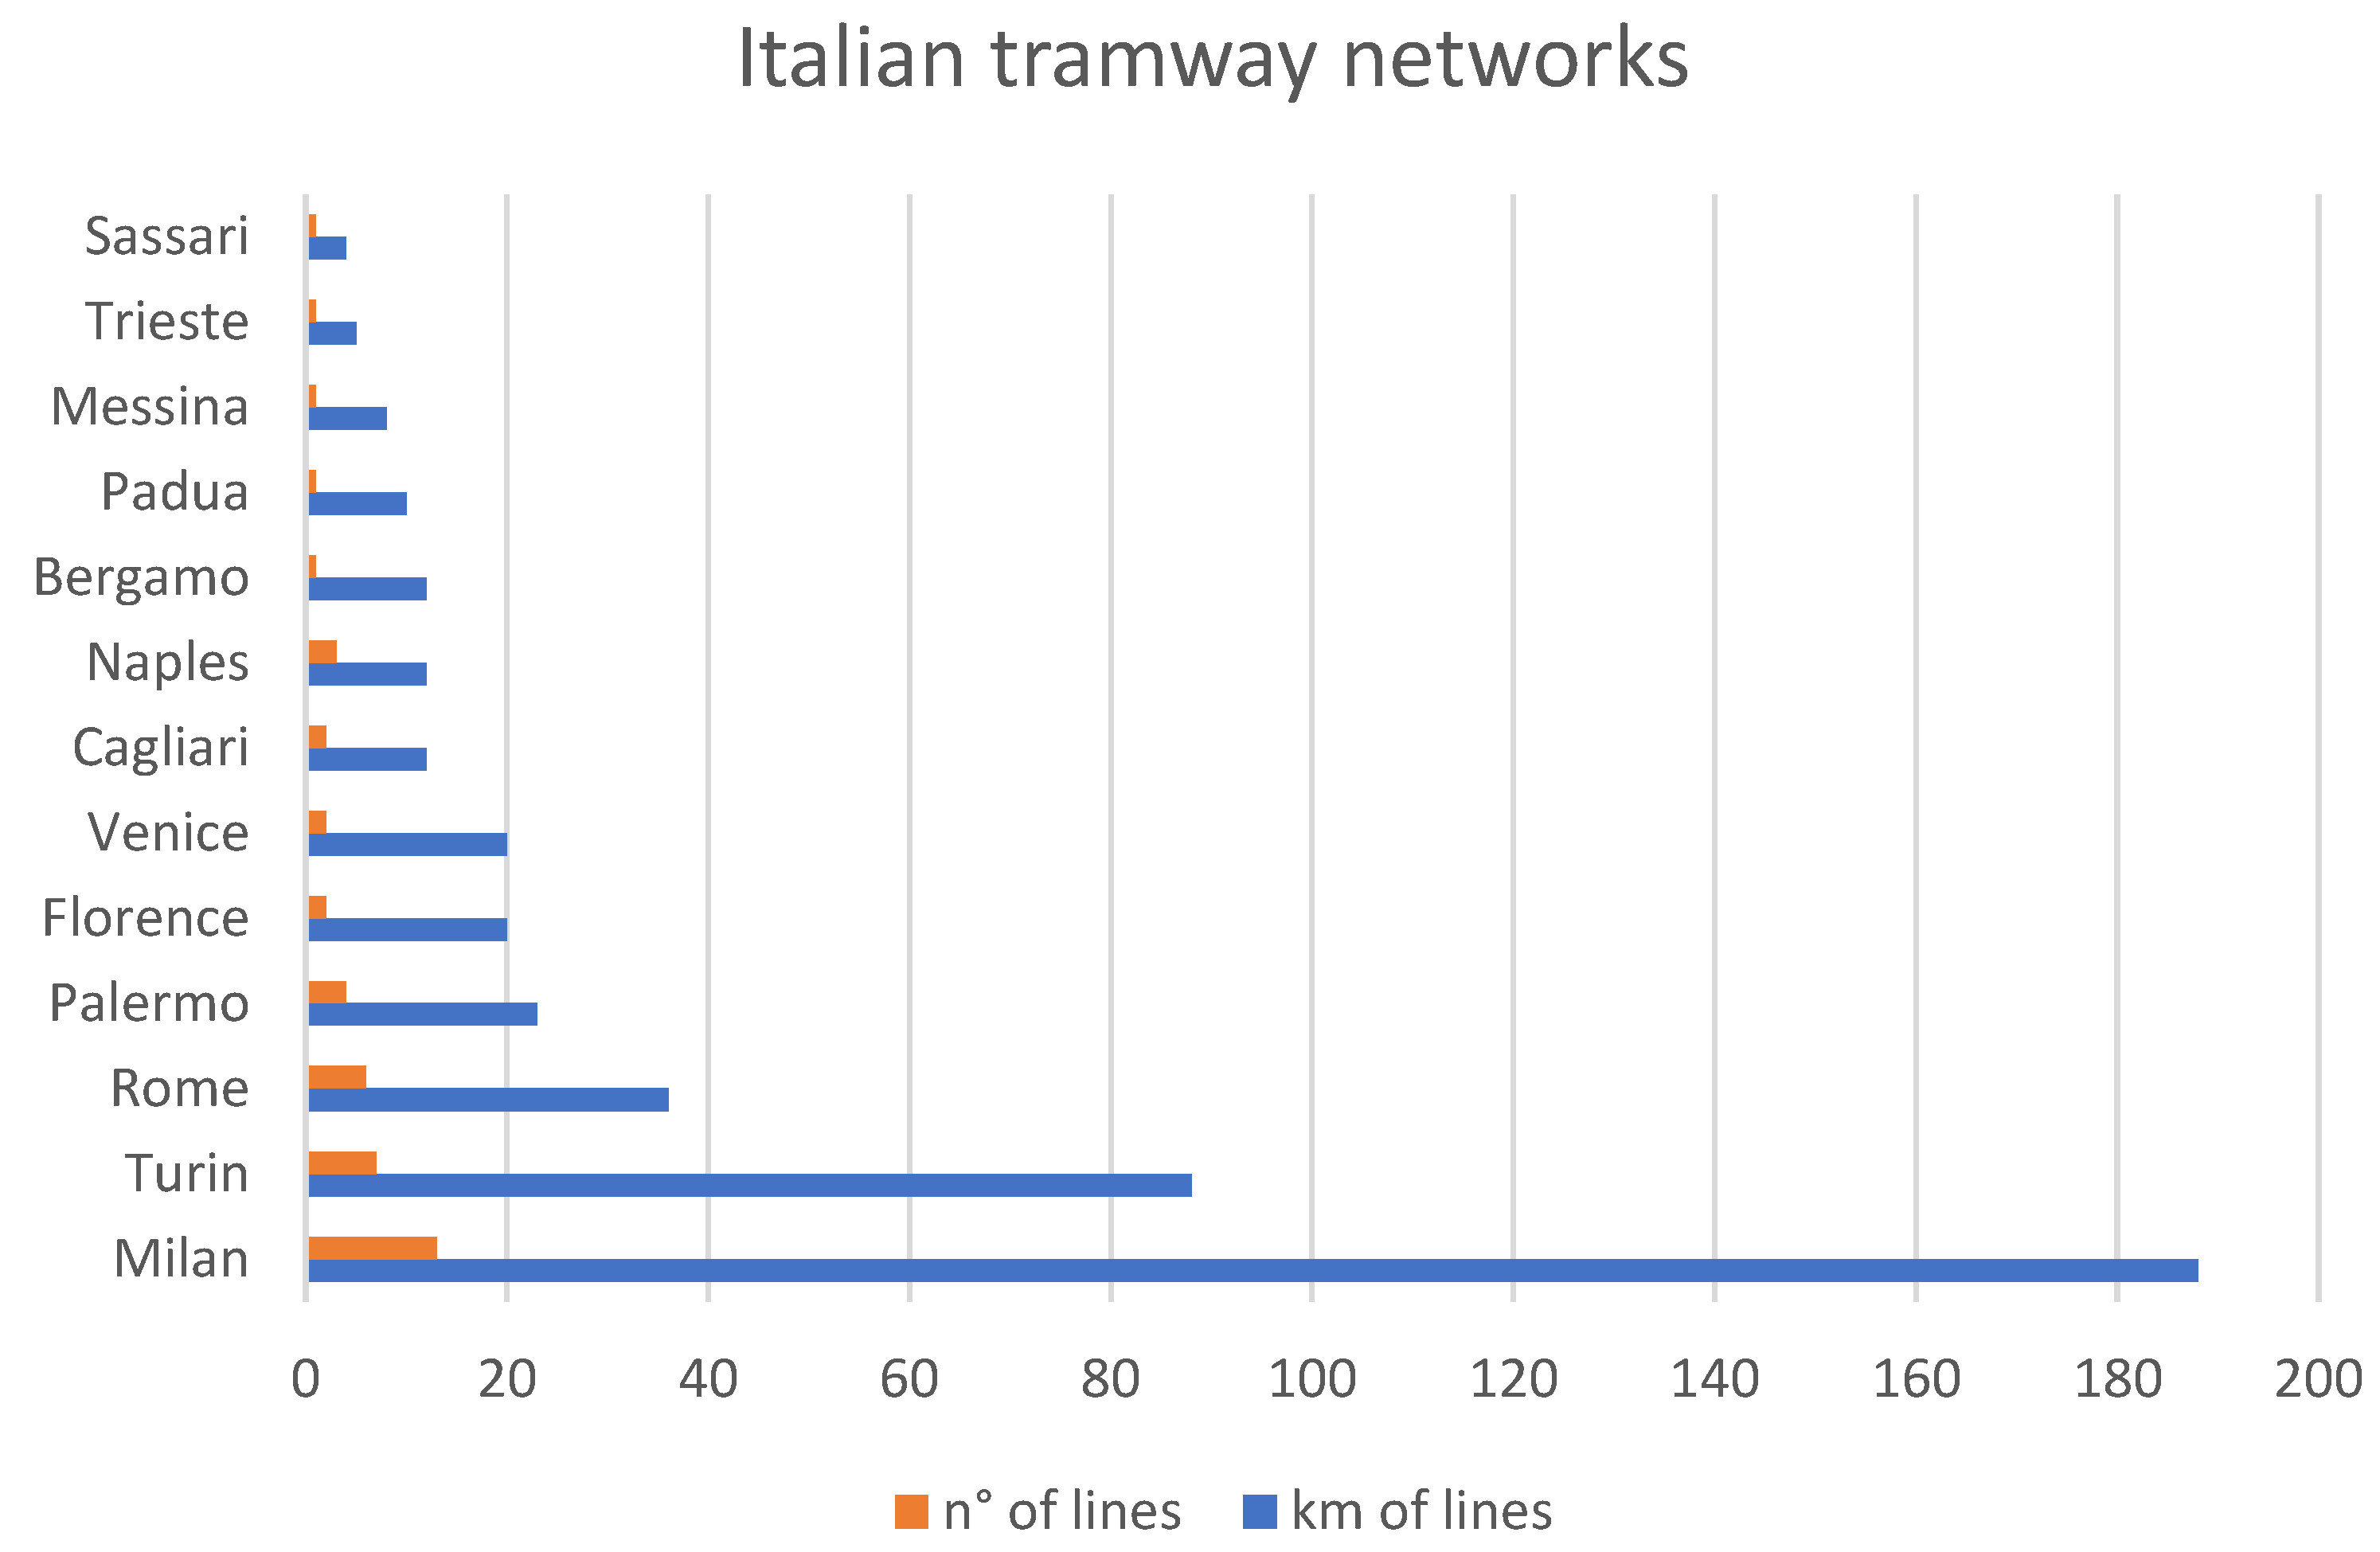
Focusing on the national level, there are 13 cities in Italy with a tramway grid, for a total network length of 428 km, excluding trolleybus-dedicated grids (Milano, Napoli, Bologna, Roma, Parma, Cagliari, Modena, Genova, La Spezia, Lecce, Chieti, Sanremo, Ancona, and Rimini currently have in-service trolleybuses.). Milan tops the list with a tramway network length of 188 km spread in 17 operating lines [50]. Turin comes in second place, with a network length of 88 km and eight plus two lines in service [50]. Rome is in a distant third place, with a tramway network of 36 km and six lines. Palermo has 23 km of network and four lines, while Firenze and Venezia have 20 km each with two operating lines apiece. Cagliari, Napoli, and Bergamo each have 12 km of network, with just one line for Bergamo, two for Cagliari, and three for Napoli. Padova, Messina, Trieste, and Sassari all have one line, with 10 km for Padova, 8 km for Messina, 5 km for Trieste, and 4 km for Sassari as operating tramway lines. It is to be noted that the City of Bologna has started the civil works for the first of four lines of tramway network. The first line is expected to operate from 2026, while the other three are undergoing the project approval phase [51].
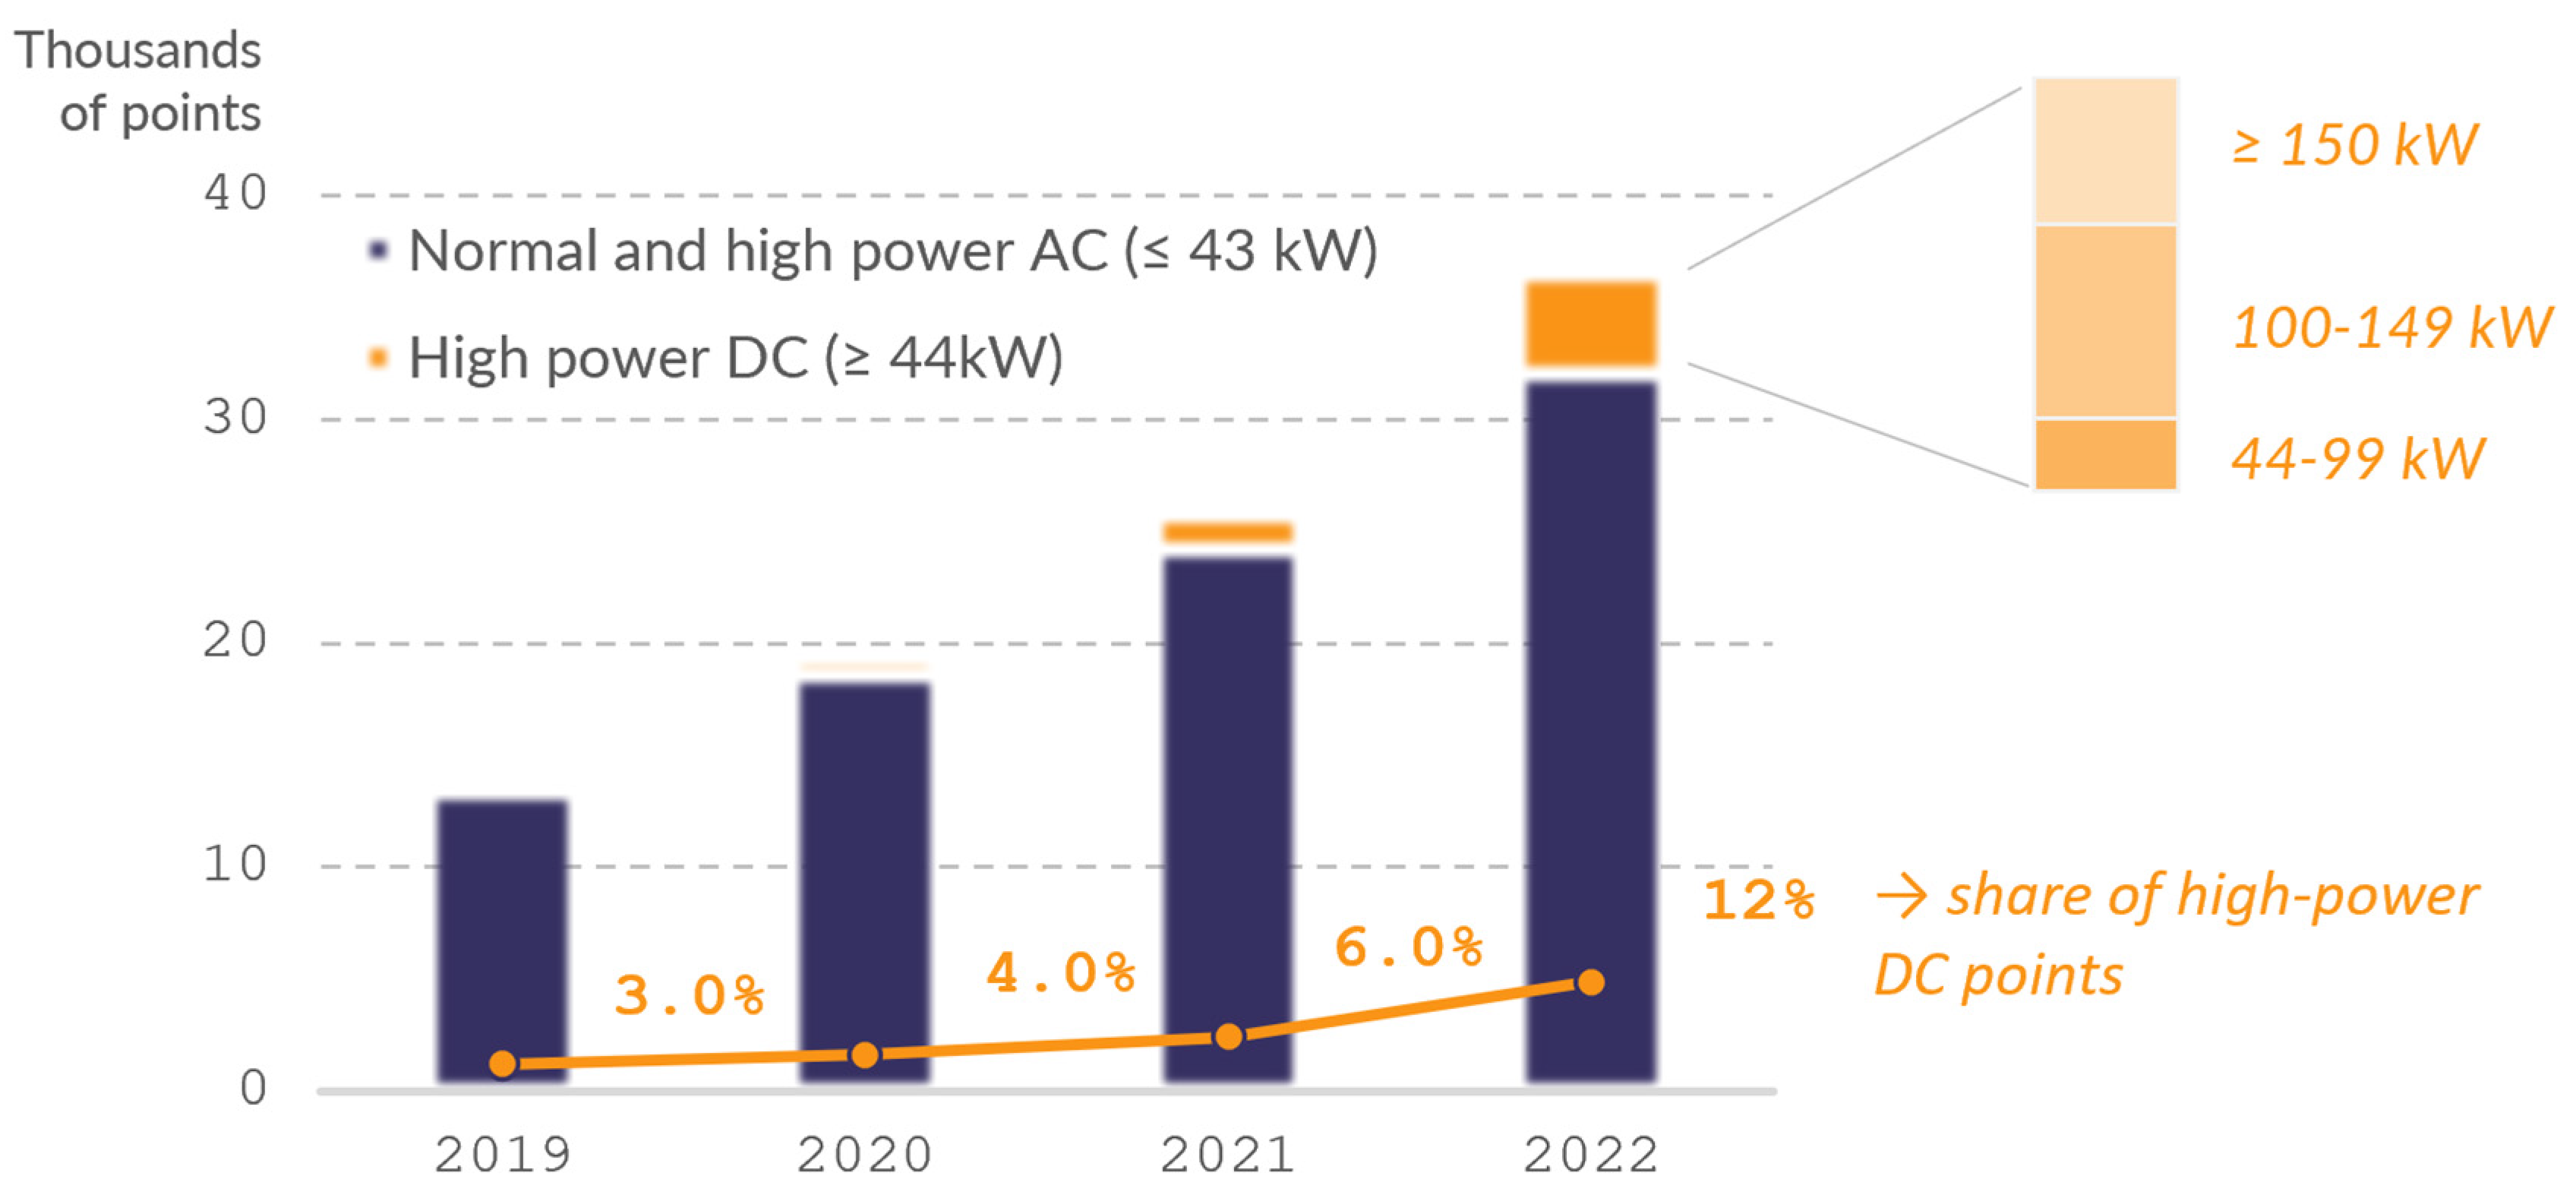
Estimating the number of conversion substations as proportional to the substation/km ratio of Turin, the total number of conversion substations dedicated to tramway network powering in Italy should be higher than 100 (see Figure 6). This would enable the installation of around 210,150 kW chargers in urban contexts all along the peninsula, or 8% of the total number of chargers with 100 kW power (or more) present now in Italy (see Figure 7) [52].

Figure 6.
Graph showing the Italian cities with a tramway, their number of active lines, and the total km of their networks.
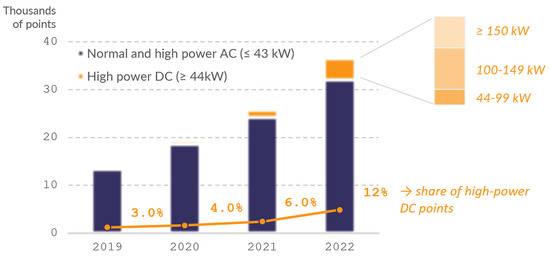
Figure 7.
Number of publicly available recharging points in Italy, by recharging point category. Data were sourced from the annual reports from motus-e [52,53,54,55] and from the European Alternative Fuels Observatory [56].
The innovative solution proposed in this paper holds great potential to facilitate the diffusion of electric mobility. However, it is clear that the future of urban mobility shall be based on a variety of charging concepts, satisfying different consumers’ needs and meeting local specifications. The study of the synergies among different charging concepts is, therefore, pivotal for the development of an integrated transport-energy system.
As an example, fast DC charging could be paired with other trending concepts, such as Parallel Mobile Charging Services (PMCS) [57], last mile delivery systems, and taxi fleets. This could alleviate range anxiety issues and accidental empty battery conditions for city dwellers and commuters.
This fast-charging solution is also open to further synergies with the city tramway network. The issue of battery electric trams was not addressed in this paper, since Turin’s network is entirely covered by catenary systems, so trams do not necessitate on-board energy storage. Nevertheless, battery electric trams are another emerging concept, conceived for the specific situation in which overhead lines are technically infeasible or unwanted for safety or aesthetic reasons [58]. Such trams, also known as Acumulador de Carga Rápida (Fast Charging Accumulator) (ACR), are equipped with a supercapacitor which is fast-charged at stops and releases energy during the trip. The feasibility of the integration of such a solution with the fast chargers proposed in this paper, enabling the hybrid charging of trams and light duty vehicles, should be explored in future studies.
5. Conclusions
The presented technical solution addresses the pressing challenges posed by electrical mobility transition, compared to the current grid. The investigated option offers a strategic answer to the expected significant increase in the electric loads and the demand for new vehicle recharging points. The proposal leverages existing infrastructure, marking it as a significant step toward sustainable urban development.
The potential impact of this innovative solution becomes apparent when evaluating its practical application: under a conservative utilization factor, a single recharging station operating 24/7 could potentially serve more than 60 vehicles per day. Considering Turin’s tramway system with its 22 substations and the estimated EV stock in the Piedmont region, the relevance of these figures becomes evident. In terms of transport activities, the energy provided by a recharging station could cover a travel distance exceeding the equivalent of 13,000 km.
The DC-native nature of the installation simplifies the architecture of DC chargers, utilizing existing rectifiers in substations and offering potential savings in economic costs and environmental impact. The use of established standards and components ensures a high hardware Technology Readiness Level (TRL). Moreover, the scalability and replicability of the solution are evident, with the potential for more than 100 conversion substations across Italy, enabling the installation of numerous high-power chargers in urban contexts.
These considerations showcase the substantial contribution to sustainable mobility and the potential contribution to reaching the goals set by the Alternative Fuels Infrastructure Regulation (AFIR). In essence, the proposed solution not only addresses the immediate challenges posed by grid constraints but also aligns with broader sustainability goals, offering a scalable and replicable model for powering electric vehicles in urban environments across Italy.
Future works should aim to quantify the effective contribution of regenerative braking to the energy demand of charging vehicles, investigating the temporal patterns of charging and braking events and defining the requirements of the energy management system. In addition, the synergies between the proposed solution and other complementary concepts for urban electric mobility, such as PMCS and ACR, should be addressed.
Author Contributions
M.P.: Conceptualization, Methodology, Validation, Writing; A.F.C.: Visualization, Investigation, Writing, Formal analysis; L.L.: Data Curation, Writing; G.C.: Resources; P.G.: Supervision, Project administration, Funding acquisition. All authors have read and agreed to the published version of the manuscript.
Funding
This publication is part of the project NODES, which has received funding from the MUR—M4C2 1.5 of PNRR with grant agreement no. ECS00000036. This publication is part of the project PNRR-NGEU, which has received funding from the MUR–DM 352/2022. This publication is sup-ported by the activities of the INCIT-EV European project, funded by Horizon2020, G.A. n° 875683.
Data Availability Statement
Data are contained within the article.
Acknowledgments
The authors wish to acknowledge the Municipality of Turin for the supportive collaboration.
Conflicts of Interest
The authors declare no conflict of interest.
References
- EU Deal to End Sale of New CO2 Emitting Cars by 2035. Available online: https://ec.europa.eu/commission/presscorner/detail/en/IP_22_6462 (accessed on 9 November 2023).
- European Commission. Communication from the Commissions to the European Parliament, the European Council, the Council, the European Economic and Social Committee and the Committee of the Regions—The European Green Deal, Europe; European Commission: Brussels, Belgium, 2019. [Google Scholar]
- Falchetta, G.; Noussan, M. Electric vehicle charging network in Europe: An accessibility and deployment trends analysis. Transp. Res. D Transp. Environ. 2021, 94, 102813. [Google Scholar] [CrossRef]
- European Parliament. Regulation (EU) 2023/851 of the European Parliament and of the Council of 19 April 2023 Amending Regulation (EU) 2019/631 as Regards Strengthening the CO2 Emission Performance Standards for New Passenger Cars and New Light Commercial Vehicles in Line with the Union’s Increased Climate Ambition; European Parliament: Brussels, Belgium, 2023. [Google Scholar]
- European Parliament. Regulation (EU) 2018/1999 of the European Parliament and of the Council of 11 December 2018 on the Governance of the Energy Union and Climate Action; European Parliament: Brussels, Belgium, 2018. [Google Scholar]
- Marotta, A.; Julea, A.; Acosta Iborra, B.; Lodi, C.; Klassek Bajorek, D.; Gomez Vilchez, J. Assessment of the Member States’ Implementation Reports of the National Policy Frameworks under the Directive 2014/94/EU on the Deployment of Alternative Fuels Infrastructure; European Commission: Brussels, Belgium, 2021. [Google Scholar]
- DECRETO 7 Agosto 2012, n. 134, Conversione in Legge, Con Modificazioni, del Decreto-Legge 22 Giugno 2012, n. 83, Recante Misure Urgenti per la Crescita del Paese; Gazzetta Ufficiale: Roma, Italy, 2012.
- Mulholland, E. Zero-Emission Bus and Truck Market in Europe: A 2021 Update. 2022. Available online: https://theicct.org/publication/zero-emission-bus-and-truck-market-in-europe-factsheet-aug23/ (accessed on 9 January 2024).
- European Environmental Agency. New Registrations of Electric Cars, EU-27—European Environment Agency. 2023. Available online: https://www.eea.europa.eu/data-and-maps/daviz/new-electric-vehicles-in-eu-3#tab-chart_3 (accessed on 12 February 2024).
- Talluri, G.; Grasso, F.; Chiaramonti, D. Is deployment of charging station the barrier to electric vehicle fleet development in EU urban areas? An analytical assessment model for large-scale municipality-level EV charging infrastructures. Appl. Sci. 2019, 9, 4704. [Google Scholar] [CrossRef]
- Paffumi, E.; De Gennaro, M.; Martini, G.; Scholz, H. Assessment of the potential of electric vehicles and charging strategies to meet urban mobility requirements. Transp. A Transp. Sci. 2015, 11, 22–60. [Google Scholar] [CrossRef]
- Gemassmer, J.; Daam, C.; Reibsch, R. Challenges in Grid Integration of Electric Vehicles in Urban and Rural Areas. World Electr. Veh. J. 2021, 12, 206. [Google Scholar] [CrossRef]
- Stańczyk, T.L.; Hyb, L. Technological and Organisational Challenges for e-Mobility. Arch. Automot. Eng. 2019, 84, 57–70. [Google Scholar] [CrossRef]
- Rafi, M.A.H.; Bauman, J. A Comprehensive Review of DC Fast-Charging Stations with Energy Storage: Architectures, Power Converters, and Analysis. IEEE Trans. Transp. Electrif. 2021, 7, 345–368. [Google Scholar] [CrossRef]
- Ahmad, A.; Khalid, M.; Ullah, Z.; Ahmad, N.; Aljaidi, M.; Malik, F.A.; Manzoor, U. Electric Vehicle Charging Modes, Technologies and Applications of Smart Charging. Energies 2022, 15, 9471. [Google Scholar] [CrossRef]
- Aggeler, D.; Canales, F.; Zelaya -De, H.; Parra, L.; Coccia, A.; Butcher, N.; Apeldoorn, O. Ultra-Fast DC-Charge Infrastructures for EV-Mobility and Future Smart Grids. In Proceedings of the 2010 IEEE PES Innovative Smart Grid Technologies Conference Europe (ISGT Europe), Gothenburg, Sweden, 11–13 October 2010; IEEE: Piscataway, NJ, USA, 2010. [Google Scholar]
- Subashini, M.; Vijayan, S. Smart Charging for Zero Emission Vehicles—A Comprehensive Review. Renew. Energy Focus 2023, 46, 57–67. [Google Scholar] [CrossRef]
- Franzese, P.; Patel, D.D.; Mohamed, A.A.S.; Iannuzzi, D.; Fahimi, B.; Risso, M.; Miller, J.M. Fast DC Charging Infrastructures for Electric Vehicles: Overview of Technologies, Standards, and Challenges. IEEE Trans. Transp. Electrif. 2023, 9, 3780–3800. [Google Scholar] [CrossRef]
- Khalid, M.R.; Alam, M.S.; Sarwar, A.; Asghar, M.J. A Comprehensive review on electric vehicles charging infrastructures and their impacts on power-quality of the utility grid. eTransportation 2019, 1, 100006. [Google Scholar] [CrossRef]
- Rahman, S.; Shrestha, G.B. An investigation into the impact of electric vehicle load on the electric utility distribution system. IEEE Trans. Power Deliv. 1993, 8, 591–597. [Google Scholar] [CrossRef]
- Unterluggauer, T.; Rich, J.; Andersen, P.B.; Hashemi, S. Electric vehicle charging infrastructure planning for integrated transportation and power distribution networks: A review. eTransportation 2022, 12, 100163. [Google Scholar] [CrossRef]
- van der Horst, K.; Diab, I.; Mouli, G.R.C.; Bauer, P. Methods for increasing the potential of integration of EV chargers into the DC catenary of electric transport grids: A trolleygrid case study. eTransportation 2023, 18, 100271. [Google Scholar] [CrossRef]
- Smith, K.; Hunter, L.; Kerry, C.; Kellett, M.; Booth, C. Integrated Charging of EVs Using Existing LVDC Light Rail Infrastructure: A Case Study. In Proceedings of the IEEE Third International Conference on DC Microgrids (ICDCM), Matsue, Japan, 20–23 May 2019. [Google Scholar] [CrossRef]
- Zhang, T.; Zhao, R.; Ballantyne, E.E.F.; Stone, D.A. Increasing urban tram system efficiency, with battery storage and electric vehicle charging. Transp. Res. D Transp. Environ. 2020, 80, 102254. [Google Scholar] [CrossRef]
- Santos, P.; Fonte, P.; Luís, R. Improvement of DC Microgrid Voltage Regulation based on Bidirectional Intelligent Charging Systems. In Proceedings of the 15th International Conference on the European Energy Market (EEM), Lodz, Poland, 27–29 June 2018. [Google Scholar] [CrossRef]
- Fernandez, L.M.; Garcia, P.; Garcia, C.A.; Jurado, F. Hybrid electric system based on fuel cell and battery and integrating a single dc/dc converter for a tramway. Energy Convers. Manag. 2011, 52, 2183–2192. [Google Scholar] [CrossRef]
- Pouget, J.; Guo, B.; Bossoney, L.; Coppex, J.; Roggo, D.; Ellert, C. Energetic simulation of DC railway micro-grid interconnecting with PV solar panels, EV charger infrastructures and electrical railway network. In Proceedings of the 2020 IEEE Vehicle Power and Propulsion Conference, Gijon, Spain, 18 November–16 December 2020; Institute of Electrical and Electronics Engineers Inc.: Piscataway, NJ, USA, 2020. [Google Scholar] [CrossRef]
- Shekhar, A.; Mouli, G.C.R.; Bandyopadhyay, S.; Bauer, P. Electric Vehicle Charging with Multi-Port Converter based Integration in DC Trolley-Bus Network. In Proceedings of the 2021 IEEE 19th International Power Electronics and Motion Control Conference, PEMC 2021, Gliwice, Poland, 25–29 April 2021; Institute of Electrical and Electronics Engineers Inc.: Piscataway, NJ, USA, 2021; pp. 250–255. [Google Scholar] [CrossRef]
- Kumar, L.; Lathwal, R. Electric vehicle charging method and impact of charging and discharging on distribution system: A review. Int. J. Electr. Hybrid Veh. 2022, 14, 87–111. [Google Scholar] [CrossRef]
- Toret—Wikipedia. Available online: https://it.wikipedia.org/wiki/Toret (accessed on 9 November 2023).
- DECRETO-LEGGE 16 Luglio 2020, n. 76 Misure Urgenti per la Semplificazione e L’innovazione Digitale; Gazzetta Ufficiale della Repubblica Italiana: Roma, Italy, 2020.
- Automobil Club d’Italia. Autoritratto; Automobil Club d’Italia: Rome, Italy, 2022. [Google Scholar]
- EU Classification of Vehicle Types|European Alternative Fuels Observatory. Available online: https://alternative-fuels-observatory.ec.europa.eu/general-information/vehicle-types (accessed on 11 November 2023).
- Monitoring of CO2 Emissions from Passenger Cars Regulation (EU) 2019/631. 2023. Available online: https://sdi.eea.europa.eu/catalogue/srv/api/records/fa8b1229-3db6-495d-b18e-9c9b3267c02b (accessed on 9 January 2024).
- New Passenger Cars by Segment in the EU—ACEA—European Automobile Manufacturers’ Association. Available online: https://www.acea.auto/figure/new-passenger-cars-by-segment-in-eu/ (accessed on 11 November 2023).
- Report—Vehicles in Use, Europe 2023—ACEA—European Automobile Manufacturers’ Association. Available online: https://www.acea.auto/publication/report-vehicles-in-use-europe-2023/ (accessed on 11 November 2023).
- Green Finance Institute. Demystifying Utilisation; Green Finance Institute: London, UK, 2023. [Google Scholar]
- Hecht, C.; Das, S.; Bussar, C.; Sauer, D.U. Representative, empirical, real-world charging station usage characteristics and data in Germany. eTransportation 2020, 6, 100079. [Google Scholar] [CrossRef]
- Borlaug, B.; Yang, F.; Pritchard, E.; Wood, E.; Gonder, J. Public electric vehicle charging station utilization in the United States. Transp. Res. D Transp. Environ. 2023, 114, 103564. [Google Scholar] [CrossRef]
- Transport Office. Municipality of Turin (Turin, TO, Italy). Personal communication, 2023.
- VIRTA. EV Charger Utilization Rates of Five European Countries; VIRTA: San Francisco, CA, USA, 2023. [Google Scholar]
- Nicholas, M.; Wappelhorst, S. Preparing Italy’s Charging Infrastructure for Rapid Vehicle Electrification. 2022. Available online: https://www.governo.it/sites/governo.it/files/PNire.pdf (accessed on 9 January 2024).
- Nicholas, M.; Lutsey, N. Quantifying the Electric Vehicle Charging Infrastructure Gap in the United Kingdom. 2020. Available online: https://theicct.org/sites/default/files/publications/UK-charging-gap-082020.pdf (accessed on 9 January 2024).
- ev Industry Blog. Top Metrics to Measure the Performance of Your EV Charging Stations. 2023. Available online: https://evchargingsummit.com/blog/top-metrics-to-measure-the-performance-of-your-ev-charging-stations/ (accessed on 9 January 2024).
- Fröde, P.; Lee, M.; Sahdev, S. Can Public EV-Fast Charging Stations Be Profitable in the United States? McKinsey & Company: Chicago, IL, USA, 2023. [Google Scholar]
- Automobil Club d’Italia. Annuario Statistico 2023; Automobil Club d’Italia: Rome, Italy, 2023. [Google Scholar]
- Mahlberg, J.A.; Desai, J.; Bullock, D.M. Evaluation of Electric Vehicle Charging Usage and Driver Activity. World Electr. Veh. J. 2023, 14, 308. [Google Scholar] [CrossRef]
- Ulrich, L. Electric Cars and the Lack of Charging in Cities—The New York Times. Available online: https://www.nytimes.com/2020/04/16/business/electric-cars-cities-chargers.html (accessed on 9 November 2023).
- Akin, T. Tesla’s Advantage: EVs Cannot Succeed Without Developing Parallel Supercharging Networks|UC Davis. Available online: https://www.ucdavis.edu/curiosity/news/tesla%E2%80%99s-advantage-evs-cannot-succeed-without-developing-parallel-supercharging-networks (accessed on 9 November 2023).
- Tramway Routes in Europe—The Table of the Cities. Available online: https://www.lineetramtorino.com/Tabellaeng.php (accessed on 11 November 2023).
- Tram Bologna. 2023. Available online: https://www.trambologna.it (accessed on 19 November 2023).
- MOTUS-E. Le Infrastrutture di Ricarica ad uso Pubblico in Italia—Quarta Edizione; MOTUS-E: Rome, Italy, 2022. [Google Scholar]
- MOTUS-E. Le Infrastrutture di Ricarica Publica in Italia; MOTUS-E: Rome, Italy, 2019. [Google Scholar]
- MOTUS-E. Le Infrastrutture di Ricarica Pubblica in Italia—Seconda Edizione; MOTUS-E: Rome, Italy, 2020. [Google Scholar]
- MOTUS-E. Le Infrastrutture di Ricarcia Pubblica in Italia—Terza Edizione; MOTUS-E: Rome, Italy, 2021. [Google Scholar]
- Italy|European Alternative Fuels Observatory. Available online: https://alternative-fuels-observatory.ec.europa.eu/transport-mode/road/italy (accessed on 8 November 2023).
- Cui, S.; Ma, X.; Zhang, M.; Yu, B.; Yao, B. The parallel mobile charging service for free-floating shared electric vehicle clusters. Transp. Res. E Logist. Transp. Rev. 2022, 160, 102652. [Google Scholar] [CrossRef]
- Sintropher. Innovative Technologies for Light Rail and Tram: A European Reference Resource. Briefing Paper 5 Hybrid Battery/Supercapacitor-Hybrid Electric and Rapid Accumulator Systems. 2015. Available online: https://www.polisnetwork.eu/wp-content/uploads/2019/06/induction-system-2-finalpolis.pdf (accessed on 9 January 2024).
Disclaimer/Publisher’s Note: The statements, opinions and data contained in all publications are solely those of the individual author(s) and contributor(s) and not of MDPI and/or the editor(s). MDPI and/or the editor(s) disclaim responsibility for any injury to people or property resulting from any ideas, methods, instructions or products referred to in the content. |
© 2024 by the authors. Licensee MDPI, Basel, Switzerland. This article is an open access article distributed under the terms and conditions of the Creative Commons Attribution (CC BY) license (https://creativecommons.org/licenses/by/4.0/).