Abstract
In this paper, a software framework is presented through an application that is able to jointly optimize an electric motor and a gearbox for the design of a drive system for electric vehicles. The framework employs a global optimization method and uses both analytical and finite element method (FEM) models to evaluate the objective functions. The optimization process is supported by a statistical surrogate model, which allows a large reduction of runtime. An earlier version of this framework was only suitable for electric motor optimization. In the application presented in a previous paper, the motor of a belt-driven electric drive system was optimized. In this paper, the optimization of the same drive system is shown, but now with a combined optimization of a gear drive and motor. The objective functions of optimization are minimizing the total loss energy and the weight of the drive system. The optimization results are compared with previous results to demonstrate the further potential of joint optimization.
1. Introduction
The global market for electric vehicles is experiencing continuous growth on a yearly basis. This surge can be attributed to increasing consumer interest, advancements in technology, and a growing awareness of environmental sustainability. As governments worldwide implement policies to encourage the adoption of electric vehicles, the automotive industry is witnessing a significant shift towards cleaner and more sustainable transportation alternatives. This expansion in the electric vehicle market reflects a broader trend towards reducing carbon emissions and promoting eco-friendly mobility solutions across the globe (see [1,2]). The electric motors used in passenger cars are usually induction machines or permanent magnet synchronous machines (PMSMs), which are connected to the wheels via a gearbox. The types of gearboxes used in electric vehicles are discussed in detail in reference [3].
In reference [4], the optimization of the electric motor of the SZEnergy student team’s 2022 race car is presented. This is a team of students from Széchenyi István University competing in the Shell Eco-marathon energy efficiency competition with their own designed and built racing cars. The current drive system is shown in Figure 1. This drive system consists of a PMSM with a nominal power of 1 kW and a gear belt drive with a gear ratio of . The vehicle’s motor will be referred to as SZEvol hereafter. In this paper, an optimization of this drive system will be presented, but in this case with a gear drive. The aim is to jointly optimize the SZEvol and the geared drive coupled to it. The optimization is operating point-based, i.e., the optimization is performed on operating points consisting of the excepted torque—rotational speed—time weighting parameters prescribed on the basis of the predefinied duty cycle. The gearbox model is a single-stage gearbox with plastic gears.
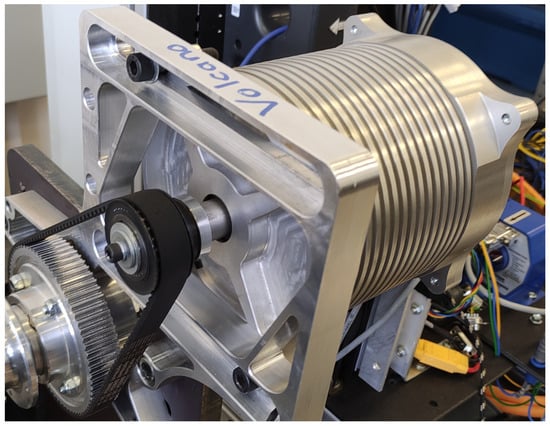
Figure 1.
The current drive system.
There are many different studies on the energy optimization of electric machines for electric vehicles (see, e.g., [5,6]), but the design of the gearbox also has an impact on the energy properties of the overall drive system. References [7,8] are both studies related to system-level optimization. This paper presents a joint optimization of an electric motor and its controller for driving an electric vehicle. The optimization procedure presented in this paper also includes a surrogate model.
The design and geometry of gearboxes play a key role in their energy efficiency, and the microgeometry of gearboxes not only affects energy loss, but is also a determinant of noise emissions (see [9]). In this case, we focus on energy and mass optimization, as these factors directly affect the efficiency of the drive system operation.
Reference [10] presents a multi-objective optimization of a CNC grinding machine with a focus on environmentally friendly, low-carbon manufacturing. This work illustrates the difficulties in multi-objective optimization, i.e., that the optimization does not result in a single optimum, but in a set of optima.
The optimization problems in the examples presented so far have all focused on either the optimization of the electric motor or the gearbox, and they have not been considered as a single system. However, the combined optimization of electric motor and gearbox provides the opportunity to investigate the effect of a change in gear ratio on the entire drive system. Reference [11] shows that different gear ratios are ideal for different operating conditions, so this should be taken into account for the operating-point-based optimization.
The main difficulty with joint optimization is that the efficiency of the gearbox decreases as the gear ratio increases (see [12]), while the efficiency of the electric motor increases (see [13]). In this paper, this contradiction ïs illustrated through a joint operating-point-based optimization of an electric motor and its coupled geared drive.
2. The Optimization Framework
The framework and its analytical mathematical models were developed in MATLAB R2021b software, while the FEM model was developed in Ansys Electronics 2019 R3 software.
The optimization framework is prepared to handle global optimization algorithms. These algorithms operate iteratively. The results evaluated in a given iteration are used to generate the individuals of the next iteration. The description of how the framework works is given through the demonstration of such an iteration. The Figure 2 shows an internal iteration of the optimization framework.
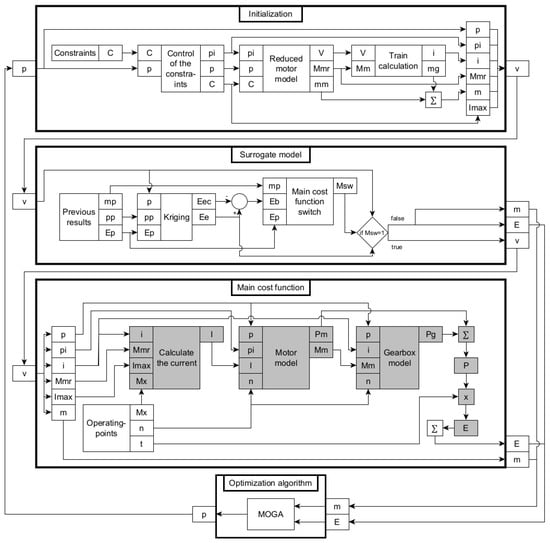
Figure 2.
The optimization framework.
During the optimization process, the optimization algorithm generates the next generation in each iteration. The individuals in the new generation are first subjected to constraint checking. Here, the gear ratio, the torque constant, and the motor mass are also determined. For the possible individuals, the surrogate model decides whether it is worthwhile to perform a detailed loss energy evaluation or whether it is sufficient to provide a much smaller computationally intensive estimate. If the estimate is sufficient, this value and the precisely determined mass are the result of the optimization algorithm, otherwise the main cost function with detailed evaluation provides the values of the objective functions. Table 1 provides a description of the notations shown in Figure 2.

Table 1.
Descriptions of the signs in Figure 2.
2.1. The Optimization Algorithm
The optimization framework currently optimizes using an evolutionary algorithm with the multi-objective genetic algorithm (MOGA) built into MATLAB software. Due to the modular design of the framework, it can be easily replaced by any other global optimization algorithm.
The genetic algorithm (GA) is a component of evolutionary mathematical optimization, drawing its name from its resemblance to the principles of genetics, the study of heredity. In the human body, genes encapsulate the structural and functional information necessary for the production of proteins. These genes are passed down through generations, exhibiting hereditary traits as descendants inherit them from their parents. Genetic inheritance involves one-to-one transmission, crossbreeding, and mutation, resulting in descendants possessing unique traits alongside those inherited from their ancestors. The operation of genetic algorithms is rooted in this biological logic (see [14]).
If there are several objective functions to optimize, it is not always clear whether one is better than another. To simplify the task, a weighted average of the objective function values is often used, so that the original multi-objective optimization problem can be reduced to a single-objective optimization. In other approaches, individuals can be divided into two groups: dominated and non-dominated individuals. In a problem with multiple objective functions, an individual can only be clearly superior if all objective functions have values closer to the optimum. Individuals that have a clearly better individual are called dominated individuals, while those that do not are called non-dominated individuals. The front formed by the non-dominated individuals of the optimization in the multidimensional objective function space is called the pareto-optimal front. The elements of this front constitute the result of the optimization (see [15]).
2.2. The Initialization
The inputs to this module are the design variable vectors for the new generation of individuals (p) and constraints (C). The design variables are usually the geometric parameters of the motor and gearbox and the winding parameters. In addition, it is also possible to specify material properties as design variables. Constraints can be either linear or nonlinear. It is also possible to write nonlinear constraints that require FEM simulation. This is made possible by the reduced motor model, where a much shorter simulation than the detailed evaluation is usually sufficient to check the constraints, and other results, such as the mass of the motor, are easily available in advance.
As this framework is designed to optimize drive systems for electric vehicles, constraints include current and voltage limits for the vehicle’s batteries and motor controller, as well as the maximum rotational speed and torque excepted. The reduced motor model performs a transient simulation with current excitation at a constant rotational speed. The motor model will be described in detail later. The inputs to the model are the design variables, the maximum speed, and the current, and the output are the torque and the DC voltage. The last four are included in the constraints. The DC voltage is provided by Equations (1) and (2) for three-phase PMSMs (see [16]):
where , , and are the winding voltages.
where , , and are the current excitation; is the phase resistance; and , , and are the induced voltages. The induced voltages are calculated by Equation (3):
where , , and are the resulting fluxes of the coils associated with each phase.
The next step is to calculate the gearbox gear ratio. First, the gear ratio needed to produce the maximum torque excepted at maximum speed and maximum current excitation is calculated. In a further step, it is possible to refine this value using the gearbox model based on the exact loss energies of the gearbox. This step is not shown in detail in Figure 1, but the Train calculation model includes the gearbox model. The gearbox model will be described in detail later.
2.3. The Surrogate Model
The surrogate model can estimate the value of the objective functions. This is advantageous when the time excepted for a detailed evaluation of the objective function value is much greater than the time excepted for estimation. In this case, the kriging surrogate model is included in the optimization framework, but it can be easily replaced by other surrogate models.
Kriging is a statistical technique and regression method used mainly in environmental modeling, geostatistics, and approximate design problems. The aim of kriging is to provide an estimate of the value of a given variable at a given spatial point, based solely on available data. The basis of kriging is the use of covariance functions and variograms found in geostatistics. These statistical tools help to assess the spatial variability and the relationships of variables. Kriging uses previously collected data to estimate the value of a variable at a given point by spatial interpolation (see [17,18]).
The inputs to the model are the results of previous generations, the vector of design variables, and the vector v. Since the mass calculation has already been carried out for the reduced motor model and the train calculation model, only the loss energy is estimated (). If, based on the lower bound of the confidence interval of the estimation () and the calculated mass (m), the individual is not dominant, i.e., there is no previous individual with at least one lower objective function value, the main cost function with detailed evaluation is not executed (), and the objective function value is the estimated loss energy (). Otherwise, the main cost function will calculate the value of the objective functions.
2.4. The Main Cost Function
The main cost function performs the detailed evaluation of the objective functions that were not evaluated during initialization. These are typically quantities that require longer FEM simulations, in this case, the loss energy of the motor. The inputs to this module are the vector v and the parameters associated with the operating points. Since the optimization usually involves several operating points, the internal structure is iterative. The boxes in gray are run for each operating point separately.
Since the inputs to the motor model are rotational speed and excitation current amplitude and the working point parameters are rotational speed and expected torque, a current calculation must first be made. In constant speed transient simulations with current excitation, the torque output is proportional to the amplitude of the excitation, so the amplitude value required for the working point can be easily determined from the results obtained when checking the constraints using the (4) relationship.
where I is the excepted current amplitude, is the current amplitude used in the reduced motor model, is the expected torque at the working point, is torque calculated by the reduced motor model, and i is the gearbox ratio.
The motor model then receives as input the vector of design variables, the vector of implicit parameters, the current amplitude associated with the operating point, and the rotational speed associated with the operating point.
The power losses (P) calculated here therefore only apply to the current operating point. After multiplication by time weighting, they become loss energy. The sum of the loss energies at the operating points (E—marked in gray) will be the objective function value calculated for the individual (E).
2.4.1. The Motor Model
The motor model consists of an FEM model and the corresponding evaluation code. The FEM model is built in Ansys Electronics 2019 R3 software, but it can be easily exchanged (e.g., for a JMAG model) like the other modules of the framework. The framework performs constant rotational speed transient simulations with current excitation on the model for the evaluations. The validation of the currently used motor model can be found in [4].
The total loss calculated for a motor is the sum of the iron and winding losses calculated at the different operating points. The iron losses can be calculated from Equation (5) (see [19]).
where is the iron loss, is the hysteresis loss coefficient, is the eddy–current loss coefficient, is the excess loss coefficient, B is the magnetic flux density, and f is the frequency of the winding currents.
The winding losses can be calculated from Equation (6).
where is the winding losses, I is the effective value of the excitation current, is the phase resistance, and is the number of phases.
2.4.2. The Gearbox Model
The optimization framework uses a single-speed plastic gearbox model, but this can easily be replaced by another model.
Small gears, which are usually subjected to high loads, cannot be manufactured from engineering plastics, because their strength is significantly lower than that of stainless steel gears. For this reason, they are mostly used in applications where their load capacity is still adequate and where their other advantages may be important. Such properties are, e.g., low weight, corrosion resistance, wear resistance, quiet running, economical production, etc. Therefore, the possibility of their application in small electric vehicles based on these properties was investigated. It is worth noting that plastic gears prefer a steady-state mode around a given working point, which is not typical for a vehicle application, as vehicles often accelerate and decelerate, and in the case of modern electric vehicles they can also recuperate, which also involves the transfer of motion and energy through the gearbox, but as these loads are generally lower than the maximum permissible load, they are also well suited to this application (see [20,21]).
The inputs to this model are the design variables, gear ratio, motor torque, and motor rotational speed.
Plastic gears are usually designed for the permissible power rating () based on the Lewis formula (see [22]). The formula can be given in the (7) form.
where m is module, y is teeth factor, b is the load-bearing tooth width, d is pitch circle (provided by the gear’s wheelbase and the gear ratio), n is rotational speed, is speed factor, is operating factor, and is bending stress in the gear tooth.
From relation (7), we can extract the minimum value of two parameters, among the parameters that are important for the optimization of the gearbox; one is the module and the other is the tooth width. Since the effect of the tooth width is small from an energy point of view, it is not worth choosing it as the main parameter. Besides the module, it is the gear ratio that has a major impact on the efficiency of the gearbox, typically such that the lower the gear ratio, the better the efficiency. This implies that drive systems with lower ratios will typically have lower loss energy of the gearbox.
Accurate determination of gear losses is a complex task, requiring in-depth knowledge of structural, mechanical, geometrical, tribological, and thermal properties. Most of the losses are due to friction of the associated gear teeth, but bearing friction can also be significant. For high-speed gearboxes, losses due to oil mixing, seal friction, and air turbulence must also be taken into account. At low speeds and a low load torque, sliding friction losses dominate gearbox power losses, while at higher speeds gear rolling losses and bearing losses become more significant. In addition, it can be concluded that, at high speed operation, the windage loss of the gearbox also increases significantly (see [23]). The total power loss of the gearbox can be described by (8).
where is the loss power of the gearbox, is the tooth friction loss, is the rolling resistance loss, is the seal friction loss, is the oil friction loss, is the windage loss, and is the losses from the bearings.
Tooth friction loss is a load loss due to friction in the tooth contact. To calculate this, the coefficient of tooth friction is needed, which is determined empirically or by measurement. Determining the coefficient of tooth friction is not simple, as it is influenced by the properties of the lubricant, the lubrication method, the material and design of the gears, the surface condition, surface roughness, operating conditions, load, speed, and temperature. The power loss due to tooth friction can be described by relation (9) (see [24]).
where is the input power, is the constant coefficient of friction, and is the gear loss factor.
The rolling loss of the gear is usually negligible among the losses, so it is neglected in the model used.
The calculation of the seal friction loss can be properly calculated by knowing the seal design of the gearbox, but since this is not known at the pre-design stage, an estimator (10) is used in the model to describe this loss shape (see [25]).
where is the diameter of the axis and is the rotational speed.
Oil friction loss occurs when gears are running in oil. At low speeds, the rotating gears at the bottom of the housing, which are in contact with the oil, are subjected to shearing stresses on the fluid. At higher speeds, the centrifugal force forces the oil against the walls of the housing, changing the depth of gear meshing and hence the lubrication quality, and causing fluid flow losses in the gearbox. Since the gearbox models used in this paper are grease lubricated, this type of loss does not occur in the present application.
The windage loss is typical at high speeds and is completely independent of the transmitted load. The main influences on this form of loss are the geometry of the gears, the viscosity of the lubricant, and the peripheral speed of the gears. The loss of power due to air swirl can be described by relationship (11) (see [26]).
where is the windage loss of the driving gear and is the windage loss of the driven gear. These can be calculated from relationships (12) and (13).
where b is the width of the gear, n is the rotational speed of the gear, i is the gear ratio, d is the diameter of the pitch circle, and is the dynamical viscosity.
Rolling bearings are usually used in the gearboxes of electric vehicles. They are less sensitive to continuous lubrication failure and have good efficiency. A wide range of relationships are used to calculate bearing friction. The calculation method for the model used in this paper, defined by SKF, can be described by relation (14) (see [27]).
where is the angular velocity of the bearing, is the inlet shear heating reduction factor, is the kinematic replenishment/starvation reduction factor, is the rolling friction torque, is the sliding friction torque, is the seal friction torque, and is the drag losses torque.
3. The Application
In this application, the optimization of the propulsion system of the 2022 competition vehicle of the SZEnergy student team of the Széchényi István University is presented. For a detailed description of the vehicle, see [4,28]. This drive system consists of a PMSM (SZEvol) with a rated power of 1 kW and a gear belt drive with a gear ratio. The application presented in [4] shows the optimization of the motor for this drive system. There, the efficiency of the gearbox was set to for all operating conditions based on the manufacturer’s data. In the previous paper, the efficiency of the motor controller was . In this paper, the detailed efficiency fields of the drive systems are not considered, and therefore the efficiency of the motor controller is not taken into account. Only the loss energies of the motor and the gearbox are considered.
3.1. The Objective Functions
The objective functions in this application are the same as those presented in the multi-objective optimization application presented in [4], i.e., minimizing loss energy and mass. Of course, the number and type of objective functions can be easily changed, but it must be taken into account that increasing the number of objective functions drastically increases the complexity of the optimization problem.
3.2. The Design Variables
The design variables were all geometric variables, except for the number of turns. For comparison, the design variables for the electric motor model are the same as in [4]. The design variables are shown in Figure 3 and Table 2.
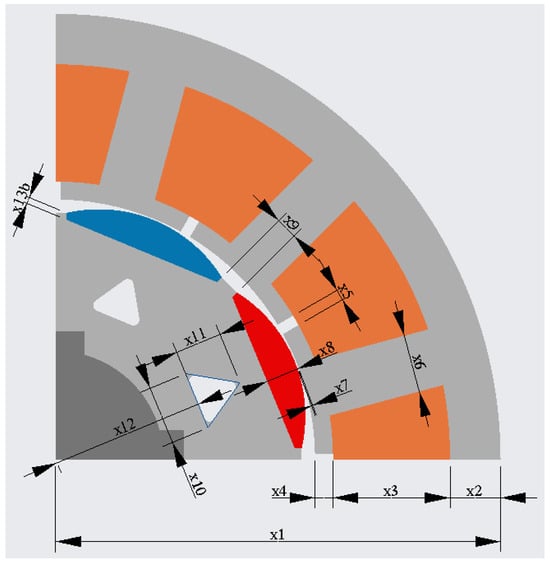
Figure 3.
Cross-section of SZEvol with the geometrical design variables of the motor [4].
Table 2.
Design variables.
3.3. The Operating Points
The parameters of the operating points are shown in Table 3.
Table 3.
Operating points.
The time weights can be used to weight the operating points. This can be used to interpret the loss energies on the duty cycle reduced to operating points. These values are defined in more detail in [4].
3.4. The Constraints
The optimization problem contains two linear and two nonlinear geometric constraints, which are:
where is the number of poles, is the number of parallel wires, is the diameter of the envelope of the magnets, and is the inner radius of the stator minus the air gap. Constraint (15) specifies the minimum distance between the magnets and the rotor cuts, constraint (16) prevents the rotor and stator from crossing, constraint (17) specifies the minimum winding requirements, and constraint (18) ensures the correct shape of the magnets.
In addition to these, there were three other nonlinear constraints:
where V is the DC voltage, is the maximum DC voltage (48 V), and i is the gear ratio.
3.5. The Parameters of the Motor and the Gearbox Model
The electric motor model is a PMSM with 4 pole pairs, 12 slots, and an internal rotor. The material of the magnets is neodymium (NdFe35), the winding is copper, and the stator and rotor are plated iron (M19_29G). These match the material properties of SZEvol. The FEM model is shown in Figure 3. The parameters for SZEvol are shown in Table 2.
The gearbox model is the single-stage gearbox with plastic gears presented earlier. The gear ratio can be varied between and 6. The tooth width is 20 mm and the cylinder helix angle is 25°.
4. Results and Discussion
The results presented in [4] only include the motor mass. In the figures showing the results, the green × indicates the values of the SZEvol motor. Figure 4 shows these results, with the addition of the mass of the gear belt drive, which is 352 g. Figure 5 shows a magnification of the region highlighted in the green box in Figure 4.
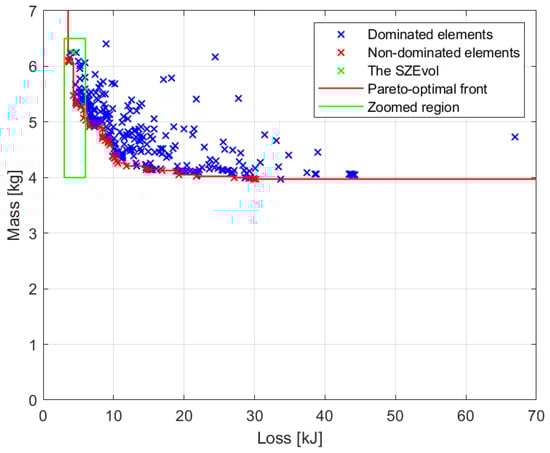
Figure 4.
Results of electric motor optimization [4].
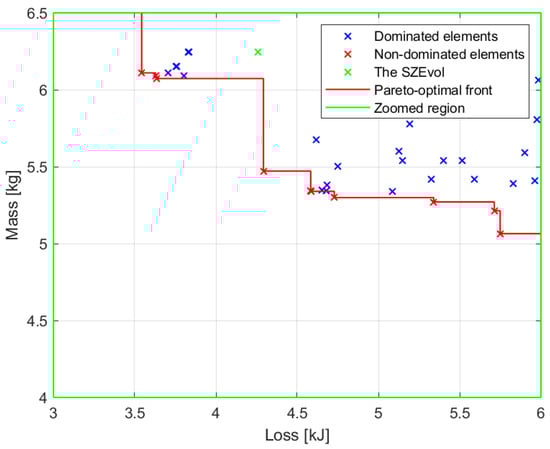
Figure 5.
Zoomed region of Figure 4 [4].
Figure 6 shows the results of the joint optimization of the electric motor and the gear drive. Figure 7 shows a magnification of the region highlighted in the green box in Figure 6.
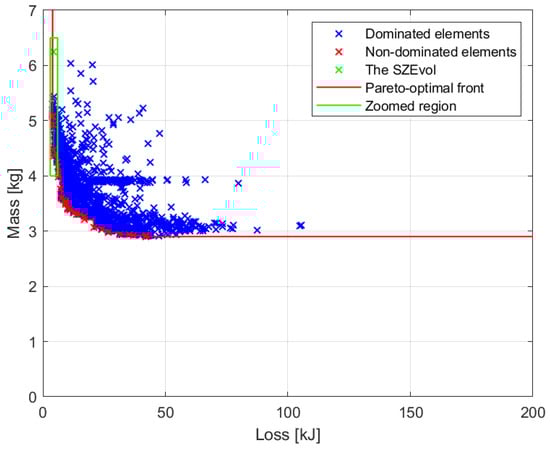
Figure 6.
Results of the joint optimization of the electric motor and the gearbox.
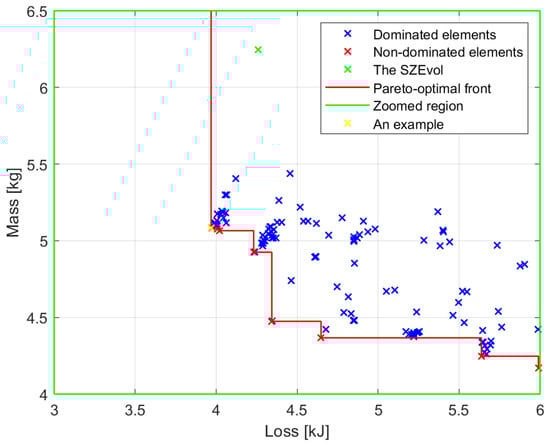
Figure 7.
Zoomed region of Figure 6.
An element of the pareto-optimal front is marked in yellow in Figure 7. This drive system design is superior in all aspects to the current SZEvol drive system and is the solution with the lowest energy dissipation for the optimization. It has been highlighted only as an example to show detailed results, since all elements of the pareto-optimal front are solutions to the optimization problem, but in this example this is considered the optimum. Figure 8 shows the detailed results of this particular case.
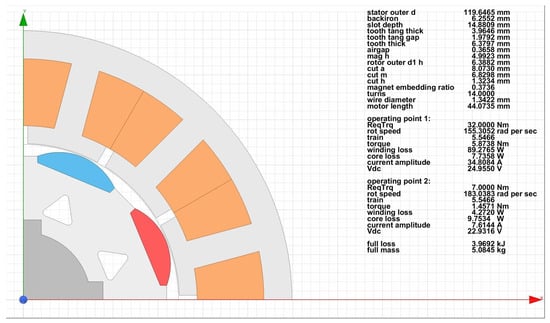
Figure 8.
An example of non-dominated elements.
This solution is able to operate with less loss energy at the designated operating points than the currently used drive system, while weighing less.
The results show that, although there were better results in terms of energy dissipation with the original gear belt drive system, in terms of mass, much more favorable drive system designs were obtained, and the relevant section of the pareto-optimal front in the vicinity of the SZEvol contains much more favorable solutions overall. It can be pointed out that the drive system optimized in coordination with the geared gearbox is better than the results of the previous optimization, so it is worthwhile to perform this type of optimization, either with gear belt gearbox or with other types of gearboxes (ball-row, planetary, etc.).
The results presented in [4] showed that single-objective optimization was more appropriate in that case. The reason for this was that the transmission ratio of the drive system was constant. However, in the optimization presented in this paper the gear ratio was also an indirect design variable, and therefore motors with lower mass and loss energies at higher speeds were included in the optimal solutions. Although the loss energy and mass of the gearboxes increased with the gear ratio, good results were obtained when considering the complete drive systems.
4.1. Correlation between Gear Ratio and Objective Function Values
In this section, the effect of the gear ratio on the losses of the gearbox and the losses of the overall drive system is discussed. In the description of the gearbox model, it is stated that the gear ratio has a major impact on the efficiency of the gearbox, typically such that the lower the gear ratio, the better the efficiency. Figure 9 shows that this claim is supported by the optimization results. Here, the gearbox loss energies of the individuals evaluated in detail are shown as a function of gear ratio.
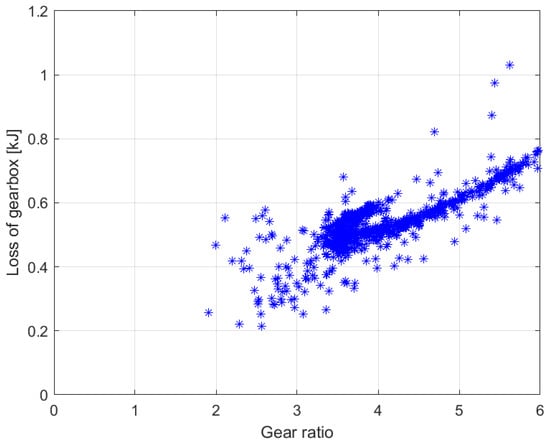
Figure 9.
Gearbox loss energies of the individuals evaluated in detail are shown as a function of gear ratio.
The efficiency of an electric motor increases at higher rotational speeds, i.e., at higher gear ratios. This has a greater impact on the overall drive system, which is why solutions with lower loss energy have higher gear ratios in the optimization. This is supported by the results shown in Figure 10. Here, the individuals are plotted in a similar way to Figure 6. Individuals marked in black have a gear ratio greater than 5, those marked in blue between 4 and 5, those marked in red between 3 and 4, those marked in green between 2 and 3, and those marked in yellow below 2. It can be seen that increasing the gear ratio also increases the efficiency of the drive system. In these cases, of course, the increased gear mass also increases the weight of the overall drivetrain, but this is more noticeable only in solutions close to the pareto-optimal front.
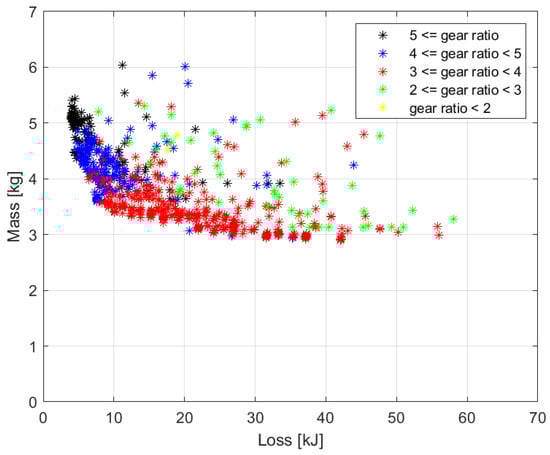
Figure 10.
Optimization results as a function of gear ratio.
In the segment highlighted in Figure 7, the gear ratios are always above 4. The correlation analysis showed that the gear ratio currently used in the SZEvol drive system was dominated by higher values in the highlighted part of the pareto-optimal front in Figure 7. This suggests that even if the gear belt drive is retained, the efficiency of the system could be increased by increasing the gear ratio and optimizing the motor design for this change.
4.2. The Statistics of the Optimization
The details of the workstation running the optimization are shown in Table 4.
Table 4.
Details of the workstation running the optimization.
During optimization, each evaluation runs on a single processor core, so eight evaluations can run simultaneously. The average time per evaluation is 5 min. During the optimization, 49 generations were run in addition to the initial generation 0. A total of 1675 evaluations were performed, of which only 956 required a detailed evaluation. In the remaining 719 cases, the kriging surrogate model estimates were used, so that a detailed evaluation was necessary in only of the cases. Figure 11 shows the efficiency of kriging from generation to generation.
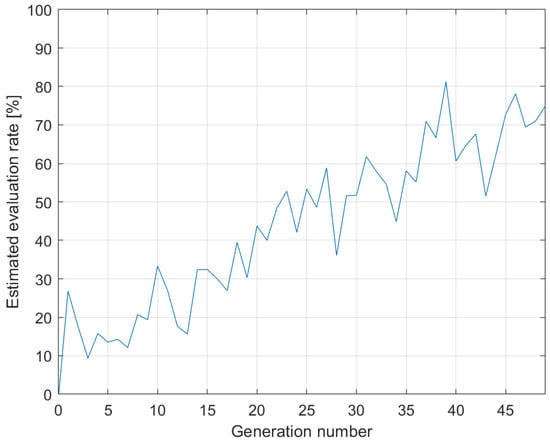
Figure 11.
Efficiency of kriging from generation to generation.
5. Conclusions
In this paper, a multi-objective, work-point-based optimization of the drive system, i.e., the electric motor and the gearbox, of an energy-efficient racing vehicle is presented. Although the gear ratio of the gearbox was only an indirect parameter of the optimization, it is clear that increasing the gear ratio caused an increase in the losses of the gearbox, while decreasing the losses of the electric motor. This discrepancy cannot be properly addressed if the motor and the gearbox are optimized separately. The presented optimization framework, which is suitable for the joint optimization of the electric motor and the gearbox, provides a solution. The results show that, in this case, increasing the gear ratio of the current drive system leads to an increase in the efficiency of the overall drive system if the drive system is optimized as a whole.
Based on these results, it can be argued that optimizing the electric motor and the gearbox together can be more efficient than optimizing the components separately, since the ratio fundamentally changes the energy efficiency of each component.
Author Contributions
Conceptualization, visualization writing—draft preparation, methodology, validation, and formal analysis, G.I.; the model of the gearbox and all descriptions related to the gearbox, J.P. All authors have read and agreed to the published version of the manuscript.
Funding
The research was supported by the European Union within the framework of the National Laboratory for Autonomous Systems (RRF-2.3.1-21-2022-00002).
Institutional Review Board Statement
Not applicable.
Informed Consent Statement
Not applicable.
Data Availability Statement
Data are contained within the article.
Acknowledgments
The authors also recognize the contribution of the SZEnergy Team, who contributed internal telemetry data, photos, and support throughout the tests.
Conflicts of Interest
The authors declare no conflicts of interest.
Abbreviations
The following abbreviations are used in this manuscript:
| DC | Direct Current |
| FEM | Finite Element Method |
| MOGA | Multi-Objective Genetic Algorithm |
| PMSM | Permanent Magnet Synchronous Machine |
References
- Corradi, C.; Sica, E.; Morone, P. What drives electric vehicle adoption? Insights from a systematic review on European transport actors and behaviours. Energy Res. Soc. Sci. 2023, 95, 102908. [Google Scholar] [CrossRef]
- Austmann, L.M. Drivers of the electric vehicle market: A systematic literature review of empirical studies. Financ. Res. Lett. 2021, 41, 101846. [Google Scholar] [CrossRef]
- Rimpas, D.; Chalkiadakis, P. Electric vehicle transmission types and setups: A general review. Int. J. Electr. Hybrid Veh. (IJEHV) 2021, 13, 38–56. [Google Scholar] [CrossRef]
- Istenes, G.; Pusztai, Z.; Kőrös, P.; Horváth, Z.; Friedler, F. Kriging-assisted multi-objective optimization framework for electric motors using predetermined driving strategy. Energies 2023, 16, 4713. [Google Scholar] [CrossRef]
- Das, S.; Mondal, S.; Saha, S.; Sarkar, C. A GSA Based Torque and LossOptimisation of an Induction Motor. Int. J. Adv. Res. Electr. 2013, 2, 3717–3725. [Google Scholar]
- Sun, I.; Shi, Z.; Cai, Y.; Lei, G.; Guo, Y.; Zhu, J. Driving-Cycle-Oriented Design Optimization of a Permanent Magnet Hub Motor Drive System for a Four-Wheel-Drive Electric Vehicle. IEEE Trans. Transp. Electrif. 2020, 6, 1115–1125. [Google Scholar] [CrossRef]
- Lei, G.; Wang, T.; Guo, Y.; Zhu, J.; Wang, S. System-Level Design Optimization Methods for Electrical Drive Systems: Deterministic Approach. IEEE Trans. Ind. Electron. 2014, 61, 6591–6602. [Google Scholar] [CrossRef]
- Lei, G.; Wang, T.; Zhu, J.; Guo, Y.; Wang, S. System-Level Design Optimization Method for Electrical Drive Systems–Robust Approach. IEEE Trans. Ind. Electron. 2015, 62, 4702–4713. [Google Scholar] [CrossRef]
- Qin, Z.; Wu, Y.T.; Lyu, S.K. A Review of Recent Advances in Design Optimization of Gearbox. Int. J. Precis. Eng. Manuf. 2018, 19, 1753–1762. [Google Scholar] [CrossRef]
- Wang, L.; Han, J.; Ma, F.; Li, X.; Wang, D. Accuracy design optimization of a CNC grinding machine towards low-carbon manufacturing. J. Clean. Prod. 2023, 406, 137100. [Google Scholar] [CrossRef]
- Ahssan, M.R.; Ektesabi, M.; Gorji, S. Gear Ratio Optimization along with a Novel Gearshift Scheduling Strategy for a Two-Speed Transmission System in Electric Vehicle. Energies 2020, 13, 5073. [Google Scholar] [CrossRef]
- Halim, M.F.M.A.; Sulaiman, E.; Othman, R.N.F.K.R. Gear Efficiency Estimation Method through Finite Element and Curve Fitting. Int. J. Appl. Electromagn. Mech. 2021, 66, 425–443. [Google Scholar] [CrossRef]
- Künzler, M.; Pflüger, R.; Lehmann, R.; Werner, Q. Dimensioning of a permanent magnet synchronous machine for electric vehicles according to performance and integration requirements. Automot. Engine Technol. 2022, 7, 97–104. [Google Scholar] [CrossRef]
- Kalyanmoy, D. Multi-Objective Optimization Using Evolutionary Algorithms; John Wiley & Sons, Inc.: New York, NY, USA, 2001; pp. 80–129. [Google Scholar]
- Goodarzi, E.; Ziaei, M.; Hosseinipour, E.Z. Introduction to Optimization Analysis in Hydrosystem Engineering; Springer: Berlin/Heidelberg, Germany, 2014; pp. 111–148. [Google Scholar]
- Filizadeh, S. Electric Machines and Drives; CRC Press: Boca Raton, FL, USA, 2013; pp. 146–153. [Google Scholar]
- Cressie, N. The origins of kriging. Math. Geol. 1990, 22, 239–252. [Google Scholar] [CrossRef]
- Nielsen, H.B.; Lophaven, S.N.; Søndergaard, J. DACE—A Matlab Kriging Toolbox; Informatics and Mathematical Modelling, Technical University of Denmark: Copenhagen, Denmark, 2002. [Google Scholar]
- Huynh, C.; Zheng, L.; Acharya, D. Losses in High Speed Permanent Magnet Machines Used in Microturbine Applications. J. Eng. Gas Turbines Power 2008, 131, 97–104. [Google Scholar]
- Reitschuster, S.; Illenberger, C.M.; Tobie, T.; Stahl, K. Application of high performance polymer gears in light urban electric vehicle powertrains. Forsch Ingenieurwes 2022, 86, 683–691. [Google Scholar] [CrossRef]
- Reitschuster, S.; Tobie, T.; Stahl, K. Experimental verification of high-performance polymer gears in an electric vehicle powertrain. Forsch Ingenieurwes 2023, 87, 881–890. [Google Scholar] [CrossRef]
- Prabhakaran, S.; Balaji, D.S.; Joel, C. Stress Analysis and Effect of Misalignment in Spur Gear. Int. J. Appl. Eng. Res. 2014, 9, 13061–13071. [Google Scholar]
- Polák, J.; Lakatos, I. Analysis of propulsion unit mathematical model. Mach. Des. 2015, 7, 137–140. [Google Scholar]
- Hoehn, B.R.; Michaelis, K.; Hinterstoißer, M. Optimization of gearbox efficiency. Gomabn 2009, 48, 462–480. [Google Scholar]
- Martins, R.; Seabra, J.; Seyfert, C.; Luther, R.; Igartua, A.; Brito, A. Power Loss in FZG gears lubricated with industrial gear oils: Biodegradable Ester vs. Mineral oil. Tribol. Interface Eng. Ser. 2005, 48, 421–430. [Google Scholar]
- Coy, J.J.; Townsend, D.P.; Zaretsky, E.V. Gearing, NASA Reference Publication 1152, AVSCOM Technical Report 84-C-15; NASA: Washington, DC, USA, 1985; p. 50.
- SKF Group. Catalogue 6000/I EN; SKF Group: Gothenburg, Sweden, 2008; pp. 96–99. [Google Scholar]
- Pusztai, Z.; Kőrös, P.; Szauter, F.; Friedler, F. Implementation of Optimized Regenerative Braking in Energy Efficient Driving Strategies. Energies 2023, 16, 2682. [Google Scholar] [CrossRef]
Disclaimer/Publisher’s Note: The statements, opinions and data contained in all publications are solely those of the individual author(s) and contributor(s) and not of MDPI and/or the editor(s). MDPI and/or the editor(s) disclaim responsibility for any injury to people or property resulting from any ideas, methods, instructions or products referred to in the content. |
© 2024 by the authors. Licensee MDPI, Basel, Switzerland. This article is an open access article distributed under the terms and conditions of the Creative Commons Attribution (CC BY) license (https://creativecommons.org/licenses/by/4.0/).