Article

Assessment of Energy Self-Sufficiency of Wastewater Treatment Plants—A Case Study from Poland

by
Adam Masłoń
1,*,
Joanna Czarnota
1,
Paulina Szczyrba
2,
Aleksandra Szaja
3,
Joanna Szulżyk-Cieplak
4 and
Grzegorz Łagód
3,*
1
Department of Environmental Engineering and Chemistry, Rzeszow University of Technology, Powstańców Warszawy 6, 35-959 Rzeszów, Poland
2
The Faculty of Civil and Environmental Engineering and Architecture, Rzeszow University of Technology, Poznańska 2 Street, 35-959 Rzeszów, Poland
3
Faculty of Environmental Engineering, Lublin University of Technology, Nadbystrzycka 40B, 20-618 Lublin, Poland
4
Faculty of Mathematics and Information Technology, Lublin University of Technology, Nadbystrzycka 38, 20-618 Lublin, Poland
*
Authors to whom correspondence should be addressed.
Energies 2024, 17(5), 1164; https://doi.org/10.3390/en17051164
Submission received: 5 February 2024 / Revised: 23 February 2024 / Accepted: 27 February 2024 / Published: 1 March 2024
(This article belongs to the Collection Feature Papers in Energy, Environment and Well-Being)

Abstract

:
Currently, one of the main goals is to make municipal wastewater treatment plants (WWTPs) energy-neutral. However, advanced wastewater treatments and sewage sludge processing are still classified as highly energy-intensive. In this study, the energy self-sufficiency potential assessment of the WWTP located in Krosno (Poland) was evaluated. Moreover, the possible paths for improving the energy balance of the analyzed facility are presented in this paper. The performed evaluation indicated that in 2016–2019, the energy consumption at WWTP Krosno varied from 0.25 to 0.71 kWh/m3 of wastewater (average 0.51 kWh/m3), and the highest energy utilization values in each year were recorded around the summer season. An analysis of the data showed that as the pollutant load flowing into the WWTP increased, its energy utilization decreased. Such results indicate that the treatment cost per cubic meter decreases as the load increases due to the capital cost being the same. The estimated self-sufficiency of the facility in the years analyzed was 50.5%. The average energy recovery from 1 m3 of wastewater was 0.27 kWh/m3, and the average energy recovery from 1 m3 of biogas was 1.54 kWh/m3. Since the energy balance of this wastewater treatment plant, determined primarily by the continuously increasing cost of energy purchases, has to be improved, two courses of action were identified that will allow for increasing self-sufficiency. The co-digestion strategy was indicated as the easiest solution to implement, given the on-going anaerobic stabilization of sewage sludge at this WWTP. Moreover, the possible co-substrates that can be obtained from local suppliers were indicated. The second course of action, which requires a thorough economic analysis, is sludge pre-treatment, which might improve sewage sludge properties, resulting in a more favorable biogas yield.

1. Introduction

Wastewater treatment plants (WWTPs) constitute facilities characterized by high energy utilization [1]. Traditionally, these objectives were designed to meet stringent requirements for the wastewater discharged to environment. At that time, no attention was paid to the significant energy consumption of the applied technologies [1,2]. However, geopolitical circumstances and the depletion of conventional fuels have recently necessitated the search for new solutions aimed at saving energy. It has been estimated that Europe’s energy use for wastewater treatment is responsible for over 1% of its total consumption [3]. Importantly, the energy demand will constantly increase, doubling by 2040 [4]. Energy-related expenses involve significant costs for WWTPs. Previous studies have shown that the energy expenditure accounts for over 60% of their total operating costs [5]. The high energy use of WWTPs is also related to the generation of greenhouse gas emissions (GHGs) that contribute to climate change. Therefore, new solutions are constantly being sought to improve energy consumption while ensuring the quality of service provided [4]. The first step enabling the achievement of the energy self-sufficiency of the WWTP is to determine the energy consumption of each stage of treatment. Generally, the energy requirements are strictly related to the adopted technology, which depends on the wastewater characteristics and effluent quality requirements. Other crucial factors are the WWTP capacity, its age, as well as the location of the facility.
In this study, an assessment of the energy self-sufficiency potential of a selected WWTP (Krosno, Poland) was conducted. The possibilities of improving the efficiency of biogas production for this facility were also identified. In addition, two concepts of the sludge treatment systems were proposed, in which actions were introduced to improve the energy self-sufficiency characterizing this wastewater treatment plant. Thus far, such multifaceted studies in relation to this facility have not been carried out. The proposed changes might be implemented into this WWPT, thus allowing us to achieve energy neutrality.

2. Energy Utilization and Energy Self-Sufficiency of Wastewater Treatment Plants

2.1. Energy Consumption Assessment of WWTPs

Previous studies have indicated that energy demand decreases with the increasing capacity of the WWTPs [6,7]. No less important are the knowledge and experience of technologists [8]. Therefore, the total specific energy consumption might vary in a wide range of 0.26 to 1.11 kWh/m3 [9,10]. The high values of this indicator are mainly related to significant load present in wastewater or discharging a significant share of the industrial wastewater. In turn, the lower values might be observed in less technologically advanced WWTPs.
Large municipal facilities involve primary, secondary, and sludge treatments. Additionally, some WWTPs include a tertiary stage [11,12]. The mechanical stage applies a simple unit of screening, grit, and grass removal as well as sedimentation. The first processes require low energy inputs, varied between 0.022 and 0.042 kWh/m3. Similarly, the sedimentation process demands only 0.043–0.07 kWh/m3 [13]. These requirements are related to the work of pumps, engines, or mechanical scrappers.
The biological step requires a much higher energy demand as compared to the primary one. At large municipal WWTPs, the dominant technology of this stage is the activated sludge process. Typically, the energy demand for this technology ranges between 0.30 and 0.65 kWh/m3. Higher values might be found when a nitrification process is adopted [7]. It should be pointed out that the aeration process might be responsible for 42 to even 70% of the total energy demand in a wastewater treatment plant [8]. In addition to the aeration process, a mixing of activated sludge in bioreactors as well as sludge recirculation also require higher energy inputs; these processes consume approx. 5–10% of the total energy demand at WWTPs [14]. Membrane bioreactors are also known as devices with a relatively high energy consumption of 0.33 kWh/m3 [4,15].
Sludge processing is also related to significant energy demand. In the case of the application of an anaerobic digestion process (AD), the high energy demand is related to the mixing and heating of the digesters. In this case, the specific electricity consumption might range from 0.38 to 0.48 kWh/m3. Despite the high value, it is still lower than in the case of aerobic stabilization; therein, this parameter might even exceed the value of 1.0 kWh/m3 [16]. The thickeners and centrifuges applied to sludge dewatering constitute a small share in energy consumption [4,17]. Generally, sludge processing might contribute from 5 to 31% of the total energy demand [8].
Many WWTPs apply a tertiary treatment to meet the stricter requirements relating to removing pollutants such as pathogens, micro plastic, and pharmaceuticals [18]. This step involves a range of physical and chemical processes, including advanced oxidation processes, filtration technologies, or adsorption [19]. These processes are recognized as generally more energy-intensive than primary and secondary treatments. However, they use energy in a more efficient way; therefore, they indicate decreased consumption of energy per treated volume or removed pollutant mass [20].

2.2. Solutions to Improve the Energy Self-Sufficiency Characterizing Wastewater Treatment Plants

Facilities in which the energy required for operation is produced at least 100% are indicated as energy self-sufficient; however, it is assumed that this energy is contained in sludge or wastewater processed with zero external energy input [21,22]. Data in the literature indicate that with available technological solutions, it is possible to make a WWTP completely self-sufficient in terms of energy. However, it should be noted that there is currently no stand-alone technology the application of which would enable a WWTP to achieve complete independence from the grid [8,23]. Achieving energy self-sufficiency for a WWTP requires a two-way approach, implemented by reducing the electricity consumption of the facility, while maintaining the required parameters of treated wastewater quality, and generating energy on its own, e.g., from renewable sources (Table 1). Simultaneously, the most effective solution will be the parallel implementation of the optimal measures for a given WWTP [23].
The introduction of appropriate technological modifications and operational strategies in the technological sequence of a WWTP will result in decreased energy consumption for wastewater treatment processes. Solutions for each WWTP should be selected individually, paying special attention to the technical capabilities of the facility, as well as making a thorough economic assessment of the project.
Referring to the first direction, the optimization of energy consumption reaching 10–20% can be achieved, i.e., by using highly efficient pumps and blowers equipped with frequency converters in the process of aeration and pumping of wastewater [14].
The second direction allowing for achieving the energy self-sufficiency of WWTPs is the improvement of the AD. According to estimates, this technology enables us to recover 40–80% of the chemical energy contained in the wastewater. Currently, the combined heat and energy generation using biogas produced via anaerobic digestion constitutes the predominant solution allowing for achieving WWTPs’ energy self-sufficiency [23,24,28]. However, only larger WWTPs involve the anaerobic sludge stabilization; the potential in question is held by less than 20% of WWTPs [23,29]. The factors that allow for increasing energy recovery from sludge include optimizing the design and operation of digesters. An adequate hydraulic retention time in the digesters will yield the maximum amount of biogas. Due to sludge rheology, it is crucial to ensure a constant supply of sludge to the digesters, as well as select a low-energy mixing system in the digesters. It is important to correctly select biogas tanks, heat pumps, and sizing motors in relation to the size of the digester to fully utilize the maximum energy potential of sludge [14,30,31]. Additionally, achieving improved biogas production, which translates into the increased energy efficiency of the treatment plant, is possible through the use of mechanical, chemical, biological, and thermal pre-treatments of sewage sludge prior to the AD [14,32,33]. The main goal of all the above-mentioned methods is improve the solubilization of the substrate, hence making it more biodegradable [33,34].
Moreover, the use of a co-digestion strategy, in which additional components are added to the main substrate, might lead to higher biogas production and, thus, energy recovery. In the case of sewage sludge, the most frequently applied substrates include some industrial residues, e.g., glycerin, organic fraction of municipal solid waste, as well as food waste [14,35,36]. Furthermore, the implementation of this method allows for the utilization of the unemployed potential of digesters that are often over dimensioned [37]. Another method to boost biogas production involves adding essential trace metals for the AD, e.g., nickel, iron, cobalt, selenium, iron, and molybdenum. In this case, co-supplementation enhances metabolic activity as well as facilitates syntrophic interactions between AD microbes [38].
Moreover, researchers’ attention is focused on biochar application in the AD; in this case, its use might eliminate the toxicity inhibition, improve the process stability, as well as increase methane yields [39]. Another factor is related to the application of high-efficiency cogeneration systems for electricity and heat production that enable the operator to achieve an energy self-sufficient WWTP [40]. The availability of other power generation technologies, such as those based on solar or wind energy (external sources, determined by climatic conditions), is a complementary solution and allows for full self-sufficiency for larger facilities, but also represents opportunities to improve the energy balance in smaller facilities [23]. Many scientists have indicated renewable energy generated from external sources of a WWTP site as methods allowing for achieving energy self-sufficiency of facilities, which could even become net energy producers [41,42,43].
Implementing renewable energy sources, such as wind turbines and photovoltaic cells, into the system allows for energy generation of 5–10% [44,45]. Another way of improving the energy balance in a wastewater treatment plant is the recovery of heat and mechanical energy using heat exchangers, water turbines, and heat pumps in the case of a favorable altitude system [46].
Energy consumption can also be optimized in terms of control of systems at the WWTP. Ongoing analyses of equipment operating parameters and technological processes allows for the optimization of energy efficiency [47]. Also, implementing energy-efficient technologies to remove nitrogen, such as the anammox process or deammonification, enables us to reduce the operating costs of the biological part of a WWTP or the treatment of a leachate from sludge dewatering [48,49]. Recently, novel promising approaches to energy generation have been proposed, e.g., a microbial electrolysis cell [50] or an aqueous-phase reforming process [51]. Such strategies can also contribute to achieving the energy self-sufficiency of many WWTPs.

3. Materials and Methods

3.1. Study Site

The mechanical–biological WWTP in Krosno (Podkarpackie Province, Poland) was commissioned in 1973, and several modernizations have been carried out. The designed average daily capacity for rain-free weather is Qav d = 35,410 m3/d, and the maximum daily capacity is Qd max = 52,610 m3/d (rainy weather). The Krosno wastewater treatment plant receives and treats domestic wastewater from residential and public buildings located in Krosno and its vicinity. The WWTP also receives industrial wastewaters from glassworks, car washes, and workshops, etc., which may contain particularly hazardous substances, but their quantity is relatively small. However, most of them are pre-treated in facilities prior to discharging into the WWTP in Krosno.
The plant consists of mechanical, biological, sludge, and biogas parts. The technological system of the Krosno WWTP consists of the following facilities and equipment: two mechanical belt-hook grids with a clearance of 6 mm; a wastewater pumping station with a capacity of 1000 m3/h; two two-chamber aerated horizontal–longitudinal sand traps with a mechanical sand scraper; and two horizontal primary settling tanks with a length of 42 m. Part of the primary sludge is subjected to hydrolysis (acidification) in order to enrich the wastewater with volatile fatty acids (VFAs) (Figure 1). This action is intended to increase the efficiency of the enhanced biological phosphorus removal process. The hydrolyzer operates cyclically, depending on the demand for VFAs. Moreover, the biological part of the described WWTP includes 2 activated sludge chambers with a plug flow, characterized by an active depth and volume of 4.6 m and 8496 m3, respectively. Each biological reactor consists of a predenitrification chamber (anoxic zone), a dephosphatation chamber (anaerobic zone), a denitrification chamber (anoxic zone), as well as a nitrification chamber (aerobic zone). Biological reactors cooperate with 2 secondary radial settling tanks with a diameter of 36 m (Figure 1). The denitrification process, carried out in the anoxic chamber, depending on the composition of the wastewater and the demand for organic carbon, is supported by the dosage of methanol (the dose depends on the COD in the wastewater). In addition, biological removal of phosphorus from wastewater is supported by chemical coagulant (PIX 113). The applied wastewater treatment system enables an integrated removal of phosphorus, nitrogen, and carbon compounds.
In the sludge process line, primary sludge is thickened in a gravity thickener, and excess sludge is thickened in a mechanical belt thickener. Then, thickened sludge is directed to digesters with a capacity of 2500 m3 each. A retention tank with a capacity of 585 m3 is used to store stabilized sludge. Subsequently, sludge is dewatered on a belt press, where the solid content increases to 15.5–25.7%. The next step includes hygienization and drying using a solar dryer. The processed sludge is stored in a landfill and ultimately directed toward agricultural use (Figure 2).
The biogas generated in the anaerobic reactors is captured by means of gauge bells and routed through a pipeline to the biogas desulfurization unit. Cogeneration modules (CHP—Combined Heat and Power) constitute the biogas receiver. Two MTU-manufactured generators are used to carry out CHP. Each module consists of a spark-ignition reciprocating engine coupled to a synchronous generator. The basic technical parameters of the CHP modules are shown in Table 2. The surplus biogas that cannot be consumed in the CHP unit goes to gas boilers, which additionally supply thermal energy to the wastewater treatment plant equipment and buildings. The boiler plant is equipped with two boilers with a thermal power of 400 kW.

3.2. Methodology for Calculating Individual Parameters

The operating data obtained for the period of 2016–2019 were used to perform the energy profile analysis for the Krosno WWTP. On the basis of the obtained data, it was possible to identify the consumption of electricity and evaluate the energy balance of the wastewater treatment plant. The indicators of energy performance concerning wastewater treatment which were used in this study included the following:
EI—electricity consumption indicator [kWh per m3 wastewater],
EIR—electric energy recovery indicator [kWh per m3 wastewater].
The energy recovery indicators are used to establish the heat or electricity generation in the CHP system, accounting for the daily inflow of wastewater as well as biogas and sewage sludge production in the course of wastewater treatment.
Electricity consumption (consumption of electric energy)—EI—is the parameter most frequently used for evaluating the energy effectiveness of wastewater treatment plants; it concerns the inflow (kWh per m3 wastewater), often called referred to as “specific energy consumption” [53]. Electricity consumption was also determined in relation to the BOD5-load flowing into the WWTP [EIL, kWh/BOD5]. For a comprehensive assessment of electricity production, the rate at which biogas is produced from sewage sludge Bj [m3/kg TS] and the energy potential of biogas EPB [kWh per Nm3 of biogas] were determined.

4. Results and Discussion

The assessment of the WWTP energy utilization is related to the analysis of its energy balance. The adopted technology at WWTP is related to the composition and amount of wastewater flowing into the facility, and, hence, affects the amount of sludge generated, which ultimately determines the energy utilization of the facility. Basic descriptive statistics for the total amount of wastewater and its quality parameters in 2016–2019 are presented in Table 3. In the analyzed period, the recorded daily flow Qav d represented, on average, 61.4% of the nominal load.
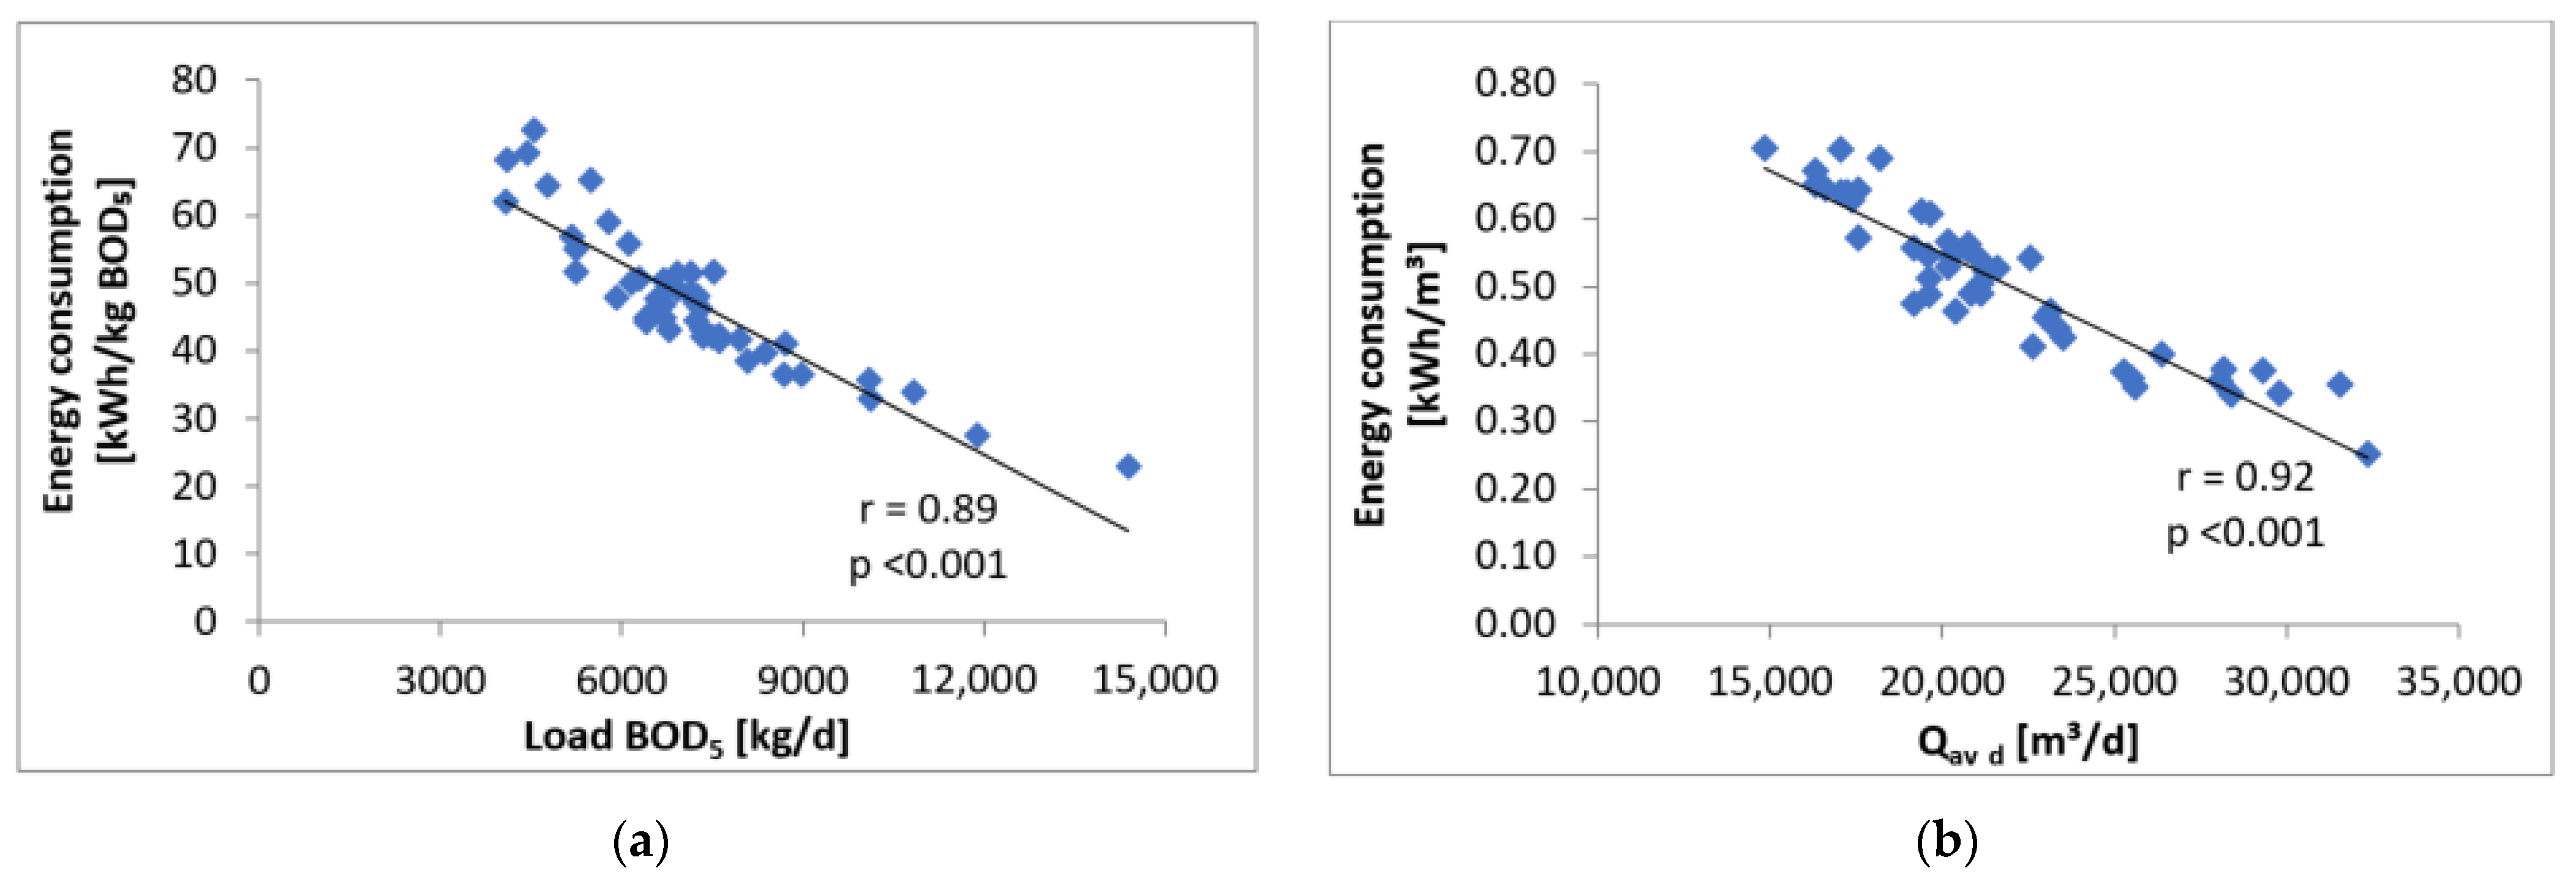
Figure 3a shows that there is a strong relationship between the load flowing into the treatment plant and its energy utilization. It can be concluded that with the increasing inflow pollutant load, the energy utilization reduces, indicating that the technological processes of wastewater treatment become more economic at high pollutant loads. The relationship between energy utilization and influent organic pollutant load shows that the correlation coefficient is at r = 0.89 (p < 0.001). A statistically large relationship between energy consumption and the load of pollutant load of wastewater flowing into the treatment plant was also reported by Masłoń [54] for the Krzeczowice WWTP (Poland), obtaining a coefficient of correlation r = 0.90 (p < 0.01). However, it should be noted that the analysis carried out ignored the effect of the loads of other pollutants, so the values obtained should be considered as the overall significance of a given factor translated into electricity consumption. A similar observation was also observed in a study conducted by He et al. and Bagherzadeh et al. [55,56].
The analysis of energy consumption to an average of 24 h wastewater flow clearly shows that smaller wastewater inflow to WWTP translates into a higher energy utilization of the facility (Figure 3b). A significant relationship was found between the average daily wastewater flow and electricity consumption—the coefficient of correlation was r = 0.92 (p < 0.001).
A thorough energy utilization analysis of the Krosno WWTP in 2016–2019 showed that the energy efficiency of the plant, in terms of electricity consumed for treating 1 m3 of wastewater, was inversely proportional to the volume of daily flow. The coefficient of energy consumption for wastewater treatment was 0.48 kWh/m3, while the average coefficient of energy consumption in relation to the pollutant load indicated 1.63 kWh/kg BOD5. Comparing the obtained results with the data of 148 different wastewater treatment plants, for which the average coefficient of energy consumption per m3 of wastewater (0.82 kWh/m3) and the average coefficient of energy consumption related to the BOD5 load (2.05 kWh/kg BOD5) were calculated, it may be observed that the findings obtained from the data analysis for the Krosno WWTP do not exceed the average parameters in the literature [57]. Comparing the results with the findings reported in the literature, it may be stated that the energy utilization of the Krosno WWTP is at a moderate level. In selected Polish wastewater treatment plants, energy utilization is as follows: the Rzeszów WWTP—0.87 kWh/m3 and 1.07 to 1.7 kWh/BOD5, the Opole WWTP—0.72 kWh/m3 and 1.66 kWh/BOD5, the Iława WWTP—1.06 kWh/m3 and 1.46 kWh/kg BOD [53,58,59,60].
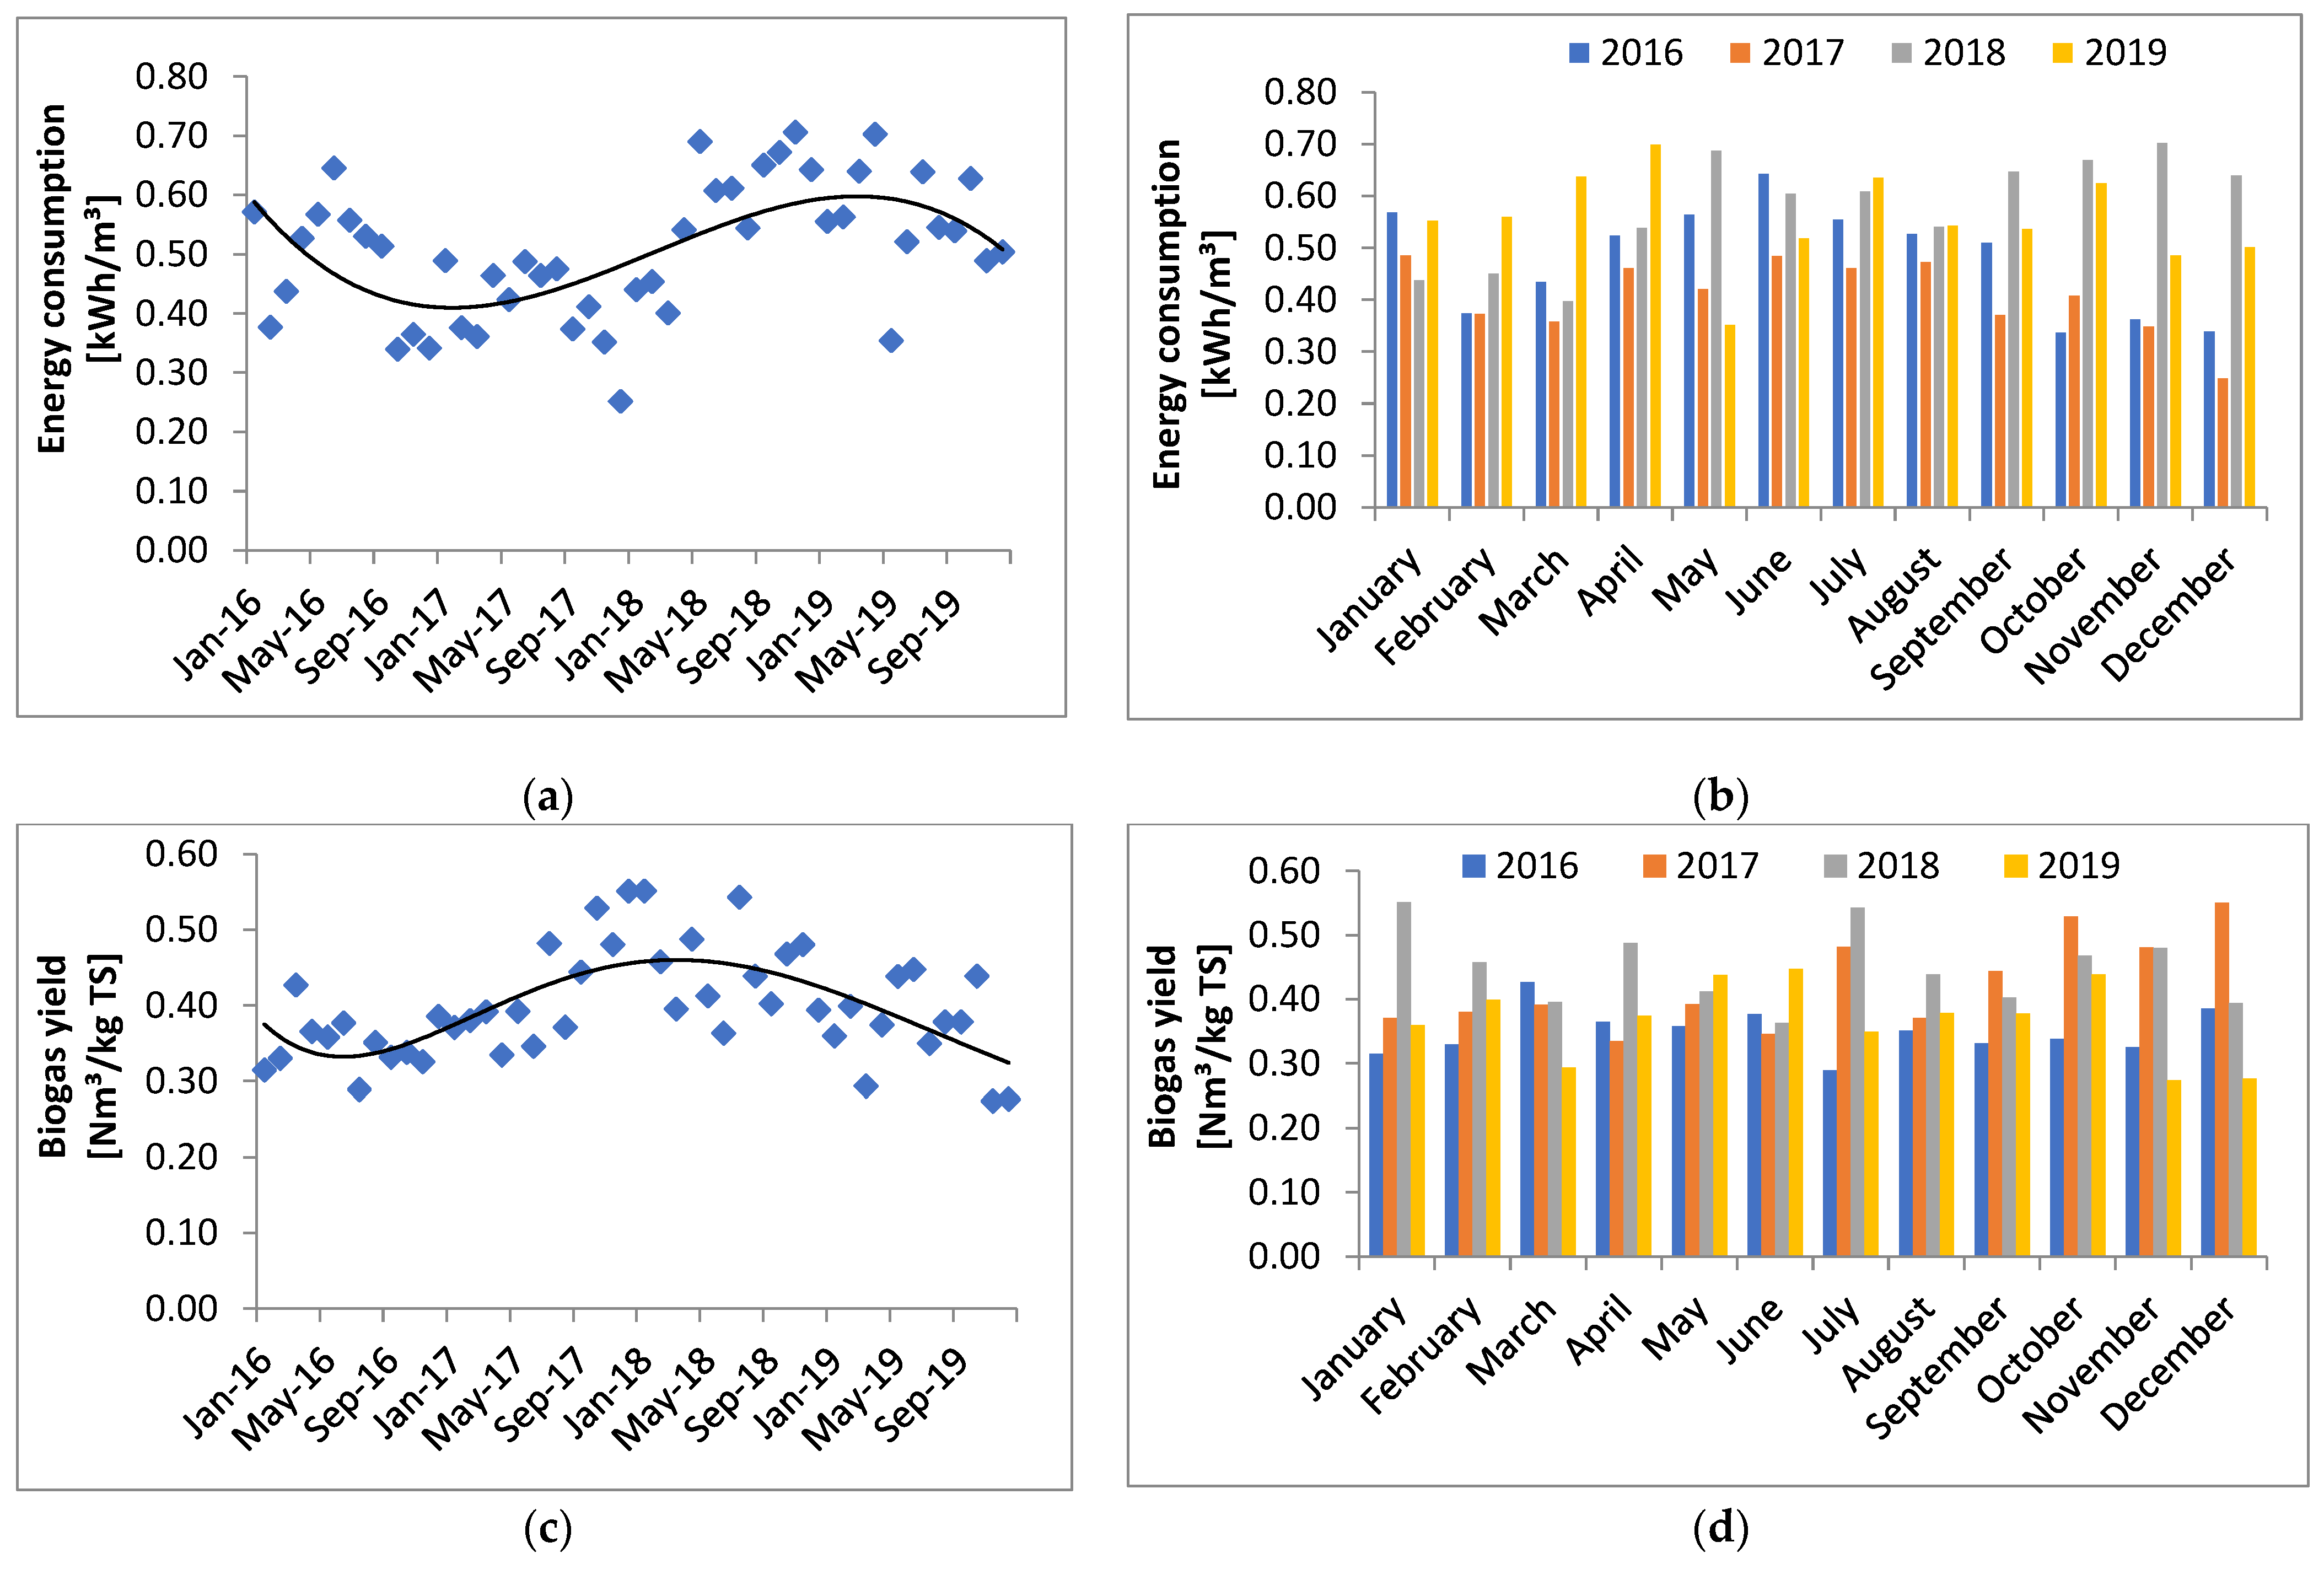
Over the 2016–2019 period, a slight upward regression in energy consumption was recorded at the subject WWTP (Figure 4a), and the highest energy utilization values in each year were recorded around the summer season (Figure 4b), that is, directly inversely proportional to increased wastewater flow. Significant fluctuations were observed, ranging from 0.25 to 0.71 kWh/m3, with a mean of 0.51 kWh/m3, and a standard deviation of 0.11 kWh/m3. Generally, this parameter varies significantly both within the country and among different countries [61]. However, one of the most important factors that affected its value was the concentration of pollutants in the influents of WWTPs. The highest value of energy consumption could be observed in the cases of WWTPs that receive a significant amount of industrial wastewater. In the USA, this parameter varied in a wide range of 0.09–1.12 kWh/m3; in Germany a lower value was found, estimated at the level of 0.3–0.43 kWh/m3. Meanwhile, the consumption of energy in China is 0.13–0.50 kWh/m3. Such low values of this parameter in China or Germany are related to the fact that most industries in those countries have their own WWTPs that pretreat wastewater prior to its discharge into municipal WWTPs [62].
The analysis corresponding to biogas production from 1 m3 of sewage sludge entering the digesters showed that the Krosno WWTP is capable of receiving between 7.37 and 11.13 Nm3 of biogas. Nevertheless, one should remember that the ratio of biogas production in relation to total solid content (TS) is a more meaningful indicator. The biogas yield expressed in Nm3 biogas/kg TS over the years analyzed varied in the range of 0.27–0.55 m3/kg TS (Figure 4c). On average, about 0.40 Nm3 of biogas was obtained from one kilogram of sludge total solids (the dry weight of the sludge fluctuated in the range of 1.62 to 2.95%). Comparing the obtained values to the results of the analysis of biogas management in Rzeszow, similar values can be observed [60].
From January 2016, a slight upward regression can be observed. The highest increases were recorded from mid-2017 to the spring of 2018, June to July and September to October in 2018. The highest value of biogas Nm3 converted to kg TS was obtained in December 2017 and January 2018—0.55 Nm3/kg TS (Figure 4d).
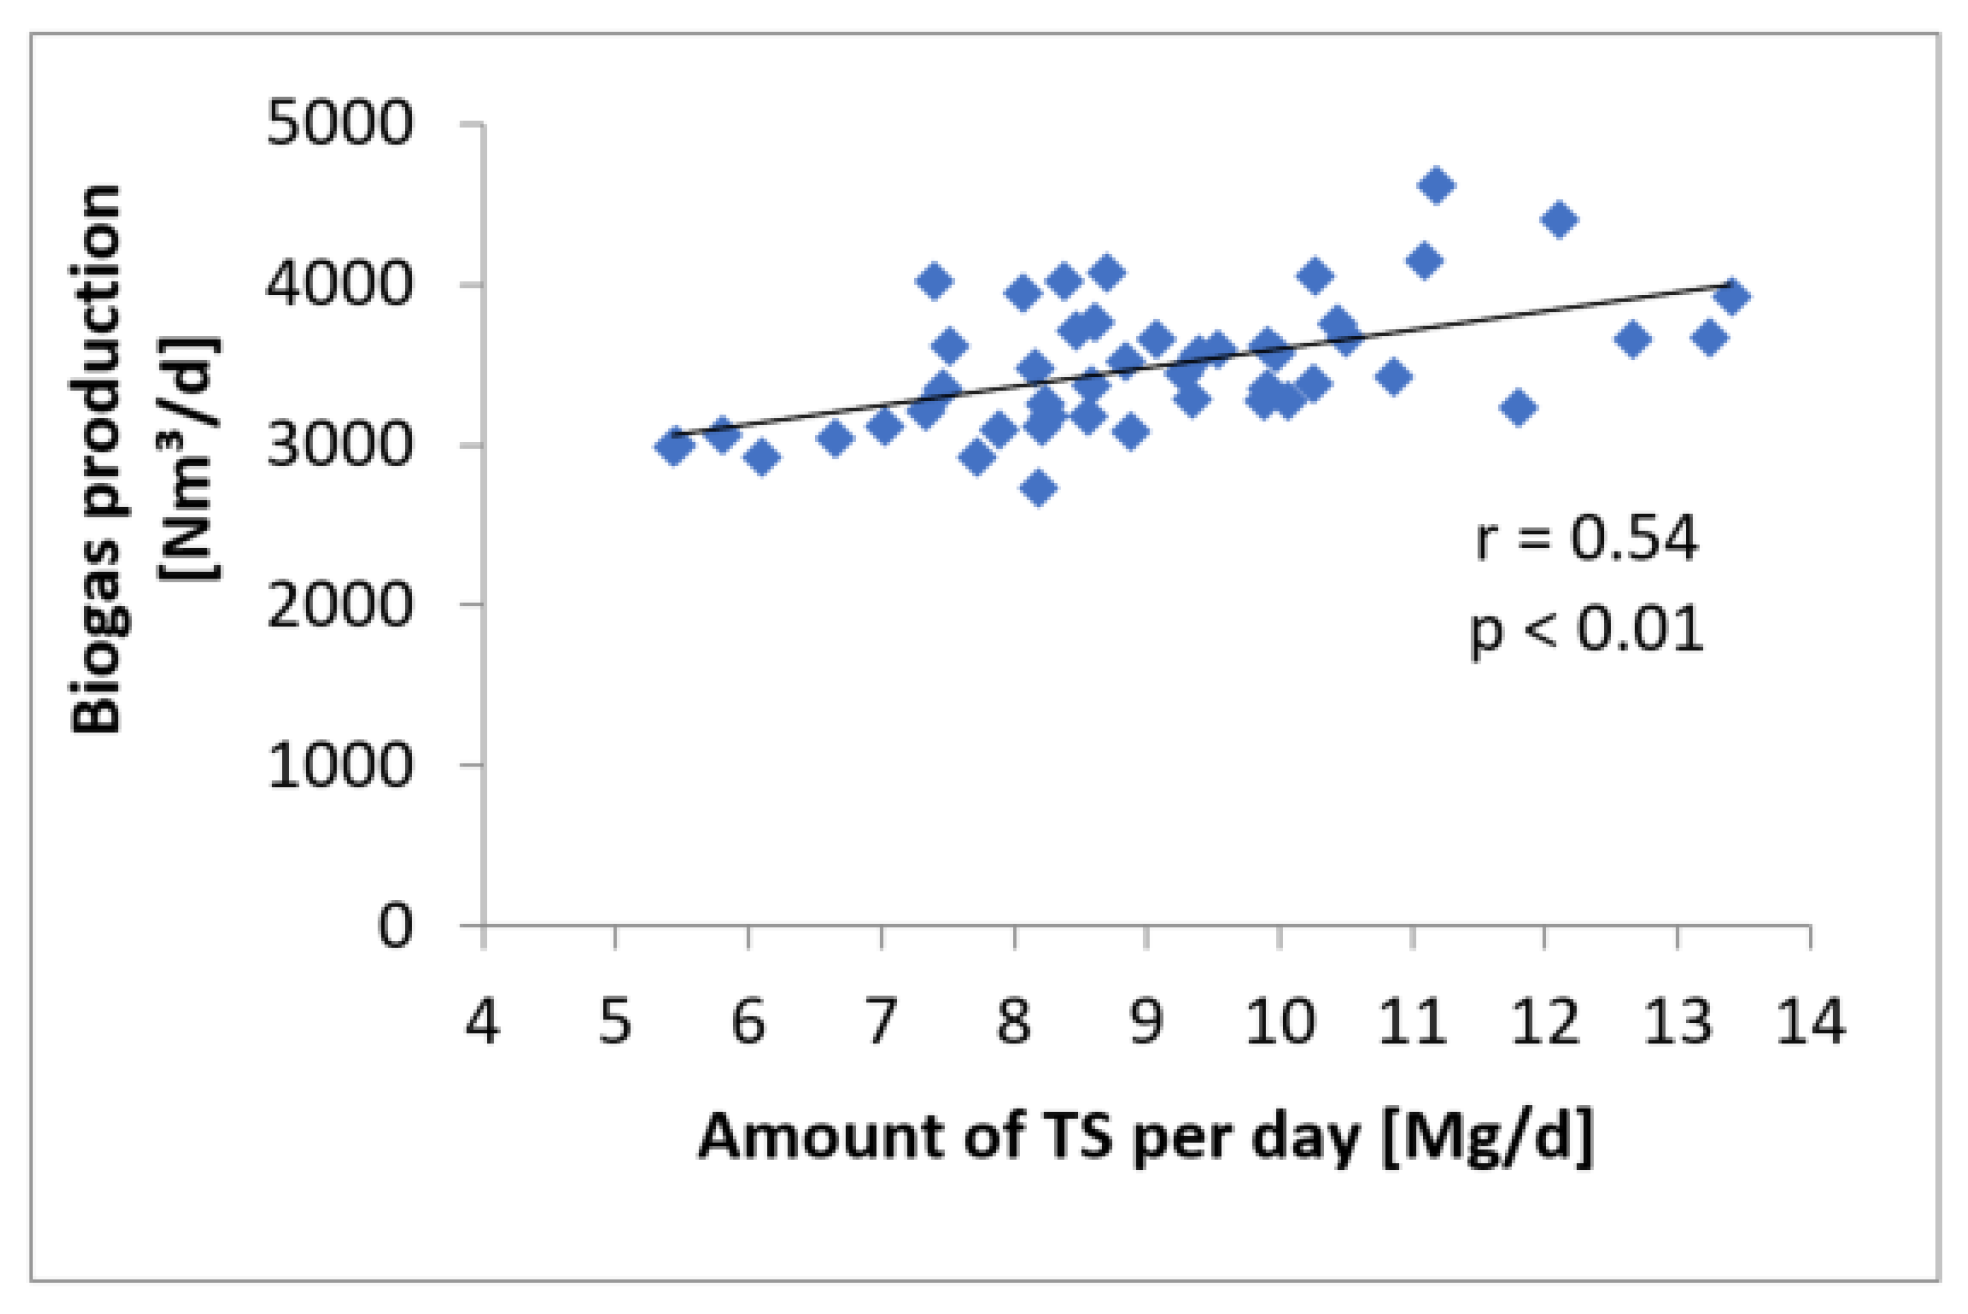
The data analysis showed a statistical relationship between biogas production expressed in m3/d and the amount of total solids in Mg/d (Figure 5). The correlation coefficient between the two aforementioned parameters was r = 0.54 (p < 0.01).
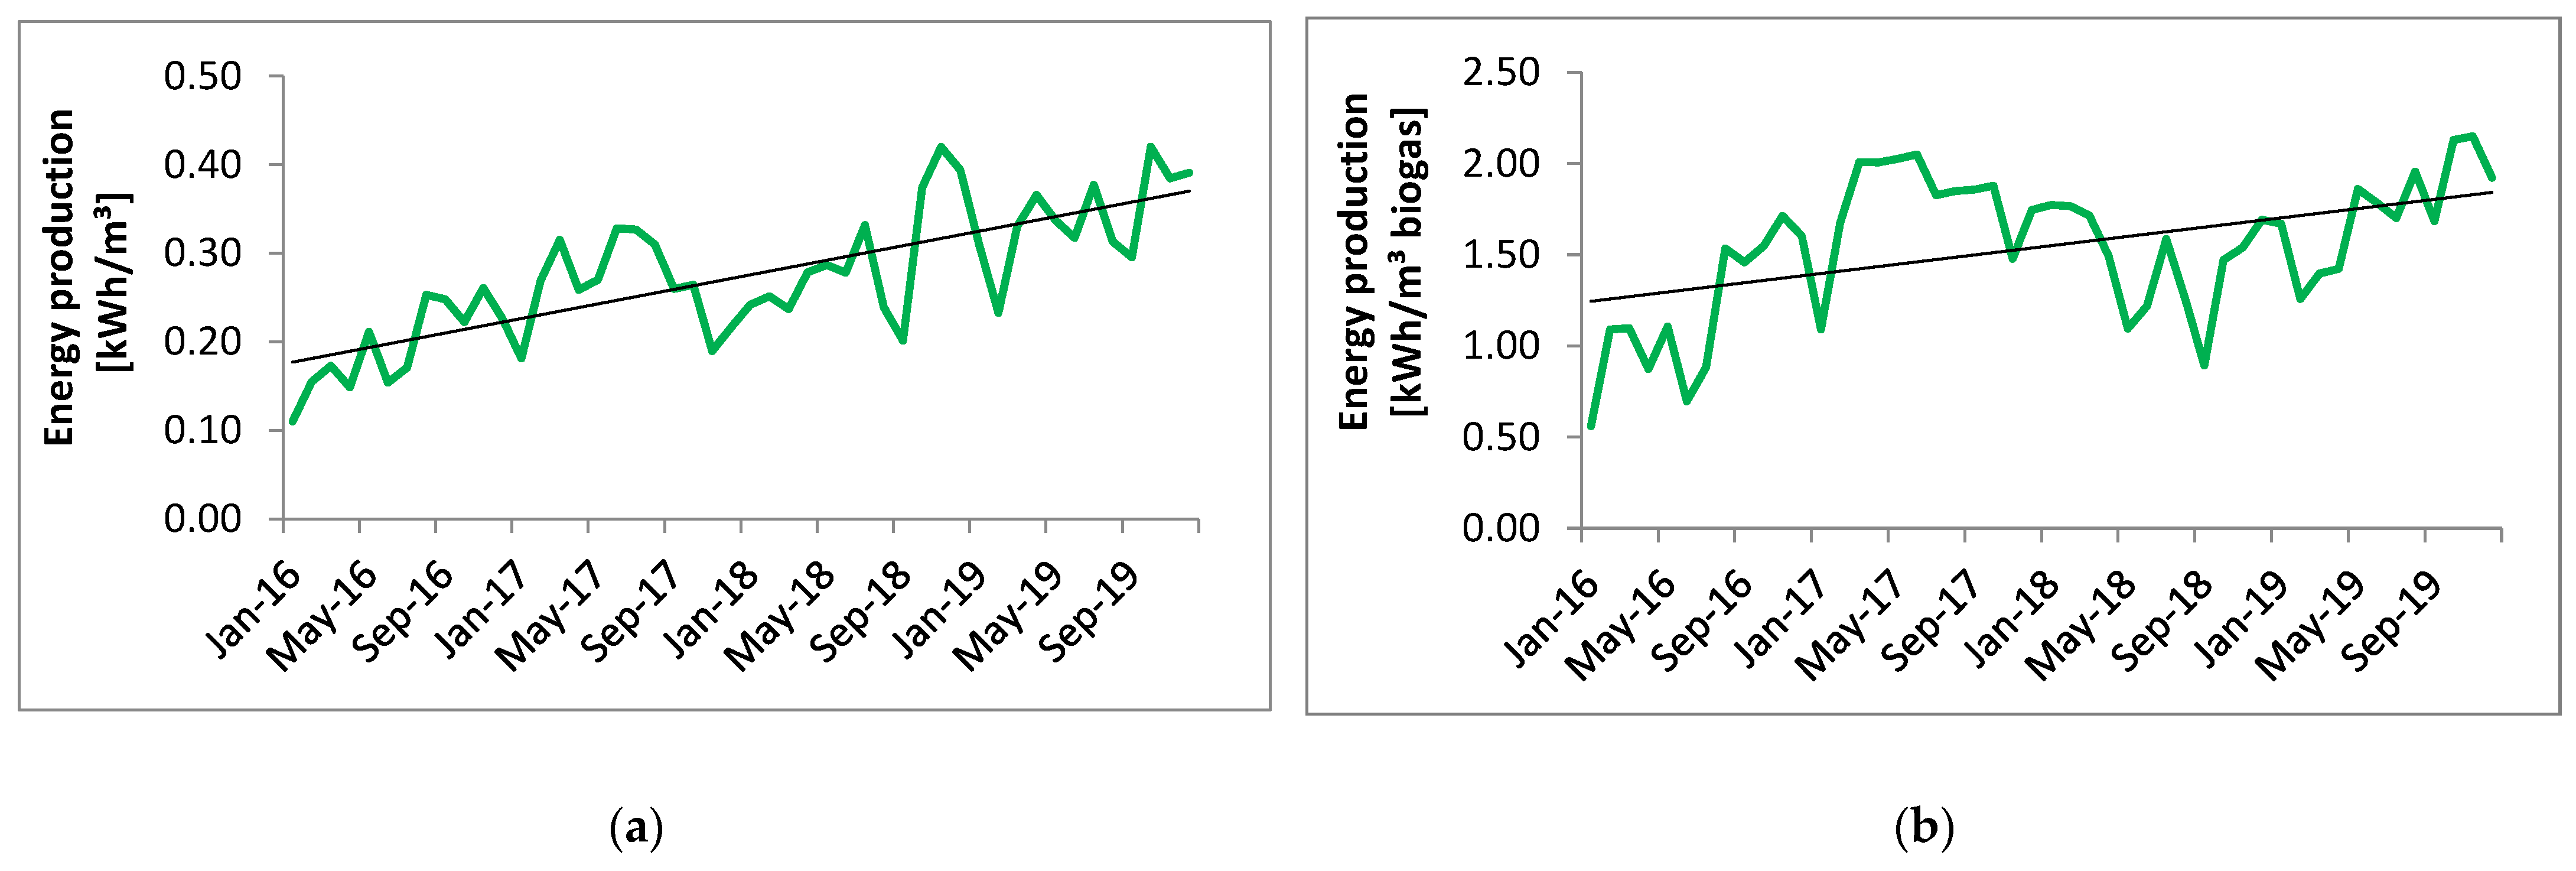
The average energy recovery from 1 m3 of wastewater at the Krosno WWTP varied from 0.11 to 0.42 kWh/m3, with an average value of 0.27 kWh/m3 (Figure 6a). The results obtained can be compared to the effects achieved at other Polish WWTPs, such as Rzeszów (0.19–0.43 kWh/m3) and Opole (0.13–0.38 kWh/m3) [58,60]. On the other hand, the estimated electricity recovery from wastewater from the Iława WWTP is 1.15 kWh/m3 [59]. The unit electricity production per m3 of treated wastewater at the Krosno WWTP showed an upward regression.
The qualitative composition of the biogas after the treatment process is shown in Table 4. The biogas had an average content of methane of approximately 62%. This is well reflected in the relatively high calorific value of biogas in the wastewater treatment plant [kWh per Nm3 of biogas].
The methane content of the produced biogas translated significantly into energy production. Electricity production per Nm3 of biogas in 2016–2019 at the analyzed WWTP ranged from 0.56 to 2.15 kWh/Nm3 of biogas, with an average value of about 1.54 kWh/m3 (Figure 6b). In comparison, at other Polish WWTPs, the ratio was at the level of: 1.16–2.21 kWh/Nm3 biogas—the Zamość WWTP, 0.95–2.18 kWh/Nm3 biogas—the Opole WWTP, 0.36–2.13 kWh/Nm3 biogas—the Dębica WWTP, 2.02–2.48 kWh/Nm3 biogas—the Rzeszów WWTP, and 1.9–4.8 kWh/Nm3 biogas—the Mielec WWTP [58,59,63,64,65,66].
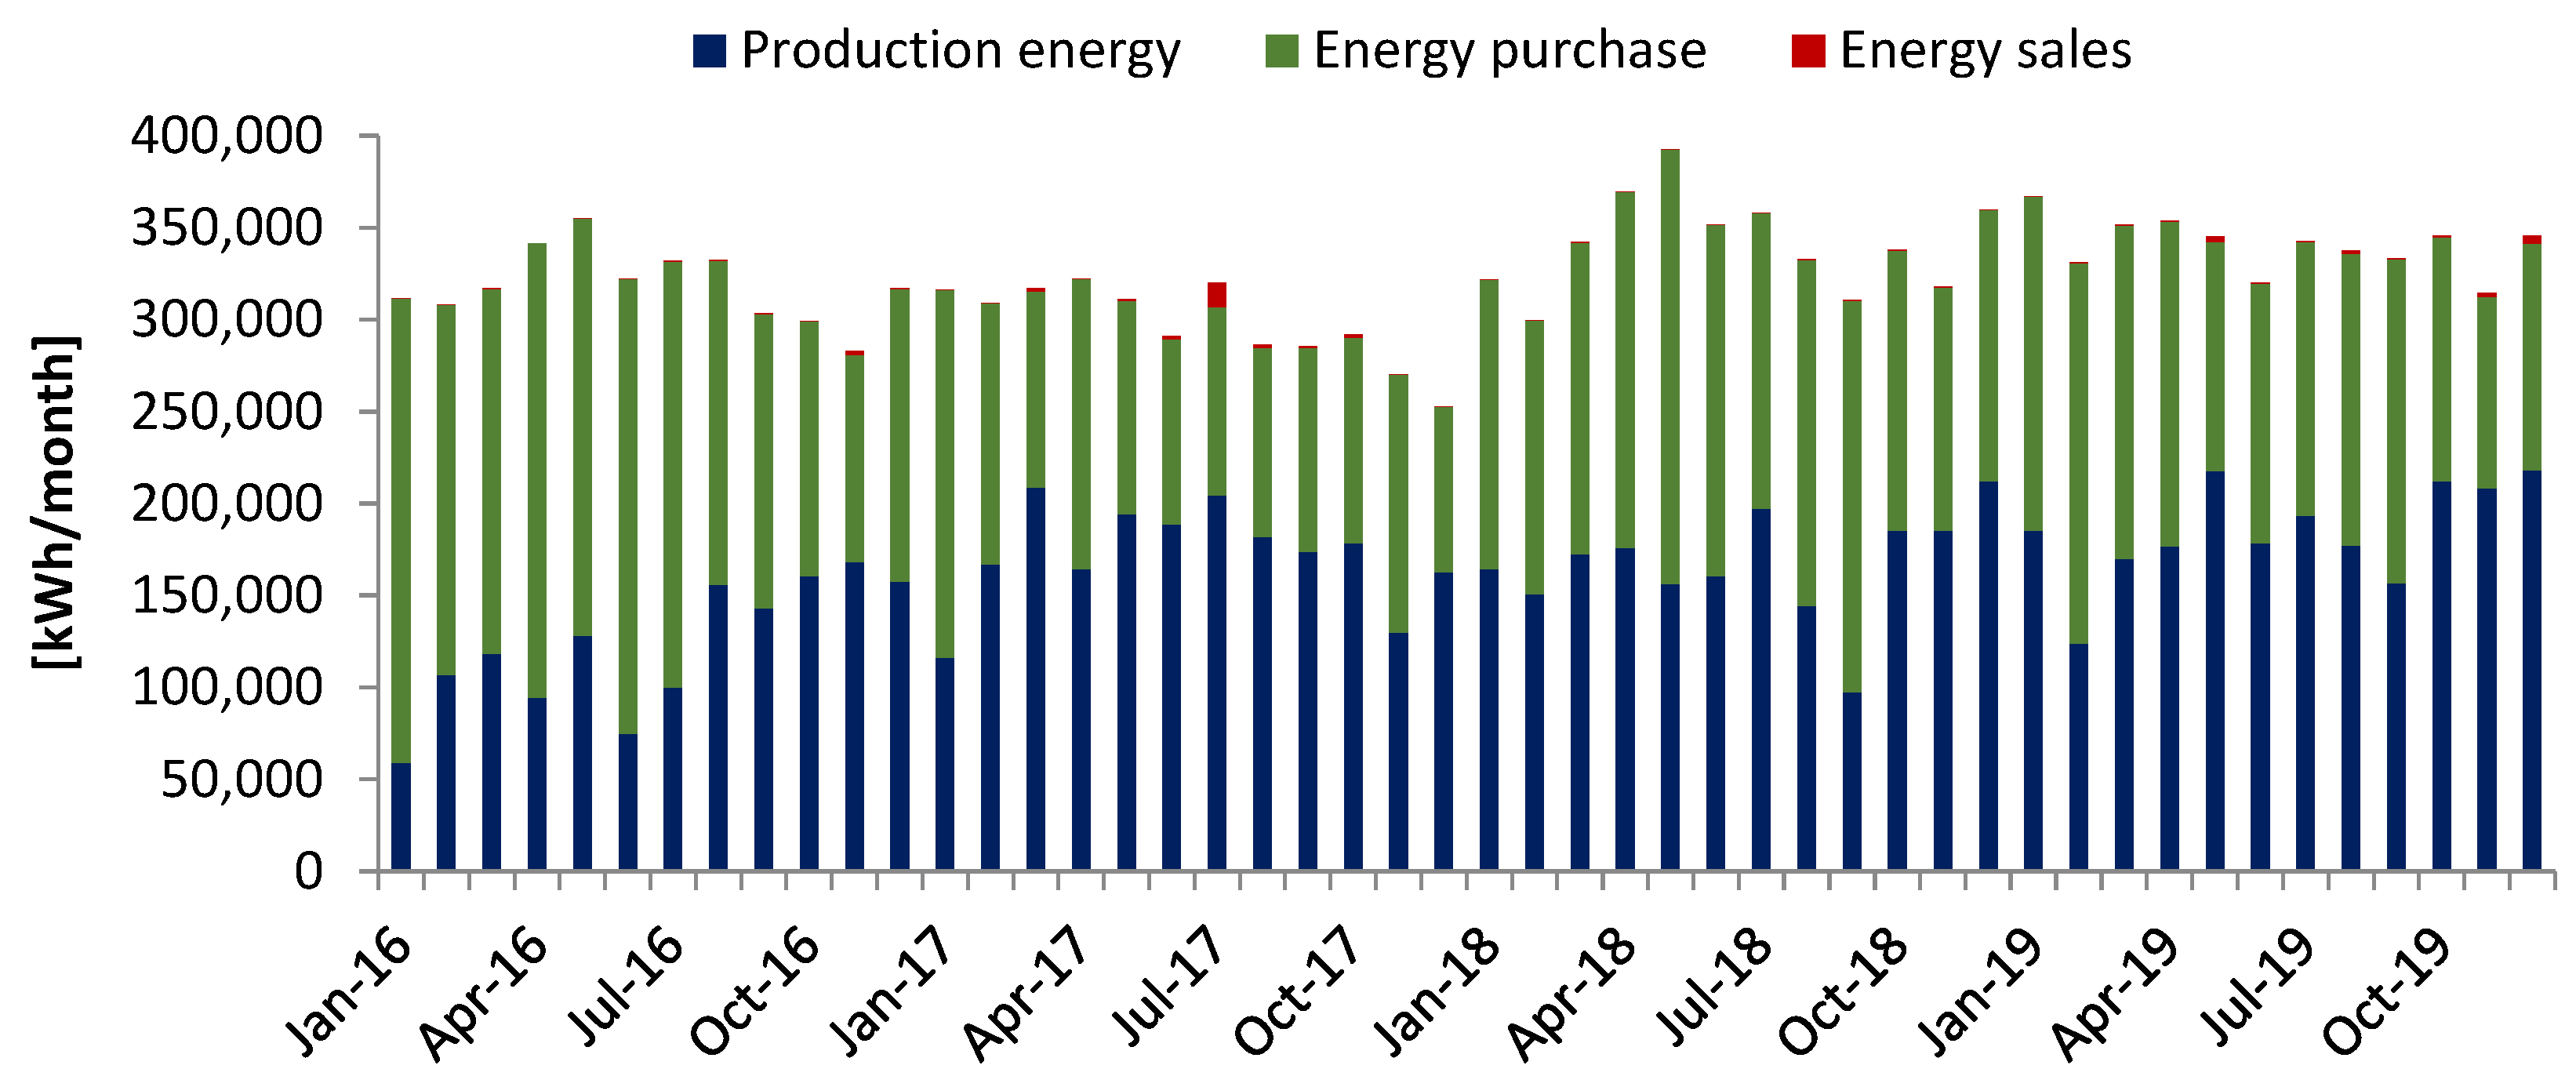
The average values of individual indicators describing the energy balance of the Krosno WWTP in 2016–2019 are summarized in Table 5. In the 2016–2019 period, energy consumption at the Krosno WWTP was in the range of 252,707.61–389,014.8 kWh/month, with an average value of 322,393.4 kWh/month (average value for the period 2016–2019). Total consumption was 15,474,881.60 kWh. The lowest energy consumption occurred in December 2017, while the highest consumption was observed in May 2018. In 2016–2019, an average of 161,725.15 kWh of energy was produced, which allowed for the resale of 42,039.60 kWh of energy. Over the four years, the CHP system produced a total of 7,762,807.0 kWh of electricity. The gap between the minimum and maximum values was 158,860.0 kWh.
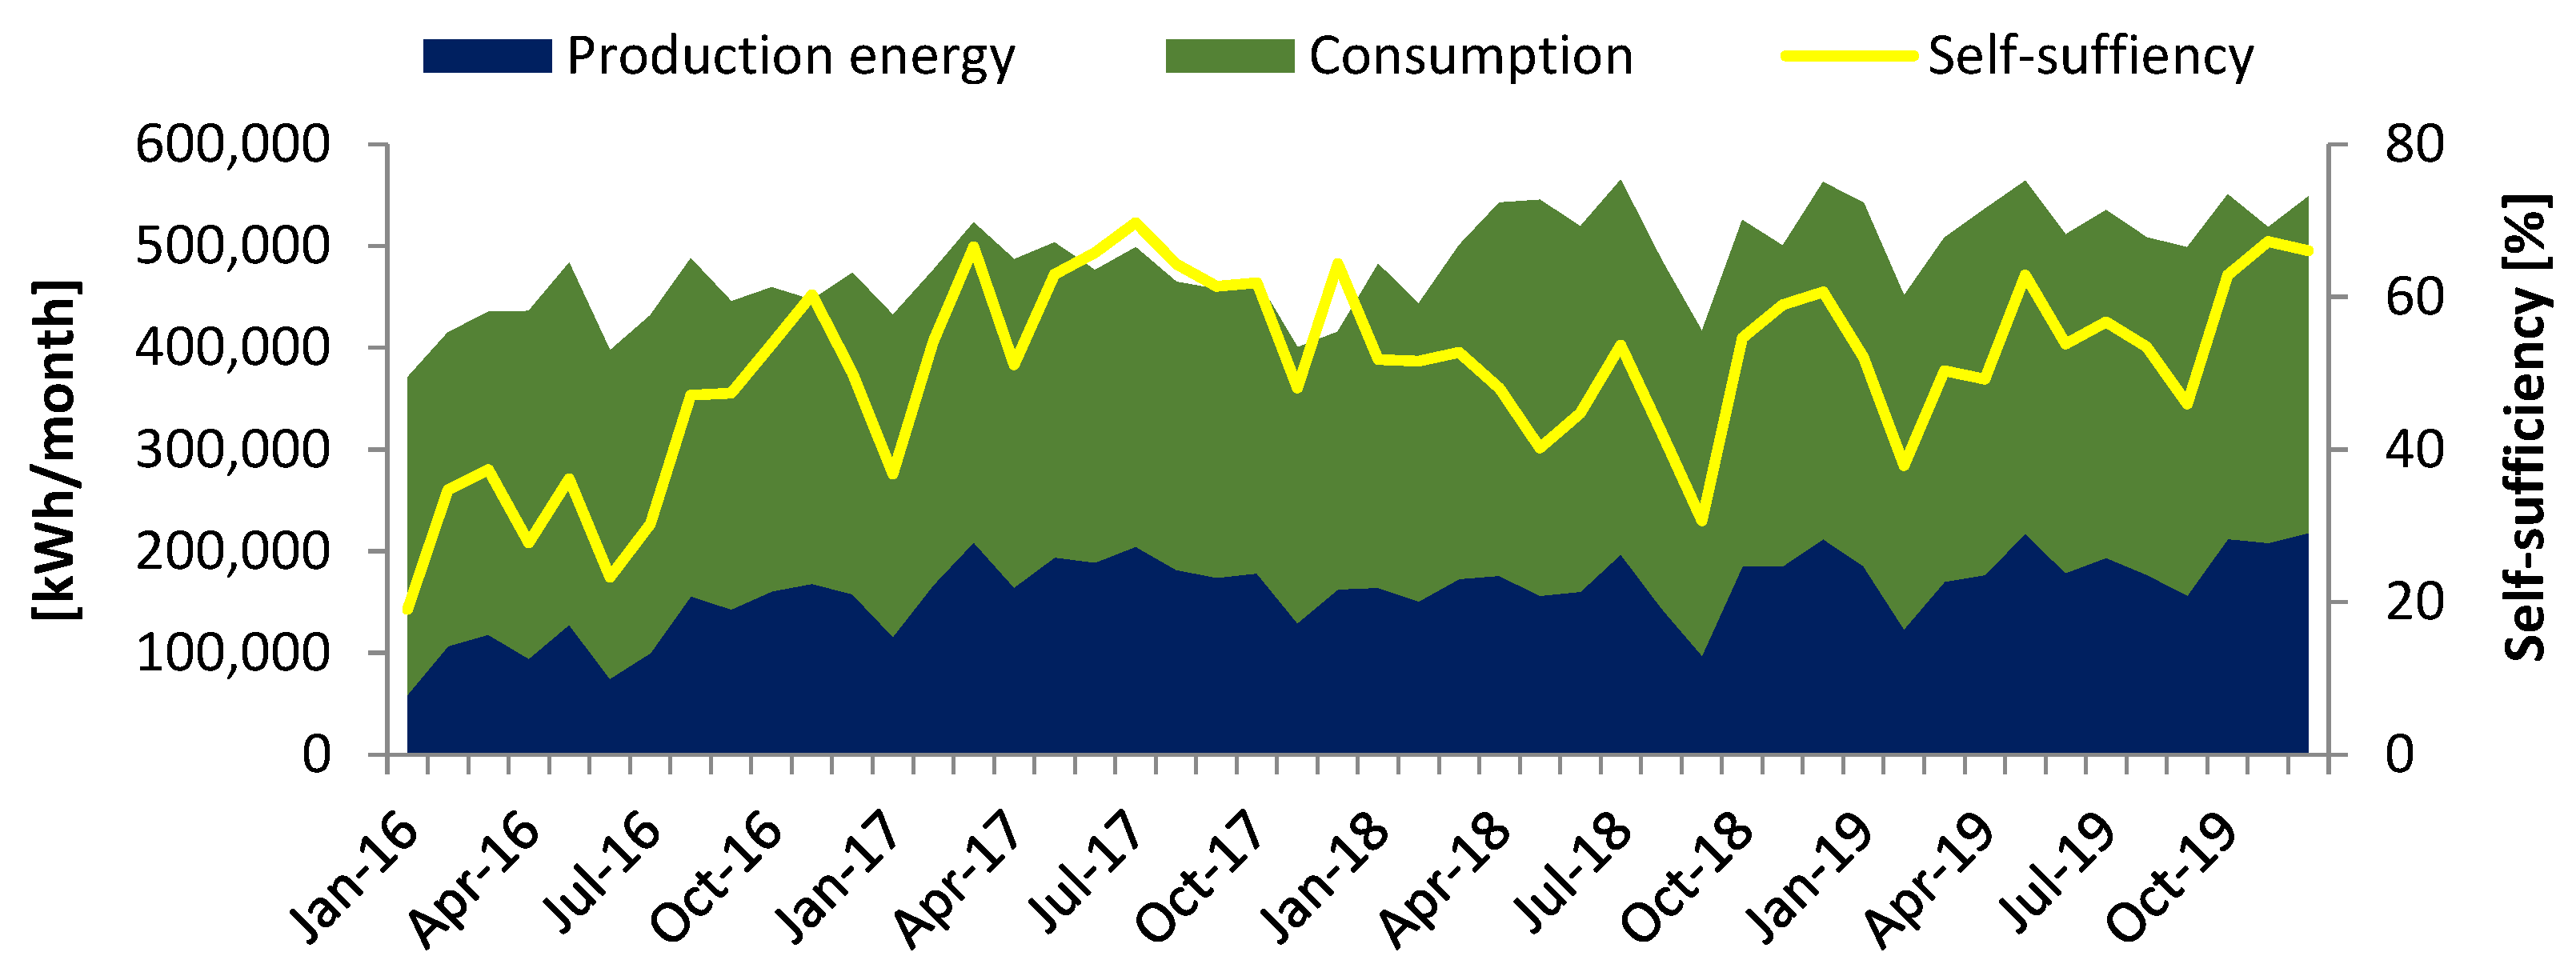
From January 2016 to December 2019, the degree of electricity demand coverage from biogas production occurred in the range of 19.0–69.7% (Figure 7). The self-sufficiency of the WWTP increased along with electricity production. The average degree of self-sufficiency was 50.5%, which significantly improved the relationship between energy purchased from the grid and that produced from biogas. With this production, the purchase of electricity could be reduced by about 50.02%. In other wastewater treatment plants in Poland, the average degree of self-sufficiency was as follows: 98.25%—the Iława WWTP [59], 34.7%—the Opole WWTP [58], 52.2%—the Zamość WWTP [63], 46.5%—the Dębica WWTP [65], 74.3%—the Rzeszów WWTP [60].
The Krosno WWTP produced a total of 7.76 GWh of electricity in the analyzed years. This value can be compared to the Iława WWTP, where in the period from January 2017 to September 2019, the plant produced a total of 7.63 GWh of electricity [59]. The most energy was sold in July 2017 (13,268.4 kWh), while the least was sold in January and March 2016 (1 kWh). April was the month with zero energy surplus (Figure 8).

5. Concepts for Increasing the Self-Sufficiency of the WWTP in Krosno

The ever-increasing cost of energy purchases necessitates improving the energy balance of almost every WWTP. Moreover, the current geopolitical situation as well as progressive climate changes necessitate changes to more rational energy consumption at WWPTs and obtaining energy from alternative sources. On the other hand, an advanced wastewater treatment processes as well as sludge treatment are recognized as highly energy-intensive [67].
As has already been mentioned in this paper (Section 2.2), four main areas of action influence the increase in energy efficiency as well as the achievement of energy self-sufficiency of wastewater treatment plants: optimization of energy consumption, recovery of chemical energy contained in wastewater, recovery of thermal and mechanical energy, and generation of energy from other renewable sources [44,45].
As an example of a measure that ensures the optimization of energy consumption, one can mention, for example, the replacement of worn-out/old mixers in activated sludge chambers or sludge stabilization chambers. Installing six new agitators in denitrification and dephospatation chambers at a certain Polish wastewater treatment plant (Rybienko Stare, Poland) enabled the achievement of the required parameters with a 30% lower power consumption (the power consumption of the new agitator was lower by 2.5 kW). The operator of this facility reported that with a mixer-operation mode of 24 h/d, the annual energy savings amounted to 133,660 kW (financial savings are 52,127 PLN at a unit price of 0.39 PLN/kWh) [68]. Referring to the energy consumption optimization in the Krosno wastewater treatment plant, it should be emphasized that in recent years, the wastewater and sludge parts of this WWTP have been modernized. The work also included replacing the equipment of technological facilities and associated devices with the models characterized by lower energy demand.
One of the priority strategies to improve energy efficiency towards self-sustainability of the WWTP involves intensifying methane production, e.g., through sewage sludge co-digestion with other organic waste [69,70,71] or sewage sludge pre-treatment prior to its introduction into digesters [72]. Nevertheless, in Polish conditions, the sewage sludge co-digestion with other types of wastes constitutes the most commonly applied and the cheapest solution for increasing biogas yield. Moreover, this method also allows for the effective management of various residues. At the Rzeszow WWTP (398,000 p.e.), biogas yields were in a range of 0.252–0.519 Nm3/kg TS of sludge when co-digesting sewage sludge with waste fats (cooking fats, used edible oils) and distillery stock [60]. For instance, at the Iława WWTP, the sewage sludge co-digestion with poultry processing waste allowed for obtaining methane in biogas at a very high level, from 93.0 to 99.8%, on average covering 98.2% of the plant’s electricity needs [59]. In this case, the biogas yield varied between 0.220 and 0.451 Nm3/kg TS.
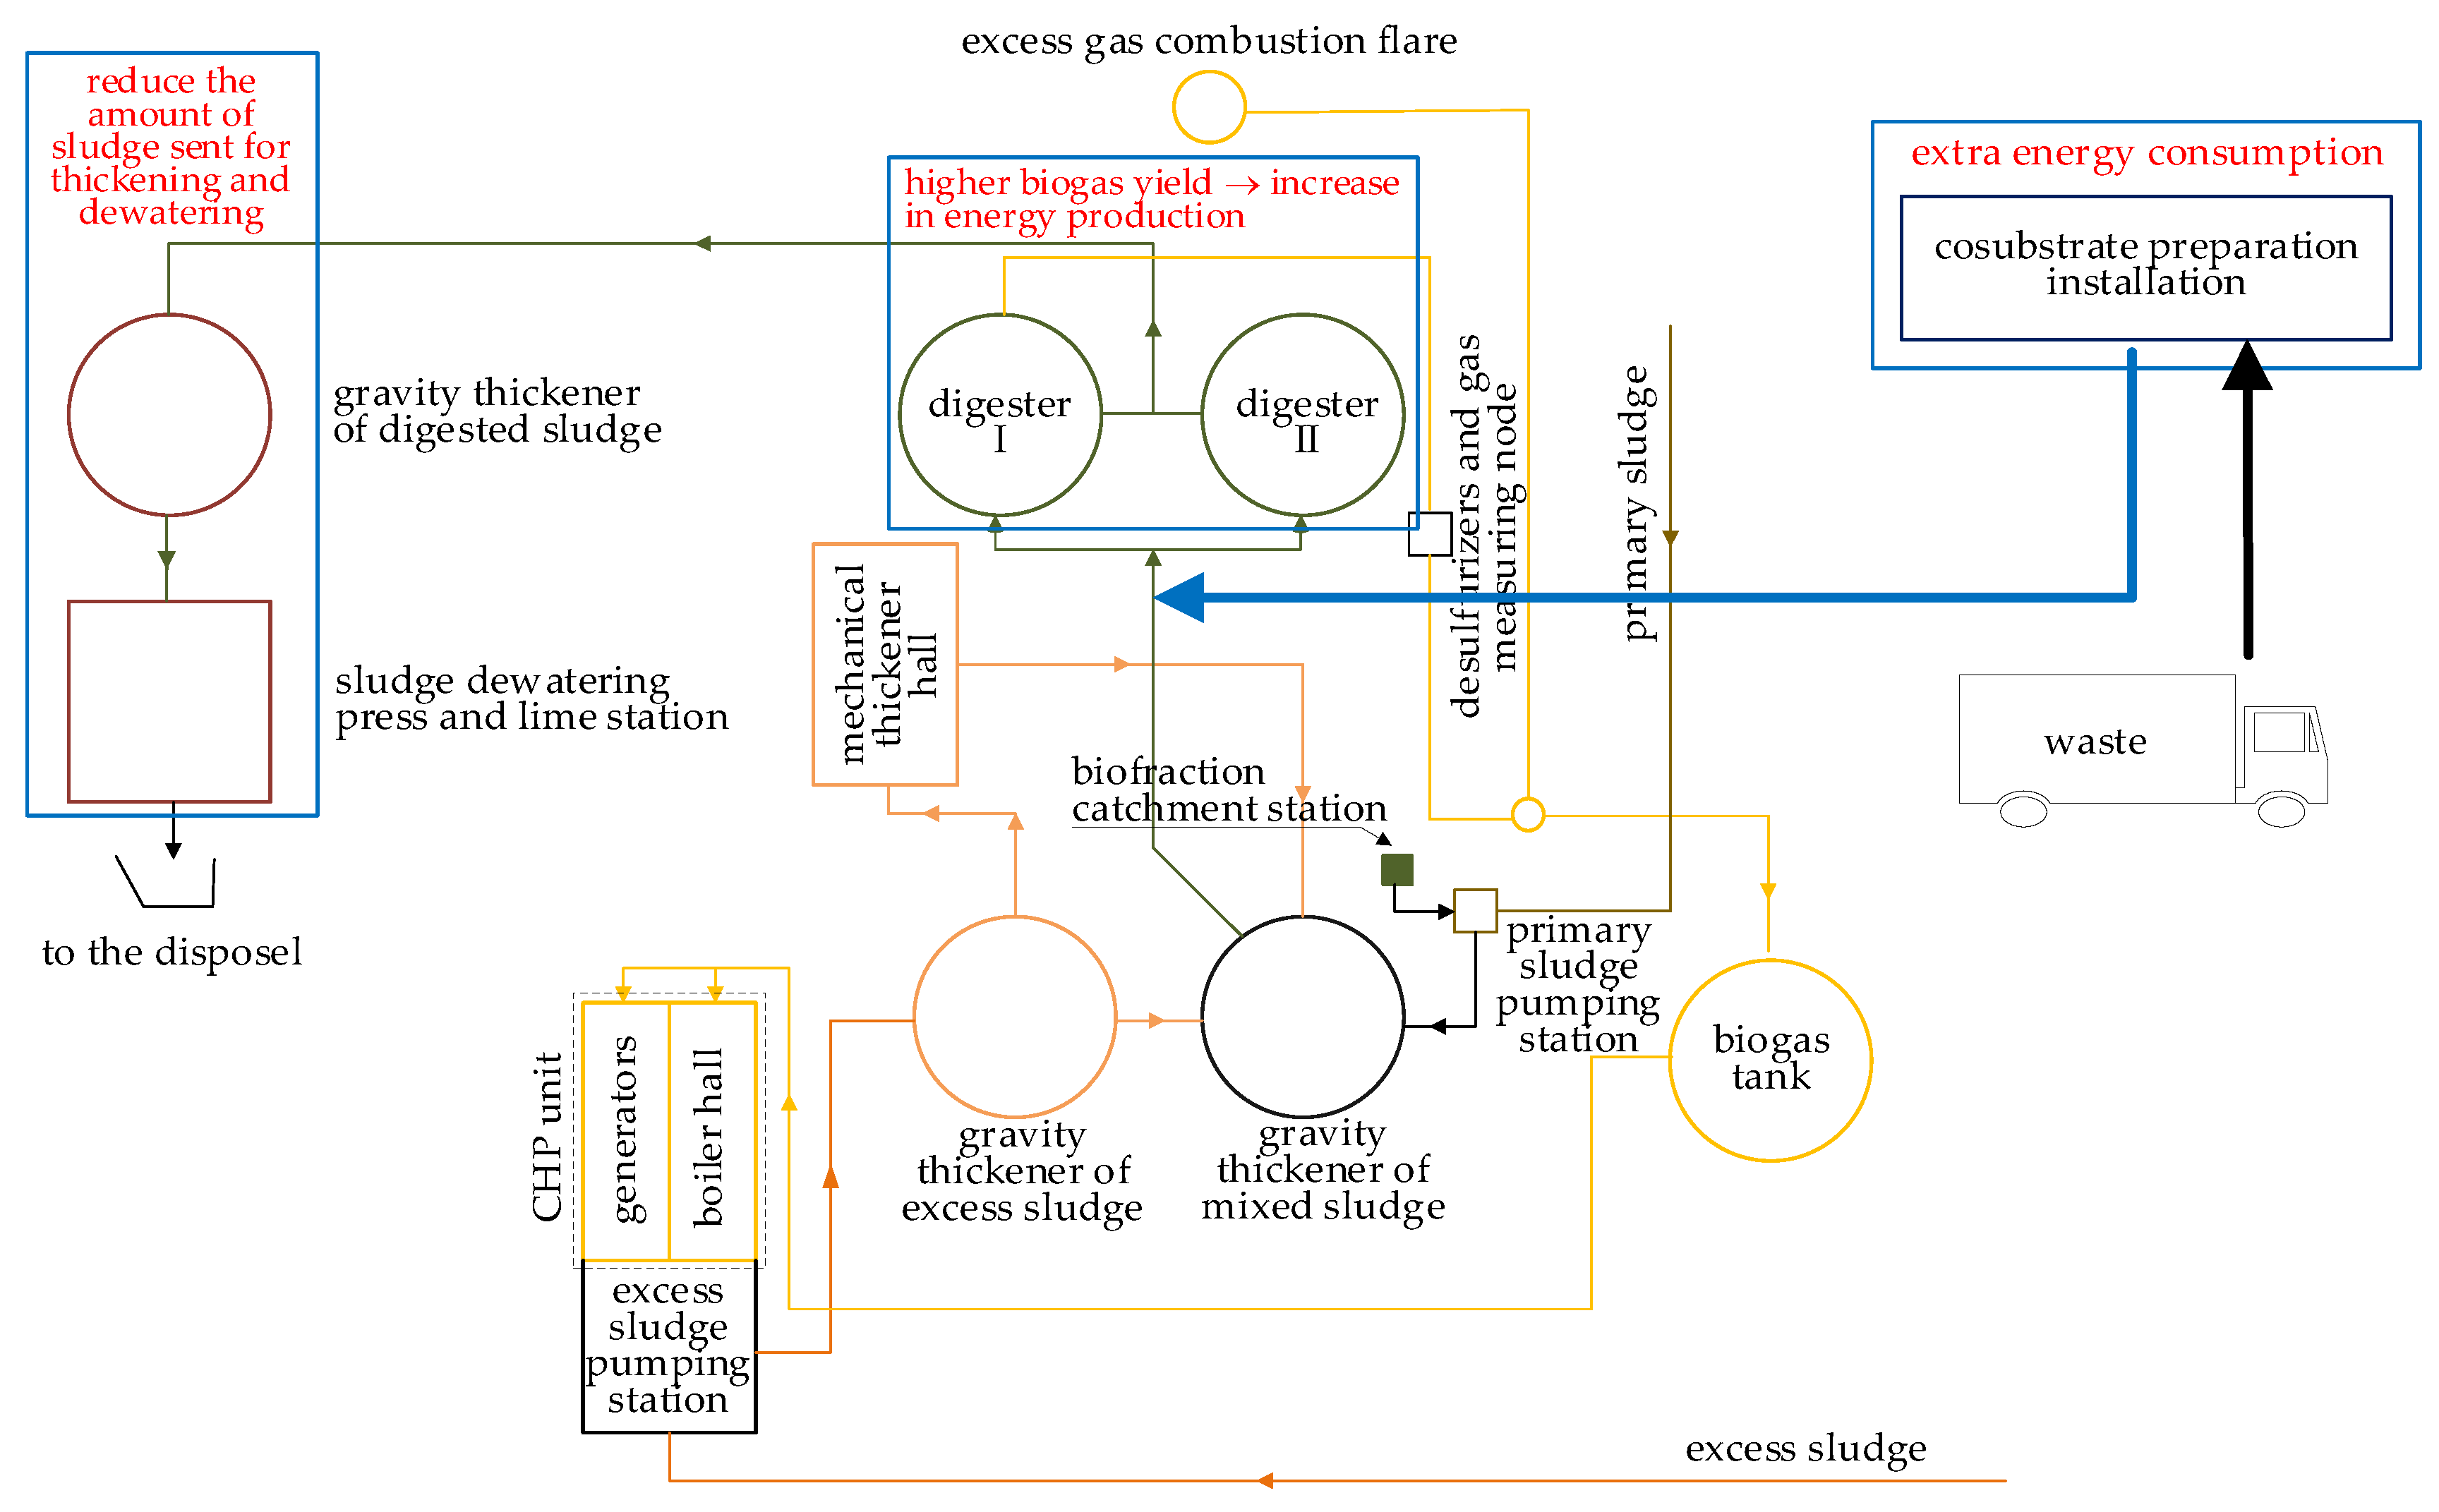
In the case of the WWTP in Krosno, this strategy might be easily implemented: the local market might be a source of many potential wastes that might be applied to existing digesters. In Krosno and the surrounding area, there are slaughterhouses and butcheries, the fat waste from which can be useful for biogas production in digesters. Another co-substrate may be waste fats from restaurants and hotels. In close proximity—up to approx. 20 km—there are well-known health resorts in Poland—Rymanów Zdrój and Iwonicz Zdrój. Therefore, the most important criterion for selecting a co-substrate, apart from the methane potential, should be the costs of waste transport and their availability. A practical measure, before deciding to introduce co-digestion in any WWTP, is to conduct biogas yield tests for a given type of waste which is to be used as a co-substrate. The results of such a study allow for determining how quickly and in what quantities biogas is produced on subsequent days of the study. In addition, the information about the composition of the biogas is obtained. The concept diagram of this solution for the analyzed WWTP is shown in Figure 9.
To confirm the validity of co-fermentation, it is worth citing examples from other facilities in Poland. The application of the poultry industry waste to co-digestion at the Koziegłowy WWTP in Poznań (1,200,000 p.e.) enabled biogas production to increase by 30%—from 0.38 to 0.49 m3/kg vs. [73]. Depending on the added concentration, 0.39–0.88 m3/kg vs. was obtained during laboratory trials from the poultry industrial waste. In the course of full-scale research, 0.81 m3/kg of methane yield was obtained. A higher biogas production enhanced the energy self-sufficiency of the wastewater treatment plant, which is a step towards achieving up to 80% of self-produced energy [73]. In turn, at the Brzeg WWTP (900,000 RLM), the co-digestion of waste fat and sewage sludge enabled the increase in the bio-gas production by 80%. From 1 Mg of fats, 107 m3 of biogas was obtained, which allowed for producing an additional 180 kW of electricity and recovering about 2.8 kW of heat energy contained in flue gases [66].
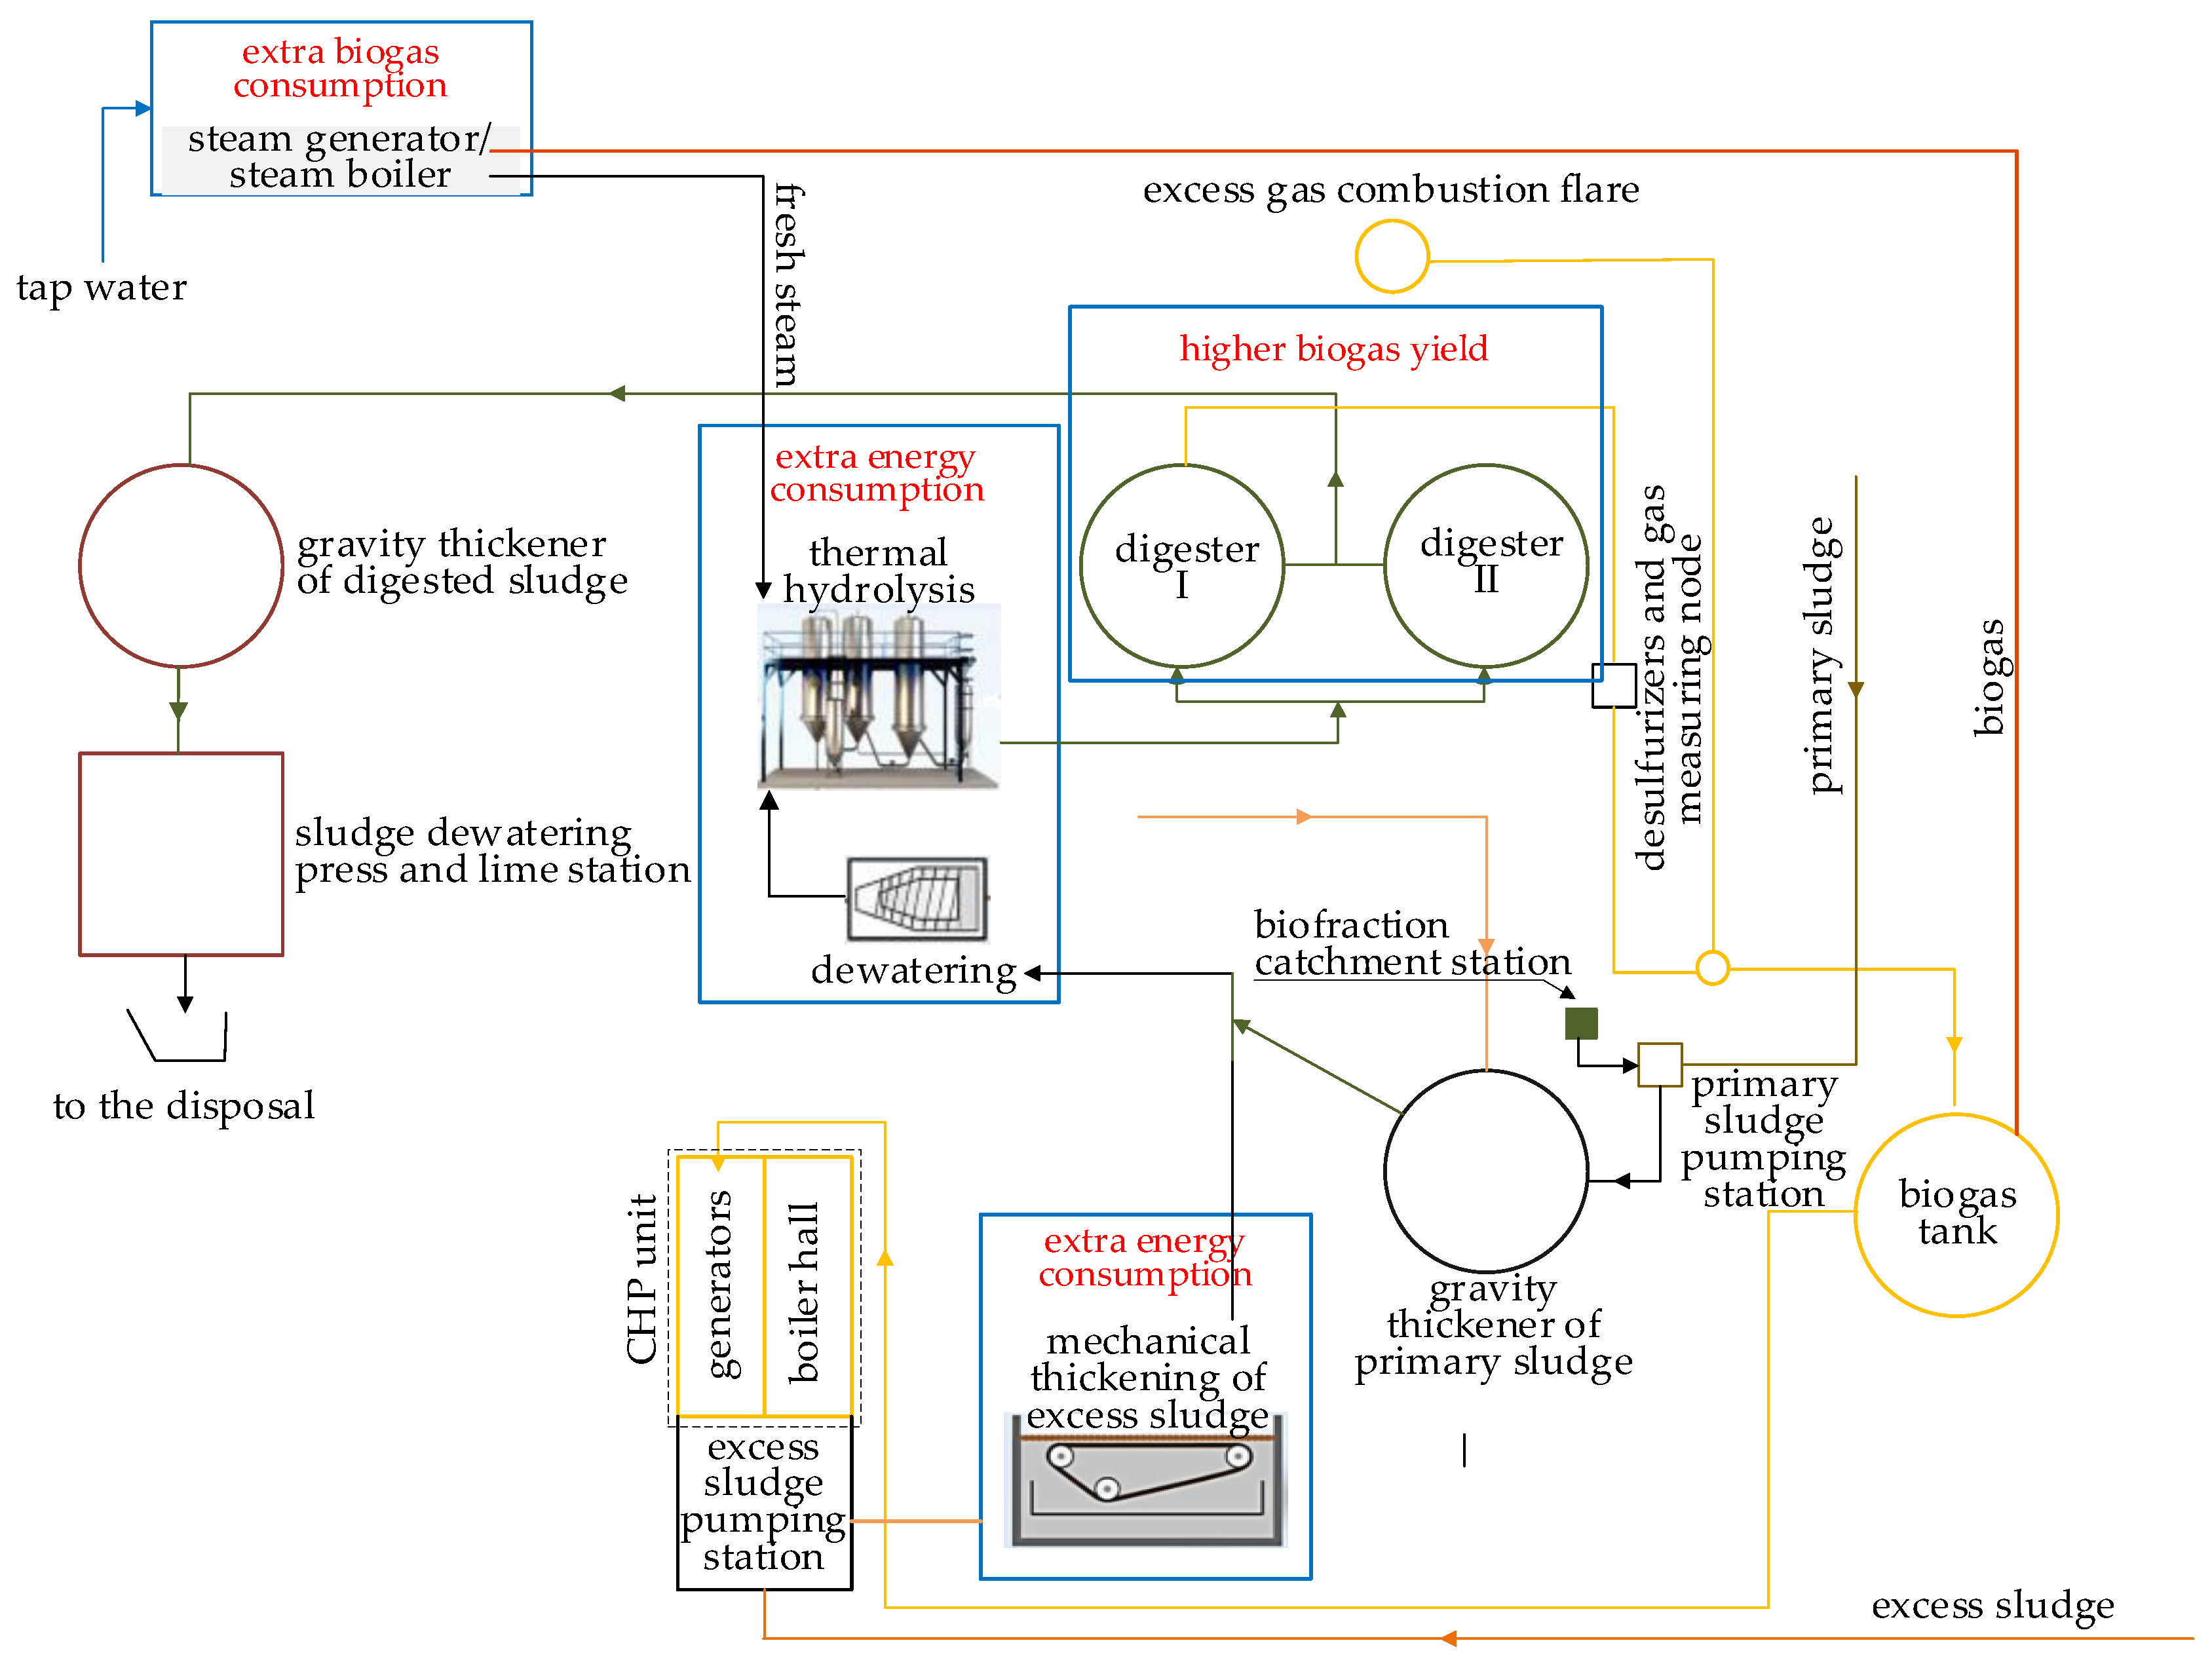
Sludge pre-treatment directly increases the biodegradability of sewage sludge, resulting in enhanced biogas production. Moreover, some of these methods also lead to improved sludge dewaterability, which might also reduce the energy consumption of sewage sludge processing. In this regard, it is possible to use an ultrasound, an electric field, or a thermal treatment [74,75,76,77,78,79,80]. The use of sludge disintegration in the form of a temperature hydrolysis process (THP) is a promising solution [81,82]. The use of the THP made it possible to obtain biogas having a content of methane and remaining biogas amounting to 64.29% and 35.51% CO2, respectively; the 0.2% which remains constitutes such components as H2S, H2, N2, and others [83]. Another frequently applied pre-treatment method in a full scale WWTP is the utilization of ultrasonication. In this case, at existing the WWTP, the production of biogas was enhanced by 40–50% in comparison to the control. Simultaneously, the degree of organic removal was enhanced by 30–50% [84]. In Polish conditions, ultrasonic installation is employed at WWTPs, e.g., Dąbrowa Górnicza. Therein, the biogas production was improved by 30%; in turn, organic removal was increased by 40–52% [85]. The concept diagram for the analyzed WWTP with this solution is shown in Figure 10.
However, the use of each pre-treatment method involves additional financial and energy costs. Therefore, it is crucial to prepare an energy balance and determine whether the obtained biogas production increase is sufficient to meet the energy needs of the pre-treatment method. Another important aspect of using biogas for energy purposes is its purity and methane content. The biogas treatment process itself consists of carbon dioxide removal, impurity cleaning, drying, desulfurization, and deodorization [86].
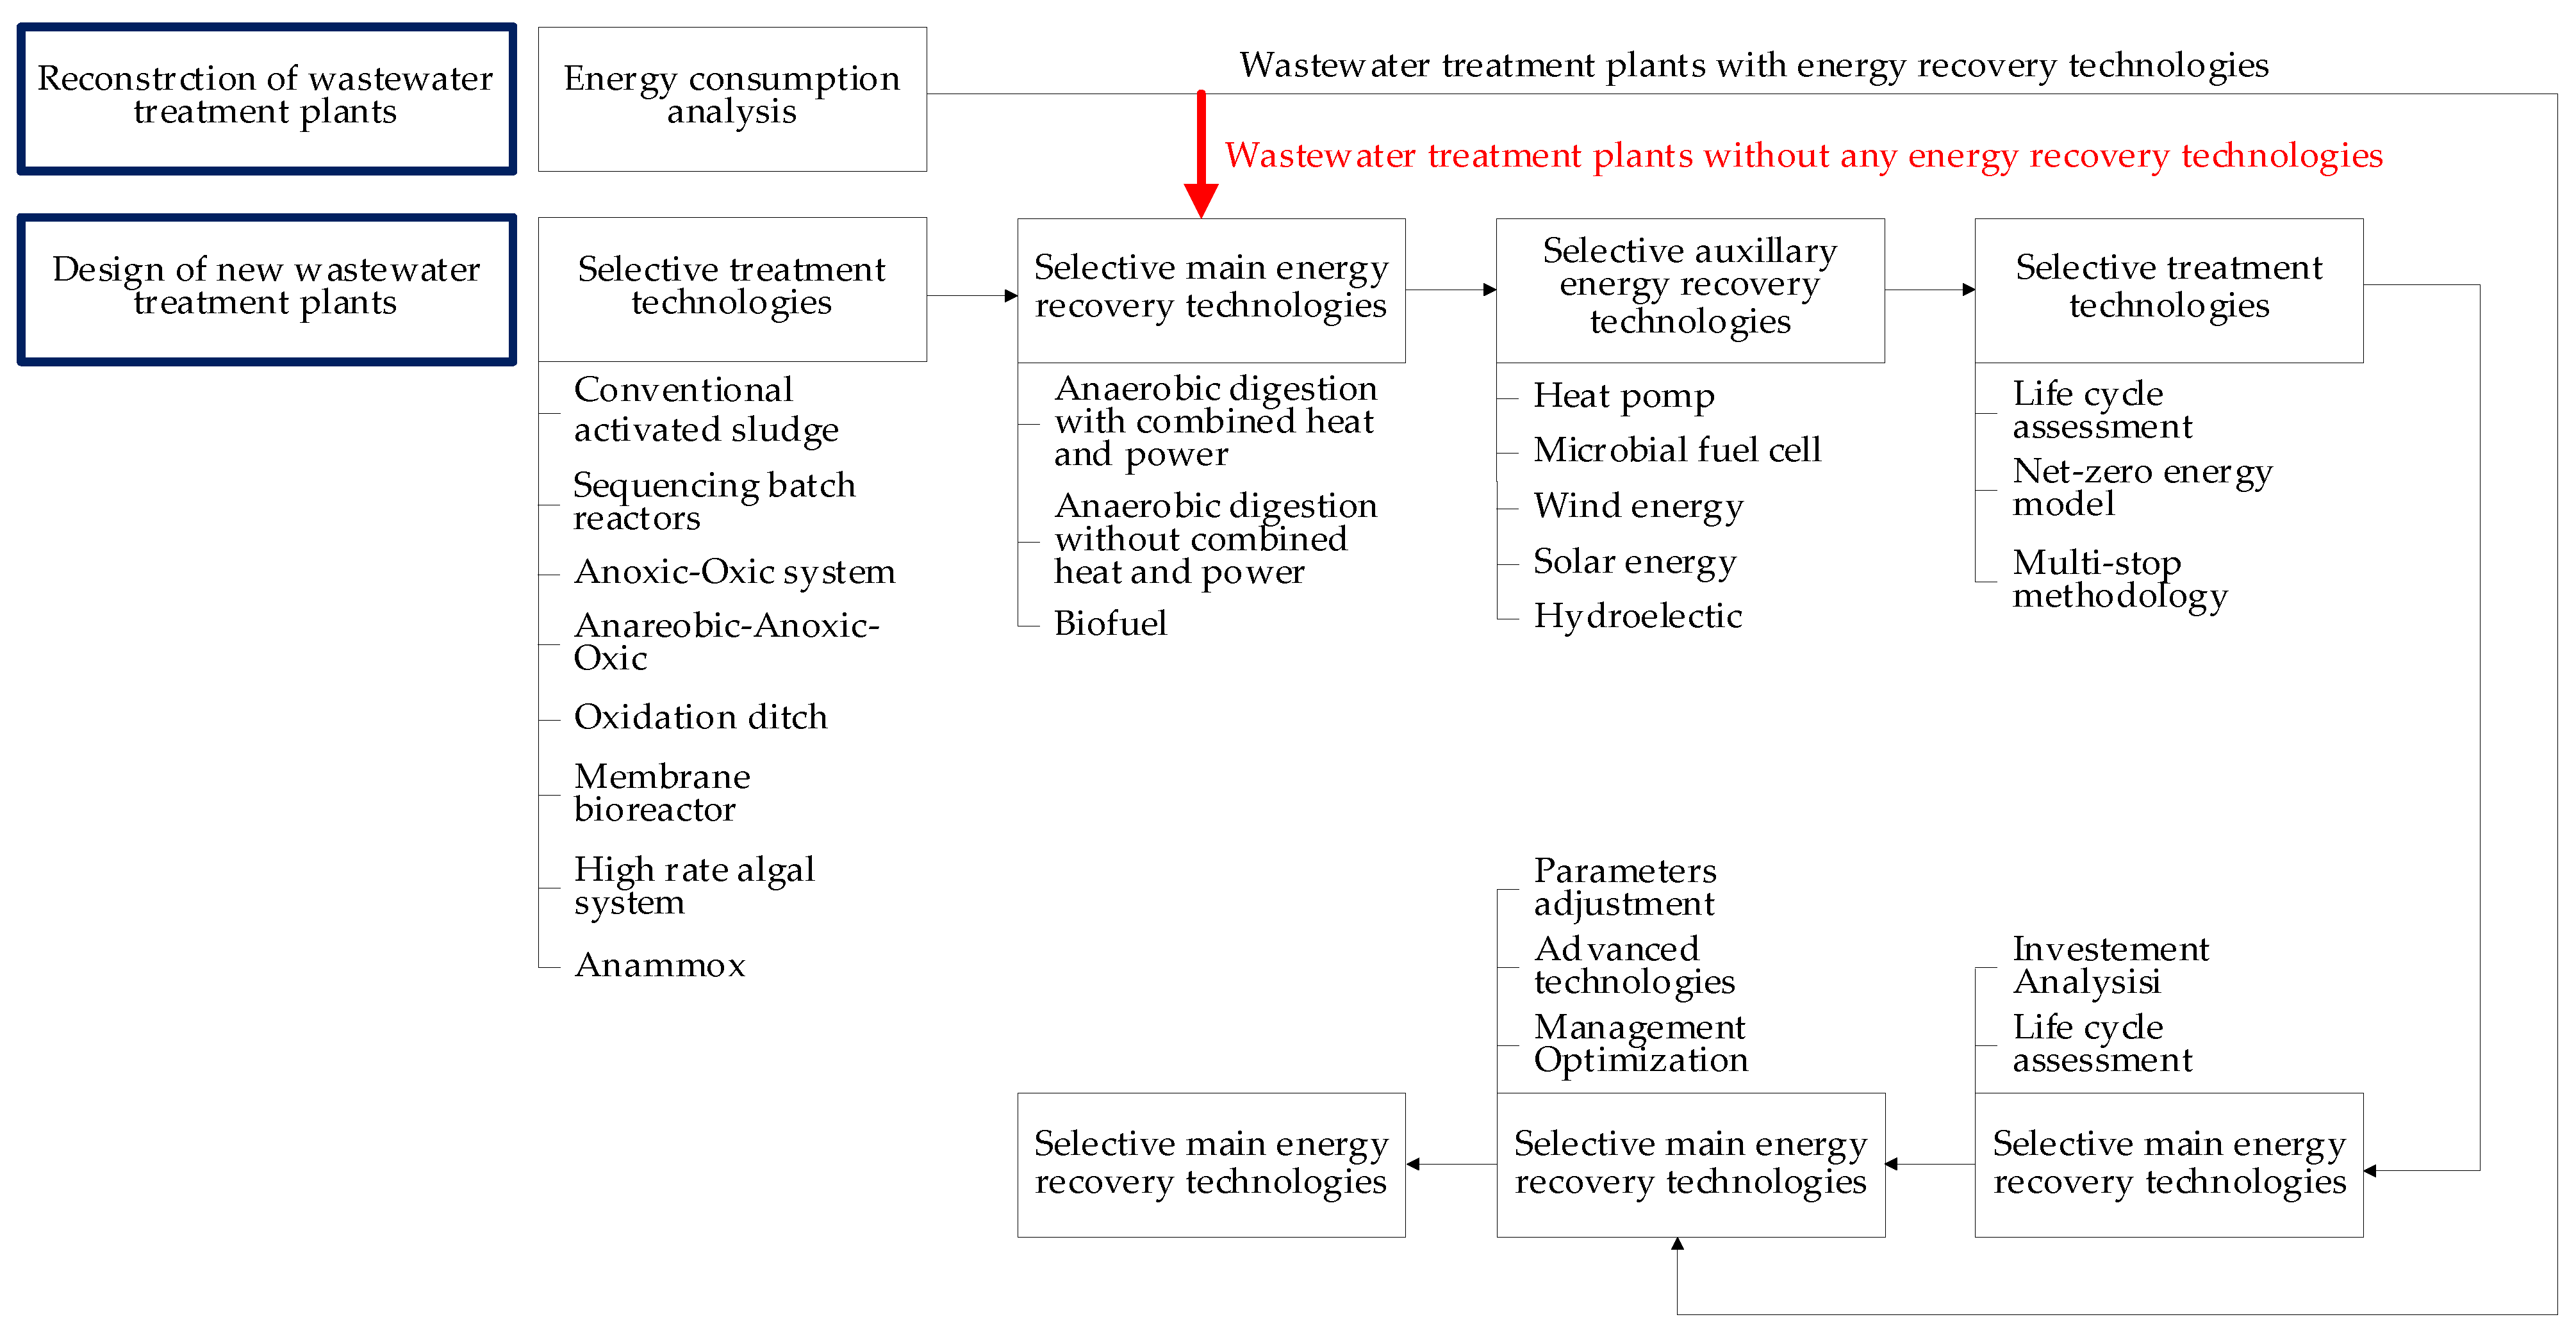
The steps towards self-sufficiency of the facility and WWTP energy balance should be considered as a whole, taking into account energy consumption in the processes of sludge processing as well as wastewater treatment, and the use of energy for social and non-technological purposes. The energy-saving procedure for a WWTP can be determined by evaluating how energy-efficient a given technology is [87,88]. Savings of energy in WWTPs are mainly connected with improving or replacing the equipment characterized by a high energy utilization (blowers, mixers, pumps) and the introduction of intelligent monitoring and control systems for the treatment of wastewater. Further consideration should be given to the possibility of producing heat and electricity from sewage sludge (digestion, co-digestion, thermal hydrolysis, sludge incineration), in addition to the recovery of energy from wastewater (water turbines, heat pumps). The production of electricity may be further intensified by using photovoltaic panels, small cogeneration systems, as well as hydroelectric and wind turbines. A general model of strategies aimed at achieving the self-sufficiency of WWTPs is presented in Figure 11.
From the presented possibilities, it is difficult to clearly indicate a universal strategy for improving biogas production and energy efficiency of WWTPs. Each has its own strengths and weaknesses. For this reason, the methods of intensifying the fermentation process or biogas enrichment should be considered individually and adapted to the realities of a given WWTP. When assessing each solution, technical, economic, and environmental factors should be taken into account primarily.

6. Conclusions

An analysis of the data for the selected wastewater treatment plant (Krosno, Poland) enabled us to draw the following conclusions:
  • Currently, in the employed technological system, achieving 100% self-sufficiency of the WWTP in terms of electricity is not possible; however, the WWTP allowed for covering the demand for electricity by 50.5%.
  • The implementation of the anaerobic digestion process enabled the production of 7.76 GWh of electricity in 2016–2019 and reduced its purchase by about 50.2%.
  • The achievement of the self-sufficiency of the WWTP in Krosno is possible through the improvement of the anaerobic digestion process. The co-digestion strategy may be considered as the easiest to implement in existing digesters.
  • The introduction of a sewage sludge pretreatment strategy might be a positive course of action, while bearing in mind that it is an energy-intensive activity; thus, it will be necessary to carefully analyze the profitability of such a solution. The use of ultrasonication might improve the biogas production even to the level of 40–50%.
  • Another way might be improving the energy efficiency of equipment (blowers, mixers, and pumps) and implementing intelligent monitoring as well as a control for the WWTP operation. Such solutions might contribute to reducing energy consumption by approximately 30%.

Author Contributions

Conceptualization and methodology, A.M., J.C., A.S. and G.Ł.; formal analysis, G.Ł.; investigation, resources, data curation and visualization, A.M., J.C., P.S. and J.S.-C.; writing—original draft preparation, A.M., J.C., P.S. and A.S.; writing—review and editing, A.S., J.S.-C. and G.Ł. All authors have read and agreed to the published version of the manuscript.

Funding

This work was financially supported within the authors’ research of particular scientific units under subvention for a Scientific Disciplines program.

Data Availability Statement

Data are contained within the article.

Acknowledgments

The kind help from the Krosno WWTP staff is gratefully acknowledged.

Conflicts of Interest

The authors declare no conflicts of interest.

Abbreviations

ADanaerobic digestion process
BOD5biochemical oxygen demand
CHPcombined heat and power
THPtemperature hydrolysis process
TStotal solids content
WWTPwastewater treatment plant
VSvolatile solids

References

  1. Panepinto, D.; Fiore, S.; Zappone, M.; Genon, G.; Meucci, L. Evaluation of the energy efficiency of a large wastewater treatment plant in Italy. Appl. Energy 2016, 161, 404–411. [Google Scholar] [CrossRef]
  2. Maziotis, A.; Sala-Garrido, R.; Mocholi-Arce, M.; Molinos-Senante, M. A comprehensive assessment of energy efficiency of wastewater treatment plants: An efficiency analysis tree approach. Sci. Total Environ. 2023, 885, 163539. [Google Scholar] [CrossRef]
  3. Walker, N.L.; Williams, A.P.; Styles, D. Pitfalls in international benchmarking of energy intensity across wastewater treatment utilities. J. Environ. Manag. 2021, 300, 113613. [Google Scholar] [CrossRef]
  4. Cardoso, B.J.; Rodrigues, E.; Gaspar, A.R.; Gomes, Á. Energy performance factors in wastewater treatment plants: A review. J. Clean. Prod. 2021, 322, 129107. [Google Scholar] [CrossRef]
  5. Gu, Y.; Li, Y.; Li, X.; Luo, P.; Wang, H.; Robinson, Z.P.; Wang, X.; Wu, J.; Li, F. The feasibility and challenges of energy self-sufficient wastewater treatment plants. Appl. Energy 2017, 204, 1463–1475. [Google Scholar] [CrossRef]
  6. Trapote, A.; Albaladejo, A.; Simón, P. Energy consumption in an urban wastewater treatment plant: The case of Murcia Region (Spain). Civ. Eng. Environ. Syst. 2014, 31, 304–310. [Google Scholar] [CrossRef]
  7. Siatou, A.; Manali, A.; Gikas, P. Energy consumption and internal distribution in activated sludge wastewater treatment plants of Greece. Water 2020, 12, 1204. [Google Scholar] [CrossRef]
  8. Maktabifard, M.; Zaborowska, E.; Makinia, J. Achieving energy neutrality in wastewater treatment plants through energy savings and enhancing renewable energy production. Rev. Environ. Sci. Biotechnol. 2018, 17, 655–689. [Google Scholar] [CrossRef]
  9. Gans, N.; Mobini, S.; Zhang, X.N. Appendix E. Mass and Energy Balances at the Gaobeidian Wastewater Treatment Plant in Beijing, China. Available online: https://www.yumpu.com/en/document/view/43133293/appendix-e-mass-and-energy-balances-at-the-gaobeidian- (accessed on 27 November 2023).
  10. Trojanowicz, K. Energetyczna utylizacja biogazu jako element gospodarki osadowej w oczyszczalni ścieków w Krośnie. Forum Eksploatatora 2016, 4, 46–53. [Google Scholar]
  11. Üstün, G.E.; Solmaz, S.K.A.; Çiner, F.; Bažkaya, H.S. Tertiary treatment of a secondary effluent by the coupling of coagulation-flocculation-disinfection for irrigation reuse. Desalination 2011, 277, 207–212. [Google Scholar] [CrossRef]
  12. González, J.M.; de Guzmán, I.; Elosegi, A.; Larrañaga, A. Tertiary wastewater treatment combined with high dilution rates fails to eliminate impacts on receiving stream invertebrate assemblages. Sci. Total Environ. 2023, 859, 160425. [Google Scholar] [CrossRef]
  13. Longo, S.; d’Antoni, B.M.; Bongards, M.; Chaparro, A.; Cronrath, A.; Fatone, F.; Lema, J.M.; Mauricio-Iglesias, M.; Soares, A.; Hospido, A. Monitoring and diagnosis of energy consumption in wastewater treatment plants. A state of the art and proposals for improvement. Appl. Energy 2016, 179, 1251–1268. [Google Scholar] [CrossRef]
  14. Szatkowska, B.; Neczej, E. Analiza Ścieżek Odzysku Energii i Poprawy Efektywności w Komunalnych Oczyszczalniach Ścieków; ETV4Water Consortium: Oslo, NOR, 2017; Available online: https://etv.ietu.pl/wp-content/uploads/2017/09/ETV4Water_WP1_Report.pdf (accessed on 15 November 2023).
  15. Krzeminski, P.; Van Der Graaf, J.H.J.M.; Van Lier, J.B. Specific energy consumption of membrane bioreactor (MBR) for sewage treatment. Water Sci. Technol. 2012, 65, 380–392. [Google Scholar] [CrossRef]
  16. Ranieri, E.; Giuliano, S.; Ranieri, A.C. Energy consumption in anaerobic and aerobic based wastewater treatment plants in Italy. Water Pract. Technol. 2021, 16, 851–863. [Google Scholar] [CrossRef]
  17. Vaccari, M.; Foladori, P.; Nembrini, S.; Vitali, F. Benchmarking of energy consumption in municipal wastewater treatment plants—A survey of over 200 plants in Italy. Water Sci. Technol. 2018, 77, 2242–2252. [Google Scholar] [CrossRef]
  18. Zeng, S.; Chen, X.; Dong, X.; Liu, Y. Efficiency assessment of urban wastewater treatment plants in China: Considering greenhouse gas emissions. Resour. Conserv. Recycl. 2017, 120, 157–165. [Google Scholar] [CrossRef]
  19. Pei, M.; Zhang, B.; He, Y.; Su, J.; Gin, K.; Lev, O.; Shen, G.; Hu, S. State of the art of tertiary treatment technologies for controlling antibiotic resistance in wastewater treatment plants. Environ. Int. 2019, 131, 105026. [Google Scholar] [CrossRef]
  20. Silva, C.; Rosa, M.J. Energy performance indicators of wastewater treatment: A field study with 17 Portuguese plants. Water Sci. Technol. 2015, 72, 510–519. [Google Scholar] [CrossRef]
  21. Svardal, K.; Kroiss, H. Energy requirements for waste water treatment. Water Sci. Technol. 2011, 64, 1355–1361. [Google Scholar] [CrossRef]
  22. Gu, Y.; Li, Y.; Li, X.; Luo, P.; Wang, H.; Wang, X.; Wu, J.; Li, F. Energy Self-sufficient Wastewater Treatment Plants: Feasibilities and Challenges. Energy Procedia 2017, 105, 3741–3751. [Google Scholar] [CrossRef]
  23. Llácer-Iglesias, R.M.; López-Jiménez, P.A.; Pérez-Sánchez, M. Energy self-sufficiency aiming for sustainable wastewater systems: Are all options being explored? Sustainability 2021, 13, 5537. [Google Scholar] [CrossRef]
  24. Nakkasunchi, S.; Hewitt, N.J.; Zoppi, C.; Brandoni, C. A review of energy optimization modelling tools for the decarbonisation of wastewater treatment plants. J. Clean. Prod. 2021, 279, 123811. [Google Scholar] [CrossRef]
  25. Avilés, A.B.L.; Velázquez, F.D.C.; del Riquelme, M.L.P. Methodology for energy optimization in wastewater treatment plants. Phase I: Control of the best operating conditions. Sustainability 2019, 11, 3919. [Google Scholar] [CrossRef]
  26. Diaz-Elsayed, N.; Rezaei, N.; Guo, T.; Mohebbi, S.; Zhang, Q. Wastewater-based resource recovery technologies across scale: A review. Resour. Conserv. Recycl. 2019, 145, 94–112. [Google Scholar] [CrossRef]
  27. Guerra-Rodríguez, S.; Oulego, P.; Rodríguez, E.; Singh, D.N.; Rodríguez-Chueca, J. Towards the implementation of circular economy in the wastewater sector: Challenges and opportunities. Water 2020, 12, 1431. [Google Scholar] [CrossRef]
  28. Zhang, X.; Wei, Y.; Pan, H.; Xiao, H.; Wu, J.; Zhang, Y. The comparison of performances of a sewage treatment system before and after implementing the cleaner production measure. J. Clean. Prod. 2015, 91, 216–228. [Google Scholar] [CrossRef]
  29. Gandiglio, M.; Lanzini, A.; Soto, A.; Leone, P.; Santarelli, M. Enhancing the energy efficiency of wastewater treatment plants through co-digestion and fuel cell systems. Front. Environ. Sci. 2017, 5, 70. [Google Scholar] [CrossRef]
  30. Bergamo, U.; Viccione, G.; Coppola, S.; Landi, A.; Meda, A.; Gualtieri, C. Analysis of anaerobic digester mixing: Comparison of long shafted paddle mixing vs gas mixing. Water Sci. Technol. 2020, 81, 1406–1419. [Google Scholar] [CrossRef]
  31. Subbarao, P.M.V.; D’ Silva, T.C.; Adlak, K.; Kumar, S.; Chandra, R.; Vijay, V.K. Anaerobic digestion as a sustainable technology for efficiently utilizing biomass in the context of carbon neutrality and circular economy. Environ. Res. 2023, 234, 116286. [Google Scholar] [CrossRef]
  32. Shi, C.Y. Mass Flow and Energy Efficiency of Municipal Wastewater Treatment Plants; IWA Publishing: London, UK, 2011; ISBN 9781780400907. [Google Scholar]
  33. Enebe, N.L.; Chigor, C.B.; Obileke, K.; Lawal, M.S.; Enebe, M.C. Biogas and Syngas Production from Sewage Sludge: A Sustainable Source of Energy Generation. Methane 2023, 2, 192–217. [Google Scholar] [CrossRef]
  34. Mirmasoumi, S.; Ebrahimi, S.; Saray, R.K. Enhancement of biogas production from sewage sludge in a wastewater treatment plant: Evaluation of pretreatment techniques and co-digestion under mesophilic and thermophilic conditions. Energy 2018, 157, 707–717. [Google Scholar] [CrossRef]
  35. Kretschmer, F.; Neugebauer, G.; Stoeglehner, G.; Ertl, T. Participation as a key aspect for establishing wastewater as a source of renewable energy. Energies 2018, 11, 3232. [Google Scholar] [CrossRef]
  36. Karki, R.; Chuenchart, W.; Surendra, K.C.; Shrestha, S.; Raskin, L.; Sung, S.; Hashimoto, A.; Kumar Khanal, S. Anaerobic co-digestion: Current status and perspectives. Bioresour. Technol. 2021, 330, 125001. [Google Scholar] [CrossRef]
  37. Linville, J.L.; Shen, Y.; Schoene, R.P.; Nguyen, M.; Urgun-Demirtas, M.; Snyder, S.W. Impact of trace element additives on anaerobic digestion of sewage sludge with in-situ carbon dioxide sequestration. Process Biochem. 2016, 51, 1283–1289. [Google Scholar] [CrossRef]
  38. Bardi, M.J.; Vinardell, S.; Astals, S.; Koch, K. Opportunities and challenges of micronutrients supplementation and its bioavailability in anaerobic digestion: A critical review. Renew. Sustain. Energy Rev. 2023, 186, 113689. [Google Scholar] [CrossRef]
  39. Nie, W.; He, S.; Lin, Y.; Cheng, J.J.; Yang, C. Functional biochar in enhanced anaerobic digestion: Synthesis, performances, and mechanisms. Sci. Total Environ. 2024, 906, 167681. [Google Scholar] [CrossRef]
  40. Gambini, M.; Vellini, M.; Stilo, T.; Manno, M.; Bellocchi, S. High-efficiency cogeneration systems: The case of the paper industry in Italy. Energies 2019, 12, 335. [Google Scholar] [CrossRef]
  41. Zacchei, E.; Colacicco, A. Direct Method to Design Solar Photovoltaics to Reduce Energy Consumption of Aeration Tanks in Wastewater Treatment Plants. Infrastructures 2022, 7, 79. [Google Scholar] [CrossRef]
  42. Odabaş Baş, G.; Aydinalp Koksal, M. Environmental and Techno-Economic Analysis of the Integration of Biogas and Solar Power Systems to Urban Wastewater Treatment Plants. SSRN Electron. J. 2022. [Google Scholar] [CrossRef]
  43. Rani, A.; Snyder, S.W.; Kim, H.; Lei, Z.; Pan, S.Y. Pathways to a net-zero-carbon water sector through energy-extracting wastewater technologies. Npj Clean Water 2022, 5, 49. [Google Scholar] [CrossRef]
  44. Lazarova, V.; Choo, K.-H.; Cornel, P. Water-Energy Interactions in Water Reuse; IWA Publishing: London, UK, 2012. [Google Scholar]
  45. Lazarova, V.; Choo, K.-H.; Cornel, P. Meeting the challenges of the water-energy nexus: The role of reuse and wastewater treatment. Water21 2012, 14, 12–17. [Google Scholar]
  46. Spriet, J.; McNabola, A.; Neugebauer, G.; Stoeglehner, G.; Ertl, T.; Kretschmer, F. Spatial and temporal considerations in the performance of wastewater heat recovery systems. J. Clean. Prod. 2020, 247, 119583. [Google Scholar] [CrossRef]
  47. Żaba, T. Energetycznie pasywna oczyszczalnia ścieków—Innowacja czy konieczność? Kierun. Wod-Kan 2022, 3, 64–69. [Google Scholar]
  48. Zhang, F.; Peng, Y.; Sun, J.; Liu, Y.; Yin, W.; Wang, Y.; Lu, X.; Zhao, L. Ultra-low energy consumption process (PN+Anammox) for enhanced nitrogen removal from decentralized sewage. Chem. Eng. J. 2021, 426, 130769. [Google Scholar] [CrossRef]
  49. Mąkinia, J.; Zaborowska, E.; Ramm, K. Jakie będą oczyszczalnie’jutra”? Kierun. Wod. Kan 2022, 3, 24–28. [Google Scholar]
  50. Koul, Y.; Devda, V.; Varjani, S.; Guo, W.; Ngo, H.H.; Taherzadeh, M.J.; Chang, J.S.; Wong, J.W.C.; Bilal, M.; Kim, S.H.; et al. Microbial electrolysis: A promising approach for treatment and resource recovery from industrial wastewater. Bioengineered 2022, 13, 8115–8134. [Google Scholar] [CrossRef]
  51. Zoppi, G.; Pipitone, G.; Pirone, R.; Bensaid, S. Aqueous phase reforming process for the valorization of wastewater streams: Application to different industrial scenarios. Catal. Today 2022, 387, 224–236. [Google Scholar] [CrossRef]
  52. Municipal Utilities Company located in Krosno—Krośnieński Holding Komunalny (Krosno, Podkarpackie Province, Poland), Personal Communication. 2023.
  53. Masłoń, A. Analysis of energy consumption at the Rzeszów Wastewater Treatment Plant. E3S Web Conf. 2017, 22, 4–11. [Google Scholar] [CrossRef]
  54. Masłoń, A. Energy Consumption of Selected Wastewater Treatment Plants Located in South-Eastern Poland. Eng. Prot. Environ. 2017, 20, 331–342. [Google Scholar] [CrossRef]
  55. He, Y.; Zhu, Y.; Chen, J.; Huang, M.; Wang, P.; Wang, G.; Zou, W.; Zhou, G. Assessment of energy consumption of municipal wastewater treatment plants in China. J. Clean. Prod. 2019, 228, 399–404. [Google Scholar] [CrossRef]
  56. Bagherzadeh, F.; Nouri, A.S.; Mehrani, M.-J.; Thennadil, S. Prediction of energy consumption and evaluation of affecting factors in a full-scale WWTP using a machine learning approach. Process Saf. Environ. Prot. 2021, 154, 458–466. [Google Scholar] [CrossRef]
  57. Heidrich, Z.; Ramocki, W. Energochłonność miejskich oczyszczalni ścieków. Forum Eksploatatora 2009, 5, 46–49. [Google Scholar]
  58. Szczyrba, P.; Masłoń, A.; Czarnota, J.; Olszewski, K. Analysis of sewage sludge and biogas-energy management at the opole wastewater treatment plant; [Analiza gospodarki osadowej i biogazowoenergetycznej w oczyszczalni ścieków w opolu]. Inz. Ekol. 2020, 21, 26–34. [Google Scholar] [CrossRef]
  59. Masłoń, A.; Czarnota, J.; Szaja, A.; Szulżyk-Cieplak, J.; Łagód, G. The Enhancement of Energy Efficiency in a Wastewater Treatment Plant through Sustainable Biogas Use: Case Study from Poland. Energies 2020, 13, 6056. [Google Scholar] [CrossRef]
  60. Masłoń, A.; Tendera, K. Gospodarka odpadami ściekowymi w oczyszczalni ścieków Rzeszów. Forum Eksploatatora 2017, 1, 38–45. [Google Scholar]
  61. Niu, K.; Wu, J.; Qi, L.; Niu, Q. Energy intensity of wastewater treatment plants and influencing factors in China. Sci. Total Environ. 2019, 670, 961–970. [Google Scholar] [CrossRef]
  62. Wang, H.; Yang, Y.; Keller, A.A.; Li, X.; Feng, S.; Dong, Y.; Li, F. Comparative analysis of energy intensity and carbon emissions in wastewater treatment in USA, Germany, China and South Africa. Appl. Energy 2016, 184, 873–881. [Google Scholar] [CrossRef]
  63. Masłoń, A. An Analysis of Sewage Sludge and Biogas Production at the Zamość WWTP. In Lecture Notes in Civil Engineering; Springer: Berlin/Heidelberg, Germany, 2020; Volume 47, pp. 291–298. ISBN 9783030270117. [Google Scholar]
  64. Masłoń, A.; Pazdro, S.; Mroczek, W. Gospodarka osadowa w oczyszczalni ścieków w Mielcu. Forum Eksploatatora 2015, 4, 47–54. [Google Scholar]
  65. Masłoń, A.; Czarnota, J. Biogas production from sewage sludge as an energy balance element of the wastewater treatment plant. In Proceedings of the VI International Scientific and Technical Conference “Pure Water. Fundamental, Applied and Industrial Aspects”, Kiev, Ukraine, 14–15 November 2019; pp. 46–48. [Google Scholar]
  66. Gazda, M.; Adam, R.; Sudak, M. Research on cofermentation of sewage sludge with waste fats for the wastewater treatment plant in Brzeg. Infrastruct. Ecol. Rural Areas 2012, 3, 79–90. [Google Scholar]
  67. Torregrossa, D.; Castellet-Viciano, L.; Hernández-Sancho, F. A data analysis approach to evaluate the impact of the capacity utilization on the energy consumption of wastewater treatment plants. Sustain. Cities Soc. 2019, 45, 307–313. [Google Scholar] [CrossRef]
  68. Miaśkieicz, K. Oszczędności energetyczne i kosztowe. Nowoczesne mieszadła średnoobrotowe Wilo. Kierun. Wod-Kan 2022, 3, 70–71. [Google Scholar]
  69. Grosser, A.; Neczaj, E. Sewage sludge and fat rich materials co-digestion—Performance and energy potential. J. Clean. Prod. 2018, 198, 1076–1089. [Google Scholar] [CrossRef]
  70. Liu, Y.; Gu, J.; Zhang, M. A-B Processes towards Energy Self-Sufficient Municipal Wastewater Treatment; IWA Publishing: London, UK, 2019. [Google Scholar]
  71. Chow, W.L.; Chong, S.; Lim, J.W.; Chan, Y.J.; Chong, M.F. Anaerobic Co-Digestion of Wastewater Sludge: A Review of Potential Co-Substrates and Operating. Processes 2020, 8, 39. [Google Scholar] [CrossRef]
  72. Bień, B.; Bień, J.D. Conditioning of sewage sludge with physical, chemical and dual methods to improve sewage sludge dewatering. Energies 2021, 14, 5079. [Google Scholar] [CrossRef]
  73. Budych-Gorzna, M.; Smoczynski, M.; Oleskowicz-Popiel, P. Enhancement of biogas production at the municipal wastewater treatment plant by co-digestion with poultry industry waste. Appl. Energy 2016, 161, 387–394. [Google Scholar] [CrossRef]
  74. Wójcik, M.; Stachowicz, F. Influence of physical, chemical and dual sewage sludge conditioning methods on the dewatering efficiency. Powder Technol. 2019, 344, 96–102. [Google Scholar] [CrossRef]
  75. Zawieja, I.; Włodarczyk, R.; Kowalczyk, M. Biogas generation from sonicated excess sludge. Water 2019, 11, 2127. [Google Scholar] [CrossRef]
  76. Zawieja, I. Effect of thermal and alkaline disintegration of excess sludge on biodegradation. J. Ecol. Eng. 2019, 20, 172–182. [Google Scholar] [CrossRef]
  77. Bień, B.; Bień, J.D. Dewatering of sewage sludge treated by the combination of ultrasonic field and chemical methods. Desalin. Water Treat. 2020, 199, 72–78. [Google Scholar] [CrossRef]
  78. Kamizela, T.; Kowalczyk, M.; Zawieja, I. The use of chemical methods and magnetic field in conditioning and dewatering of digested sewage sludge. Water 2020, 12, 1642. [Google Scholar] [CrossRef]
  79. Kim, H.; Koo, B.; Sun, X.; Yoon, J.Y. Investigation of sludge disintegration using rotor-stator type hydrodynamic cavitation reactor. Sep. Purif. Technol. 2020, 240, 116636. [Google Scholar] [CrossRef]
  80. Xu, D.; Han, X.; Chen, H.; Yuan, R.; Wang, F.; Zhou, B. New insights into impact of thermal hydrolysis pretreatment temperature and time on sewage sludge: Structure and composition of sewage sludge from sewage treatment plant. Environ. Res. 2020, 191, 110122. [Google Scholar] [CrossRef]
  81. Svensson, K.; Kjørlaug, O.; Higgins, M.J.; Linjordet, R.; Horn, S.J. Post-anaerobic digestion thermal hydrolysis of sewage sludge and food waste: Effect on methane yields, dewaterability and solids reduction. Water Res. 2018, 132, 158–166. [Google Scholar] [CrossRef]
  82. Yang, D.; Hu, C.; Dai, L.; Liu, Z.; Dong, B.; Dai, X. Post-thermal hydrolysis and centrate recirculation for enhancing anaerobic digestion of sewage sludge. Waste Manag. 2019, 92, 39–48. [Google Scholar] [CrossRef]
  83. Mukawa, J.; Pająk, T.; Rzepecki, T.; Banaś, M. Energy Potential of Biogas from Sewage Sludge after Thermal Hydrolysis and Digestion. Energies 2022, 15, 5255. [Google Scholar] [CrossRef]
  84. Hogan, F.; Mormede, S.; Clark, P.; Crane, M. Ultrasonic sludge treatment for enhanced anaerobic digestion. Water Sci. Technol. 2004, 50, 25–32. [Google Scholar] [CrossRef]
  85. Borukało, K.; Kowal, L.; Milanowski, A. Ultradźwiękami w osad. Przegląd Komunaln. 2013, 2, 40–46. [Google Scholar]
  86. Becker, C.M.; Marder, M.; Junges, E.; Konrad, O. Technologies for biogas desulfurization—An overview of recent studies. Renew. Sustain. Energy Rev. 2022, 159, 112205. [Google Scholar] [CrossRef]
  87. Masłoń, A.; Wójcik, M.; Chmielowski, K. Efficient Use of Energy in Wastewater Treatment Plants. Energy Policy Stud. 2018, 1, 12–26. [Google Scholar]
  88. Dąbrowska, S.; Masłoń, A. The Use of Biogas From the Anaerobic Digestion of Sewage Sludge To Improve the Energy Balance of Wastewater Treatment Plants. J. Civ. Eng. Environ. Archit. 2020, 37, 5–18. [Google Scholar] [CrossRef]
Figure 1. Technological scheme of the WWTP Krosno (simplified from data provided by Municipal Utility Company located in Krosno, Poland [52]).
Energies 17 01164 g001
Figure 2. Diagram of the sludge–biogas node of the WWTP Krosno (simplified from data provided by Municipal Utility Company located in Krosno, Poland [52]).
Energies 17 01164 g002
Figure 3. Effect of BOD5 load on inflow on energy utilization of the treatment plant (a) and hydraulic load on energy utilization of the treatment plant (b).
Energies 17 01164 g003
Figure 4. Energy utilization of the WWTP (a) and monthly summary of energy utilization of the WWTP (b) in 2016–2019, as well as the biogas yield (c) and monthly biogas yield (d) for 2016–2019.
Energies 17 01164 g004
Figure 5. Relationship between the amount of biogas produced and the amount of total solids per day.
Energies 17 01164 g005
Figure 6. The electricity production per 1 m3 of treated wastewater (a) and the electricity production per 1 m3 of biogas (b).
Energies 17 01164 g006
Figure 7. Production and consumption of electricity including self-sufficiency.
Energies 17 01164 g007
Figure 8. Monthly balance of energy production, consumption, and sales at the WWTP.
Energies 17 01164 g008
Figure 9. The concept of changing the technological line of sludge treatment aimed at applying the co-digestion process at the Krosno WWTP (own elaboration).
Energies 17 01164 g009
Figure 10. Proposed system for sewage sludge technological line involving pre-treatment stage at the Krosno WWTP.
Energies 17 01164 g010
Figure 11. A model for strategies toward self-sustainability of WWTPs [88].
Energies 17 01164 g011
Table 1. Directions and actions to achieve energy self-sufficiency for WWTPs (own elaboration based on the literature).
DirectionActionLiterature
Reducing energy consumption of existing equipment
Enhancing the operational efficiency of the equipment used;
[23,24,25]
Enhancing the level of automation of the most energy-intensive processes, such as aeration;
Conducting specialized training for operators;
Implementing processes with lower energy demand.
Implementing technologies allowing for recovery of energy from wastewater/sludge and production of renewable energy
Applying solutions allowing recovery of chemical energy from wastewater;
Applying solutions allowing recovery of thermal and/or mechanical energy from wastewater;
[24,26,27]
Applying installations for obtaining energy from, among others, water/wastewater and the sun, based on water turbines and photovoltaic panels.
Table 2. Basic technical parameters of the CHP modules in operation at the WWTP Krosno (simplified from Municipal Utility Company [52]).
Technical ParameterUnitValue
Electric power[kW]192
Thermal power[kW]214
Rotational speed[rpm]1500
Maximum water temperature at the inlet[°C]70
Maximum water temperature at the outlet[°C]90
Maximum electrical power demand for auxiliary drives[kW]4
Gas consumption (for 54% CH4)[Nm3/h]90.7
Table 3. Influent wastewater parameters in 2016–2019 (simplified from Municipal Utility Company [52]).
Hydraulic Load
ParameterMinimumMaximumAverageSD
Total amount of wastewater, m3/d14,858.032,351.621,743.64240.0
Physicochemical Parameters
ParameterMinimumMaximumAverageSD
Biochemical oxygen demand (BOD5)mg/L125.5680.5342.5112.5
kg/d4060.114,384.87150.11952.5
Chemical oxygen demand
(COD)
mg/L375.51295.0794.4211.1
kg/d9556.223,780.916,613.02756.8
Total suspended solids
(TSSs)
mg/L180.0805.0475.1141.5
kg/d3857.415,008.49991.12438.8
Total nitrogen (TN)mg/L28.2113.873.219.0
kg/d913.92077.91514.8224.3
Total phosphorous (TP)mg/L3.426.213.54.8
kg/d108.4569.5280.579.3
SD is the standard deviation of means at p = 0.01.
Table 4. Qualitative composition of the treated biogas.
ParameterMinimumMaximumAverageSD
CH4, % v/v50.665.861.84.68
CO2, % v/v29.244.535.43.8
Other, % v/v0.015.251.753.83
H2S, ppm6.2207.095.267.2
Table 5. Energy balance of the Krosno WWTP in 2016–2019 (an average value was given for each year).
YearProductionEnergy PurchaseEnergy ConsumptionEnergy SalesSelf-Sufficiency
[kWh][kWh][kWh][kWh][%]
2016122,370.00195,666.75317,685.83350.9238.92
2017172,639.67123,266.12293,985.331920.4558.92
2018166,937.17173,977.65340,262.1567.9249.16
2019184,953.75154,395.75337,640.151164.0254.87
Disclaimer/Publisher’s Note: The statements, opinions and data contained in all publications are solely those of the individual author(s) and contributor(s) and not of MDPI and/or the editor(s). MDPI and/or the editor(s) disclaim responsibility for any injury to people or property resulting from any ideas, methods, instructions or products referred to in the content.