Article

Strategies for Improving the Resiliency of Distribution Networks in Electric Power Systems during Typhoon and Water-Logging Disasters

1
Shenzhen Power Supply Co., Ltd., Shenzhen 518020, China
2
School of Electrical Engineering, Xi’an Jiaotong University, Xi’an 710049, China
*
Author to whom correspondence should be addressed.
Energies 2024, 17(5), 1165; https://doi.org/10.3390/en17051165
Submission received: 7 February 2024 / Revised: 25 February 2024 / Accepted: 27 February 2024 / Published: 1 March 2024
(This article belongs to the Section F3: Power Electronics)

Abstract

:
Coastal cities often face typhoons and urban water logs, which can cause power outages and significant economic losses. Therefore, it is necessary to study the impact of these disasters on urban distribution networks and improve their flexibility. This paper presents a method for predicting power-grid failure rates in typhoons and water logs and suggests a strategy for improving network elasticity after the disaster. It is crucial for the operation and maintenance of power distribution systems during typhoon and water-logging disasters. By mapping the wind speed and water depth at the corresponding positions in the evolution of wind and water logging disasters to the vulnerability curve, the failure probability of the corresponding nodes is obtained, the fault scenario is generated randomly, and the proposed dynamic reconstruction method, which can react in real-time to the damage the distribution system received, has been tested on a modified 33-node and a 118-node distribution network, with 3 and 11 distribution generators loaded, respectively. The results proved that this method can effectively improve the resiliency of the distribution network after a disaster compared with the traditional static reconstruction method, especially in the case of long-lasting wind and flood disasters that have complex and significant impacts on the distribution system, with about 26% load supply for the 33-node system and nearly 95% for the 118-node system.

1. Introduction

Extreme weather events have become more frequent around the world in recent years [1,2,3], causing natural disasters such as heavy rain, typhoons, tsunamis, and water-logging. These events have led to severe challenges for urban public services including power facilities, resulting in power outages and significant losses to the national economy, posing a serious threat to sustainable urban development and human lives [4].
To address these challenges, most existing studies focus on microgrid reconstruction to enhance the resiliency of the distribution network and its ability to cope with the impact of extreme weather events [5,6,7,8,9]. For instance, study [8] proposed a strategy of running network reconstruction during strong wind events to maximize the network’s resiliency while minimizing line-switching operations. Study [10] suggested a two-stage reconstruction algorithm with an analytical hierarchical process (AHP) calculating composite elasticity, to ensure the most cost-effective or efficient distribution system reconstruction strategy. A multi-objective microgrid reconfiguration optimization algorithm based on dart game theory is proposed in study [9], which aims to minimize total loss, load reduction, and total recovery costs while ensuring compliance with various topological and electrical constraints. The importance of emergency demand response planning (EDRP) is demonstrated using an improved IEEE 33 bus test system as an example. Some studies also consider adding renewable energy, distributed power supply, mobile energy storage, electric vehicles, and other resources to enhance the distribution network’s resiliency [11,12,13,14]. Others focus on pre-disaster deployment and post-disaster maintenance [15,16,17,18,19]. For example, study [17] proposed a resilient distribution network planning problem (RDNP) to cope with natural disasters such as hurricanes, which minimizes system losses through line reinforcement and allocation of distributed generation resources. In study [18], the maintenance and restoration of a radial distribution network is modeled as a scheduling problem with soft priority constraints and expressed as time-indexed integer linear programming (LP) with valid inequalities. Study [19] studied five attributes of network loss reduction, reliability improvement, network expansion delay, power outage cost, and installation cost of an energy storage configuration under normal, fault, and disaster scenarios.
Some studies modeled the fault situation of the distribution network in typhoons and extreme temperature weather [20,21,22,23,24], which can be roughly divided into two categories. Some use event probability models and vulnerability curves to simulate power system faults. Study [22] established the probability generation model of typhoons and the space–time vulnerability model of distribution network lines. The temporal and spatial impact of typhoons on distribution networks is quantified. A breadth-first search algorithm isolates the distribution network. The load reduction of each isolated microgrid is calculated. Then, the elasticity of the distribution network is quantitatively evaluated, and the IEEE 33 bus test system is used as an example for verification. The other category does not require detailed models of extreme events but evaluates based on neural networks and other technologies. For example, study [23] uses multi-source data fusion technology and neural network modeling technology and constructs fuzzy evaluation functions to analyze the fault degree of different distribution networks under typhoon weather. Study [24] estimates the total power demand of the distribution network under extreme temperature conditions by simulating and modeling the distribution network. It takes the power supply of Texas during the winter storm Uri in 2021 as a case study. In comparison with the actual situation, the case proves that the proposed simulation method can significantly reduce potential unmet energy and improve energy utilization.
It is worth noting that most studies on the impact of disasters on power systems have overlooked urban water logging. Coastal cities are especially vulnerable to heavy rainfall during typhoon season, which can lead to water logging in urban areas. This can cause damage to the distribution system’s components, leading to power outages that result in significant economic losses and negative social impacts [25,26,27,28,29,30].
Given the pressing need for study on improving the distribution network’s elasticity during typhoon and water-logging disasters, this paper proposes a method for enhancing the elasticity of the distribution network, including quantifying the failure probability of distribution network components according to the wind speed and water depth, and a dynamic microgrid reconstruction mathematical model, which can react in real-time to the damage the distribution system received during typhoon and water-logging disasters.
In Section 2 of this paper, the influence of the power system under typhoon and water-logging scenarios is modeled. In Section 3, a dynamic microgrid reconstruction mathematical model is built. A numerical case study is provided in Section 4 to verify the model, and the conclusions are presented in Section 5.

2. Vulnerability Model of Distribution System Components in Wind and Flood Scenarios

Typhoons, rainstorms, and floods will further cause water logging. Urban water logging refers to the phenomenon that heavy precipitation or continuous precipitation far exceeds the interception and drainage capacity of a region, resulting in water accumulation in underground space or low-lying areas [31,32,33]. Substation flooding caused by urban water logging and distribution network lines and tower damage caused by typhoons are the main failure modes of the power grid in typhoon and water-logging disasters [34,35]. Assuming that weather parameters (such as wind speed and precipitation depth) are known, the vulnerability curves of distribution network lines, towers, substations, buried cables, and other vulnerable components under water-logging and typhoon scenarios are established in this section, and the failure probability of power system components is obtained by combining the vulnerability curves with weather conditions, which provides the basis for future research.
The fragility function describes the probability of the failure of a structure or component under conditions that depend on the load associated with the potentially hazardous strength (such as the depth of water logging in a substation). The vulnerability curve is based on (a) a statistical analysis of a large number of historical data, (b) an experiment, (c) a model analysis; (d) professional judgment; and (e) a combination of the above [36].
The strength characteristics of various engineering structures are a lognormal distribution. That is, for a given piece of equipment, the risk threshold, in other words, the strength of risk factors (such as depth of immersion), at the time of damage can be described by a lognormal distribution [37], as follows:
ln S d , d s N ( ln S ¯ d , d s , β d , d s 2 )
where S d is the risk factor (such as the depth of water now), S d , d s is the risk threshold (such as the depth of water immersion when damaged), that is, for a piece of equipment, in a destructive test, when the risk factor S d is under S d , d s , the equipment works as usual, and above S d , d s , it shuts down. S ¯ d , d s is the median of S d , d s . β d , d s is the standard deviation of the natural logarithm of the equipment damage threshold ( S d , d s ). Then, the POS (Probability of an Outage Start) of equipment failure at a given risk factor S d can be expressed as
P O S ( S d ) = f ( S d ) = 1 S d 2 π β d , d s exp [ 1 2 β d , d s 2 ( ln S d S ¯ d , d s ) 2 ]
where f is the Probability Density Function (PDF).
The probability of the device being in a failure state (the event is denoted as d s ) at a given risk factor ( S d ), denoted as P ( d s | S d ) , can be expressed by the Cumulative Distribution Function (CDF).
P ( d s | S d ) = F ( S d ) = Φ 1 β d , d s ln ( S d S ¯ d , d s )
where Φ is the distribution function of the standard normal distribution. This function is difficult to calculate and is often approximated by piecewise linear functions.
To simplify the problem, we assume that all similar devices in the distribution network share the same vulnerability curve. The following part discusses the distribution network tower, distribution network line, and substation, respectively.

2.1. Vulnerability Model of Distribution Network Tower

Regardless of the damage to distribution network towers under good weather conditions, a vulnerability curve is constructed for distribution network towers. The probability that a distribution network tower is in a fault state at time T can be simplified as a function of the wind speed passing through the tower as
P T , T o w ( v ) = 1 , v v collapse P T , T o w , h v ( v ) , v critical v < v collapse 0 v < v critical
where v is the wind speed passing through the tower, v critical represents the wind speed when the failure probability of the tower increases rapidly, and v collapse is the wind speed when the failure probability of the tower is negligible. See [37,38] for relevant parameters. P T , T o w , h v is the failure probability of the tower when the wind speed is high, which can be further simplified as
P T , T o w , h v ( v ) = Φ 1 β ln ( v v ¯ ) 0.00952 v
where β and v ¯ depend on the condition of the tower; here, β 0.3268 , v ¯ 4.5311 .

2.2. Distribution Network Line Vulnerability Model

The line may also be affected by stormy weather. It is considered that the failure of the line and the failure of the tower are independent of each other, so the vulnerability curves are different.
The vulnerability of the line should also be related to the wind speed, and its establishment is similar to Equation (4), like
P T , L i n e = 1 , v v collapse P T , L i n e , h v ( v ) , v critical v < v collapse P L min , v < v critical
where P L min is the failure rate of the line in “good weather” (small wind speed), relevant parameters refer to [37,39]. Since the wind speed in the area where the line passes may be different, the wind speed here is considered as the highest wind speed in the area where the line passes [40].
P T , Line , hv is the fault probability of the line when the wind speed is high but still within the line’s withstand range, which can be further simplified as
P T , L i n e , h v ( v ) = Φ 1 β ln ( v v ¯ ) 0.02333 v
where β and v ¯ depend on the line condition; here, β 0.1926 and ln v ¯ 3.7896 .
The fragility curves of transmission lines and towers to wind are shown in Figure 1.
Then, at time T, considering that the faults of the tower and the line are independent of each other, the probability of branch e failing due to wind can be defined as
P e ( w ) = 1 T o w T ( 1 P T , T o w ) L i n e L ( 1 P T , L i n e )
where P T , T o w and P T , L i n e are, respectively, the failure probability of a single tower or line at time T, obtained by mapping the vulnerability curve of the tower (line) to the position (maximum) wind speed of the tower (line), and T and L represent the collection of the tower and line in branch e.

2.3. Vulnerability Model of Substation and Buried Cable

When the storm develops further and urban water logging occurs, outdoor switches, circuit breaker equipment, transformers, and buried cables in ground substations may be flooded, further affecting the power system [41,42,43,44]. Since the failure conditions of such equipment are all related to the depth of water logging at their locations, their vulnerability models are similar, but some parameters are different. Here, a substation is taken as an example to establish the failure model.
The United States Federal Emergency Management Agency (FEMA) has given the damage curve of substations under normal circumstances when they are flooded (Figure 2) [44]. When the water depth is D, the damage percentage u of the substation can be expressed as
u = ( 4.68 D + 0.77 )
If a device in the substation becomes submerged, the substation stops providing service, and the node trips. The water level depth serves as the risk threshold for the substation to halt its service. FEMA has provided the vulnerability curve for substation flooding, which is shown in Figure 3 [45]. It should be pointed out that, compared with the United States, different regions may have different design standards, protection measures, and substation topology, and other parameters are different as well, but its curve form can be used as a reference.
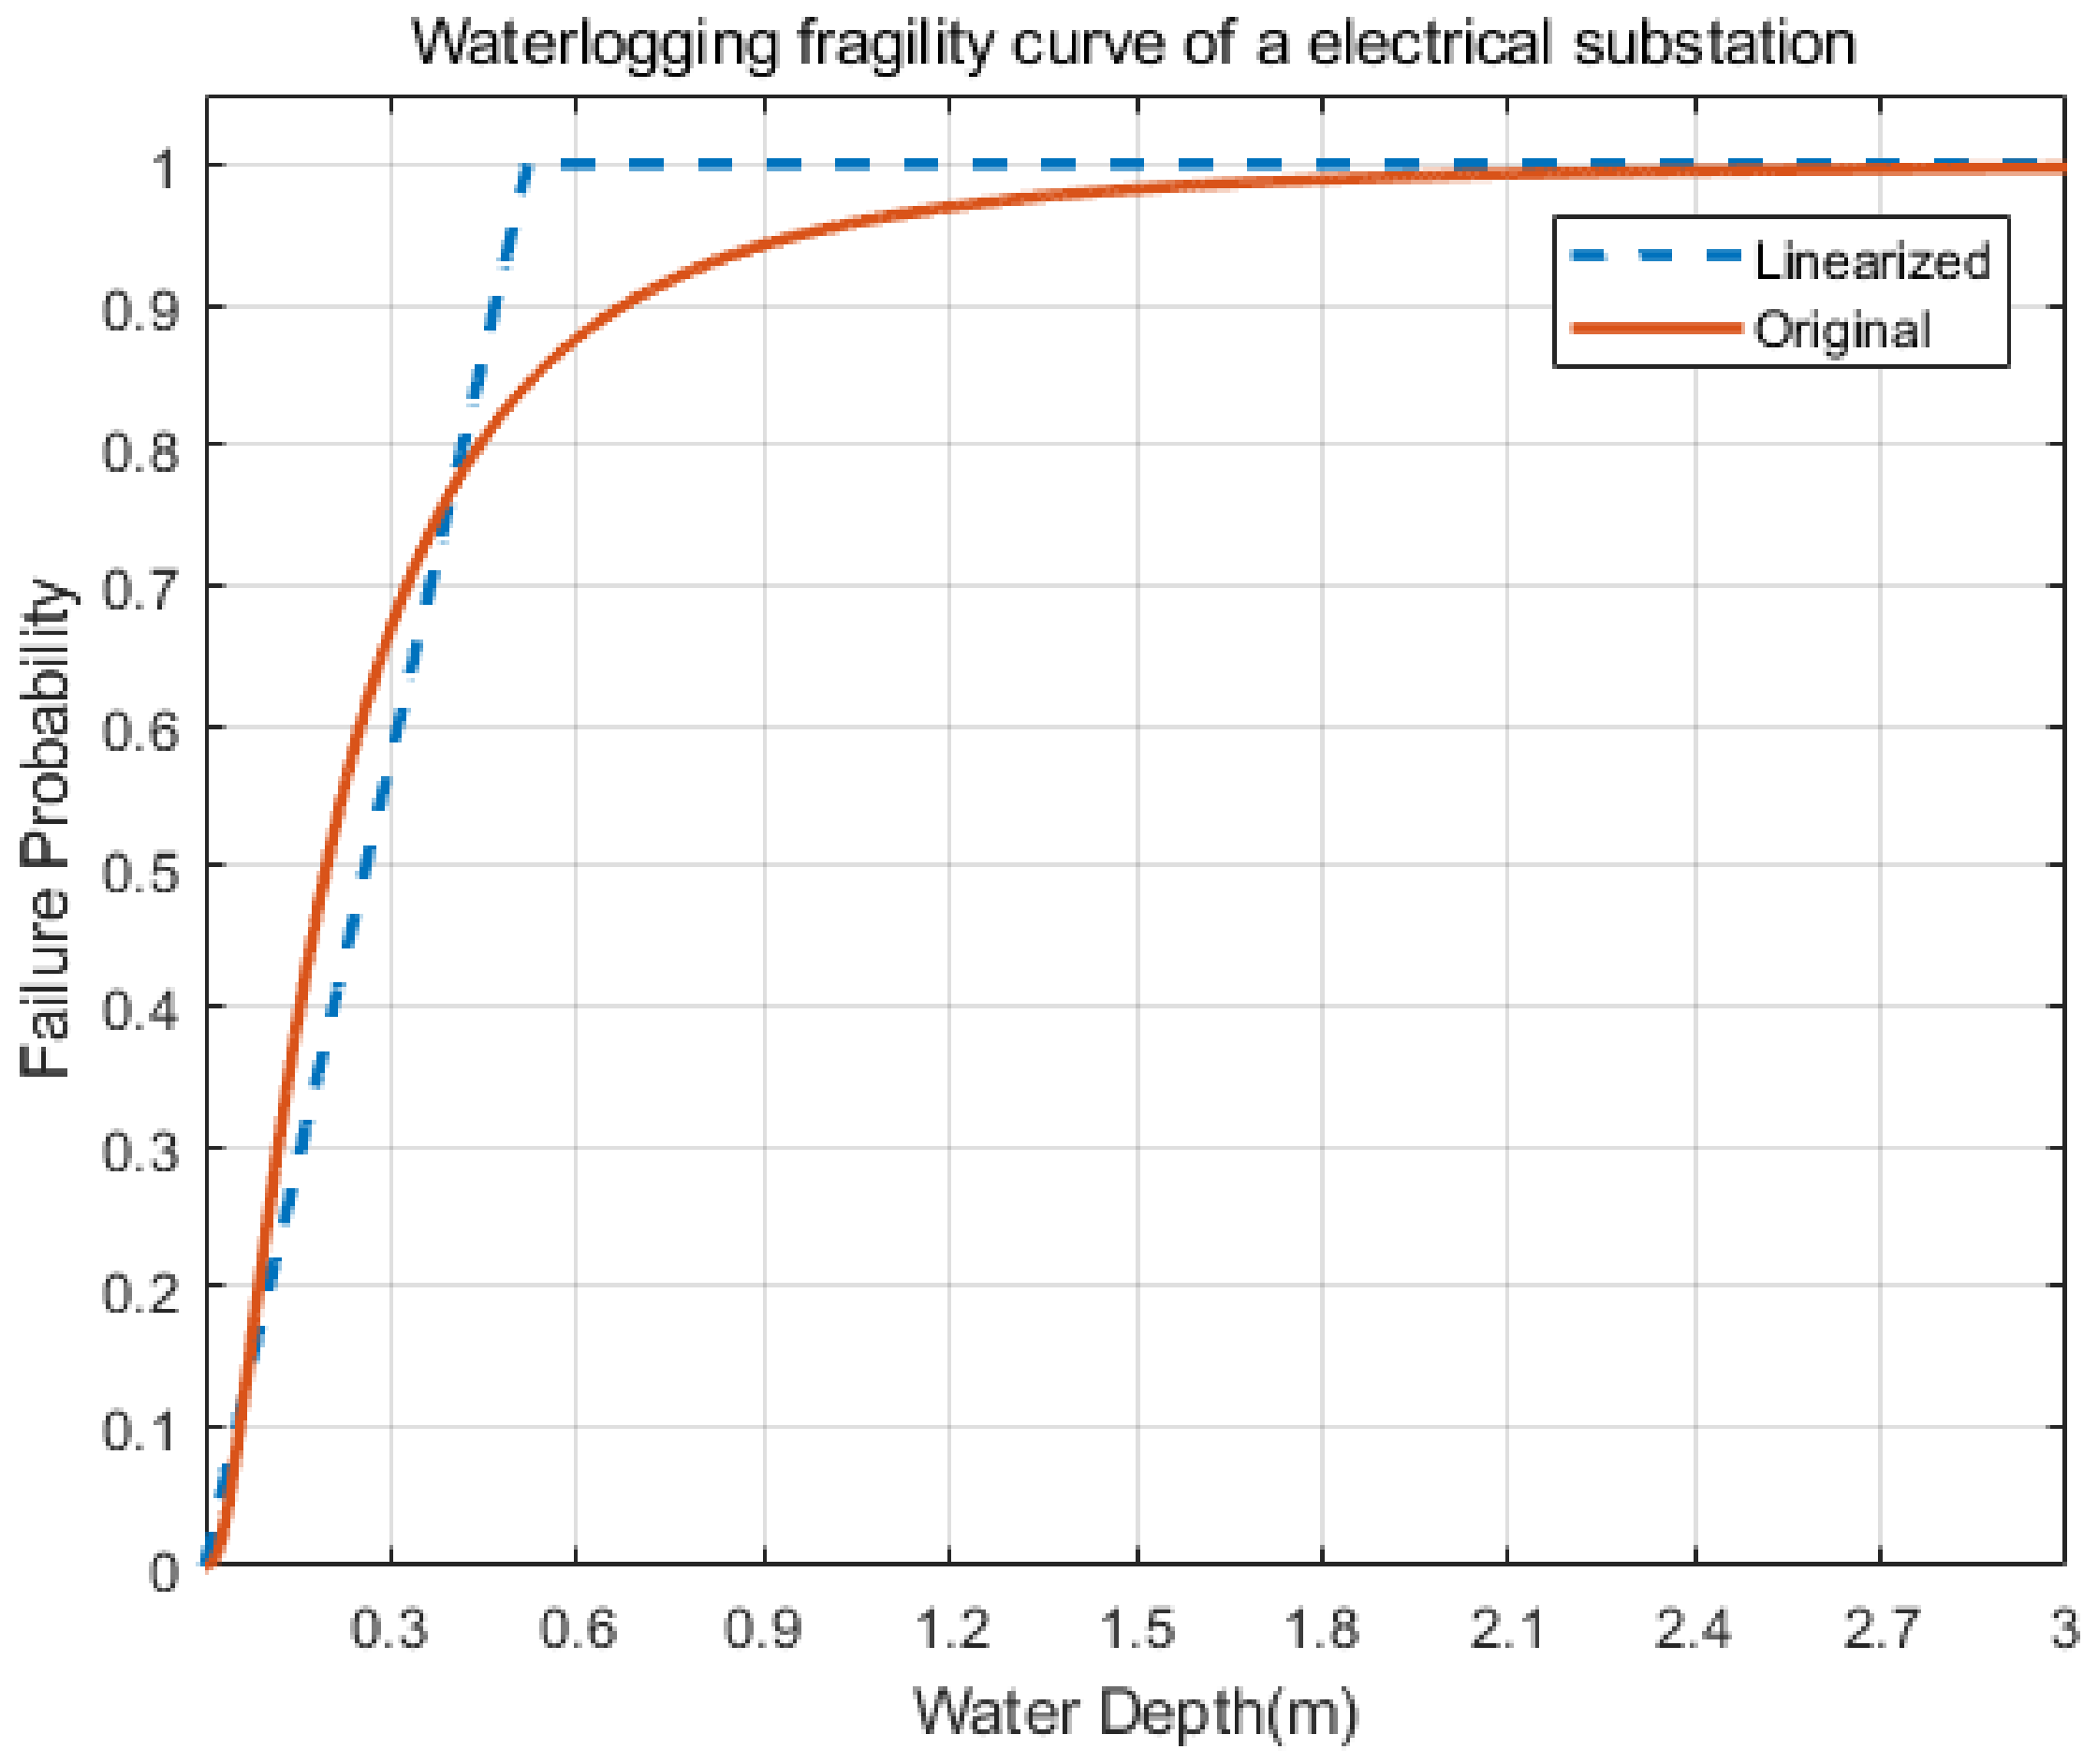
In the substation water-logging fault model established in this paper, the fault probability of a substation at time T can be simplified as a piecewise linear function of substation water-logging depth D, as
P T , S u b ( D ) = 1 , D D collapse P T , S u b , h D ( D ) , 0 < D < D collapse 0 , D = 0
where D is the water depth of the substation, and D collapse is the water depth where the probability of no failure of the substation can be ignored (0.52 m is taken here [46,47], and the curve can be reconstructed according to the historical data of the research object to adapt to the actual situation). The substation damage probability P T , S u b , h D can also be simplified when the water level is high (Figure 4) as follows:
P T , S u b , h D ( D ) = Φ 1 β ln ( D D ¯ ) 1.923 D
The establishment of the vulnerability curve in this paper is mostly based on assumptions and simplification. If there is more historical data relating to the failure of power system components and real-time weather conditions, the existing model can be modified to establish a more accurate vulnerability curve and improve the confidence of the model.

3. A Multi-Objective Dynamic Model Considering Distribution Network Reconstruction under Wind and Flood Disasters

It can be seen from Section 2 that in the evolution process of wind and water-logging disasters, with the changes in wind speed and water-logging depth, the fault situation of the distribution network will also change continuously with the advance of time. The distribution network reconstruction model proposed in this paper considers the dynamic faults of transformers at distribution network nodes and multiple branches caused by wind and water-logging disasters and studies the distribution network faults in the process of disaster evolution by time stages. After the fault, the important load can be recovered by the dynamic adjustment of the line switch, the output dispatching of the distributed power supply, and the optimization of the operation mode of the distribution network. A multi-objective dynamic optimization model was established with the aim of maximum load supply and minimum switching times in the whole research period.

3.1. Objective Function

The model proposed in this paper divides nodes into three classes according to the importance of load at node k and set weights ω k = ω i ( k B , i = 1 , 2 , 3 ) , respectively, and ω 1 ω 2 ω 3 .
To maximize the sum of powered load in each period and minimize the number of switching states, the objective function can be expressed as
max f = α t T k B ω k y k , t P k , t β t T l E ( a l , t a l , t 1 )
where y k , t is a binary variable, indicating whether the load at node k at time t is powered. B is the set of all nodes in the distribution network, E is the set of all branches in the distribution network, and a l , t represents whether the line is connected and is a binary variable. Furthermore, for the coefficient, there is α + β = 1 .

3.2. Constraints

3.2.1. Distribution Network Operation Constraints

Power flow balance constraints and safety constraints are included as
s . t . p j = p j g p j l = j k δ j P j k i j π j ( P i j I i j 2 r i j ) + g j V j 2 , j B q j = q j g q j l = j k δ j Q j k i j π j ( Q i j I i j 2 x i j ) + b j V j 2 , j B
V j 2 = V i 2 2 ( P i j r i j + Q i j x i j ) + I i j 2 ( r i j 2 + x i j 2 ) , i j E
I i j 2 = P i j 2 + Q i j 2 V i 2 , i j E
I i j < I i j < I ¯ i j , i j E
V i < V i < V ¯ i , i B +
where δ j is the set of all the branches of the outgoing node j, π j is the set of all the branches of the incoming node j, and B + represents the set of other nodes except the substation node. These equations contain the following variables: node injection power ( p , q ), branch power flow ( P , Q ), node voltage (V), and branch current (I).
Let I ˜ i j = I i j 2 , V ˜ i = V i 2 , Formula (15) can be SOCP transformed into
s . t . p j = j k δ j P j k i j π j ( P i j I ˜ i j r i j ) + g j V ˜ j , j B q j = j k δ j Q j k i j π j ( Q i j I ˜ i j x i j ) + b j V ˜ j , j B
V ˜ j = V ˜ i 2 ( P i j r i j + Q i j x i j ) + I ˜ i j ( r i j 2 + x i j 2 ) , i j E
2 P i j 2 Q i j I ˜ i j V ˜ j 2 I ˜ i j + V ˜ j , i j E
I ̲ 2 i j < I ˜ i j < I ¯ 2 i j , i j E
V ̲ i 2 < V ˜ i < V ¯ i 2 , i B +

3.2.2. Distributed Generator (DG) Operation Constraints

To better realize post-disaster recovery of important loads, distributed power is added to some nodes in the proposed model. This part of DG is not affected by disasters or is less affected, and it is considered that it can still work normally during the disaster evolution process.
For DG at node j, its output meets
P ̲ j DG P j , t DG P ¯ j DG Q ̲ j DG Q j , t DG Q ¯ j DG j B DG , t
where B DG indicates the set of all nodes configured with the distributed power supply. Equation (23) is the constraint of the DG output, which means the active and reactive output of DG at node j in period t should be between the upper and lower limits of the output.

3.2.3. Distribution Network Radial Topology Constraints

For the radial constraint, the connectivity and node-branch number relationship must be met at the same time. From the perspective of virtual power flow, this paper proposes the single commodity flow constraint to ensure the connectivity of the graph, which together with the node-branch number relationship forms the radial constraint. The model is as follows:
i j E a i j = N N R
δ i F i j + D i = π i F k i , i B / R
F i j a i j M , i j E
where δ j is a set of branches whose last node is j (inflow node j) and π j whose first node is j (outflow node j). The number of nodes in the network is N. R is the set of root nodes in each microgrid, each microgrid contains a root node, generally a substation node or distributed generator node, and the number of root nodes is equal to the number of microgrids. F i j represents the virtual power flow of a line and D i the virtual requirements for each node. M is a positive real number with a large value, usually set as the number of nodes.
Constraint (24) means that the number of all closed lines is equal to the number of all nodes minus the number of subgrids, ensuring that each group of graphs generates a tree, and constraints (25) and (26) are a single commodity flow constraint, ensuring the connectivity of each subgrid: (1) Except for the root nodes of each subgrid, each node has 1 unit of virtual demand, and the sum of incoming virtual flows of all nodes is equal to the sum of outgoing virtual flows. (2) Use the “big M method” to judge the line connection situation: if the line is connected, constrain (26) equivalent to no constraint, and the virtual flow of the branch is 0, while the line is broken.
The whole model contains the objective function shown in Formula (12) and the constraint conditions shown in Formula (18) to Formula (26). The optimization variables include branch breaking or connecting variable ( a i j ), distributed power output variable ( P j , t DG , Q j , t DG ), node injected power ( p , q ), branch power flow ( P , Q ), node voltage (V), and branch current (I). The above model is a mixed-integer second-order cone optimization problem (SOCP), which can be solved directly with the Gurobi commercial solver.

4. Case Study

This study employs two test systems: a 33-node distribution network and a 118-node test system, for case simulation and analysis. Sampling the vulnerability curves in the established models, we assumed the impact of typhoons and flooding on the city’s distribution network, and three reconstruction schemes (dynamic, static, and no reconstruction) are proposed for each case. The case study demonstrates the superiority of the proposed model in addressing wind and flood disasters and enhancing the resilience of the power grid.

4.1. The 33-Node Distribution Network Test System

In this part, the 33-node distribution network test system is used to construct the simulation scenario. The topology of the distribution network is shown in Figure 5. Distributed power supplies are installed on nodes 7, 15, and 32.
With the change in wind speed and water-logging depth during the evolution of wind and water-logging disasters, dynamic faults occur in the distribution network. In the process of disaster evolution, a period of 4 h and 16 time intervals after a certain failure (group) is taken as the research object, that is, 15 min is a research interval. It is assumed that since the time the study begins (the first fault occurs, t 0 ), the components in the distribution network fail every 1 h, and the branch e 1 , 2 does not break. Without loss of generality, the system failure situation is obtained by sampling the vulnerability curve of each component, as shown in Table 1.
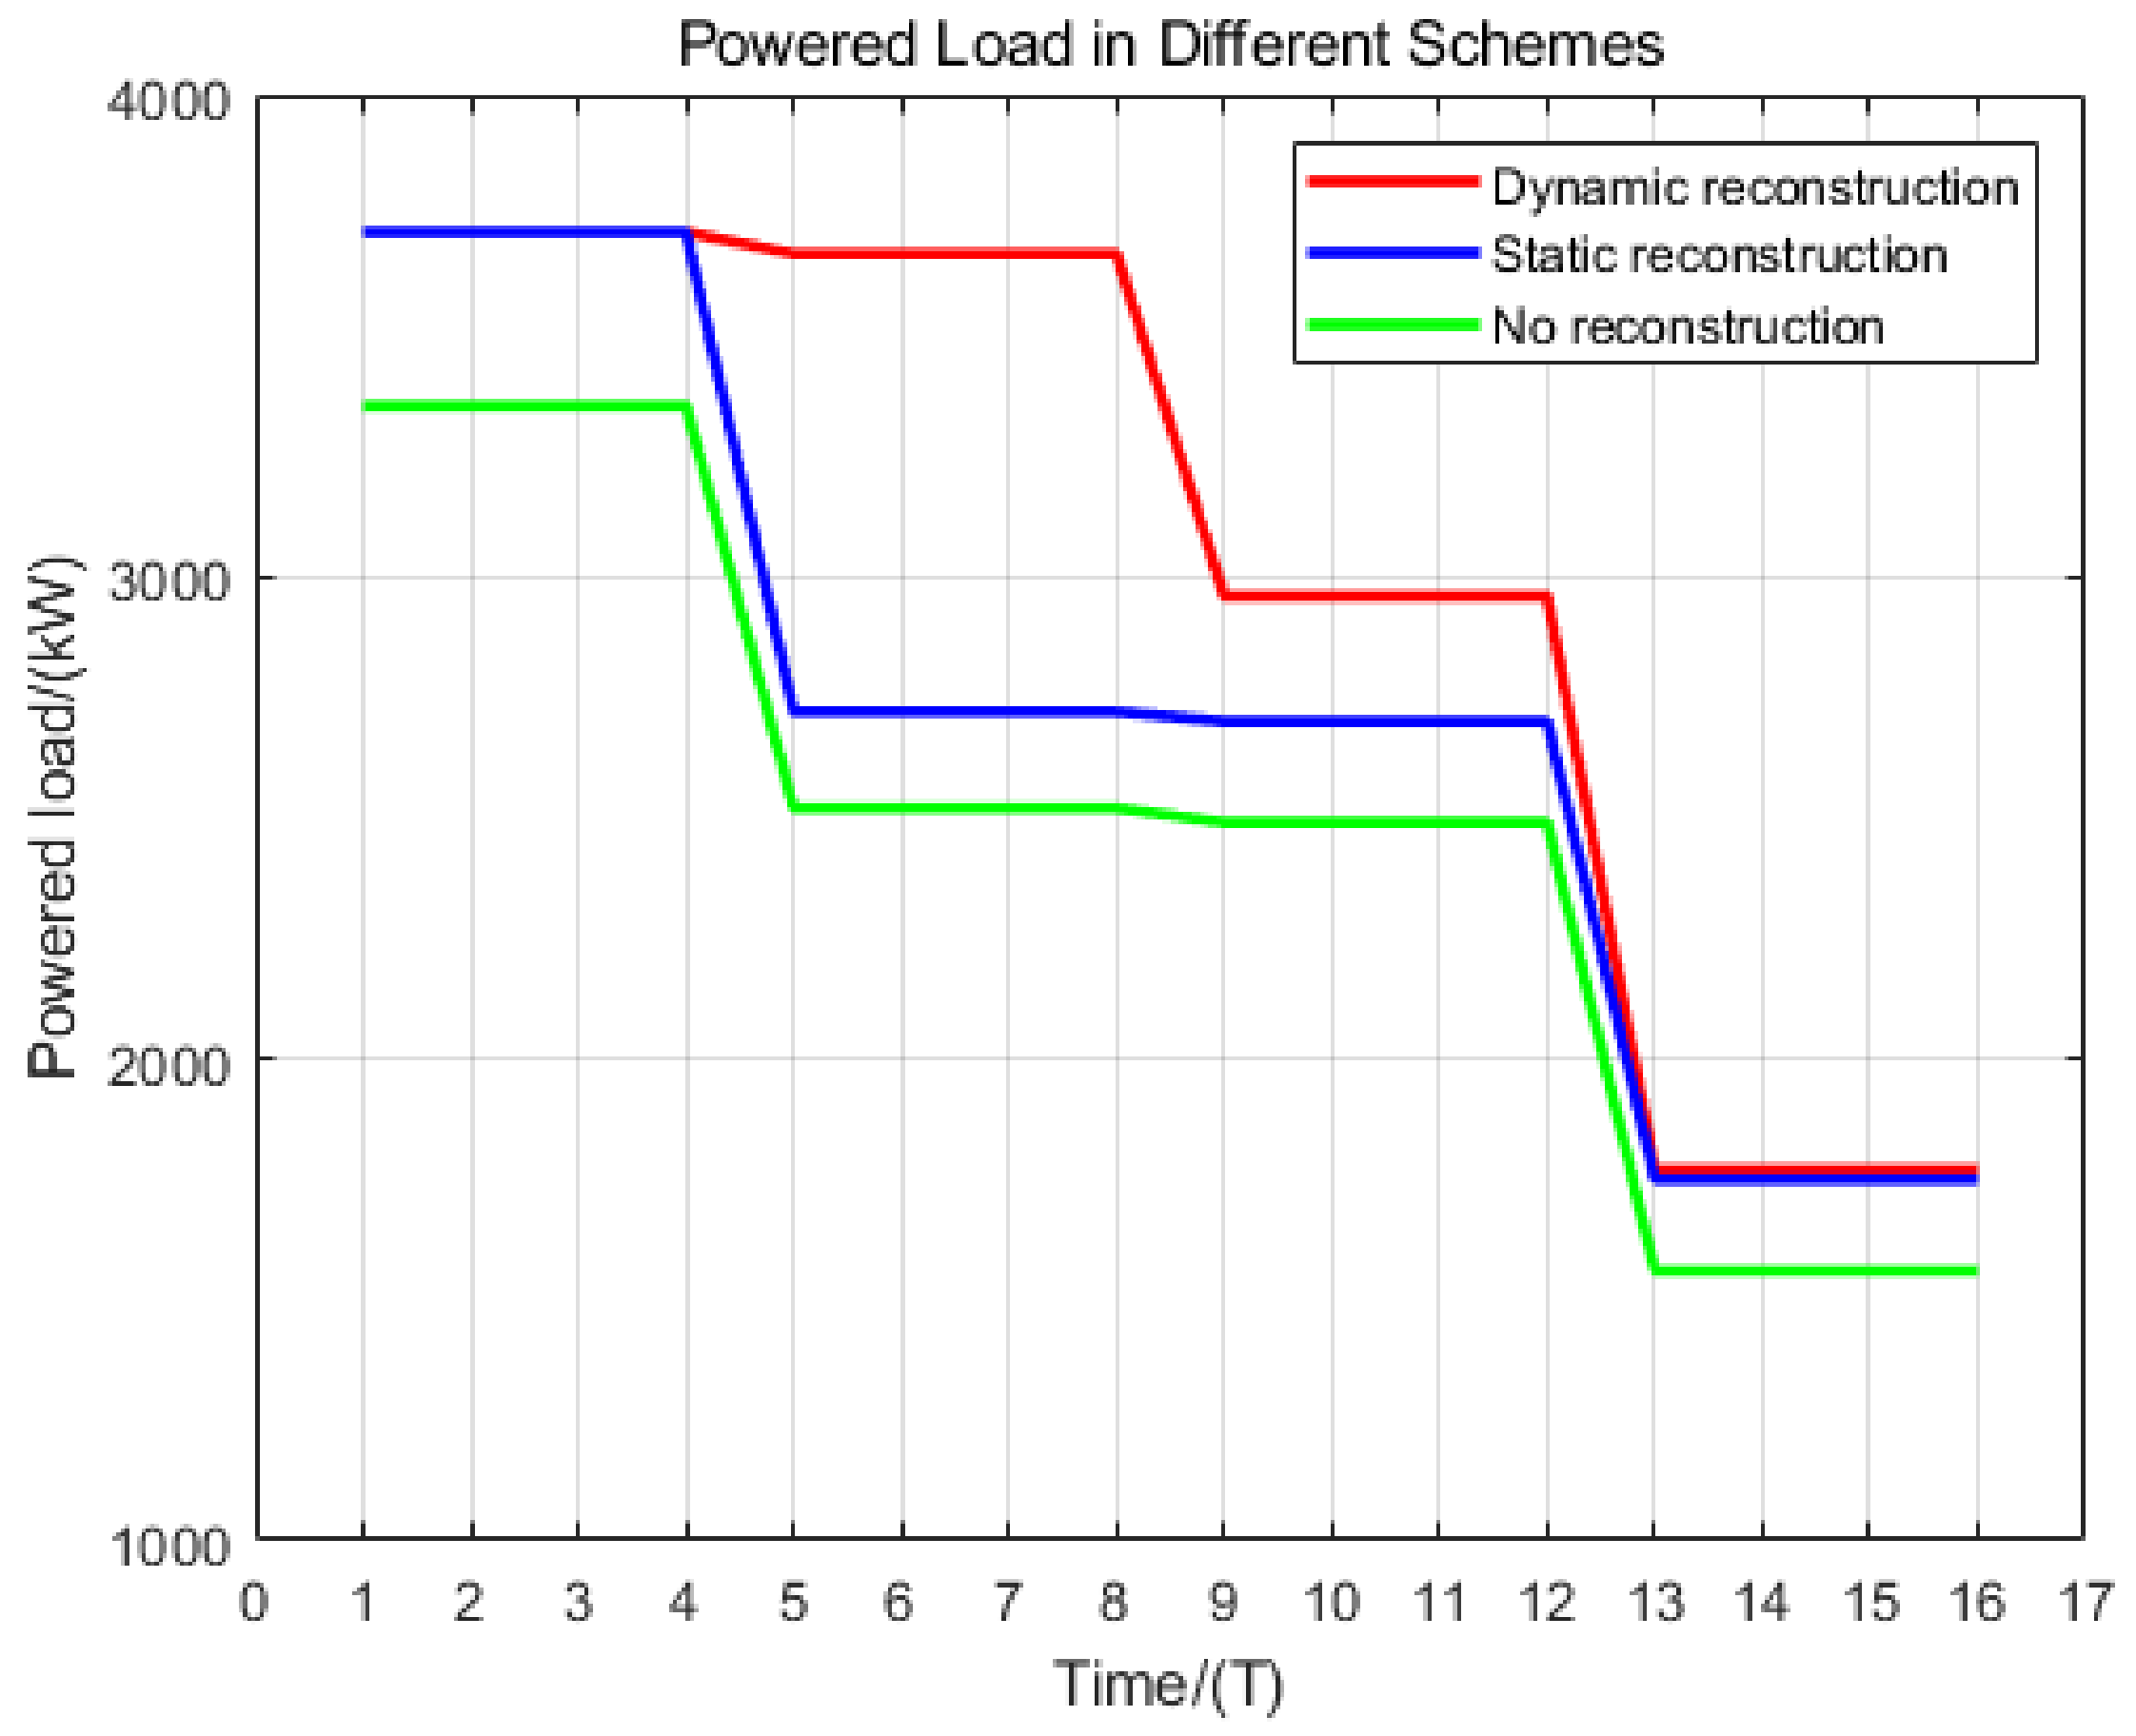
To verify the improvement of the elasticity of the distribution network by the proposed method, three schemes are set up: (1) the scheme without considering the network reconstruction, (2) a static reconstruction scheme that only reconstructs after the first fault, and (3) a dynamic reconstruction scheme that reconstructs after each failure.
By comparing the load supply in various scenarios (Figure 6), it can be seen that the elasticity of the distribution network after reconstruction is significantly improved compared with the scheme that does not reconstruct at all. At the same time, compared with static reconstruction, the dynamic reconstruction method proposed in this paper can greatly improve the load supply amount of the distribution network after a period of disaster evolution, especially for disaster scenarios such as wind and flood disasters that last for a long time and have complex impacts on the distribution system. For Period 5–8, our dynamic scheme can supply almost 100% of the load (98.79%), but the traditional static solution can only supply 73.22%, with an increase of 25.57% of the total load in the test system.
In the above fault scenario, the dynamic reconstruction process at each stage is shown in Figure 7. After the first line failure, part of the contact switch is activated, the network is reconstructed, and the load can still supply as normal (Figure 7a). After the second group of faults occurs, all the contact lines are closed, and the remaining loads can still maintain normal power supply except for loads at node 11 which cannot be supplied due to the fault of the node transformer (Figure 7b). When the disaster progresses further, after the third group of faults occurs, if all the contact lines are closed, the normal power supply of all loads except the load at the faulty node ( b 11 , b 29 ) still cannot be guaranteed. At this time, considering the importance of loads, the power supply gives priority to more important loads (such as hospitals, municipalities, etc.), the contact line e 18 , 33 is disconnected, and some load nodes with lower weights stop supplementing (Figure 7c). When the situation deteriorates further, more lines are disconnected, and line e 25 , 29 is also disconnected, giving priority to the higher weight loads (Figure 7d).

4.2. The 118-Node Distribution Network Test System

To further prove the effectiveness of the proposed strategy, we introduced a 118-node distribution network test system as a case to simulate the failure and recovery of the power system in the course of typhoons and water-logging disasters.
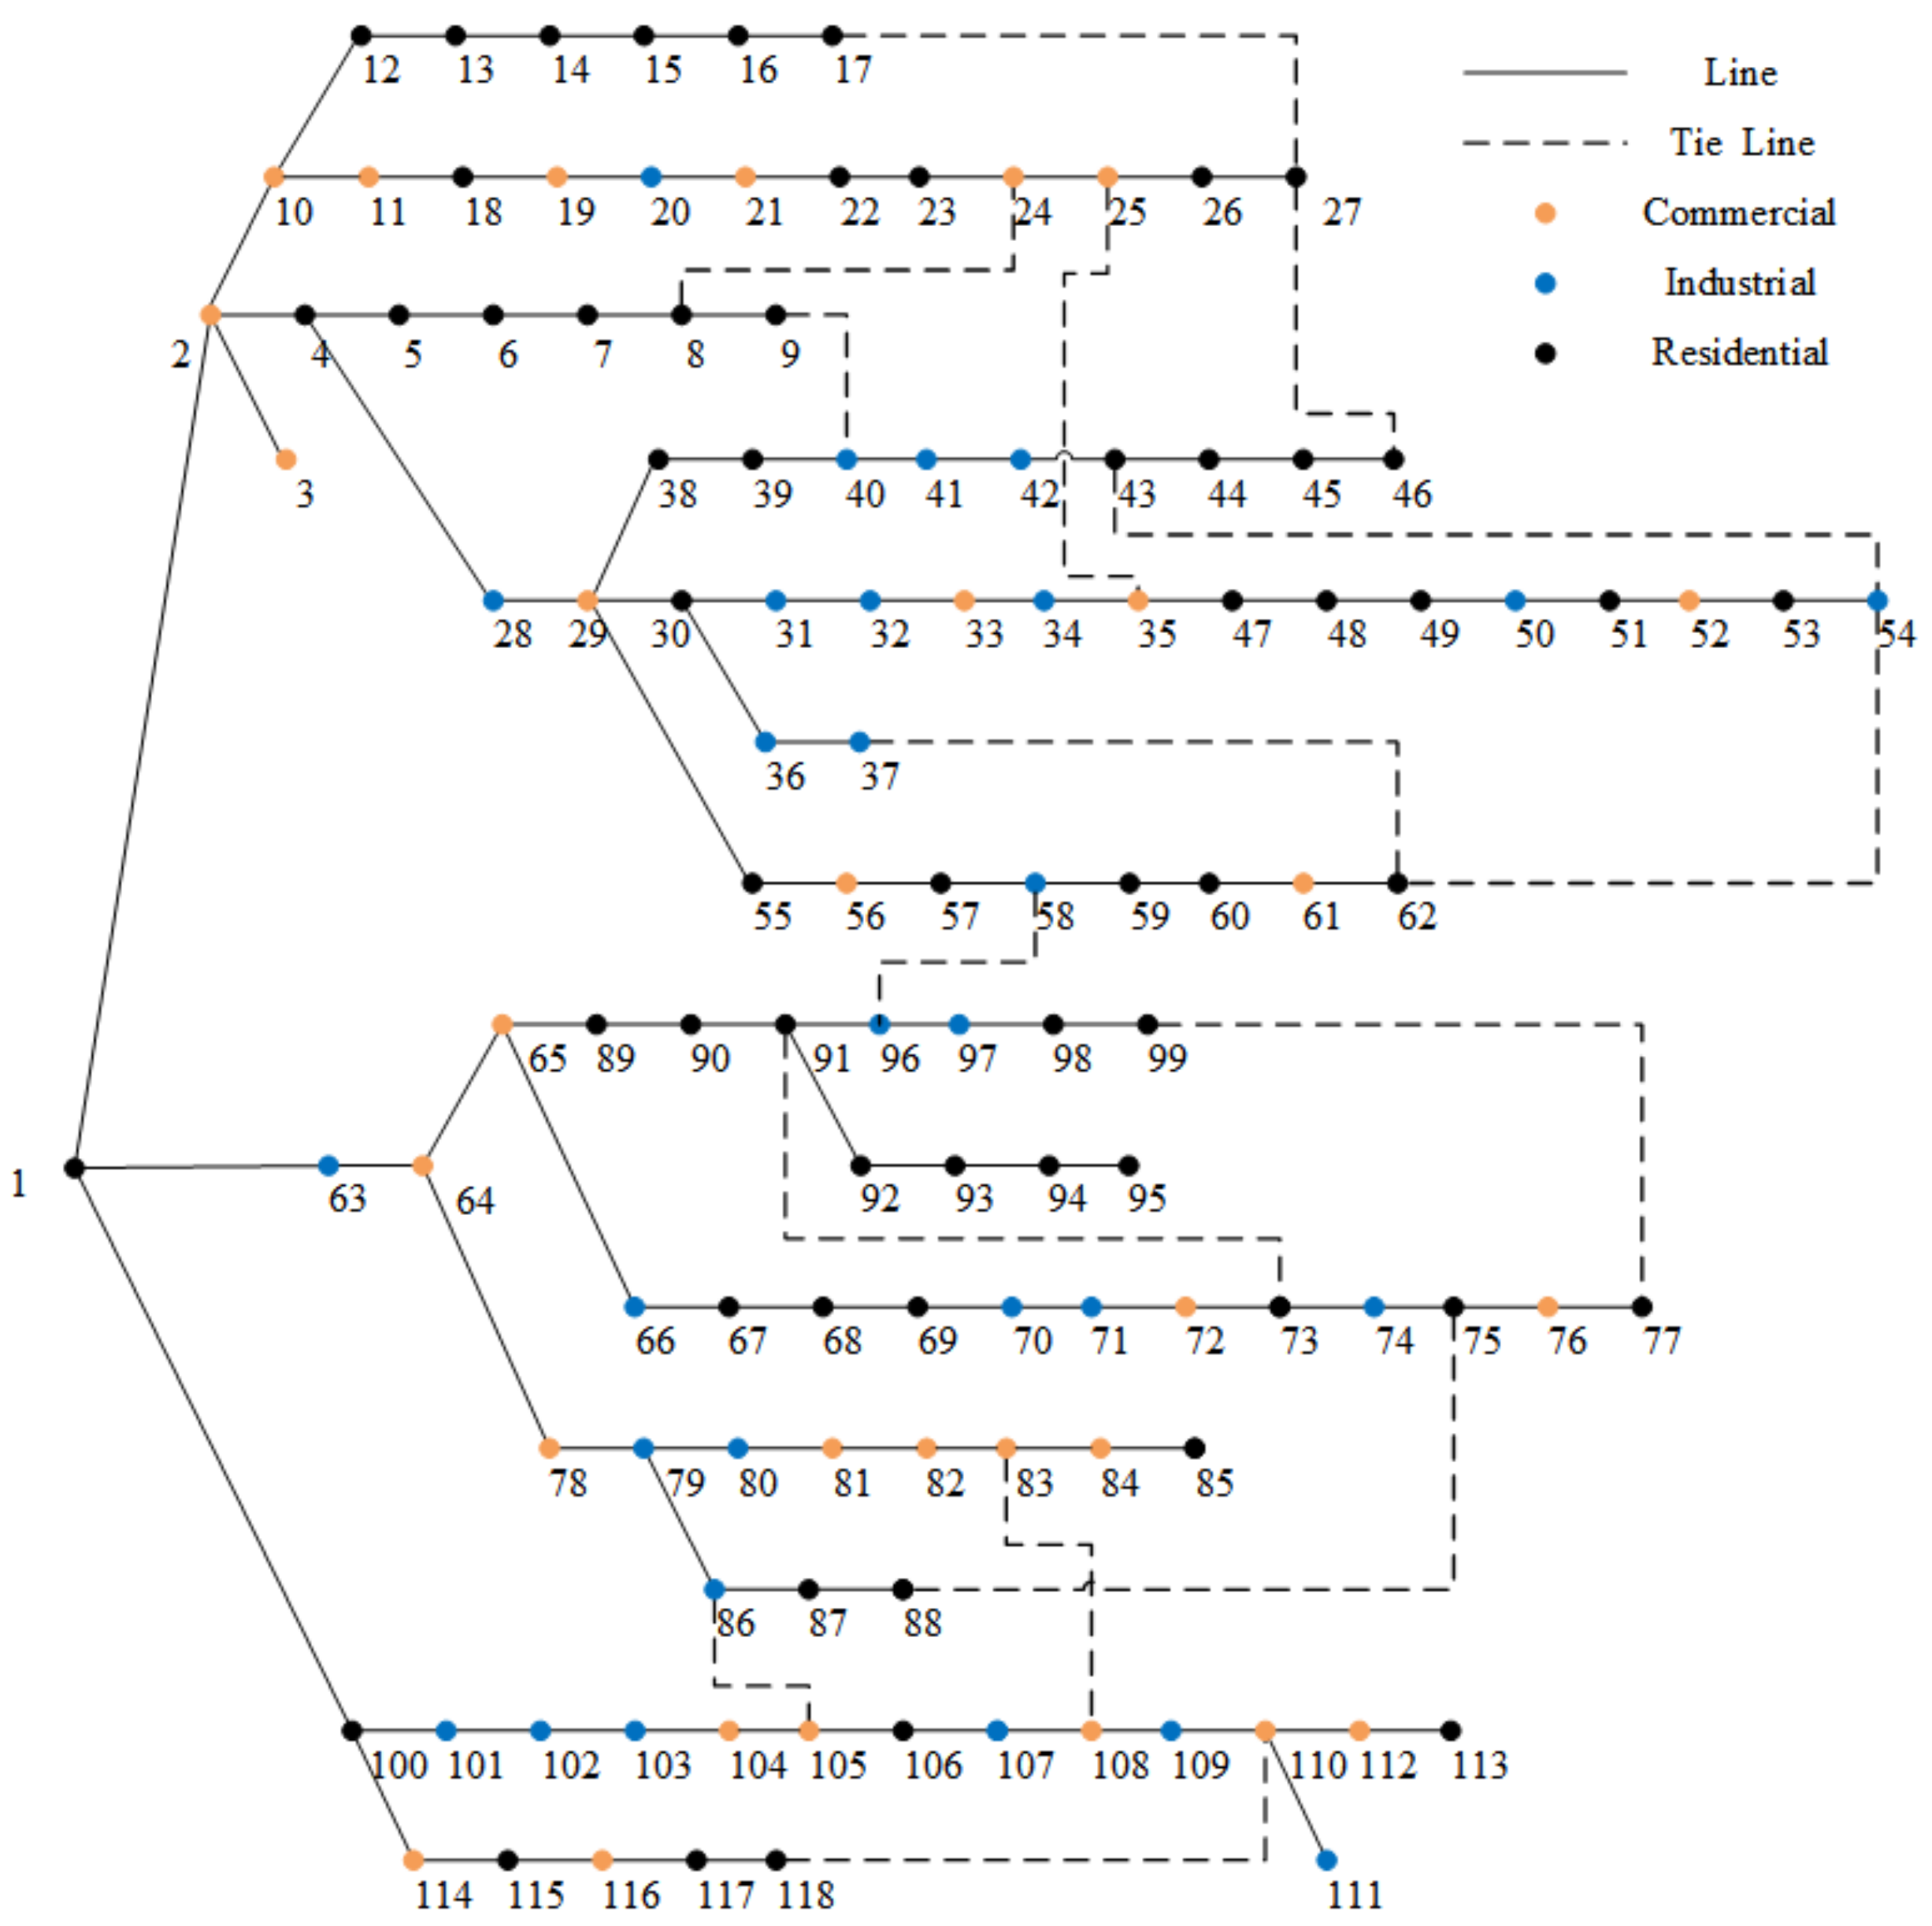
The 118-node distribution network test system topology is shown in the figure below (Figure 8), including commercial, industrial, and residential loads, with degressive weights. In total, 11 DGs are installed in the system.
In this case, we no longer assume a single failure scenario of the distribution network during the evolution of wind and flood disasters but sample the wind speed and water level depth at the corresponding time nodes, map to the vulnerability curve in Section 2, obtain the fault probability of lines and nodes at this time, and then generate a series of random dynamic fault scenarios, which are more random and more similar to the actual disasters.
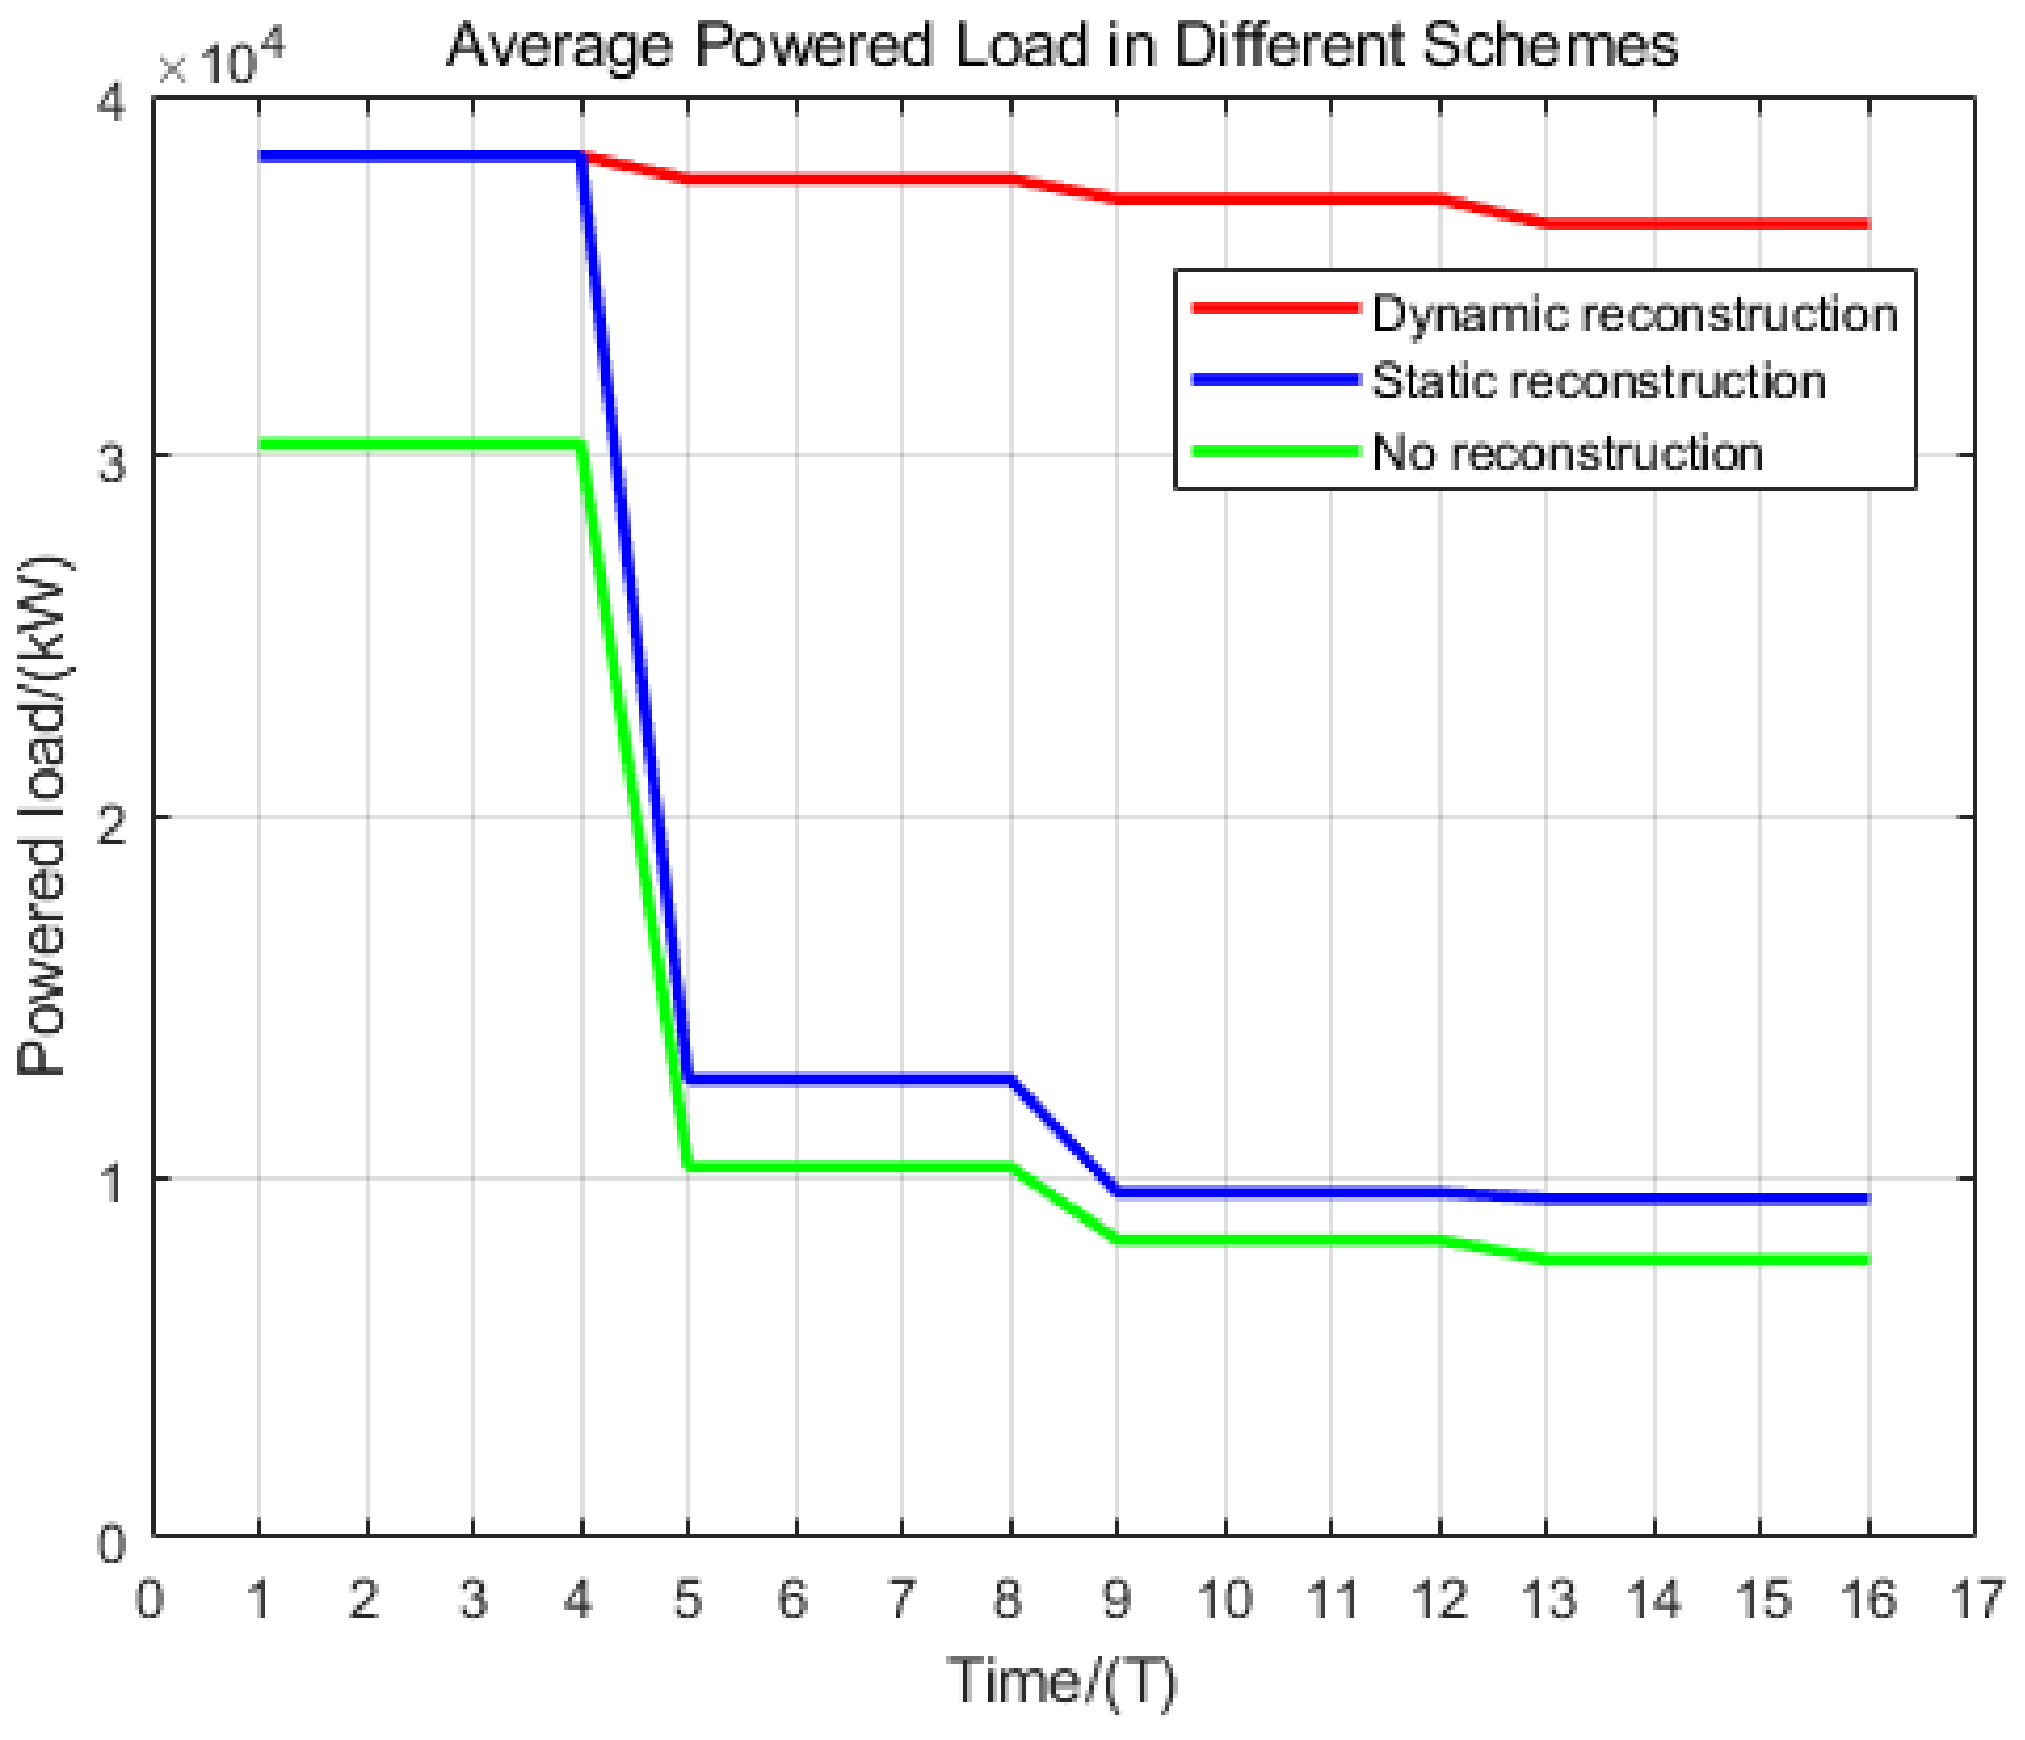
A total of 100 failure scenarios were generated. Three schemes of dynamic reconstruction, static reconstruction, and non-reconstruction were adopted for these fault scenarios, and the average value of total power supply in each period was obtained, as Figure 9.
It can be seen that for the 118-node system, the dynamic reconstruction scheme proposed in this paper has a better effect on improving the elasticity of the distribution system and can make the power supply of the post-disaster power system reach almost 95.06%, which is significant compared with 20.14% of the no reconstruction and 24.56% of the static reconstruction (the increment is 71.50% of the total load).
The 118-node system itself has more contact lines, and the dynamic reconstruction scheme proposed in this paper could adjust the system topology immediately and effectively during the fault evolution process and ensure the connection between the downstream node load and the main substation node to the greatest extent. Therefore, for the large node distribution network systems, the strategy proposed in this paper can better improve the elasticity.
To sum up, the dynamic reconstruction scheme proposed in this paper can continuously and flexibly deal with the long-term and high-complexity distribution network faults during the evolution of wind and flood disasters. It uses fewer contact switch actions and recovers important loads to the greatest extent under wind and flood disasters, which has obvious advantages compared with no reconstruction or traditional static reconstruction schemes.

5. Conclusions

This paper proposes a method to predict the failure rate of power grids under wind and water-logging scenarios and suggests a post-disaster distribution network resiliency improvement strategy. The study combines hydrology, climate science, and power grid analysis to quantify the probability of power grid failure under wind and flood disasters. This method is significant for the operation and maintenance of power distribution systems in the event of wind and water-logging disasters.
The study uses a modified 33-node distribution network test system to simulate wind and water-logging disasters and proposes a multi-objective long-last dynamic distribution network reconstruction scheme to improve the power network’s resiliency. The dynamic reconstruction method is significantly superior to the scheme with no reconstruction at all and improves the load supply of the distribution network after a period of disaster evolution compared to traditional static reconstruction. In the whole disaster cycle, for the 33-node system and 118-node system, the power supply of our dynamic scheme is increased by 25.57% and 71.50% (of the total load amount) compared with the traditional static scheme, respectively, which verifies the effectiveness of the proposed scheme in improving the elasticity of the distribution system, and the method is particularly useful for wind and flood disasters that last for a long time and have complex impacts on the distribution system.
Future studies will refine the distribution network fault model and predict distribution network faults based on weather information in disaster warnings to obtain a more personalized and targeted distribution network resilience improvement plan.

Author Contributions

Conceptualization, N.M. and Y.W.; data curation, G.L.; formal analysis, Z.X.; funding acquisition, N.M. and L.X.; methodology, Z.X. and D.L.; project administration, L.X.; resources, Y.W. and G.L; software, D.L.; supervision, C.C.; validation, Z.L. and J.S.; visualization, Z.L.; writing—original draft, Z.X.; writing—review and editing, C.C. All authors have read and agreed to the published version of the manuscript.

Funding

This work is supported by Science and Technology Project of China Southern Power Grid Co., Ltd. (No. 090000KK52222158).

Data Availability Statement

Publicly available datasets were analyzed in this study. These data can be found here: https://www.fema.gov/flood-maps/tools-resources/flood-map-products/hazus (accessed on 17 October 2023).

Conflicts of Interest

Authors Yijun Wang, Nan Ma, Guowei Liu and Lisheng Xin were employed by the company Shenzhen Power Supply Co., Ltd. The remaining authors declare that the research was conducted in the absence of any commercial or financial relationships that could be construed as a potential conflict of interest. The authors declare that this study received funding from Science and Technology Project of China Southern Power Grid Co., Ltd. (No. 090000KK52222158). The funder was not involved in the study design, collection, analysis, interpretation of data, the writing of this article or the decision to submit it for publication.

Abbreviations

The following abbreviations are used in this manuscript:
AHPAnalytical Hierarchical Process
EDRPEmergency Demand Response Planning
RDNPResilient Distribution Network Planning
CDFCumulative Distribution Function
HVHigh Voltage
MVMedium Voltage
LVLow Voltage
DGDistributed Generator
SOCPSecond-Order Cone Programming

References

  1. Kayaga, S.M.; Amankwaa, E.F.; Gough, K.V.; Wilby, R.L.; Abarike, M.A.; Codjoe, S.N.A.; Kasei, R.; Nabilse, C.K.; Yankson, P.W.K.; Mensah, P.; et al. Cities and extreme weather events: Impacts of flooding and extreme heat on water and electricity services in Ghana. Environ. Urban. 2021, 33, 131–150. [Google Scholar] [CrossRef]
  2. Albrecht, F. Natural hazard events and social capital: The social impact of natural disasters. Disasters 2018, 42, 336–360. [Google Scholar] [CrossRef] [PubMed]
  3. Ahmadiani, M.; Ferreira, S. Well-being effects of extreme weather events in the United States. Resour. Energy Econ. 2021, 64, 101213. [Google Scholar] [CrossRef]
  4. Dehghanian, P.; Aslan, S.; Dehghanian, P. Maintaining Electric System Safety Through An Enhanced Network Resilience. IEEE Trans. Ind. Appl. 2018, 54, 4927–4937. [Google Scholar] [CrossRef]
  5. Gkika, A.V.; Zacharis, E.A.; Skikos, D.N.; Lekkas, E.L. Battling the extreme: Lessons learned from weather-induced disasters on electricity distribution networks and climate change adaptation strategies. Hydrol. Res. 2023, 54, 1196–1226. [Google Scholar] [CrossRef]
  6. Dong, J.; Zhu, L.; Dong, Q.; Kritprajun, P.; Liu, Y.; Liu, Y.; Tolbert, L.M.; Hambrick, J.C.; Xue, Y.S.; Ollis, T.B.; et al. Integrating Transactive Energy Into Reliability Evaluation for a Self-Healing Distribution System With Microgrid. IEEE Trans. Sustain. Energy 2022, 13, 122–134. [Google Scholar] [CrossRef]
  7. Igder, M.A.; Liang, X.; Mitolo, M. Service Restoration Through Microgrid Formation in Distribution Networks: A Review. IEEE Access 2022, 10, 46618–46632. [Google Scholar] [CrossRef]
  8. Sabouhi, H.; Doroudi, A.; Fotuhi-Firuzabad, M.; Bashiri, M. Electricity distribution grids resilience enhancement by network reconfiguration. Int. Trans. Electr. Energy Syst. 2021, 31, e13047. [Google Scholar] [CrossRef]
  9. Osman, S.R.; Sedhom, B.E.; Kaddah, S.S. Optimal resilient microgrids formation based on darts game theory approach and emergency demand response program for cyber-physical distribution networks considering natural disasters. Process. Saf. Environ. Prot. 2023, 173, 893–921. [Google Scholar] [CrossRef]
  10. Chanda, S.; Srivastava, A.K. Defining and Enabling Resiliency of Electric Distribution Systems With Multiple Microgrids. IEEE Trans. Smart Grid 2016, 7, 2859–2868. [Google Scholar] [CrossRef]
  11. Mingming, W.; Zhaoheng, L.; Konstantin, M. Optimal risk-driven operation of renewable-penetrated distribution network during natural-disasters: A resiliency-oriented analysis. Sustain. Cities Soc. 2023, 99, 104967. [Google Scholar] [CrossRef]
  12. Galvan, E.; Mandal, P.; Sang, Y. Networked microgrids with roof-top solar PV and battery energy storage to improve distribution grids resilience to natural disasters. Int. J. Electr. Power Energy Syst. 2020, 123, 106239. [Google Scholar] [CrossRef]
  13. Liu, W.; Liu, Y.; Yang, Y.; Xu, Q.; Dong, F. Power restoration model for distribution networks after extreme rainstorm disasters based on electric vehicle travel characteristics. Energy Rep. 2023, 9, 372–380. [Google Scholar] [CrossRef]
  14. Zhang, L.; Huang, J.; Tang, W.; Hou, Y.; Wang, Z.; Xie, F.; Fan, W. Equilibrium Allocation of ESSs in Multiple UIESs-Accessed Distribution Networks Considering the Resilience and Economic Benefits. IEEE Trans. Ind. Appl. 2023, 59, 5230–5242. [Google Scholar] [CrossRef]
  15. Lin, H.; Zhou, X.; Lu, J. Research on Optimizing the Recovery Strategy of a Distribution Network Communication System Under Extreme Disasters. IOP Conf. Ser. Mater. Sci. Eng. 2020, 853, 012010. [Google Scholar] [CrossRef]
  16. Moreira, A.; Heleno, M.; Valenzuela, A. A Risk-Averse Approach for Distribution Grid Expansion Planning. Energies 2021, 14, 8482. [Google Scholar] [CrossRef]
  17. Yuan, W.; Wang, J.; Qiu, F.; Chen, C.; Kang, C.; Zeng, B. Robust Optimization-Based Resilient Distribution Network Planning Against Natural Disasters. IEEE Trans. Smart Grid 2016, 7, 2817–2826. [Google Scholar] [CrossRef]
  18. Tan, Y.; Qiu, F.; Das, A.K.; Kirschen, D.S.; Arabshahi, P.; Wang, J. Scheduling Post-Disaster Repairs in Electricity Distribution Networks. IEEE Trans. Power Syst. 2019, 34, 2611–2621. [Google Scholar] [CrossRef]
  19. Chen, L.; Liu, W.; Shi, Q.; Lyu, X.; Bai, Y.; Zhang, S.; Lu, Y.; Liu, Z. Prospect Theory-Based optimal configuration of modular mobile battery energy storage in distribution network considering disaster scenarios. Int. J. Electr. Power Energy Syst. 2022, 142, 108215. [Google Scholar] [CrossRef]
  20. Panteli, M.; Trakas, D.N.; Mancarella, P.; Hatziargyriou, N.D. Boosting the Power Grid Resilience to Extreme Weather Events Using Defensive Islanding. IEEE Trans. Smart Grid 2016, 7, 2913–2922. [Google Scholar] [CrossRef]
  21. Panteli, M.; Mancarella, P. Modeling and Evaluating the Resilience of Critical Electrical Power Infrastructure to Extreme Weather Events. IEEE Syst. J. 2017, 11, 1733–1742. [Google Scholar] [CrossRef]
  22. Wang, Y.; Huang, T.; Li, X.; Tang, J.; Wu, Z.; Mo, Y.; Xue, L.; Zhou, Y.; Niu, T.; Sun, S. A Resilience Assessment Framework for Distribution Systems Under Typhoon Disasters. IEEE Access 2021, 9, 155224–155233. [Google Scholar] [CrossRef]
  23. Li, S.; Lu, L.; Hu, W.; Tang, J.; Qin, L. Prediction Algorithm of Wind Waterlogging Disaster in Distribution Network Based on Multi-Source Data Fusion. Math. Probl. Eng. 2022, 2022, 2721734. [Google Scholar] [CrossRef]
  24. Hanif, S.; Mukherjee, M.; Poudel, S.; Yu, M.G.; Jinsiwale, R.A.; Hardy, T.D.; Reeve, H.M. Analyzing at-scale distribution grid response to extreme temperatures. Appl. Energy 2023, 337, 120886. [Google Scholar] [CrossRef]
  25. Ministry of Water Resources of the People’s Republic of China. China Flood and Drought Disaster Prevention Bulletin; Ministry of Water Resources of the People’s Republic of China: Beijing, China, 2023. Available online: www.waterpub.com.cn (accessed on 28 November 2023).
  26. Ning, Y.F.; Dong, W.Y.; Lin, L.S.; Zhang, Q. Analyzing the causes of urban waterlogging and sponge city technology in China. Proc. IOP Conf. Ser. Earth Environ. Sci. 2017, 59, 012047. [Google Scholar] [CrossRef]
  27. Zhang, Q.; Wu, Z.; Zhang, H.; Dalla Fontana, G.; Tarolli, P. Identifying dominant factors of waterlogging events in metropolitan coastal cities: The case study of Guangzhou, China. J. Environ. Manag. 2020, 271, 110951. [Google Scholar] [CrossRef] [PubMed]
  28. Huang, H.; Chen, X.; Zhu, Z.; Xie, Y.; Liu, L.; Wang, X.; Wang, X.; Liu, K. The changing pattern of urban flooding in Guangzhou, China. Sci. Total. Environ. 2018, 622–623, 394–401. [Google Scholar] [CrossRef]
  29. Li, H.; Ding, L.; Ren, M.; Li, C.; Wang, H. Sponge city construction in China: A survey of the challenges and opportunities. Water 2017, 9, 594. [Google Scholar] [CrossRef]
  30. Zhang, Z.; Liang, J.; Zhou, Y.; Huang, Z.; Jiang, J.; Liu, J.; Yang, L. A multi-strategy-mode waterlogging-prediction framework for urban flood depth. Nat. Hazards Earth Syst. Sci. 2022, 22, 4139–4165. [Google Scholar] [CrossRef]
  31. Yu, H.; Zhao, Y.; Fu, Y.; Li, L. Spatiotemporal variance assessment of urban rainstorm waterlogging affected by impervious surface expansion: A case study of Guangzhou, China. Sustainability 2018, 10, 3761. [Google Scholar] [CrossRef]
  32. Jiang, Y.; Zevenbergen, C.; Ma, Y. Urban pluvial flooding and stormwater management: A contemporary review of China’s challenges and “sponge cities” strategy. Environ. Sci. Policy 2018, 80, 132–143. [Google Scholar] [CrossRef]
  33. Zhang, Q.; Wu, Z.; Cao, Z.; Guo, G.; Zhang, H.; Li, C.; Tarolli, P. How to develop site-specific waterlogging mitigation strategies? Understanding the spatial heterogeneous driving forces of urban waterlogging. J. Clean. Prod. 2023, 422, 138595. [Google Scholar] [CrossRef]
  34. Knight, U.G. The Natural Environment—Some Disturbances Reviewed. In Power Systems in Emergencies; John Wiley & Sons, Ltd.: Hoboken, NJ, USA, 2001; pp. 175–212. [Google Scholar] [CrossRef]
  35. Ward, D.M. The effect of weather on grid systems and the reliability of electricity supply. Clim. Chang. 2013, 121, 103–113. [Google Scholar] [CrossRef]
  36. Bhusal, N.; Gautam, M.; Abdelmalak, M.; Benidris, M. Modeling of Natural Disasters and Extreme Events in Power System Resilience Enhancement and Evaluation Methods. In Proceedings of the 2020 International Conference on Probabilistic Methods Applied to Power Systems (PMAPS), Liege, Belgium, 18–21 August 2020; pp. 1–6. [Google Scholar] [CrossRef]
  37. Panteli, M.; Pickering, C.; Wilkinson, S.; Dawson, R.; Mancarella, P. Power System Resilience to Extreme Weather: Fragility Modeling, Probabilistic Impact Assessment, and Adaptation Measures. IEEE Trans. Power Syst. 2017, 32, 3747–3757. [Google Scholar] [CrossRef]
  38. RESNET: Resilient Electricity Networks for Great Britain—Tyndall Centre for Climate Change Research. 2015. Available online: https://tyndall.ac.uk/projects/resnet-resilient-electricity-networks-for-great-britain/ (accessed on 9 December 2023).
  39. Murray, K.; Bell, K.R.W. Wind related faults on the GB transmission network. In Proceedings of the 2014 International Conference on Probabilistic Methods Applied to Power Systems (PMAPS), Durham, UK, 7–10 July 2014; pp. 1–6. [Google Scholar] [CrossRef]
  40. Panteli, M.; Mancarella, P. Operational resilience assessment of power systems under extreme weather and loading conditions. In Proceedings of the 2015 IEEE Power & Energy Society General Meeting, Denver, CO, USA, 26–30 July 2015; pp. 1–5. [Google Scholar] [CrossRef]
  41. Boggess, J.M.; Becker, G.W.; Mitchell, M.K. Storm & flood hardening of electrical substations. In Proceedings of the 2014 IEEE PES T&D Conference and Exposition, Chicago, IL, USA, 14–17 April 2014; pp. 1–5. [Google Scholar] [CrossRef]
  42. Ma, S.; Su, L.; Wang, Z.; Qiu, F.; Guo, G. Resilience Enhancement of Distribution Grids against Extreme Weather Events. IEEE Trans. Power Syst. 2018, 33, 4842–4853. [Google Scholar] [CrossRef]
  43. Sánchez-Muñoz, D.; Domínguez-García, J.L.; Martínez-Gomariz, E.; Russo, B.; Stevens, J.; Pardo, M. Electrical Grid Risk Assessment Against Flooding in Barcelona and Bristol Cities. Sustainability 2020, 12, 1527. [Google Scholar] [CrossRef]
  44. Hazus User & Technica Manuals. 2023. Available online: https://www.fema.gov/flood-maps/tools-resources/flood-map-products/hazus/user-technical-manuals (accessed on 17 October 2023).
  45. Multi-Hazard Loss Estimation Methodology Flood Model HAZUS-MH MR4 Technical Manual; Federal Emergency Management Agency: Washington, DC, USA, 2009.
  46. Amicarelli, A.; Manenti, S.; Paggi, M. SPH Modelling of Dam-break Floods, with Damage Assessment to Electrical Substations. Int. J. Comput. Fluid Dyn. 2021, 35, 3–21. [Google Scholar] [CrossRef]
  47. Miraee-Ashtiani, S.; Vahedifard, F.; Karimi-Ghartemani, M.; Zhao, J.; Mallakpour, I.; AghaKouchak, A. Performance Degradation of Levee-Protected Electric Power Network Due to Flooding in a Changing Climate. IEEE Trans. Power Syst. 2022, 37, 4651–4660. [Google Scholar] [CrossRef]
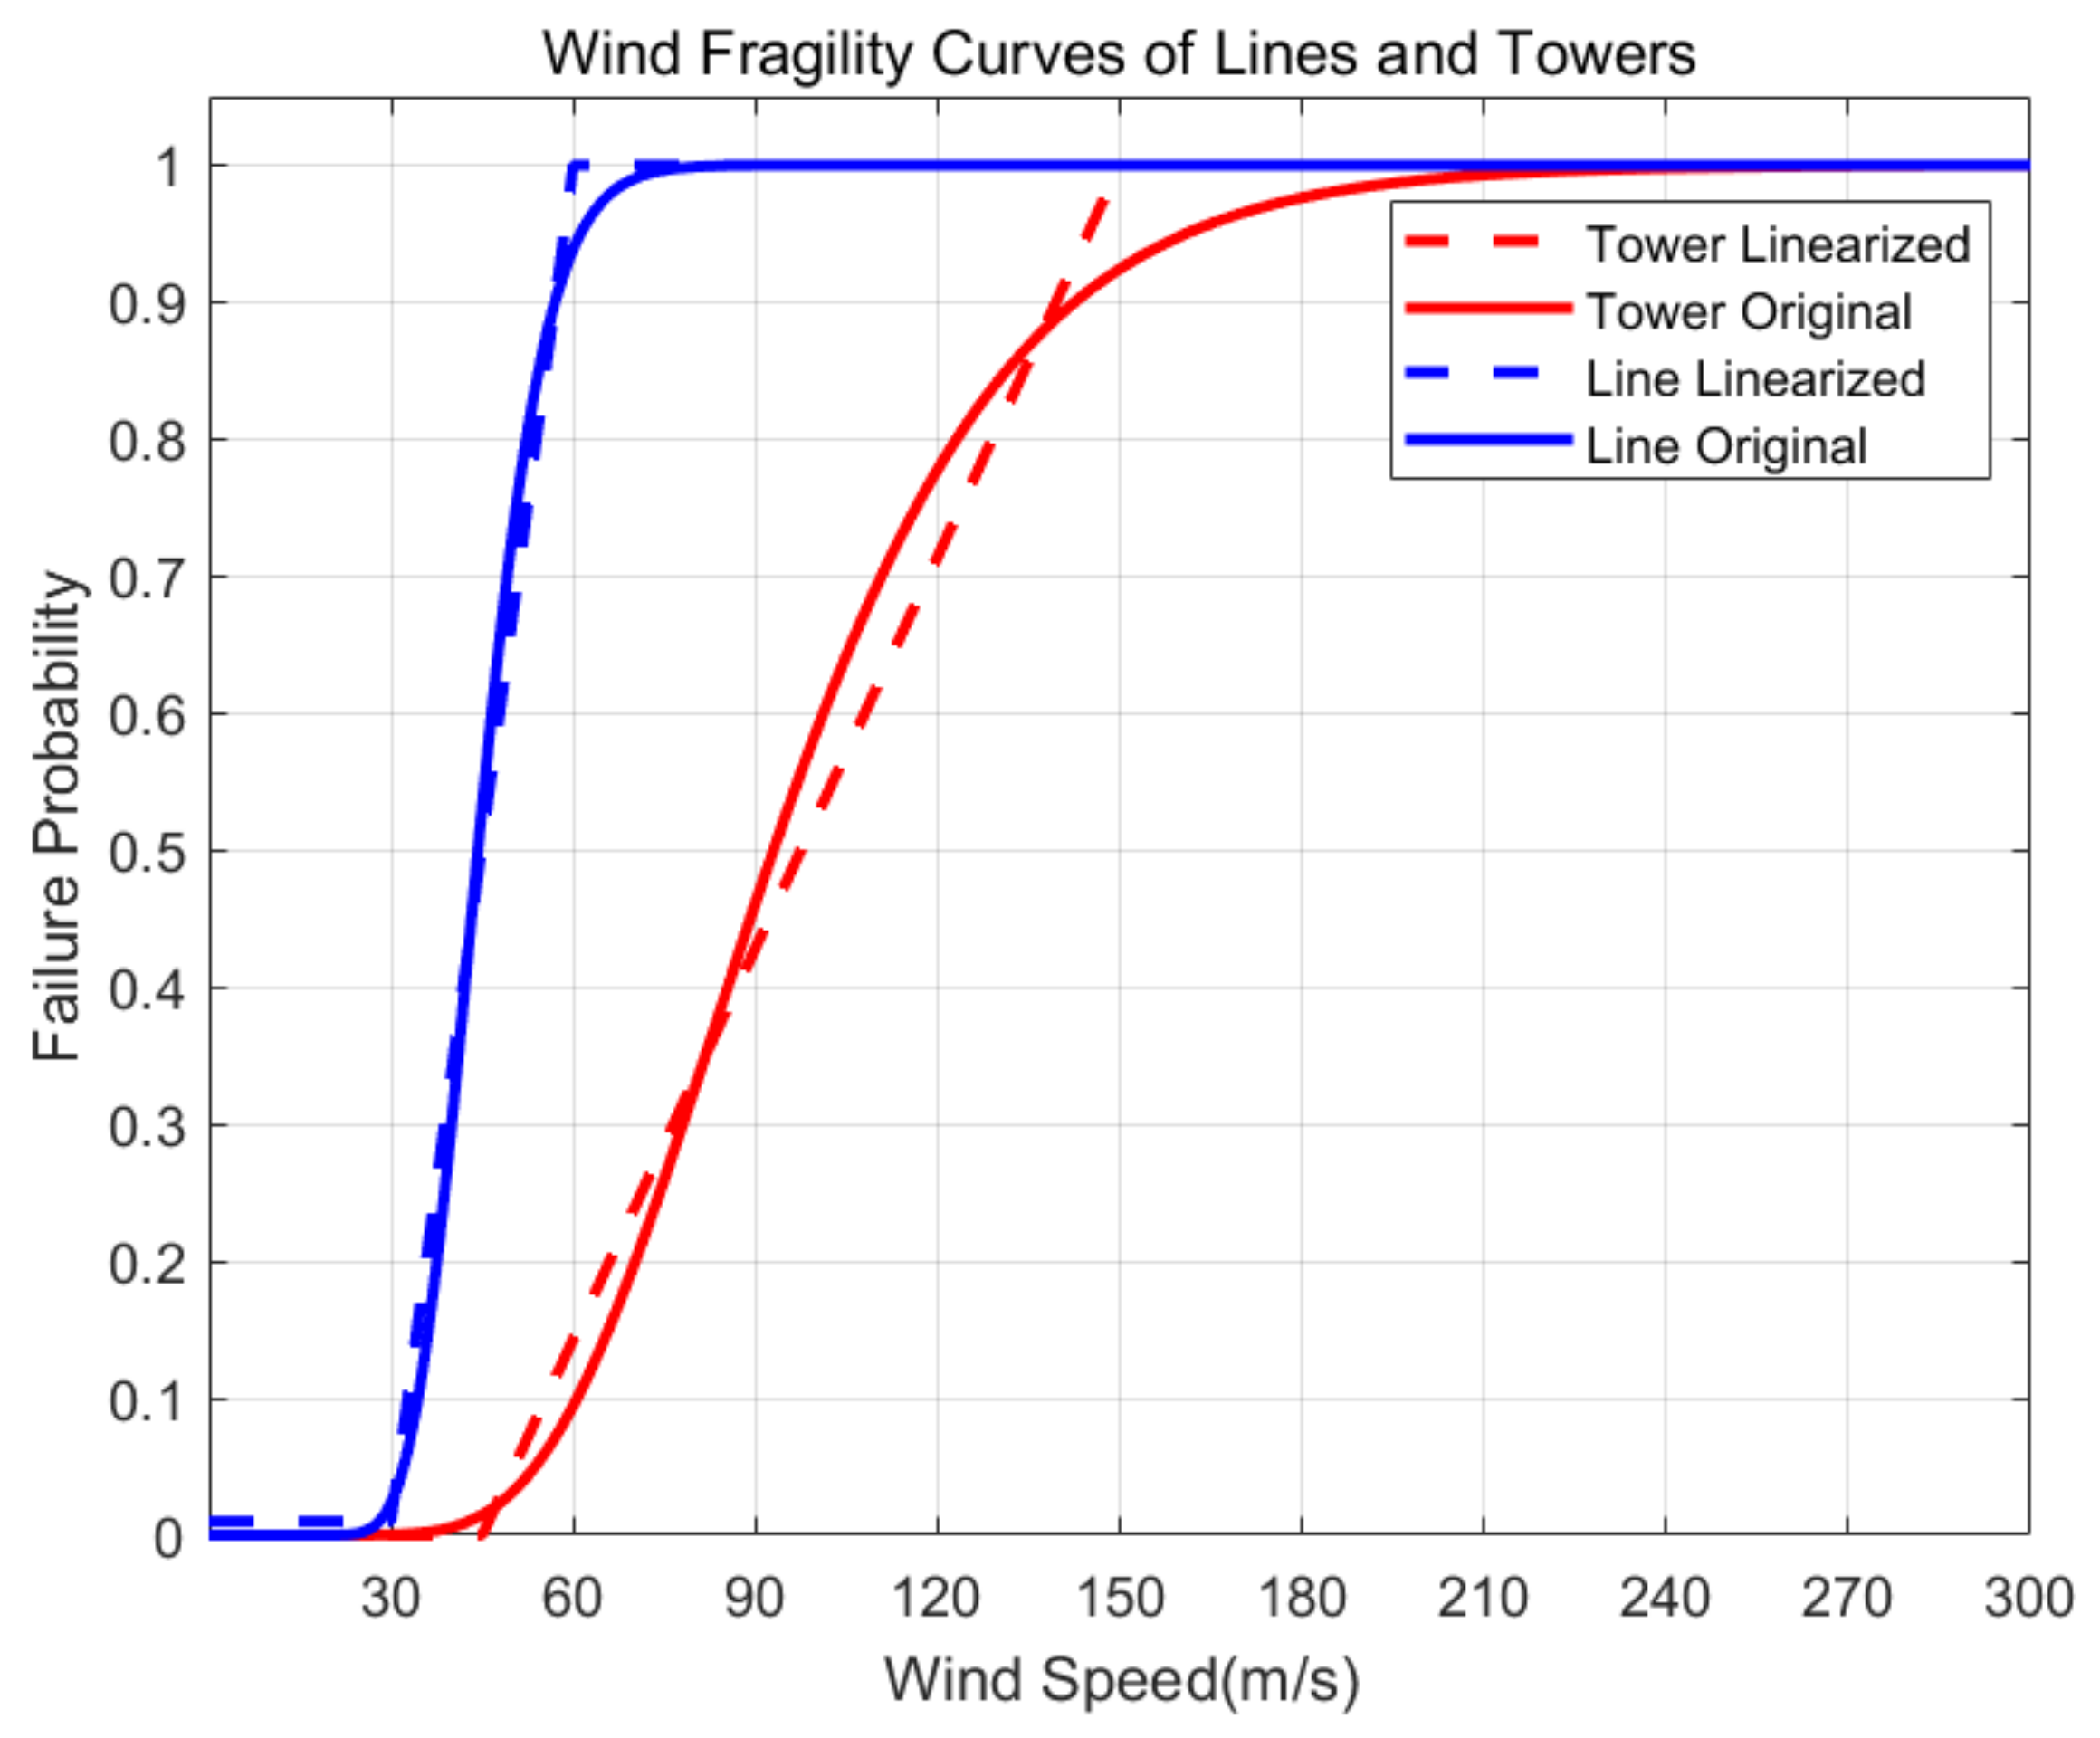
Figure 1. Wind fragility curves of transmission lines and towers.
Energies 17 01165 g001
Figure 2. Damage curve for a typical electrical substation.
Energies 17 01165 g002
Figure 3. Original flooding fragility curves for HV, MV, and LV electrical substations and distribution centers [46] (b). Softened fragility curve (a) and Hardened fragility curve for sensitivity analysis (c).
Energies 17 01165 g003
Figure 4. Waterlogging fragility curve for a typical electrical substation.
Energies 17 01165 g004
Figure 5. IEEE 33-node test system.
Energies 17 01165 g005
Figure 6. Powered load in different schemes of the IEEE 33-node system.
Energies 17 01165 g006
Figure 7. Step 1 (a), Step 2 (b), Step 3 (c) and Step 4 (d) of the dynamic reconstruction process.
Energies 17 01165 g007
Figure 8. The 118-node distribution network test system.
Energies 17 01165 g008
Figure 9. Powered load in different schemes of the IEEE 118-node system.
Energies 17 01165 g009
Table 1. System faults in each period.
Time ( t T )Fault Branch ( e E )Fault Bus ( b B )
t 0 (1) e 2 , 19
t 0 +1 h (5) e 6 , 7 , e 6 , 26 b 11
t 0 +2 h (9) e 9 , 10 , e 32 , 33 b 29
t 0 +3 h (13) e 12 , 13 , e 24 , 25 , e 3 , 23
Disclaimer/Publisher’s Note: The statements, opinions and data contained in all publications are solely those of the individual author(s) and contributor(s) and not of MDPI and/or the editor(s). MDPI and/or the editor(s) disclaim responsibility for any injury to people or property resulting from any ideas, methods, instructions or products referred to in the content.