Abstract
Axial fans may be equipped with passive flow control devices to enhance rotor efficiency or minimize noise emissions. In this regard, blade designs influenced by biomimicry, such as rotors with sinusoidal leading edges (LEs), have gained popularity in recent years. However, their design is predominantly driven by a trial-and-error approach, with limited systematic studies on the influence of rotor performance. Furthermore, their effectiveness is typically evaluated under controlled conditions that may significantly differ from operations in real installation layouts. In this work, a systematic review of the design process for sinusoidal LE axial fan rotors is provided, aiming to summarize previous design experiences. Then, a modified sinusoidal LE is designed and fitted to a 7.3 m low-speed axial fan for air-cooled condensers (ACCs). These fans operate at environmental conditions, providing a quasi-zero static pressure rise, often with inflow non-uniformities. A series of RANS computations were run to simulate the performance of the baseline fan and that of the sinusoidal leading edge, considering a real installation setup at Stellenbosh University, where the ACC is constrained between buildings and has a channel running on the ground below the fan inlet. The aim is to explore the nonbalanced inflow condition effects in both rotor geometries and to test the effect of the installation layout on fan performance. The results show that the modification to the rotor allows for a more even distribution of flow in the blade-to-blade passages with respect to the baseline geometry.
1. Introduction
Large air-cooled condensers (ACCs) are typically found in steam power plants that operate in regions with scarce water supply. In ACCs, air is the working fluid that removes heat and drives steam condensation [1]. The air flow is forced through arrays of condenser units, each equipped with one or more large-diameter low-speed axial fans. Depending on the power plant layout and the environmental conditions, two configurations, namely A- or V-shaped, are used. In the first case, a forced-draft fan drives air to a pipe with condensing steam, which is placed in the higher part of the unit. In the second, an induced-draft fan is placed downstream (above) of the steam pipe. Regardless of the configuration, they are both designed to work in an open atmosphere and environmental conditions. Thus, ACCs frequently work in off-design conditions due to daily and seasonal variations of ambient temperature, lateral wind, wind gusts, blockage from buildings, or, in general, a combination of the former elements. In view of the large number of units (larger plants can exceed 500) and their specific power consumption, off-design operations may result in a significant increase in auxiliary power demand. The possible strategies to reduce the impact of external factors on ACC performance advocate for the optimization of the ACC layout in the plant and/or the improvement of fan robustness to off-design conditions and inflow distortions.
The layout optimization of ACC units is beneficial to improve the unit thermal exchange and fan efficiency. In fact, Butler and Grimes [2] have highlighted that it is necessary to consider the historical local ambient wind conditions in the preliminary design of the condenser layout to reduce the impact of environmental factors. Marincowitz et al. carry out a multi-objective optimization to mitigate the effect of wind on the thermal performance of ACCs [3]. Their final set of feasible solutions lies in a compromise between thermal exchange efficiency and blade loading reduction. A novel approach to ACC layout is proposed by Chen et al. [4], who designed a vertical layout for ACC units, improving system robustness to off-axis air flows [4]. A further strategy that is frequently coupled with layout optimization involves the adoption of wind screens that shield the units from lateral winds. However, in close-to-nominal operating conditions, the wind screen installation may result in the degradation of fan performance, as reported in [5]. A similar behavior is found in [6], which reports a reduction in the thermal efficiency in the Rankine cycle of a power plant. Even if the main deviations are found for the windward fan, the internal units also experience reduced performance, even at relatively low wind speeds. In [7], Bianchini et al. numerically investigated an ACC array to determine the best layout and geometry of windscreens. Bekker et al. [8] carried out a similar analysis for induced-draft ACCs, also identifying wind directions that appear to be more detrimental to the nominal operations of the plants. Finally, the non-uniformities of the thermal performance of ACC units may also be induced by the wayward fans that alter the intake of the internal units [9].
The effects of lateral wind can be mitigated through an appropriate fan design, with clear guidelines reported in [10]. They conclude that free vortex swirl distribution with parabolic modification has better performance for this category of fans. Rotors designed with low hub-to-tip ratios have increased the total-to-static efficiency of the fans, although they may exhibit excessive hub swirl and losses. In [10], the authors found that the spinner cone shape is not relevant to rotor aerodynamic performance, and they conclude by suggesting that ACC fans may be equipped with a simple flat plate. Several scholars identify the tip section as being critical in the presence of lateral wind, as pointed out by Duvenhage et al. [11]; they analyzed the influence of the bellmouth shape on the inlet flow field. Wind causes flow separation near the bellmouth edges and increases aerodynamic losses regarding the fans in the tip sections. This effect is magnified at higher wind velocities. Similar results, validated against experimental data, are also supported by Thiart and Von Backström, who also report flow separation close to the fan hub [12]. Fourie et al. focus on fan solidity and its influence on the volumetric effectiveness of the system. Solidity should be carefully chosen based on the fan installation height, as flow non-uniformities prevail closer to the ground [13]. An analysis of the consequences of inlet distortion on fan aerodynamics was carried out by Van der Spuy et al. in [14]. Here, the consequences are evident in all the fans of the array, where they experienced off-axis inlets, while the flow separation that takes place in the bellmouth was found to affect only the peripheral fans of the array. The authors also observed that fans with steeper characteristic curves are more resilient to inlet distortion. Moreover, fans that typically exhibit low noise emissions may be suited for the installation in ACCs. Among the problems in the operation of ACC units, are noise and airflow-induced blade mechanical vibration (FIV), which are important issues. The large span of ACC fan blades, their weight, and unsteady blade loading can also result in vibrations, with fatigue effects on the bearings and motor. For these reasons, some fan manufacturers (including the one under examination) are considering nonmetallic materials, composite materials, and hollow-honeycomb structures. The use of advanced materials can, indeed, change the vibrational modes of the fan, resulting in the control of noise and vibrations, as shown in [15].
Despite the influence of inflow distortion on the fan power absorption and operating conditions, to the best of the authors’ knowledge, no significant solution to mitigate this problem has found large-scale application.
This manuscript aims to understand if the leading edge serrations can help to control fan performance under distorted inflow conditions and highlight the effects on the fan of the ACC installation site. In particular, we aim to highlight whether the blockage of the buildings on the sides of the ACC and the channel that runs below the fan inflow have an influence on the inlet conditions. The paper is structured as follows: In the first part, the role of a sinusoidal leading edge and its application as a flow control technique is discussed. In the second part, the procedure to design the sinusoidal leading edge from rotor-only simulations, based on a literature survey, is reported. The numerical analysis of the aerodynamic performance of a fan equipped with the modified blades then follows. The fan is installed in an ACC test facility. Different scenarios are simulated in order to replicate mild and strong off-axis flows. A comparison between baseline and modified blades is eventually reported.
2. Flow Control Using Sinusoidal Leading Edges
The adoption of concepts that are biology-inspired is not entirely novel in turbomachinery design. These solutions frequently aim to increase stall margin, lift-to-drag maximization, and noise emission reduction [16]. Pioneering works from Fish [17,18] focus on hydro-dynamics and how natural selection has favored characteristics that improve swimming efficiency. In a similar manner, the unique camber distribution found in seagull wings was investigated by Xin et al. [19]. A comparison with NACA four-digit airfoils proved that seagull wings operate with increased aerodynamic efficiency. Nevertheless, these solutions can hardly be applied to engineering problems, as the Reynolds numbers involved are too low for turbomachinery applications.
In contrast, humpback whales (Megaptera novaeangliae) provide one of the few examples of natural evolutionary traits that can be turned into turbomachinery solutions while still preserving kinematic similarity. These whales are characterized by tubercles on the head and front edge of the pectoral flippers, which span up to 5 m and exhibit a winglike aspect ratio and 10 to 11 round tubercles. The tubercles are found in the outer 70 % of the flipper span and are equally spaced, as described by Fish and Battle [20]. Several researchers have investigated the underlying physics of tubercles, with the turbomachinery-relevant works summarized in Table 1. In contrast with whale tubercles, the shapes found here exhibit regular patterns. Therefore, tubercle geometry can be characterized by the sole wave length and amplitude , following the scheme of Figure 1.

Table 1.
Literature survey of the turbomachinery-relevant studies on leading edge tubercles. The wavelength and amplitude of the sinusoids are expressed as a percentage of the chord. The Reynolds numbers were computed based on the mean chord.
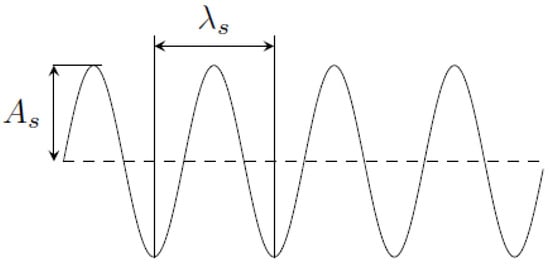
Figure 1.
Modification of the straight leading edge (dashed line) using a sinusoidal function.
2.1. Design Practices and Challenges for Sinusoidal Leading Edge Rotors
The analysis of the relevant prior works outlines several best practices for the design of a rotor with a sinusoidal leading edge:
- The amplitude of the sinusoid is selected between 0.05c and 0.4c, where c is the chord length of the aerodynamic profile;
- Higher values of are associated with higher aerodynamic losses at low incidence;
- The effect of the wavelength is negligible in post-stall operations; however, low values of are responsible for increased losses;
- Wavelength is normally chosen between 0.1c and 0.4c;
- Low values of and large are preferred in noise control. Tubercles are, in fact, beneficial in diminishing tonal noise at peak frequencies, and modified airfoils show reduced broadband sound pressure levels. In isolated profiles, new peaks at higher frequencies may appear;
- Sinusoid leading edge aerodynamic performance is similar for Reynolds numbers between 0.1M and 1.5M;
- Airfoil thickness plays a role, suggesting that thicker profiles are less sensitive to performance degradation due to sinusoidal shape;
- Sinusoids act as stall delayers and post-stall stabilizers, with little to no effect in stable operations. It is, therefore, not recommended to apply this modification if stable operation is expected.
Despite clear indications of admissible values to guide tubercle design, several challenges to their application in turbomachinery, especially fans, remain unsolved. First, the standard design procedures for turbomachinery do not account for the altered distributions of velocity and specific work caused by the presence of a sinusoidal LE. Sinusoids are often only included after the final design of the baseline geometry is obtained. Second, the same procedures usually don’t entail the effects of radial motions. Regarding amplitude and wavelength selection, no unanimous consensus has been reached so far, with relevant works only pointing out acceptable ranges for these values. The percentage of the blade span to be covered with the sinusoidal modification is not well understood, even though it is typically located in the last 20% of the span. How the sinusoidal pattern could interfere with blade modifications that involve a radial redistribution of specific work, such as blade skewing or sweeping, is still unknown. Additionally, their effects in the deep stall region have not been fully investigated yet.
2.2. Sinousoidal Leading Edges in Fan Rotors
Several works have studied the application of tubercles to axial fan rotors. Sinusoids can be applied along a portion of the blade span on the leading edge and are characterized by varying chord lengths of a fixed amplitude, following a sinusoidal distribution.
The airfoil thickness is increased or reduced accordingly. The number and amplitude of sinusoidal peaks must be carefully selected to avoid an excessive derating of the aerodynamic properties of the section, as reported in [33,34]. Sinusoidal LEs allow fans to operate above their stall points, as reported in [35].
Concerning rotor noise, Chong et al. [36] have found that the highest noise reduction occurs with the largest amplitudes and smallest wavelengths. In fact, modified airfoils suppress trailing edge self-noise and turbulence–leading edge interaction noise. Noise does, however, increase at higher frequencies. Increasing the wavelength helps to increase the stall margin, even if the lift capability of the airfoil is reduced in pre-stall operating conditions. Similar results based on wind-tunnel tests on isolated wings are also reported by Guerreiro and Sousa. They also highlight that wings with a sinusoidal leading edge were not influenced, even by large variations in the Reynolds number [37]. Sinusoidal LEs in axial fans have also been investigated by Corsini et al., and in [32,38], the authors analyze the relationship between stall margin increase, noise reduction, and the interaction of the sinusoids with the flow.
Despite the working principle remaining mostly unaltered, the application of sinusoids to fan rotors shows some differences with respect to isolated airfoils and wings:
- Sinusoidal LEs induce additional vorticity that interferes with the secondary structures that are generated in the flow passage. They also generate radial motions that interfere with and dampen the tip leakage vortex;
- The sinusoids are locally applied to control the radial velocity distribution. As an example, only the outer 30% of the blade span is usually modified with the sinusoidal profile;
- Airfoil family, thickness, and camber distributions may substantially differ from the relevant works on isolated airfoils, which mostly focus on NACA 0021 and NACA 65-021.
Due to these aspects, no clear guidelines and best practices have been developed yet.
3. Design of Sinusoidal Leading Edge Rotor for a Low-Speed, High-Diameter Fan in an ACC Test Facility
This section describes the design criterion and aerodynamic effects of a sinusoidal LE in a low-speed, large-diameter axial fan. The fan under analysis was developed under the Horizon2020 MinWaterCSP program [39]; its main features are summarised in Table 2. A front view of the fan with the blade number, which is later exploited for a discussion of the results, is reported in Figure 2. The design and optimization process of the baseline geometry is fully described in [40]. The fan has previously been extensively investigated using actuator line models [41,42] and fully resolved CFD [43,44,45].

Table 2.
Description of the fan.
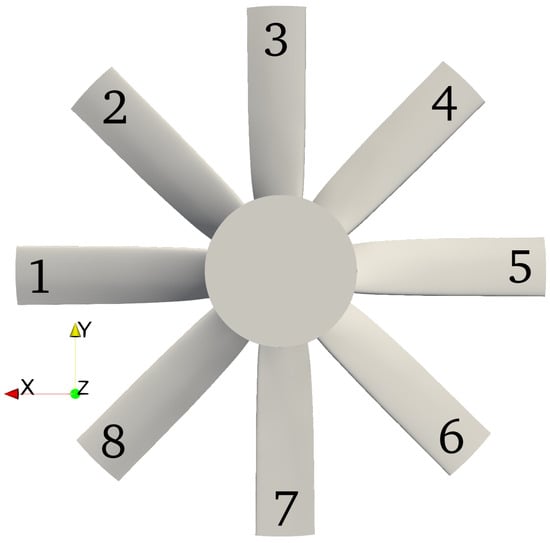
Figure 2.
Front view of the fan and blade numbering.
The design of the sinusoidal LE is based on the concept of controlling the interaction between the separation on the suction side of the blade and the tip leakage vortex. In particular, the aim is to limit the trailing edge separation that occurs at peak pressure to allow the tip leakage vortex to develop along the suction side of the blade. Breaking the interaction of flow separation with the TLV allows for its development along the blade suction side and, thus, avoids the drop in pressure typically associated with stalled operations [16]. This dynamic is shown in Figure 3, where the streamlines of relative velocity on a cylindrical surface at 100.05% of the tip radius are plotted with the tip in the background as a reference. In the figure, the white line is the chord of the tip section, and the black line is the direction of the core of the TLV. At peak pressure fan operation, the flow separates on the tip section at about 50% of the chord, leading to an interaction with the TLV that is unable to develop in this region and is, therefore, convected away from the blade suction side. On a modified rotor, however, the vorticity shed from the leading-edge bump closes the separation and allows the TLV to remain close to the suction side, leading to an increase in velocity and a drop in pressure.
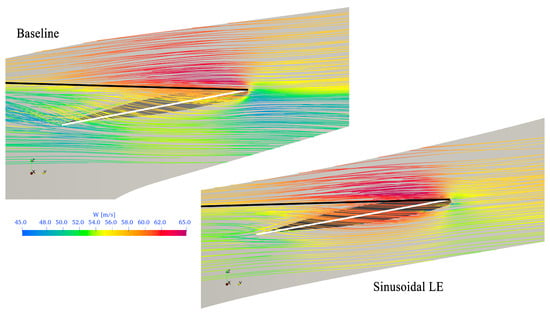
Figure 3.
Comparison between the tip leak vortex dynamics for baseline and modified blades. The relative velocity streamlines are colored using relative velocity magnitude, W.
The design of the sinusoidal leading edge starts with the analysis of the pressure distribution on the baseline geometry at the peak pressure operating point, Figure 4. From previous works, it is known that the number of sinusoids must be limited to avoid increasing the drag on the rotor. Additionally, the tip section must correspond to a peak of the sinusoid, and at least one other peak is needed to shed counter-rotating vortices from the leading edge correctly. This leads to the idea of limiting the number of sinusoids to 1.5. Furthermore, the average blade surface is kept constant and the amplitude of the sinusoid is kept at 20% following previous studies, in which this value was proven to be a good trade-off between the the capability to control tip separation without an abrupt increase in drag. Finally, the wavelength of the sinusoid was chosen so that the first sinusoid covers the regions of high-pressure and low-pressure, respectively, on the pressure/suction surfaces near the leading edge of the baseline blade (Figure 4).
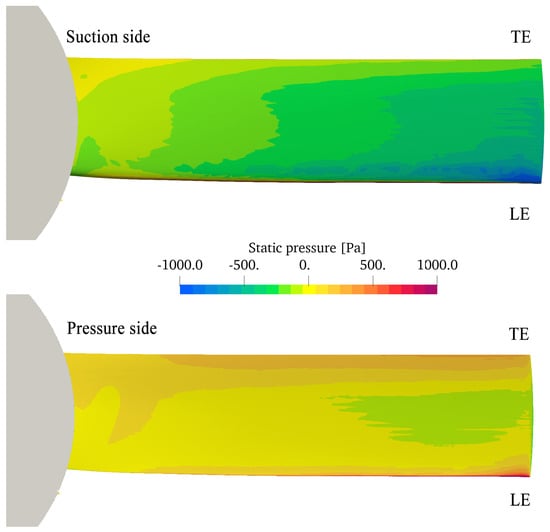
Figure 4.
Static pressure distribution on the suction and pressure surfaces for the baseline rotor.
4. Experimental and Numerical Setup
This section analyzes the effects of the sinusoidal leading edge in the off-design operations of a low-speed axial fan for air-cooled condensers. The fan, which is described in Table 2, is commonly found in ACCs. Given the near-zero static pressure rise provided by the rotor, inlet distortions may cause the fan to operate in unstable conditions. The numerical results hereby reported aim to characterize the rotor aerodynamics in the presence of significant non-uniformities at the inlet, and they are used to assess the effectiveness of the modified leading edge in these conditions. The computational domain is derived from the air-cooled condenser experimental facility that is installed at Stellenbosh University, South Africa. The test rig is equipped with a full-size 7.3 m diameter fan. The facility is installed between two buildings that exert a significant blockage on the fan inflow. Moreover, a channel runs on the ground below the fan inlet, and its influence on the inlet conditions is still to be understood. The following computations entail all these aspects that reflect in the computational domain, as shown in Figure 5.
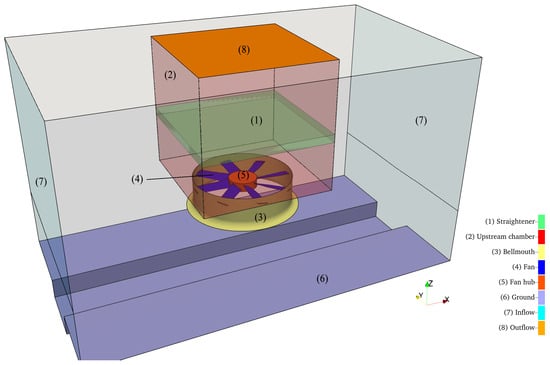
Figure 5.
Scheme of the numerical model of the experimental facility (computational domain).
The rotor (4) is installed below a closed chamber (2) that mimics the heat exchanger found in the real installation. The test rig is equipped with a metallic grid (1) that acts as a flow straightener with a drag resistance corresponding to the tube bundle in a heat exchanger. The air flow enters the domain from the two lateral boundaries (7) and exits from the chamber from (8). The structure is supported by four columns (not present in these simulations). The ground below the rotor (6) includes the channel that runs below the structure; the channel is there to avoid possible floods during exceptional weather events, so it is usually empty. The inlet and the fan outflow are installed at 2.2 m and 8 m above ground level, respectively. The chamber was built using a squared section with a length of 4.8 m. The inlet sections are placed 6 m from the exterior of the bellmouth.
4.1. Scenario Definition
The two rotor geometries were simulated both in nominal and distorted inflow conditions. An asymmetric intake was generated by varying the volumetric flow rate at the inlets of the domain (Surfaces (7) in Figure 5). The results are analyzed for three scenarios:
- i
- Balanced (B): The flow rate is equally divided between the two inlets;
- ii
- Mildly unbalanced (MU): the inflow has an imposed flow rate that is double that of the opposite;
- iii
- Fully unbalanced (FU): the full flow rate is imposed on one inlet only
4.2. Numerical Modeling
The computations were carried out using the Galileo100 CINECA HPC cluster, with 384 processors and 12 node hours for each simulation. Computations were performed in OpenFOAM-v21, using a stationary SIMPLE solver. Turbulence closure relied on the RNG model. The relative motion between the rotor and the solid surfaces of the layout was modeled using a frozen rotor approach, solving Navier–Stokes equations in a multiple reference frame (MRF). The presence of the straightener downstream of the fan is modeled using the Darcy–Forchheimer law, with the pressure gradient across the grid equal to:
The two coefficients of Equation (1), and , were computed according to the methodology reported in [46] and were validated against the experimental measurements. The grid is responsible for a static pressure drop of 40 Pa.
The computational grids were generated using the OpenFOAM–v22.06 snappyHexMesh built-in utility, using a background grid of 0.2 m isotropic cells. Grid refinement is based on the grid sensitivity analysis reported in [47]. Both grids (modified and baseline rotors) entail approximately 18M cells. The grids were designed for high-Reynolds number computations to achieve a value of 100 in the tip region. An a-posteriori check resulted in a maximum value of between 112 and 120 for the baseline fan and between 98 and 112 for the sinusoidal LE fan, depending on the computed flow rate. The volumetric flow rates of the fan, determined according to three scenarios, are imposed at the inlet of the domain. The turbulent intensity of the inlet was set to . No slip boundary conditions were applied to all of the solid surfaces, with a high Reynolds wall function for the turbulent quantities. The lateral and top surfaces were treated as slip surfaces for numerical stability. At the outflow, convective boundary conditions were selected for all the quantities.
5. Validation
The numerical results are first evaluated for the balanced scenario for different volumetric flow rates. The TTS pressure rise and power absorption shown in Figure 6 were computed for two measuring sections at 4.9 m and 6.46 m from the ground, respectively. Figure 6 also shows the experimental shaft power consumption for the fan, as measured on the MinwaterCSP facility [48].
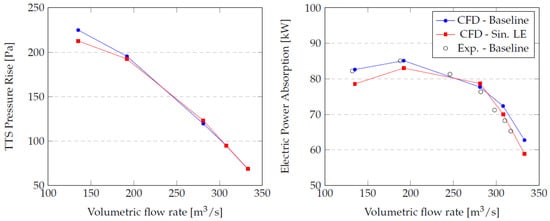
Figure 6.
Total-to-static pressure rise and electric power absorption versus volumetric flow rate for the two rotors, and a power comparison using the available measurements.
The results highlight that (a) the two rotors provide almost the same TTS pressure rise at all flow rates, with the baseline geometry providing higher pressure at the lowest flow rate (135 m3/s); (b) the blade equipped with sinusoidal LE has reduced power absorption at all flow rates; hence, it operates with similar TTS efficiency with respect to the baseline geometry; (c) the numerical results show good agreement between CFD and the measurements for the baseline geometry.
6. Results
6.1. Fan Performance under Distorted Inflow Conditions
In Table 3, the TTS pressure rise performance of the two fans is reported for different inflow conditions. The pressure rise is calculated using the same measuring sections used for Figure 6. In balanced conditions, the baseline and the sinusoidal LE rotors provide the same pressure rise. For mild unbalanced (MU) inflow conditions, the sinusoidal LE fan has a lower pressure rise capability between 281 and 308 m3/s, similar performance in terms of design conditions, and lower flow rates with respect to the baseline rotor. Finally, the fully unbalanced (FU) inflow conditions strongly reduced the pressure rise of the two fans at all flow rates, with a significant reduction of 13.5% and 37% in the design flow rate for the baseline and modified rotors, respectively.

Table 3.
TTS Pressure rise [Pa] versus volumetric flow rate: a comparison between baseline and sinusoidal LE for the different inflow scenarios.
Figure 7 shows a comparison between the electric power and TTS efficiency characteristic curves of the two fans for the different inflow conditions. Both fans operate with increased power absorption in the case of unbalanced inflow conditions. In fact, in fully unbalanced conditions, the baseline geometry shows an average 5.15% increase in power absorption, with a maximum of 8% more at 308 m3/s. In contrast, the modified geometry has a lower increase in power absorption at all flow rates (less than 3%), apart from the design point (12% of the increased power absorption). This analysis highlights that (a) the MU scenario strongly affects fan behavior, mostly in terms of power absorption, whereas pressure rise is mildly affected; (b) the modified rotor shows a sharp reduction in TTS pressure rise in close-to-nominal flow rates in the FU scenario and reduced power absorption at all flow rates; (c) the de-rating of performance for the two fans is particularly evident at the highest flow rates.
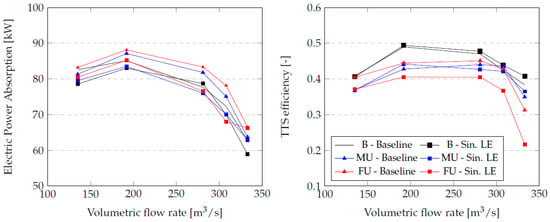
Figure 7.
Electric power absorption and total-to-static efficiency versus volumetric flow rate for the two rotors at different inflow balances.
The baseline geometry has a better TTS efficiency (computed using electric power) at all flow rates with respect to the modified rotor. However, this difference is negligible for the balanced scenario, with small differences in the MU scenario. In the FU scenario, the modified rotor is characterized by a loss of 9.3% instead.
6.2. Flow Survey with Balanced and Distorted Inflow Conditions
In this paragraph, the effects of the layout of the installation (lower channel and lateral walls) and the inflow conditions (balanced or distorted) are discussed by analyzing the flow behavior upstream of the fan. In particular, Figure 8 (first row) shows the streamline patterns on a meridional plane aligned with the channel that flows downstream of the baseline fan, while Figure 8 (second row) shows normalized axial velocity contours 1 m upstream of the rotor. Rows 3 and 4 in the same figure repeat the same visualizations for the sinusoidal LE rotor. In order to better understand where the flow is driven by the fan, in the second and fourth rows of the figure, black and blue dots mark where the streamlines released, respectively, from the left and right inflow sections intersecting the contour plane. For the baseline geometry (second row of the figure) with a balanced inflow condition (left), the velocity contour is mostly symmetric with respect to the x-axis, with the separated flow on the left and right of the shroud (the light asymmetry can be addressed to the MRF solution and the frozen clocking of the blades with respect to the environment). Most of the streamlines enter the duct from the left and right part, resulting in a non-axy-symmetric flow pattern. This asymmetry is related to the lateral wall rather than the underground channel, which, from further visual inspection (not shown here), seems not to be affecting fan operations, confirming that the fan is installed sufficiently far-away from the ground.
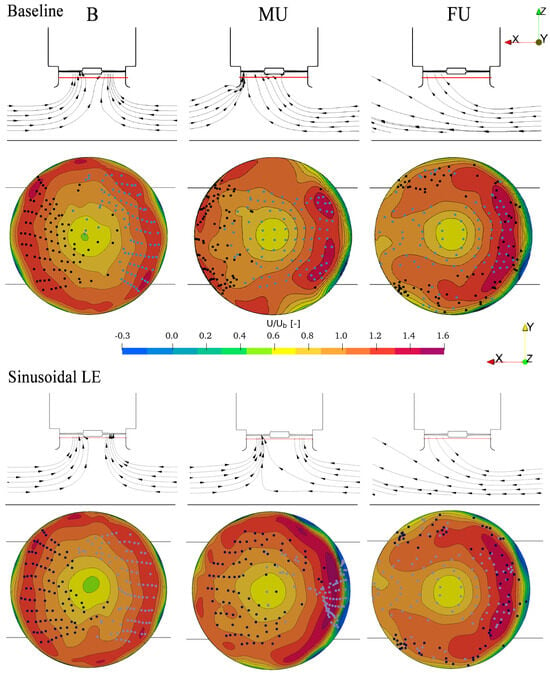
Figure 8.
Scheme of air intake, and a comparison between the inflow velocities in the bellmouth section for the three scenarios. Axial velocity is normalized with respect to bulk velocity, . The black lines represent the inflow channel reported in Figure 5.
For the MU and the FU scenarios, the flow becomes non-symmetric with respect to the y-axis, with a higher velocity region present in the right part of the inflow (i.e., the one with the higher mass-flow rate). In the MU case, the flow coming from the right inflow feeds roughly three-quarters of the fan inlet section, while the flow from the left inflow enters about one-quarter of the surface. It must be pointed out that the top and bottom parts of the inflow are fed, instead, by the air drafted by the fan from the sides, close to the lateral walls of the domain. Moving to the FU case, most of the fan inflow region is fed by the right side, while the air drafted from the left side enters the fan inflow in the region at the tip where axial velocity is higher. Moving to the sinusoidal LE rotor (fourth row), the inflow velocity contours show basically the same behavior as the baseline rotor in the balanced and FU inflow operations. There is, however, a different behavior in MU operations: the rotor with the Sinusoidal LE, in fact, shows a higher region of axial velocity on the right portion of the inflow at high radii. This region is fed from the right inflow, and thus, flow from the left side can actually feed most of the left side of the inflow annulus.
In Figure 9, the streamline patterns released from both the inflow sections are shown in different views to better understand the flow behavior of the baseline fan rotor. In this figure, the blue streamlines are released from the inflow section on the right (the one with the higher flow rate when the flow is not balanced), and the black streamlines are released from the left inflow. A lateral view is given in the first row, while a view from the bottom is given in the second row for the balanced and mild unbalanced conditions. The last figure is a 3D view of the FU condition. In balanced conditions, the flow is mostly symmetric with respect to the x-axis, and the air is drafted from the lateral inflows and enters most of the inflow section. In MU conditions, the draft action reflects the increase in air coming from the right side. The flow is still symmetric with respect to the x-axis. In FU conditions, the flow becomes more complex, with most of the air that enters the fan inflow coming from the right side of the fan and two highly three-dimensional structures being drafted from the left side that enters the fan inflow on the sides.
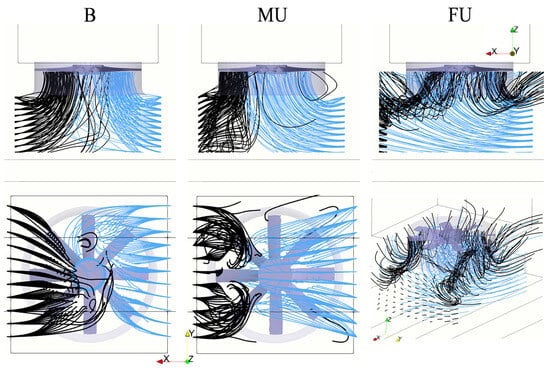
Figure 9.
Lateral, bottom, and three-dimensional view of the flow streamlines, colored according to the inflow direction; baseline geometry.
In Figure 10, the same visualization is provided for the sinusoidal LE fan, where, again, the major difference with respect to the baseline fan is found only in the MU operations. In fact, when comparing the central columns of Figure 9 and Figure 10, it is evident how the flow entering from the right side (that has double the flow rate of that coming from the left) in the baseline fan enters most of the inflow section, constraining the black streamlines on the left side of the inlet duct. For the Sinusoidal LE fan, the flow rate coming from the right enters most of the fan’s central inflow section, and the one that enters from the left covers the sides.
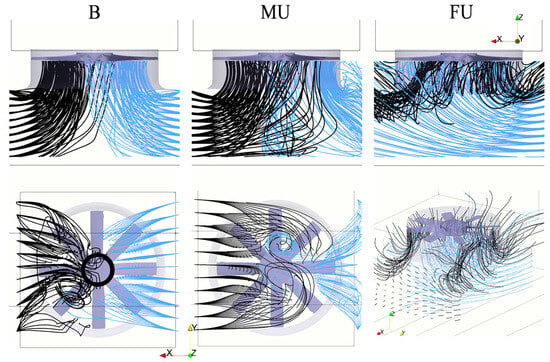
Figure 10.
Lateral, bottom, and three-dimensional view of the flow streamlines, colored according to the inflow direction; sinusoidal LE geometry.
The different behavior of the two rotors in the MU conditions is also shown in Figure 11 and Figure 12, where the cascade views at midspan and 95% of the span for the relative velocity contours are shown for both geometries. At midspan, Figure 11, the major differences between the blade-to-blade passages of the two rotors are found in between blades 8–1 and 1–2, where the sinusoidal LE rotor shows a flow that is basically the same as that of the other passages, while in the baseline rotor, higher velocity defects are found for blades 1, 2, and 3 with respect to the others. Near the tip of the blade, Figure 12, the same considerations apply as, in fact, the sinusoidal LE rotor is characterized by a blade-to-blade velocity distribution that is similar for each passage. In contrast, for the baseline rotor blade-to-blade passages, 8–1 and 1–2 are characterized by a strong acceleration with respect to the others. This can be explained by the contribution of the left inflow to the overall flow rate in this area, a trait that is better highlighted in Figure 5.

Figure 11.
Cascade projection of the relative velocity contour at 50% of the span for the two rotors. The blades are numbered according to Figure 2.

Figure 12.
Cascade projection of the relative velocity contour at 95% of the span for the two rotors. The blades are numbered according to Figure 2.
7. Conclusions
In this manuscript, the results of the computations of two axial fan rotors fitted inside an air-cooled condenser real installation layout are reported to answer the following research questions: (i) Can a modified sinusoidal leading edge help control fan performance under distorted inflow conditions? (ii) How does the installation setup—constrained between two buildings and entailing a channel dug on the ground below the fan inlet—affect the inflow velocity under uniform and non-uniform conditions? When the fan operates with a balanced inflow, the baseline and sinusoidal LE rotors have the same pressure performance, and the latter has slightly lower power consumption (Figure 6). With mild-unbalance and full-unbalance inflow conditions, in general, the baseline geometry has a higher pressure rise (Table 3), and both fans work with increased power (Figure 7). In general, the efficiency of the fan with the sinusoidal LE rotor has better efficiency at FU conditions, while in B and MU operations, the overall TTS efficiency of the two rotors is quite close along the operating range. We can conclude that in this installation layout, the LE modification has a limited capability of controlling the detrimental effects of inflow distortions. When dealing with the installation setup, the computations show that the distortion of the inflow velocity is related to the effects of the lateral buildings rather than the horizontal channel that runs below the ACC. In fact, the distance between the ground and the fan inflow is long enough to avoid a direct influence, whereas the tunneling effect of the lateral buildings has a clear effect on inflow distortion.
Author Contributions
Methodology, software, formal analysis, writing and visualization: L.T. and G.D.; Funding acquisition: A.C.; Supervision: G.D. and J.V.d.S. All authors have read and agreed to the published version of the manuscript.
Funding
This work received funding by the MIMIT under the Grant Agreement “RdS PTR 2022-2024—Energia elettrica dal mare”.
Data Availability Statement
The data presented in this study are available on request from the corresponding author.
Acknowledgments
We acknowledge the CINECA award under the Iscra-C initiative regarding the availability of high-performance computing resources and support under agreement Nr. HP10CU62XI.
Conflicts of Interest
The authors declare no conflict of interest.
References
- Astolfi, M.; Martelli, E.; Pierobon, L. 7—Thermodynamic and technoeconomic optimization of Organic Rankine Cycle systems. In Organic Rankine Cycle (ORC) Power Systems; Macchi, E., Astolfi, M., Eds.; Woodhead Publishing: Cambridge, UK, 2017; pp. 173–249. [Google Scholar]
- Butler, C.; Grimes, R. The effect of wind on the optimal design and performance of a modular air-cooled condenser for a concentrated solar power plant. Energy 2014, 68, 886–895. [Google Scholar] [CrossRef]
- Marincowitz, F.; Owen, M.; Muiyser, J. Multi-objective optimisation for wind resistant air-cooled condenser operation. Appl. Therm. Eng. 2023, 218, 119382. [Google Scholar] [CrossRef]
- Chen, L.; Yang, L.; Du, X.; Yang, Y. A novel layout of air-cooled condensers to improve thermo-flow performances. Appl. Energy 2016, 165, 244–259. [Google Scholar] [CrossRef]
- Venter, A.; Owen, M.; Muiyser, J. A numerical analysis of windscreen effects on air-cooled condenser fan performance. Appl. Therm. Eng. 2021, 186, 116416. [Google Scholar] [CrossRef]
- He, W.; Dai, Y.; Zhu, S.; Han, D.; Yue, C.; Pu, W. Influence from the blade installation angle of the windward axial fans on the performance of an air-cooled power plant. Energy 2013, 60, 416–425. [Google Scholar] [CrossRef]
- Bianchini, C.; Da Soghe, R.; Giannini, L.; Mazzei, L.; Gardner, A.; Wilde, J. Characterization of ACC Losses Due to Wind and Design of Optimal Wind-Screens. In Proceedings of the Turbo Expo: Power for Land, Sea, and Air, Boston, MA, USA, 26–30 June 2023; Volume 86991, p. V006T10A008. [Google Scholar]
- Bekker, G.; Meyer, C.; Van der Spuy, S. Influence of pressure recovery on the performance of an induced draught air-cooled condenser under windless and windy conditions. Appl. Therm. Eng. 2022, 213, 118703. [Google Scholar] [CrossRef]
- Yang, L.; Du, X.; Zhang, H.; Yang, Y. Numerical investigation on the cluster effect of an array of axial flow fans for air-cooled condensers in a power plant. Chin. Sci. Bull. 2011, 56, 2272–2280. [Google Scholar] [CrossRef][Green Version]
- Louw, F.G.; Bruneau, P.R.; von Backström, T.W.; van der Spuy, S.J. The design of an axial flow fan for application in large air-cooled heat exchangers. In Proceedings of the Turbo Expo: Power for Land, Sea, and Air, Copenhagen, Denmark, 11–15 June 2012; Volume 44694, pp. 771–785. [Google Scholar]
- Duvenhage, K.; Vermeulen, J.; Meyer, C.; Kröger, D. Flow distortions at the fan inlet of forced-draught air-cooled heat exchangers. Appl. Therm. Eng. 1996, 16, 741–752. [Google Scholar] [CrossRef]
- Thiart, G.; Von Backström, T. Numerical simulation of the flow field near an axial flow fan operating under distorted inflow conditions. J. Wind. Eng. Ind. Aerodyn. 1993, 45, 189–214. [Google Scholar] [CrossRef]
- Fourie, N.; Van Der Spuy, S.; Von Backström, T. Simulating the effect of wind on the performance of axial flow fans in air-cooled steam condenser systems. J. Therm. Sci. Eng. Appl. 2015, 7, 021011. [Google Scholar] [CrossRef]
- Van der Spuy, S.J.; von Backström, T.W.; Kröger, D.G. Performance of low noise fans in power plant air cooled steam condensers. Noise Control. Eng. J. 2009, 57, 341–347. [Google Scholar] [CrossRef][Green Version]
- Karpenko, M.; Stosiak, M.; Deptuła, A.; Urbanowicz, K.; Nugaras, J.; Królczyk, G.; Żak, K. Performance evaluation of extruded polystyrene foam for aerospace engineering applications using frequency analyses. Int. J. Adv. Manuf. Technol. 2023, 126, 5515–5526. [Google Scholar] [CrossRef]
- Bianchi, S.; Corsini, A.; Sheard, A. A critical review of passive noise control techniques in industrial fans. J. Eng. Gas Turbines Power 2014, 136, 044001. [Google Scholar] [CrossRef]
- Fish, F.E. Influence of hydrodynamic-design and propulsive mode on mammalian swimming energetics. Aust. J. Zool. 1994, 42, 79–101. [Google Scholar] [CrossRef]
- Fish, F.E.; Howle, L.E.; Murray, M.M. Hydrodynamic flow control in marine mammals. Integr. Comp. Biol. 2008, 48, 788–800. [Google Scholar] [CrossRef]
- Xin, H.; Rui, G.; Jin, J.F.; Liu, Y.R.; Yi, M.; Qian, C.; Zheng, Y. Numerical simulation and aerodynamic performance comparison between seagull aerofoil and NACA 4412 aerofoil under low-reynolds. Adv. Nat. Sci. 2010, 3, 244–250. [Google Scholar]
- Fish, F.E.; Battle, J.M. Hydrodynamic design of the humpback whale flipper. J. Morphol. 1995, 225, 51–60. [Google Scholar] [CrossRef]
- Watts, P.; Fish, F.E. The influence of passive, leading edge tubercles on wing performance. In Proceedings of the 12th International Symposium: Unmanned Untethered Submersible Technology, Annual International Symposium; Autonomous Undersea Systems Institute: Durham, NH, USA, 2001. [Google Scholar]
- Hansen, K.L.; Kelso, R.M.; Dally, B.B. Performance variations of leading-edge tubercles for distinct airfoil profiles. AIAA J. 2011, 49, 185–194. [Google Scholar] [CrossRef]
- Hansen, K.L. Effect of Leading Edge Tubercles on Airfoil Performance. Ph.D. Thesis, University of Adelaide, Adelaide, Australia, 2012. [Google Scholar]
- Xingwei, Z.; Chaoying, Z.; Tao, Z.; Wenying, J. Numerical study on effect of leading-edge tubercles. Aircr. Eng. Aerosp. Technol. 2013, 85, 247–257. [Google Scholar] [CrossRef]
- Miklosovic, D.; Murray, M.; Howle, L.; Fish, F. Leading-edge tubercles delay stall on humpback whale (Megaptera novaeangliae) flippers. Phys. Fluids 2004, 16, L39–L42. [Google Scholar] [CrossRef]
- Hansen, K.L.; Rostamzadeh, N.; Kelso, R.M.; Dally, B.B. Evolution of the streamwise vortices generated between leading edge tubercles. J. Fluid Mech. 2016, 788, 730–766. [Google Scholar] [CrossRef]
- Kim, H.; Kim, J.; Choi, H. Flow structure modifications by leading-edge tubercles on a 3D wing. Bioinspir. Biomim. 2018, 13, 066011. [Google Scholar] [CrossRef] [PubMed]
- Cai, C.; Zhou, T.; Liu, S.; Zuo, Z.; Zhang, Y.; Li, Q. Modeling of the compartmentalization effect induced by leading-edge tubercles. Phys. Fluids 2022, 34, 087104. [Google Scholar] [CrossRef]
- Seyhan, M.; Sarioglu, M.; Akansu, Y.E. Influence of leading-edge tubercle with amplitude modulation on NACA 0015 airfoil. AIAA J. 2021, 59, 3965–3978. [Google Scholar] [CrossRef]
- Hansen, K.; Kelso, R.; Doolan, C. Reduction of flow induced tonal noise through leading edge tubercle modifications. In Proceedings of the 16th AIAA/CEAS Aeroacoustics Conference, Stockholm, Sweden, 7–9 June 2010; p. 3700. [Google Scholar]
- Fan, M.; Dong, X.; Li, Z.; Sun, Z.; Feng, L. Numerical and experimental study on flow separation control of airfoils with various leading-edge tubercles. Ocean Eng. 2022, 252, 111046. [Google Scholar] [CrossRef]
- Corsini, A.; Delibra, G.; Sheard, A.G. On the role of leading-edge bumps in the control of stall onset in axial fan blades. J. Fluids Eng. 2013, 135, 081104. [Google Scholar] [CrossRef]
- Chaitanya, P.; Joseph, P.; Narayanan, S.; Vanderwel, C.; Turner, J.; Kim, J.W.; Ganapathisubramani, B. Performance and mechanism of sinusoidal leading edge serrations for the reduction of turbulence–aerofoil interaction noise. J. Fluid Mech. 2017, 818, 435–464. [Google Scholar] [CrossRef]
- Post, M.L.; Decker, R.; Sapell, A.R.; Hart, J.S. Effect of bio-inspired sinusoidal leading-edges on wings. Aerosp. Sci. Technol. 2018, 81, 128–140. [Google Scholar] [CrossRef]
- Miklosovic, D.S.; Murray, M.M.; Howle, L.E. Experimental evaluation of sinusoidal leading edges. J. Aircr. 2007, 44, 1404–1408. [Google Scholar] [CrossRef]
- Chong, T.P.; Vathylakis, A.; McEwen, A.; Kemsley, F.; Muhammad, C.; Siddiqi, S. Aeroacoustic and aerodynamic performances of an aerofoil subjected to sinusoidal leading edges. In Proceedings of the 21st AIAA/CEAS Aeroacoustics Conference, Dallas, TX, USA, 22–26 June 2015; p. 2200. [Google Scholar]
- Guerreiro, J.; Sousa, J. Low-Reynolds-number effects in passive stall control using sinusoidal leading edges. AIAA J. 2012, 50, 461–469. [Google Scholar] [CrossRef]
- Corsini, A.; Delibra, G.; Sheard, A.G. Leading edge bumps in ventilation fans. In Proceedings of the Turbo Expo: Power for Land, Sea, and Air, San Antonio, TX, USA, 3–7 June 2013; Volume 55188, p. V004T10A007. [Google Scholar]
- MinWaterCSP Website. Available online: https://minwatercsp.eu/ (accessed on 30 May 2023).
- Angelini, G.; Bonanni, T.; Corsini, A.; Delibra, G.; Tieghi, L.; Volponi, D. Optimization of an axial fan for air cooled condensers. Energy Procedia 2017, 126, 754–761. [Google Scholar] [CrossRef]
- Tieghi, L.; Delibra, G.; Corsini, A.; Van Der Spuy, J. Numerical investigation of CSP air cooled condenser fan. E3S Web Conf. 2020, 197, 11010. [Google Scholar] [CrossRef]
- Angelini, G.; Bonanni, T.; Corsini, A.; Delibra, G.; Tieghi, L.; Volponi, D. Effects of Fan Inflow Distortions on Heat Exchange in Air-Cooled Condensers: Unsteady Computations With Synthetic Blade Model. In Proceedings of the Turbo Expo: Power for Land, Sea, and Air, Oslo, Norway, 11–15 June 2018; Volume 50985, p. V001T09A010. [Google Scholar]
- Tieghi, L.; Delibra, G.; van der Spuy, J.; Corsini, A. Leading Edge Bumps for Flow Control in Air-Cooled Condensers. Int. J. Turbomach. Propuls. Power 2023, 8, 9. [Google Scholar] [CrossRef]
- Barnabei, V.F.; Castorrini, A.; Corsini, A.; Van der Spuy, J.; Rispoli, F. Unsteady flow simulation of an axial fan for dry cooling in a CSP plant using the variational multiscale method. In Proceedings of the Turbo Expo: Power for Land, Sea, and Air, Virtual, Online, 21–25 September 2020; Volume 84058, p. V001T10A014. [Google Scholar]
- Volponi, D.; Bonanni, T.; Tieghi, L.; Delibra, G.; Corsini, A.; Wilkinson, M.; Van Der Spuy, S.; Von Backström, T.W. CFD simulation results for the MinWaterCSP cooling fan. In Proceedings of the FAN 2018, Darmstadt, Germany, 18–20 April 2018; Available online: https://www.researchgate.net/profile/Sybrand-Van-Der-Spuy/publication/325036834_CFD_SIMULATION_RESULTS_FOR_THE_MINWATERCSP_COOLING_FAN/links/5c1c8feb458515a4c7edd381/CFD-SIMULATION-RESULTS-FOR-THE-MINWATERCSP-COOLING-FAN.pdf (accessed on 15 February 2024).
- Idelchik, I.E. Handbook of Hydraulic Resistance; Begell House: Washington, DC, USA, 1996. [Google Scholar]
- Tieghi, L.; Delibra, G.; van der Spuy, J.; Corsini, A. On the usage of tip appendages for flow control in air-cooled condensers. In Proceedings of the 18th Conference on Modelling Fluid Flow CMFF’22, Budapest, Hungary, 30 August–2 September 2022. [Google Scholar]
- Van der Spuy, S.; Els, D.; Tieghi, L.; Delibra, G.; Corsini, A.; Louw, F.; Zapke, A.; Meyer, C. Preliminary Evaluation of the 24 Ft. Diameter Fan Performance In the MinWaterCSP Large Cooling Systems Test Facility. In Proceedings of the Turbo Expo: Power for Land, Sea, and Air, Virtual, Online, 7–11 June 2021; Volume 84898, p. V001T10A005. [Google Scholar]
Disclaimer/Publisher’s Note: The statements, opinions and data contained in all publications are solely those of the individual author(s) and contributor(s) and not of MDPI and/or the editor(s). MDPI and/or the editor(s) disclaim responsibility for any injury to people or property resulting from any ideas, methods, instructions or products referred to in the content. |
© 2024 by the authors. Licensee MDPI, Basel, Switzerland. This article is an open access article distributed under the terms and conditions of the Creative Commons Attribution (CC BY) license (https://creativecommons.org/licenses/by/4.0/).