Abstract
Transformers are a very important asset in the electrical transmission grid, and they can suffer from destructive events—e.g., rare transformer fires. Unfortunately, destructive events often lead to a lack of data available for investigators during post-event forensics and failure analysis. This fact has motivated our design and implementation of a robotic multi-sensor platform and cloud backend solution for the lifecycle monitoring, inspection, diagnostics, and condition assessment of transformers. The robotic platform collects data from specific viewpoints around the transformer during operation and at specific relevant lifecycle milestones of the transformer (e.g., at the factory acceptance test) in an automated, repetitive, precise, and reliable manner. The acquired data are stored in the cloud backend, which also provides computing resources and data access to relevant in- and off-premises services (e.g., respectively, SCADA systems, and weather reports). In this paper, we present the results of our first measurement campaign to showcase the value of our solution for transformer lifecycle monitoring, for anomaly detection, and as a crucial tool for post-event forensics in the case of destructive events.
1. Introduction
It has been often assumed that transformer failure rates follow a theoretical bathtub curve on the age of the transformer with three life stages: an initial stage with increased failure due to design or installation issues, a stable period with a constant failure rate, and a final stage where reliability decreases as the device ages. However, data gathered by the CIGRE Working Group (WG) A2.37, in their transformer reliability survey [1], showed no clear initial stage of increased failure. This finding was the result of collection and analysis of failure data from three transformer populations, from Europe, New Zealand, and Canada. Followup work by the Cigre WG A2.62 [2] has gathered data on power transformers by means of a voluntary survey from European and North American power utilities and confirmed the lack of on an initial stage of increased failure rates. The WG also fitted Weibull distributions calculating their respective failure rates over time and concluded that both the European and North American transformer failure rate distributions with respect to transformer age are similar. Following to the conclusions of both CIGRE WGs, evidence suggests that there is not an initial period of reduced reliability due to issues related to design, materials, manufacturing, transport, and installation [3].
Transformer fires, short circuits, mechanical faults, and overvoltage events are all destructive events that can occur during operation and cause significant damage to the transformer and its surrounding infrastructure. An examination of data from the survey by the Cigre WG A2.62 [2] on the external consequences of 728 major failures showed that the majority (61.7%) had no external impact. Fires were a consequence of 14% of these major failures, while an identical proportion (14.3%) led to explosions or bursts without any fire. Oil leaks were the sole outcome in 9.3% of the major failures. The surveyed data indicated that the failures were predominantly related to winding, bushings, and tap changers. External short circuits were indicated to be the major contributor or cause of the failures. However, the cause of a substantial part of the failures was unknown or not specified in detail. These international surveys are crucial sources of information. An alternative is transmission asset databases, such as the one from EPRI [4], which includes data on transformers and other components of the power system.
Therefore, in transformer fleet management, it is crucial to properly maintain and monitor the condition of transformers according to their load operation levels to minimize failure rates, extend the lifetime of the transformers, and allow for their timely retirement. The use of continuous monitoring and predictive maintenance is essential to prolong the life of transmission systems and reduce any unexpected outages [3,4,5,6,7,8]. Standard monitoring solutions, such as those presented in [9,10], are integrated into the Supervisory Control and Data Acquisition (SCADA) systems to monitor the Key Performance Indicators (KPIs) of power transformers. The data that can be gathered from a transformer depend on the model. Generally, modern transformers have access to a greater range of information compared to older models [3], like winding hotspot temperature sensors and Dissolved Gas Analyzers (DGAs).
While the effectiveness of standard diagnostics methods and sensors, such as DGA, is evident, we may look beyond for further means of lifecycle and condition monitoring of power transformers and other substation equipment. Certain mechanical abnormalities, or disorders, caused by aging and repetitive faults through, e.g., overvoltages are not identifiable by the data generated by such standard diagnostics methods and sensors. Instead, an interesting approach that requires investigation is the usage of external sensors, to attempt the automatic detection of such mechanical abnormalities. In this context, anomalies identified through visual, acoustic, and thermal sensors, contextualized for the weather and the load and cooling states of the transformer, could indicate the presence of rare anomalies. In-service monitoring of substations is routinely undertaken by skilled technicians, with the purpose of looking for rare anomalies in the substation equipment. Such inspection rotations include visual inspections, thermal imaging, oil testing, partial discharge monitoring, ultra-violet cameras, acoustic emissions, and other survey methods [5]. Regarding transformers themselves, a wide variety of data acquisition and tests, which could be supported by the same sensor modalities, are recommended during and around the first loading after commissioning and near the end of the warranty period [3].
Considering visual, acoustic, and thermal sensors, corrosion and oil leakage can be identified in pictures, the thermal imagery of the transformer and adjacent equipment can be used for hotspot detection, and acoustics can be used to measure vibrations and sound-level emissions from transformers. For instance, researchers have tested the usage of deep learning to create acoustic “voiceprints” of transformers [11], and other equipment [12], to automatically detect abnormalities. The load and output signals of transformers may also be an indicator of faults for electrical equipment. The authors of [13] have trained and harnessed a model—based on the output signal’s S-transform and subsequent image classification—for enhancing and identifying fault features from three electronic circuits.
The motivation of our work concerns the data acquisition by external sensors around the transformer for its lifecycle and condition monitoring and investigating the automatic detection of anomalies through their data. Continuous or repetitive monitoring presents itself as a unique data source to attempt, through anomaly detection, to identify rare transformer abnormalities, which are otherwise not detectable by standard transformer diagnostics methods and sensors.
The presented robotic system prototype, designed in the context of the X-AMINOR project [14], offers minimally invasive transformer monitoring to complement the conventional monitoring techniques. We have designed a robotic multi-sensor platform that incorporates the set of visual, thermal and acoustic sensors described in Section 2. Our system supports the lifecycle and condition monitoring of the transformer by working alongside standard diagnostics methods, enabling repetitive data acquisition. These data are useful for post-event forensics in the case of destructive events and to enable the automatic detection of further anomalies, potentially even rare transformer abnormalities, otherwise undetectable by standard diagnostic methods. Important differences in comparison to similar ongoing projects, such as [15], are the use of (1) a three-dimensional (3D) microphone array to analyze noise patterns and their sources, (2) a Husky Unmanned Ground Vehicle (UGV) robot by Clearpath Robotics; and (3) the implementation of the Light Detection and Ranging (LiDAR) sensor only once—i.e., initially, to create an accurate 3D model of the transformer, which is used later as template for the precise 3D registration of the acquisition viewpoints by means of Red Green Blue–Depth (RGB-D) images. This paper is an extension and followup of our publication [16] and presents the main characteristics of the system (Section 2, Figure 1), its capabilities (Section 3, Section 4, Section 5, Section 6, Section 7 and Section 8), and the results obtained using the system and its monitoring modules (Section 9) during our first measurement campaign, which lasted approximately one month, as well as conclusions and future work (Section 10).

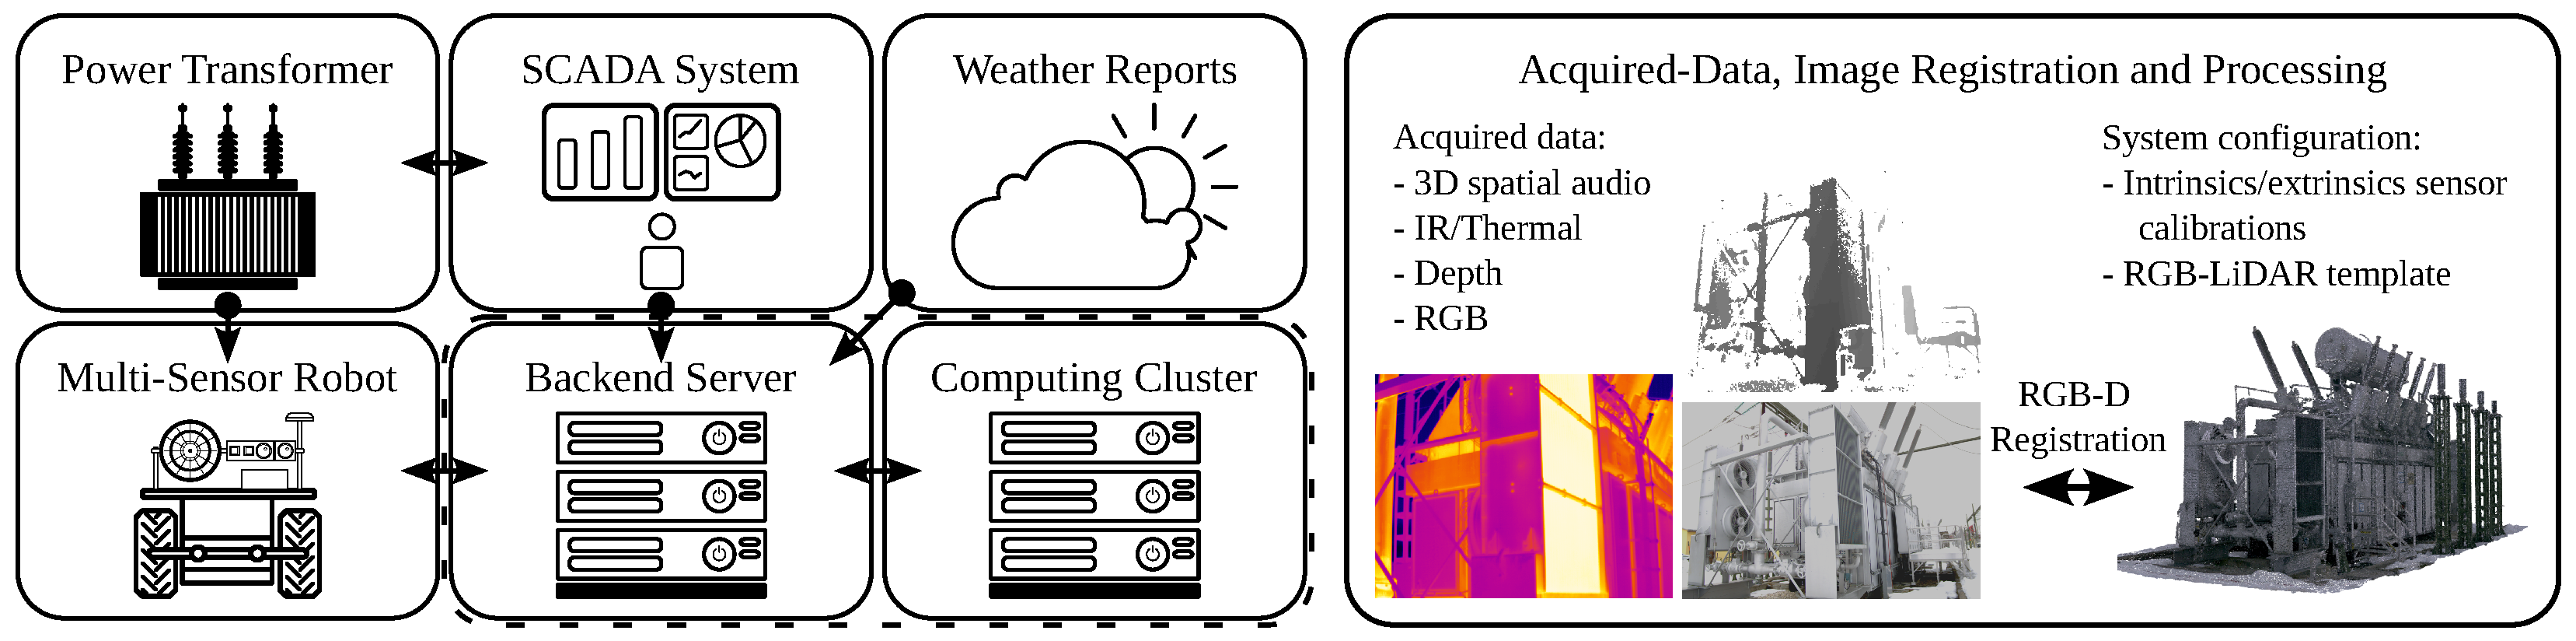
Figure 1.
Proposed robotic multi-sensor platform and cloud backend solution for comprehensive lifecycle monitoring, inspection, and diagnostics of transformers. On the left, the data-acquisition information-flow diagram demonstrates the planned connection and interaction among various components. The custom-built multi-sensor platform, which includes a high-resolution RGB camera, a Time of Flight (ToF) depth camera, a thermal camera, and a 3D microphone array, serves as the primary data source (Figure 2). This sensor setup acquires data from the power transformer itself by means of the UGV, which is agreggated to data from the SCADA system and weather reports. The data from the multi-sensor platform are collected and registered in 3D, the position of each sensor is localized, as shown on the right, by means of RGB-D registration. The backend server acts as the central hub for data storage and analysis, while real-time weather reports enhance the system’s understanding of external conditions. A computing cluster ensures efficient data processing and analysis, enabling decision-making for transformer maintenance and performance optimization.
2. Proposed System
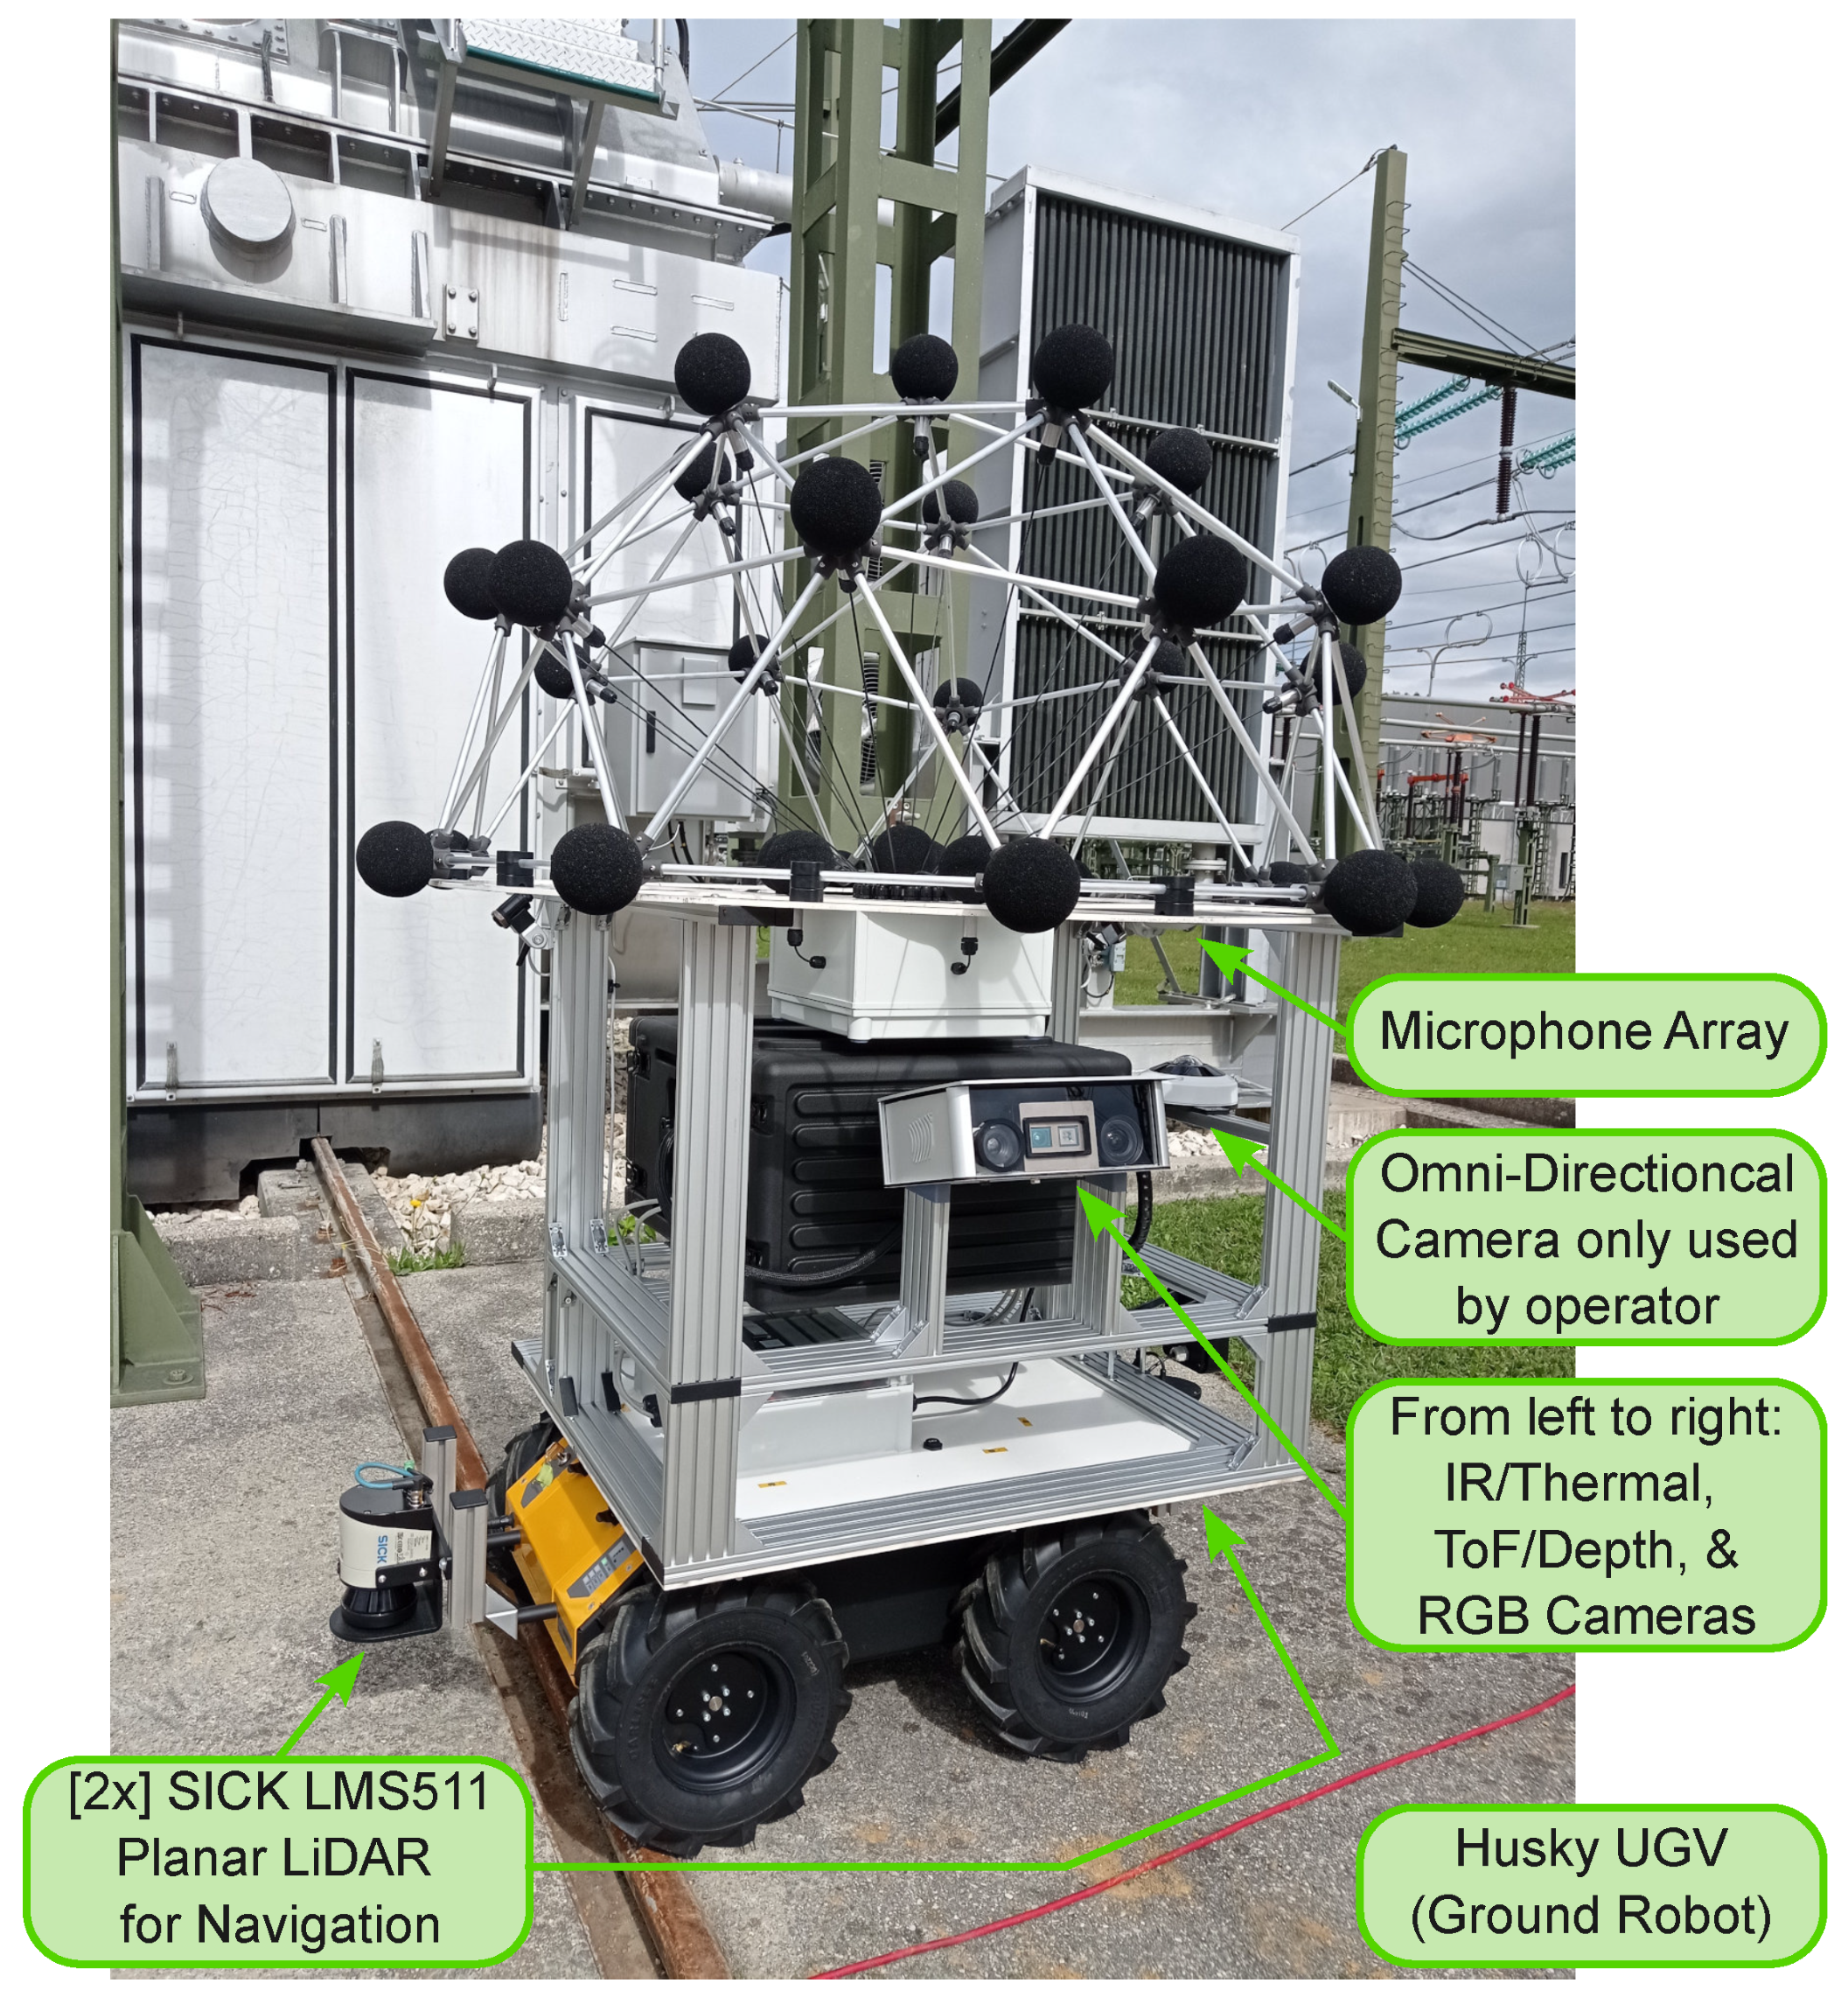
Monitoring Robot and Sensor Equipment: a Husky UGV, by Clearpath Robotics, was selected as a basis for the robot. Our custom-built multi-sensor platform for transformer inspection (Figure 2) includes a high-resolution RGB-camera (16.1 MP), a Time of Flight (ToF) depth-camera (640 × 480 px), a thermal camera (640 × 480 px) and a 3D microphone array (achieving a spatial resolution of 0.1 m). For the inspection, assuming a 5 m distance to the transformer, the cameras achieved sampling distances of (RGB) 1.6 mm/px, (ToF/Depth) 10.3 mm/px and (InfraRed (IR)/Thermal) 4.6 mm/px. The choice of sensors is based on the common targets of onsite transformer inspections [6] (visible abnormalities, such as oil spills, cracks, and bulging, and the occurrence of unusual sounds) and the correlation of transformer failures to certain weather conditions [8] (especially, lightning and the highest temperature reached). Sensor data are stored in the backend, after each inspection, using standard formats. For instance, point cloud data are stored using the industry standard for LiDaR data, that is, compressed LAS-file, with the file-extension “.laz”.

Figure 2.
The figure presents the prototype system that was developed as an outcome of our research. The Husky UGV from Clearpath Robotics is equipped with the custom-built multi-sensor platform, which includes a high-resolution RGB camera, a Time of Flight (ToF) depth camera, a thermal camera, and a 3D microphone array, which serves as the primary data source. The names of each sensor are displayed in green boxes, and arrows refer to each sensor’s specific placement on the platform.
Backend Server: The backend cloud platform is built using Docker containers. The goal was a data-ingestion point suitable for a robot operating with a mobile internet connection. The robot sends mainly time-series data from various sensors but also binary data such as images and audio recordings. To fulfill these requirements, the Mongo database (MongoDB) was chosen for its support for time series collections, as well as its support for larger files using MongoDB’s Grid File System (GridFS).
For a secure transmission from the robot to the backend, the Message Queuing Telemetry Transport (MQTT) protocol is used. An MQTT broker within a DeMilitarized Zone (DMZ) is deployed. This follows the recommendation from the National Institute of Standards and Technology (NIST) Cybersecurity Framework [17] and allows the robot only to send data but not to access any of the backend services and data.
Apache Kafka is used Tttdistribute data to various services in the backend. Messages from the robot pass through the MQTT broker in the DMZ to Kafka, which then distributes the data to MongoDB for persistent storage. With Kafka, the system is modular, and future services like automatic model retraining can be supplied with new data.
During development, the focus shifted from time series data to binary data. To accommodate this change, MinIO serves as an alternative data storage. Using MinIO’s S3 Application Programming Interface (API) implementation precise policy restriction allows for a secure system without a DMZ. MinIO offers a simple web interface for download, including file versioning and data governance.
With this change, the communication protocol changed from MQTT to Hypertext Transfer Protocol Secure (HTTPS), which is better suited for large file transmission, while MQTT is limited to 260 MB [18]. If necessary, thanks to Apache Kafka, it is possible to implement the file transmission using MQTT by modifying an existing sink for MinIO.
To enable a simpler workflow, the system includes a JupyterHub installation, which allows for working with the data, without the need to download them locally and the ability to use a Graphics Processing Unit (GPU) cluster. User management is implemented via Keycloak, which also provides MinIO and JupyterHub with Single Sign-On (SSO).
To improve the backend, the possibility of incorporating Voxel51’s FiftyOne to manage image datasets collaboratively is being explored. This would include data labeling and querying, helping the optimization of the workflow, and ensure accuracy. The implementation of Machine Learning Operations (MLOps) practices is planned, specifically data lineage tracking, to help quickly identify and resolve any issues that arise during the ML model training process.
3. Point Cloud Registration and Camera Pose Estimation
Unlike many visual and audio analysis tasks in industrial environments—where the sensor position and lighting conditions are known and fixed—inspecting a transformer with a mobile robot in an electrical substation presents more challenges. The sensor’s position relative to the object being analyzed is probabilistic. The lighting conditions vary with time, weather, and seasons. The object’s appearance also changes due to environmental factors such as shadows, rain, and snow. As a result, data preprocessing and sensor fusion are necessary to counterbalance the raw data quality’s limitations.
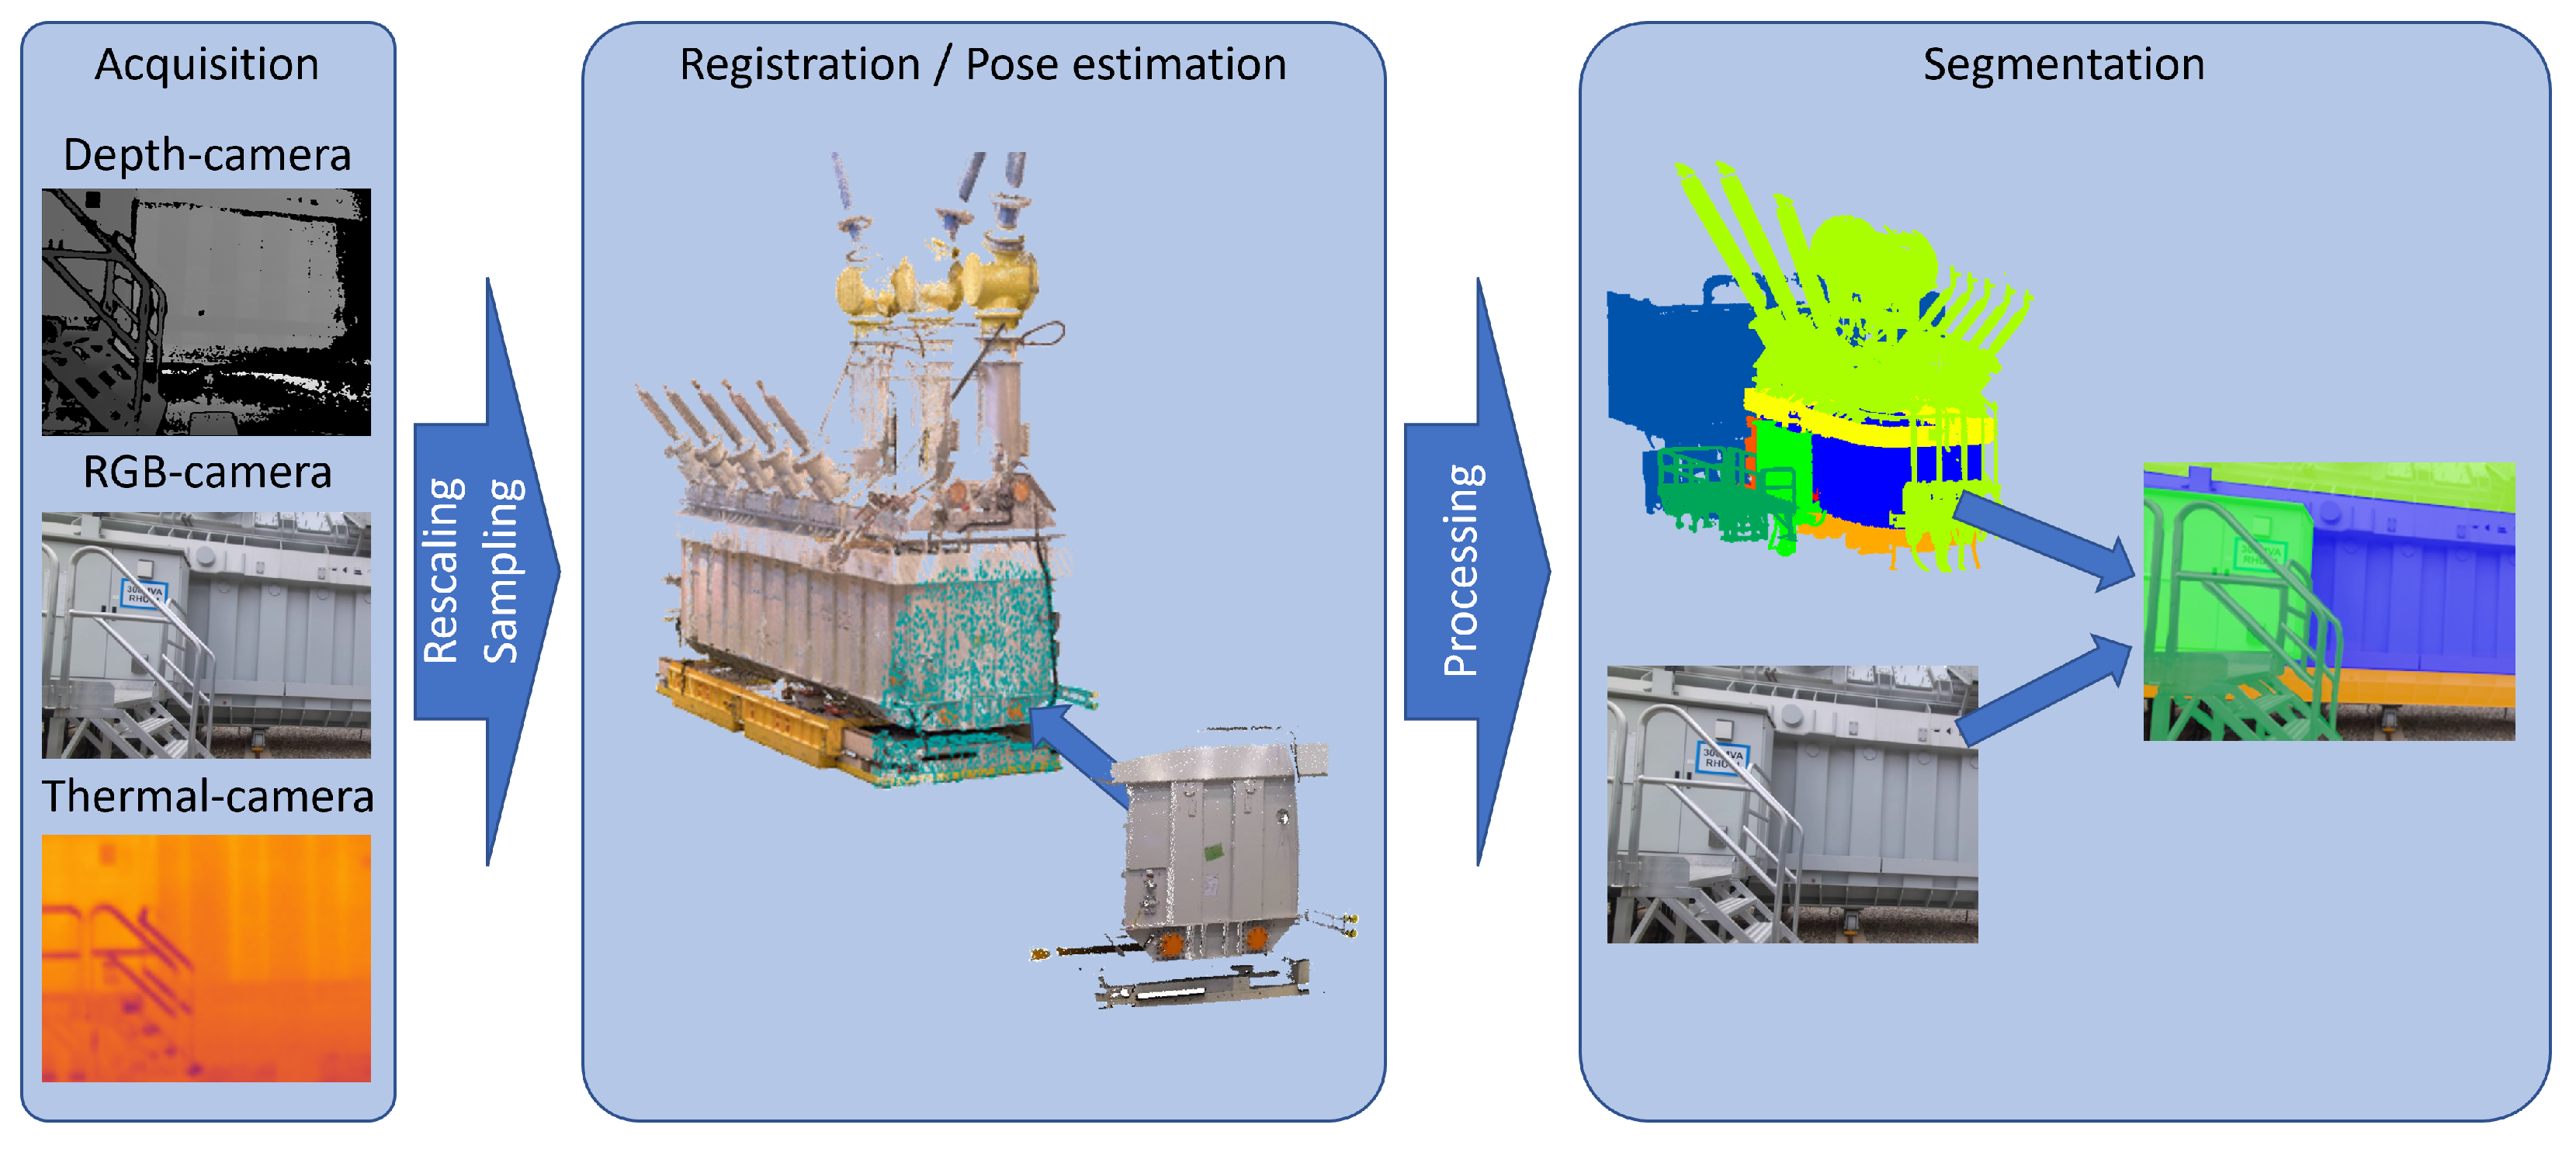
Additionally, some modules depend on fused information. For example, the meter reading module uses the 3D positions of the meters on the 2D image to correctly apply detectors to the image area, distinguish between various meters, and adjust for the viewing angle on the meter. Audio analysis requires environmental information in the form of a transformer point cloud relative to the microphone array’s position during audio capture. The positions of sound sources in different frequency ranges are calculated by applying audio beamforming on this point cloud. Moreover, thermal information is mapped onto the point cloud and compared to reference values to determine if any parts of the transformer exceed specific temperature limits. By mapping the 3D positions of certain transformer parts (e.g., distribution cabinet, heat exchanger, rooftop, etc.) onto the two-dimensional (2D) image, the images can be segmented, as shown in Figure 3. This allows for the application of different modules only on relevant areas.
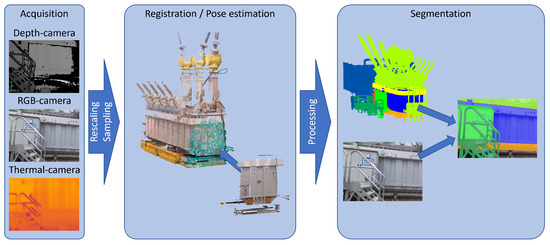
Figure 3.
First part of visual analysis pipeline: data acquisition, point cloud registration and image segmentation.
Finally, detections and findings can be consolidated using 3D information. Audio and image findings from the acquisitions can be linked to 3D positions on the transformer and compared with analyses from different acquisition positions or times. If findings are detected from multiple positions and on various dates, the likelihood of them being true positives increases. These findings can then be consolidated and marked as confirmed, as shown in Figure 4. If the findings cannot be verified from different positions or on different dates, they may have been false positives caused by environmental factors and can be dismissed. Findings can also be filtered by their location. This enables distinguishing between findings located on the transformer and those on peripheral equipment. Thus, false positives, such as corrosion located on a nearby metal fence, can be discarded based on location information.
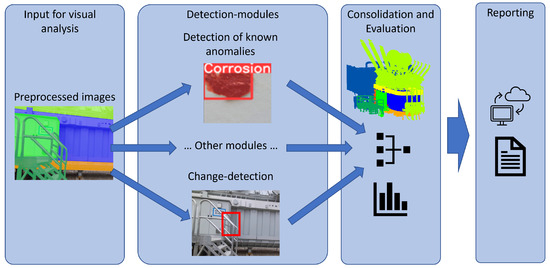
Figure 4.
Second part of the visual analysis pipeline: detection modules analyzing the preprocessed images, consolidation and evaluation of detections in 3D, and reporting.
Challenges of point cloud registration and pose estimation: One of the primary challenges for the registration was the self-similarity of some parts of the transformer (e.g., the two short sides of the transformer with cooling towers look nearly identical), the small and asymmetrical overlap of the reference to the acquired acquisition point clouds, and cross-source data acquisition. The point clouds captured by the sensor system only cover approximately 5–10% of the reference point cloud’s area, yet they are almost entirely contained within the reference point cloud. Since the transformer has large self-similar areas along the long side and similar mirrored areas on the opposing cooling towers, the acquired point cloud has multiple matching features from different parts of the transformer, resulting in mediocre registration results with standard registration approaches.
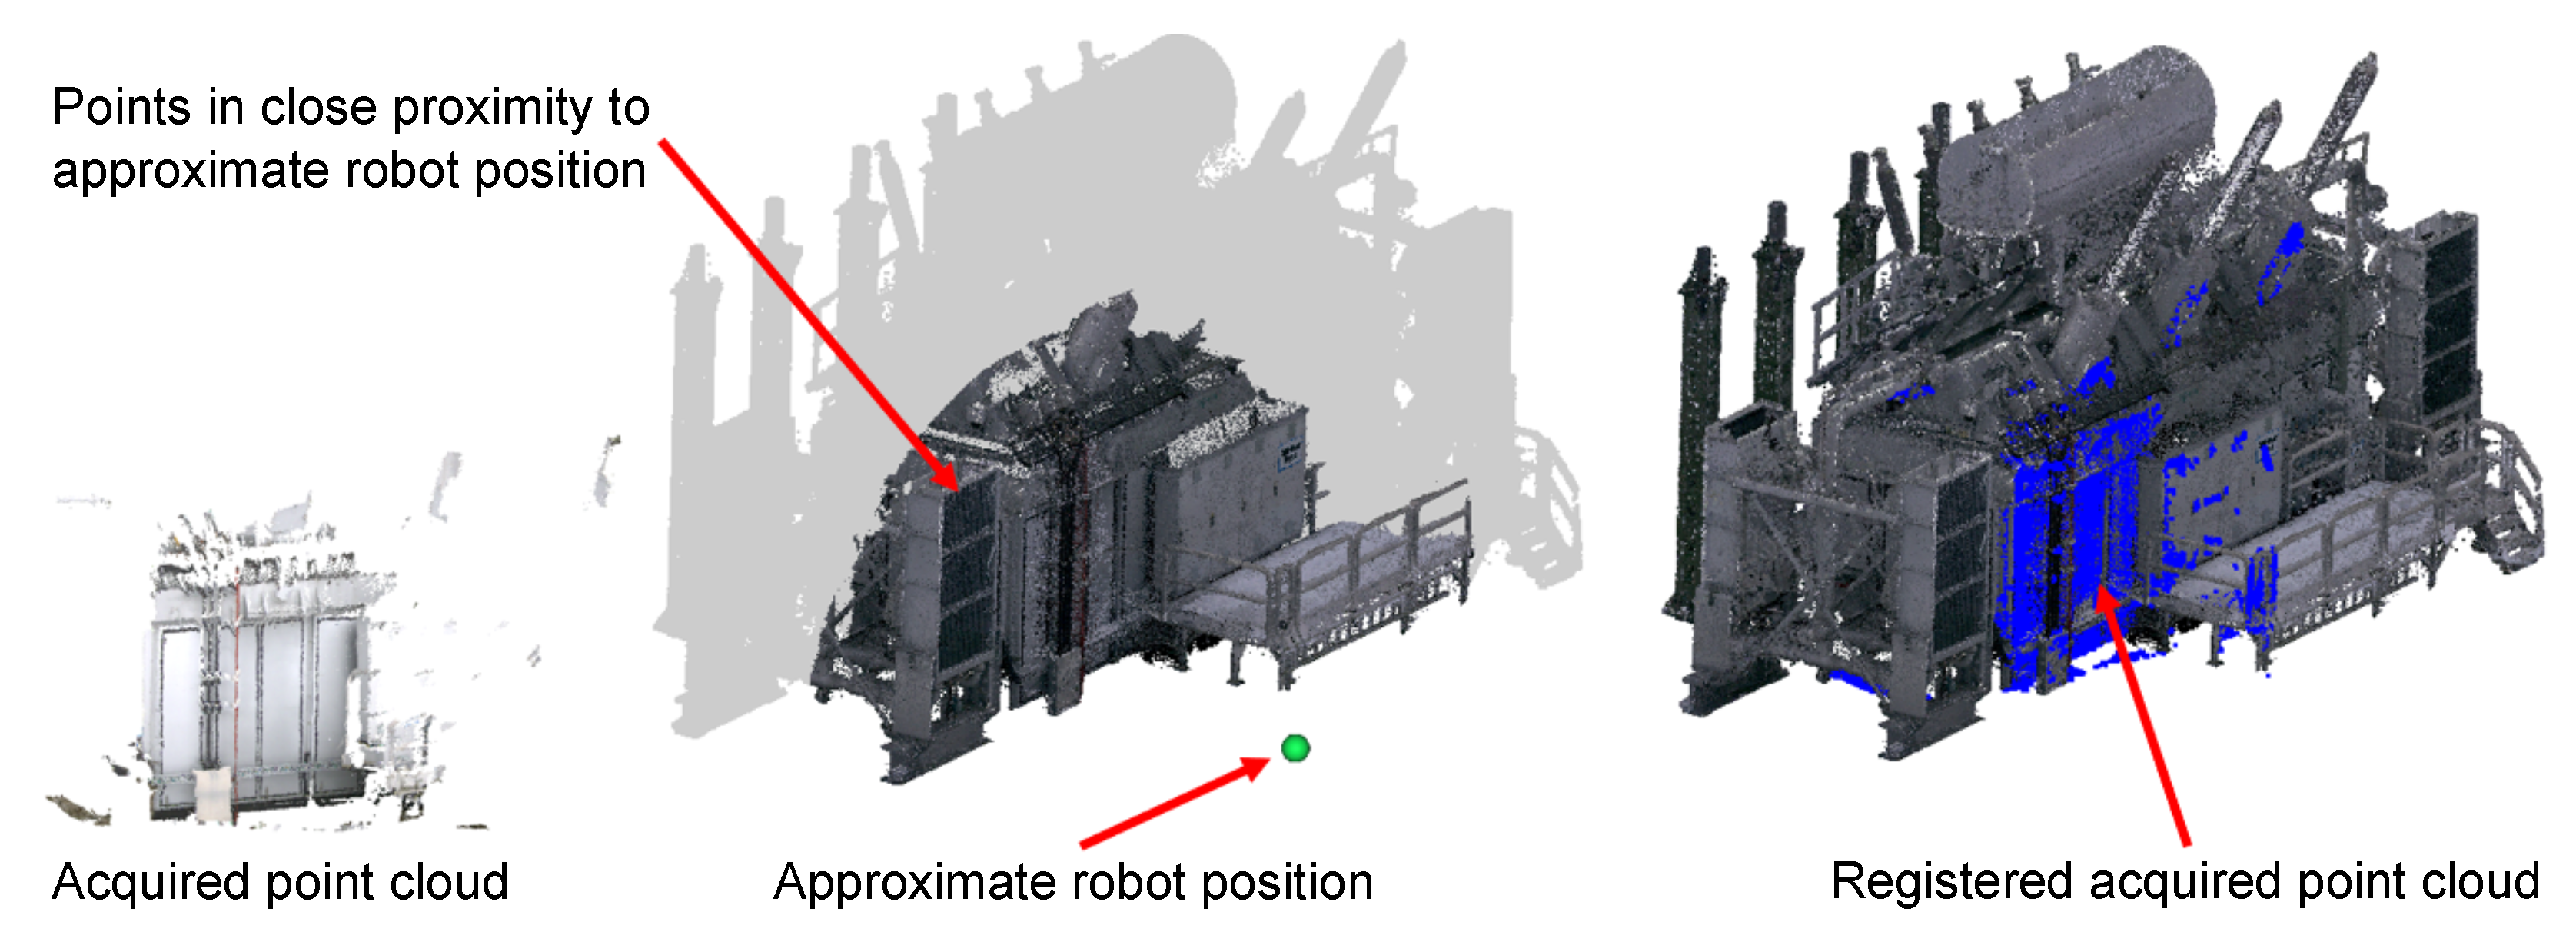
This challenge was tackled by utilizing prior knowledge of the coarse pose from the robot navigation software. Although this pose is not accurate enough for the tasks mentioned above and only provides the location on a 2-dimensional map, it can be used to spatially filter the reference features of the transformer. Therefore, only features in the robot’s close proximity are used for the registration, as shown in Figure 5.

Figure 5.
Utilization of approximate robot position for better performance in point cloud registration. Only features within a specified range to the approximate robot position are used for point cloud registration.
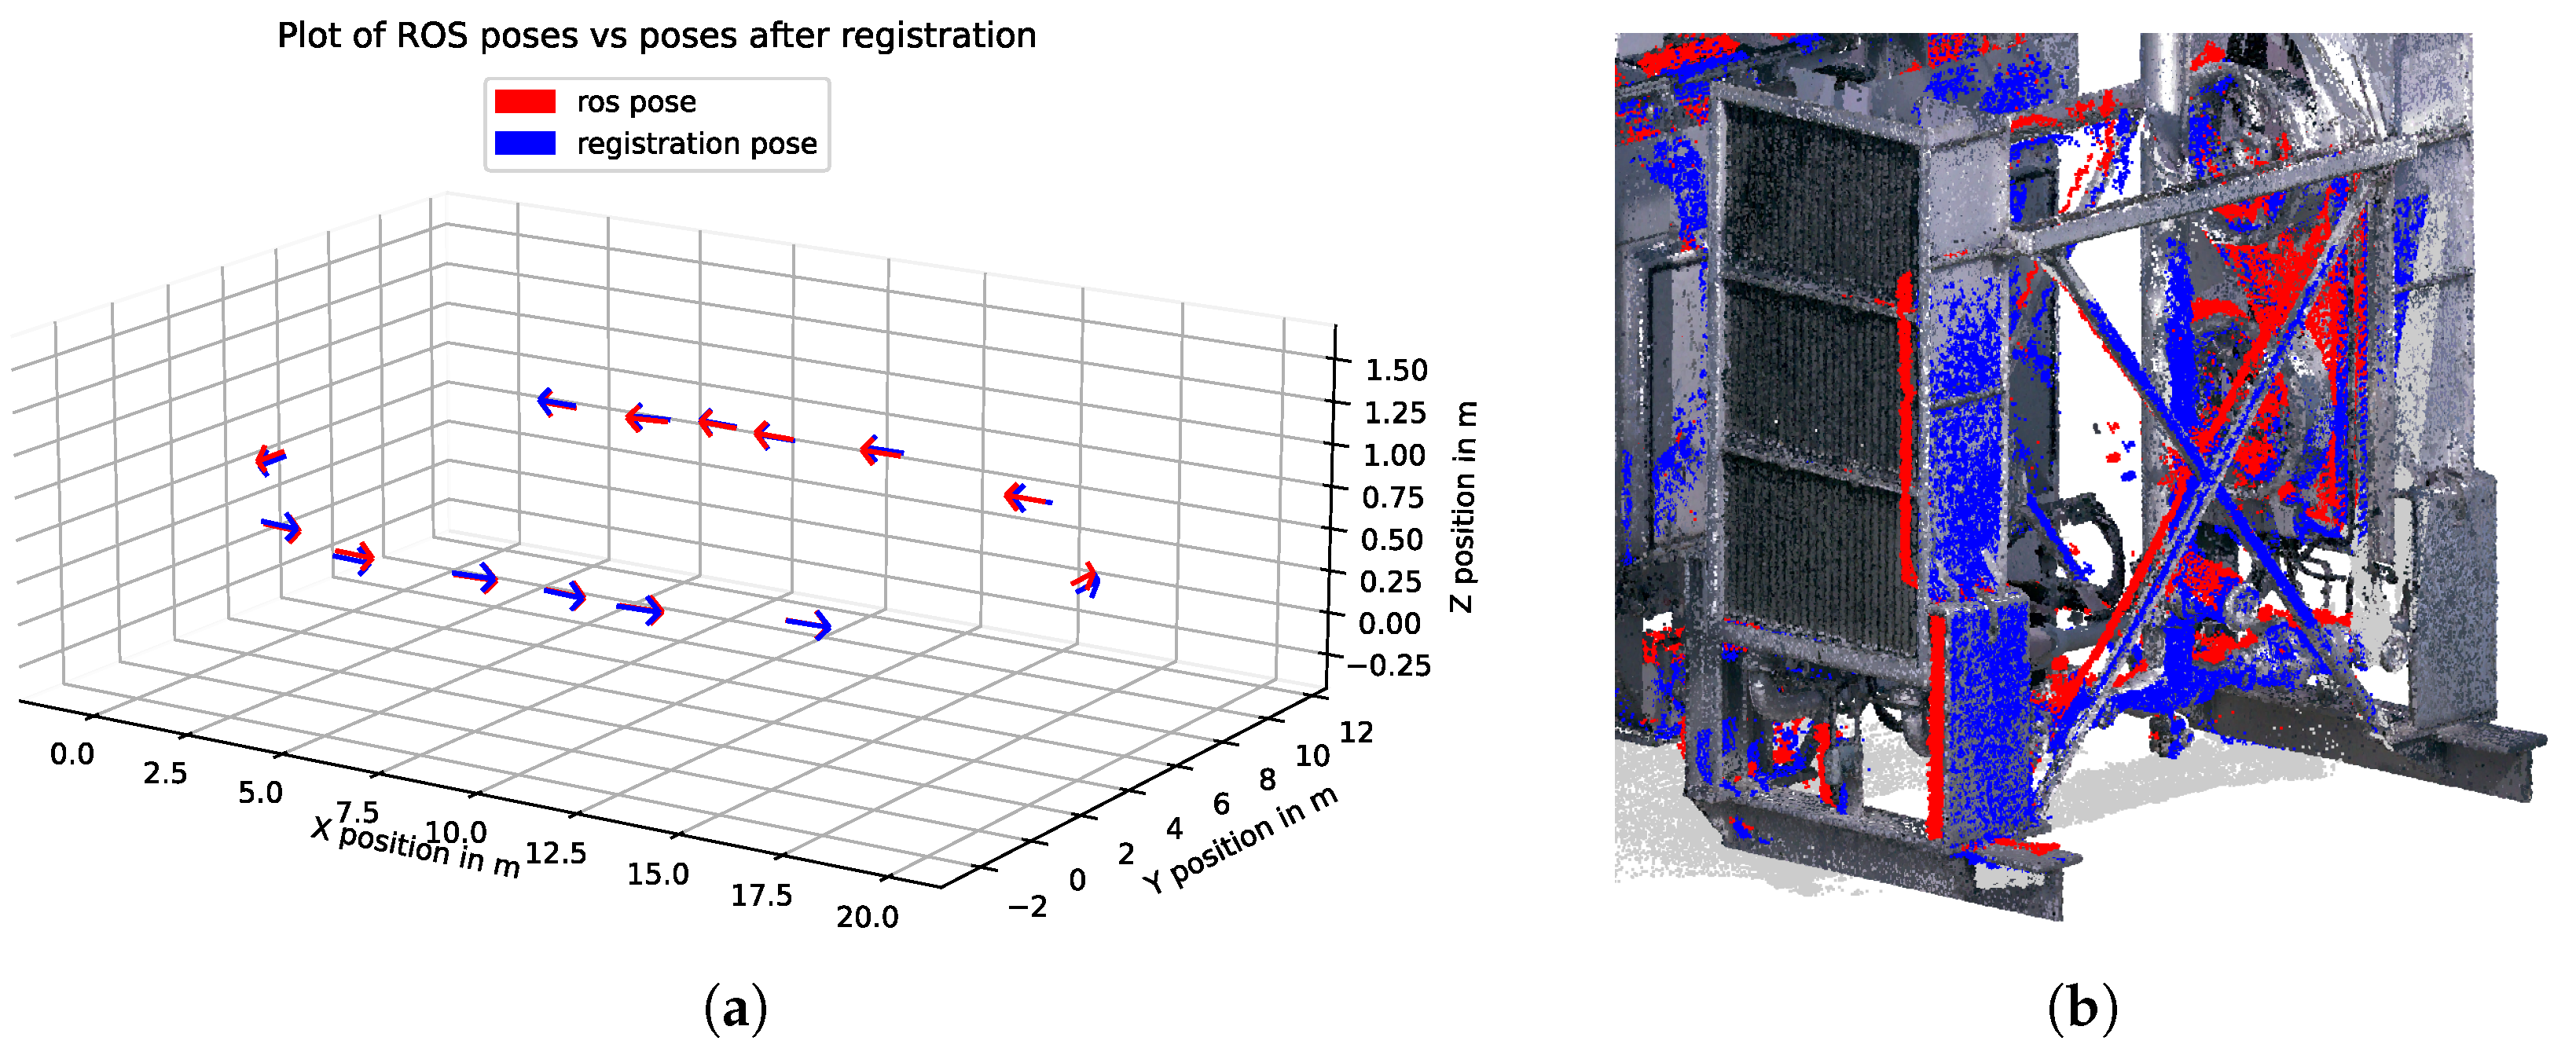
To leverage the 2D robot poses on the map for improved registration, the position of the camera system relative to the robot coordinate system is determined, yielding a transformation matrix of the coordinate systems. This transformation matrix is then applied to all relative robot poses and used for the coarse alignment of the point clouds for registration. Figure 6a illustrates a comparison between transformed Robot Operating System (ROS) poses and poses calculated using the registration pipeline. The differences between the arrows, which represent the x-direction of the poses, demonstrate that the probabilistic robot pose is sufficient for selecting the points for registration, but not precise enough for point cloud registration. Figure 6b displays the alignment of the acquired point cloud on the reference point cloud using the transformed ROS pose (in red) and the accurately aligned point cloud using the registration pipeline (in blue). The disparities are particularly noticeable at the edge of the heat exchanger and the pipes at the image center. The calculated misalignment of this specific point cloud, using the transformed robot pose, amounts to 20.8 cm.
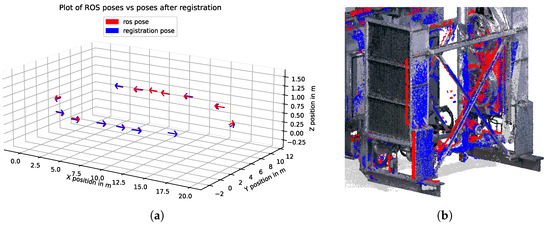
Figure 6.
Comparison of ROS poses (red) and registration poses (blue). (a) Plot of position and x-axis orientation of transformed ROS poses and poses from the registration pipeline. (b) Registered point clouds on reference point cloud.
The performance of point cloud registration on cross-source data, specifically data captured with different sensors, presents a significant challenge [19]. The reference point cloud, referred to in this paper as the RGB-LiDAR reference model of the transformer, is obtained using a 360° LiDAR. In contrast, the sensor system mounted on the robot generates point cloud data using a Time-of-Flight (ToF) depth camera. The use of 360° LiDAR for the reference enables the creation of a dense point cloud, without the typical layer structure associated with usual LiDAR scanners, thus eliminating one of the major hurdles in cross-sourced point cloud registration. The primary differences remaining between the LiDAR and ToF point clouds are their point densities and viewpoints. The reference point cloud, captured from multiple viewpoints, is continuous, while the robot-generated point clouds only display unoccluded areas. The variance in point densities was addressed using voxel-based subsampling, equalizing the point density of both point clouds. The challenges coming from differing viewpoints and occlusions were addressed using a robust, outlier-resistant pose-estimation algorithm.
Reference data preparation: In a preliminary step, a reference point cloud of the transformer was constructed. Over 180 million individual points were captured using a Leica BLK360 LiDAR scanner from 45 different scanning locations to generate a comprehensive point cloud representation of the transformer, free of occlusions and viewable from all angles. The individual point clouds were merged using point cloud registration. Noise and undesired objects were eliminated, and the point cloud was subsampled using a voxel-based method to account for the disparity in point densities resulting from the fusion of the individual scans. As a last step in the creation of the RGB-LiDAR reference model of the transformer, the point cloud was segmented into different parts of the transformer for image segmentation, and a different segmentation was applied with defined temperature limits for specific areas.
Point Cloud Registration and Pose-Estimation Procedure: A depth image is captured with the ToF depth-camera and converted to a point cloud. This point cloud frame is subsequently matched to the reference point cloud of the transformer through the following stages:
- The point cloud is subsampled with voxel-based subsampling;
- A CNN-feature-extractor [20] is used to extract low-level geometric features.
- The extracted geometric features are matched with precomputed geometric features of the transformer reference point cloud. This is carried out by searching for k-nearest neighbors on the reference-feature k-dimensional tree (k-d tree). The k-d tree is constructed from the reference features, and k nearest neighbors are queried based on the features from the captured point cloud.
- A robust outlier-resistant pose-estimation algorithm [21] is used to estimate the camera’s pose in relation to the transformer, leveraging the matched features.
Results of Point Cloud Registration on a Test Dataset: The performance of the registration and pose estimation was assessed using a dataset created from actual transformer data. The reference point represents the real reference used during the missions. The sensor data that were gathered were captured using the actual sensor assembly. A total of 58 acquisitions from varying positions around the transformer were tested. The registration’s performance was evaluated on the deployed computer system, which is an NVIDIA JETSON AGX Xavier Developer Kit. Therefore, the registration times reported were measured on the robot’s onboard computer.
The evaluation was based on the following criteria:
- The count of successfully matched point clouds (a point cloud was considered successfully matched if the translation error was less than 0.5 m and the rotational error was under 10°);
- The mean translation and rotational error of the successful matches;
- The mean computation time required for registration and pose estimation.
To evaluate the performance, the following parameters were altered:
- The voxel size used for subsampling both the reference and acquired point clouds;
- The quantity of features extracted from the reference and acquired point clouds;
- The number of nearest neighbors considered for feature matching, including mutual nearest neighbors;
- The use of robot pose for spatial filtering of reference features during the matching process.
The results showed significant improvements across all tested parameter variations when the approximate robot pose was utilized. Without the use of the approximate robot position, only a maximum of 54 out of the 58 acquired point clouds could be successfully registered to the reference. When only features near the approximate robot position were used, the matched frame count increased to 57 out of 58 acquired point clouds. Further improvements were observed with an increased number of nearest neighbors, peaking at two nearest neighbors. The mean translational error for the best parameter set was 6 cm, and the mean rotational error was , as shown in Table 1. These results are considered sufficient for the tasks mentioned above. The registration time of less than a second enables data preprocessing on the robot during the mission.

Table 1.
Point Cloud Registration and Pose-Estimation Results for Different Parameters.
Initial results of the consolidation of detections and findings: Detections are consolidated using 2D and 3D information. Only images from the recent inspection rounds are considered, e.g., the last 10 days. Candidates for 2D detection are first converted to 3D locations on the RGB-LiDAR reference model. When five or more candidates are accumulated in the same spot, and the estimated 3D candidate location is visible in 10 or more inspection images, the voting mechanism is triggered. The consolidation relies on positive and negative votes. If the anomaly in question is detected in an image or measurement, it is tallied as a positive vote, and if no detection is achieved and the patch is visible according the RGB-LiDAR reference model, it is considered a negative vote. The presence of a given anomaly is confirmed based on a minimum positive vote threshold that 50% or more of the votes need to be positive. The prototype voting mechanism for the consolidation of detections has not yet been evaluated on an extensive dataset. Only initial results obtained for the corrosion-detection module are presented. In Figure 7, two instances of the voting mechanism are shown, where the presence of visual anomalies was determined successfully.
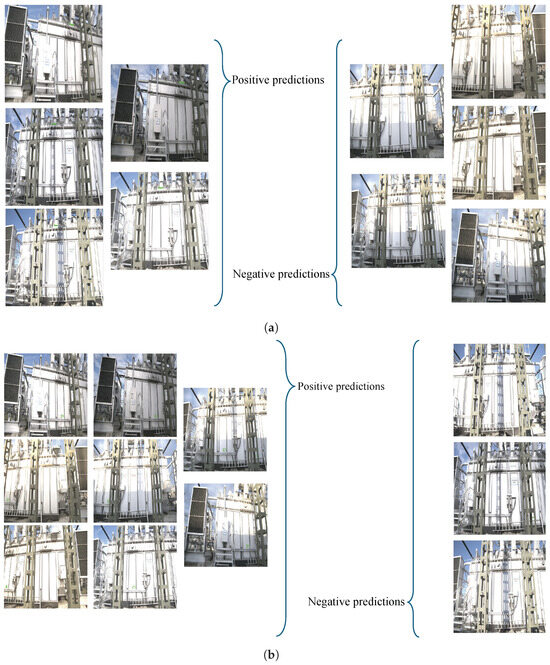
Figure 7.
Two instances of the prototype voting mechanism for the consolidation of detections. (a) A flagged anomaly (rust), highlighted in green, is consistently identified in 5 out of 10 images, which meets the 50% threshold for validation. (b) A flagged anomaly (scratch), highlighted in green, is consistently identified in 8 out of 11 images, surpassing the predetermined 50% threshold for validation. Instances of incorrect predictions or overly bright images hindered accurate anomaly detection in some cases, highlighting the challenges associated with anomaly identification.
4. Power Transformer Thermal Analysis
Thermal analysis plays a critical role in assessing the operational health of power transformers by monitoring temperature distribution. It helps identify hotspots, abnormal heating patterns, and potential insulation degradation, enabling proactive maintenance interventions to prevent catastrophic failures and extend the transformer’s lifespan. In the state of the art, several models have been implemented to estimate the temperature rise and predict potential hotspots such as the one in [22], where a magneto–fluid–thermal coupling model was deployed and cross-verified against the experimental results from their infrared thermography method. Another study presented by the authors in [23] describes a thermal network model associated with electromagnetic loss relying on the thermoelectric analogy method. The temperature distribution results from the thermal network model were compared against those from computational fluid dynamics and experimental infrared imaging camera measurements.
In our robot prototype system, the acquired thermal is mapped to the RGB LiDAR reference model of the transformer. Using the spatially calibrated thermal and depth cameras, the thermal values captured by the IR camera are mapped onto the transformer point cloud. This is demonstrated in Figure 8, which showcases the mapping of the thermal image onto the point cloud. Figure 8a depicts the image of the thermal camera of a portion of the transformer including the heat exchanger. Figure 8b then shows the corresponding 3D points, colored according to the thermal data.
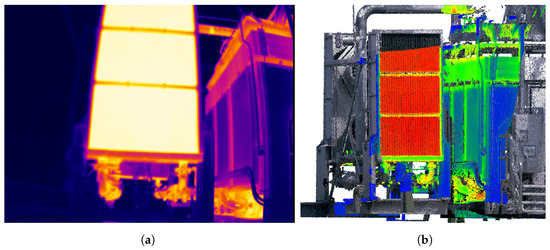
Figure 8.
Mapping of thermal image values onto transformer point cloud using thermal camera intrinsic and extrinsic calibration. (a) Image acquired with the thermal camera. (b) Registered point clouds with thermal values displayed.
This process is repeated for each robot position, resulting in a comprehensive point cloud representation of the entire transformer, as shown in Figure 9. The observed thermal values are compared with predefined limits, set in consultation with transformer experts, to identify any violation of the thermal limits on specific transformer components. Further, temperature gradients are calculated to identify hotspots on certain parts of the transformer, where a large, local temperature gradient is not expected.
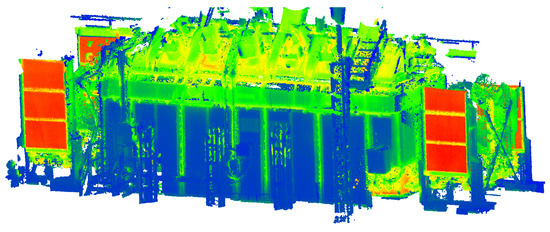
Figure 9.
Combination of values from fourteen thermal images mapped onto the whole transformer point cloud.
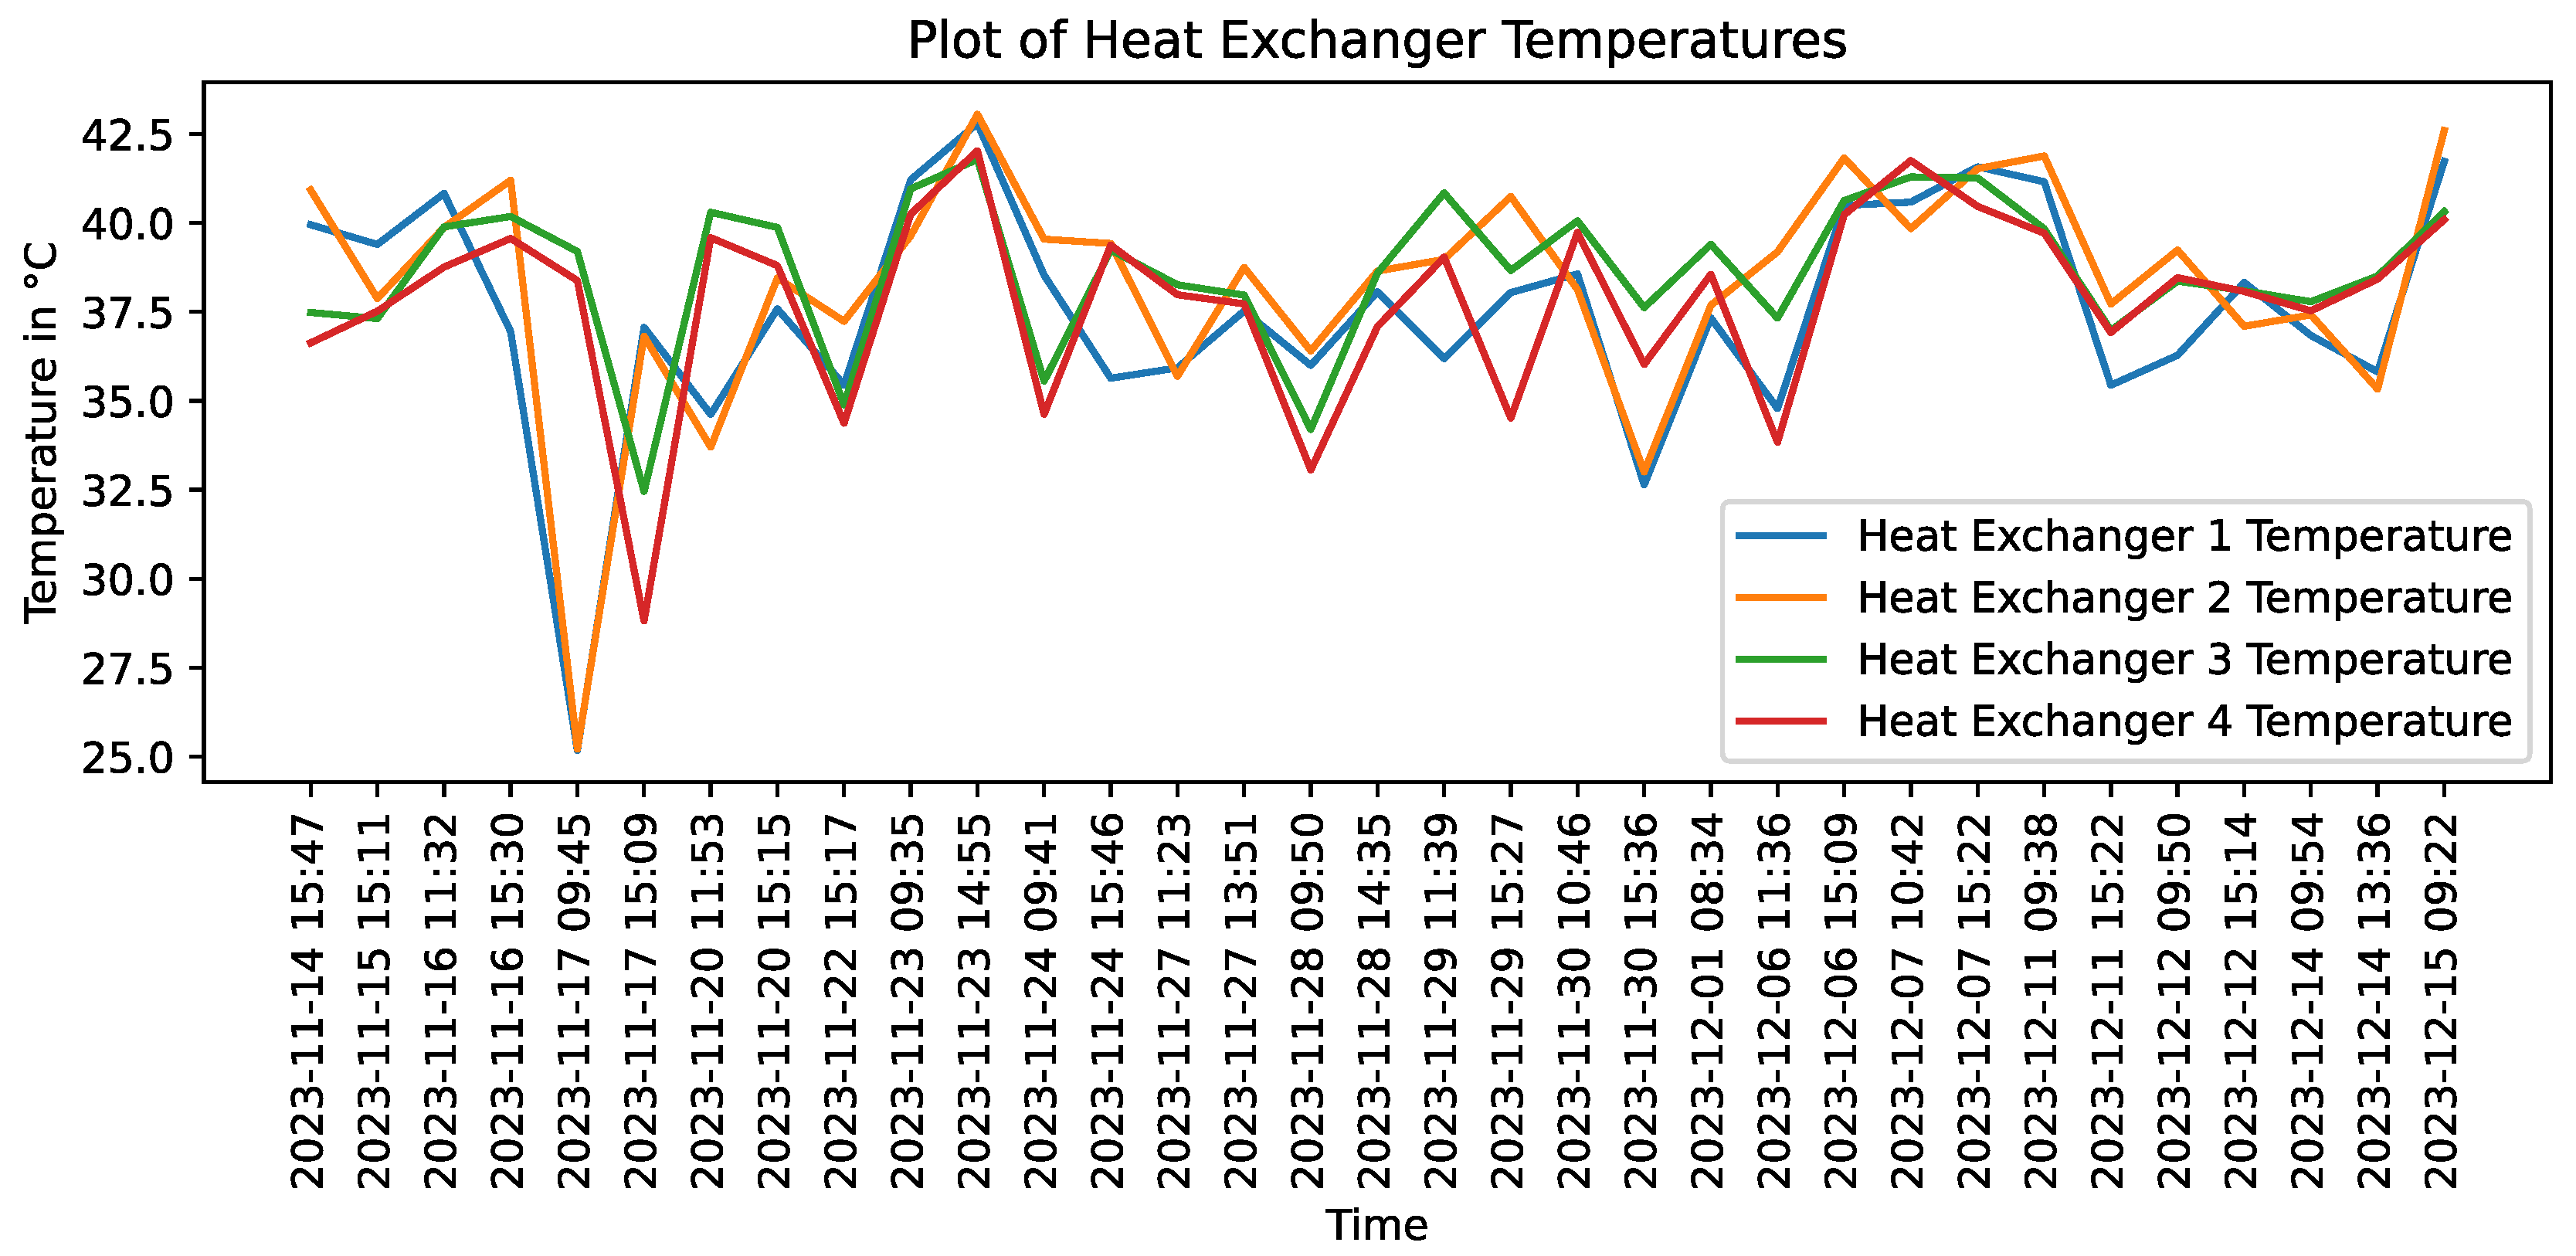
In addition, it is possible to make relative comparisons. For example, the temperatures of the four heat exchangers can be evaluated against each other to detect any differences, which could be caused, e.g., by a malfunctioning fan or oil pump. Figure 10 presents the temperature readings from the center panes of the four heat exchangers situated at the transformer corners. There are noticeable temperature variances between some of the heat exchangers, most noticeably on 17 November. The manufacturer has confirmed that these differences are a result of varying cooling strategies. These strategies involve the activation and deactivation of certain fans and oil pumps, contingent on the temperature of the transformer oil.
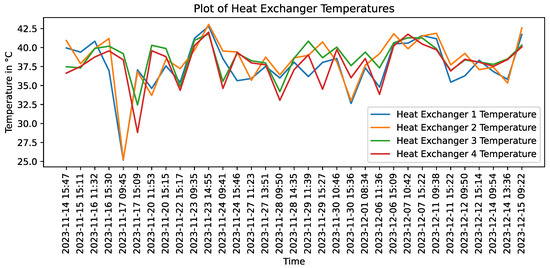
Figure 10.
Temperature over time for the four heat exchangers of the transformer.
5. Visual Diagnostics of Analog Measurement Devices
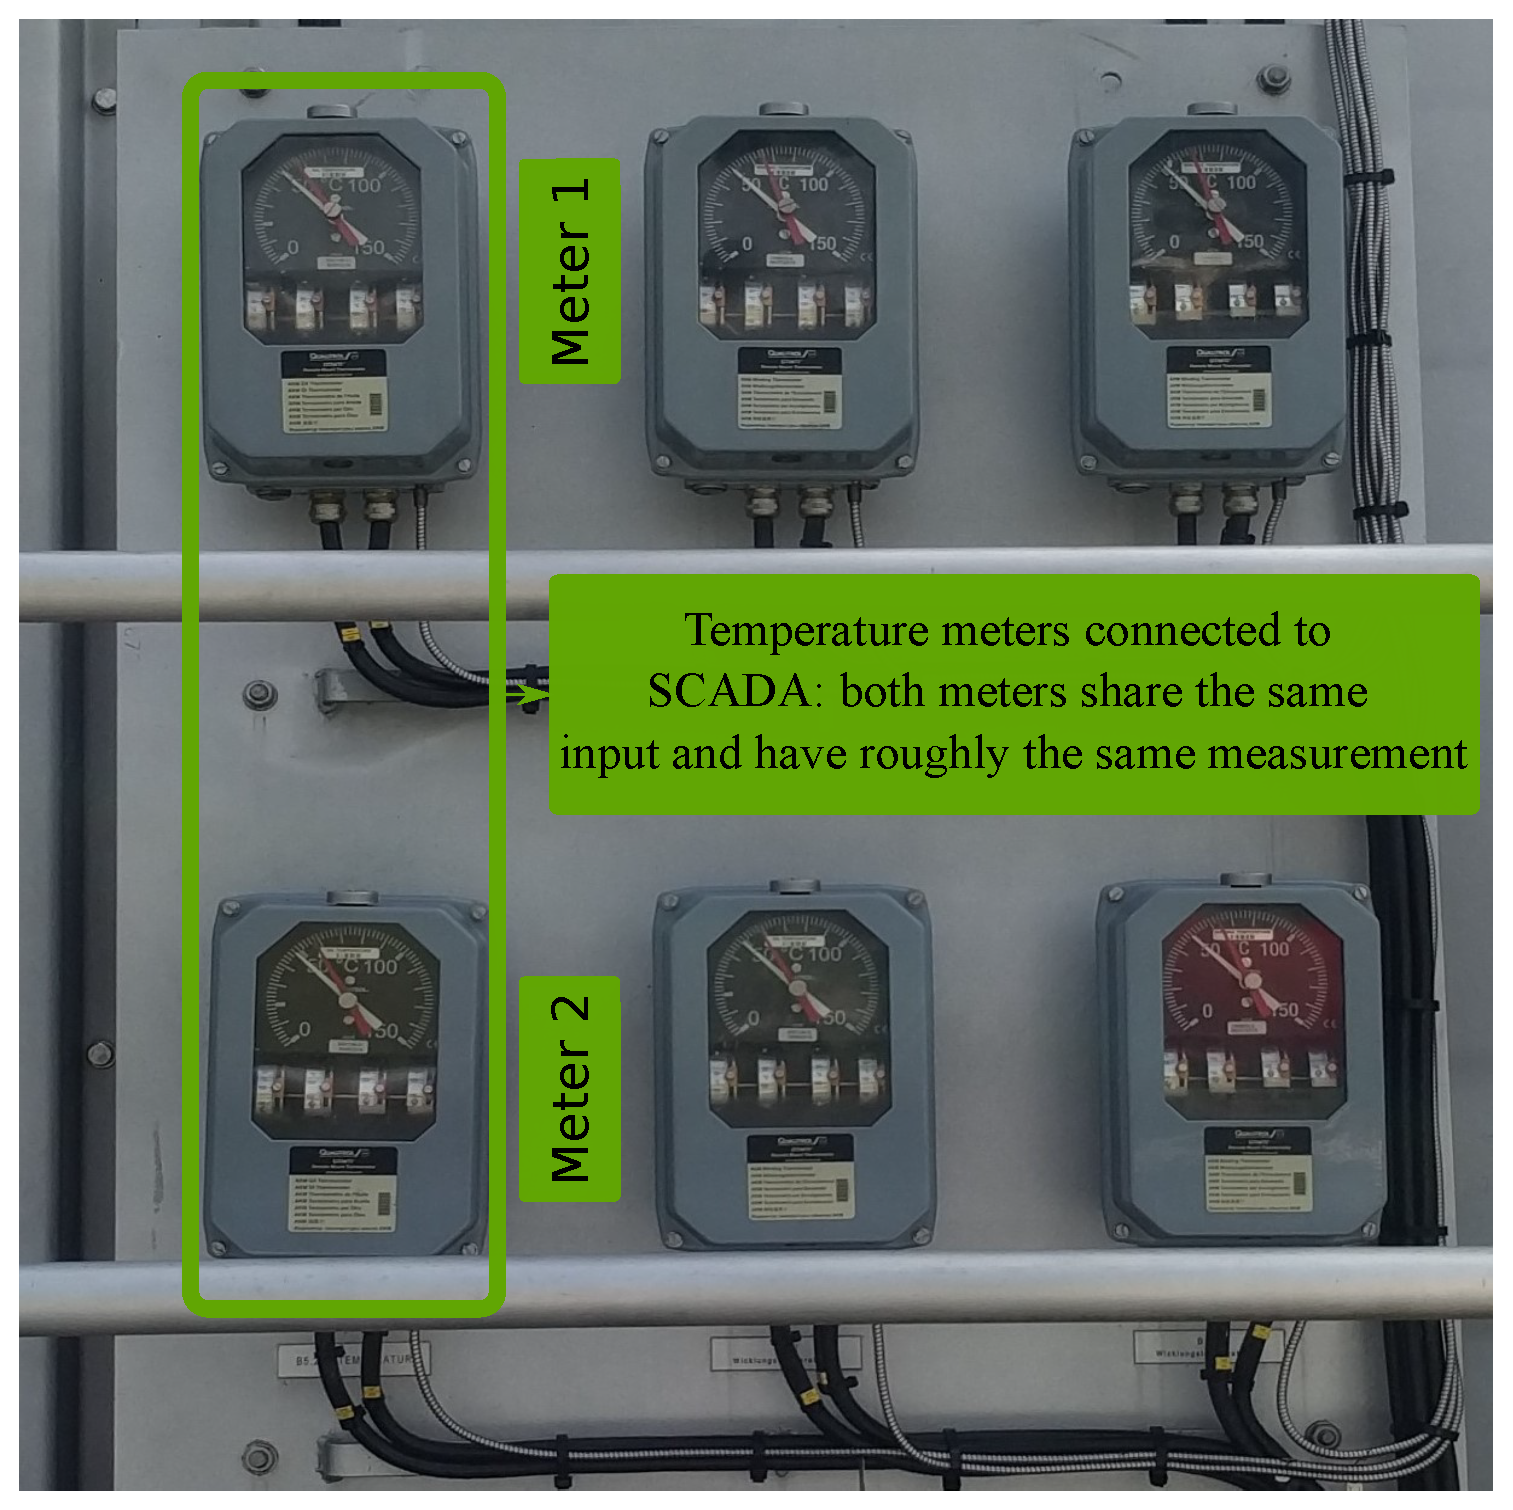
Transformer windings are typically submerged in an insulating oil whose temperature along with that of the windings is indicative of the transformer’s overall load and health status [24,25,26]. Temperature meters can display inconsistent measurements, e.g., showcasing a maximum temperature lower than the current one. The inspectors are tasked with the visual inspection of the meters as often not all meters are connected to the transformer monitoring system. For instance, out of the six meters on our substation test transformer, only two are connected to the SCADA, as seen in Figure 11. We aim to read the measurements of both the SCADA-enabled and disconnected temperature meters. The presented visual diagnostics of analog devices have been developed with two main intents in mind: (1) providing new capabilities toward the automatic visual inspection of the transformer and (2) the retrofitting of old equipment so that it can be digitized without changing the existing hardware.
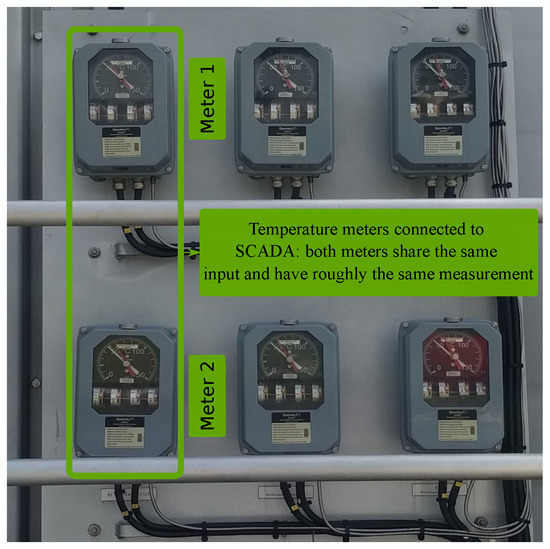
Figure 11.
Meters connected to the SCADA: both meters measure roughly the same point at all times.
Equipment and steel walkways surrounding the transformer could obstruct near views of the meters. For this reason, the acquired images include the meters in small regions, resulting in low-resolution tilted images of the meters. Our research question is therefore reading the analog meters from said low-resolution imagery.
Similarly to those used by H. Jiale et al., methods such as Hough circles and lines have been used in the past to achieve automatic vision-based meter reading [27,28]. Tests conducted using this approach showed promising potential for the high-resolution images acquired at the test site, but showcased insufficient precision and a high failure rate for low-resolution imagery. The state-of-the-art research works by X. Wu et al., Y. Fang et al., and L. Zuo et al. [29,30,31] implemented deep learning Mask Region-Based Convolutional Neural Network (Mask R-CNN) for the preprocessing of the needle masks and showcased impressive precision results on high-resolution images while addressing the weaknesses of the Hough transform—e.g., when it comes to tilt, blur, and noise. These approaches require at least moderate amounts of training data and require high computing capabilities. In the retrieved state-of-the-art literature, there is no previous research work addressing low-resolution imagery of analog meters.
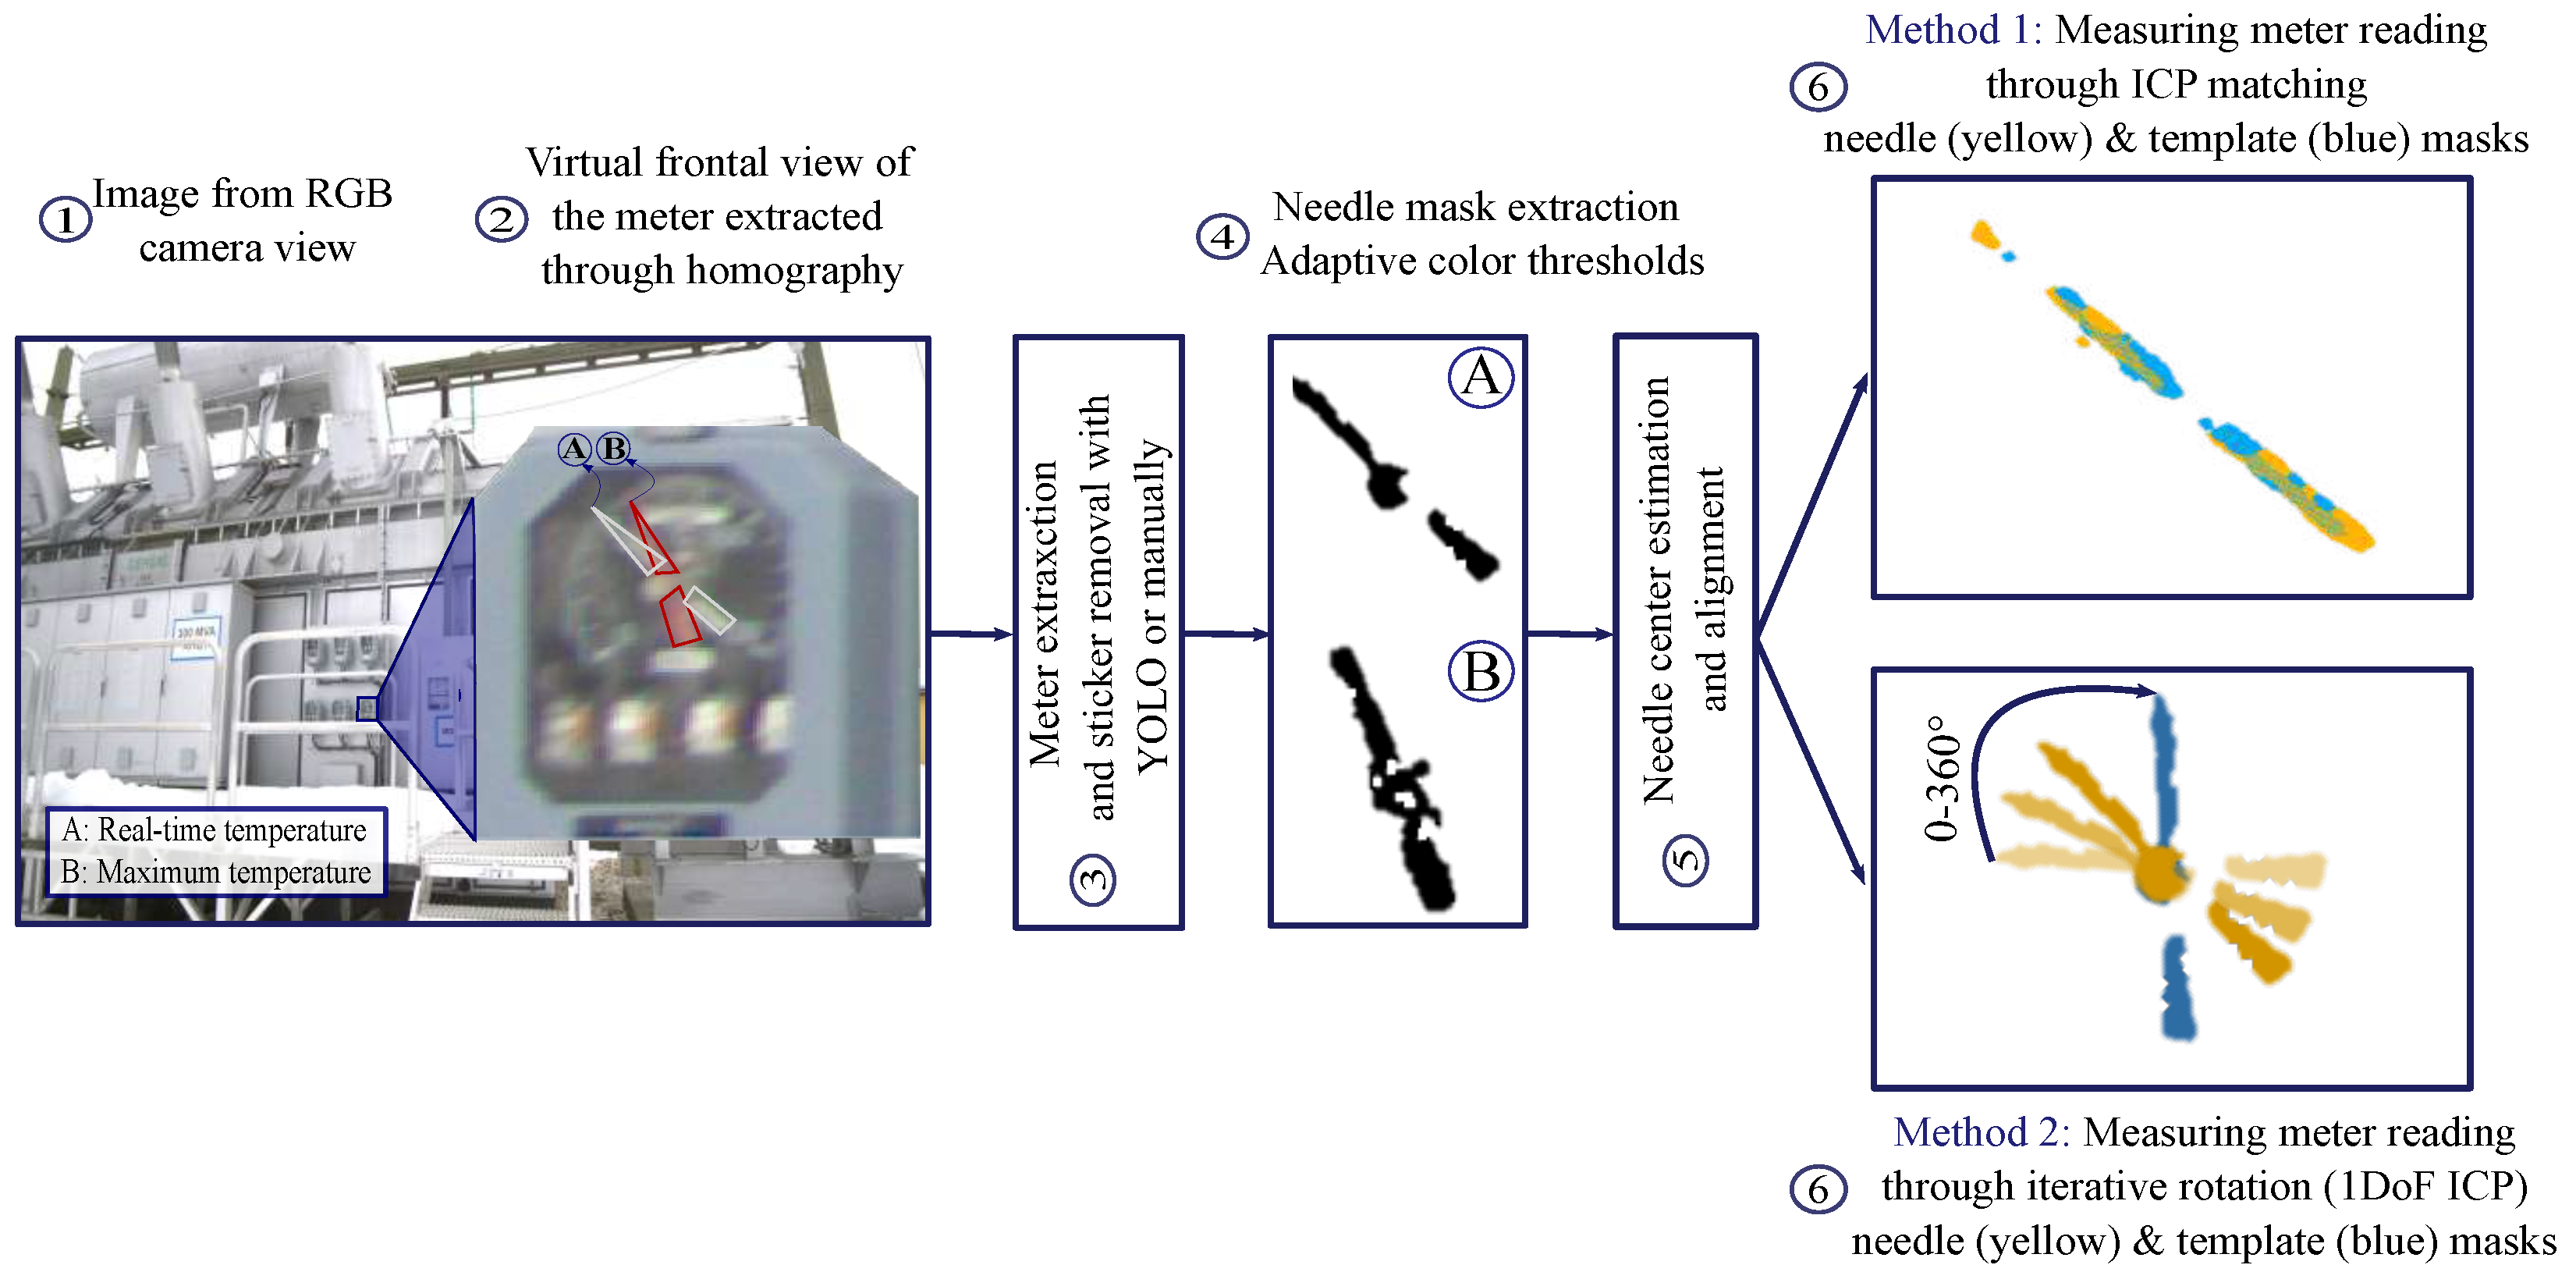
In this work, the Vision-Based Analog Meter Reading pipeline (VBAMR-Pipeline), shown in Figure 12, is introduced to accurately measure the meter readings while simultaneously tackling the conditions of low resolution and tilt from acquired images of the power transformer (Figure 12, step 1).

Figure 12.
Vision-Based Analog Meter Reading pipeline (VBAMR-Pipeline) steps: homography, meter display segmentation and cleaning, needle mask extraction, needle center identification, and measurement of meter reading through ICP matching.
VBAMR-Pipeline, step 2, homography: The coordinate system of the previously created RGB-LiDAR reference model is used to tackle the tilt and bias of the camera position. From the reference model, the position of the meters is known. This allows one to create virtual camera locations, from which the view of the meters is standardized, i.e., untilted frontal views of the meters at a known distance, which approximately fixes their location and size in the virtual images. Since there are 6 meters on the transformer, six different virtual image views are thus generated from each image by means of a homography image-to-image mapping (Figure 12, step 2).
VBAMR-Pipeline, step 3, meter segmentation and cleaning: A meter contains a diverse range of elements, typically including a display, pointer needles, a scale, an outer shell, and other miscellaneous elements. While all these elements are captured in the RGB image we wish to process, only the needles are necessary to gauge the temperature measurements. As these elements will impact the extraction of needle masks in the upcoming steps, due to their color profiles overlapping with those of the needles, we opted for the segmentation of only the meter displays, which include the temperature needles and the scale. This is followed by the removal of all extraneous objects left on the segmented meter display (Figure 12, step 3). For this step, all the necessary detection tasks are performed by means of a fine-tuned You Only Look Once (YOLO) model [32] trained on 87 meters images.
VBAMR-Pipeline, step 4, needle mask extraction: Many elements in meters, including the ones in field transformers, can be identified by their colors and average pixel counts. Through the means of data exploration, an investigation of the color profiles of relevant elements of the meters and estimated adaptive Hue, Saturation, Value (HSV) and “RGB” thresholds was conducted for their segmentation. To achieve an adaptive segmentation of the needles, color thresholding is applied along with an automatic modification of the color value ranges. To guide the adaptive color thresholding, an iterative comparison of the number of segmented pixels with the expected average pixel count of the element is conducted to achieve the segmentation of the needles. Even in low resolution imagery, this enables background removal and the extraction and identification of the temperature needles (Figure 12, step 4).
VBAMR-Pipeline, step 5, needle center identification: Due to small errors in the pose estimation, the positions of the needles and their centers of rotation across the obtained homography images are not uniform. This non-uniformity hinders the performance of the angle-estimating algorithms used later. Therefore, the needle center of rotation is estimated automatically using either the “SAM” method or the “RECT” method, and then it is used to initialize the algorithms in the subsequent step of the pipeline.
- “SAM” method: Thanks to the homography operation, in the virtual frontal view of the meter, the size (or area) of the analog meters in square pixels, as well as the needle rotation centers with respect to the bounding box of the analog meter, remains relatively constant across samples. We therefore used the Segment Anything Model (SAM), a deep learning method by Kirillov et al. [33], to obtain a segmentation mask of various meter elements. Then, we automatically identified the mask of the meter itself based on its number of square pixels, i.e., its area in the homography image. We calculated the needle center of rotation from the bounding box using a pre-calibrated offset.
- “RECT” method: Upon identifying the mask of a given needle (VBAMR-Pipeline, step 3), we determined its corresponding bounding box. The center of the bounding box provides a rough estimation of the position of the needle’s center of rotation.
VBAMR-Pipeline, step 6, measurement of meter reading: Since the segmented needle masks are noisy, upon the retrieval of the needle masks and their centers of rotation, the following alternatives to measure their indicated readings by means of angle-estimating algorithms were tested:
- Iterative Closest Point (ICP) [34,35,36]: An algorithm for the alignment of the needle mask with a pre-defined template, whose orientation is known (Figure 12, step 6.1), is used. The ICP principle relies on the iterative matching of corresponding points and the calculation of rigid transformation until a convergence criterion is met. The resulting rigid transformation matrix provides the rotation angle between needle mask and template;
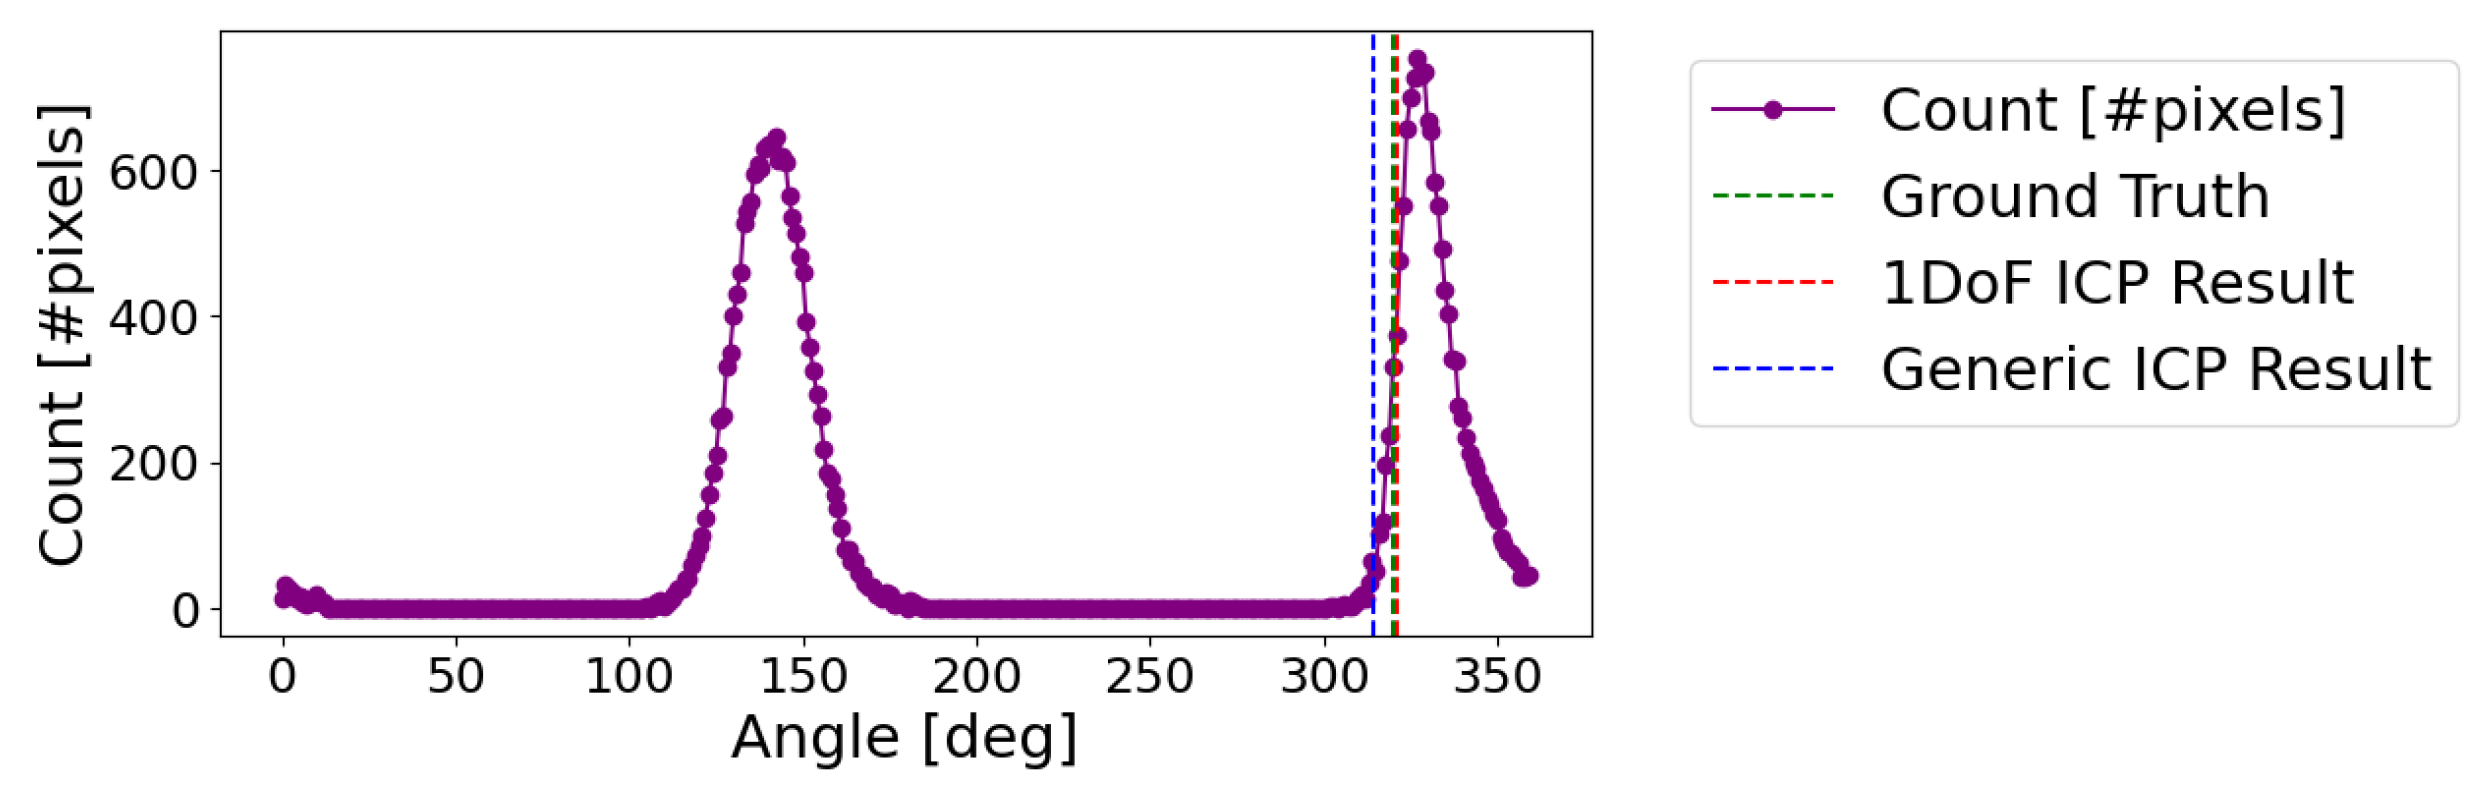
- One-Degree-of-Freedom ICP (1DoF ICP): A more problem-specific approach relying purely on the brute force search for the best needle rotation fitting the acquired image has been implemented. This will be referred to as iterative rotations or 1DoF ICP. A needle mask is rotated around the estimated meter center to test every possible position of the needle, where an evaluation metric estimates the quality of the match with a needle template (Figure 12, step 6.2). The algorithm and its metrics evaluate the matching quality by considering the needle’s shape, size, and color distribution. As an example, each iteration of the rotation angle is showcased against the count of overlapping pixels in Figure 13, where the locations of the peaks indicate candidate rotations of the needle. Usually, this results in two candidate rotations, corresponding to opposite positions of the needle. The best candidate is selected by assessing the direction of the needle and a search window is afterward defined around it. Inside this search window, the rotation with the farthest tip of the needle from the center of the meter can be found and identified as the needle angle.
 Figure 13. Number of pixels matching the needle template per rotation angle. The results of both tested algorithms are shown. For the 1DoF ICP, the right peak is automatically selected as best candidate. The search for the best needle rotation in a search window around the right peak results in an estimate very close to the ground-truth.
The estimated angles are utilized for measuring the reading values of the real-time and maximum-temperature needles.
VBAMR-Pipeline, results: Results based on 132 samples of each needle (current and maximum temperature), acquired during the first measurement campaign of the robot, are presented in Table 2 and Table 3. In order to evaluate the performance of our algorithm, we retrieved the angular ground-truth manually from the virtual front view meter images or homography meter images. For this purpose, OpenCV was used to estimate the needle angles based on a few clicked points on the image. The tables summarize the performance of our approach for each center identification method, “SAM” and “RECT”, and angle-measuring algorithm, “generic ICP” and “1DoF ICP”. The Mean Absolute Error (MAE) is used as the accuracy metric for the needle angle, in degrees (°), and its corresponding temperature, in degrees Celsius (°C). The meter’s temperature reading values range from 0 to 150 °C.
Table 2.
Performance Metrics of the Vision-based Analog Meter Reading: “SAM” Approach.
Table 3.
Performance Metrics of the Vision-based Analog Meter Reading: “RECT” Approach.
Some outliers affect the accuracy disproportionately. For this reason, results are provided for overall and inlier samples. The overall samples contain all meters (132 in total), and the inlier samples contain those with less error than from the ground truth, with being the standard deviation of the corresponding method. Therefore, we define a vision-based meter reading to be successful when its error is below .
The lower error displayed by white needle measurements is rooted in cleaner masks obtained via the adaptive-threshold step of the algorithm (Figure 5, step 4). White needles can be filtered out using the green primary color, while red is extracted using the hue. The hue range of the red needle overlaps with that of other elements of the meter, leading to rougher masks.
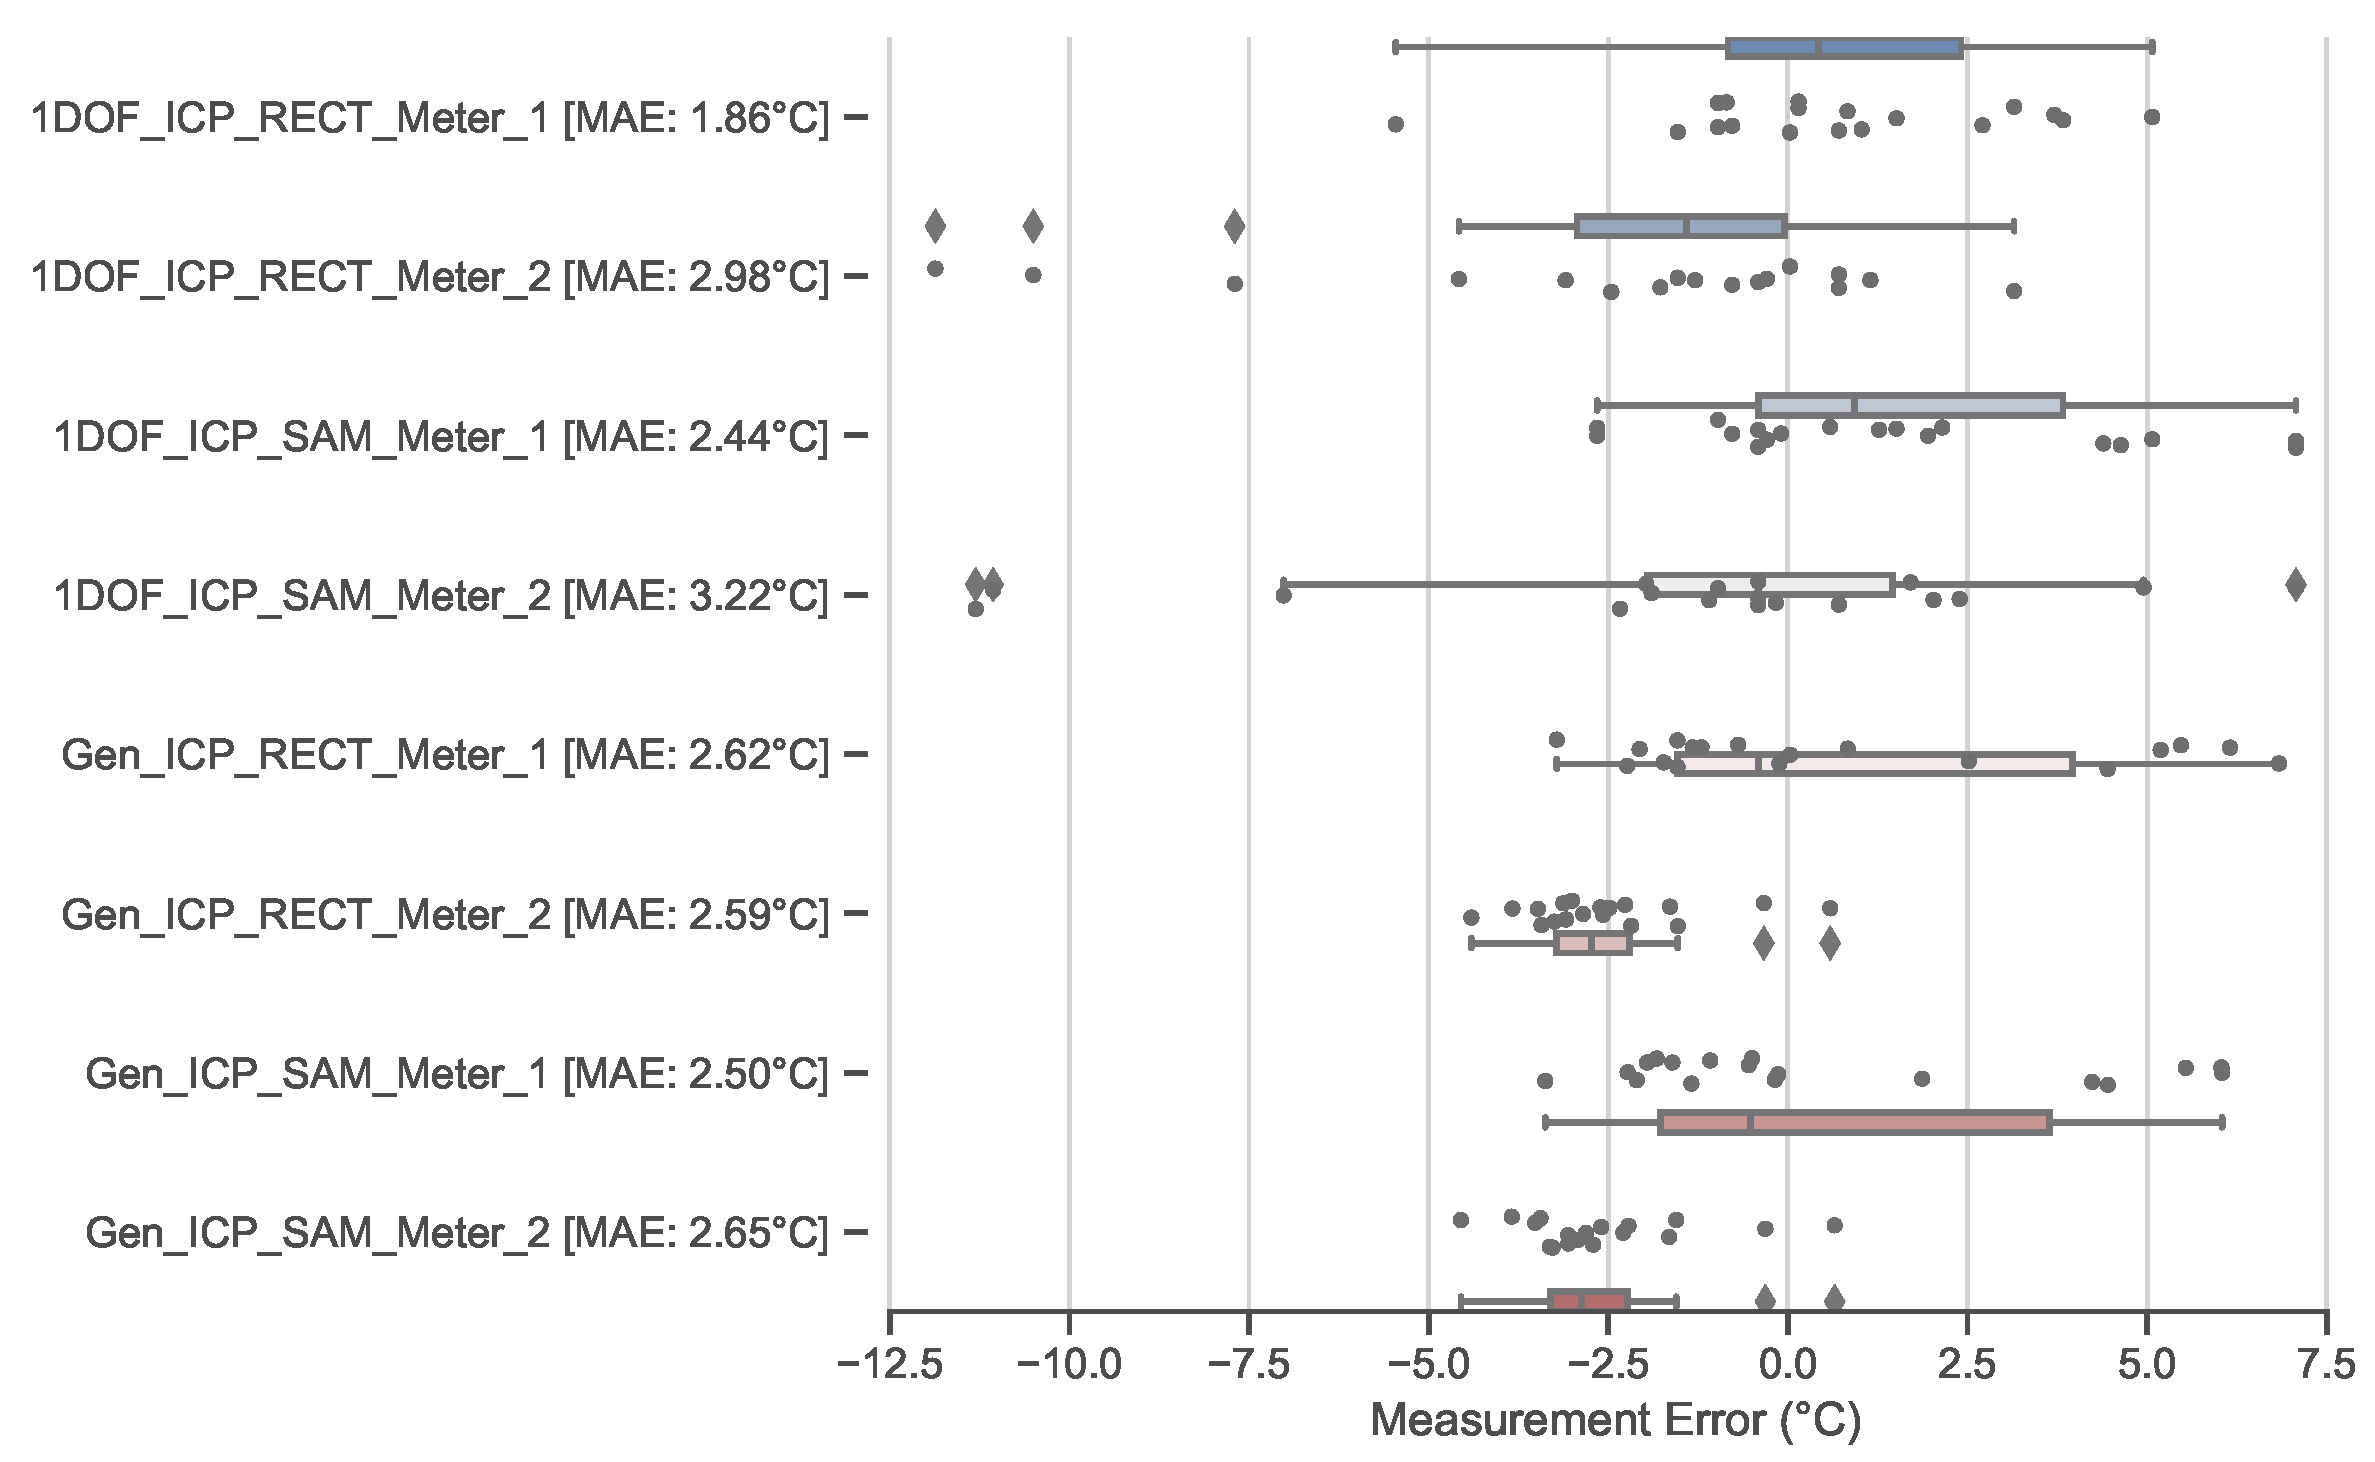
The validity of our results are next cross-verified based on the available SCADA measurements for meters 1 and 2 (see Figure 11). The resulting meter reading errors distributions are shown in Figure 14 by means of boxplots and through separate MAE calculations in Figure 15. The 1DoF ICP, with the ‘’RECT” center finding and for both meters, displays lower error in comparison to its counterpart algorithms.
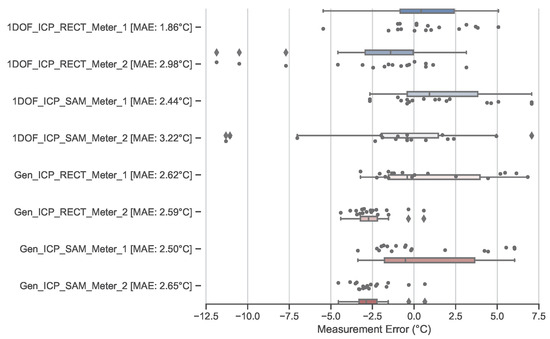
Figure 14.
Estimation error samples and distributions, displayed as boxplots, of the difference between the ground-truth measurements obtained from the SCADA and the variations of the generic and 1DoF ICP algorithms (‘SAM’ vs. ‘RECT’). As two meters share the same SCADA measurement, tests were conducted on both.
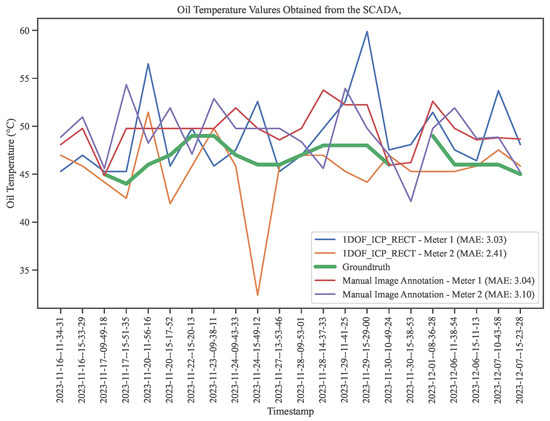
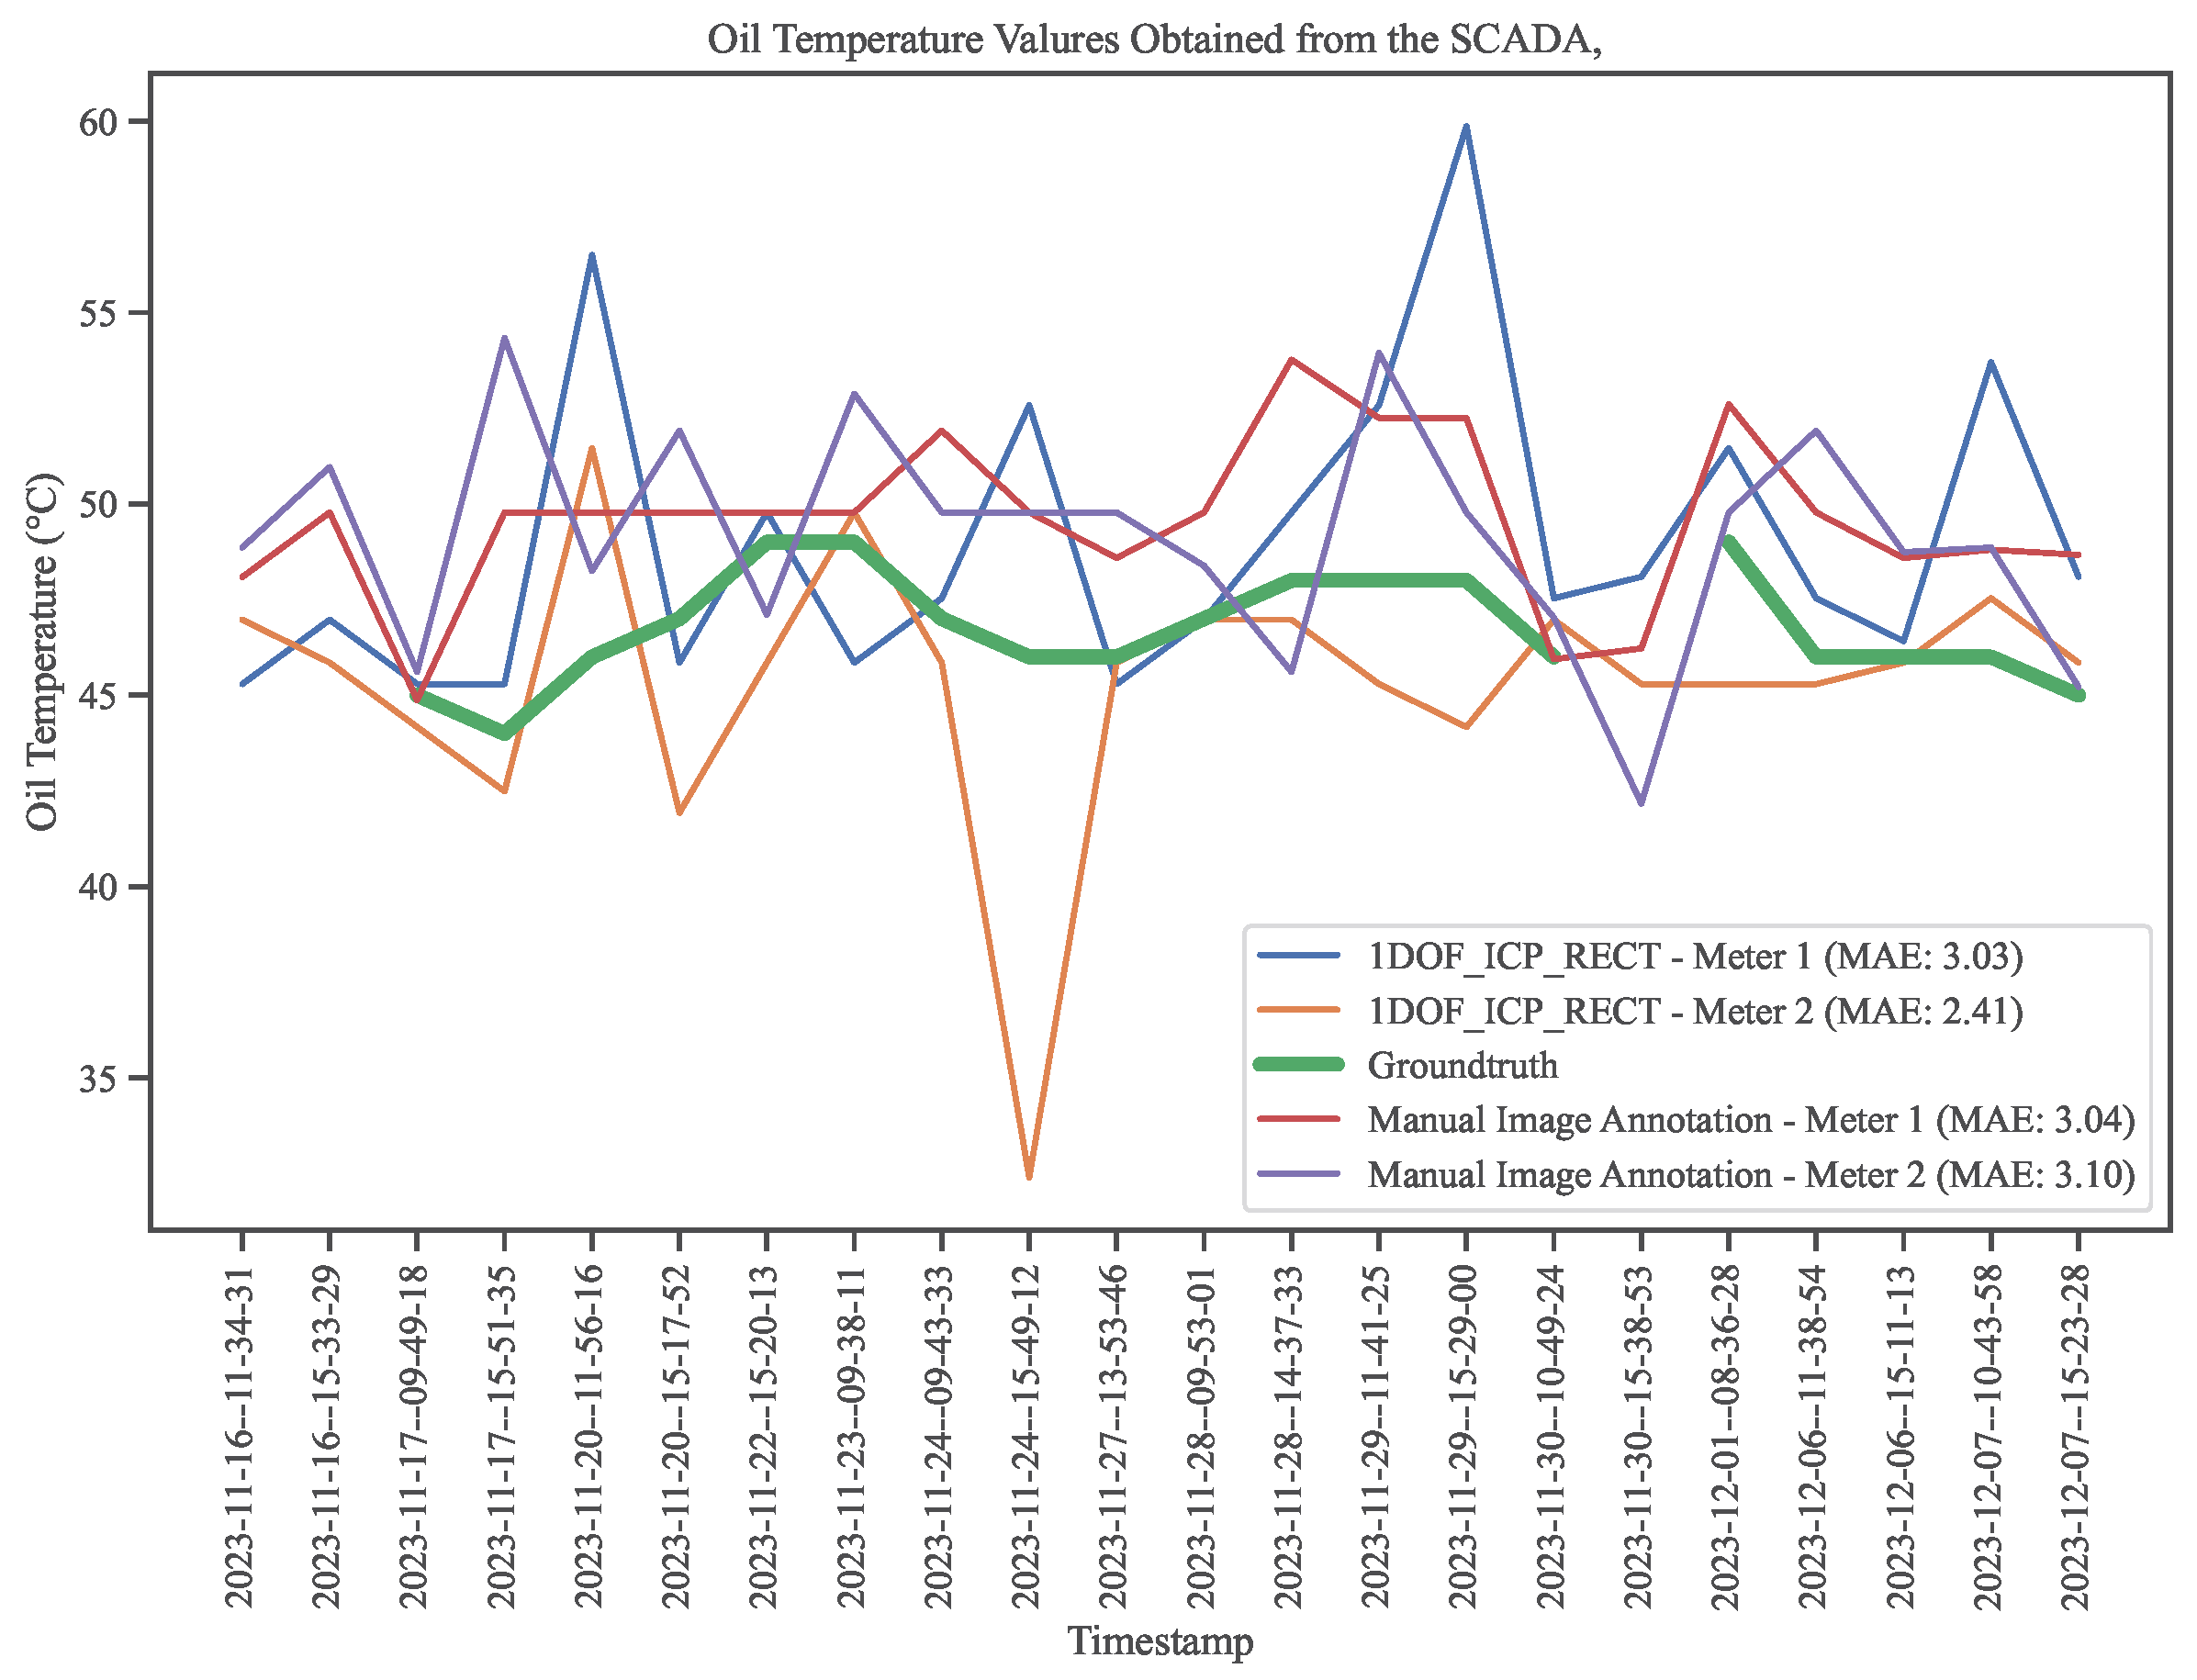
Figure 15.
Timeseries displaying the ground truth obtained from the SCADA in comparison to the matching values produced by the ICP “RECT” algorithm. Note that the resampling period of the SCADA is 15 min, which causes an average offset of 7 to 8 min between robot measurements and the ground truth.
This dissonance between the MAE results in Table 2 and Table 3 and the boxplot is caused by the difference in ground-truth data use and manual labeling as opposed to SCADA time series. As the SCADA provides the more accurate measurements and as the success rates of all algorithms are similar, we conclude that 1DoF ICP with RECT center alignments is the best candidate for future measurements.
To illustrate the accuracy of 1DoF ICP “RECT”, we display a time series of the oil temperature calculated via 1DoF ICP “RECT”, SCADA, and manually labeled data in Figure 15. As displayed by the low error of the algorithm for both meters, we note that our algorithm outperforms the hand-labeled ground truth, which is prone to human error. This makes 1DoF ICP “RECT” a candidate for retrofitting under circumstances of disconnection or the absence of a SCADA system.The end goal is to improve the solution to allow a user to configure the algorithm to read other meter types and models. In addition, as future work, the implemented algorithm is to be compared against other state-of-the-art methods for differing image resolutions or, more specifically, sampling distances on the surface of the meter.
6. Corrosion Surface Detection and Segmentation
Electrical transformers play a pivotal role in the power distribution network, facilitating the efficient transfer of electricity across various voltage levels. The longevity and reliability of these transformers are essential for ensuring an uninterrupted power supply. However, over time, transformers are exposed to harsh environmental conditions, such as moisture and chemical pollutants, which can lead to the formation of rust and corrosion on their surfaces. The presence of rust and corrosion not only undermines the structural integrity of transformers but can also negatively impact their performance and lifespan. Early detection and accurate assessment of these defects are crucial to prevent catastrophic failures and maintain the efficiency of the power grid [37,38].
Traditional techniques of corrosion detection and other defects might rely on visual inspection or complex instrumentation, non-destructive testing methods, acoustics, and radiographic techniques. However, in this work, advanced deep learning techniques, and instance segmentation models [39] are used to achieve the automatic vision-based detection of corrosion and «anomalies» on the surface of the transformer. Specifically, the YOLO architecture is adopted due to its real-time object detection capabilities and suitability for defect-recognition tasks.
At the beginning of our approach, a comprehensive dataset comprising images of surfaces exhibiting different degrees of rust and corrosion was compiled. The images for training the model were taken from public datasets, and images from the mounted camera on the autonomous vehicle were used for testing. To ensure model robustness, the training dataset includes diverse environmental conditions, lighting variations, and rust patterns.
The YOLO architecture was chosen for its ability to identify and locate multiple object instances within an image simultaneously. YOLO’s object detection approach involves dividing the image into a grid and predicting bounding boxes and class probabilities within each grid cell. This real-time detection mechanism makes it suitable for industrial applications where timely intervention is crucial. Later, we experimented with more diverse and enlarged datasets comprising images captured by different cameras and magnified images to specifically address the intricacies of detecting defects. Moreover, augmentation techniques were adopted and tested in order to identify the combination of data that best met the requirements of our problem. The compiled datasets were divided into training, validation, and test sets.
The YOLO model was trained again for this study, i.e., implementing transfer learning, to perform instance segmentation to accurately identify and segment instances of objects, anomalies, and corrosion. The training process involved an iterative optimization of model parameters to minimize detection errors. The trained model’s performance was rigorously evaluated using various metrics such as mean average precision (mAP) at the IoU threshold of 0.5 and other IoU thresholds (0.5–0.95), recall, precision, and losses related to bounding boxes, classification, and segmentation. The model’s ability to differentiate between patterns of varying severity was assessed to ensure its reliability in practical scenarios.
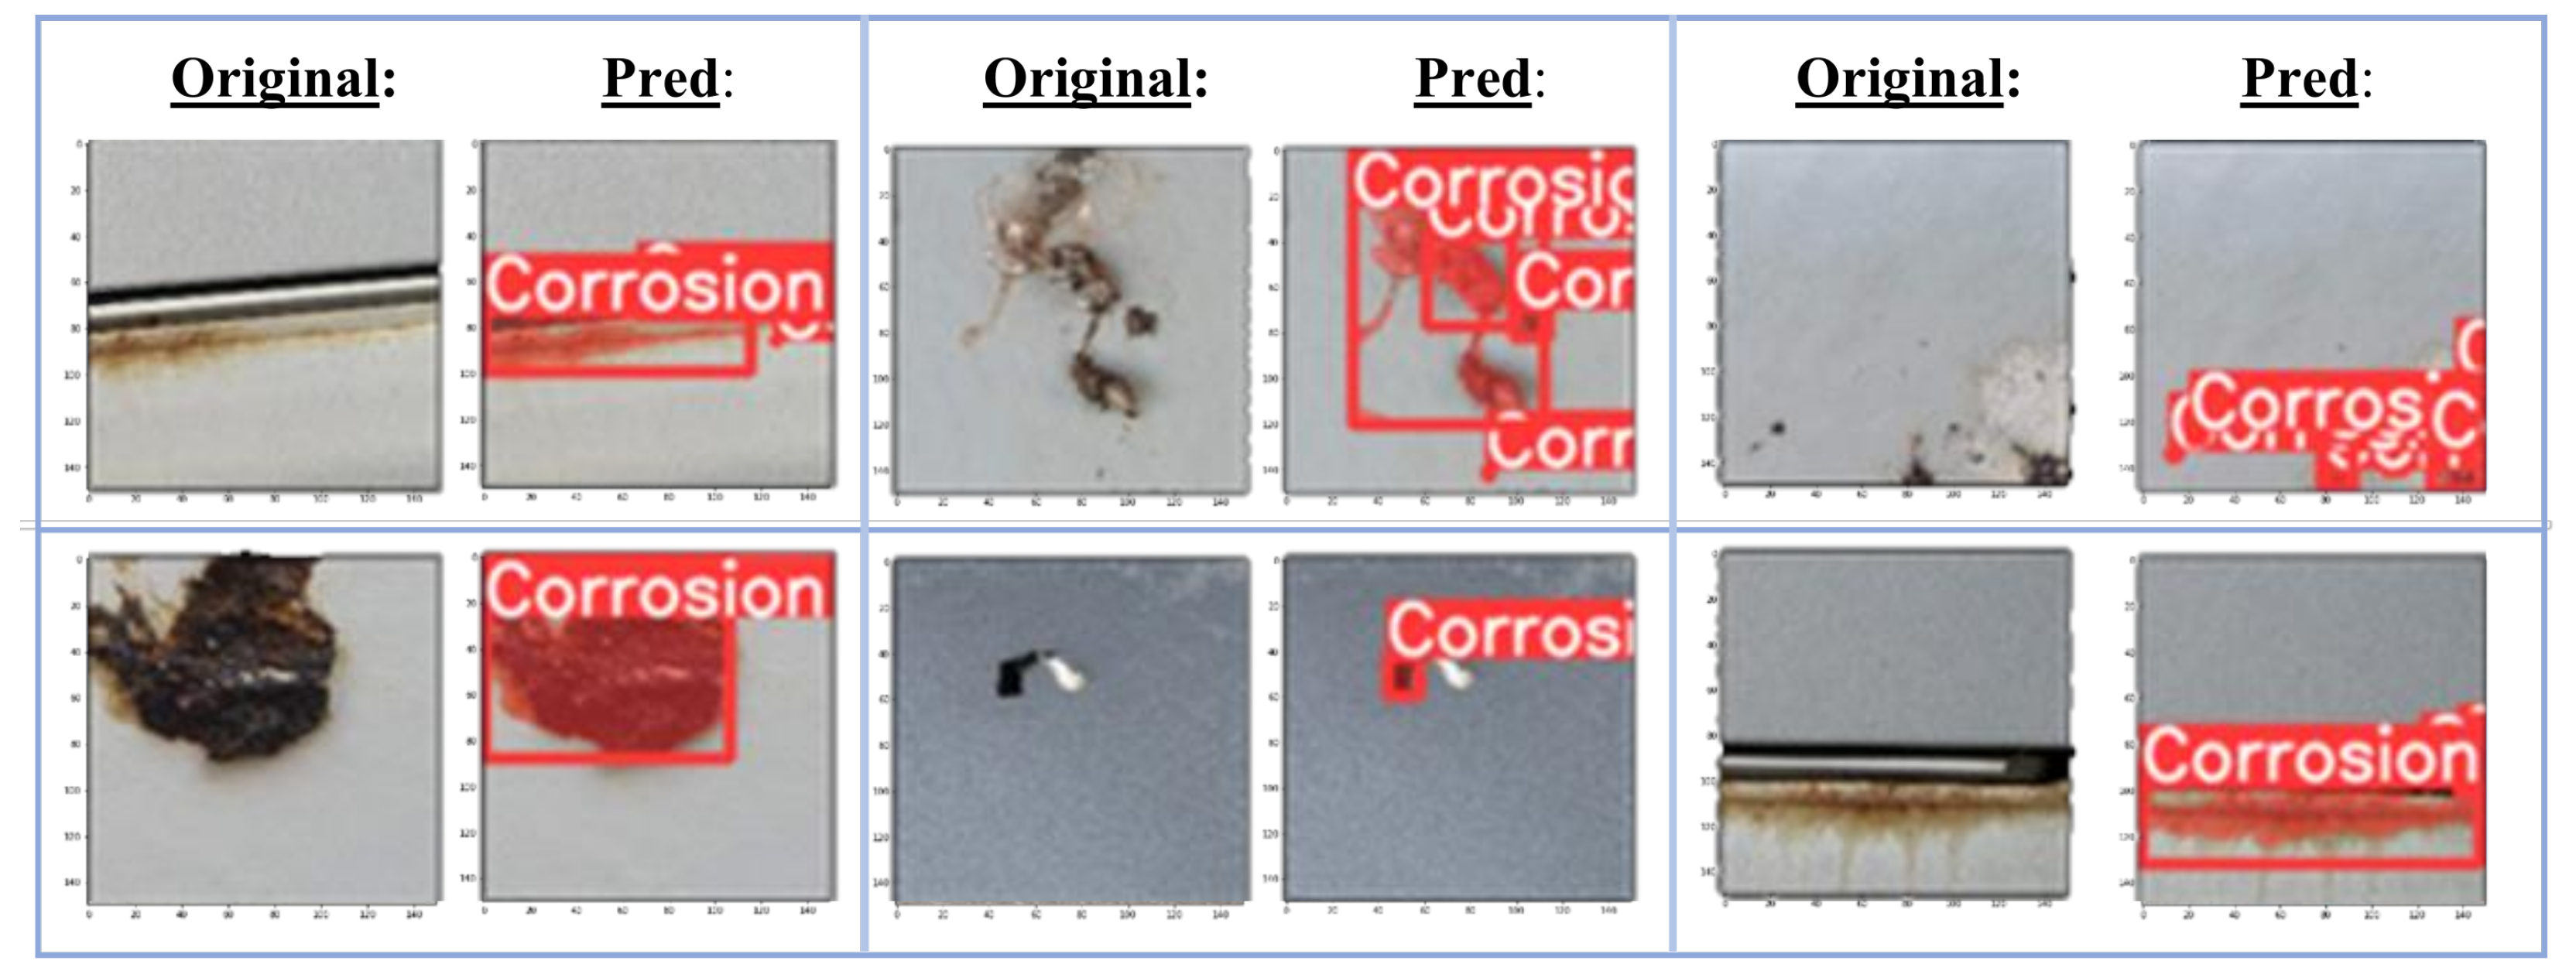
The system’s example predictions are presented in Figure 16 and Figure 17, where different cases of corrosion are shown. The following capabilities of this module are shown: the detection of larger defects, but also the detection of subtle and minuscule anomalies, with an emphasis on rust detection in this case. As an initial step, the detection of corrosion, such as rust, is performed. Subsequently, our work comprises the recognition of other types of defects, such as oil leaks and color anomalies caused by weather conditions or other external factors, as well as the segmentation of objects, such as analog meters.
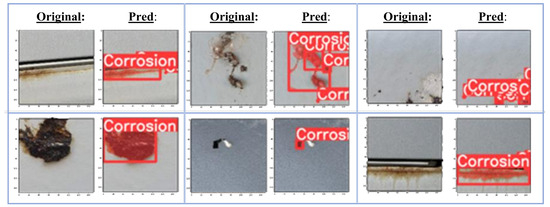
Figure 16.
The figure presents six different cases of corrosion. On the left are original images with corrosion, and the right, every original image is the prediction (Pred) of the model, highlighted in a bounding box the detected anomaly and segmented (colorizing) the problematic area.
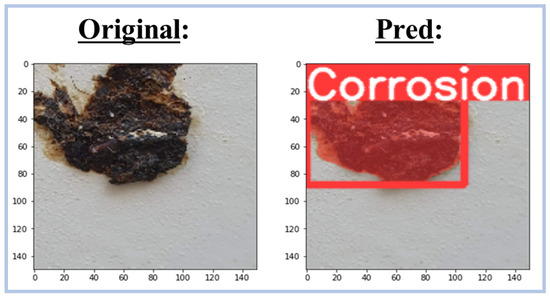
Figure 17.
The figure presents one case of corrosion on the surface of a transformer. On the left is the original image, and on the right is the prediction of the model, highlighted in a bounding box the detected anomaly and segmented the problematic area.
To determine the most effective model for predicting defects and anomalies on the surfaces of electrical transformers, we created several datasets that we used in our supervised approach with Yolo. The datasets encompassed various surface conditions, including color anomalies, oil leaks, rust detection, scratches, silicone insulation defects, and object localization for the analog meters.
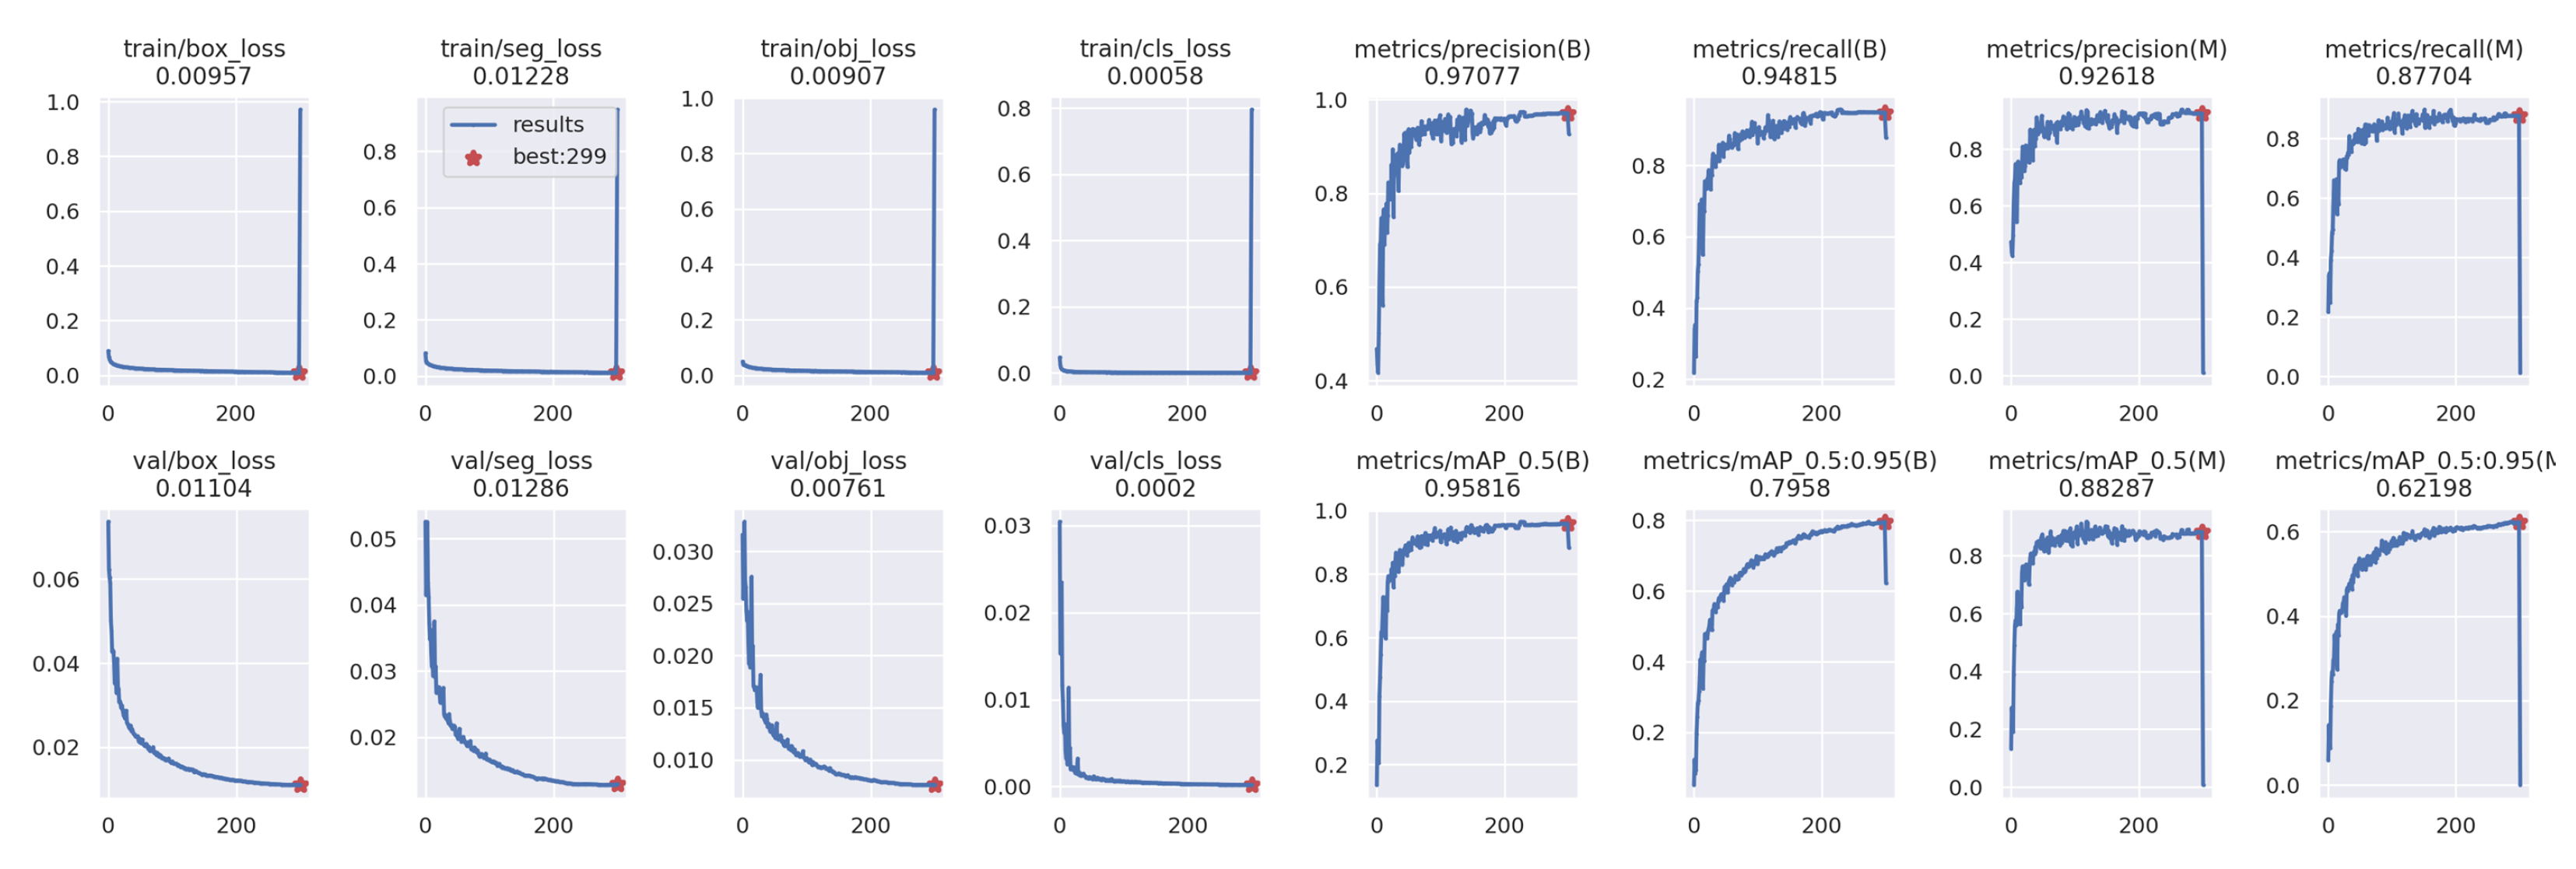
The results, presented in Figure 18, demonstrate the model’s proficiency in detecting and classifying anomalies across different categories. Notably, the high mAP values and balanced Recall and Precision scores underscore the model’s effectiveness in identifying and localizing defects, while the detailed breakdown of losses provides insights into the individual components contributing to the overall model’s performance. The confusion matrix, visualized in Figure 19, provides a thorough analysis of true positive, true negative, false positive, and false negative predictions. The high values (0.92 to 0.99) in the confusion matrix for individual classes demonstrate the model’s strong performance in correctly identifying specific defect categories.
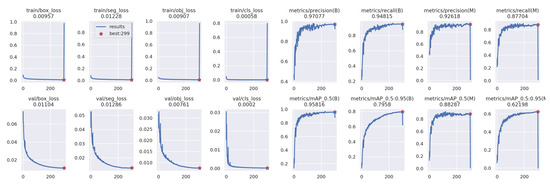
Figure 18.
The figure presents the model’s losses and metrics for one of the best-performing datasets used in the study to predict anomalies in the surface of electrical transformers as a part of the pipeline for our supervised approach.
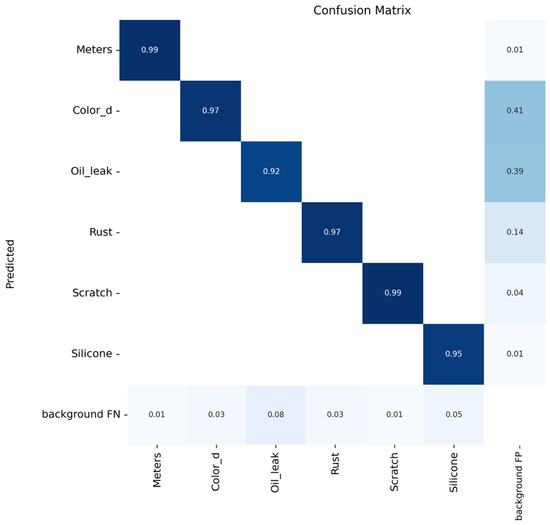
Figure 19.
The figure presents the model’s confusion matrix for one of the best-performing datasets used in the study to predict anomalies in the surface of electrical transformers as a part of the pipeline for our supervised approach.
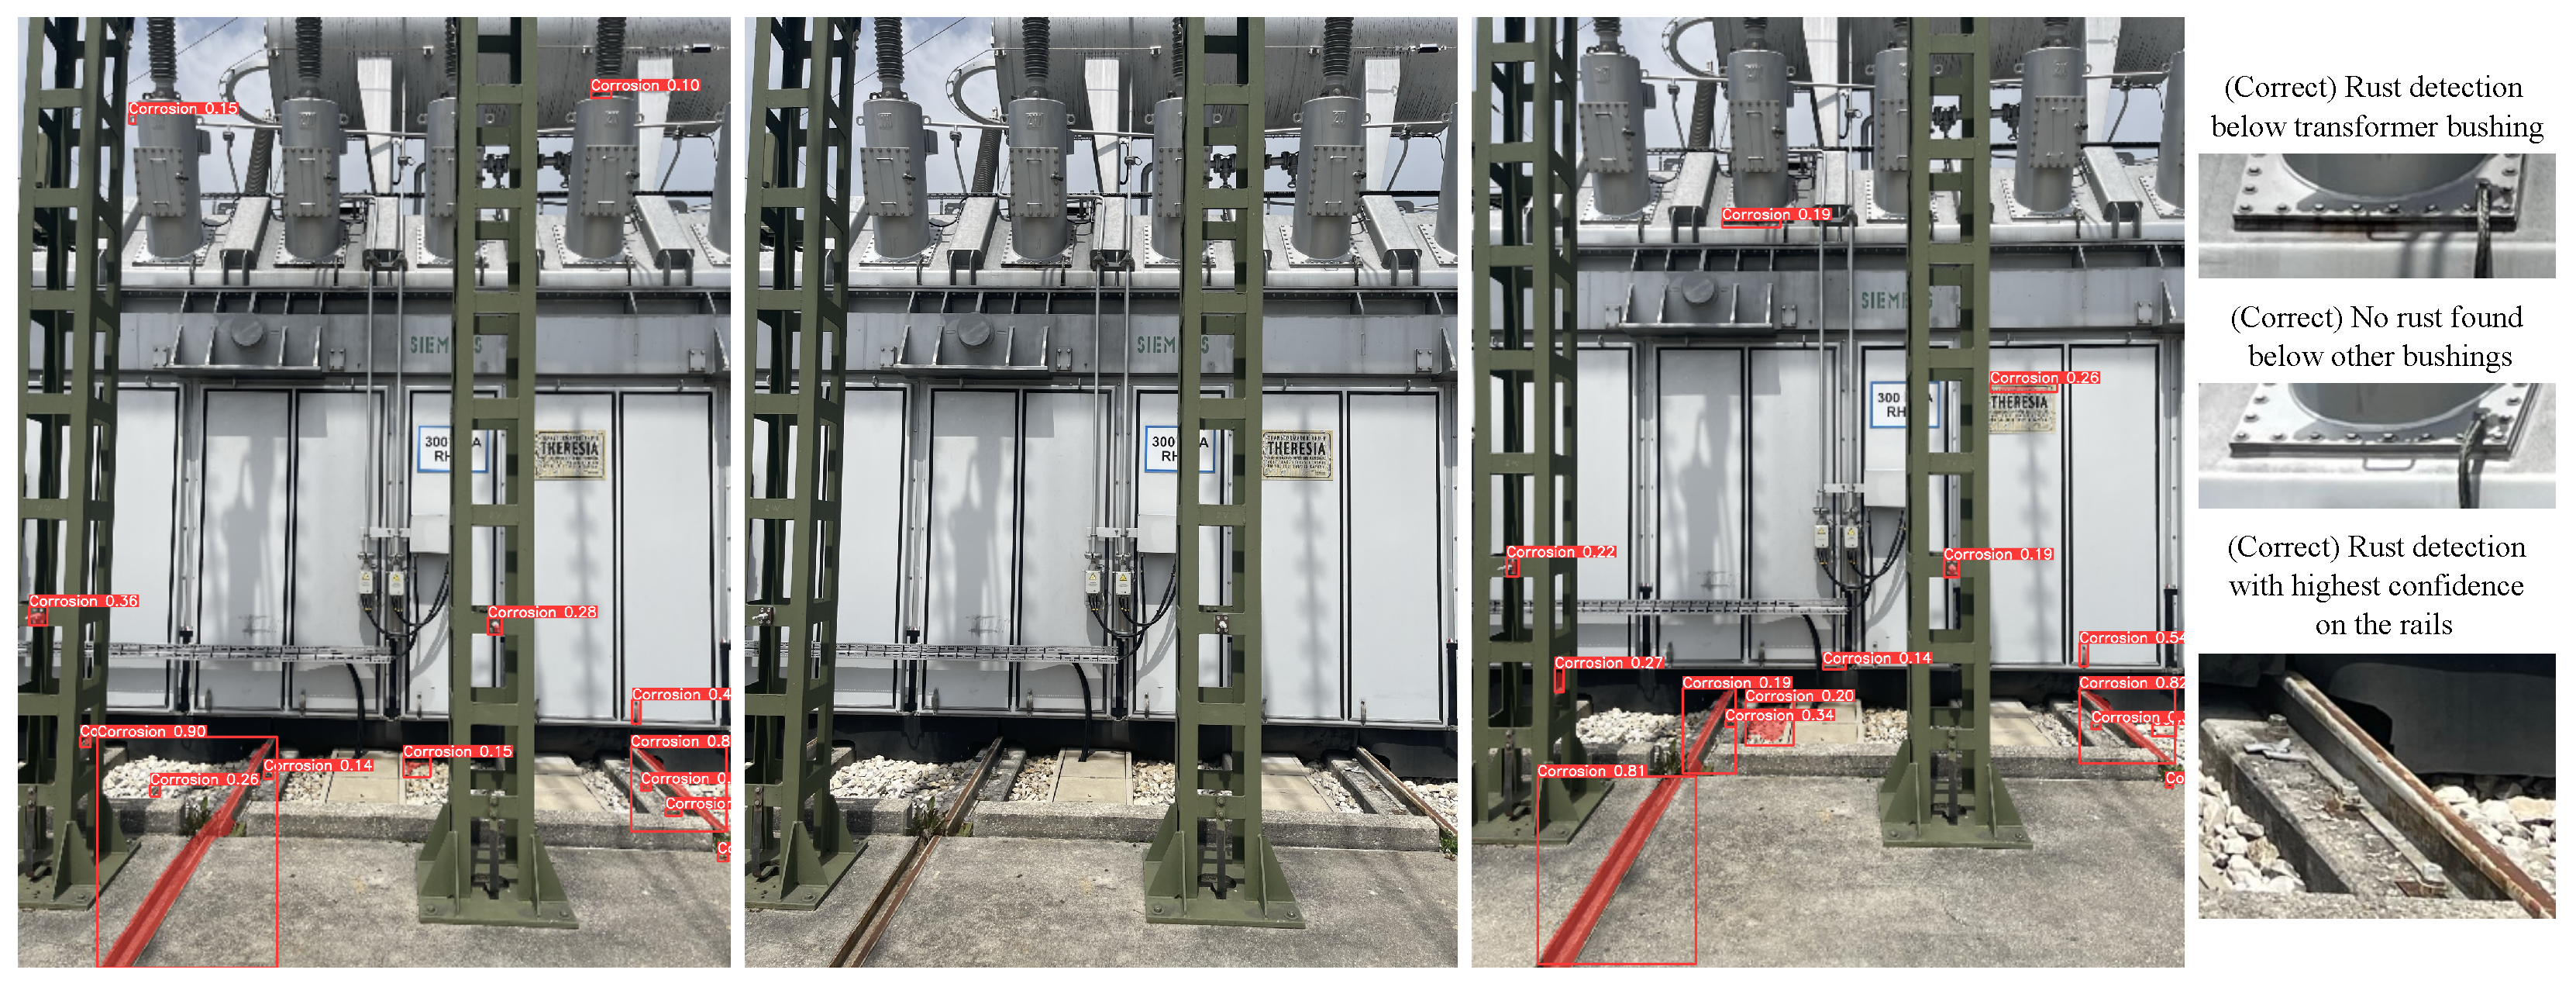
The model has also demonstrated its effectiveness when put to the test in real-world scenarios, such as in Figure 20. When applied to images of power transformers, the model successfully identifies and segments areas of rust with a high confidence level consistently exceeding 70–80%. This robust performance ensures that potential corrosion issues are detected accurately, enabling timely maintenance and preventing costly damage.

Figure 20.
The figure presents the model’s segmented masks overlaid onto power transformer images, highlighting areas potentially affected by corrosion and aiding in proactive maintenance. In the middle of the image, one can see the original image. The right and left images are 2 images taken from 2 similar but different viewpoints. Many predicted “corrosion” defects are detected in both images within the red boxes. For the low-confidence detections on the top of the transformer, around the columns of the insulators, the detection on the right image with a confidence of 0.19 is correct. A highe- resolution, detailed image of this area would probably result in higher-confidence detection of this incipient defect. Close-up images are shown on the right that show some exemplary detections in detail.
Initially, we explored the effect of a public dataset [40] regarding rust to identify defects in the images. Next, in order to recognize various defects, we expanded our scope to include additional classes such as “analog meters”, “color detections”, “oil leaks”, “scratches”, and “silicone anomalies”. Since no public datasets were available for the aforementioned classes, we conducted a data-collection process using the multi-sensor robot that was developed by our team. The results presented in Figure 21 showcase the model’s versatility and effectiveness not only in rust detection but also in addressing a spectrum of distinct defect classes in real conditions via images in an actual electrical plant.
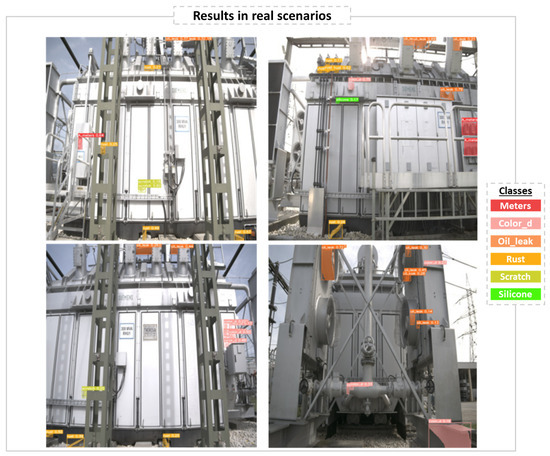
Figure 21.
The figure presents four exemplary images from a real electrical plant, demonstrating the identification of the six classes, where each color represents one class. Each image shows a different side of the electrical transformer employed in our experiment. The detections are visualized, along with the confidence of the model in its predictions.
While the results are indeed promising, it is critical to mention the importance of some parameters in interpreting the model’s predictions, as the accuracy may vary depending on specific environmental conditions and image quality and resolution. By means of the RGB-LiDAR reference model, it is possible to automatically discard rust detections on the ground. The image resolution and resulting sampling distance on the surface of the transformer limit the performance of the rust detection and the smallest defects that can be detected by the model with a good confidence level. The expectation is that as our dataset expands, the model will benefit from a richer and more diverse set of examples, leading to more accurate predictions and contributing to its overall efficacy in defect prediction and anomaly detection.
In conclusion, this research presents an efficient approach for anomaly detection and corrosion assessment on the surfaces of electrical transformers. By leveraging deep learning techniques, particularly the YOLO architecture, the developed model showcases real-time capabilities and adaptability to diverse operational conditions. As part of future work, the assessment of the accuracy of the model in a bigger and more diverse transformer image dataset will be performed. In addition to that, our plan includes an approach to self-improve the model by utilizing a semi-annotation mechanism that uses the existing architecture in conjunction with other models to generate additional labeled training data that will contribute to the refinement of our model. This iterative process is designed to enhance the model’s ability to capture intricate patterns within the data, fostering a continuous cycle of improvement. By enabling the early detection of defects and corrosion and by continuously improving their understanding of the data, such models have the potential to provide efficient and timely maintenance interventions.
7. Robust Change Detection
Complementary to identifying known causes of defects such as rust and oil spills, we also consider automatic change detection as a valuable alternative approach to highlight potential deteriorations on the outside of a transformer. With repeated inspection trips performed by the robot, a large archive of historical images can be accumulated over time, allowing users to compare the current state of the transformer with previous observations. Due to the number of data, automated mechanisms are required for identifying potentially relevant changes. These have to be tolerant to changing environmental conditions (weather, illumination, etc.) and robust to small variations in viewpoint (limited relocalization accuracy). A range of machine learning approaches for this application scenario has been published, such as [41].
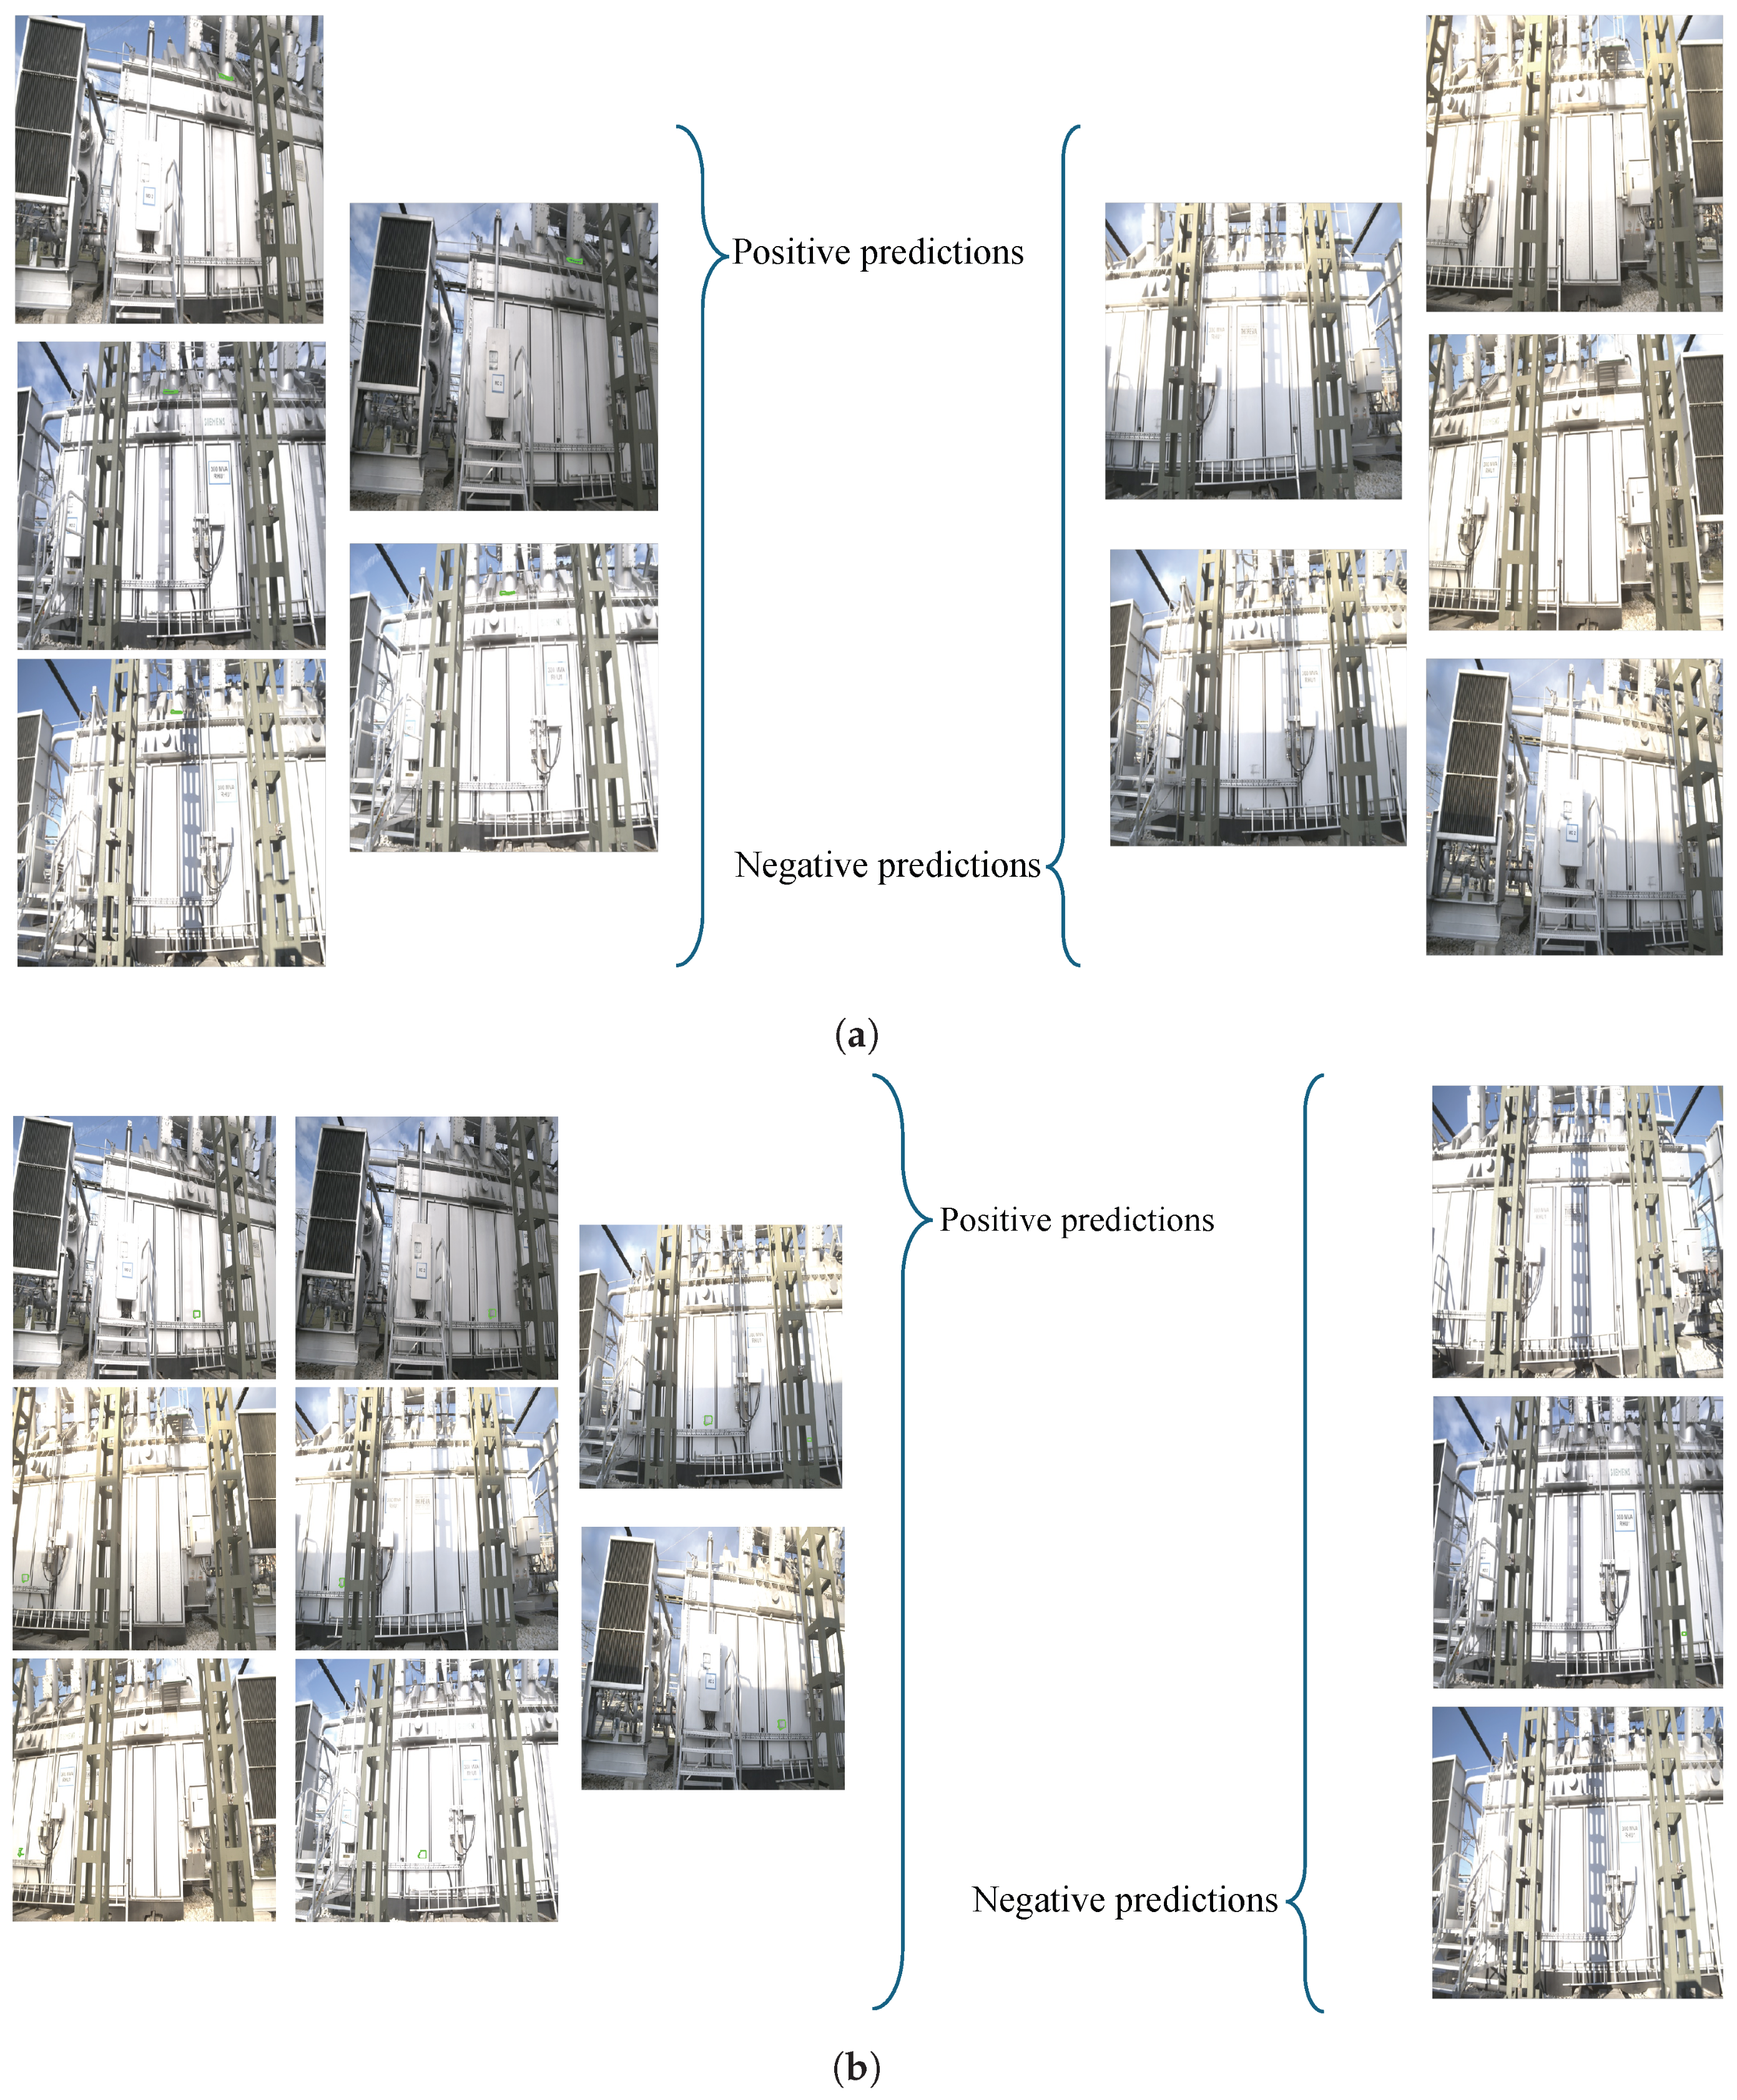
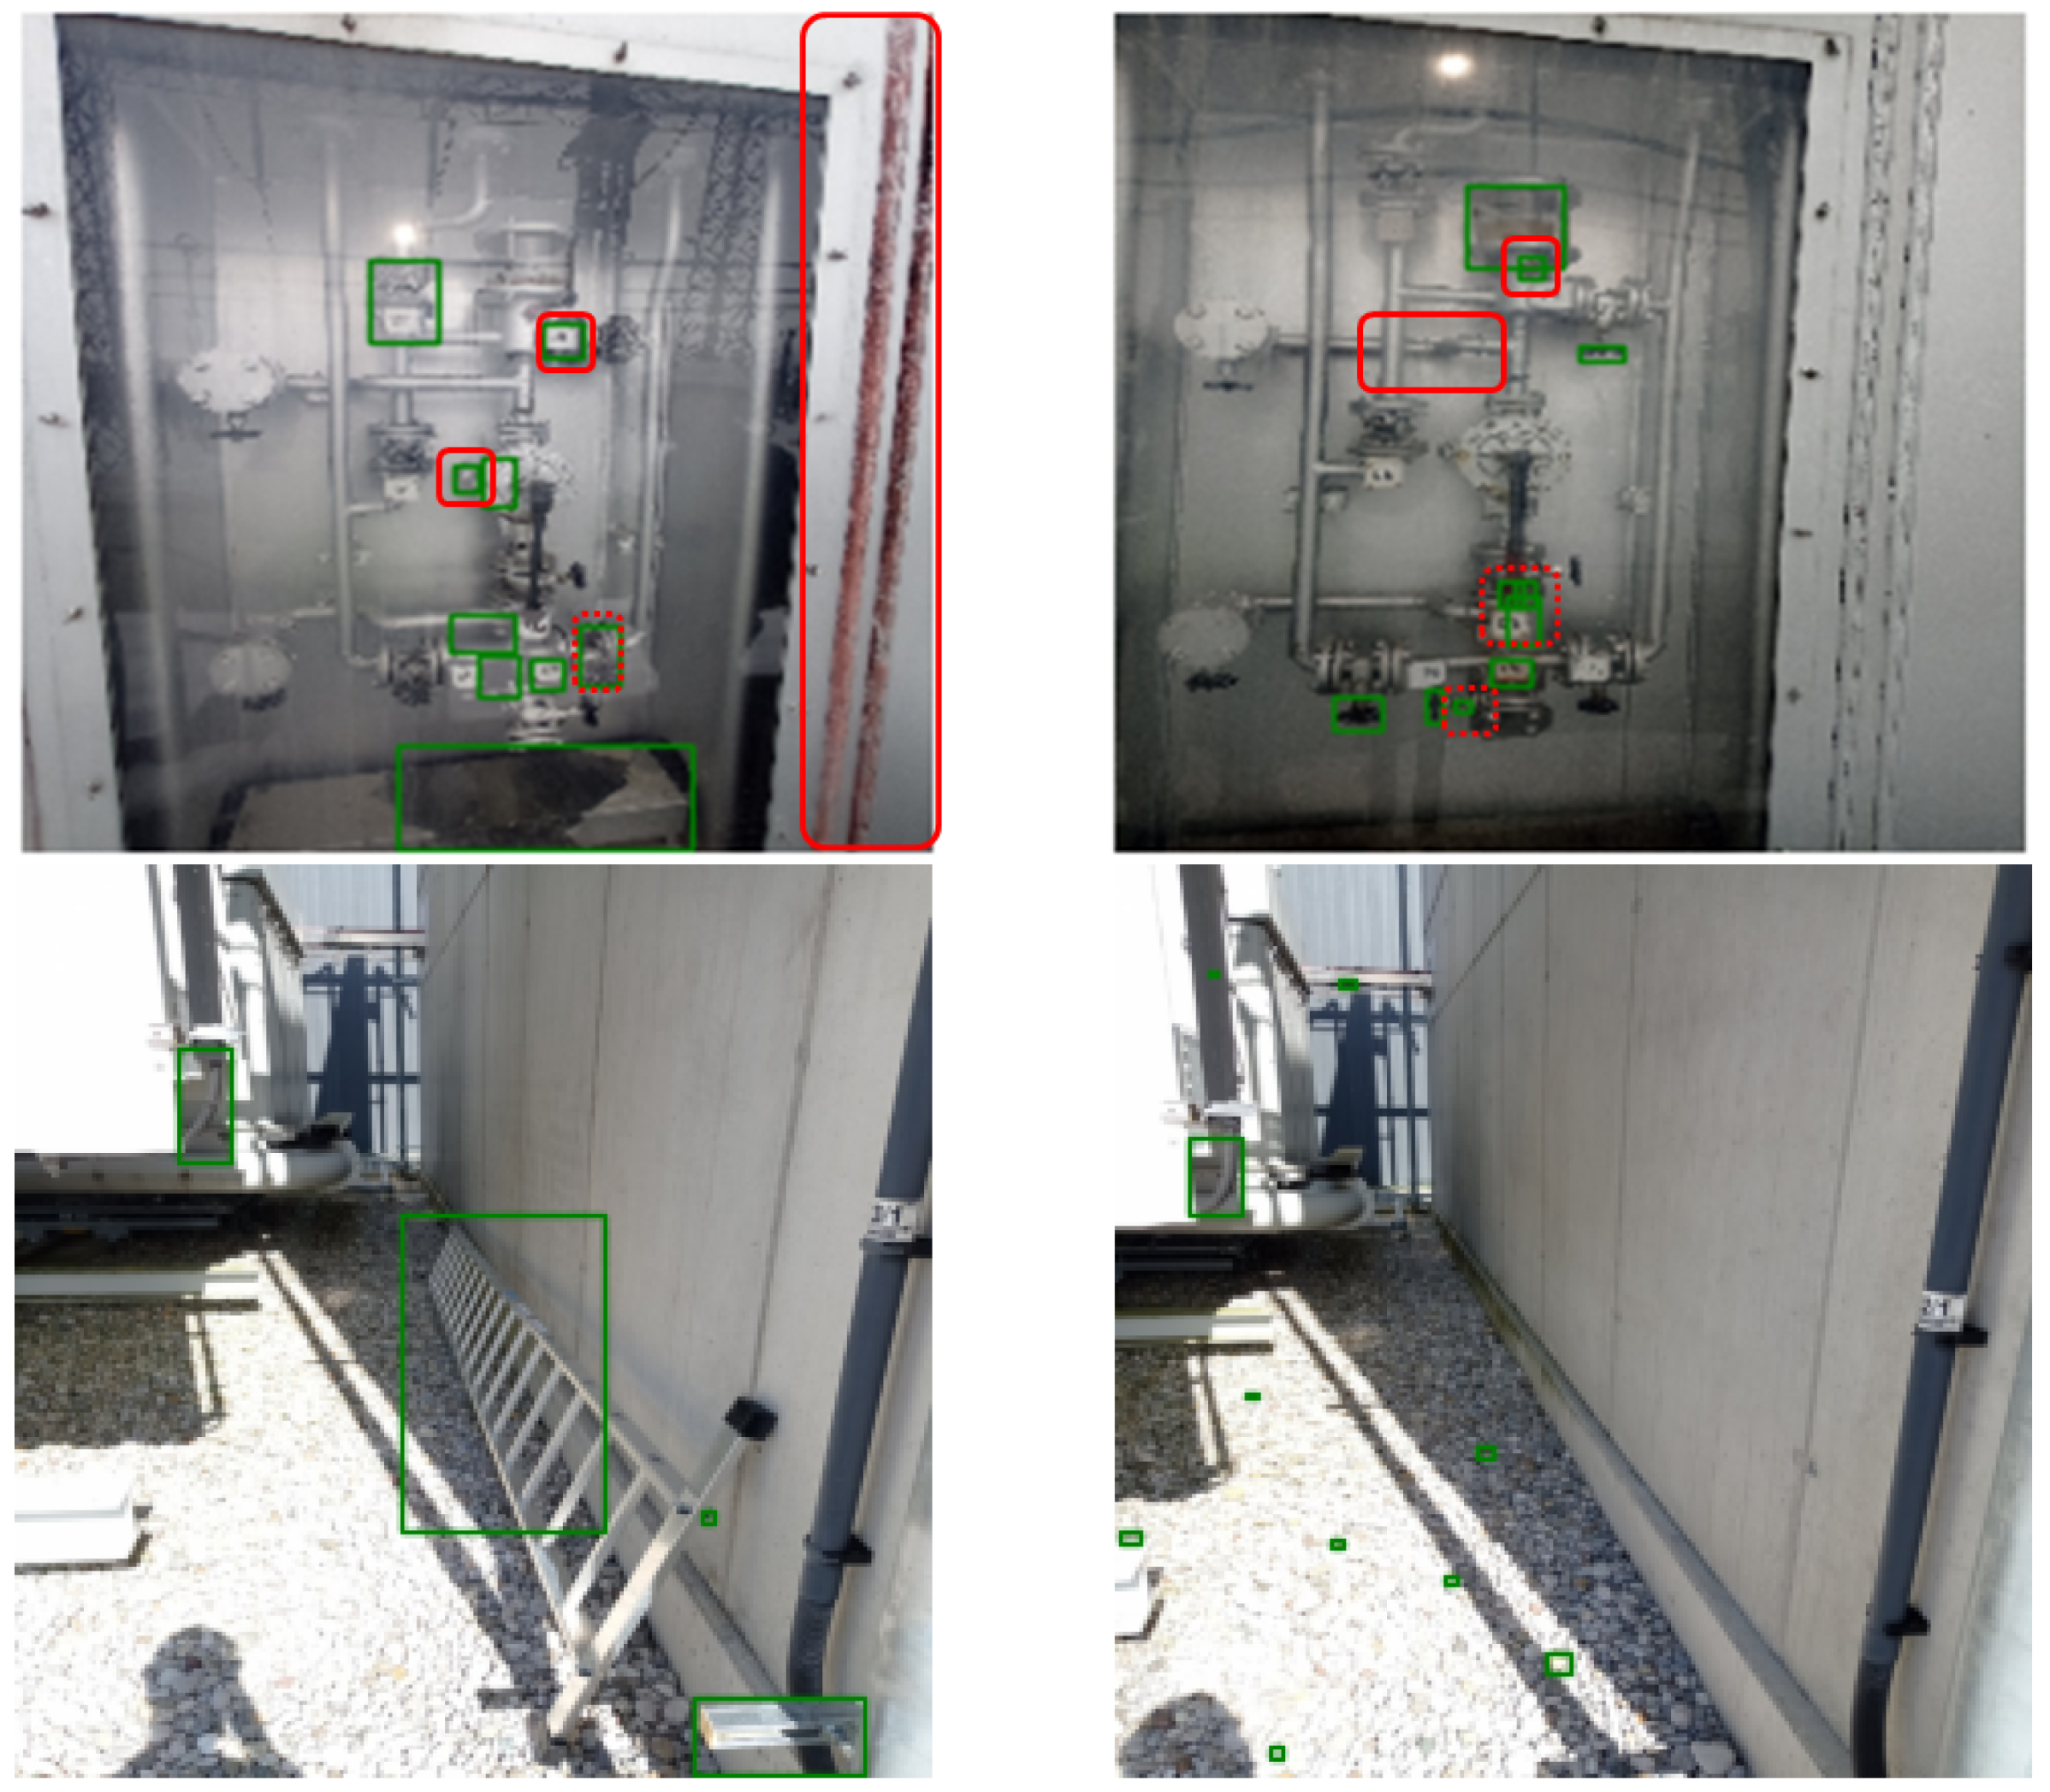
To evaluate this specific approach on a preliminary and small dataset, sample results are illustrated in Figure 22, where the automatically identified changes are highlighted. While a few additional image areas were incorrectly reported as changes, i.e., a few false positives and a mediocre precision metric, it is noted that most of the actual changes are correctly identified by the algorithm; i.e., there are few false negatives and a high recall metric. Further work based on the newly recorded image data is required to corroborate and improve these results. Note that in any case, a human operator would be required to confirm the changes and assess their severity, but this expert could efficiently use the automatic guidance and the archive of data to perform their inspection task.

Figure 22.
Automatically identified changes between two handheld images of transformers are shown with green boxes. Errors are highlighted with red boxes. Note that in both cases, these are actually two different transformers that should be identical and are in use next to each other for the same time period, but they still exhibit a few small, but real differences that are correctly reported by the change-detection algorithm.
8. Power Transformer Acoustic Modeling
A novel approach to measure and visualize acoustic emissions of transformers is presented. The term “3D acoustic heat map” stands for the visualization of the distribution of acoustic emissions over the entire surface of a transformer, shown in Figure 23. For this novel acoustic representation, the RGB-LiDAR reference model of the transformer is combined with the output of the microphone array. A beamforming algorithm calculates the directional sound radiation of each voxel of the 3D model. The values of the directional sound radiation result in a 3D acoustic heat map for each desired frequency. These acoustic heatmaps contain various information about different sound-related parameters, including the sound pressure level, as well as the local sound sources at characteristic frequencies.
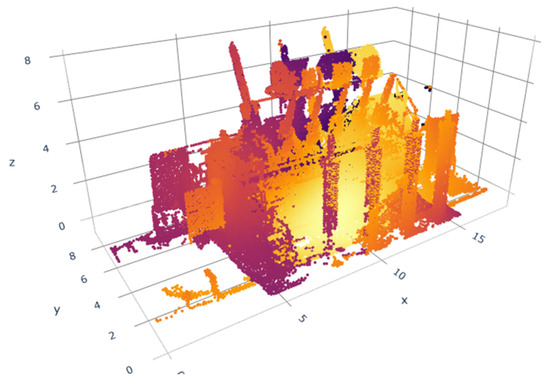
Figure 23.
Three-dimensional heatmap representing the transformer sound emissions. Acoustic heatmaps, acquired from all four sides are mapped on the RGB-LiDAR reference model. Lighter colors represent higher sound pressure level values. A visual inspection allows us to identify the strongest acoustic sources.
The microphone array geometry used consists of an icosahedron dome V2 [42] with a radius of 135 cm and 32 sensor positions for ICP electret microphones in an IP67 enclosure. Compared to a 2D geometry, the 3D geometry has the advantage of being able to attenuate noise from behind. A flat, upright array cannot distinguish between noises coming from the front and those originating from the rear [43]. The array geometry used results in a directivity index greater than 10 dB for frequencies above 200 Hz and greater than 15 dB for frequencies above 800 Hz. For spatialization, delay and sum (DAS) beamforming [44] is used to compute the sound arriving from a given direction. Besides its straightforward implementation, DAS guarantees artifact-free output signals, which is important for any acoustic modeling approach that relies on these signals. Furthermore, DAS preserves the amplitude ratios with respect to the input signals, which is mandatory for the calculation of the resulting absolute sound pressure values. Figure 23 shows a combination of acoustic heatmaps acquired from all four sides of the transformer mapped onto the RGB-LiDAR reference model. Monitoring the surface over time provides a statistical model of a healthy transformer. As soon as enough data from this healthy model—the acoustic fingerprint, so to speak—are available, deviations from this model can be detected. We expect that faults inside the transformer will propagate to the surface and that we will be able to detect these via anomaly detection. However, long-term data still need to be recorded for this. More detailed information can be found here [45].
9. Summary of Results
The evaluations of the capabilities, presented in the previous Section 3, Section 4, Section 5, Section 6, Section 7 and Section 8, showcase the potential of the system to support the lifecycle and condition monitoring of the transformer and detect certain anomalies. Each dataset acquired by the robot corresponds to the state of the transformer at a certain date and time, as acquired by the multi-sensor platform on the same viewpoints around the transformer. Several modules of the proposed solution provide a wide multi-sensor monitoring of the transformer.
The point cloud registration approach (Section 3) allows for (i) pose estimation of the sensor platform mounted on the robot based on the depth images; (ii) the accumulation of statistical data—of measurements, detections and findings from all sensors—on the RGB–LiDAR reference model of the transformer; and (iii) the consolidation of detections and findings, based on a voting mechanism. The testing of this measurements consolidation through the voting mechanism is ongoing.
Examples of such measurements include the temperature of certain points or elements of the transformer, such as the fan coolers (Section 4), as well as the readout of analog meters (Section 5) and the acquisition of the acoustic emissions originating from the transformer’s external surface (Section 8).
Examples of detections and findings include thermal hotspots (Section 4); uncommon measurements of noise and the location of their sources, such as vibrating loose elements (Section 8); failure cases of the analog meters and the comparison of their readings to those logged in the SCADA system (Section 5); corrosion, rust, oil leaks, and other surface detects (Section 6); and the detection of visually identifiable changes on transformer elements (Section 7).
Although many of the presented results have been qualitative, quantitative evaluations for the performance and accuracy of some of the methods have been carried out based on data acquired during the first measurement campaign performed by our robotic prototype, which has lasted around one month. Such evaluations include automatic pose registration of the multi-sensor platform (Section 3), the automatic reading of analog measurement devices (Section 5), and the detection of corrosion and surface defects (Section 6).
The developed robotic system prototype offers additional benefits compared to current standard methods. While standard diagnostics methods are effective to achieve competitive transformer lifecycle monitoring, certain rare anomalies are not detectable through them. An example of such undetectable anomalies is the mechanical disorders caused by aging and repetitive faults. With the data from the repetitive inspection rounds performed by the robot, such anomalies may be detectable and measurable. Some existing approaches from other domains would attempt to learn the normal behavior of the transformer, enabling the isolation of measurements outside of the learned normal behavior. In addition, consolidating measurements onto the RGB-LiDAR reference model of the transformer allows us to visualize detections that are repeatably identified in consecutive rounds of inspection.
10. Conclusions and Future Work
This paper presents a prototype multi-sensor robot and cloud backend solution for the lifecycle and condition monitoring of transformers and for anomaly detection. The focus of the design has been on performing minimally invasive transformer monitoring and diagnostics and for the robot to be deployable alongside standard existing transformer-monitoring strategies.
For data acquisition, the robotic platform collects data from specific viewpoints around the transformer while avoiding obstacles or stopping if necessary, in an automated, repetitive, precise, and reliable manner. The acquired data are stored in the cloud backend, while the data processing is divided between the robot and the backend. In order to relate and consolidate detections and findings to specific locations on the transformer, an accurate sensor-registration approach was first implemented, and a voting mechanism to further concretize the consolidation is now undergoing development with some initial results obtained for the corrosion detection module. This allows us to automatically measure and localize the following on the transformer: (1) the temperature of specific elements; (2) sources of noise; (3) corrosion, rust, and other surface detects; (4) the readings of analog-measurement devices; and (5) changes and modifications. The purpose is to achieve the early detection of anomalies on the transformer, to enable timely maintenance interventions, and, thereby, to mitigate the occurrence of expensive transformer failures and service disruptions. Furthermore, by identifying anomalies at their incipient stages, which may be related to rare transformer abnormalities, e.g., mechanical disorders, the system can hopefully contribute to extending the operational lifespan and efficiency of transformers.
As future work, the capabilities, advantages, and trade-offs of the system will be assessed in comparison to onsite inspection and other retrofitting efforts. With this focus, the analysis will be based on both quantitative and qualitative measures assessing the performance of the system to achieve tasks performed during onsite inspections, as well as other tasks, such as automatic anomaly and change detection based on the processing of the four sensing modalities: RGB, depth, infrared (IR)/thermal, and acoustics. Furthermore, the systematic automatic logging of the data produced by the system enables the development of powerful algorithms for the lifecycle monitoring of power transformers.
Author Contributions
Conceptualization: J.W., J.P., F.F., F.B.; Data Curation: J.W., A.J., S.L., G.S., O.K., A.M., J.P., F.F.; Formal Analysis: J.W., A.J., S.L., G.S., O.K., A.M., J.P., F.F.; Investigation: J.W., A.J., G.S., O.K., A.M., J.P., F.F.; Methodology: J.W., A.J., S.L., G.S., O.K., A.M., J.P., F.F.; Software: J.W., A.J., S.L., G.S., O.K., A.M., J.P., F.F.; Visualization: J.W., A.J., G.S., O.K., A.M., F.F.; Writing—original draft: J.W., A.J., S.L., G.S., O.K., A.M., J.P., F.F., F.B.; Writing—review and editing: J.W., A.J., S.L., G.S., O.K., A.M., J.P., F.F., F.B.; Project Administration: J.P., F.F., F.B.; Funding acquisition: F.F., F.B.; Resources: F.B.; Supervision: J.P., F.F. All authors have read and agreed to the published version of the manuscript.
Funding
This work has been supported by the by the Austrian Research Promotion Agency FFG, as follows: (1) funding for the work through the e!MISSION program, through the project X-AMINOR, Contract No. 881186, (2) support through the FFG-COMET-K1 Center “Pro2Future” (Products and Production Systems of the Future), Contract No. 881844, and (3) support through the TU Graz Open Access Publishing Fund.
Data Availability Statement
Other than the public dataset [40] used partially under Section 6, the rest of the data used in the study is not readily available due to legal agreements between the involved companies for data privacy reasons.
Acknowledgments
Austrian Power Grid (APG) has our deepest appreciation for their support in the realization of this work. Their support has been crucial in allowing experiments and data collection for research purposes at one of their power stations with the automated ground robot prototype, developed and integrated as part of the FFG project X-AMINOR.
Conflicts of Interest
Author Jakub Waikat was employed by the company SIEMENS Energy Austria GmbH and by Siemens AG Österreich. Authors Amel Jelidi, Sandro Lic, Georgios Sopidis, and Jesús Pestana were employed by the company Pro2Future GmbH. Author Olaf Kähler was employed by the company JOANNEUM RESEARCH Forschungsgesellschaft mbH and by Siemens AG Österreich. Authors Anna Maly, and Ferdinand Fuhrmann were employed by the company JOANNEUM RESEARCH Forschungsgesellschaft mbH. Author Fredi Belavic was employed by the company Austrian Power Grid AG. The funders had no role in the design of the study; in the collection, analyses, or interpretation of data; in the writing of the manuscript; or in the decision to publish the results.
References
- Transformer Reliability Survey; Technical Brochure 642. Final Report of Working Group A2.37; CIGRE: Paris, France, 2015.
- Tenbohlen, S.; Hanif, Z.; Martin, D. Analysis of Major Failures of Power Transformers. In Proceedings of the Cigre SC A2 & 6th International Colloquium Transformer Research and Asset Management (ICTRAM), Split, Croatia, 29 November–2 December 2023. [Google Scholar]
- Bastos, G.M.; Breckenridge, T.; Lamb, M.; MacArthur, T.L.; Ryder, S. Transformer and Reactor Procurement; CIGRE Green Books (CIGREGB); Springer: Cham, Switzerland, 2022. [Google Scholar]
- Hirsch, M. Predicting Failures with EPRI’s Transmission Asset Database. Available online: https://eprijournal.com/predicting-failures-with-epris-transmission-asset-database/ (accessed on 19 December 2023).
- Krieg, T.; Finn, J. Substations; CIGRE Green Books (CIGREGB); Springer: Cham, Switzerland, 2019. [Google Scholar]
- Putchala, S.R.; Kotha, R.; Guda, V.; Ramadevi, Y. Transformer Data Analysis for Predictive Maintenance. In Proceedings of the Second International Conference on Advances in Computer Engineering and Communication Systems: ICACECS 2021, Hyderabad, India, 13–14 August 2022; pp. 217–230. [Google Scholar]
- Singh, J.; Singh, S. Transformer failure analysis: Reasons and methods. Int. J. Eng. Res. Technol. 2016, 4, 1–5. [Google Scholar]
- Ko, E.H.; Dokic, T.; Kezunovic, M. Prediction model for the distribution transformer failure using correlation of weather data. In Proceedings of the 5th International Colloquium on Transformer Research and Asset Management, Opatija, Croatia, 9–12 October 2019; pp. 135–144. [Google Scholar]
- Pudlo, G.; Tenbohlen, S.; Linders, M.; Krost, G. Integration of power transformer monitoring and overload calculation into the power system control surface. In Proceedings of the IEEE/PES Transmission and Distribution Conference and Exhibition, Yokohama, Japan, 6–10 October 2002; Volume 1, pp. 470–474. [Google Scholar]
- Al-Ali, A.R.; Khaliq, A.; Arshad, M. GSM-based distribution transformer monitoring system. In Proceedings of the 12th IEEE Mediterranean Electrotechnical Conference (IEEE Cat. No. 04CH37521), Dubrovnik, Croatia, 12–15 May 2004; Volume 3, pp. 999–1002. [Google Scholar]
- Yu, D.; Zhang, W.; Wang, H. Research on Transformer Voiceprint Anomaly Detection Based on Data-Driven. Energies 2023, 16, 2151. [Google Scholar] [CrossRef]
- Bai, J.; Chen, J.; Wang, M.; Ayub, M.S.; Yan, Q. SSDPT: Self-supervised dual-path transformer for anomalous sound detection. Digit. Signal Process. 2023, 135, 103939. [Google Scholar] [CrossRef]
- Jia, Z.; Wang, S.; Zhao, K.; Li, Z.; Yang, Q.; Liu, Z. An efficient diagnostic strategy for intermittent faults in electronic circuit systems by enhancing and locating local features of faults. Meas. Sci. Technol. 2023, 35, 036107. [Google Scholar] [CrossRef]
- Fuhrmann, F.; Diwold, K.; Waikat, J.; Gaugl, J.; Belavic, F.; Graf, F. X-AMINOR: A Mobile Multi-Sensor Platform for Lifecycle-Monitoring of Transformers. In Proceedings of the SMARTGREENS, Prague, Czech Republic, 26–28 April 2023; pp. 121–128. [Google Scholar]
- National Grid Uses Robots for Interconnector Maintenance. Available online: https://transformers-magazine.com/tm-news/national-grid-uses-robots-for-interconnector-maintenance/ (accessed on 19 December 2023).
- Waikat, J.; Jelidi, A.; Lic, S.; Sopidis, G.; Kähler, O.; Maly, A.; Pestana, J.; Fuhrmann, F.; Belavic, F. Preliminary Results by a Multi-Sensor Robot for the Lifecycle Monitoring of Transformers. In Proceedings of the Cigre SC A2 & 6th International Colloquium Transformer Research and Asset Management (ICTRAM), Split, Croatia, 29 November–2 December 2023. [Google Scholar]
- Force, J.T. Security and Privacy Controls for Information Systems and Organizations; Technical report; National Institute of Standards and Technology: Gaithersburg, MD, USA, 2017. [Google Scholar]
- OASIS Standard. MQTT Version 3.1.1. 2014. Available online: http://docs.oasis-open.org/mqtt/mqtt/v3.1.1/os/mqtt-v3.1.1-os.html (accessed on 19 December 2023).
- Huang, X.; Mei, G.; Zhang, J. Cross-source point cloud registration: Challenges, progress and prospects. Neurocomputing 2023, 548, 126383. [Google Scholar] [CrossRef]
- Choy, C.; Park, J.; Koltun, V. Fully convolutional geometric features. In Proceedings of the IEEE/CVF International Conference on Computer Vision, Seoul, Republic of Korea, 29 October–1 November 2019; pp. 8958–8966. [Google Scholar]
- Yang, H.; Shi, J.; Carlone, L. Teaser: Fast and certifiable point cloud registration. IEEE Trans. Robot. 2020, 37, 314–333. [Google Scholar] [CrossRef]
- Li, Y.; Yan, X.; Wang, C.; Yang, Q.; Zhang, C. Eddy Current Loss Effect in Foil Winding of Transformer Based on Magneto-Fluid-Thermal Simulation. IEEE Trans. Magn. 2019, 55, 8401705. [Google Scholar] [CrossRef]
- Chen, Y.; Yang, Q.; Zhang, C.; Li, Y.; Li, X. Thermal Network Model of High-Power Dry-Type Transformer Coupled with Electromagnetic Loss. IEEE Trans. Magn. 2022, 58, 8402105. [Google Scholar] [CrossRef]
- Adapa, R.; Douglass, D.A. Dynamic thermal ratings: Monitors and calculation methods. In Proceedings of the 2005 IEEE Power Engineering Society Inaugural Conference and Exposition in Africa, Durban, South Africa, 11–15 July 2005; pp. 163–167. [Google Scholar]
- Lai, W.; Li, W.; Meng, H.; Ding, R.; Wang, Y.; Fang, S. Research on the relation between load coefficient and hot spot temperature of oil-immersed power transformer. In Proceedings of the 2019 IEEE International Conference on Power, Intelligent Computing and Systems (ICPICS), Shenyang, China, 12–14 July 2019; pp. 393–396. [Google Scholar]
- Daminov, I.; Rigo-Mariani, R.; Caire, R.; Prokhorov, A.; Alvarez-Hérault, M.C. Demand Response coupled with Dynamic Thermal Rating for increased transformer reserve and lifetime. Energies 2021, 14, 1378. [Google Scholar] [CrossRef]
- Jiale, H.; En, L.; Bingjie, T.; Ming, L. Reading recognition method of analog measuring instruments based on improved hough transform. In Proceedings of the IEEE 2011 10th International Conference on Electronic Measurement & Instruments, Chengdu, China, 16–19 August 2011; Volume 3, pp. 337–340. [Google Scholar]
- Zheng, W.; Yin, H.; Wang, A.; Fu, P.; Liu, B. Development of an automatic reading method and software for pointer instruments. In Proceedings of the 2017 First International Conference on Electronics Instrumentation & Information Systems (EIIS), Harbin, China, 3–5 June 2017; pp. 1–6. [Google Scholar]
- Wu, X.; Shi, X.; Jiang, Y.; Gong, J. A high-precision automatic pointer meter reading system in low-light environment. Sensors 2021, 21, 4891. [Google Scholar] [CrossRef] [PubMed]
- Fang, Y.; Dai, Y.; He, G.; Qi, D. A mask RCNN based automatic reading method for pointer meter. In Proceedings of the 2019 Chinese Control Conference (CCC), Guangzhou, China, 27–30 July 2019; pp. 8466–8471. [Google Scholar]
- Zuo, L.; He, P.; Zhang, C.; Zhang, Z. A robust approach to reading recognition of pointer meters based on improved mask-RCNN. Neurocomputing 2020, 388, 90–101. [Google Scholar] [CrossRef]
- Redmon, J.; Divvala, S.; Girshick, R.; Farhadi, A. You only look once: Unified, real-time object detection. In Proceedings of the IEEE Conference on Computer Vision and Pattern Recognition, Las Vegas, NV, USA, 26 June–1 July 2016; pp. 779–788. [Google Scholar]
- Kirillov, A.; Mintun, E.; Ravi, N.; Mao, H.; Rolland, C.; Gustafson, L.; Xiao, T.; Whitehead, S.; Berg, A.C.; Lo, W.Y.; et al. Segment anything. arXiv 2023, arXiv:2304.02643. [Google Scholar]
- Besl, P.J.; McKay, N.D. Method for registration of 3-D shapes. In Proceedings of the Sensor Fusion IV: Control Paradigms and Data Structures, Boston, MA, USA, 12–15 November 1991; Volume 1611, pp. 586–606. [Google Scholar]
- Chen, Y.; Medioni, G. Object modelling by registration of multiple range images. Image Vis. Comput. 1992, 10, 145–155. [Google Scholar] [CrossRef]
- Segal, A.; Haehnel, D.; Thrun, S. Generalized-ICP. In Proceedings of the Robotics: Science and Systems, Seattle, WA, USA, 28 June–1 July 2009; Volume 2, p. 435. [Google Scholar]
- Ma, L.; Ren, C.; Wang, J.; Liu, T.; Yang, H.; Wang, Y.; Huang, Y.; Zhang, D. Self-reporting coatings for autonomous detection of coating damage and metal corrosion: A review. Chem. Eng. J. 2021, 421, 127854. [Google Scholar] [CrossRef]
- Reddy, M.S.B.; Ponnamma, D.; Sadasivuni, K.K.; Aich, S.; Kailasa, S.; Parangusan, H.; Ibrahim, M.; Eldeib, S.; Shehata, O.; Ismail, M.; et al. Sensors in advancing the capabilities of corrosion detection: A review. Sens. Actuators Phys. 2021, 332, 113086. [Google Scholar] [CrossRef]
- Vorobel, R.; Ivasenko, I.; Berehulyak, O.; Mandzii, T. Segmentation of rust defects on painted steel surfaces by intelligent image analysis. Autom. Constr. 2021, 123, 103515. [Google Scholar] [CrossRef]
- Corrosion Instance Segmentation Dataset. Available online: https://universe.roboflow.com/cawilai-interns-july-2023/corrosion-instance-segmentation-sfcpc (accessed on 19 December 2023).
- Sachdeva, R.; Zisserman, A. The Change You Want to See (Now in 3D). In Proceedings of the IEEE/CVF International Conference on Computer Vision, Paris, France, 2–6 October 2023; pp. 2060–2069. [Google Scholar]
- Icosahedron. Available online: https://en.wikipedia.org/wiki/Icosahedron (accessed on 19 December 2023).
- Van Trees, H.L. Detection, Estimation, and Modulation Theory, Part 4: Optimum Array Processing; John Wiley & Sons: Hoboken, NJ, USA, 2002. [Google Scholar]
- Elko, G.W.; Meyer, J. Microphone arrays. In Springer Handbook of Speech Processing; Springer: Berlin/Heidelberg, Germany, 2008; pp. 1021–1041. [Google Scholar]
- Fuhrmann, F.; Maly, A.; Blass, M.; Waikat, J.; Belavic, F.; Graf, F. 3D acoustic heat-maps for transformer monitoring applications. In Proceedings of the Cigre SC A2 & 6th International Colloquium Transformer Research and Asset Management (ICTRAM), Split, Croatia, 29 November– 2 December 2023. [Google Scholar]


Disclaimer/Publisher’s Note: The statements, opinions and data contained in all publications are solely those of the individual author(s) and contributor(s) and not of MDPI and/or the editor(s). MDPI and/or the editor(s) disclaim responsibility for any injury to people or property resulting from any ideas, methods, instructions or products referred to in the content. |
© 2024 by the authors. Licensee MDPI, Basel, Switzerland. This article is an open access article distributed under the terms and conditions of the Creative Commons Attribution (CC BY) license (https://creativecommons.org/licenses/by/4.0/).