1. Introduction
Current environmental concerns and increasing energy needs mean that alternative fuels such as hydrogen and compressed natural gas (CNG) have emerged as potential solutions to decarbonizing energy systems [
1,
2,
3,
4]. These energy carriers, stored and transported in composite cylinders, are crucial to the evolution of green transportation and stationary power systems. The complex process of filling composite cylinders with hydrogen and CNG underlies the performance, safety, and efficiency of these systems, which requires a detailed investigation. This research paper aims to consider operational aspects associated with the hydrogen and CNG filling process to composite cylinders (type IV) which are recognized for their superior strength-to-weight ratio, durability, and corrosion resistance. The filling process for these cylinders remains a subject of research and optimization, particularly in relation to hydrogen and CNG—gases with diverse physical properties and inherent challenges.
The hydrogen filling process for composite cylinders involves unique technical challenges due to the gas’s lower density, higher diffusivity, and potential for embrittlement [
5]. On the other hand, filling these cylinders with CNG, primarily composed of methane, necessitates a thorough understanding of its own set of characteristics including high energy content, volatility, and safety [
6,
7].
A few researchers and research groups have tackled the challenge of modeling and conducting thermodynamic analysis of the process of filling cylinders with hydrogen.
Li et al. developed a lumped-parameter model for the filling process and obtained several time-independent temperature evolution curves [
1]. Bourgeois et al. presented the spatial distribution of temperatures and the dependence of final gas temperatures in relation to fuel conditions [
8]. Sapre et al. investigated the adiabatic simulation of the type IV tank with a nominal working pressure of 70 MPa in the refueling process, taking into account the refueling conditions at the station [
9]. Li et al. performed theoretical analysis, experiments, and simulations, focusing on initial pressure and temperature, filling rate, and ambient temperature during the fast-filling process [
10]. Caponi et al. analyzed tank-to-tank refueling operations and compared single-tank storage with a multi-tank cascade system [
11]. In 2021, Kang et al. investigated a lightweight type IV vessel with a polyethylene terephthalate (PET) liner. A parametric study was performed for charging strategies [
12]. Liu et al. determined that the hydrogen gas temperature increase reaches the highest value at the end of rapid filling, and is higher in a type IV cylinder compared to a type III cylinder [
13]. In their carefully designed study, Ruffio et al. provided a thermodynamic analysis of the refueling of a gaseous fuel tank which compares the temperature and pressure evolutions obtained from a different EOS [
14]. Cho et al. performed experimental studies on the internal phenomena of the developed cylinder during the filling process (pressure and temperature monitoring during filling and cycling tests) [
15,
16]. Melideo et al. provided a comprehensive comparison between experiments and simulation results for (i) gas temperature inside the tank, (ii) temperature at the interface between the liner and the composite material, and (iii) temperatures on the surface [
17]. Galassi et al. performed CFD simulations for hydrogen fast filling (up to 70 MPa) to evaluate the hydrogen temperature inside the tank during this process [
18]. Although there is a focus on modeling the process of filling cylinders with hydrogen [
19,
20,
21,
22,
23], some studies have also explored the thermodynamic parameters involved in the rapid filling of cylinders with compressed natural gas (types III and IV) [
24,
25,
26,
27,
28,
29,
30,
31]. This research, therefore, serves to critically analyze, compare, and provide new insights into the operational intricacies of hydrogen and CNG filling processes, contributing towards more efficient, safer, and cost-effective strategies for high-pressure gas storage in composite cylinders. A comparative study is particularly significant as it not only elucidates the distinct characteristics and requirements of each gas but also provides a comprehensive foundation for decision-making in applications where both hydrogen and CNG are viable options.
This research primarily aims to examine the impacts of hydrogen, methane, and their mixtures on an Alternative Fuel Vehicle (AFV) onboard cylinder during rapid filling. The calculation of the thermodynamic properties of gas samples is conducted using the GERG-2008 equation of state (EOS) and established thermodynamic relationships. The assumption made is that a lightweight cylinder is connected to a single reservoir tank during the filling process. A theoretical model, founded on mass and energy balance, was developed to analyze the thermodynamic properties, specifically focusing on the changes in pressure within the cylinder during the filling, the Joule–Thomson coefficient, gas temperature in the cylinder, mass flow rate during filling, accumulated mass in the cylinder, entropy generation, and energy stored in the cylinder. Analysis was performed for selected gas samples, variant tank volumes, and selected time steps during the filling process. This study aims to bridge existing gaps in knowledge and contribute to future developments in the field of high-pressure gas storage. The main novelty of the article is a detailed analysis of the process of filling a composite tank with pure hydrogen and mixtures of methane and hydrogen, the use of a hydrogen-blended natural gas mixture for use in Alternative Fuel Vehicles (AFVs), and the examination of the variability of parameters during the process of rapid refueling of compressed natural gas depending on the hydrogen content. A maximum hydrogen content of 23% in natural gas is assumed due to safety reasons for combustion conditions in end devices [
32]. This is the maximum level of hydrogen content in a mixture with methane that can be considered natural gas for CNG refueling stations. Despite greater interest in hydrogen in recent years, relatively few works have been written in this field. Moreover, the analysis was performed based on the GERG-2008 model, not previously used in other works.
4. Methodology
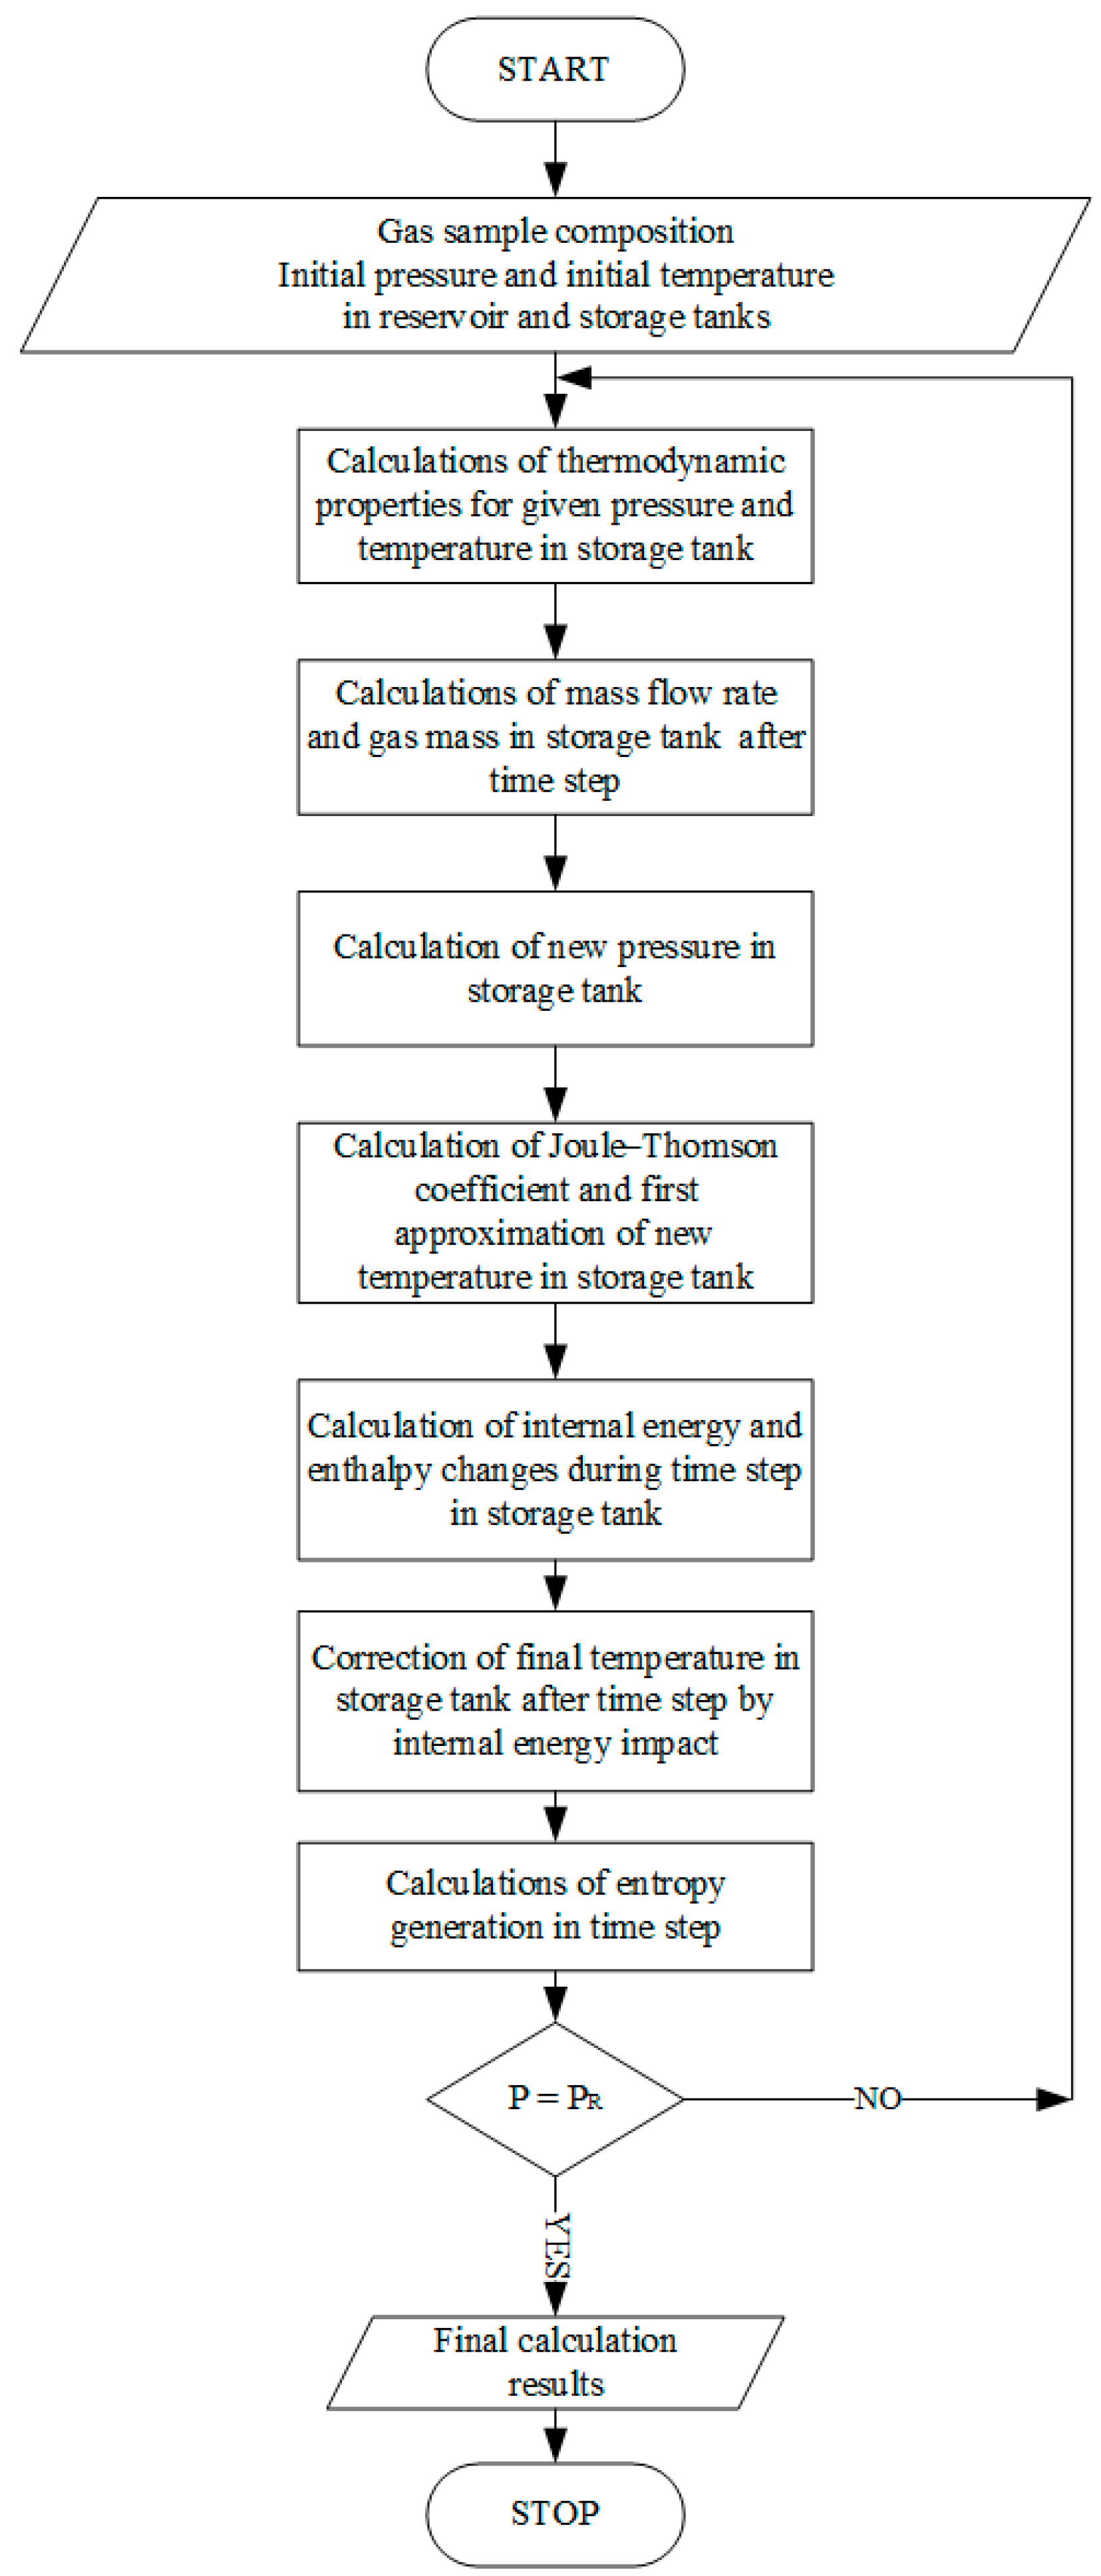
The calculation procedure starts with the indication of the gas sample’s initial conditions (pressure and temperature) in the storage composite tank and reservoir supply tank. Other thermodynamic properties (e.g., compressibility factor, gas density, Joule–Thomson coefficient) in the initial state, during the filling process, and in the final state are calculated using the GERG-2008 equation of state. After the initial parameters are calculated, the gas mass flow into the storage tank and the gas mass in the composite storage tank are calculated after a time step. On this basis, the new pressure in the tank is determined, and then the Joule–Thomson ratio after a time step is calculated. After these calculations, it is possible to determine the temperature in the storage tank after a time step resulting from the J–T effect. Next, the temperature in the tank is corrected after determining the changes in the internal energy of the gas. In the last stage, the level of entropy generation for the obtained pressure and temperature values is determined. These calculations are continued until the final condition—the pressure in the composite tank equals the pressure in the supply tank—is reached. A simplified calculation scheme is presented in
Figure 3.
4.1. Type IV Composite Tank Fast-Filling Process Thermodynamic Analysis
To conduct calculations and formulate a thermodynamic model for the rapid-filling process of alternative fuel, it should be assumed that a composite tank (type IV), installed in an Alternative Fuel Vehicle (AFV), operates as an open thermodynamic system undergoing a quasistatic filling process. The determination of specific thermodynamic parameters involved the application of the continuity equation and the first law of thermodynamics. It was assumed that the type IV composite tank maintains a constant volume and possesses only one entry point (inlet). A full description of the thermodynamic analysis of the composite tank fast-filling process is presented in our previous work [
24].
4.2. Determining Gas Thermodynamic Properties
As discussed in the previous section of this manuscript, it is crucial to determine several thermodynamic parameters (compressibility factor, density or specific volume, internal energy, and enthalpy) of the selected gas samples to analyze the filling process of the composite tank. The present chapter clarifies the methodologies used for calculating these properties. Detailed procedures for computing most of the thermodynamic parameters of gases can be found in [
24,
26,
27,
42,
43].
4.3. GERG-2008 Equation of State
The European Gas Research Group (GERG) developed the GERG-2008 equation of state, an expansion of the GERG-2004 EOS for a more precise EOS for gases [
44,
45,
46]. The GERG EOS consolidates individual pure gas EOS into a unified equation of state for natural gas mixtures and hydrogen. The GERG-2008 equation of state (EOS) is based on fundamental state equations for each of the 21 pure substances included in the model, in addition to the 210 potential binary mixtures of these components. This makes it a reliable model for multicomponent mixtures, covering 21 of the most frequently encountered components of natural gas, such as hydrogen [
45,
47]. A specific fundamental EOS for hydrogen was developed explicitly for the creation of the GERG-2008 equation of state.
The GERG-2008 equation of state (EOS) has also been established as a standard for calculating the thermodynamic properties of natural gas mixtures [
48,
49]; its primary objective is to calculate the compressibility factor. The GERG-2008 equation of state (EOS) is recognized for its applicability in two distinct ranges: the normal and the extended [
49]. The normal range encompasses the temperature and pressure within the ranges of 90 K ≤ T ≤ 450 K and P ≤ 35 MPa. Additionally, the extended range covers the temperature and pressure within 60 K ≤ T ≤ 700 K and P ≤ 70 MPa.
The fluid model in the presented analysis to compute thermodynamic parameters was based on the GERG-2008 equation of state. This equation relies on an explicit multi-component approximation of the reduced Helmholtz free energy, denoted as α:
where
—dimensionless form of Helmholtz free energy, -.
—dimensionless reduced density of the mixture, -.
—dimensionless inverse reduced temperature of the mixture, -.
ρr—reduced density.
Tr—reduced temperature.
The superscripts
o and
r refer to the ideal and reduced parts of Helmholtz free energy [
44,
45]. The term
signifies the properties of an ideal gas mixture for a given molar density (
), temperature (
), and molar composition (
) of the mixture with
components, as expressed by the following equation:
In Equation (2), the reduced Helmholtz energy of the ideal gas state of component
is given by the following:
where
—the critical density of the pure component, kg/m3.
—the critical temperature of the pure component, K.
R—universal gas constant, .
= 8.314510/8.314472.
The coefficients
and
in Equation (3) were adopted from Kunz 2012 [
45]. Within the framework of a multi-fluid approximation, the residual part of the reduced Helmholtz free energy of the mixture (
) can be expressed as follows:
The reduced critical parameters of the mixture are combined using the following mixing principles:
The first term in Equation (20) represents the residual Helmholtz free energy contribution of the individual components
, which is detailed in Equation (7).
The second term in Equation (4) represents the departure function and relies on the binary mixture proportion of components
[
45] as follows:
The function in Equation (8) is given by Equation (9) as follows:
and can represent binary mixtures (generalized departure function). All coefficients
,
,
,
,
, and exponents
,
,
,
,
,
,
,
,
, are provided by Kunz and Wagner and have been adjusted using data for binary mixtures (specifically hydrogen and methane) [
39]. The coefficient
is suitable to the binary data specific to each particular mixture. It is assigned a value of zero for binary mixtures where no departure function has been established. In conclusion, the formula for determining the compressibility factor (
Z) of natural gases according to the GERG-2008 equation of state is described as follows (10):
where
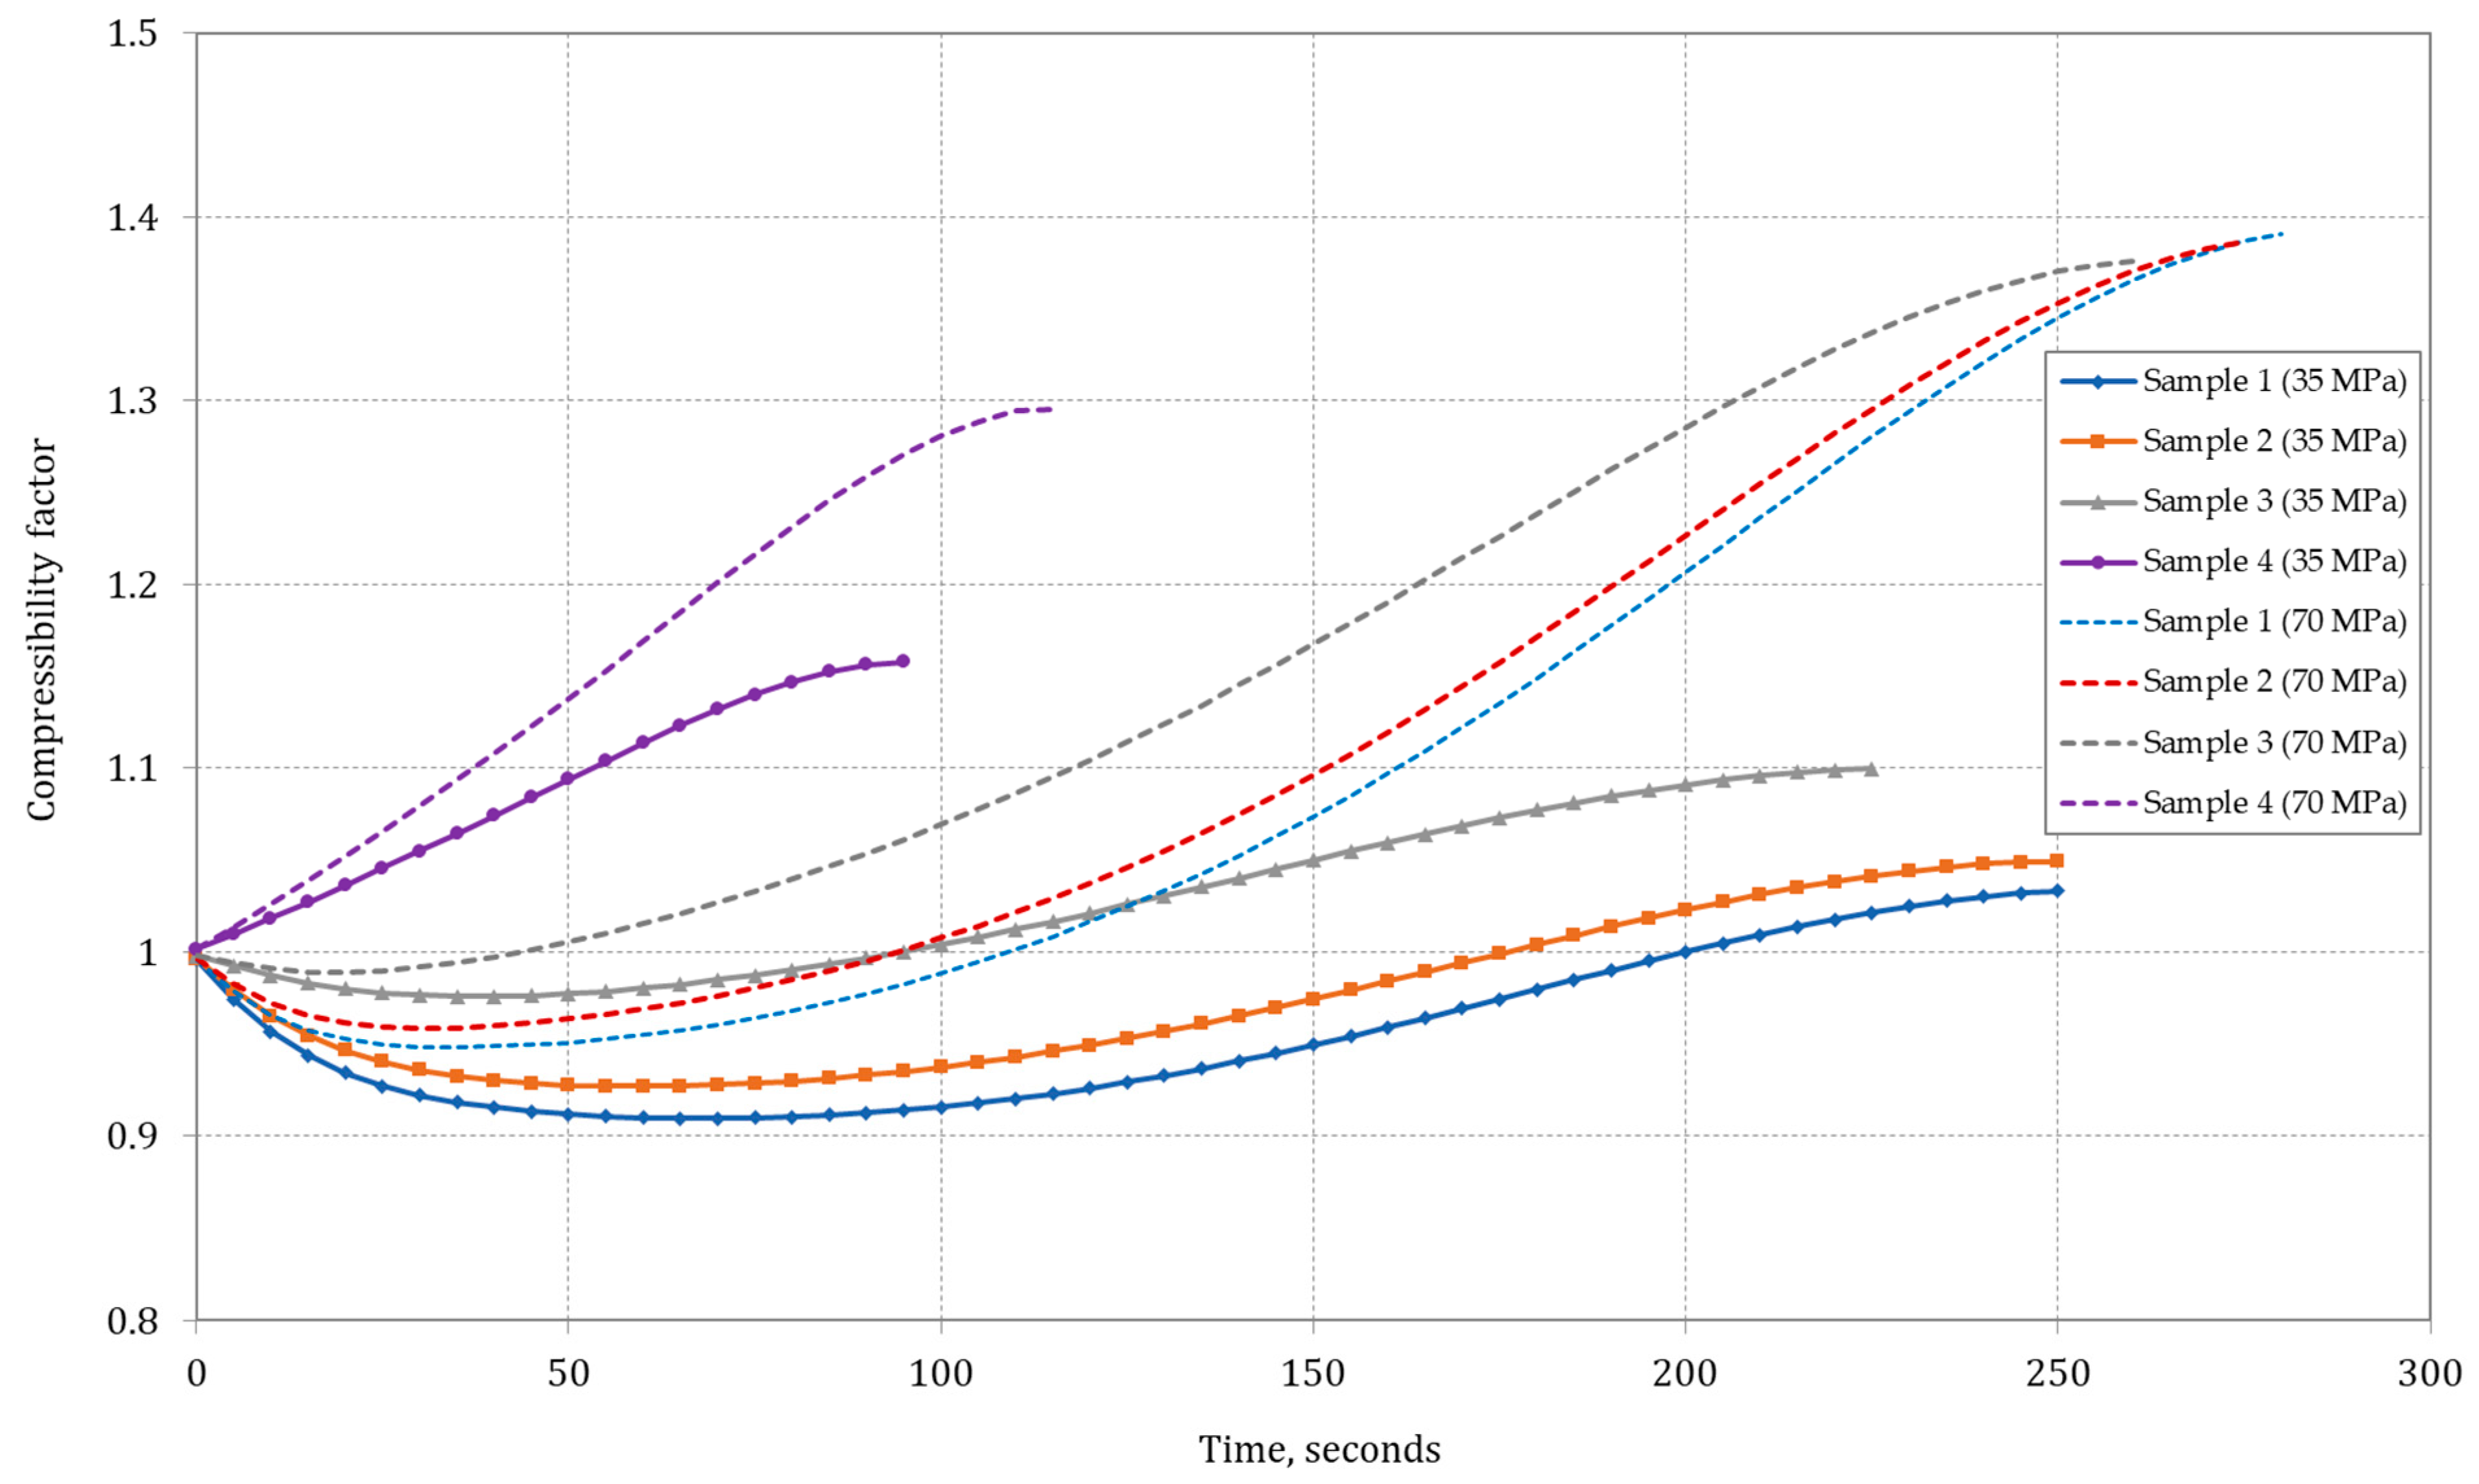
Figure 4 shows the computed variations in the compressibility factor (
Z) tank filling with the hydrogen/methane gas samples.
4.4. Joule–Thomson Coefficient Calculation
In general application, the Joule–Thomson coefficient is determined based on the following relationship:
where
where
Cp—isobaric heat capacity,
H—enthalpy,
v—specific volume,
P—pressure,
T—temperature,
ρ—density.
The Joule–Thomson coefficient was calculated using the GERG-2008 EOS in accordance with ISO 20765-2 [
49]; it is given in Equation (14) as follows:
The correlation between the Joule–Thomson coefficient and the reduced Helmholtz energy and its derivatives was calculated with the following equation [
48,
49]:
where α—dimensionless form of Helmholtz free energy,
δ—dimensionless reduced density of the mixture,
τ—dimensionless inverse reduced temperature of the mixture.
Calculation of the required derivatives of the reduced Helmholtz energy is necessary to determine the Joule–Thomson coefficient. All the parameters, along with the first and second derivatives of the ideal gas section and the remaining Helmholtz free energy fraction, were determined for use in Equation (15). Subsequently, the Joule–Thomson coefficient was derived. The J–T coefficient should equate to zero for the J–T inversion curve determination, as shown in Equation (16):
The J–T inversion point of the gas at the specified temperature (or specified pressure) was determined using an iterative method. In this procedure, the temperature (or pressure) and the composition of natural gas are iteratively adjusted. The pressure (or temperature) is iteratively approximated until the Joule–Thomson coefficient reaches zero [
44,
48,
49,
50].
4.5. Analysis of the Second Law of Thermodynamics–Entropy Generation
The performed study of the tank-filling process was extended with the issue of entropy generation. In the performed research, utilization of the second law of thermodynamics alongside the description of flow processes within the gas storage system of the filling station enables the evaluation of entropy generation rates for the system’s characteristic nodes [
51].
The formulation of the second law of thermodynamics governing the filling process of onboard cylinders can be expressed as follows:
where
—entropy generation rate,
—heat loss rate,
—initial mass rate,
si—initial specific entropy.
It is assumed that irreversibility in the process arises at the cylinder inlet, suggesting an isentropic expansion from the reservoir tank to the inlet position. By integrating this assumption with the continuity equations and the equation governing heat inflow to the tank, alongside the second law of thermodynamics (Equation (17)), the resultant equation is derived (Equation (18)) as follows:
Considering the onboard cylinder as the control volume and recognizing that the cylinder has only one inlet, the continuity equation (conservation of mass) is expressed as follows:
The heat transfer from the onboard cylinder to the environment can be calculated from the relationship as follows:
The differential equation for an elementary time instant can be written in the following form (21):
The subsequent step involves integrating Equation (21) from the initiation of the filling process to the present moment, as outlined below:
For a refueling station with a single reservoir tank where the entire filling process remains constant, integrating the above equation can be simplified to form as follows:
Adiabatic system
Equation (23) can be simplified for an adiabatic system as written in Equation (24):
and if the cylinder is empty at the beginning of the filling process
, the subsequent relationship can be formulated as follows:
Ideal gas behavior for adiabatic system
For ideal gas behavior, the second law of thermodynamics undergoes significant simplification. With the following assumptions regarding ideal gas:
and if the cylinder volume is known and specific heat and tank temperature are constant, Equation (24) can be simplified as follows:
Under the assumption that the onboard cylinder pressure reaches the reservoir tank pressure, Equation (28) provides the maximum entropy generation for filling stations as follows:
Considering equations
,
and
, the above equation can be further simplified as follows:
where
cv—isochoric heat capacity,
Vc—volume of cylinder,
R—universal gas constant.
It should be noted that Equations (26)–(30) are valid only for filling stations with one tank. The calculation of entropy generation for filling stations with a cascade tank system requires more complicated calculations. In this case, dimensionless entropy (
NS) generation is introduced to compare the results for different configurations as follows:
It is noteworthy that Equation (31) signifies the irreversibility of the process within the system. Minimization, in this context, refers to reducing the portion of the workload dissipated as heat in the system. Considering that all the necessary work for the system is executed by the compressor, it can be deduced that the minimum corresponds to the lowest amount of work performed by the compressor.
5. Results and Discussion
This study examines a scenario wherein a composite tank is installed in an AFV and is treated as an adiabatic system. With this assumption, the orifice diameter and the mass flow rate at the composite tank’s inlet do not affect the final in-cylinder temperature and pressure. The orifice diameter is fixed at 1 mm, and the discharge coefficient of the orifice (at the inlet to the composite tank), denoted as Cd, is assumed to be 1.
Results of the performed analysis are presented for a 50 L composite cylinder (type IV) for which selected individual thermodynamic parameters in a function of filling time are discussed: (i) pressure change in the cylinder during filling, (ii) Joule–Thomson coefficient, (iii) gas temperature in the cylinder, (iv) mass flow rate during filling, (v) accumulated mass in the cylinder, (vi) entropy generation, and (vii) energy stored in the cylinder. All discussed and presented results below are dedicated to a 50 L composite cylinder (type IV).
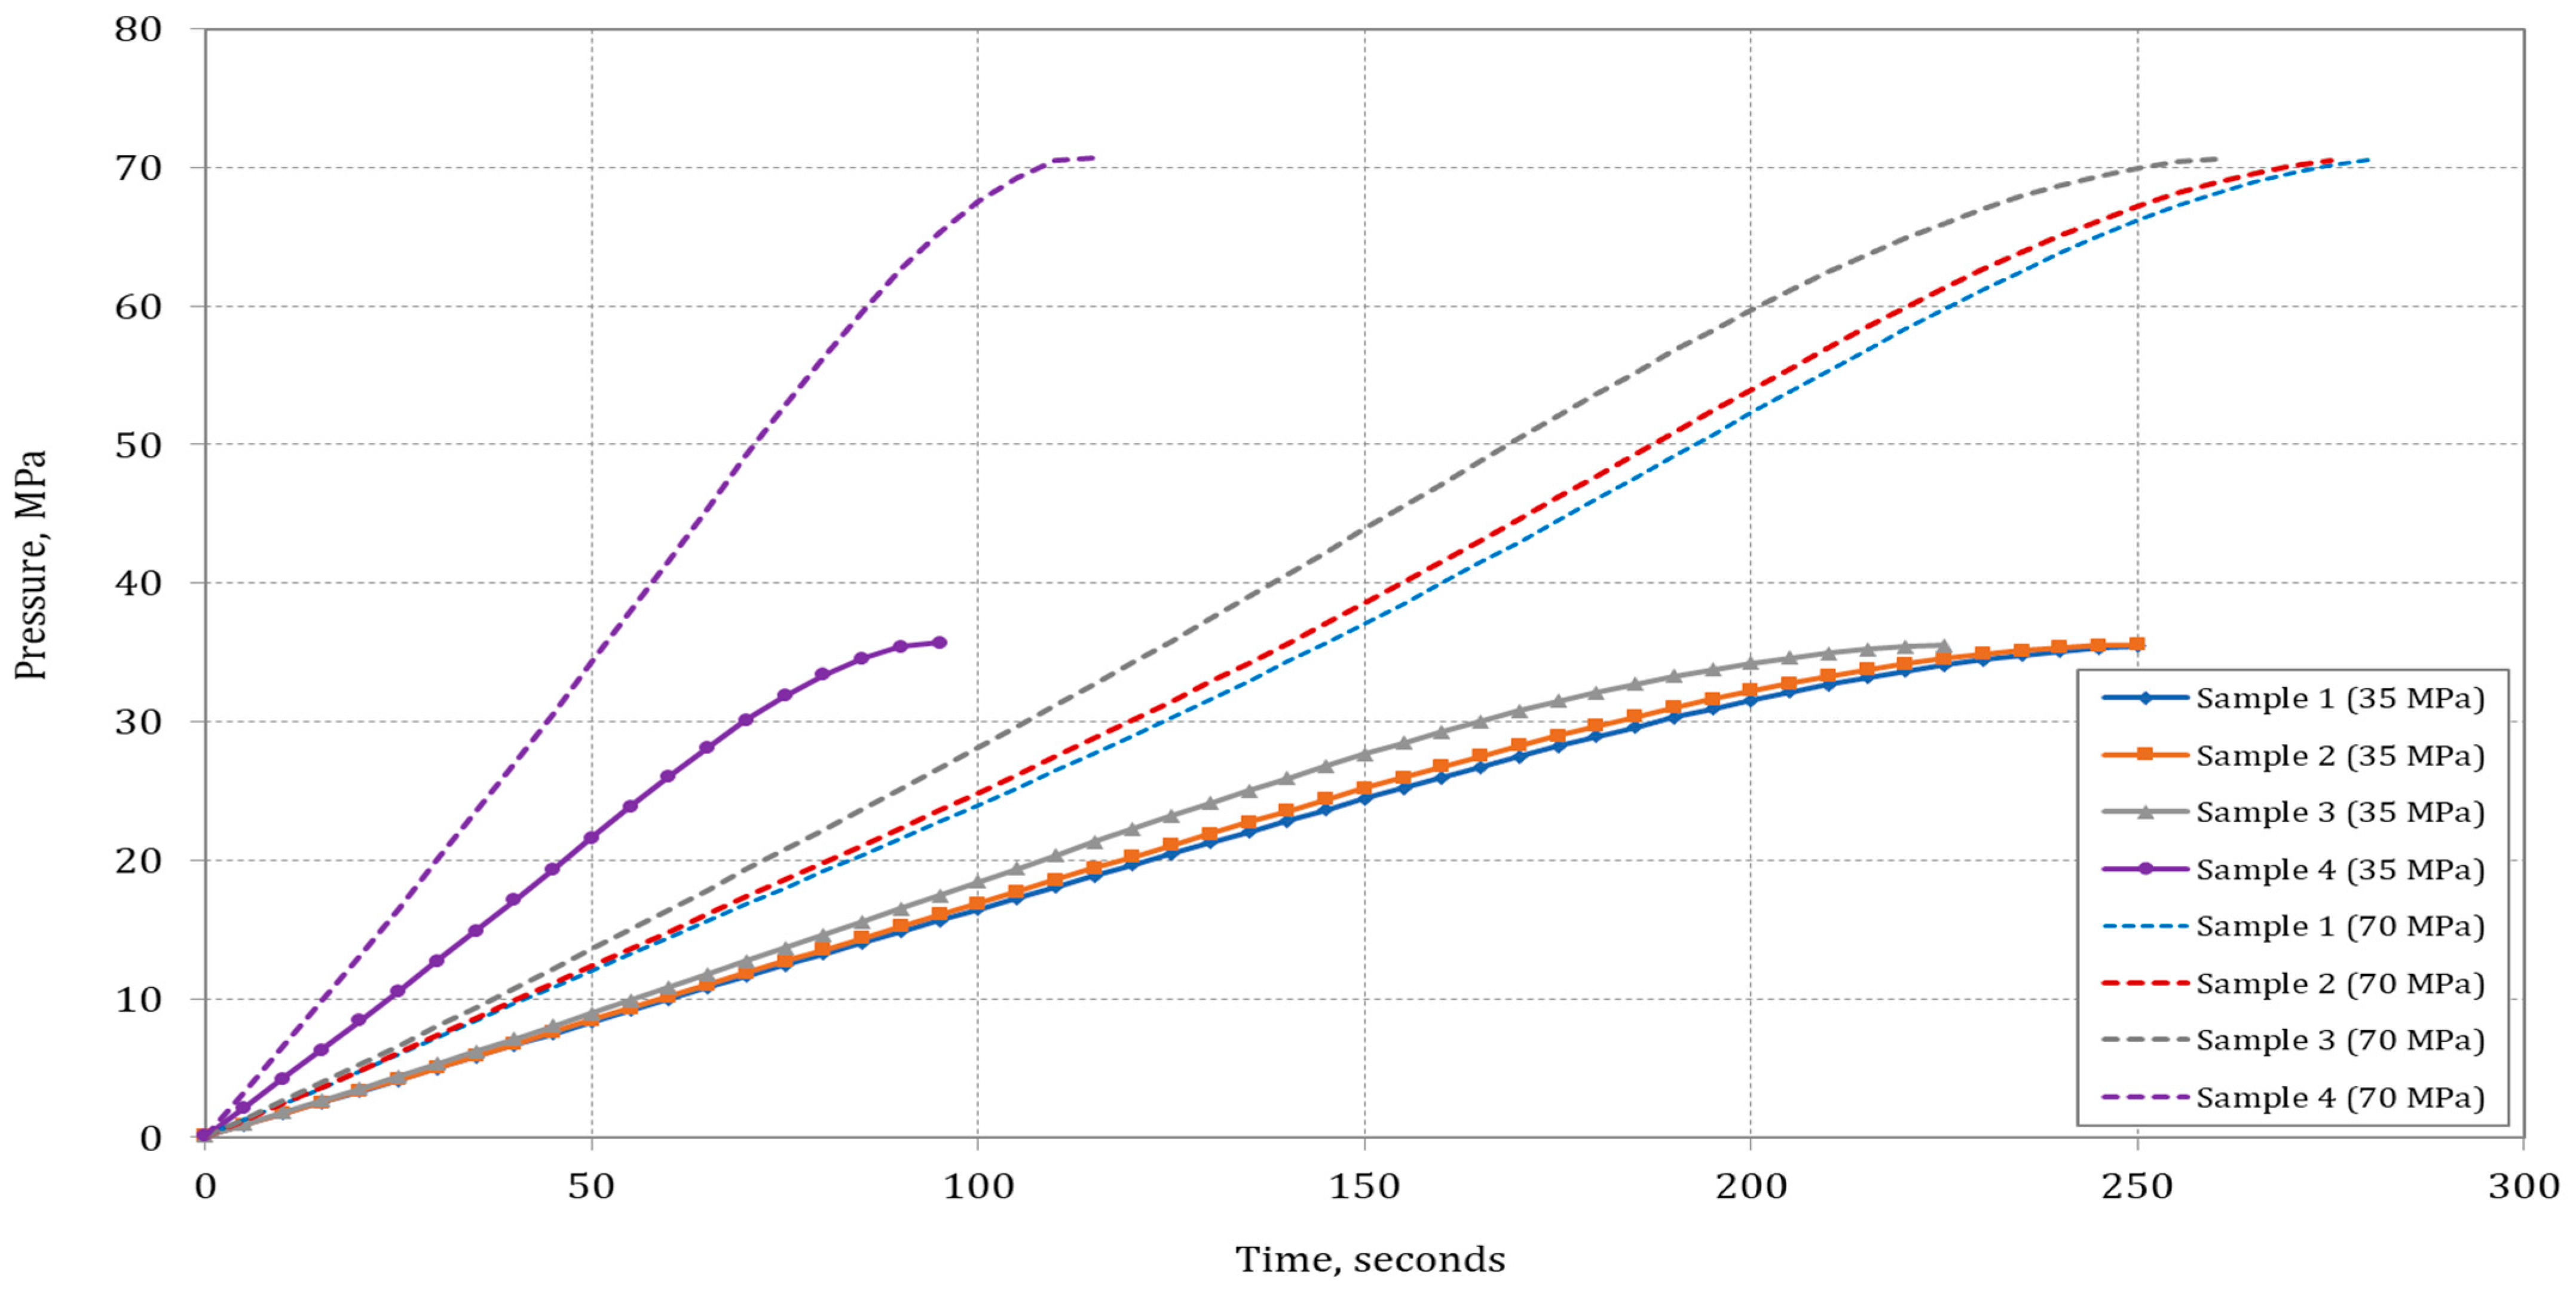
Figure 5 shows the pressure change in the cylinder during the filling process.
The filling process will be completed for Sample 4 in the shortest time for both desired maximum operating pressures (MOPs): the tank will reach 35 MPa in 95 s and for 70 MPa in 115 s. The filling time increases with the decrease in hydrogen content in the blend with methane.
The Joule–Thomson coefficient
plays a crucial role in the rapid-filling process of the composite tank. The temperature of methane, which has the positive values of the
coefficient, decreases during expansion, whereas hydrogen, with a negative
coefficient, heats up. The temperature change in relation to pressure is directly correlated to the value of the Joule–Thomson coefficient
; thus, it is recommended to ascertain this coefficient during the filling process of the composite tank [
24,
29,
30].
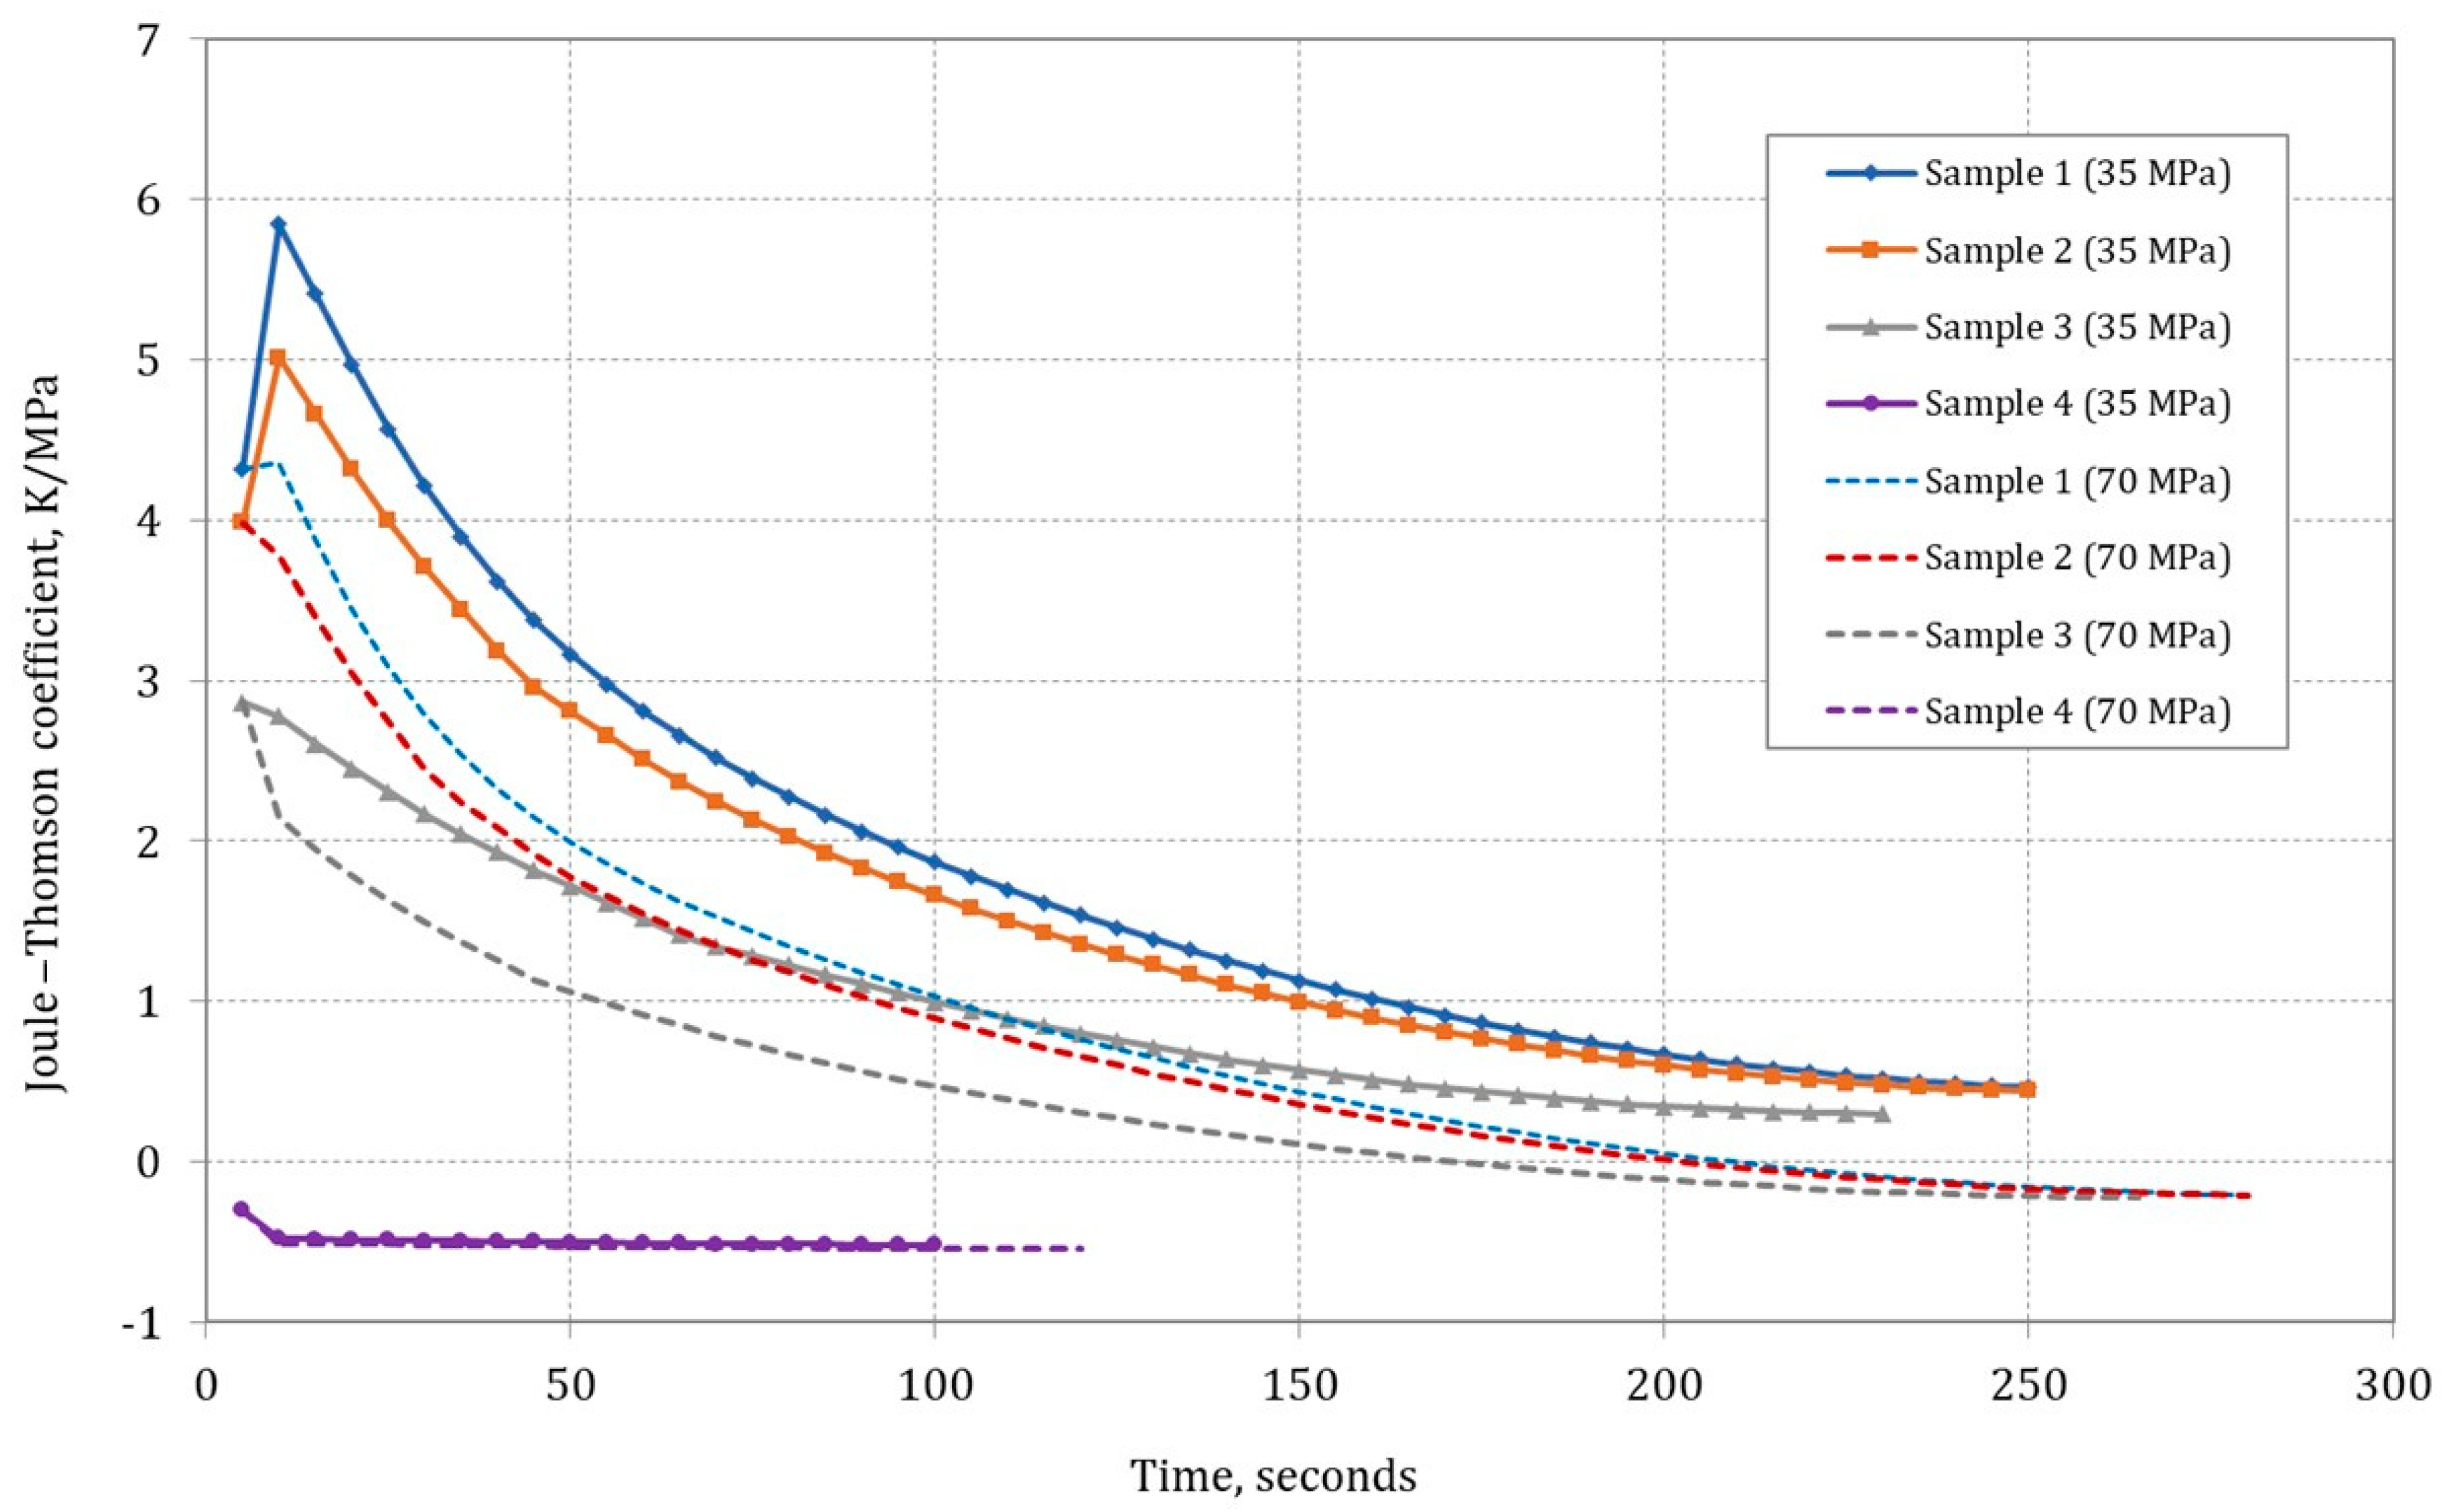
Figure 6 illustrates the impact of gas sample composition on the Joule–Thomson coefficient
in the cylinder throughout the filling process, considering initial conditions of 300 K and 0.101325 MPa.
Data analysis showed that in the initial stage of the type IV composite tank-filling process, there was an increase in the J–T coefficient for Samples 1 and 2 (only for a final pressure of 35 MPa). The J–T coefficient remained positive throughout the filling process, indicating a decrease in gas temperature during isenthalpic expansion. Comparing J–T coefficient values for other gas sample compositions, it was observed that was higher for mixtures with high methane content (high-methane gas). For hydrogen (Sample 4), the J–T coefficient ratio was negative and was the lowest among the analyzed samples.
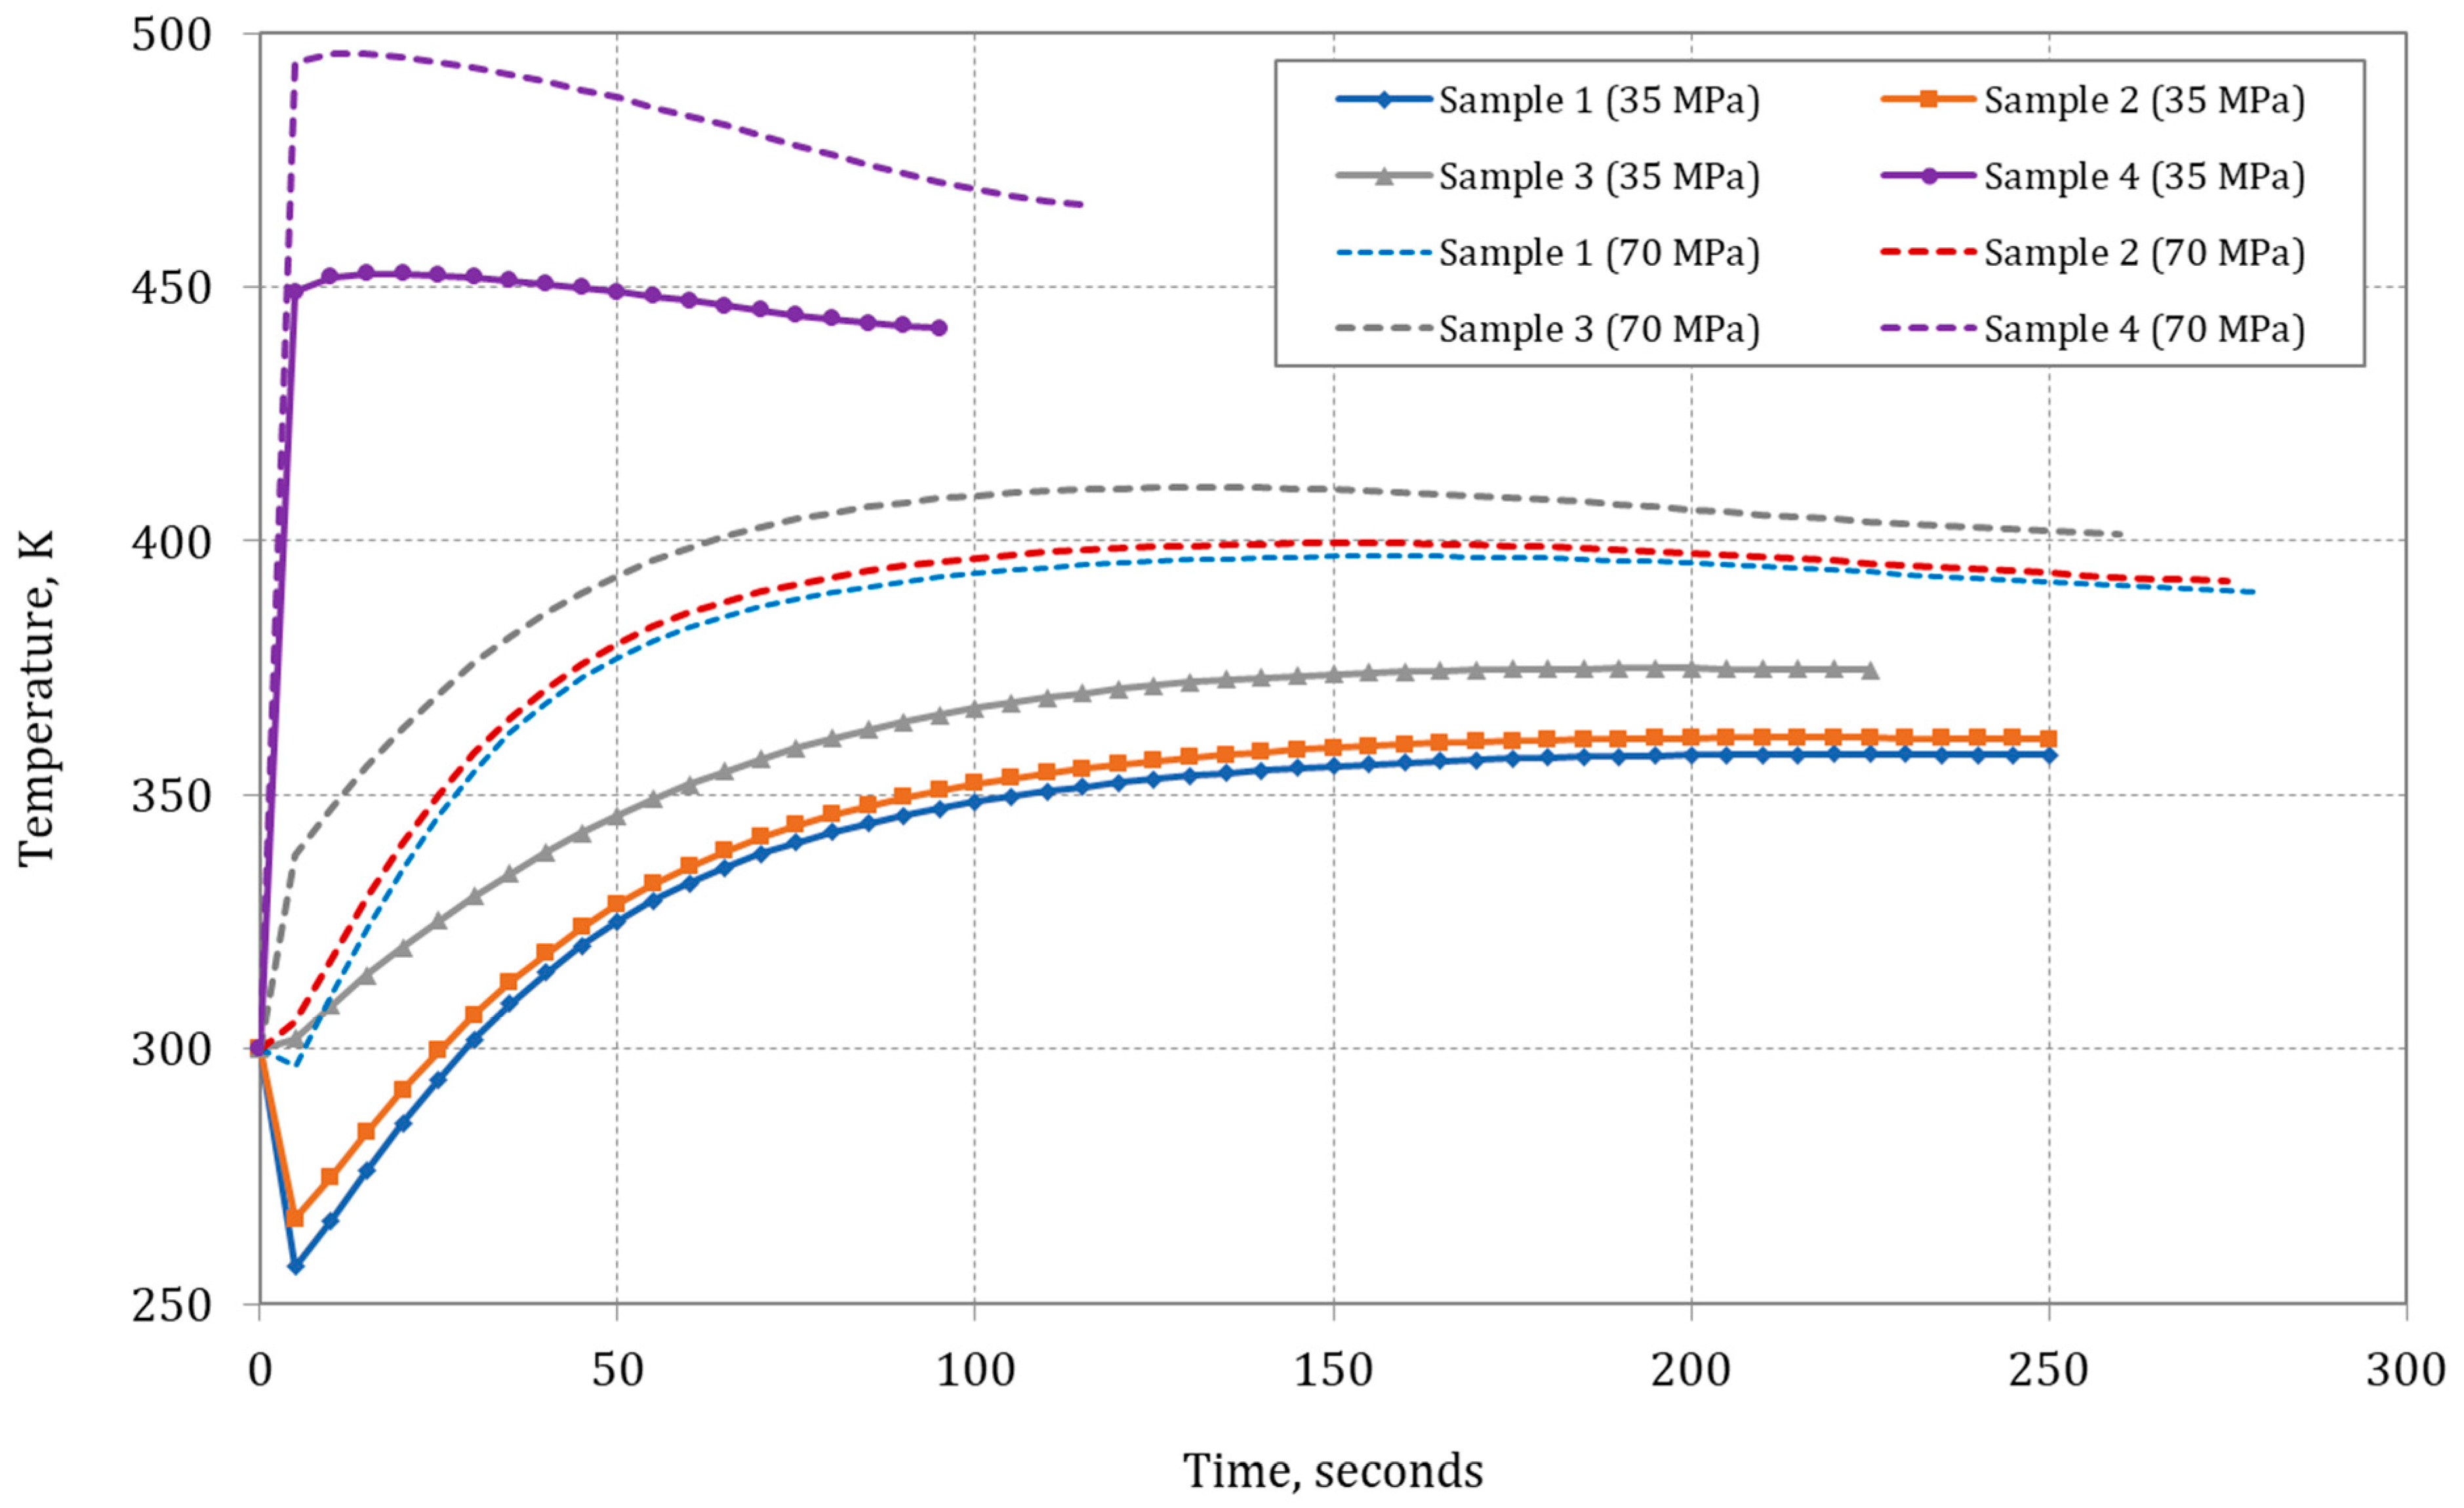
Figure 7 shows how the composition of the methane/hydrogen mixture influences the temperature within the type IV composite tank as the filling process progresses, with initial conditions set at
T = 300 K and
p = 0.101325 MPa. The analysis results indicate a decrease in the temperature of methane (Sample 1) in the composite tank, whereas, for pure hydrogen (Sample 4), the temperature rises rapidly at the onset of the refueling process. The initial decline in methane temperature (Sample 1) at the outset of composite tank filling is ascribed to the Joule–Thomson effect, which takes place during the isenthalpic expansion at the orifice, from the reservoir tank’s inlet pressure of 35.5 MPa to the initial low pressure within the composite tank exceeding 0.101325 MPa [
24,
29,
50]. During the rapid-filling process, the injected gas mixes with the gas initially present in the tank, compressing it. Due to the initially low pressure in the tank, the temperature of methane injected into the tank decreases initially due to isenthalpic expansion.
For methane and methane/hydrogen mixtures with a low molar content of hydrogen, the composite tank’s lowest gas temperature is reached when the highest determined Joule–Thomson coefficient is attained. Once the compression process and the conversion of supplied enthalpy to internal energy in the composite tank surpass the cooling effect of the Joule–Thomson effect (which diminishes with pressure increase in the composite tank), the gas temperature within the composite tank begins to rise. This is particularly noticeable at a filling pressure of 35 MPa; in the case of a pressure of 70 MPa, the increase in temperature related to the compression process quickly counteracts the J–T effect. The gas temperature increases swiftly, particularly because the initial quantity of gas in the composite tank is low and escalates rapidly during the fueling process (
Figure 7). During the fueling process, the rise in gas temperature within the composite tank slightly slows down, which is attributed to the impact of lower ambient temperature and the diminished dynamics of the compression process in the final phase, thereby leading to a decrease in mass fueling efficiency.
Hydrogen has a negative J–T coefficient; therefore, in this case, the initial expansion process causes an increase in temperature, which is then enhanced by the compression effect [
8,
9,
10,
12,
13,
14,
17,
18]. Therefore, in the case of a single-stage filling of the cylinder with hydrogen (Sample 4), a significant increase in the temperature in the tank should be expected, even up to 450–490 K. Filling the cylinder with hydrogen is faster than with methane to a given pressure, which accelerates the effect of temperature increase. In the further stage of the tank-filling process with hydrogen (Sample 4), the pressure increase is lower, and the significant temperature difference between the gas within the tank and the surrounding environment leads to a decrease in the hydrogen temperature inside the cylinder during the final phase of the filling process.
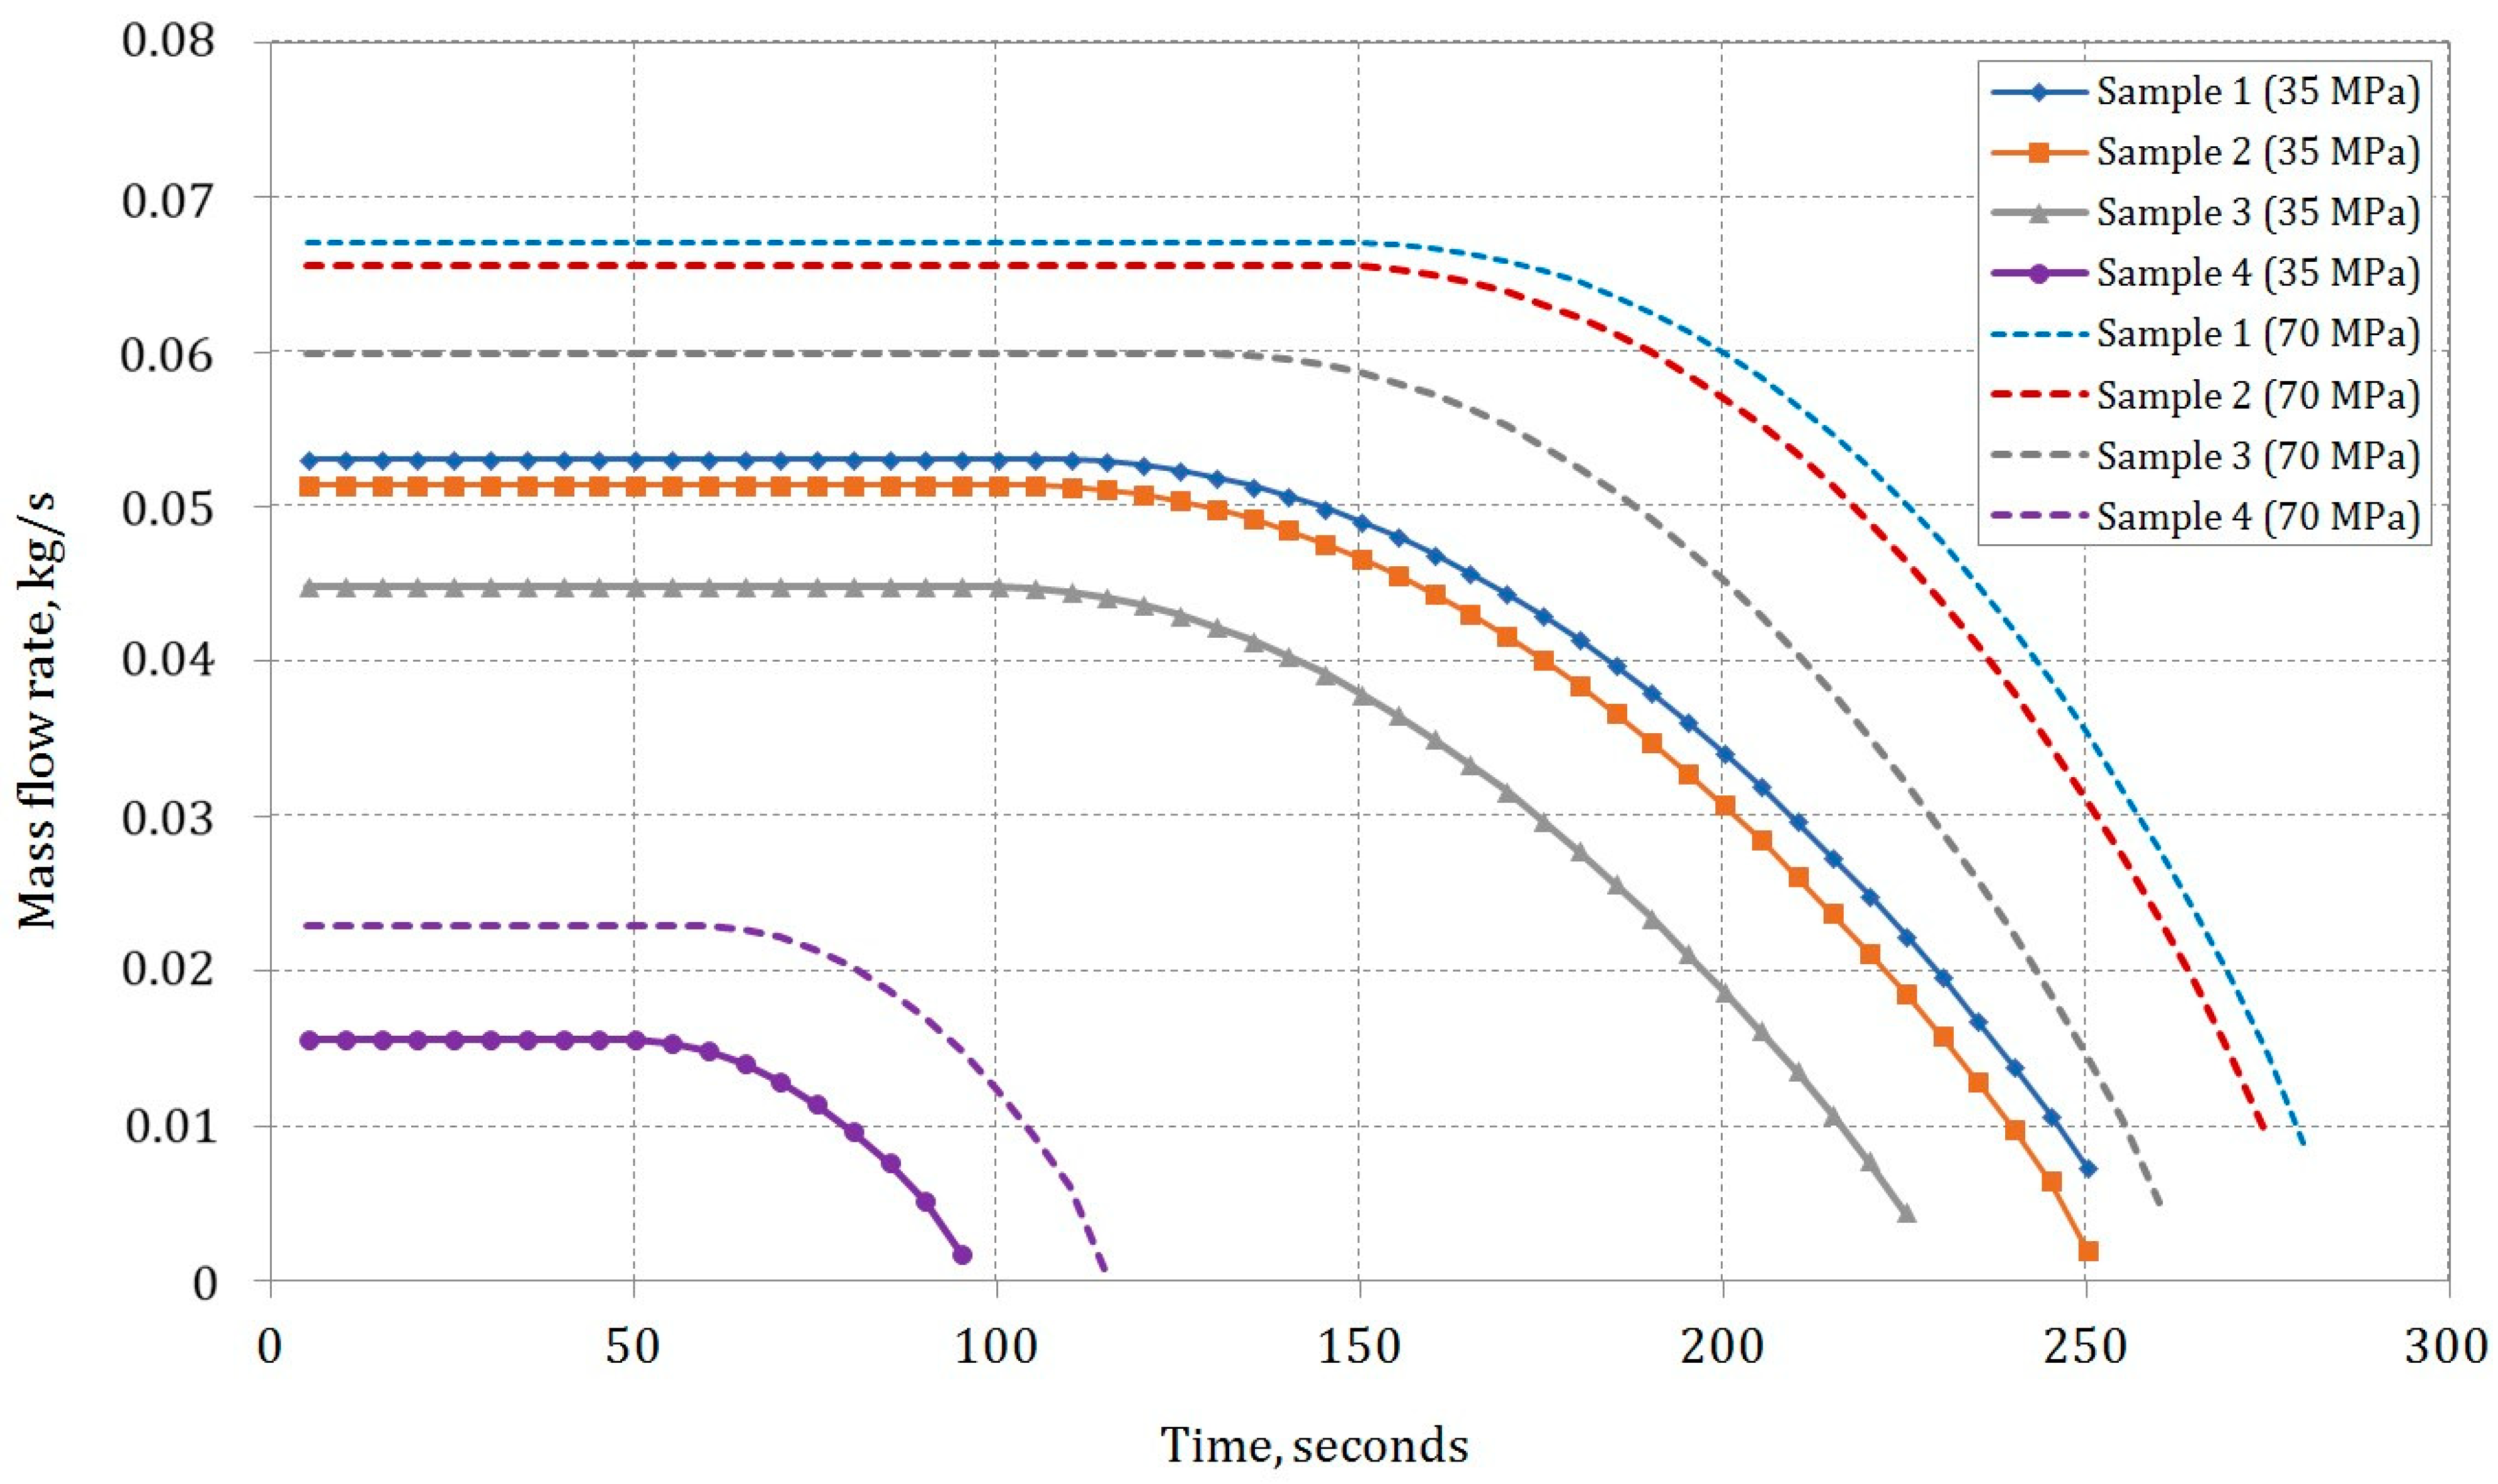
Figure 8 illustrates the mass flow rate profiles during the type IV composite tank-filling process for pure methane (Sample 1), pure hydrogen (Sample 4), and two mixtures of methane and hydrogen (Samples 2 and 3) under initial conditions of ambient temperature
T = 300 K and pressure
p = 0.101325 MPa. During the initial stage of filling, the mass flow rate remains constant due to the formation of a choking effect at the tank inlet orifice. The maximum mass flow rate is observed with pure methane (Sample 1), whereas the lowest is observed for pure hydrogen (Sample 4), owing to the higher density of methane compared to hydrogen.
The results obtained align with findings from prior studies [
24,
26,
27,
28,
29,
52]. The initial mass flow rate for methane is 0.053 kg/s, and for pure hydrogen, it is 0.016 kg/s, with a final pressure in the tank of 35 MPa. For a final pressure of 70 MPa, these rates are 0.067 kg/s and 0.023 kg/s, respectively. The time necessary for hydrogen filling to attain the final pressure (35 or 70 MPa) in the cylinder is roughly 100 s. Noteworthy is the comparatively shorter filling time, which is credited to the utilization of a smaller tank volume in the calculations compared to other studies.
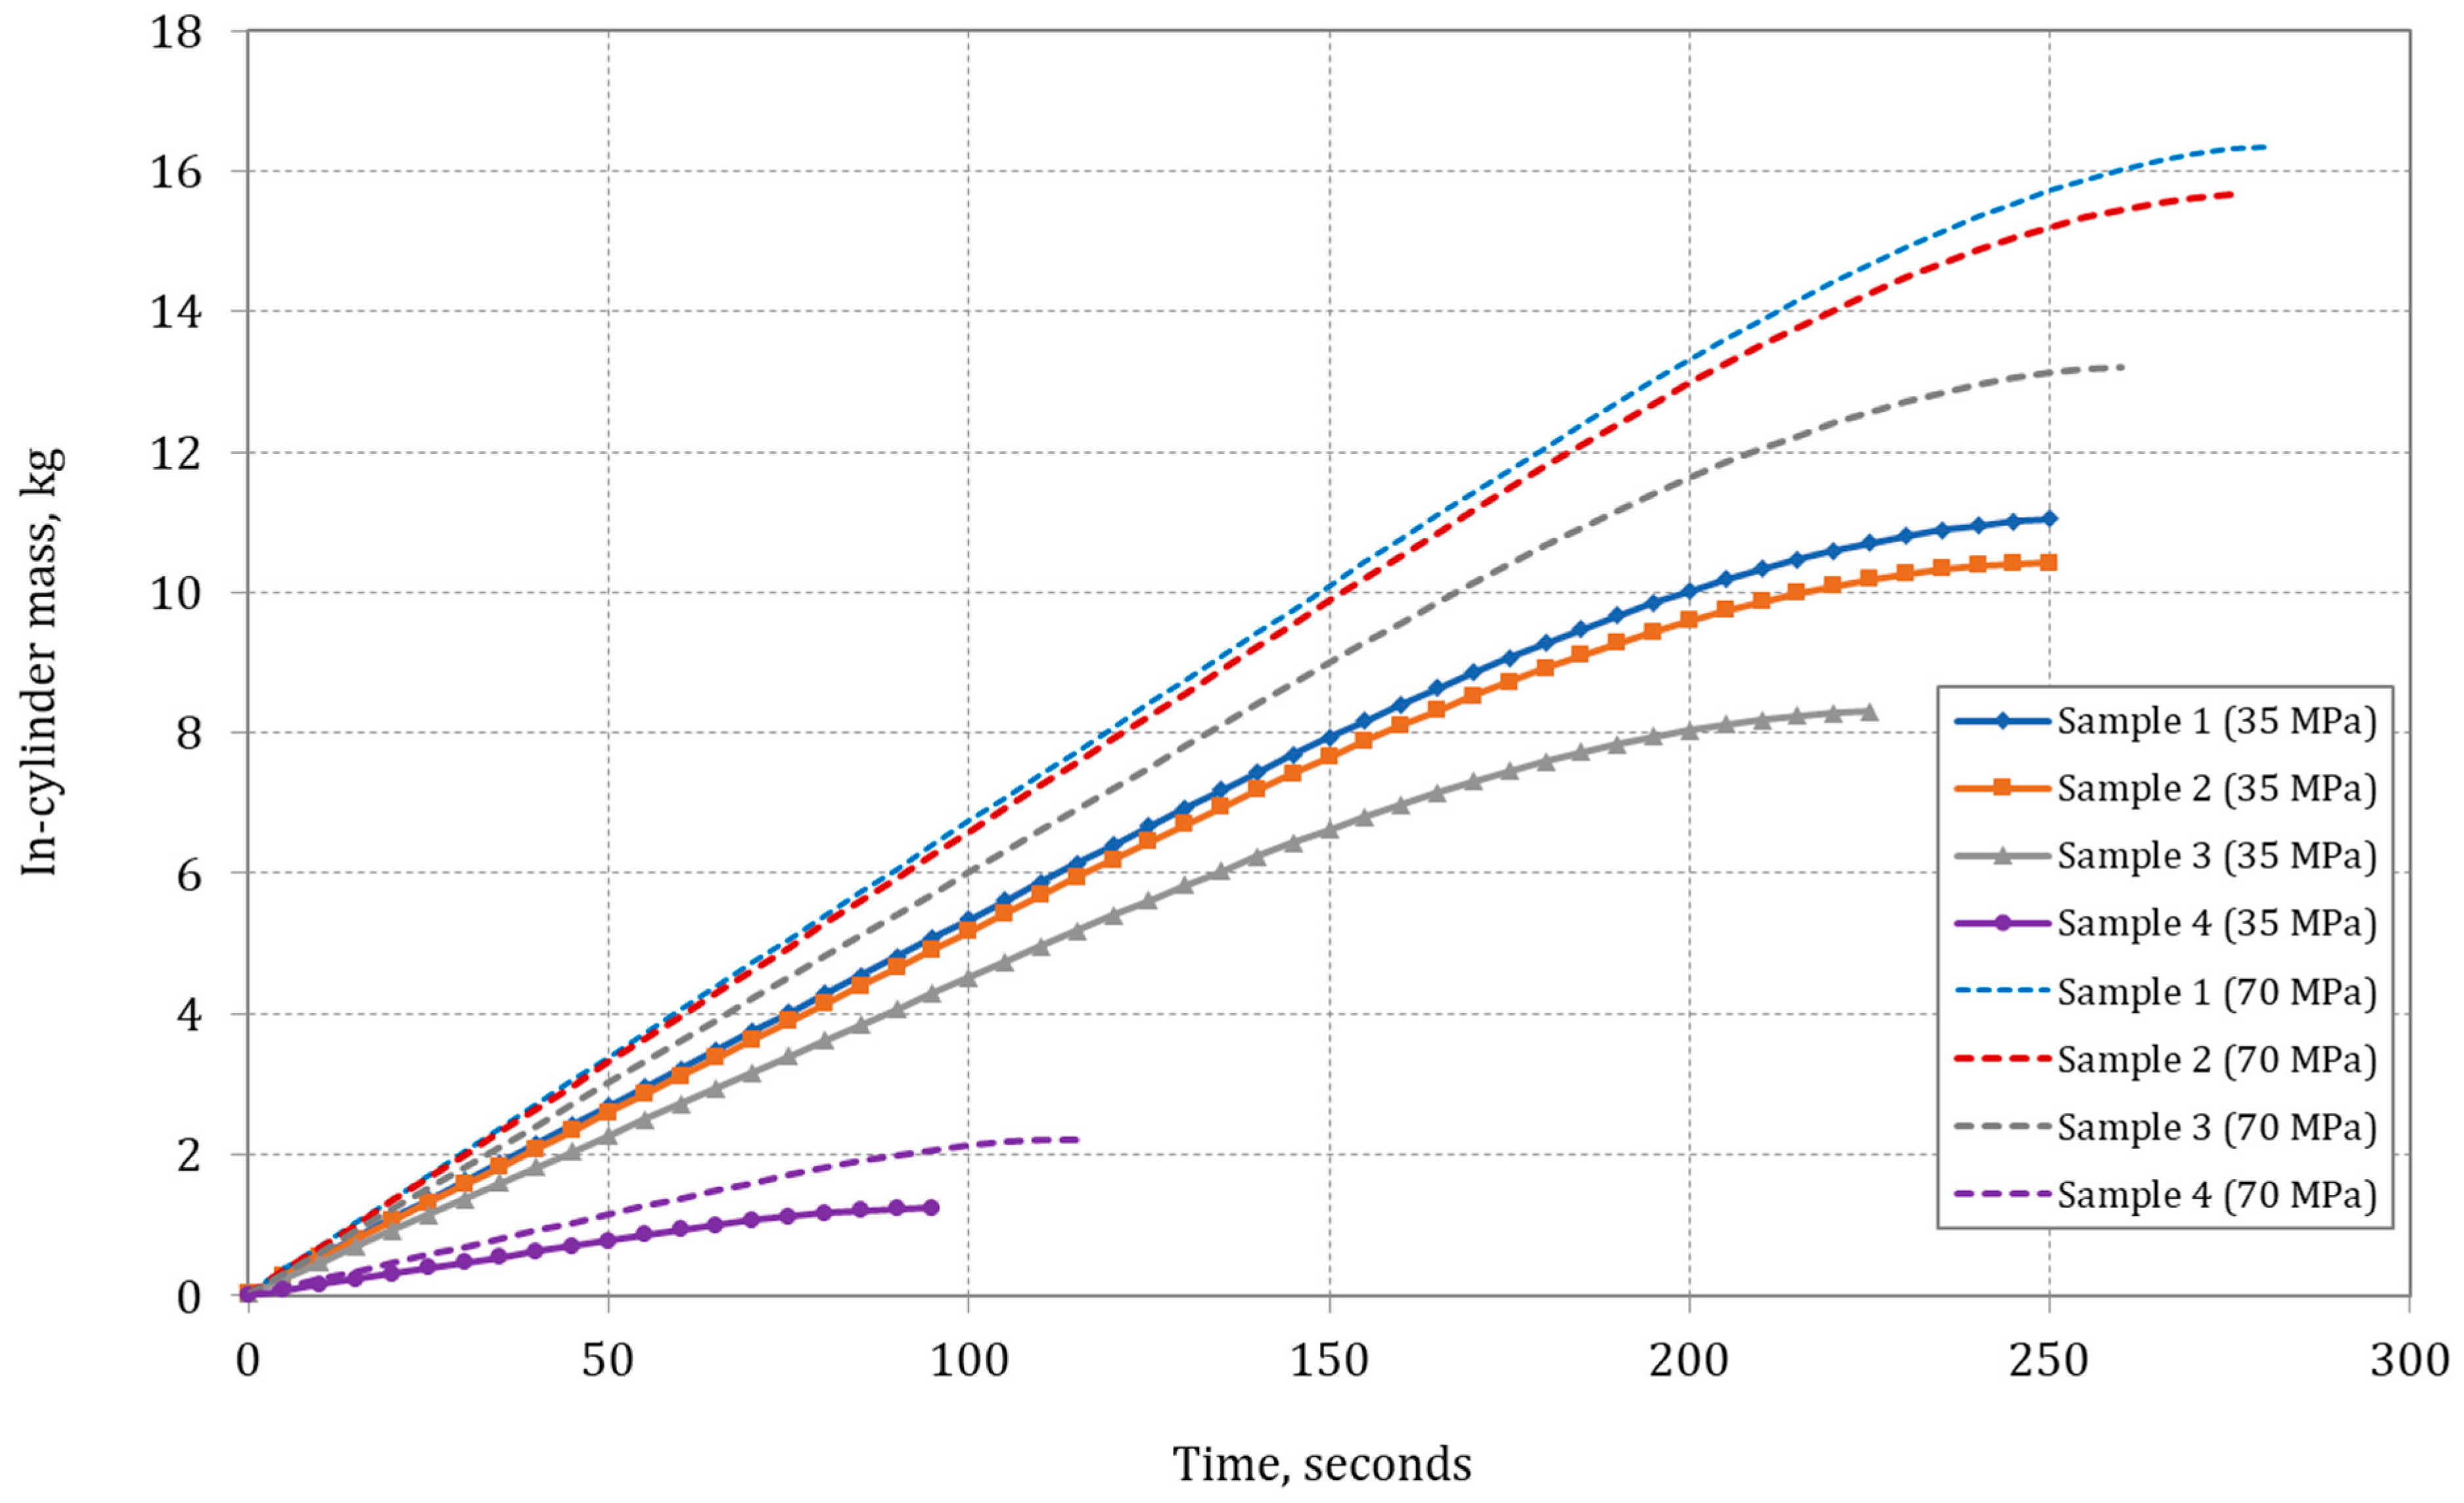
Figure 9 shows the rise in in-cylinder mass during the rapid filling of a composite type IV cylinder. The gas mass within the tank is anticipated to be greater for Sample 1 due to its higher density. For pure hydrogen (Sample 4), the weight of compressed gas is approximately 1.25 kg for a filling pressure of 35 MPa and 2.20 kg for 70 MPa. To highlight differences, theoretical plots for pure methane (11.04 kg for 35 MPa and 16.4 kg for 70 MPa) are included. This relationship underscores the significant influence of the hydrogen and methane mixture composition on the rapid-filling process of a type IV composite tank.
Figure 9 also demonstrates the effect of gas composition on the composite tank-filling time. Distinct time profiles are observed for different mixture compositions. The higher hydrogen content leads to a shorter filling time (Sample 4). Conversely, for mixtures with a higher methane content, the mass accumulated in the cylinder is greater, requiring more time to fill the tank (type IV). These findings align with those presented in other studies [
24,
26,
27,
28,
29]. The final filling time of pure CH
4 (Sample 1) is c.a. 240 s for CNG fueling to 20 MPa, filling to 35 MPa takes about 250 s, and to 70 MPa about 280 s. The small difference is caused by higher pressure in the direct reservoir tank. Hydrogen (Sample 4) filling time is shorter: 95 s for 35 MPa and 115 s for 70 MPa.
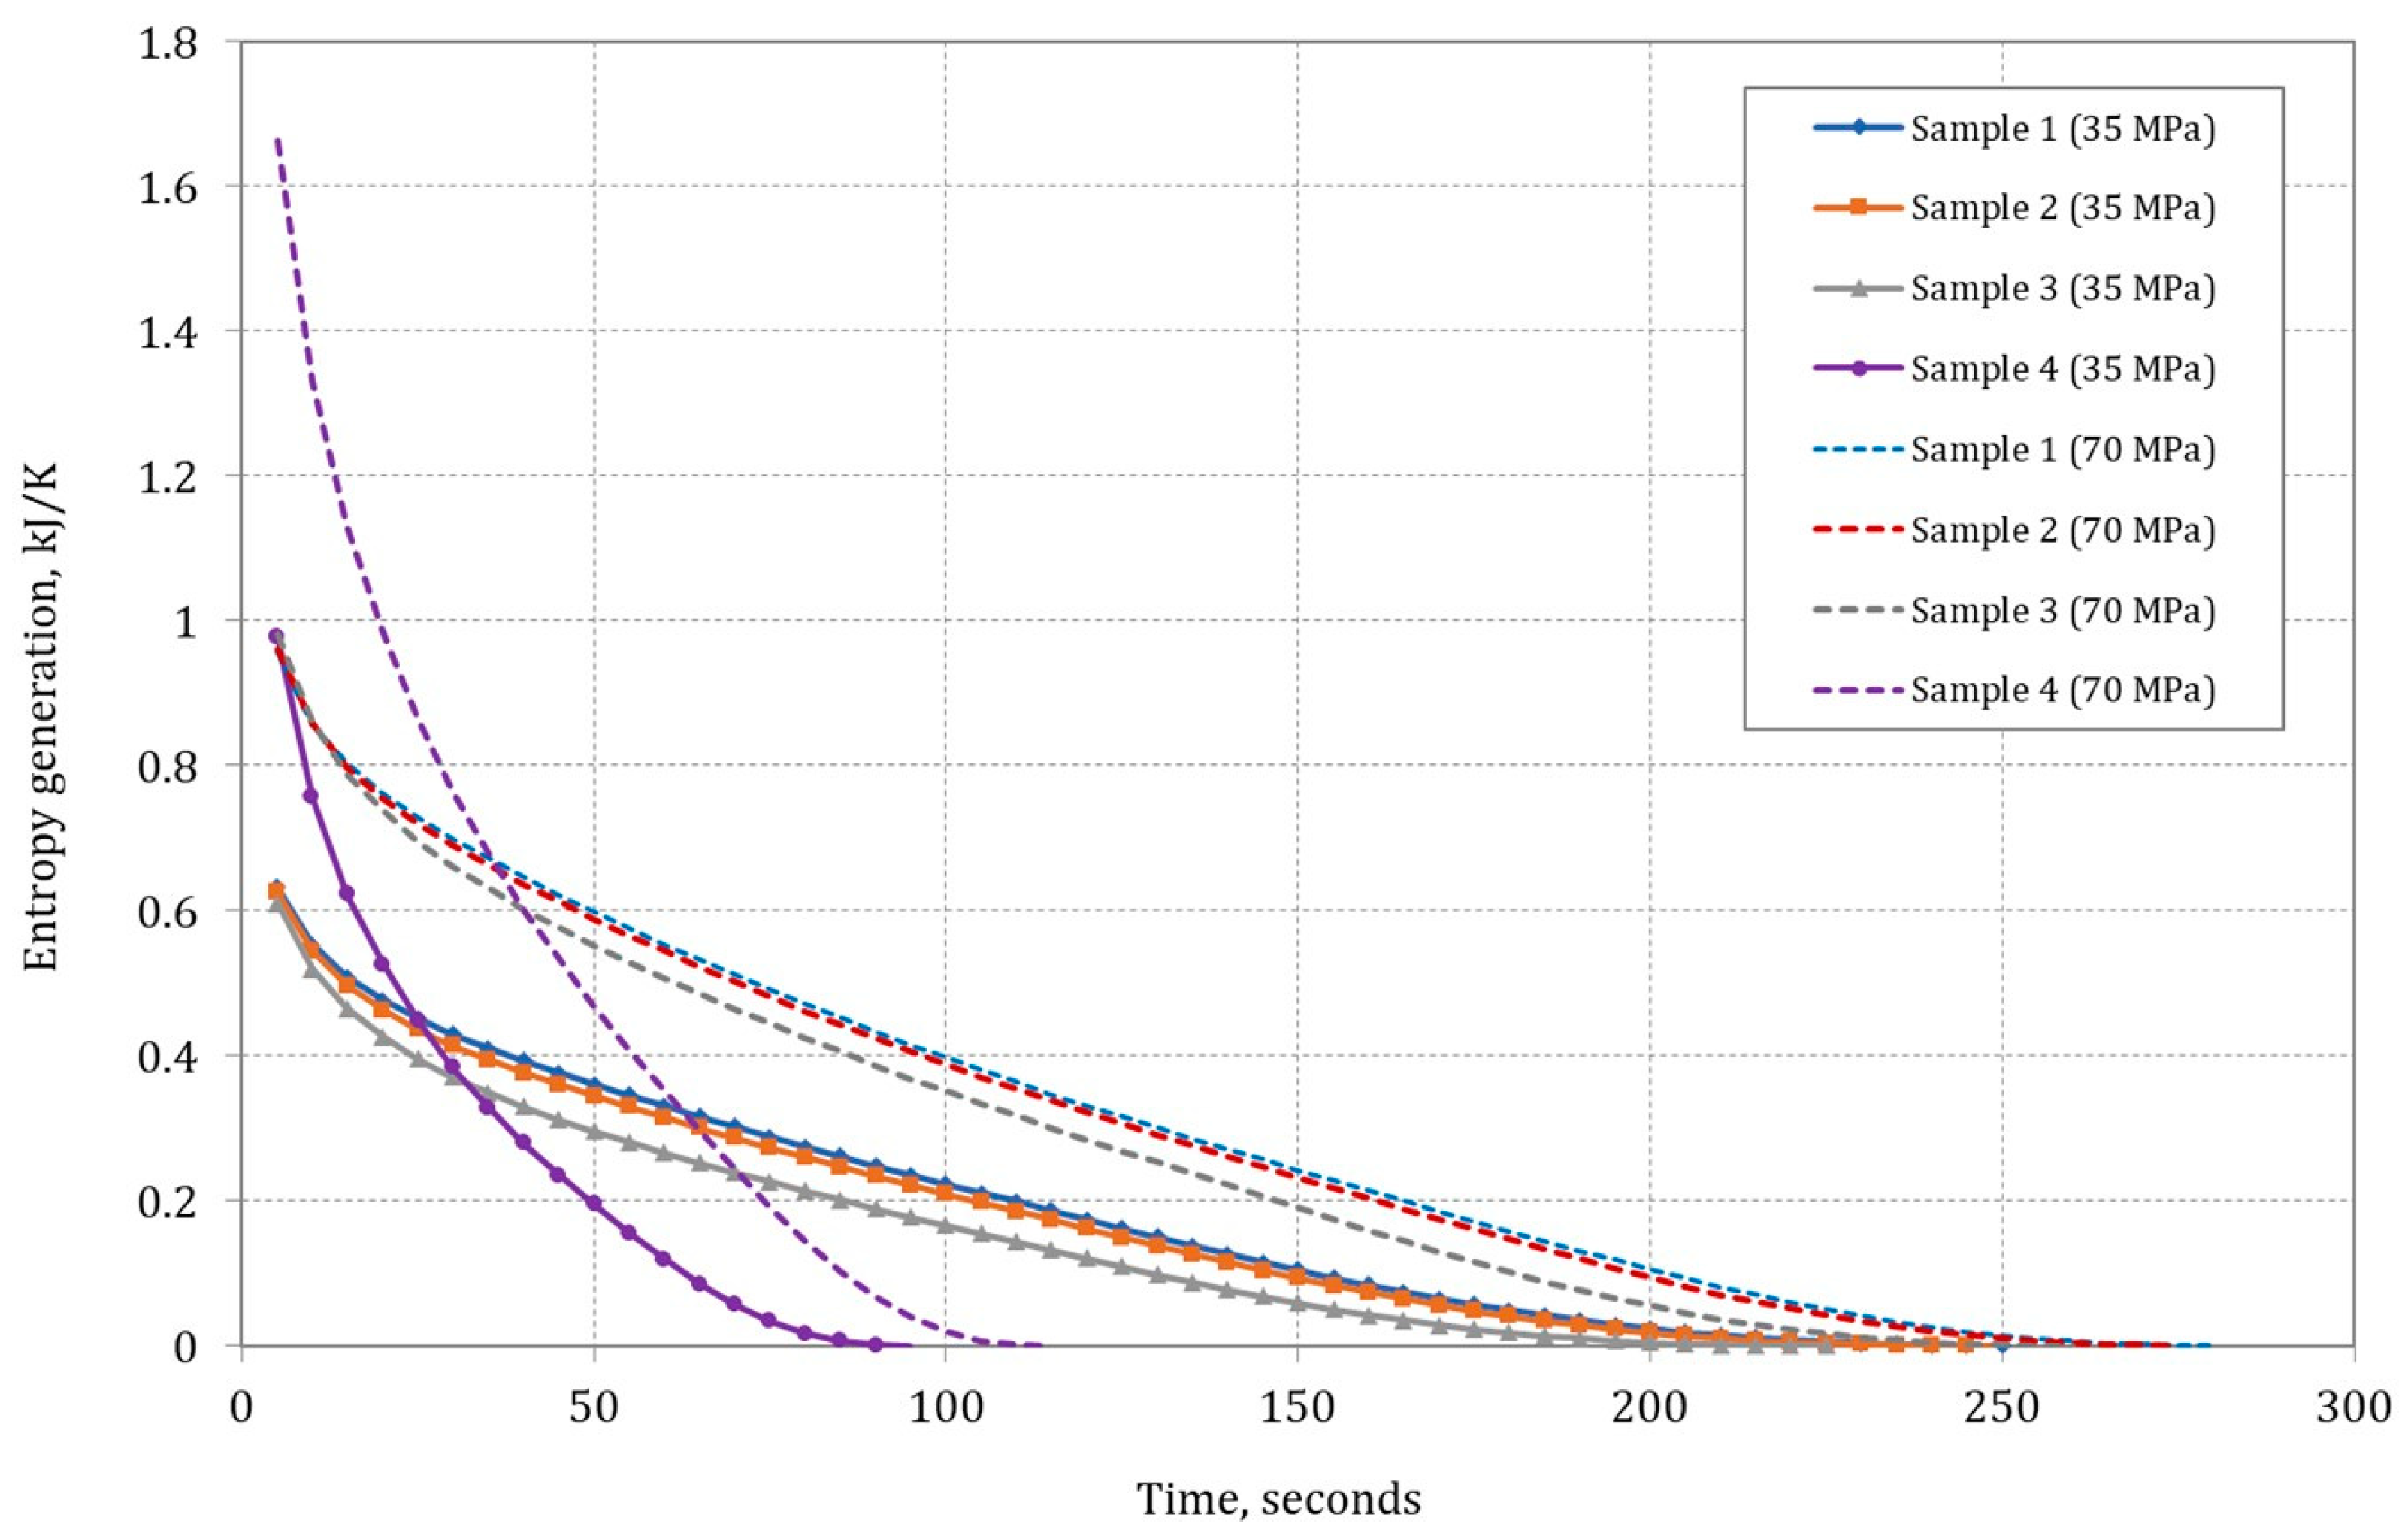
Figure 10 shows the change in entropy generation for assumed mixtures of methane and hydrogen (Samples 2 and 3), pure methane (Sample 1), and pure hydrogen (Sample 4) during the rapid filling process of an empty cylinder from ambient pressure. The generation of entropy is related to the principle of irreversibility of the thermodynamic process. The compressor works and as the pressure in the compression process increases, the generation of entropy decreases.
The analysis shows that the generation of entropy is the highest at the beginning of the filling process when the pressure difference is the highest. Certainly, for higher cylinder maximum operating pressures (70 MPa), the generation of entropy is higher. The analysis also showed a much higher entropy generation in the initial phase of the filling process for pure hydrogen (Sample 4) compared to the assumed methane–hydrogen mixtures or pure methane (Sample 1), but due to the short filling time, the entropy generation for hydrogen decreases rapidly with time.
In order to determine the maximum energy stored in the composite tank, the mass gross heating value was determined for the assumed gas sample compositions (
Table 2). The highest heat of combustion per 1 kg of gas mass occurs for Sample 4 (pure hydrogen) and the lowest for Sample 1 (pure methane). However, the coverage of the total energy content should be considered in terms of the possible maximum mass of gas of a given sample that can be contained in a given cylinder of a given capacity. However, calculated per unit volume, the hydrogen heat of combustion is much lower than that of methane, so ultimately filling the tank to the same pressure as methane in the case of hydrogen allows the storage of only about 30% of the energy accumulated when the tank was filled with methane. This has a significant impact on the potential of hydrogen in various applications, including as an energy carrier in AFVs; therefore, for tanks with smaller capacities (e.g., 50 L for passenger cars), an operating pressure of 70 MPa is used to partially compensate for this difference in the amount of stored energy.
The maximum amount of energy stored in the cylinder was determined by multiplying the mass of gas contained in the cylinder after filling by the gross heating value (heat of combustion) for a given gas sample. For other cylinder volumes (1.2, 6.8, 200, 350 L), the results of the analysis are presented in
Table 3. For pure methane, comparative calculations were made for the reference working pressure for compressed natural gas (CNG) tanks. Although the time of filling the tank to a pressure of 20 MPa is only slightly shorter compared to a pressure of 35 MPa, the amount of accumulated methane, and therefore energy, is approximately 36% lower than for a pressure of 35 MPa.
6. Conclusions
In the performed analysis of the composite tank rapid-filling process (type IV), the following parameters were determined: filling time, in-cylinder pressure increase, in-cylinder temperature change, mass flow rate, in-cylinder mass increase, Joule–Thomson coefficient, and entropy generation. The results show that for each considered cylinder capacity, the shortest cylinder-filling time to the maximum pressure (35 MPa and 70 MPa) occurs for pure hydrogen and extends with the decreasing proportion of hydrogen in the mixture with methane. For in-cylinder mass obtained after filling to the final pressure, the lowest mass was obtained for pure hydrogen and the largest mass was obtained for pure methane. This results directly from the composition of the gas samples adopted for analysis. A more important criterion in this case was the possibility of obtaining the maximum energy content in the tank after filling. The highest energy accumulated in the cylinders was obtained for pure methane (Sample 1) and the lowest for hydrogen (Sample 4). This results from the fact that, despite hydrogen’s high calorific value per unit of mass, the mass of hydrogen accumulated in the tank is smaller. In the case of a pressure of 350 bar for each cylinder capacity, the energy accumulated in the cylinder in the case of pure hydrogen constituted about 28.5% of the energy accumulated in the tank for pure methane. In the case of analysis for a working pressure of 70 MPa for a 50-L cylinder, the energy accumulated in the cylinder in the form of hydrogen (Sample 4) constituted about 34% of the energy accumulated in the cylinder in the form of methane (Sample 1). The results regarding the filling time, the amount of gas in the cylinder after filling, the maximum generated entropy, and the maximum accumulated energy in the cylinder after filling are presented in
Table 3. In a 350 L composite cylinder (type IV), it is possible to accumulate even 4.3 GJ of energy in the case of filling it with methane.
The primary practical issue of this study revolved around examining the impact of different methane/hydrogen compositions and pure hydrogen on the rapid refueling process. The maximum hydrogen content of 23% in natural gas was assumed due to safety reasons for combustion conditions in end devices. Different contents of hydrogen can affect both the time of AFV cylinder filling and the performance of the compressor during this process. It is imperative for this process to be short, ensuring maximal gas fill-up within the shortest time frame possible. Additionally, the temperatures of compressed methane/hydrogen mixtures or pure hydrogen during filling are crucial for determining the final process conditions and complying with safety standards. Specifically, the process of filling the tank with pure hydrogen was shown to differ from other samples, particularly in terms of the final gas temperature.
Especially, the amount of gas charged varies with different gas compositions, directly impacting the vehicle’s driving range and energy stored in the AFV tank. These findings underscore the significant composition of gas as a crucial parameter in studying the filling process of onboard composite tanks (specifically type IV) from a practical standpoint. In our further work, authors intend to conduct experimental tests on recently developed ultralight composite tanks (type IV), enabling the calibration of presented model through measurements of in-cylinder pressure and temperature for the pure hydrogen filling process.
