Article

Continuous Solar Thermal Energy Production Based on Critical Irradiance Levels for Industrial Applications

by
Guillermo Martínez-Rodríguez
1,*,
Héctor H. Silviano-Mendoza
1,
Amanda L. Fuentes-Silva
1 and
Juan-Carlos Baltazar
2
1
Department of Chemical Engineering, University of Guanajuato, Guanajuato 36050, Mexico
2
Texas A&M Engineering Experiment Station (TEES), Texas A&M University, College Station, TX 3581, USA
*
Author to whom correspondence should be addressed.
Energies 2024, 17(5), 1087; https://doi.org/10.3390/en17051087
Submission received: 21 January 2024 / Revised: 15 February 2024 / Accepted: 22 February 2024 / Published: 24 February 2024

Abstract

:
The design of a solar thermal installation is based on the lowest irradiance levels that occur during winter. However, there are consecutive days with irradiance levels well below those used for the design, which are called in this work “critical irradiance levels”. To solve this challenge, a statistical analysis is carried out to find a representative percentile of 22 years of consecutive days with “critical irradiance levels”. A case study of a cotton-dyeing industrial process requires 18.5 m3 of hot water and operates for 2.75 h at temperatures between 40 and 90 °C. Environmental variables for 22 years were analyzed and validated to design a solar thermal installation (solar collector network and storage system) and a coupled heat pump. The fifth percentile, with three consecutive days and low irradiance levels, was the most repetitive. For this case, a storage system of 46.5 m3 guaranteed heat load at target temperature. The simple payback was 14.1 years, and the energy cost was 0.094 USD/kWh, which was competitive against the energy cost from using fossil fuels, 0.064 USD/kWh. The design based on critical environmental conditions guarantees a continuous supply of energy to the industrial process and defines the minimum availability of solar energy to supply a process.

1. Introduction

The challenges posed by using solar thermal energy have been solved in the last few years. The associated energy cost to respond to each challenge has been competitive. There are several papers that focus on this topic that let us visualize clearly what has been achieved and what remains to be resolved.
The general objective of solar thermal installations is to achieve a solar fraction of the one with zero emissions. The solar fraction supplied to an industrial process is not only a function of cost; environmental impacts and technical and social aspects must be considered in this evaluation. To determine the viability of solar thermal systems, scientific, technical, and fiscal analysis knowledge is required [1].
Solar thermal installations, depending on the design, include a network of solar collectors, the heat storage system (diurnal or seasonal), auxiliary heat sources (such as biomass and fossil fuel boilers, heat pumps, etc.), pumping system, piping, and a control system. In general, the design objective of these plants is the minimization of investment, operation, and maintenance costs. Initially, large-scale solar thermal systems require high capital investments, but operation and maintenance costs can be reduced by up to 5% [2].
In 2018, a levelized cost of heat (LCOH) of 39 USD/MWh was reported for solar thermal systems greater than 7 MW (10,000 m2), with daytime heat storage; for systems greater than 35 MW (50,000 m2) with seasonal heat storage (which is an important cost to consider), the levelized cost of thermal energy is 53 USD/MWh [3].
Karki et al. (2019) [4] developed a simple tool to evaluate the viability of flat-plate solar thermal systems for small and medium-sized industries in the U.S.A. They analyzed various designs and climate scenarios and found that the relationship of savings-to-investment was strongly sensitive to the gas price, and that the installation costs were greater than the benefits obtained for medium and large systems. This phenomenon was directly related to the policies implemented in the country to change the conventional energy system to a system with renewable energy. In contrast, industrial applications of low-temperature solar thermal collectors have increased due to their low cost, low impact on global warming, reliability, and long lifespan [5,6], largely thanks to the policies adopted to encourage the use of solar energy. The most used technologies for the conversion of low-temperature solar thermal energy are the flat plate solar collector (FPSC) and the evacuated tube solar collector (ETSC) [7,8]. In Europe, 70% of large-scale solar thermal systems use flat-plate solar collectors [9].
Using solar thermal energy, due to its intermittent supply, is a priority to guarantee the delivery of the heat load at temperature level through thermal energy storage systems. For a solar thermal installation, the storage system grows linearly depending on the consecutive days with irradiance levels below the average, increasing the cost of the storage system and the cost of the solar thermal installation in equal proportion, making the construction of the installation not viable.
Several studies have demonstrated novel and effective design solutions to improve the thermal performance of FPCS by proposing the use of new working fluids, use of new materials, new geometric configurations and optimization of operating conditions. In experimental studies, an increment in thermal efficiency of up to 64.1% of FPSC systems was obtained using carbon nanotubes in ethylene glycol [10]. The use of silicon carbide nanofluid in distilled water (SiC/DW) was experimentally evaluated, and it turned out that the thermal efficiency of the FPSC increased by 77.43%, and the exergetic efficiency increased by 35.33% [11]. Experimentally, it was possible to increase the thermal and exergetic efficiency of the FPSC by 55% and 8% by adding transparent insulating materials (TIM) of plastic and airgel–silica in the cover, respectively [12]. Wang et al. (2022) [13] reported the efficiency of large flat-plate solar collectors improved by up to 4.07%. The increase in collector efficiency reduces the number of devices and, thus, the size of the collector network. In technologies like mini-channel solar collectors, the efficiencies are higher by 14.22% compared to those of conventional collectors [14]. A study conducted by Bahrami et al. (2022) [15] showed in detail the performance of FPSC to which different solar trackers, two-axis and single-axis, were integrated. The considered locations were in the latitude range from 20 to 70 °N (northern hemisphere). The results showed that the useful solar heat gain of the collector with double-axis movement compared to the fixed collector in optimal position varied between 15.74% and 71.33%, depending on the location. The fixed system is still the most viable option compared to the collector with tracking. Other proposals include the use of evacuated flat plate solar collectors (EFPSC or EFPC), where the best advantages of both technologies are combined. The average temperatures reached ~200 °C with high efficiency and without the need for monitoring [16]. Based on the previous results, by increasing the efficiency and, thus, the outlet temperature of the FPSC, the applications of low-temperature solar thermal systems in the industrial sector have expanded.
Large-scale solar collector fields have been installed in the world during the last decade (11 SHIP plants (>5000 m2), 19 solar district heating systems (>20,000 m2), and 18 solar thermal systems for growing vegetables and flowers (>50 m2) [17]). In 2021, 44 new large-scale solar heating systems (>350 kWth, >500 m2) with a capacity of 142 MWth were built. The three largest solar thermal systems installed for district water heating are in Præstø, Denmark, with a capacity of 5.6 MWth; in Nahwärme, Friesach (Austria), and the system in Mühlhausen, Germany; the latter two have a capacity of 4.0 MWth [17]. The Pampa Elvira Solar thermal installation (Chile) is one of the largest in the world; it annually supplies 54,000 MWh of heat for the copper electrowinning process; it has 2928 solar collectors that cover an absorber area of 44,000 m2, occupying 90,000 m2 of land, thus replacing 80% of diesel, which is equivalent to emitting 15,000 tons of CO2 into the atmosphere [18]. Currently, the largest solar thermal plant in the world producing district hot water in Silkeborg, Denmark, has 12,436 collectors installed on 156,694 m2. It reports an annual production of 80,000 MWh, which is equivalent to reducing CO2 emissions by 15,700 tons [19]. Martínez Rodríguez et al., 2023 [20], proposed coupling a heat pump to a solar thermal facility to solve the challenge associated with large areas of solar thermal installations. These define the cost of energy and the impact on the land and society by modifying the ecosystem. In this research, area reductions of up to 70% were achieved.
Available solar radiation is one of the main factors affecting the performance of a large-scale solar thermal plant. For non-concentrating systems, such as FPSC, that maintain a fixed inclination and azimuth, the achievable daily throughput is typically approximated as a linear function of the total irradiance received at the collector plane [21]. The annual irradiance at an optimally tilted, and aligned slope is a good indicator of the performance achievable for untracked solar collectors [22].
The study of solar resources and meteorological conditions is vital to selecting the most convenient solar technology and evaluating the technical–economic scope. In general, the energy efficiency study simulates different operating conditions [23], a wide variety of climatic regions [24], different seasons of the year [25], and even complex topographic conditions, such as the Italian Alps [26]. In Chile, the solar resource varies significantly with geographical location. The zones with the lowest daily global irradiation are in the south, with around 1095 kWh/m2/year. The surfaces with the highest incidence (2556 kWh/m2/year) show maximum Direct Normal Irradiation levels (DNI) of 3652 kWh/m2/year. Mexico is geographically located between latitudes of 15–35 °N and receives an annual irradiation of 2007.5 kWh/m2 and a daily irradiation of 5.5 kWh/m2 [27]. Denmark belongs to the Nordic zone, where global horizontal irradiation is between 1000 and 1150 kWh/m2 per year, and DNI levels are around 800–1100 kWh/m2. The average ambient temperature in January and February is right at the freezing point; in summer, the temperatures are between 13 and 17 °C.
Considering a geographic location and a specific technology, irradiance levels impact the outlet temperature of the collector network. Irradiance is the most important variable that defines the design of a solar collector network; it must guarantee the target temperature and heat load with the lowest number of collectors and storage volume. During the last decade, the number of extreme meteorological and climatological phenomena has increased, which is why reliable data sources are required to make a forecast and plan the solar resource. The ability to predict the frequency of extreme winter conditions in advance has economic implications. The behavior of irradiance during the seasons of the year has been studied using different approaches to determine clear-sky days, cloudy-sky days, and completely cloudy days. Castillejo-Cuberos et al. [28] mentioned that variational studies of solar resources could be conducted from three types of approaches: statistical; deterministic; and probabilistic. The first has focused mainly on the estimation of averages and standard deviation. The second focuses on the study of phenomena that occur over time, and the probabilistic approach evaluates the possibility that a given condition of solar radiation occurs over time. Authors such as Vignola et al. [29] recommended that the statistical analysis of solar resource data requires a long-term database, that is, with information from at least 10–15 years. The data should not exhibit a normal distribution and should preferably provide information on at least one atypical event that affected solar radiation values. They also proposed the use of probability metrics q 50 , q 95 , and q 99 based on the frequency distribution of global solar radiation to estimate the periods in which photovoltaic systems generate surplus energy. Sengupta et al. [30] established that in the first stages of solar projects, extensive information on the solar resource must be available and the origin and period of data collection must be detailed (they worked with 50 global and regional databases with solar radiation information and environmental conditions). Using a statistical approach, they established two criteria to select the appropriate information: the variability that responds to the spatio-temporal differences in the solar resources in the world. The second criterion was the error, which is the difference that exists between the information available in the databases and the results measured at meteorological stations.
Yakoubi et al. [31] evaluated 24 models for the prediction of irradiation in Morocco as a function of the clarity index and the cloudiness index. The first is an indirect measure of the available solar resources, and some of them use values of ambient temperature, relative humidity, and wind speed. The data used were from 2000 to 2018 in 14 Moroccan cities. They considered the 25th and 75th percentiles as the lower and upper limits of days with partly cloudy skies. Solar irradiation values in cities with the greatest amount of energy are in the range of 5.4–5.9 kWh/m2/d. Prediction of irradiation had good agreement with the NASA database with a standard deviation of less than 0.1 kWh/m2/d.
By selecting and treating 1,541,760 data generated between 1998 and 2019 of the average values of daily solar radiation at the site, these authors have developed a new approach to designing solar thermal installations called “critical irradiance levels”. From the arithmetic mean of the data was a frequency distribution diagram that directly presented the number of incidents for each value of solar radiation between the 5th and 99th percentiles for a long-range database. The fifth percentile was considered the criterion to establish the value of the critical irradiance levels. A coupled heat-pump–solar thermal installation system is designed based on the critical irradiance levels that occur annually in Guanajuato City (Mexico). With this design, the continuous production of heat and electrical power of a cotton-dyeing process is guaranteed for a whole year. For heat production, the solar fraction is 1, with an installation area of 1120 m2, which is 70% smaller than that occupied by a solar thermal installation.

2. Design of the Coupled System Heat-Pump–Solar Thermal Installation for The Continuous Supply of Solar Thermal Energy

In industrial processes, during the days of operation, the supply load must be guaranteed at the target temperature at which the process operates. Both the heat load and the target temperature are two parameters of each industrial process that must be met for operation. The network of solar collectors has been designed with the lowest irradiance levels, which occur during the winter period; however, during the year, there are days with irradiance levels 34% below the average of the winter period, taken for the design of the solar thermal installation. The irradiance values that occur on these days have been called the critical irradiance levels and occur on consecutive days during the year, which makes the challenge of guaranteeing the target temperature and heat load interesting. With the critical irradiance levels, the network designed with data from the winter period does not reach the target temperature, and therefore, the storage system significantly increases the installation area, the storage volume, and the cost of the solar thermal installation. To determine the days with critical irradiance levels, irradiance data from the National Renewable Energy Laboratory of the USA (NREL USA) were validated with irradiance data from the Solar Energy Laboratory of the University of Guanajuato, in Guanajuato City (Mexico). Once validated, 22 years were analyzed, and percentiles of critical irradiance levels for the 22 years were determined.

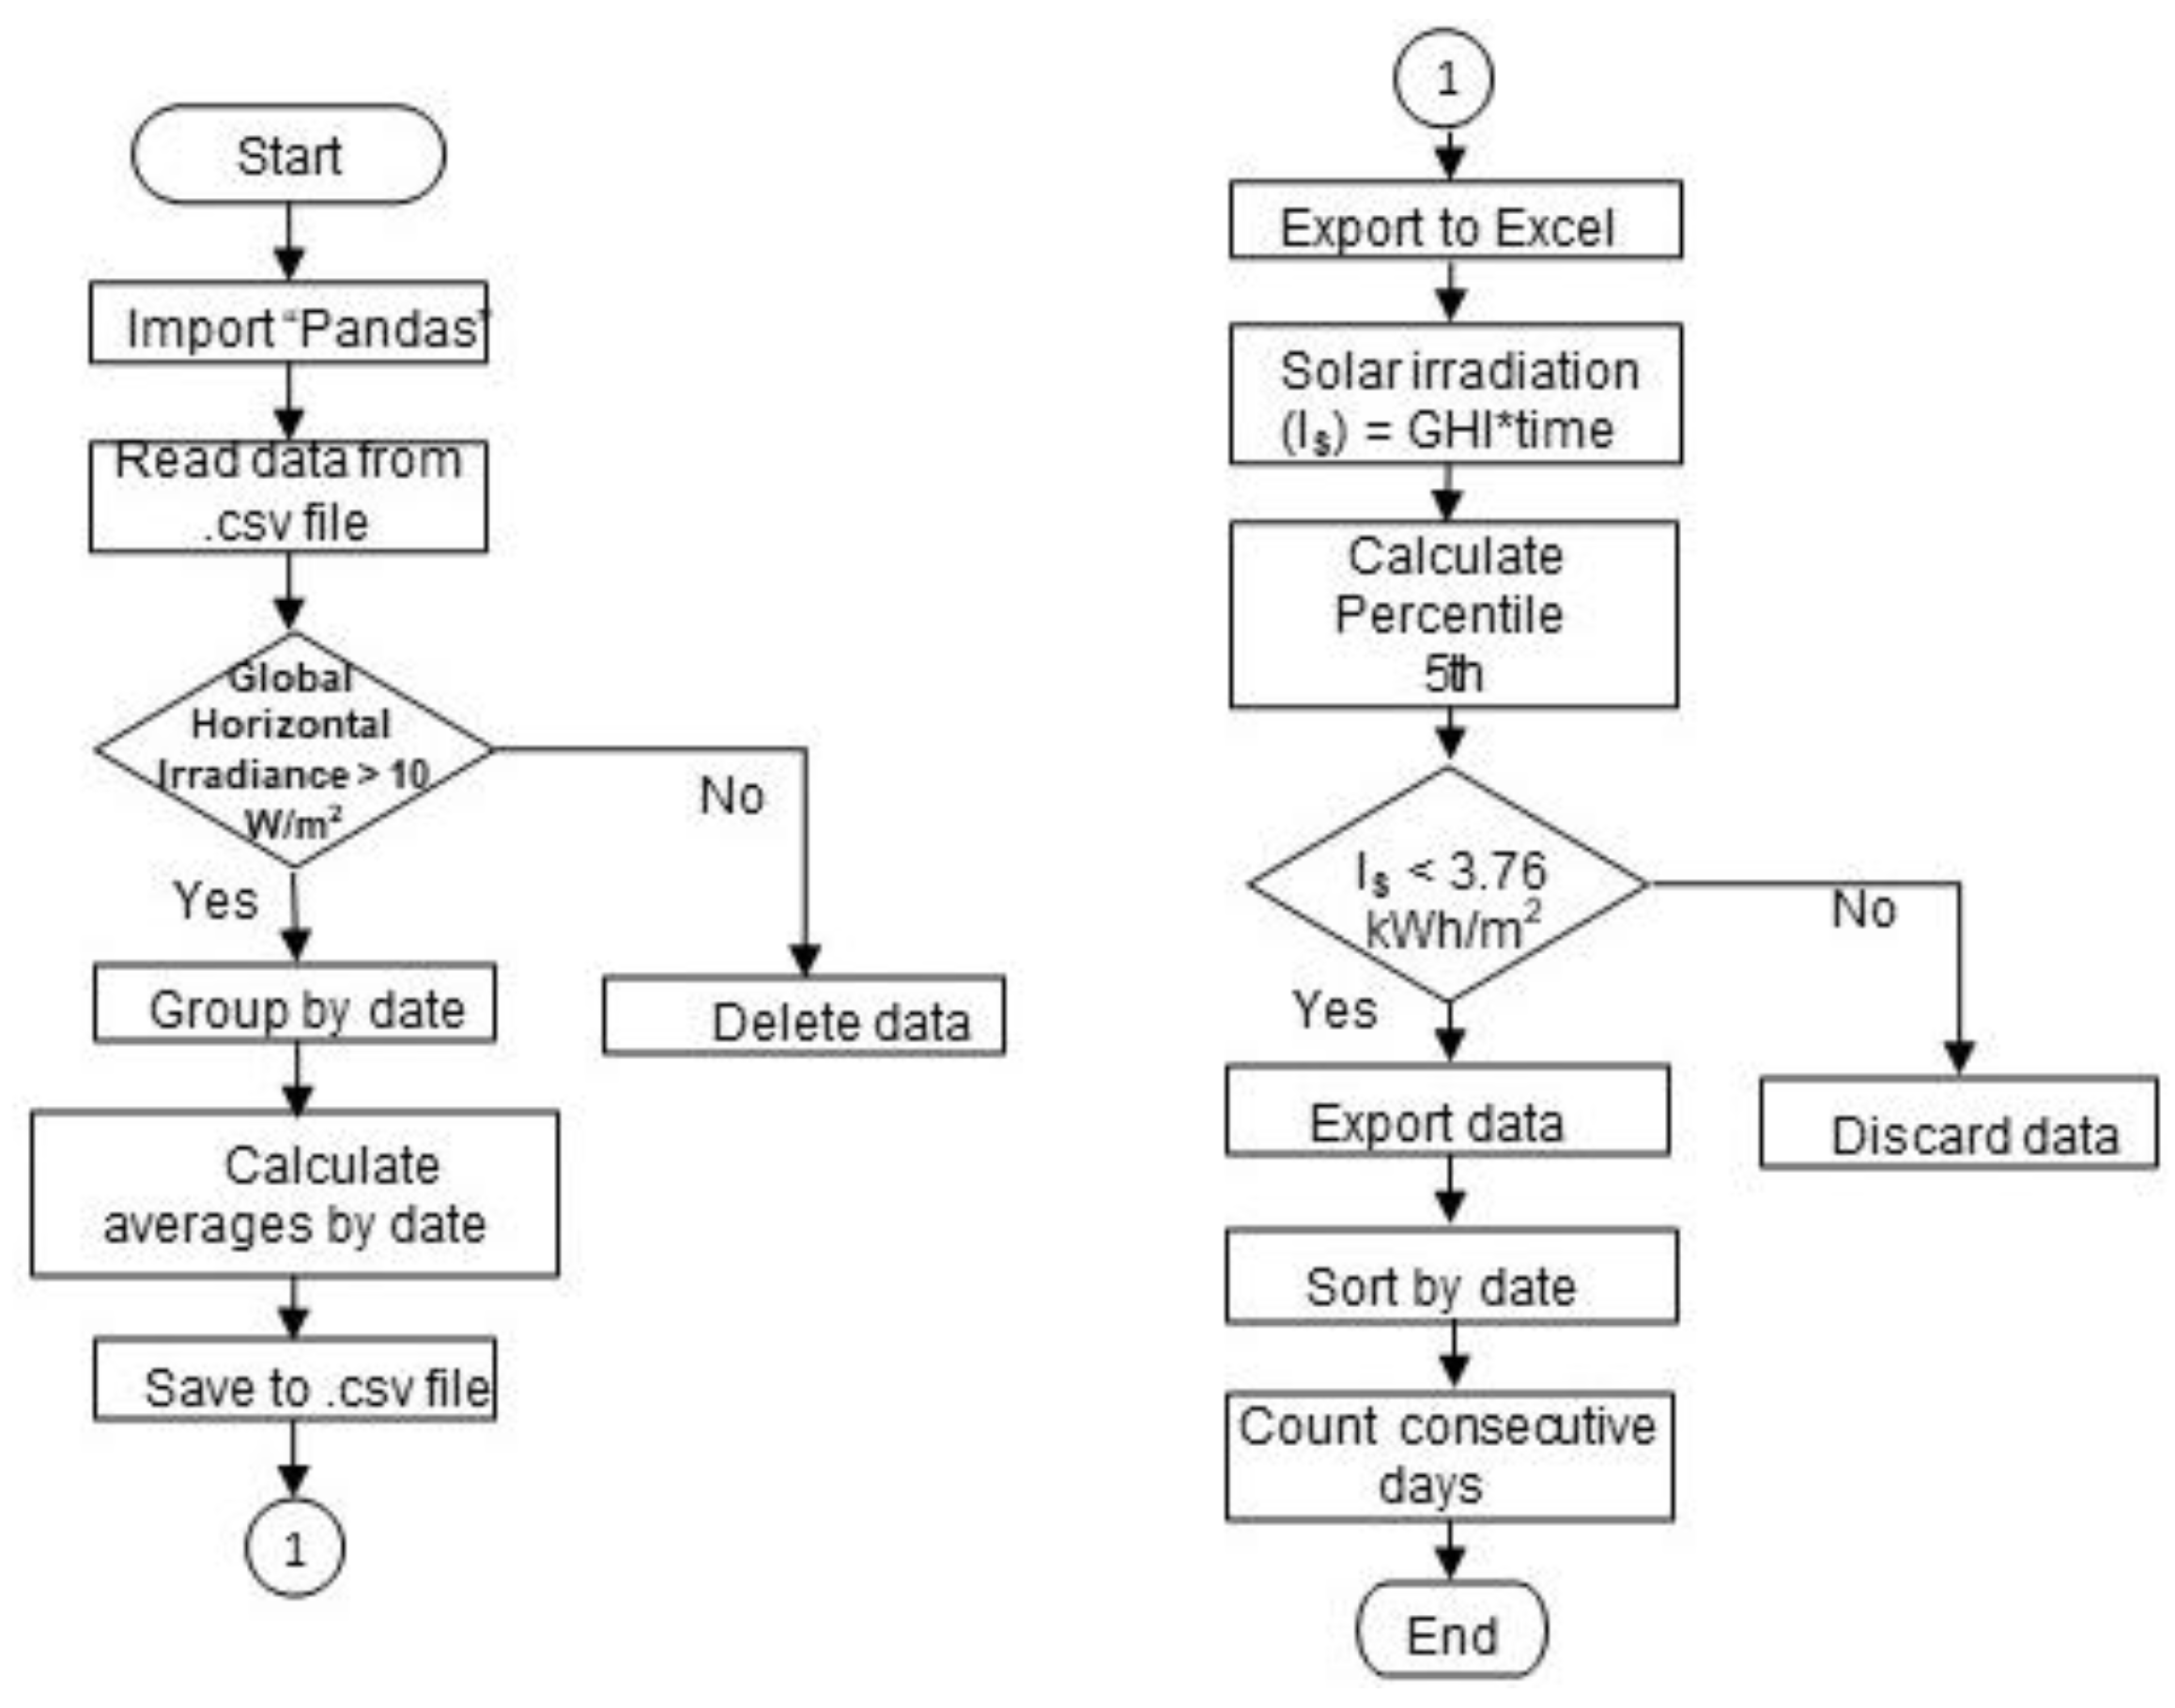
2.1. Statistical Analysis of Environmental Conditions

The statistical analysis of the environmental conditions of the city of Guanajuato (21.01 N, 101.26 W, height 2045 m) was carried out using the information available in the NREL database [32]. The extracted information includes data on global solar radiation, ambient temperature, and wind speed, in 30-min intervals for the 22-year period between 1998 and 2019. We processed 1,541,760 data using a program developed in Python language programming and using the library of data analysis Pandas. The developed program delivers the hourly, daily, monthly, and annual averages of the environmental variables in the period determined by the hours of available radiation. In the city of Guanajuato, there is a solar irradiation of 2260 kWh/m2 per year and 6.19 kWh/m2 per day; the average ambient temperature is 21.2 °C.
A percentile is a statistical magnitude that represents the percentage of data that is below a certain value of the analysis variable, therefore allowing for the comparison and classification of the data contained in the sample. The percentiles were used to evaluate and compare the energy of each day of the analyzed period based on the daily solar irradiation. The purpose is to make a classification between the days with typical environmental conditions and those that are considered with critical environmental conditions.
The results obtained from this analysis are presented in Table 1, where the average daily value of each variable is observed for each day of the study period. The days are classified with respect to the percentile in which they are located using the daily solar irradiation as a parameter of analysis.
Percentile analysis has the advantage of directly indicating extreme radiation levels in both high radiation (> q 75 ) and low radiation (< q 25 ) conditions. The analysis addresses a new classification of environmental conditions called “critical irradiance levels”. This concept corresponds to periods with extremely low radiation levels, which are of utmost importance for designing solar systems that can guarantee the total supply of energy to industrial processes. To obtain these values of critical environmental conditions, it is necessary to analyze the distribution of days that fall within each of the percentiles considered in this study; this can be easily visualized through the frequency graph shown in Figure 1.
The graph in Figure 1 shows a uniform distribution of days, around 400 days in each percentile, presenting a standard deviation of 7.92 days. This uniformity between the data allows for the percentiles to be used as a parameter to classify the days with critical environmental conditions since their values provide a direct comparison parameter between the sample data.
Analyzing the results of Table 1, it is possible to observe the solar irradiation values in the low radiation percentiles (5th to 20th percentile) for the present case study. There are relatively high values if compared to the levels reported in other leading countries in the solar sector, such as Denmark (2.73–3.15 kWh/m2/day). Due to this high availability of radiation at these levels, the new concept called “critical irradiance levels” was considered for the studied region, corresponding to those solar irradiation values that were below the fifth percentile (<3.76 kWh/m2/day).
Figure 2 represents the algorithm to select the data classified in the percentile of interest, in this case, number five. Critical irradiance level is the point value of solar radiation which is lower than the value of solar irradiation in the 20th, 10th, and 5th percentiles for the total available data. The selection of the percentile as a reference parameter is based on the definition of this parameter, which indicates that for a sample of data ordered from highest to lowest, there is a percentage of data (equal to the percentile value) in which all values are less than the value of this study’s variable in said percentile.
The results of this analysis are shown in Table 2. The irradiation values above the 5th percentile ( q 5 ) present high energy values, so q 5 was selected as the critical solar radiation condition in such a way that all the days in which the values were less than 3.76 kWh/m2/d were considered critical days for the analysis.
The number of occurrences of consecutive periods of critical days in the period studied was analyzed, finding that the maximum number of consecutive days was 7. However, this value had the occurrence of two occasions in the entire period studied; therefore, it was considered an atypical condition. To select the typical period in which critical conditions occur on consecutive days, Table 3 was constructed. Table 3 shows that for the total number of years studied, the period of consecutive days with the highest number of repetitions is 2 days. However, this value is impractical for the design of storage systems due to its short duration, so the period of critical conditions that must be considered for this purpose is the period of 3 days, with an occurrence of 12 occasions in 12 years other than the 22 analyzed.
Table 4 shows the average weather conditions of the critical conditions that occur during 3 consecutive days in each season of the year.
From the analysis of the climatological conditions of the site of interest, the average conditions of the winter period in the 22 years are:
  • Available period = 11 h;
  • Global radiation = 443 W/m2;
  • Ambient temperature = 17.3 °C;
  • Wind velocity = 2.87 m/s;
  • Daily solar irradiation = 4.87 kWh/m2.
The most favorable conditions of the winter period under clear skies are available for 8030 days of the total data reviewed, and the daily irradiation is 6.19 kWh/m2.

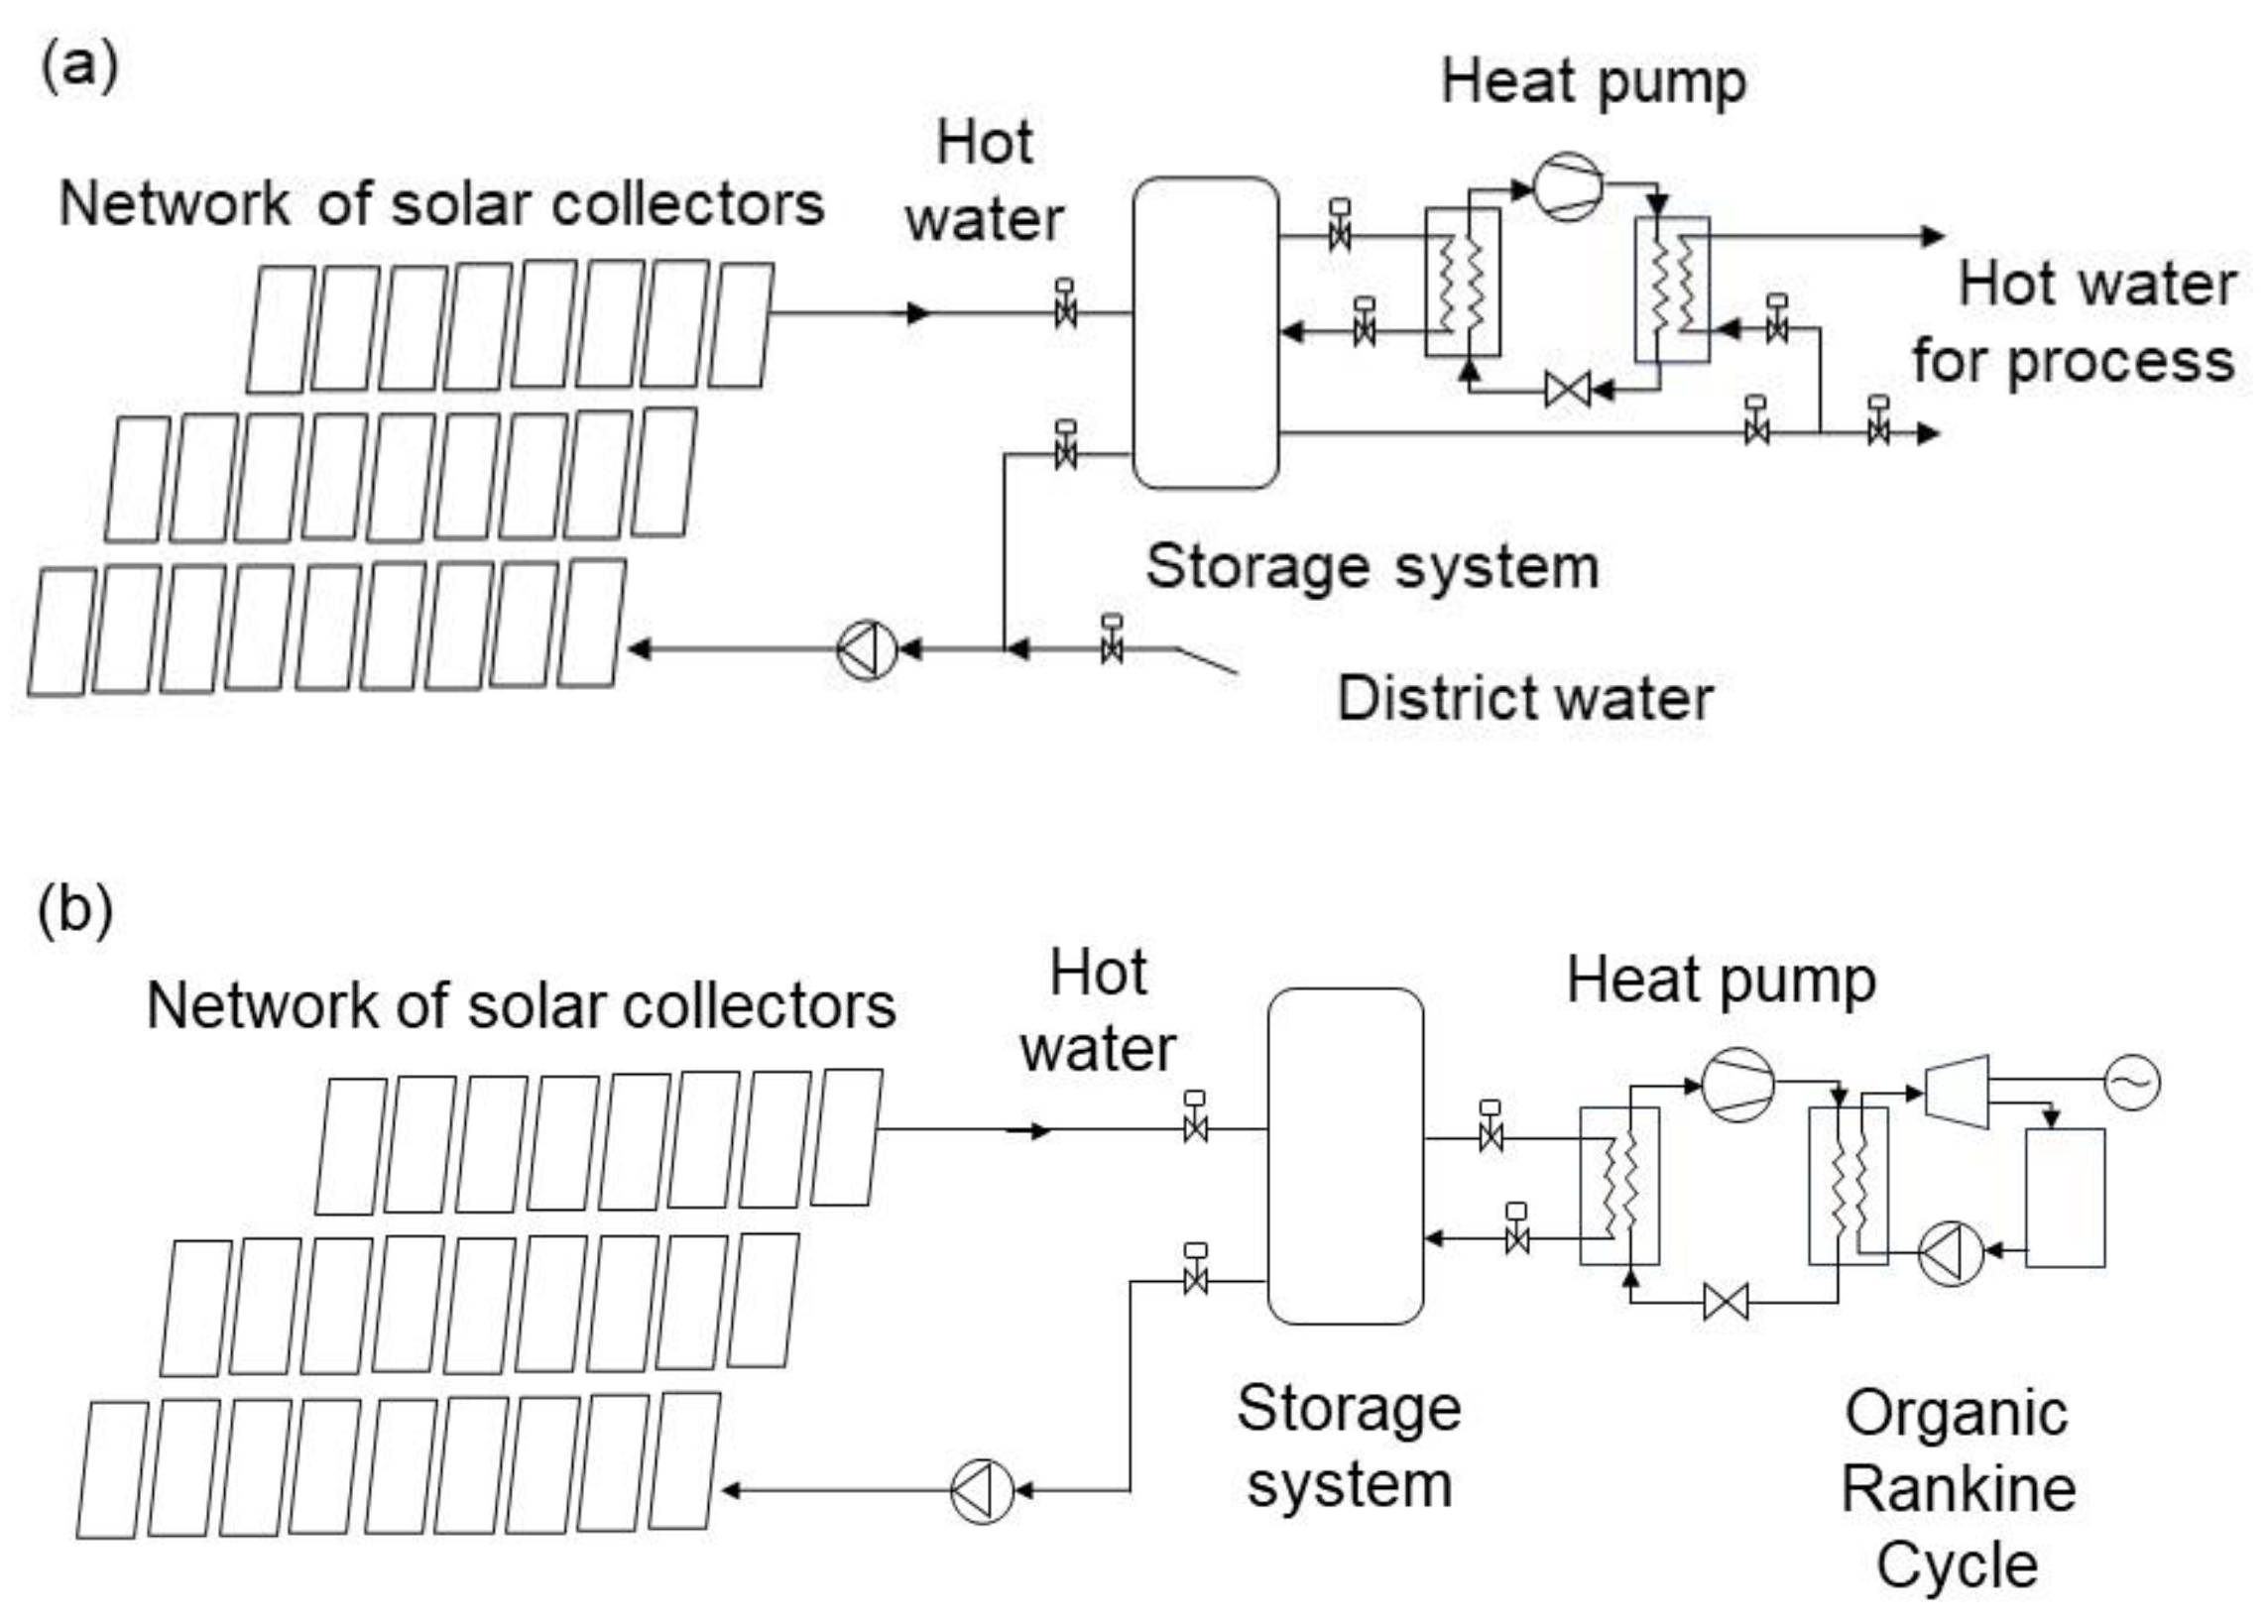
2.2. Design of Collector Networks and Storage System Coupled to A Heat Pump

In this proposal, the solar thermal system and the heat pump are integrated to achieve the energy objectives even in the most critical weather conditions. Different operating scenarios are analyzed, and the performance of these low-carbon systems is evaluated. Figure 3 represents a general scheme of the proposed system to produce process heat or heat service (a) and to produce electric power (b).

2.2.1. Solar Thermal Installation Design
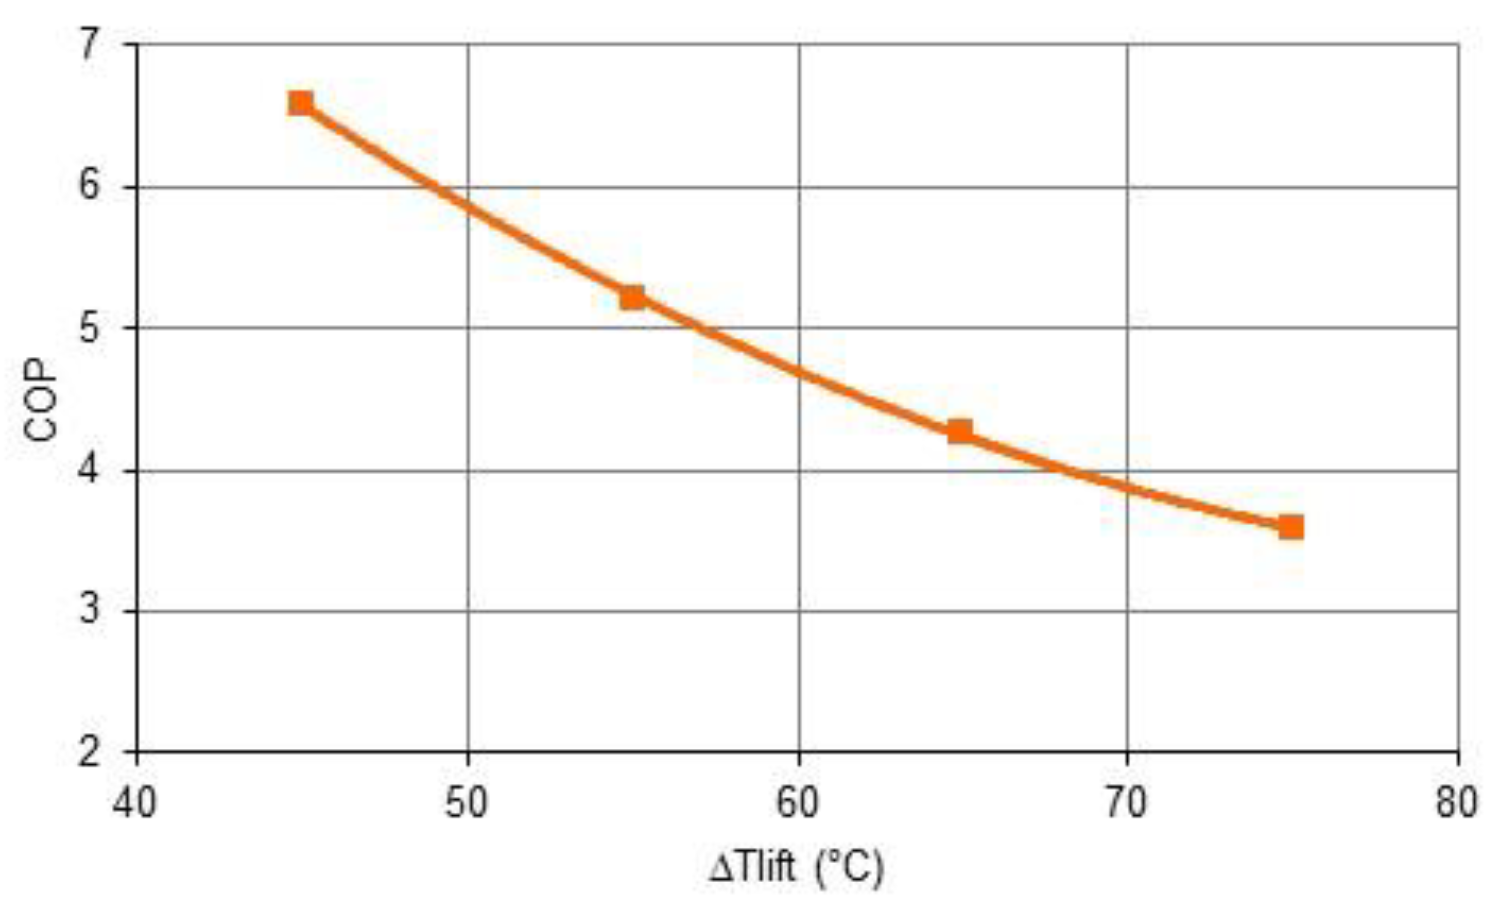
The design of the flat plate solar collector network is based on the methodology proposed by Martínez-Rodríguez et al. (2019) [33], where the size and arrangement of the network must meet the heat load and the temperature level required by the process. The flat plate solar collector used for the network design was selected from those commonly sold flat plates with standard characteristics and dimensions. For the thermal storage system, a tank with thermal insulation that is marketed for these applications is considered.

2.2.2. Heat Pump

In critical conditions, the solar thermal installation does not reach the energy objectives required by the process. With a heat pump coupled to the solar thermal system, the energy supply is guaranteed throughout the year. Heat pumps operate according to a thermodynamic principle known as the Carnot cycle and use the specific properties of refrigerants driven by electric compressors. By raising heat from the source to the point of use, the pressure of the refrigerant through the compressor increases. In this way, low-temperature heat is recovered and delivered to industrial processes [34,35].
In a heat pump, the electrical energy consumed by the compressor is converted into heat that is transmitted to the refrigerant during the compression process. Consequently, the heat transferred to the sink (the process), Q ˙ C   H P , is equal to the heat extracted from the source, Q ˙ E   H P , plus the heat associated with the work of compression, W ˙ H P , established in Equation (1).
Q ˙ C   H P = Q ˙ E   H P + W ˙ H P   ,
where Q ˙ C   H P is heat transferred to the sink (the process), kW; Q ˙ E   H P is the heat provided by the low-temperature solar thermal installation, kW.
Heat pumps are characterized by the coefficient of performance (COP), defined as the relationship (ratio) between the heat flow given and the work required, given by Equation (2):
C O P = Q ˙ C   H P W ˙ H P ,
For the case study analyzed, the performance curve of the heat pump is shown in Figure 4, where ΔTlift is the difference between the condenser and evaporator temperatures.

2.2.3. Organic Rankine Cycle (ORC)

To generate the power required by the process, a low-temperature solar thermal system–heat pump–organic Rankine cycle is proposed and described in Figure 3. To integrate low-temperature solar thermal energy into electric power production, a heat pump is used to guarantee the heat load and temperature level to operate the power cycle in the most critical environmental conditions of the year. The energy storage system of the solar thermal installation provides the heat to operate the heat pump [20].
One of the main parameters to evaluate the performance of an ORC is given by the thermal efficiency, η t h   O R C , described by Equation (3):
η t h   O R C = W ˙ n e t   O R C Q ˙ E   O R C ,
where W ˙ n e t   O R C is the net electric power produced by the ORC, kW, and is calculated as the difference between the power produced by the turbine minus the power supplied by the pump; Q ˙ E   O R C is the thermal energy supplied to the ORC through the system evaporator, kW; in this study, it is provided by the heat pump.

2.3. Estimation of GHG Emissions

To estimate the total emissions of greenhouse gases (GHG) thrown into the atmosphere by the burning of natural gas, the Equation (4) is used:
E G H G = E F i · E ,
where E is the energy consumed by the process, kWh; E F   i is the pollutant emissions factor or index i generated by fossil fuel burning. The EPA reports the following factors for natural gas: C O 2 = 53.06 ; C H 4 = 1.0 × 10 3 ; and N 2 O = 1.0 × 10 4 , kg/MMBTU [36].

2.4. Economic Evaluation

The levelized cost of energy (LCOE) is used as an indicator to evaluate the profitability of energy systems, given by Equation (5). This indicator relates the investment, operation and maintenance costs, and the cost of fuels if there is backup, with respect to the net energy production of the system throughout its useful life (USD/kWh).
L C O E = C F R · C I N V + C O & M + C F U E L E N E T ,
where C F R is the capital recovery factor that represents the relationship between a constant annuity and the present value of receiving that annuity over a given period; C I N V is the investment cost of the system, USD; C O & M are the operation and maintenance costs, USD; C F U E L is the cost for fuel use if the system has a backup, USD; and E N E T is the net energy generated by the system, kWh. The useful life of the plant is 25 years; the interest rate of the project is taken as 8%, and the prices are adjusted for the year 2023. In the analysis, subsidies and incentives are not considered, nor are taxes or special levies considered [37].

3. Case Study: Cotton-Dyeing Process

“Textil La Merced S. A.” is a manufacturing industry where 407.5 kg of cotton is dyed daily [38]. The plant works in production six days a week during the year. The activity takes place for about 10 h a day, starting at 8:00 a.m. and ending at 6:00 p.m. The plant uses a natural gas boiler to heat 18.5 m3 of water at different temperatures; a power consumption of 251 kW is also reported for a period of 3.2 h for the process.
A scheme of the process is shown in Figure 5. The production process operates in batches, and the main subprocesses are as follows: (a) pre-bleaching; in this stage, oxidizing agents and detergents are added to remove dirt from the natural fibers; 2500 L of water at 90 °C is necessary; (b) rinse; the cotton is rinsed in 1553 L of hot water at 80 °C for 10 min to eliminate residues of the oxidizing agent and detergent; (c) neutralization; subsequently an alkaline neutralization is carried out for 10 min to guarantee the purity of the raw material and remove the remnants. For this, 1553 L of hot water at 50 °C is required; (d) dyeing; the selected dye and auxiliary dyeing agents are added; the process is carried out in hot water at 60 °C for 10 min and 1953 L of water is required; (e) washing/rinsing; again, the cotton is cleaned in 1553 L of hot water at 70 °C for 10 min to eliminate traces of dye; (f) soaping; to eliminate impurities, detergent and lubricant are added, and 1553 L of hot water at 80 °C for 20 min is required; (g) rinse; remove the soap residue contained in the cotton by keeping it in 4658 L of hot water at 80 °C for 20 min; (h) neutralization; this process is carried out with the purpose of eliminating the alkalinity of the cotton generated by the soaping process; for this, a neutralizing agent is added to 1553 L of water at 40 °C and the cotton is immersed for 25 min; (i) fixation and softening; this process aims to help fix the dye in the cotton and achieve the texture required for commercial use of cotton, and the process is carried out in 1553 L of water at 40 °C for 25 min; (j) centrifuging; finally, the water content of the product is removed through this process that lasts 25 min. The dyeing process for a batch lasts 2.75 h and requires 18.5 m3 of hot water at temperatures ranging from 40 °C to 90 °C.

4. Results and Discussion

To evaluate the viability of the proposed system, different scenarios were analyzed. Weather conditions were considered critical to guarantee the long-term sustainability of the renewable system. Next, the operating conditions of the proposed system were described in detail. For the heat production and power production required by the cotton-dyeing process, the design of two systems that operate independently was proposed.
For the proposed heat production system, solar collector network–storage system–heat pump, three possible scenarios were analyzed (1, 2, and 3). To provide the hot water for the process, it was considered that the solar thermal installation heats all the hot water to 40 °C; the hot water is stored in an isolated system, and from there, it is taken to supply the heat to the process. The process required 3.1 m3 of hot water at a temperature of 40 °C and 15.4 m3 of water at temperatures between 60 and 90 °C. To achieve the energy objectives, a heat pump was integrated to provide the remaining heat.

4.1. Heat Production

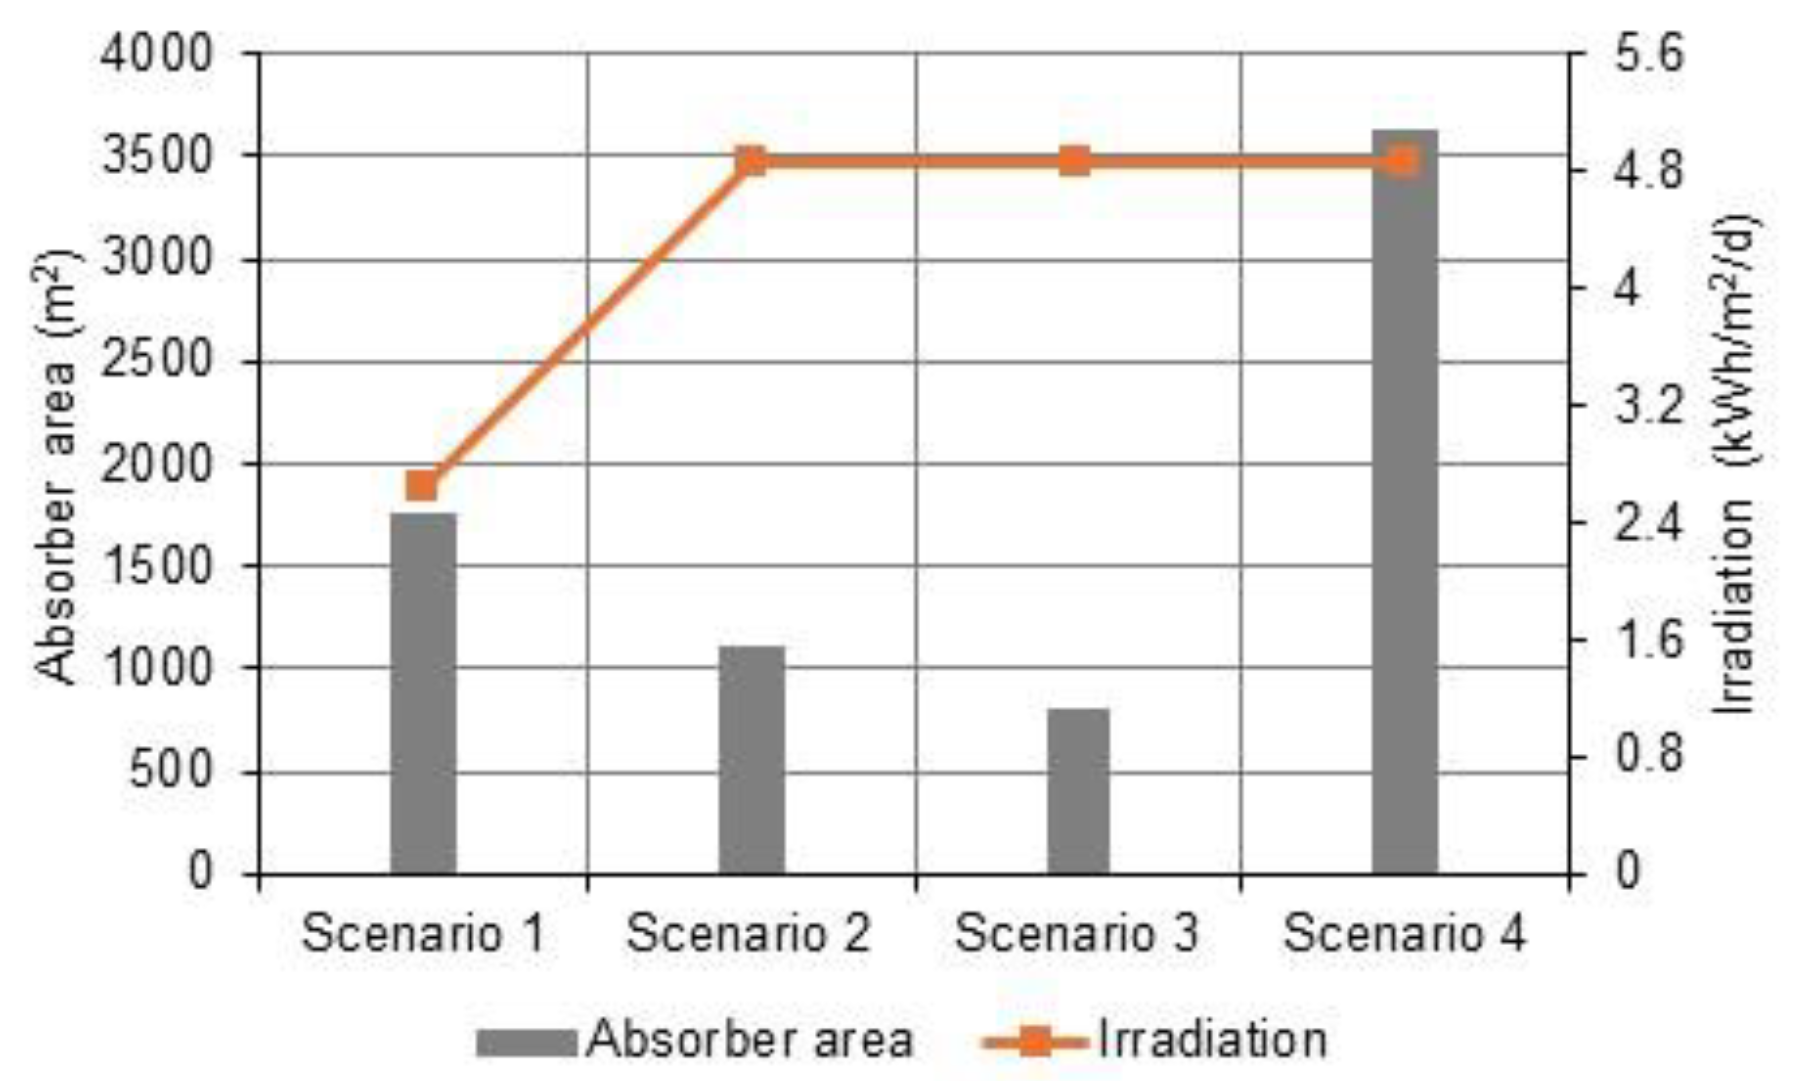
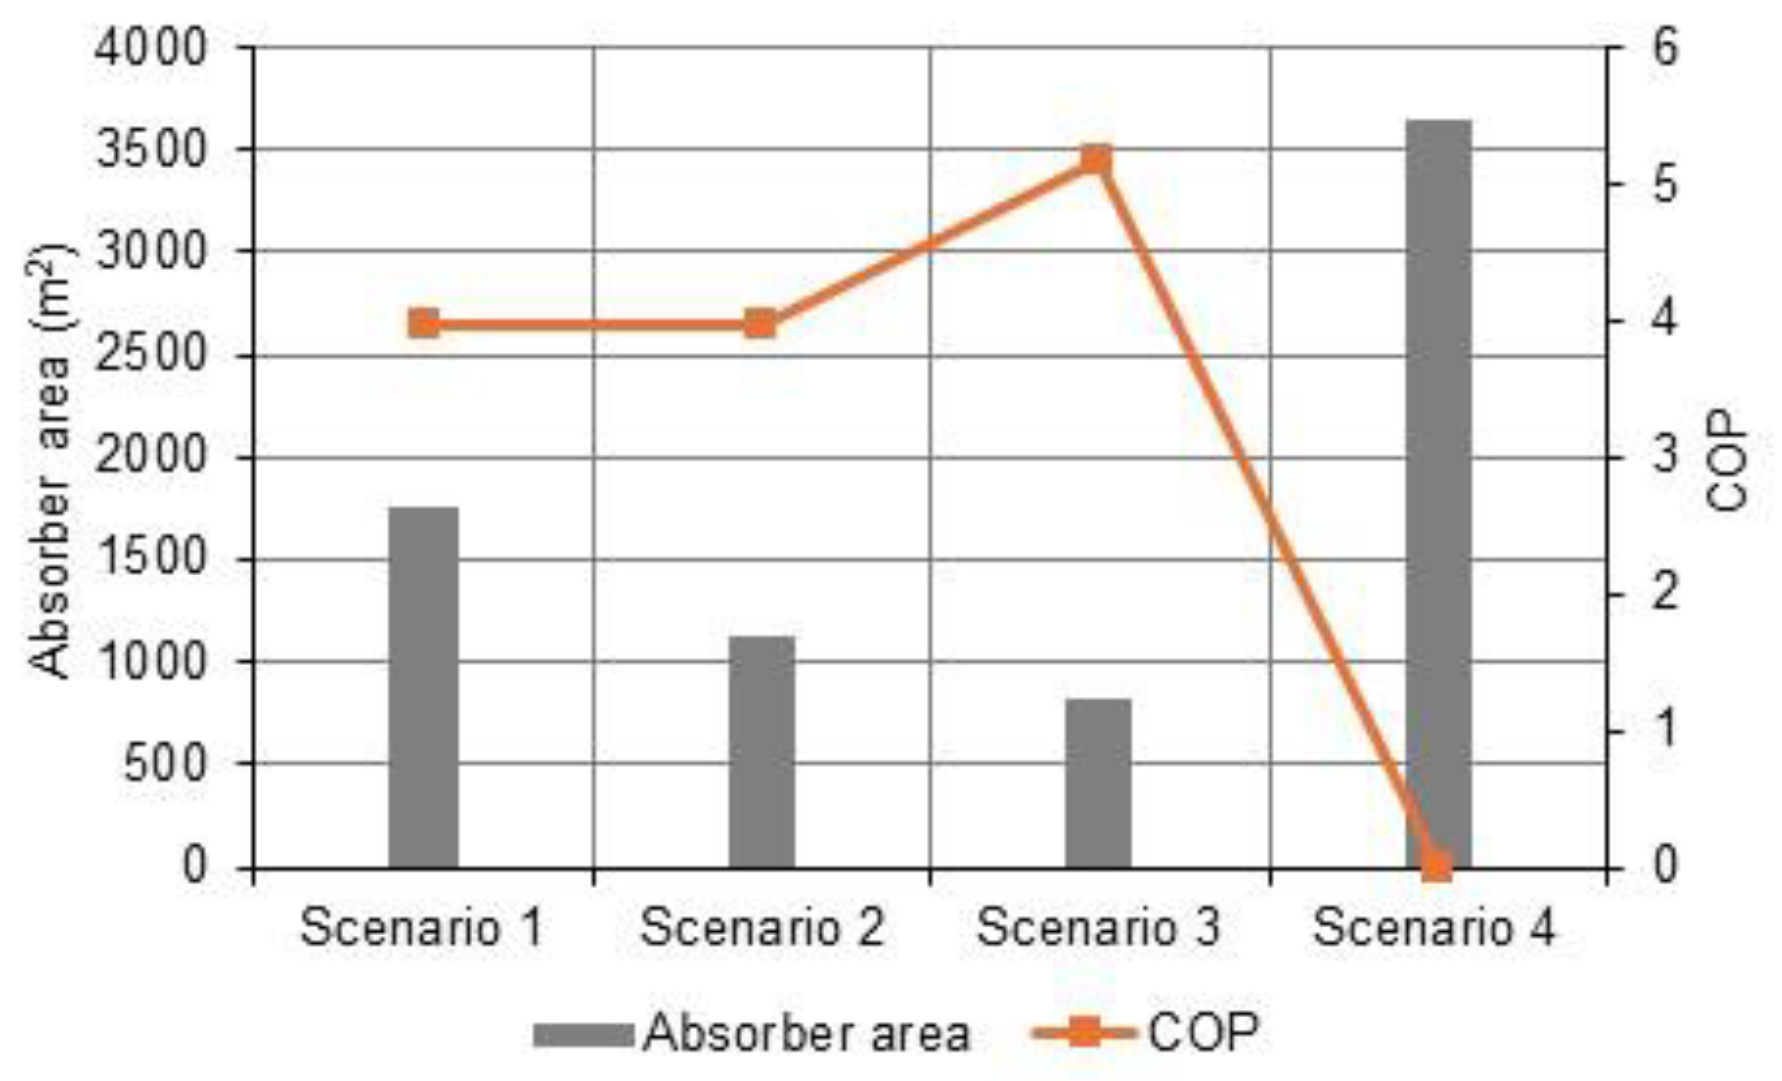
  • Scenario 1. For the critical weather conditions of the winter period, the proposed solar thermal system is considered to store energy at 40 °C. The solar thermal system heats all the water to 40 °C to operate both the heat pump and supply the process. A total of 83% of the 18.5 m3 of hot water in the process was passed to the heat pump to reach 90 °C. In these extreme weather conditions, the solar thermal system cannot reach 60 °C;
  • Scenario 2. Under average weather conditions of the winter period, it is considered that the proposed solar thermal system generates all the hot water at 40 °C. Of the 18.5 m3 of hot water for the process, 17% of the hot water was required at 40 °C, and the remaining 83% was passed to the heat pump to reach 90 °C;
  • Scenario 3. Under average weather conditions of the winter period, it is considered that the solar thermal system generates and stores all the hot water at 60 °C. Of the 18.5 m3 of hot water, 6.6 m3 was required at a temperature less than or equal to 60 °C, and 11.9 m3 was passed to the heat pump to reach 90 °C;
  • Scenario 4. The solar thermal installation is designed without the integration of the heat pump; it is considered that the solar system has the capacity to capture and store the amount of hot water for 3 consecutive days. When weather conditions are critical, hot water will be taken from the thermal storage system.
Figure 6 shows a summary of the relationship between absorber area and irradiance levels of the different scenarios.
Table 5 contains the results of the scenarios described above. The most representative parameters of the proposed system are shown.
Based on the results, the use of the proposed system (scenario 1) to produce solar heat from the process is viable, and greenhouse gas emissions are also eliminated. The levelized cost of thermal energy (LCOH) in the most critical conditions of the winter period was estimated at 0.094 USD/kWh, with an absorber area of 880 m2. Compared to the design under average winter conditions, the required absorber area is reduced by 75% and 40% for temperatures between 40 °C and 60 °C. A competitive energy cost in scenario 1 occurs when the system operates in critical conditions, and the energy objectives are achieved even in the most adverse conditions. The solar thermal installation without the integration of the heat pump (scenario 4) has the capacity to supply the energy services of the process at the lowest cost (0.044 USD/kWh) for a period of 3 consecutive days. In scenario 4, the thermal collector network and storage have greater capacity compared to the most critical scenario; the area increases 2.2 times, and the storage grows 20%.
Figure 7 exemplifies the behavior of LCOH (also represented as LCOEth) with respect to simple payback.
Figure 8 summarizes the relationship between the absorber area and COP of the heat pump in different scenarios.

4.2. Electric Power Production

In this work, the design of a solar thermal system–heat-pump–ORC is proposed to produce the electrical power of the process: 803.2 kWh per day to ensure the operation of the system during the winter period in critical and normal conditions. The solar thermal installation provides temperatures between 40 °C and 60 °C, and with the use of the heat pump, high temperatures around 100 °C are reached, which supplies the ORC.
Table 6 shows the results obtained from the system design: low temperature solar thermal–heat-pump–ORC. The evaluation was carried out considering that the solar thermal installation reaches a temperature of 40 °C operating in the most critical winter weather conditions (scenario 5) and a temperature of 60 °C in the average weather conditions of the winter period (scenario 6).
The proposed solar thermal–heat-pump–ORC system produces the electrical power required by the process during the winter period in the two reviewed scenarios, in addition to eliminating emissions into the atmosphere. In critical conditions of the winter period (2.65 kWh/m2/d), the area required for the proposed system to operate is 35 hectares; this is three times more than when the system operates in more favorable conditions (4.87 kWh/m2/d). The levelized cost of electric energy (LCOEele) in critical weather conditions is competitive compared to reported data (global average energy cost 0.153 USD per kWh in June 2023).
The refrigerant used in the design of the heat pump is R123 and is reported to have the following characteristics: critical temperature = 183.79 °C; critical pressure = 36.74 (×105) Pa; ODP = 93; and GWP = 0.02. The refrigerant used in the analysis of the organic Rankine cycle is R-600 and has the following properties: critical temperature = 151.85 °C; critical pressure = 33.1 (×105) Pa; ODP = 0; and GWP = 4.

5. Discussion

The analysis of data from 22 years of environmental conditions allowed us to quantify the available solar resources of a site and the number of atypical meteorological events where irradiation conditions were low. The use of percentiles for analysis of irradiation data allowed for the establishment of a classification of days with critical irradiance levels in Guanajuato city (<3.76 kWh/m2/d). Using the fifth percentile as a selection criterion allowed us to establish the periods of consecutive days with critical environmental conditions, finding that the maximum period was 7 consecutive days.
All scenarios managed to reduce emissions to zero by replacing the use of the boiler to produce the necessary process heat with a competitive energy cost.
In scenario 1, the proposed system satisfied the energy needs of the process by operating in the most critical environmental conditions of the year. The use of the heat pump guaranteed that the temperature for the process and the size of the installation were reached. The solar thermal network of collectors and storage systems provided the energy to operate the pump and the process at a lower temperature. This scenario was the only one that was sustainable in the long term, ensuring its operation for atypical events or days with extreme environmental conditions. For example, in 2012 and 2013, 7 consecutive days occurred, once every year.
In scenarios 2 and 3, the proposed system operates in clear-sky winter conditions, 4.78 kWh/m2/d and 17.3 °C; the solar thermal installation provides the heat load at temperatures of 40 and 60 °C. With a coupled heat pump, the temperature required by the process is reached. The size of the solar collector network to increase the temperature by 20 °C grew by 9.8%, with a reduction in the cost of energy (LCOH) of 0.018 USD/kWh.
Scenario 4 was also analyzed under clear-sky conditions; however, solar thermal energy was used without the use of a heat pump, and to ensure the operation of this system, the system was designed to operate for 3 consecutive days under clear-sky conditions. The solar collector network’s size is the largest, with an absorber area of 3640 m2. In this scenario, the energy cost and the payback are the lowest evaluated, but if critical conditions occur for more than 3 consecutive days, the system does not guarantee the supply for the process. Compared to scenario 1, the absorber area is 3.3 times larger, and the storage size increases by 20%.

6. Conclusions

In critical conditions, all the energy can be supplied to produce heat and electrical power for a cotton-dyeing process.
The design of solar thermal installation coupled to a heat pump, based on critical irradiance levels, can supply the energy required by the process throughout the year of operation.
The new design proposal guarantees continuous supply regardless of whether consecutive days with low irradiance increase or these events repeat.
The solar device installation area was reduced by 30%, and storage was reduced by 20%.
The new proposal guarantees the continuous supply of energy on operating days, even when the simple payback increases from 4.2 years to 14 years.

Author Contributions

Conceptualization, G.M.-R.; methodology, G.M.-R. and H.H.S.-M.; software, A.L.F.-S. and H.H.S.-M.; validation, G.M.-R. and A.L.F.-S.; formal analysis, G.M.-R. and A.L.F.-S.; investigation, A.L.F.-S. and H.H.S.-M.; resources, G.M.-R.; data curation, H.H.S.-M.; writing—original draft preparation, G.M.-R. and A.L.F.-S.; writing—review and editing, G.M.-R. and J.-C.B.; visualization, A.L.F.-S.; supervision, G.M.-R. and J.-C.B.; project administration, G.M.-R.; funding acquisition, G.M.-R. All authors have read and agreed to the published version of the manuscript.

Funding

APC was funded in part by Texas A & M University and the other part by the authors.

Data Availability Statement

Publicly available datasets were analyzed in this study and can be found in National Solar Radiation Data Base from National Renewable Energy Laboratory (NREL), years 1998 to 2019: https://nsrdb.nrel.gov/data-viewer. The validation was made with local database, property of Test Laboratory of University of Guanajuato for year 2011. This dataset is not readily available because the data are part of some ongoing studies and there are agreements with funding organizations where they establish restrictions on sharing data. Requests should initially be directed to Guillermo Martínez-Rodríguez, [email protected]

Acknowledgments

The authors thank Evangelina Sánchez-García for her support in the data search and editing of the manuscript. Likewise, to Jazmín Martínez-Sánchez, for her support in managing some programs for performing calculations.

Conflicts of Interest

The authors declare no conflicts of interest. The funders had no role in the design of the study, in the collection, analyses, or interpretation of data, in the writing of the manuscript, or in the decision to publish the results.

References

  1. Martínez-Rodríguez, G.; Fuentes-Silva, A.L.; Velázquez-Torres, D.; Picón-Núñez, M. Comprehensive solar thermal integration for industrial processes. Energy 2022, 239 Pt D, 122332. [Google Scholar] [CrossRef]
  2. Fink, C.; Preis, D. Roadmap “Solarwärme 2025”. Eine Technologie- und Marktanalyse mit Handlungsempfehlungen. Berichte aus Energie- und Umweltforschung 42/2014; BMVIT: Wien, Austria, 2014; pp. 42–46. [Google Scholar]
  3. Weiss, W.; Spörk-Dür, M. Solar Heat Worldwide. Global Market Development and Trends in 2018. Detailed Market Figures 2017. 2019 Edition; AEE—Institute for Sustainable Technologies: Gleisdorf, Austria, 2019. [Google Scholar]
  4. Karki, S.; Haapala, K.R.; Fronk, B.M. Technical and economic feasibility of solar flat-plate collector thermal energy systems for small and medium manufacturers. Appl. Energy 2019, 254, 113649. [Google Scholar] [CrossRef]
  5. Ahmed, S.F.; Khalid, M.; Vaka, M.; Walvekar, R.; Numan, A.; Rasheed, A.K.; Mubarak, N.M. Recent progress in solar water heaters and solar collectors: A comprehensive review. Therm. Sci. Eng. Prog. 2021, 25, 100981. [Google Scholar] [CrossRef]
  6. Tschopp, D.; Tian, Z.; Berberich, M.; Fan, J.; Perers, B.; Furbo, S. Large-scale solar thermal systems in leading countries: A review and comparative study of Denmark, China, Germany and Austria. Appl. Energy 2020, 270, 114997. [Google Scholar] [CrossRef]
  7. Olczak, P.; Matuszewska, D.; Zabagło, J. The Comparison of Solar Energy Gaining Effectiveness between Flat Plate Collectors and Evacuated Tube Collectors with Heat Pipe: Case Study. Energies 2020, 13, 1829. [Google Scholar] [CrossRef]
  8. Sokhansefat, T.; Kasaeian, A.; Rahmani, K.; Heidari, A.H.; Aghakhani, F.; Mahian, O. Thermoeconomic and environmental analysis of solar flat plate and evacuated tube collectors in cold climatic conditions. Renew. Energy 2018, 115, 501–508. [Google Scholar] [CrossRef]
  9. Weiss, W. Spörk-D Global market development and trends in 2019. Sci. Technol. Built Environ. 2019, 24, 819. [Google Scholar]
  10. AbdEl-Rady, M.; Elhenawy, Y.; Bassyouni, M.; Majozi, T.; Toderas, M.; Al-Qabandi, O.A.; Kishk, S.S. Performance enhancement of flat-plate and parabolic trough solar collector using nanofluid for water heating application. Results Eng. 2024, 21, 101673. [Google Scholar] [CrossRef]
  11. Ajeena, A.M.; Farkas, I.; Víg, P. Energy and exergy assessment of a flat plate solar thermal collector by examine silicon carbide nanofluid: An experimental study for sustainable energy. Appl. Therm. Eng. 2024, 236, 121844. [Google Scholar] [CrossRef]
  12. Zheng, J.; Febrer, R.; Castro, J.; Kizildag, D.; Rigola, J. A new high-performance flat plate solar collector. Numerical modelling and experimental validation. Appl. Energy 2024, 355, 122221. [Google Scholar] [CrossRef]
  13. Wang, D.; Mo, Z.; Liu, Y.; Ren, Y.; Fan, J. Thermal performance analysis of large-scale flat plate solar collectors and regional applicability in China. Energy 2022, 238, 121931. [Google Scholar] [CrossRef]
  14. Vahidinia, F.; Khorasanizadeh, H. Development of new algebraic derivations to analyze minichannel solar flat plate collectors with small and large size minichannels and performance evaluation study. Energy 2021, 228, 120640. [Google Scholar] [CrossRef]
  15. Bahrami, A.; Okoye, C.O.; Pourasl, H.H.; Khojastehnezhad, V.M. Techno-economic comparison of fixed and tracking flat plate solar collectors in the northern hemisphere. J. Clean. Prod. 2022, 378, 134523. [Google Scholar] [CrossRef]
  16. Bellos, E.; Tzivanidis, C. A detailed investigation of an evacuated flat plate solar collector. Appl. Therm. Eng. 2023, 234, 121334. [Google Scholar] [CrossRef]
  17. Weiss, W.; Spörk-Dür, M. Solar Heat Worldwide. Global Market Development and Trends 2021. Detailed Market Figures 2020. 2022 Edition; AEE—Institute for Sustainable Technologies: Gleisdorf, Austria, 2022. [Google Scholar]
  18. Quiñones, G.; Felbol, C.; Valenzuela, C.; Cardemil, J.M.; Escobar, R.A. Analyzing the potential for solar thermal energy utilization in the Chilean copper mining industry. Sol. Energy 2020, 197, 292–310. [Google Scholar] [CrossRef]
  19. Polikarpova, I.; Kakis, R.; Pakere, I.; Blumberga, D. Optimizing Large-Scale Solar Field Efficiency: Latvia Case Study. Energies 2021, 14, 4171. [Google Scholar] [CrossRef]
  20. Martínez-Rodríguez, G.; Baltazar, J.-C.; Fuentes-Silva, A.L. Heat and electric power production using heat pumps assisted with solar thermal energy for industrial applications. Energy 2023, 282, 128379. [Google Scholar] [CrossRef]
  21. Perers, B.; Zinko, H.; Holst, P. Analytical Model for the Daily Energy Input Output Relationship for Solar Collector Systems; Swedish Council for Building Research: Stockholm, Sweden, 1985. [Google Scholar]
  22. Fawas, S.; Aziz, F.; Ali, F. Evaluation of the Best Slope Angle for a Flat-Plate Solar Collector. Kirkuk J. Sci. 2017, 12, 157–178. [Google Scholar] [CrossRef]
  23. Furbo, S.; Dragsted, J.; Perers, B.; Andersen, E.; Bava, F.; Nielsenb, K.P. Yearly thermal performances of solar heating plants in Denmark—Measured and calculated. Sol. Energy 2018, 159, 186–196. [Google Scholar] [CrossRef]
  24. Gao, D.; Gao, G.; Cao, J.; Zhong, S.; Ren, X.; Dabwan, Y.N.; Hu, M.; Jiao, D.; Kwan, T.H.; Pei, G. Experimental and numerical analysis of an efficiently optimized evacuate flat plate solar collector under medium temperature. Appl. Energy 2020, 269, 115129. [Google Scholar] [CrossRef]
  25. Bolognese, M.; Viesi, D.; Bartali, R.; Crema, L. Modeling study for low-carbon industrial processes integrating solar thermal technologies. A case study in the Italian Alps: The Felicetti Pasta Factory. Sol. Energy 2020, 208, 548–558. [Google Scholar] [CrossRef]
  26. IRENA. Renewable Energy Prospects: Mexico, REmap 2030 Analysis; IRENA: Abu Dhabi, United Arab Emirates, 2015; Available online: www.irena.org/remap (accessed on 10 January 2023).
  27. Castillejo-Cuberos, A.; Escobar, R. Understanding solar resource variability: An in-depth analysis, using Chile as a case of study. Renew. Sustain. Energy Rev. 2020, 120, 109664. [Google Scholar] [CrossRef]
  28. Vignola, F.E.; McMahan, A.C.; Grover, C.N. Bankable Solar-Radiation Datasets. In Solar Energy Forecasting and Resource Assessment; Academic Press: Cambridge, MA, USA, 2013; pp. 97–131. [Google Scholar] [CrossRef]
  29. Sengupta, M.; Habte, A.; Wilbert, S.; Gueymard, C.A.; Remund, J. Best Practices Handbook for the Collection and Use of Solar Resource Data for Solar Energy Applications, 3rd ed.; National Renewable Energy Laboratory: Golden, CO, USA, 2021. [Google Scholar] [CrossRef]
  30. Yakoubi, H.; EL Mghouchi, Y.; Abdou, N.; Hajou, A.; Khellouki, A. Correlating clearness index with cloud cover and other meteorological parameters for forecasting the global solar radiation over Morocco. Optik 2021, 242, 167145. [Google Scholar] [CrossRef]
  31. National Renewable Energy Laboratory [NREL]. NSRDB: National Solar Radiation Data Base. January 2023. Available online: https://nsrdb.nrel.gov/data-viewer (accessed on 10 December 2023).
  32. Martínez-Rodríguez, G.; Fuentes-Silva, A.L.; Lizárraga-Morazán, J.R.; Picón-Núñez, M. Incorporating the Concept of Flexible Operation in the Design of Solar Collector Fields for Industrial Applications. Energies 2019, 12, 570. [Google Scholar] [CrossRef]
  33. Díaz-de-León, C.; Baltazar, J.-C.; Martínez-Rodríguez, G. Assessment of a Heat Pump Assisted with Solar Thermal Energy for an lndustrial Batch Process. Chem. Eng. Trans. 2022, 94, 319–324. [Google Scholar] [CrossRef]
  34. Martínez-Rodríguez, G.; Díaz-de-León, C.; Fuentes-Silva, A.L.; Baltazar, J.-C.; García-Gutiérrez, R. Detailed Thermo-Economic Assessment of a Heat Pump for Industrial Applications. Energies 2023, 16, 2784. [Google Scholar] [CrossRef]
  35. US EPA. GHG Emission Factors Hub. 3 April 2023. Available online: https://www.epa.gov/system/files/documents/2023-03/ghg_emission_factors_hub.pdf (accessed on 12 April 2023).
  36. Martínez-Rodríguez, G.; Baltazar, J.-C.; Fuentes-Silva, A.L.; García-Gutiérrez, R. Economic and Environmental Assessment Using Two Renewable Sources of Energy to Produce Heat and Power for Industrial Applications. Energies 2022, 15, 2338. [Google Scholar] [CrossRef]
  37. Espejo-Mamani, C.E.; Gomez-Ramos, C.J. Improvement of the Dyeing Process through the Reuse of Water Baths in the Dyeing Area of the Textile Company “La Merced S.A.” within the Framework of Cleaner Production. Bachelor Thesis, Universidad Privada del Norte, Trujillo, Peru, 2017. (In Spanish). [Google Scholar]
  38. Texas AM& University. Utilities & Energy Services. Available online: https://utilities.tamu.edu/rates/ (accessed on 17 January 2024).
Figure 1. Frequency graph of environmental conditions in the selected percentiles.
Energies 17 01087 g001
Figure 2. Data analysis algorithm for 5th percentile.
Energies 17 01087 g002
Figure 3. Solar thermal system–thermal storage system–heat pump to produce: (a) process heat or (b) electric power through an organic Rankine cycle. In part (a), the flow direction of hot stream on the load side of the heat pump represents that the storage system supplies low-temperature heat to both the heat-pump evaporator and the process independently.
Energies 17 01087 g003
Figure 4. Heat pump performance for different ΔTlift.
Energies 17 01087 g004
Figure 5. Simplified diagram of the cotton-dyeing process.
Energies 17 01087 g005
Figure 6. Behavior of the absorber area for two irradiance levels (critical and winter average).
Energies 17 01087 g006
Figure 7. Decreasing behavior of LCOH (also represented as LCOEth) and a simple payback of the proposed system for the 4 scenarios.
Energies 17 01087 g007
Figure 8. Relationship of the absorber area and performance of the heat pump for different scenarios.
Energies 17 01087 g008
Table 1. Results of data analysis of environmental conditions.
PercentileDaily Solar
Irradiation
(kWh/m2)
Period of Sunlight
(h)
Average Global Solar Radiation
(W/m2)
Average Ambient Temperature (°C)Average Wind Velocity
(m/s)
q 5 3.7611.3726417.03.40
q 10 4.3611.5335718.72.92
q 15 4.7711.4940119.12.84
q 20 5.0411.3443619.32.77
q 25 5.2511.2746019.22.78
q 30 5.4211.2147919.02.72
q 35 5.5911.1549618.93.02
q 40 5.7711.4350019.72.87
q 45 5.9711.5251420.22.88
q 50 6.2011.7851920.63.02
q 55 6.4412.0152821.03.10
q 60 6.6612.0654521.72.87
q 65 6.8612.0956122.03.09
q 70 7.0812.2257222.73.04
q 75 7.3212.2658922.73.18
q 80 7.5712.3860323.33.23
q 85 7.8312.4562123.73.30
q 90 8.0712.5463524.33.40
q 95 8.3512.6365224.73.48
q 99 8.6512.9365925.23.84
Table 2. Analysis of percentiles of the total data processed for solar irradiation.
Percentile2015105
Solar
Irradiation (kWh/m2/d)
5.044.774.363.76
Table 3. List of consecutive days under critical solar irradiation conditions corresponding to q 5 (I < 3.76 kWh/m2).
Year/Consecutive Days (Period)765432
1998000002
1999000112
2000000111
2001000000
2002000005
2003000005
2004000027
2005000002
2006000112
2007000134
2008000023
2009000004
2010000226
2011000013
2012100117
2013100134
2014000004
2015000005
2016000111
2017000000
2018000039
2019000004
Total (period)20071259
Total (years)20081220
Table 4. Average weather conditions for the critical conditions corresponding to the 5th percentile.
Annual
Season
Hours (h)Global
Radiation (W/m2)
Ambient Temperature (°C)Wind
Velocity (m/s)
Solar
Irradiation (kWh/m2/d)
Spring/Summer12.9026719.43.373.44
Autumn/Winter10.6725014.63.152.65
Table 5. Results of the operation of the proposed system.
Scenario 1Scenario 2Scenario 3Scenario 4
Weather conditions of the winter periodCriticalAverageAverageAverage
  • Solar thermal installation
Storage temperature, °C40406090
Heat load, kWh1444130114284742
Operation time, h10.510.510.58.0
Working fluidWater WaterWaterWater
Daily irradiation, kWh/m2/d2.654.874.874.87
Inlet temperature of water, °C14.617.317.317.3
Absorber area, m2176011208163640
Stored water volume, m346.546.528.555.8
  • Heat pump
RefrigerantR123R123R123-
Mass flow, kg/s3.203.202.41-
Heat load (evaporator), kW375375330-
Superheated steam temperature, °C103103102-
Energy consumed by the compressor, kW13113179-
ΔTlift, °C707055-
COP3.983.985.18-
LCOEth or LCOH, USD/kWh0.0940.0740.0560.044
Payback, years14.112.29.04.2
GHG Emissions, ton/y0000
Prices of HHW (Heating Hot Water): 0.063 USD/kWh [38]. ΔTlift is the difference between the condenser and evaporator temperatures.
Table 6. System results: low temperature solar thermal network–heat-pump–ORC.
Scenario 5Scenario 6
Weather conditions of the winter periodCritical Average
  • Solar thermal installation
Storage temperature, °C4060
Working fluidWaterWater
Daily irradiation, kWh/m2/d2.654.87
Heat load, kW71367968
Inlet temperature of water, °C14.617.3
Absorber area, m228,7207252
Stored water volume, m3229165
  • Heat pump
RefrigerantR123R123
Mass flow, kg/s19.018.2
Heat load (evaporator), kW22302490
Superheated steam temperature, °C103102
Energy consumed by the compressor, kW777597
ΔTlift, °C7055
COP3.985.18
  • Organic Rankine Cycle
Electric power, kW251251
Operation time, h3.23.2
RefrigerantR600R600
Mass flow, kg/s7.47.4
Heat load (evaporator), kW30943094
Superheated steam temperature, °C9090
Thermal efficiency ORC, %7.767.76
LCOEele, USD/kWh0.2780.149
Payback, years24.010.2
GHG Emissions, ton/y00
ΔTlift is the difference between the condenser and evaporator temperatures.
Disclaimer/Publisher’s Note: The statements, opinions and data contained in all publications are solely those of the individual author(s) and contributor(s) and not of MDPI and/or the editor(s). MDPI and/or the editor(s) disclaim responsibility for any injury to people or property resulting from any ideas, methods, instructions or products referred to in the content.

