1. Introduction
Despite the Paris Agreement established in 2016, the concentration of greenhouse gases in the atmosphere continues to rise, making urgent the need for cleaner alternative technologies [
1,
2]. Since the transportation sector accounts for about one quarter of the global total emissions, of which 61% is associated with passenger cars, the development of environmentally friendly vehicles is crucial to support a green energy transition [
3]. In this scenario, several nations worldwide are betting on hydrogen fuel as a relevant part of near-zero-emission transportation [
4,
5]. Hydrogen fuel can be used to power either a fuel cell vehicle (HFCV) or an internal combustion engine vehicle (HICEV) [
6,
7]. In both technologies, no carbon emissions are produced when driving the car, which makes hydrogen-powered vehicles highly promising to reduce greenhouse emissions. Therefore, hydrogen-powered cars are already available on the market. To date, Toyota and Hyundai are currently commercializing fuel cell passenger cars, i.e., Mirai and NEXO models [
8]. Regarding hydrogen combustion engines, even though none is currently in the market, companies such as Toyota, BMW, Hyundai, and Honda are conducting research and planning to release hydrogen combustion engine passenger cars soon [
8,
9,
10]. Whereas both vehicles use hydrogen as fuel, the technologies are quite different, which results in different powertrain components as further described.
In the HFCV, a fuel cell device, i.e., a polymer electrolyte membrane (PEM) in commercial vehicles, is employed to produce electricity. In this device, hydrogen oxidation and oxygen reduction take place in different electrodes separated by a membrane, and thus, electrons flow between the electrodes to generate energy. This device is more efficient than combustion engines; however, the vehicle powertrain needs to be more complex. Due to the fuel cell start-up delay, a battery and a controller are usually needed to support and split the vehicle’s power. Further, this vehicle is also composed of an electrical motor, and a single-step gear is sufficient. In the case of HICEV, with a similar powertrain to the conventional internal combustion engines (ICE), e.g., petrol cars, the hydrogen fuel is ignited, which causes a piston to move, providing mechanical energy to move the wheels. Thus, the implementation of hydrogen combustion engines could be facilitated due to the similarity to conventional vehicles and their reduced powertrain components. Despite the growing interest in hydrogen-powered vehicles, studies on hydrogen fuel cells and combustion engine vehicles are mostly reported separately, and the straightforward comparison between both powertrains is still a gap in the scientific literature. Thus, even though several studies investigate one of the hydrogen-powered vehicle technologies, a direct comparison regarding their powertrain efficiency and their carbon emissions is a topic yet to be explored [
11,
12,
13,
14,
15].
Therefore, the aim of this work is the design and modeling of the powertrain of a hydrogen fuel cell passenger car versus a hydrogen combustion engine passenger car in terms of hydrogen/energy consumption. Besides that, we aim to address the efficiency and carbon emissions by considering different hydrogen production sources to assess the potential of these technologies to reduce greenhouse emissions compared to conventional petrol-powered vehicles. Hydrogen can be produced from renewable sources such as solar and wind energy using electrolysis, the reverse process of the one that occurs in fuel cells. In this case, the hydrogen is called green hydrogen. However, most of the hydrogen used today comes from methane reform, a process that results in carbon emissions. This type of hydrogen is called grey hydrogen, or even blue hydrogen for the cases where a carbon capture process is added. Therefore, the hydrogen production source is of high relevance aiming at a cleaner technology. Thus, some specific contributions of this work are as follows:
Determination of hydrogen/energy consumption for a hydrogen fuel cell versus hydrogen internal combustion engine considering a medium-sized passenger car for the Worldwide Harmonized Light Vehicles Test Procedure (WLTP) driving cycle;
Evaluation and comparison of the performance of the hydrogen fuel cell vehicle versus hydrogen internal combustion engine considering the lower and higher speed region for the WLTP driving cycle;
Addressing of carbon emissions and fuel costs relating to the hydrogen fuel cell vehicles versus the hydrogen internal combustion engine, considering different hydrogen production methods (grey, green, and blue hydrogen) and their comparison with petrol-powered vehicles.
Document Outline
This study is divided into the following main sections: design and modeling (
Section 2); simulation analysis (
Section 3); limitations and future research (
Section 4); and conclusions (
Section 5).
Section 2 is composed of four subsections. The
Section 2.1 is related to both HFCV and HICE model implementation. The
Section 2.2 and
Section 2.3 describe the vehicle powertrain, respectively, for the HFCV and HICEV. Last, the
Section 2.4 describes the data used for the environmental and cost comparison of the models investigated.
Section 3 is also divided into 4 subsections. The
Section 3.1 and
Section 3.2 are related to the comparison of different component losses for the two models, such as the electric machine, the combustion engine, and the fuel cell. The
Section 3.3 describes the whole vehicle’s powertrain efficiency and the hydrogen consumption for both vehicles also considering the speed range. The
Section 3.4 addresses the carbon emissions and fuel cost considering the vehicle fueled with grey, blue, and green hydrogen as well as its comparison with petrol-fueled vehicles. Finally, the limitations, future research, and conclusions are summarized in the last main sections.
2. Design and Modeling
2.1. System Diagram and Driving Cycle
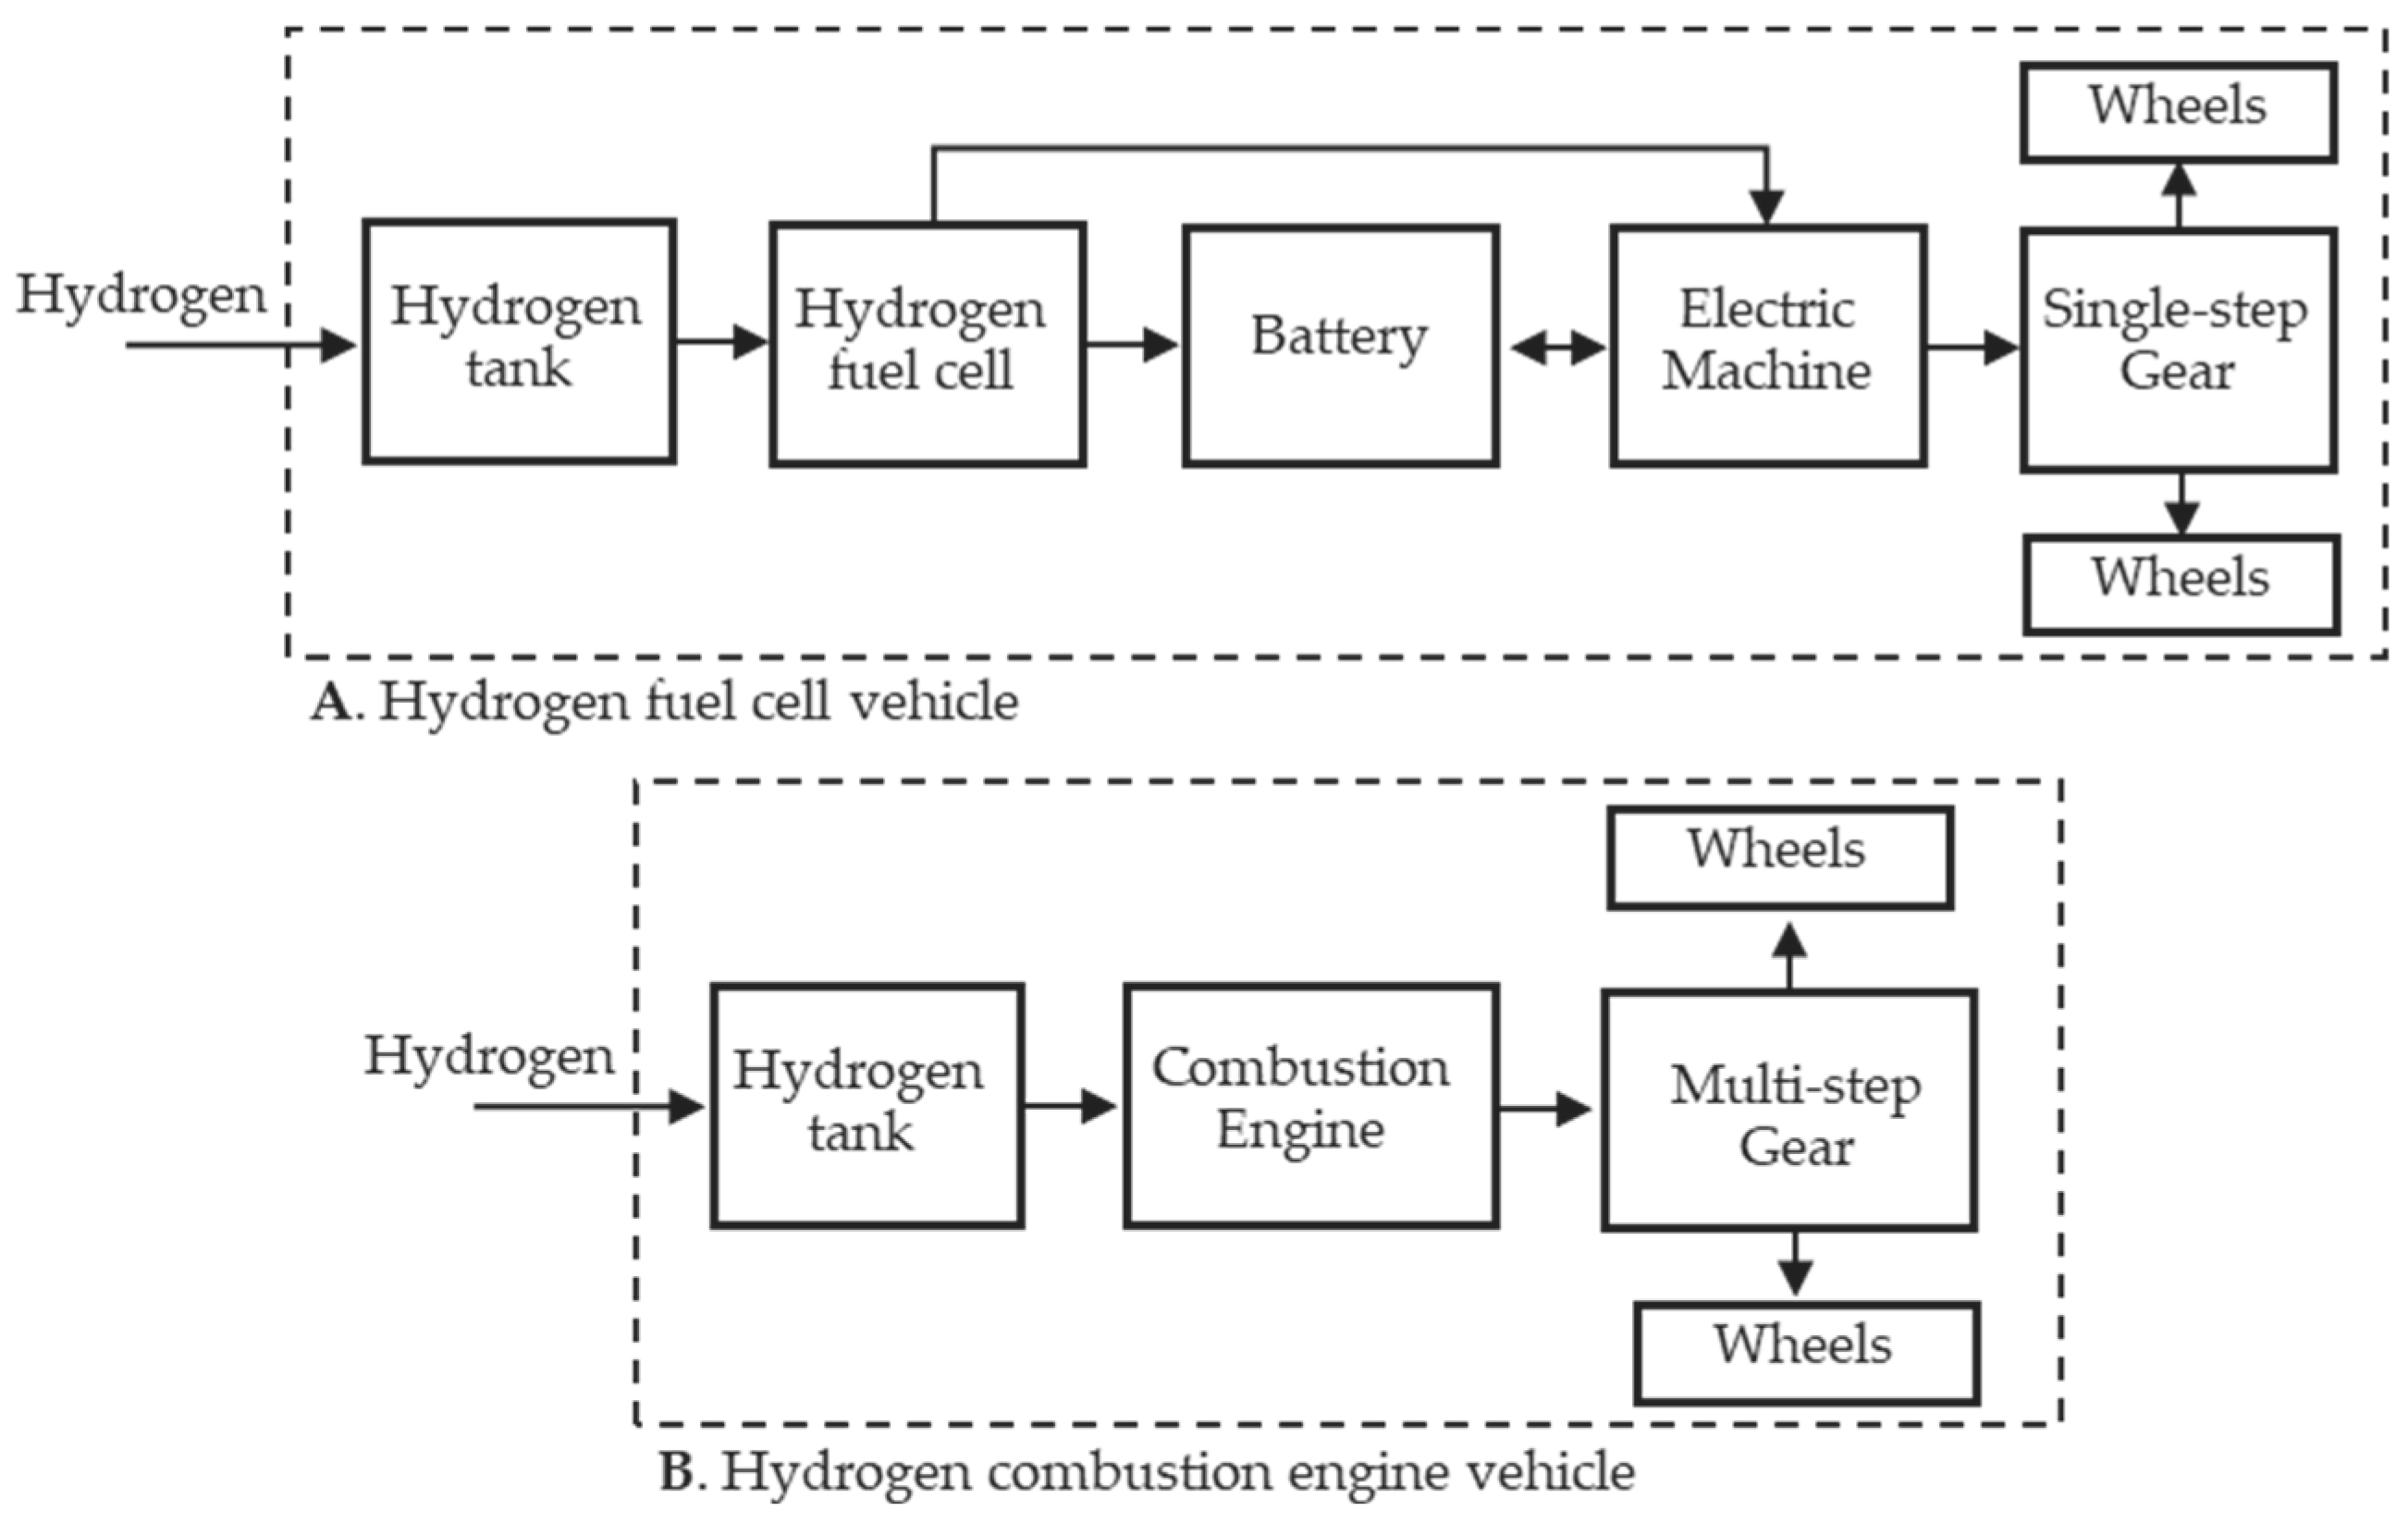
The design and modeling of two different powertrains were investigated in this work: fuel cell and internal combustion engine, both hydrogen-powered. For the HFCV powertrain, the main components were the wheels (vehicle dynamics), the single-step gear, the electric machine, the battery, the fuel cell, and the hydrogen tank. Meanwhile, the HICEV powertrain was composed of the wheels (vehicle dynamics), the gear, the combustion engine, and the hydrogen tank.
Figure 1 illustrates the system diagram for each of the powertrains considered.
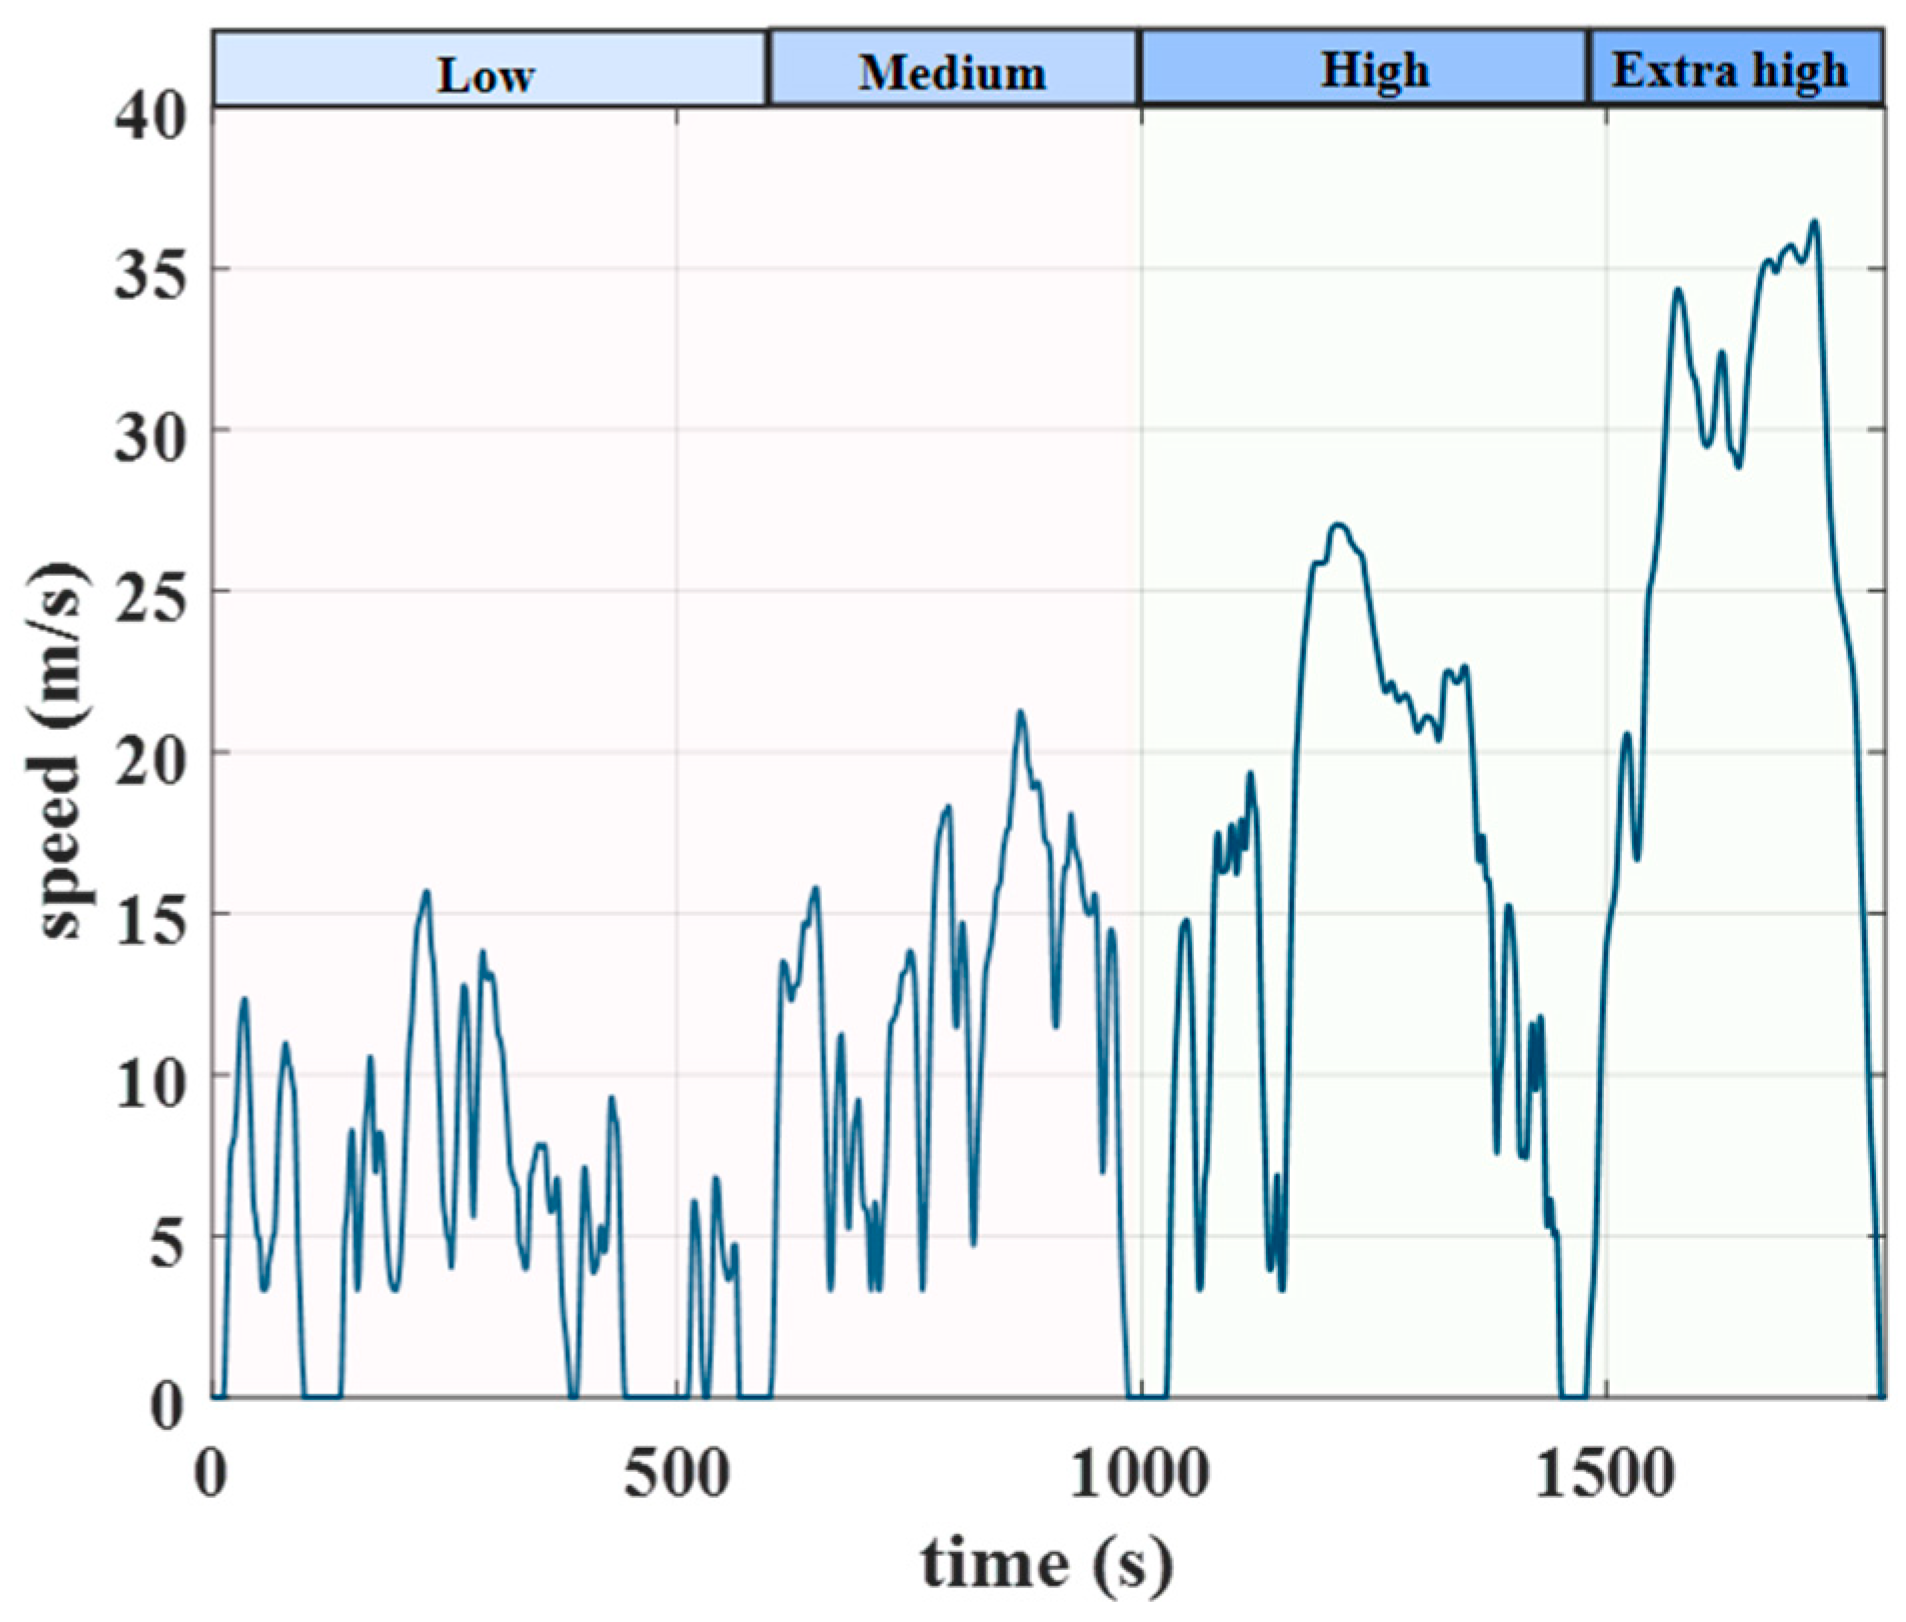
The powertrain energy system has been designed and modeled using the QSS-TB (quasistatic simulation toolbox) in Simulink considering the Worldwide Harmonized Light Vehicles Test Procedure (WLTP) as the driving cycle reference, which is the current driving cycle used for vehicle model approval in Europe [
16]. The original WLTP cycle is divided into four parts, consisting of low, medium, high, and extra-high speed, as shown in
Figure 2. For our analysis, besides analyzing the whole cycle, we have also divided the cycle into two sequences: one containing low and medium speeds, referred to here as WLTP-LS, and the other with high and extra-high speeds, referred to here as WLTP-HS. This approach allows us to identify whether one vehicle is more efficient at low or high speed. Through this analysis, a more accurate and meaningful comparison of fuel consumption between the vehicles’ powertrains can be performed.
Aiming at a practical evaluation, parameters based on a commercialized HFCV, i.e., Toyota Mirai [
17,
18,
19], were considered if available in reported data. Otherwise, standard values from the QSS tool were utilized. All the parameters implemented will be detailed in the further sections. For a reasonable comparison, similar components for the HICEV were implemented with similar parameters as the HFCV, exceptional cases will be stated. The power converters, i.e., the dc/dc converter between the battery and the fuel cell as well as the dc/ac converter between the electric machine and the fuel cell and the batter, were assumed to have neglected losses. All the components were modeled in a steady state and will be further described in the following sections, first for the HFCV and then for the HICEV.
2.2. Hydrogen Fuel Cell Vehicle (HFCV)
2.2.1. Vehicle Dynamics Model
The driving force that comes to the wheels from the powertrain has been modeled considering the mechanical equations for the vehicle’s dynamics: friction (
Fa) (aerodynamic drag), rolling resistance (
Fr), grading (
Fg), and acceleration forces (
Facc) [
20]. Thus, the sum of the driving forces that come to the wheels from the powertrain, referred to here as
Fwheels, is the sum of those 4 forces (
Fa,
Fr,
Fg,
Facc) as:
and each of the other forces considered can be described as
The vehicle dynamics parameters used are described in
Table 1.
2.2.2. Single-Step Gear
The single-step gear for the HFCV was modeled at a fixed efficiency of 95% based on a previous report [
21]. The gear ratio was calculated as a ratio of the electric machine’s top speed and the vehicle’s top speed:
which gives a gear ratio (
of 8.63. The gear specifications are described in
Table 2.
2.2.3. Electric Machine
The electric machine is implemented in the HFCV to convert electric power into mechanical power. The electric machine torque can be calculated as:
while its speed in rpm (
nEM) can be calculated as:
To scale the electric machine in the QSS-TB [
22] to fit this model, a scaling factor of 4.29 was implemented based on the Toyota Mirai specification for maximum torque (300 Nm). Furthermore, the revolutions were scaled to 12,000 rpm to meet the specifications of the electric machine as described in
Table 2.
2.2.4. Battery
The battery was modeled using a generic battery model previously reported [
23], in which the battery voltage is described as:
where
is the battery open-circuit voltage,
K is the polarization voltage,
Q is the battery capacity,
A is the exponential zone amplitude,
B is the exponential zone time constant inverse, and
is the battery current. The battery current was calculated as a function of the power and voltage:
and the battery state of charge (
SOC) can then be described as:
The same model was used for both charging and discharging modes. Each battery cell has a voltage of 1.2 V. The battery pack is composed of 34 modules of 6 cells, totaling 204 cells in series with a total capacity of 1.6 kWh. The initial SOC level was defined after pre-simulation studies to meet the same initial and final SOC level for one WLTP driving cycle as well as to keep the SOC between 40 and 60%, as indicated in [
24]. Thus, the initial SOC was 47.4, 48.7, and 48.0%, respectively, for the whole WLTP driving cycle, the region composed of low and medium speed (WLTP-LS), and the region composed of high and extra-high speed (WLTP-HS). The battery parameters are described in
Table 3.
2.2.5. Fuel Cell
The fuel cell voltage was implemented using the QSS model [
22], in which it is modeled as a linear function of its current density:
where
is the number of cells of the fuel cell stack and
is the area of the fuel cell stack, and
can be calculated from the fuel cell power and voltage as:
The fuel cell profile can be simplified as a linear function of its current density if its operation is in the ohmic region which is favored by the control system, as explained in the next section. The fuel cell efficiency was calculated considering the theoretical voltage for each cell of 1.2 V, and a fixed efficiency of 85% was added regarding the air compressor. The parameters used for the fuel cell model are described in
Table 4.
The fuel cell tank model was identical for both powertrains and considered the lower heating value (
Hu) and hydrogen density (
ρf) to calculate the fuel mass flow. The storage is at 700 bar and 20 °C storage. The parameters for the hydrogen tank are described in
Table 5.
2.2.6. Management Control System
A controller was implemented to split the power between the fuel cell and the battery in the HFCV. Three controller modes were designed. (1) The first mode is when the car decelerates, in other words, the power to the wheels is negative. In this mode, since just the battery can store the energy that comes from the electric machine, then in the case of braking, the power always transfers from the electric machine to the battery. (2) The second mode is when the power required by the wheels is positive but lower than the fuel cell’s minimum power. A minimum power for the fuel cell should be set to avoid lower efficiencies related to mass transfer issues when the power is lower than a certain value. Based on a previous report on Toyota Mirai, a power requirement lower than 6 kW drastically reduces the fuel cell efficiency and should be avoided [
19]. This means that maximum fuel cell efficiency would be around 65% at the minimum power. This avoids the fuel cell operation in the activation area and favors its operation in the ohmic region. Thus, for power requirements lower than 6 kW, only the battery sends power to the electric machine. (3) For all the other cases, the power from the battery and the fuel cell is a linear function of the SOC. Thus, the higher the SOC, the more power that comes from the battery and less power that comes from the fuel cell. Thus, this management system keeps the fuel cell operation as close as possible to the fuel cell peak efficiency according to the battery SOC. The power that comes from the battery (
Pbatt) and the fuel cell (
Pfc) can be defined as:
where
refers to the total power required from the energy source, and
refers to a constant related to the drive cycle to keep the SOC between 40 and 60%, as described in
Section 2.2.4, which was found to be 480, 280, and 620, respectively, for the whole WLTP driving cycle, the region composed of low and medium speed (WLTP-LS), and the region composed of high and extra-high speed (WLTP-HS).
2.3. Hydrogen Internal Combustion Engine (HICE)
To model the HICE, similar powertrain components to the HFCV, such as the wheels and hydrogen tank as described in
Figure 1, were designed as previously described in
Section 2.2.1 and
Section 2.2.5. The other powertrain components, i.e., the gear and combustion engine, were modeled as described in the following sections.
2.3.1. Multi-Step Gear
Since it is inefficient for single-step gears to be coupled with combustion engines, a 5-step gear was implemented in the HICEV. The multi-step gear was modeled as previously reported in [
25]. The first step was calculated based on the largest force acting on the wheels, as in (1), when a roading inclination of 30% is considered. Then, the ratio for the first gear (
k1
gear) was calculated as the ratio of the highest torque acting on the wheels and the maximum motor torque, i.e., 145 Nm. Meanwhile, the 5th gear ratio was calculated based on the wheel’s maximum angular speed using similar parameters to the HFCV vehicle electric machine described in
Table 2 and Equation (5). Thus, the minimum ratio was allocated for gear 1 and the maximum ratio for gear 5 (
k5
gear). Further, the ratios for gears 2 to 4 (
k2
gear–
k4
gear) were calculated by dividing the difference between the ratio of gears 1 and 5 in proportional spaces. The parameters used for the multi-step gear are summarized in
Table 6.
2.3.2. Combustion Engine
To model the hydrogen combustion engine, we included some modifications in the QSS engine block to adapt the model to fit the use of hydrogen as the fuel. First, the lower heating value (
Hu) and the density (
ρf) were changed considering that hydrogen fuel was stored at a pressure of 700 bar at a constant temperature of 20 °C. Thus, a lower heating value of 119.96 MJ·kg
−1 and a fuel density of 38.63 kg·m
−3 were assumed. An efficiency map, similar to that in a fossil fuel engine, was implemented using as an input parameter for the engine block a value based on the electric machine power from Toyota Mirai aiming at reasonable comparison between the vehicles. Furthermore, fuel-saving technologies, such as fuel cut-off and start/stop technology, were included in the model to agree with recent vehicle models, and standard values from QSS were applied [
22]. The parameters used for the combustion engine are described in
Table 7.
Apart from the cut-off and start/stop tools, other modern strategies are available for combustion engine vehicles to enable higher fuel savings, such as cylinder deactivation, turbocharging, variable valve timing, and direct fuel injection. If all of them are present in the vehicle’s system, savings of up to 25% should be possible [
26]. Thus, in our analysis, the comparison considering a maximum fuel saving for the combustion engine was included and will be presented together with the simulation analysis considering just the cut-off and start/stop strategies previously mentioned.
2.4. Hydrogen Production Methods: Carbon Emissions and Costs
To address the environmental impact and costs related to the hydrogen source, research data that considers the resources’ quantity and their carbon dioxide emissions and price for hydrogen production were combined. For this analysis, grey, blue, and green hydrogen were considered.
Concerning the carbon emissions, for both grey and blue hydrogen the same raw material consumption per m
3 of H
2 produced was considered [
27,
28]. The extra construction material needed for the carbon capture process was neglected in this analysis due to a lack of available data per kg of the produced hydrogen. However, a total carbon capture of 1.2 kg of CO
2 per kg of produced H
2 was included related to the manufacturing process [
27]. Further, additional natural gas, about 6% more, is needed in the system compared to the grey hydrogen to power the carbon capture process. The collected data have considered a production of 1.5 mi Nm
3 of H
2 per day and a factory lifespan of 20 years. The total CO
2 emissions of each raw material were obtained from different sources and databases [
29,
30,
31]. The consumption per kg of H
2 produced was calculated considering its density of 0.0899 kg/Nm
3. A total of 25.25 kg CO
2/kg H
2 and 16.64 kg CO
2/kg H
2, respectively, for grey and blue hydrogen was obtained. For the green hydrogen, data from a 1 MW proton exchange membrane electrolyzer (PEMEC) with a lifespan of 20 years using 35% solar and 65% wind power were considered [
32]. In that study, less than 5 kg of CO
2 per kg of produced H
2 was found including waste management.
Regarding the costs for the different hydrogen colors, data from a study in large-scale production plants that considered capital and operating costs per kg of H
2 produced were used for grey and blue hydrogen [
27] The production cost associated with grey and blue hydrogen was 0.85 and 1.17 EUR/kg H
2, respectively, with higher values for blue hydrogen due to its higher capital and operating costs related to the carbon capture process. The additional cost of 0.15 EUR/kg H
2 is added to blue hydrogen regarding carbon transport and storage that was not included in the related study [
33]. For green hydrogen, an investigation considering several locations in Sweden with different solar and wind power potentials on or off-grid based on a plant in operation with PEMEC was used as reference data [
34]. In the related work, the price of green hydrogen was found to be in the range of 3.04–13.27 EUR/kg H
2, a highly fluctuant value since its operating cost is strongly dependent on the price of renewable electricity. The values of carbon emissions and costs related to each hydrogen color from the described research data considered for our analysis are summarized in
Table 8.
3. Simulation Analysis
3.1. Electric Motor and Combustion Engine
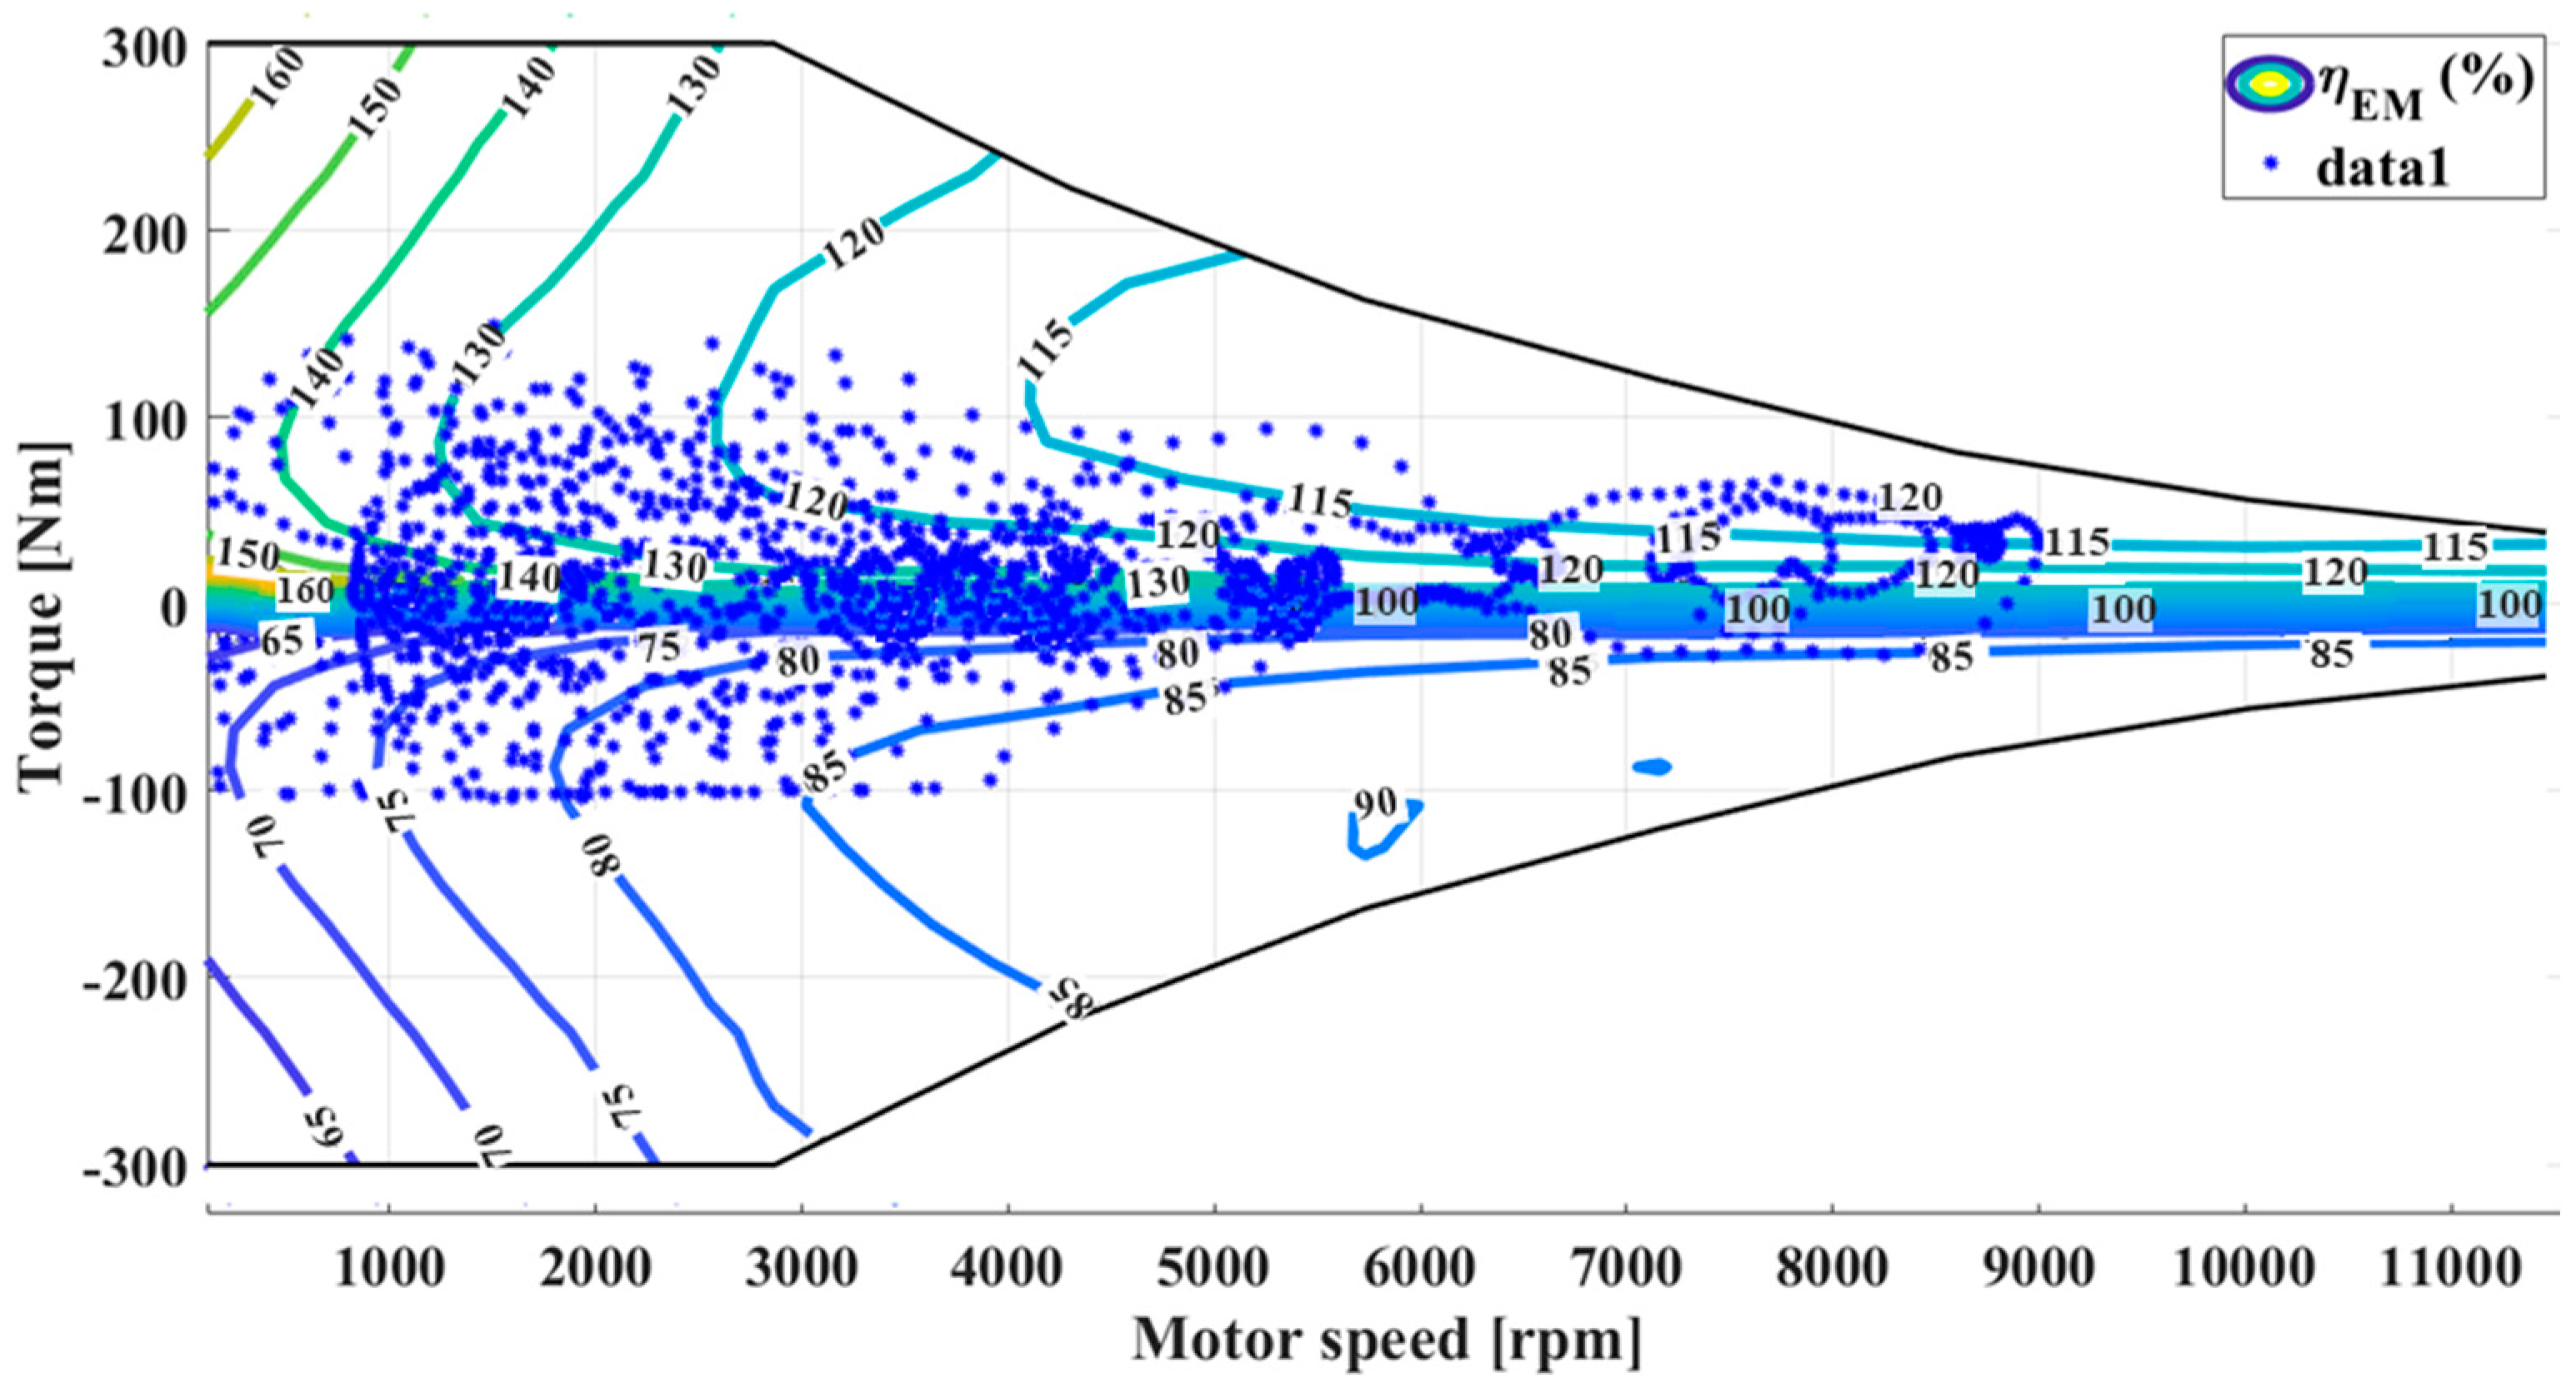
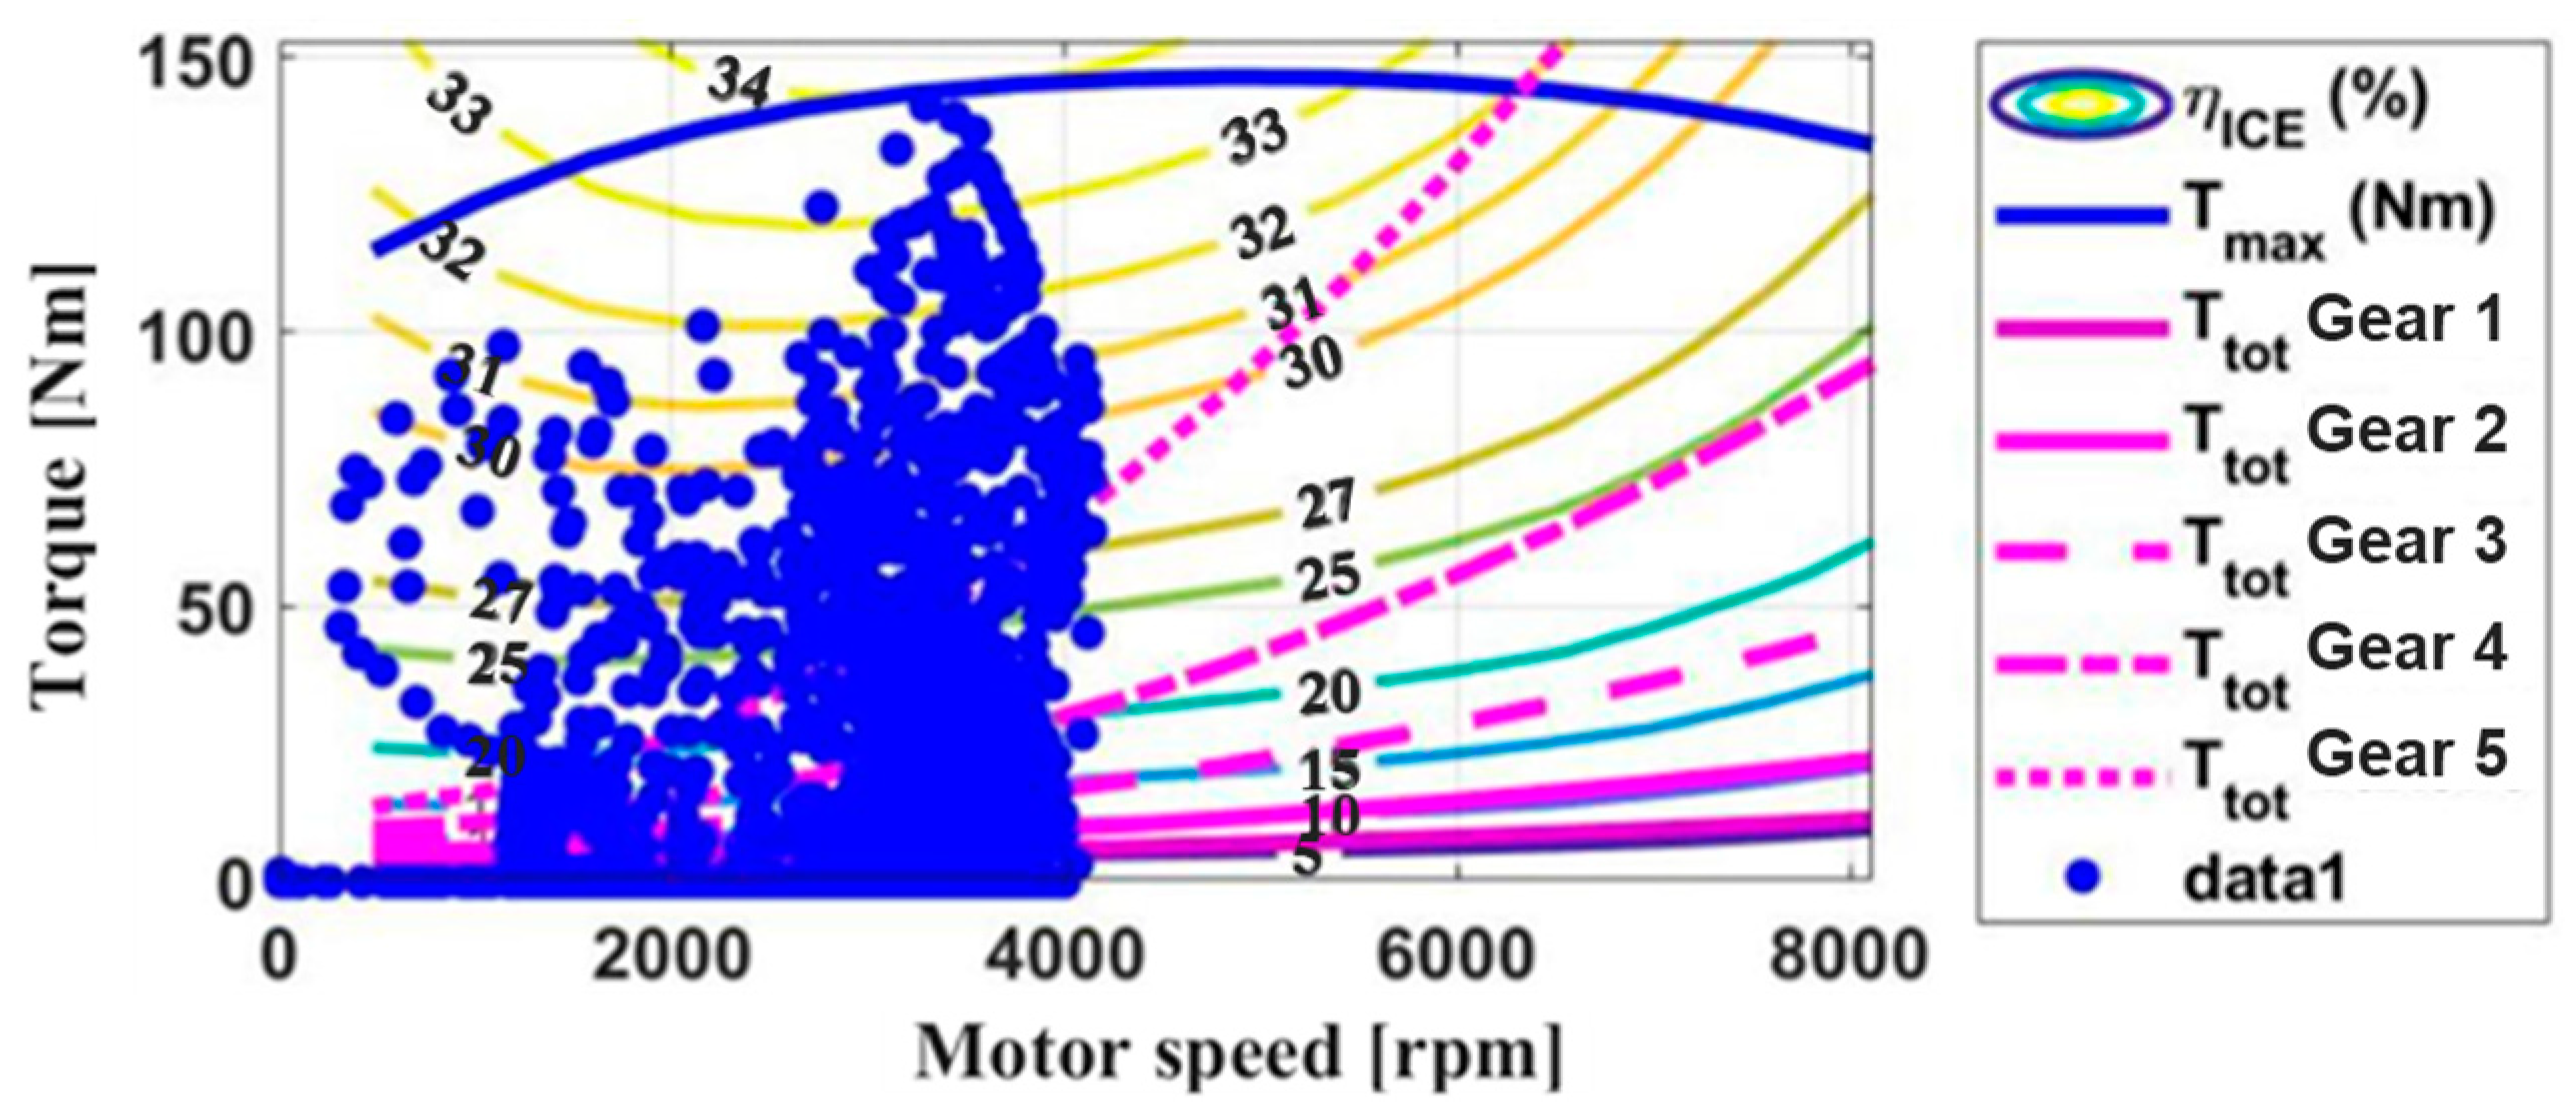
The wheels and gear energy consumption were similar for both vehicles’ powertrains since the same parameters that were applied for the vehicle dynamics and the related gearbox for each case presented similar efficiencies of around 95%. On the other hand, one of the main powertrain differences between the HFCV versus HICEV was the motor, even considering the same maximum power for both cases. While the HFCV uses an electric machine, the HICEV uses the combustion engine as the motor. The efficiency discrepancy between them makes a relevant impact on the whole powertrain’s efficiency. For this model, considering the WLTP cycle, the operating points located at lower speeds have efficiencies of around 70%, while at higher speeds, the efficiency goes up to 85%, as shown in the electric machine efficiency map in
Figure 3. Meanwhile, for the combustion engine, the efficiencies do not go higher than 34% with an average efficiency of around 20%, as shown in the combustion engine efficiency map in
Figure 4, agreeing with previous publications on hydrogen internal combustion engines [
35].
3.2. Fuel Cell
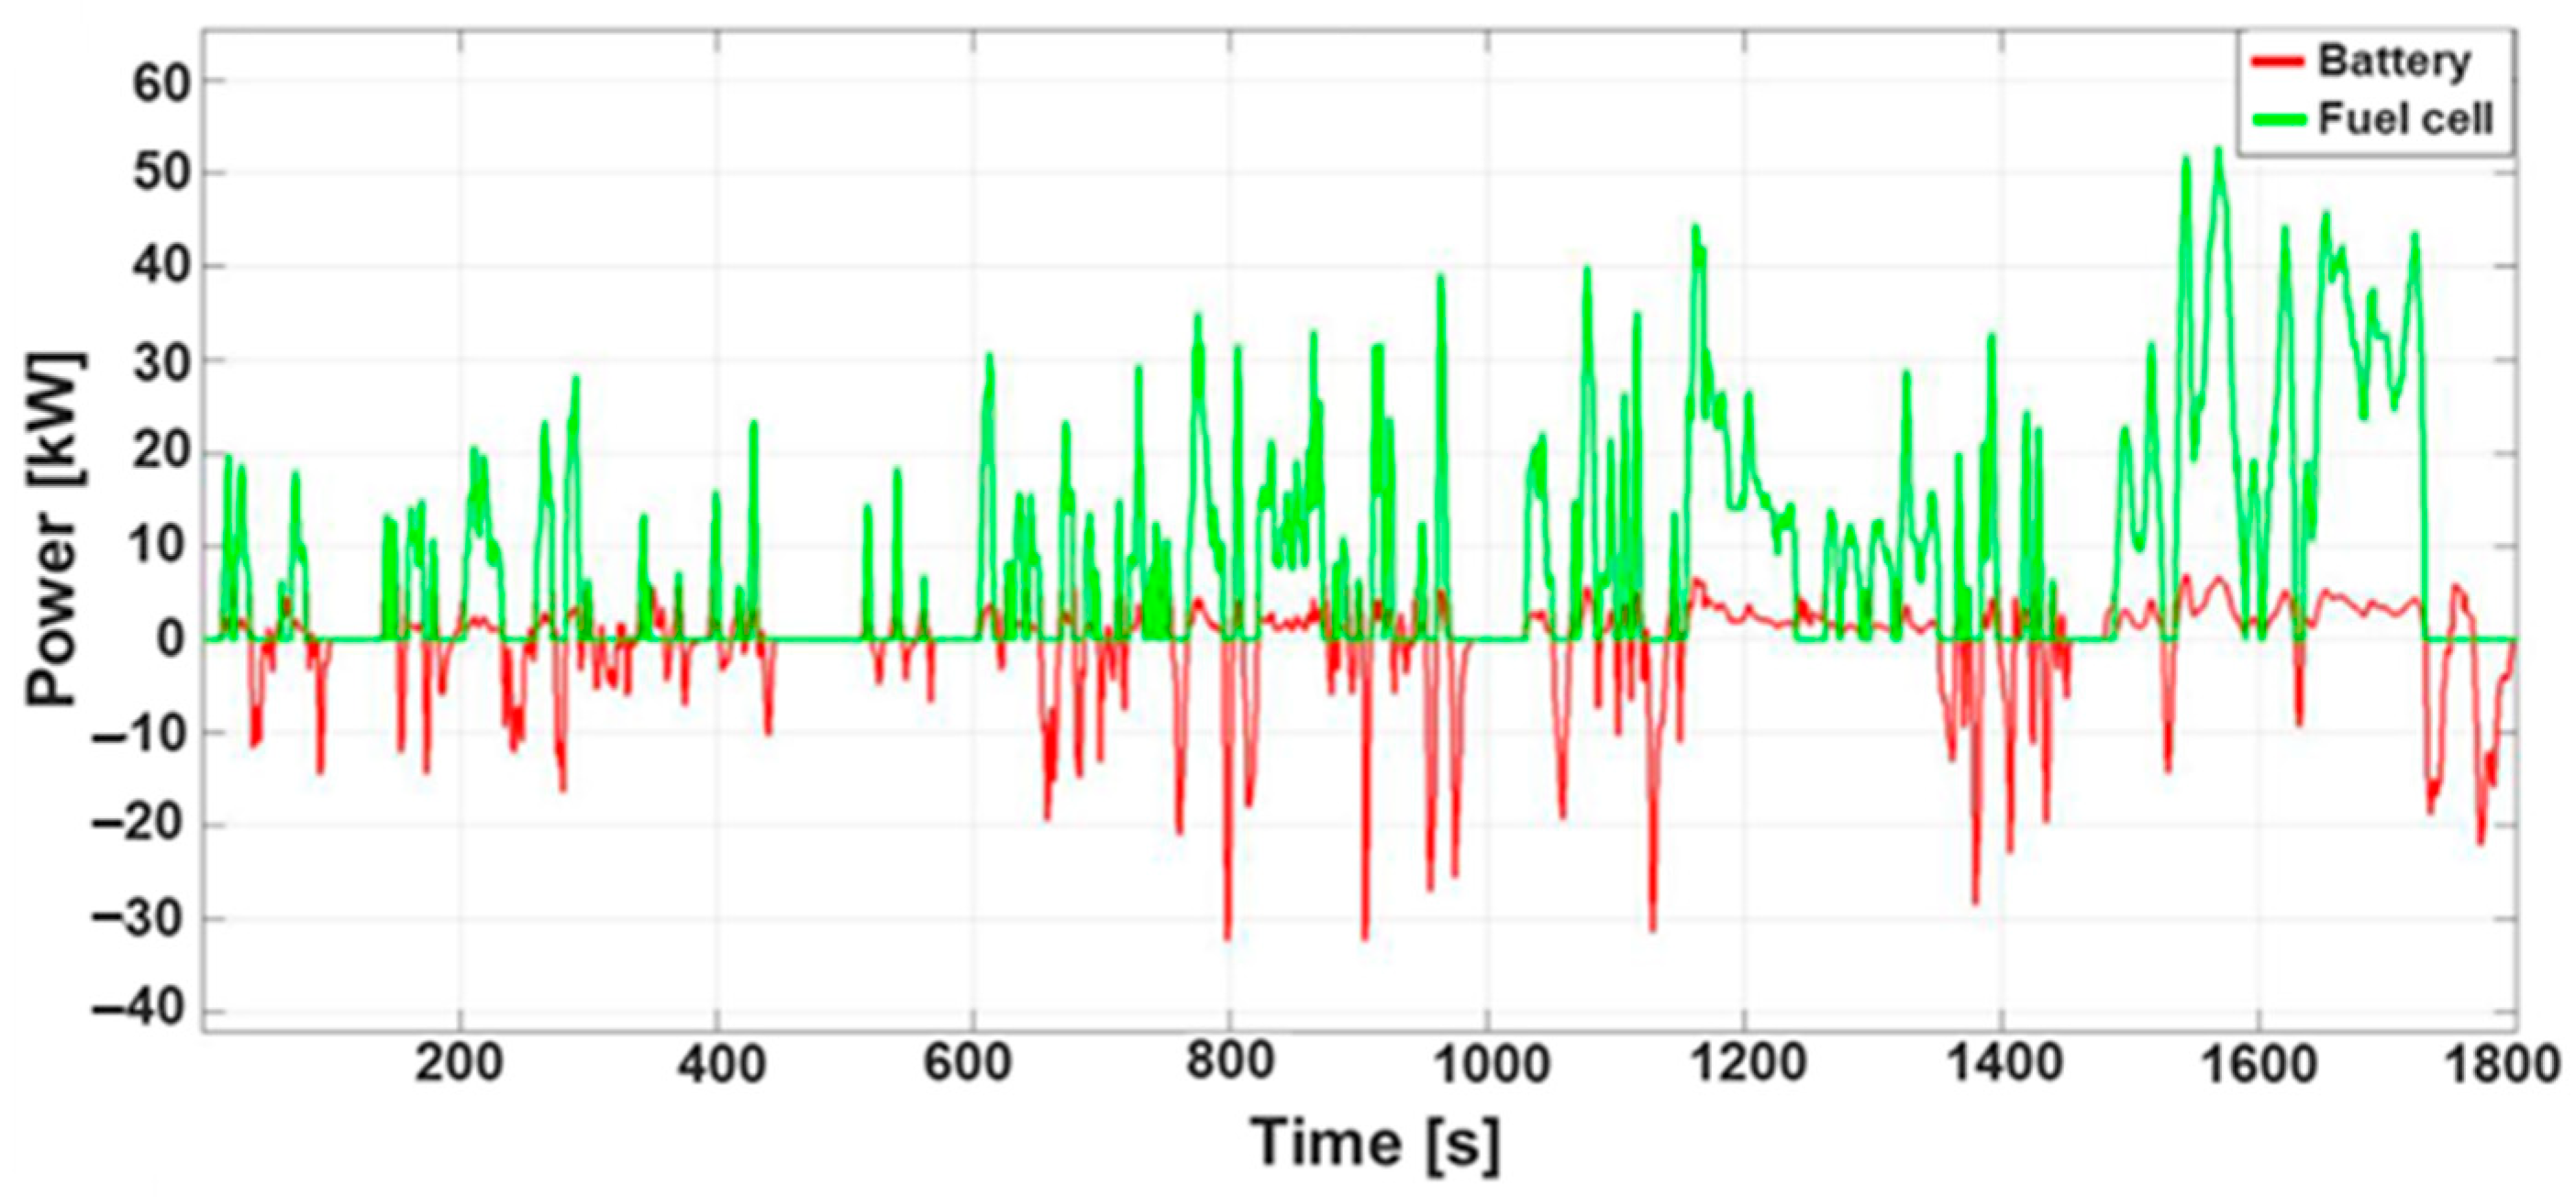
Even though the electric machine is more efficient than the combustion engine, the HFCV powertrain also has the battery and the fuel cell that can affect the overall efficiency. In this case, since the battery is a highly efficient component, the fuel cell is the main component that affects the vehicle’s efficiency. As a result of the controller implemented in the HFCV, the fuel cell, and battery shared the power to the electric motor. Thus, the fuel cell was the main energy source when the power was positive, and the battery was the only energy storage when the power was negative. The power from both the fuel cell and battery is shown in
Figure 5. Since the fuel cell’s maximum efficiency is around 65% at its minimum power [
19], for the high-power requirements in several operation points shown in
Figure 5, the efficiency drops to values lower than 50%. This efficiency oscillation is reflected in an overall efficiency of 52% for the fuel cell system. Thus, the fuel cell is the component that has the highest impact on the whole powertrain efficiency, which will be further described.
3.3. Whole Powertrain and Speed Range Impact
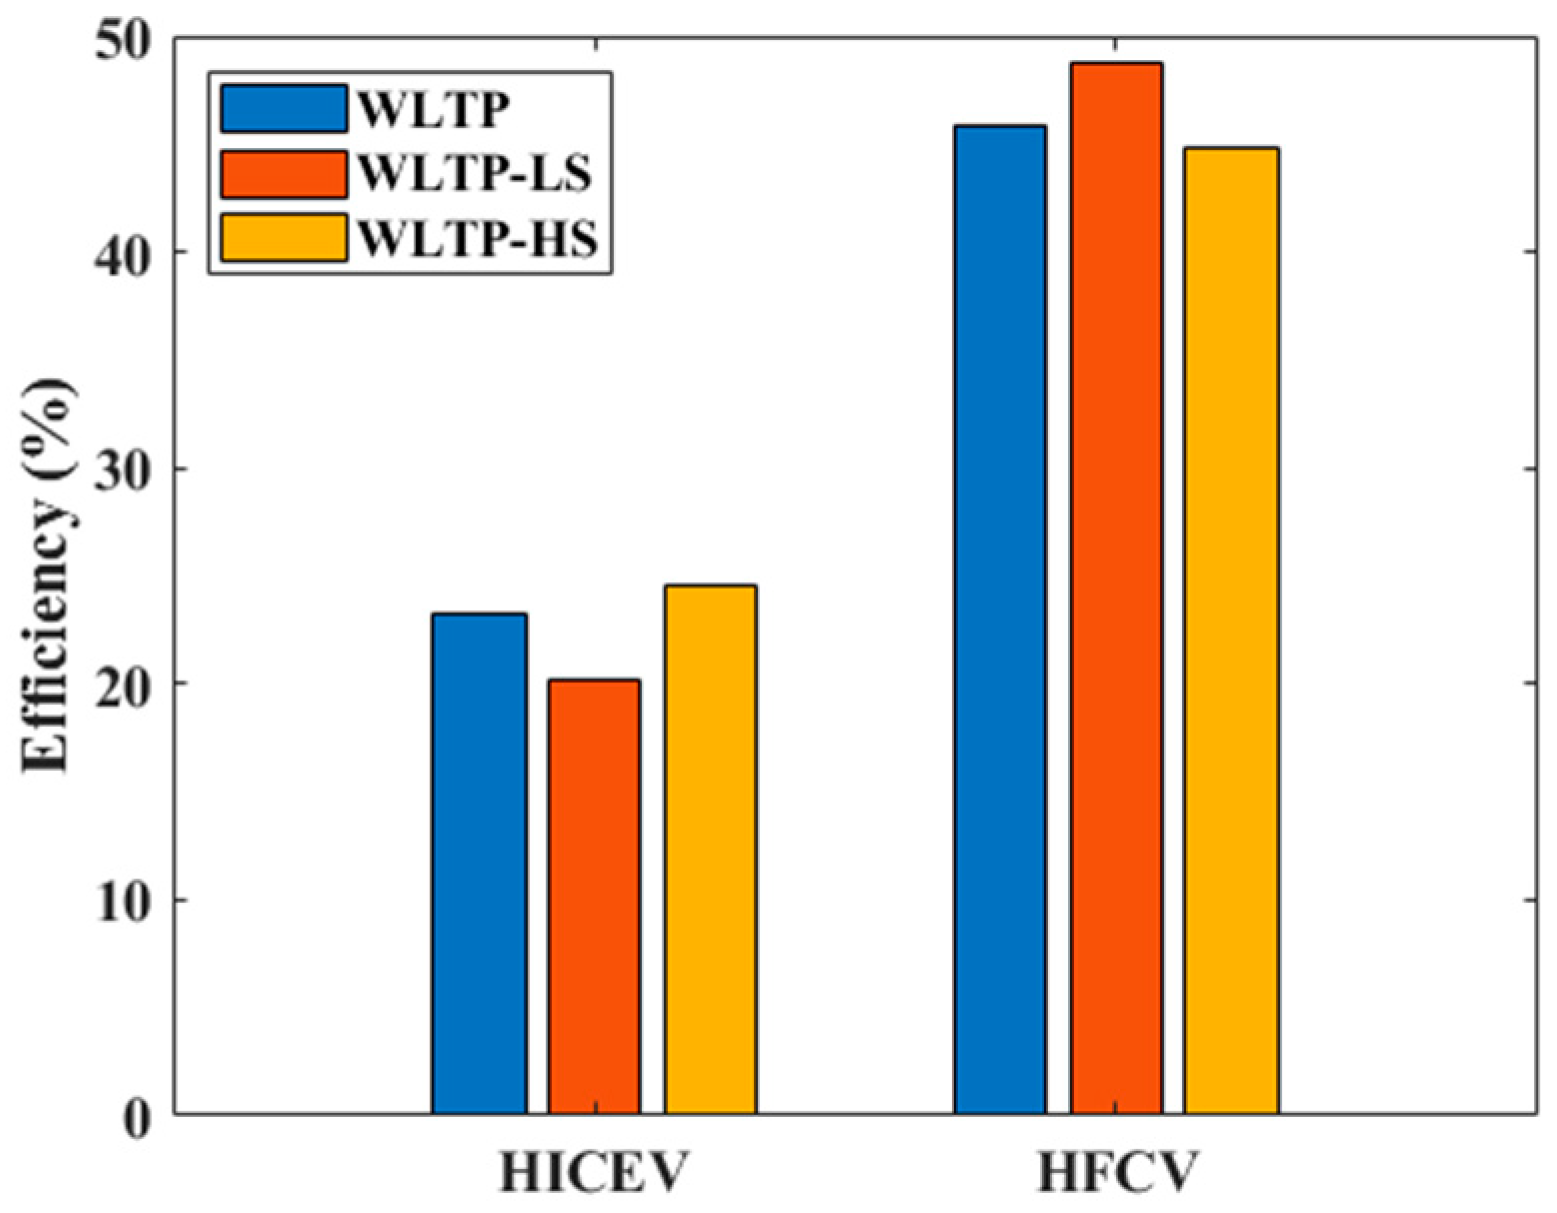
Considering all the components of the vehicle’s powertrain, the HFCV showed an efficiency of 45.9% and a hydrogen consumption of 1055 kg/100 km. Thus, the HFCV was shown to be around twice more efficient compared to the HICEV, which presented an efficiency of 23.2–29.0%, and fuel consumption of 2.39 kg/100 km, or 1.79 kg/100 km if the maximum of 25% fuel savings is considered (described in
Section 2.3.2). Therefore, if only fuel consumption and efficiency are considered, the fuel cell model is a better alternative than the combustion model even considering an optimistic fuel-saving scenario for the HICEV. Concerning different speed levels, the HFCV and HICEV demonstrated different performance profiles. For the HICEV, driving at high speeds (WLTP-HS) has been shown to be about 4% more efficient compared to driving at lower speeds. The opposite is observed for the HFCV, which presented higher efficiencies at lower speeds (WLTP-LS) as a reflection of both the electric machine and the fuel cell performance. As previously discussed, and shown in
Figure 3, the electric machine demonstrated higher performance at lower speeds. Furthermore, as the power requirement increases, the fuel cell efficiency decreases, which lowers the powertrain efficiency. However, even at lower speeds, the HFCV has shown much higher efficiency compared to the HICEV, demonstrating a better usage of hydrogen as a fuel in terms of energy/fuel consumption aimed at passenger vehicle applications. The average powertrain efficiency and hydrogen consumption for both vehicles are shown, respectively, in
Figure 6 and
Table 9 including the different speed regions of WLTP. For the HICEV, the shown fuel consumption values are related to the optimistic scenario of an extra 25% fuel savings, as previously explained.
3.4. Hydrogen Production Method Impact
To address the sustainability of the hydrogen-powered vehicles analyzed, the results obtained for their hydrogen consumption,
Table 9, were combined with the carbon emissions data for the different hydrogen colors grey, blue, and green (
Table 8). Since no carbon emissions are related to the vehicles’ operation, only carbon emissions related to the hydrogen production method are produced. Thus, the higher the carbon emissions in the hydrogen production method the higher the carbon emissions in the whole system. Therefore, if powered with green hydrogen both vehicles presented much lower carbon emissions compared when using grey and blue hydrogen. Further, the HFCV presented lower emissions than HICE for all the cases due to its higher efficiency. This result of carbon emissions combined with fuel consumption enables a straightforward comparison with the current petrol-powered passenger vehicles. According to the European Environment Agency, petrol-powered vehicles produce about 13 kg of CO
2 considering 100 km of operation [
36]. This results in about 15–16 kg of CO
2 per 100 km including the emissions related to fuel extraction and refining, for a consumption of about 4 L of petrol for 100 km of WLTP cycle and 0.72 kg of CO
2 generated per liter of petrol produced [
37]. Therefore, hydrogen-powered vehicles could only produce less carbon emissions if powered with green hydrogen. In this case, both HICEV and HFCV can produce lower carbon emissions even without considering the optimistic fuel savings scenario for the HICEV, with emissions never higher than 12 kg CO
2 per 100 km. In the case of grey hydrogen, the emissions can be around 2 to 3 times higher compared to petrol, and even blue hydrogen does not present a promising scenario, with emissions slightly higher than the petrol ones for the HFCV and at least about two times more for the HICEV. The carbon emissions values are summarized in
Table 10.
Although green hydrogen seems to be a promising sustainable solution for hydrogen-powered vehicles, its price limits its application if compared to grey and blue hydrogen. Vehicles powered with green hydrogen presented at least three times higher fuel costs compared to grey hydrogen in the most optimistic scenario from data used in this work, shown in
Table 11. However, if compared to the current petrol price, green hydrogen can be a promising candidate. Considering the petrol price per liter of 1–1.5 euros [
38] and its consumption of 4 L for a WLTP driving cycle, the total cost of fuel/100 km is EUR 4–6, which is similar to the optimistic green hydrogen scenario. In this case, the HFCV could even be a more cost-efficient choice compared to petrol-powered vehicles. Therefore, even though the optimistic scenario of green hydrogen is uncertain, exploring areas with high renewable energy potential could make hydrogen-powered vehicles not only more sustainable but also more cost-competitive.
4. Limitations and Future Research
This study had several assumptions for the design and modeling of the vehicles. For example, for the HICEV, efficiency maps like conventional engines were assumed due to a lack of data for hydrogen ICEV related to its limited commercialized version. However, since the technology and operation principle are the same, similar values as those obtained here should be expected. For the HFCV, other control strategies could have improved the vehicle operation. However, the obtained overall efficiency agrees with commercialized HFCVs. In future investigations, more models should be examined to find out if any of the alternatives had benefited from, e.g., other curb weight, size of the car, or power of the engine. Furthermore, the cars could have been compared by analyzing, e.g., purchase price and carbon dioxide emissions during production to give a better picture of sustainability and costs. Experimental investigations should also add a deep understanding regarding the comparison of the two technologies; however, since this is a complex and costly task, we believe the modeling of such comparison can support those future works. Concerning the modeling addressed in this work, we have demonstrated that green hydrogen is needed for clean energy transportation based on hydrogen, and HFCVs provide a significantly higher powertrain efficiency compared to HICEVs.
5. Conclusions
In this work, the powertrain of a hydrogen fuel cell vehicle and a hydrogen internal combustion engine were compared also considering its efficiency and fuel cost when powered with green, blue, or green hydrogen. The analysis has shown the different speed range impacts for the different vehicles. Thus, while HICEV performs more efficiently at higher speeds, HFCV has higher performance at lower speed ranges. However, even at higher speed ranges, the HFCV was about twice as efficient compared to combustion engines, resulting in a lower fuel consumption of 1.055 kg-H2/100 km in the WLTP driving cycle, while the HICE consumed about 1.79 kg-H2/100 km. Its higher performance is related to the higher efficiency of both the fuel cell and the electric machine compared to the combustion engine. When powered with hydrogen from different sources (grey, blue, and green hydrogen), only green hydrogen has demonstrated the potential to be a better option compared to petrol-powered vehicles in terms of carbon emissions, showing at least 60% lower emissions for hydrogen-powered vehicles. Furthermore, the results have shown that for an optimistic scenario for green hydrogen prices, hydrogen-powered vehicles could be cost-competitive compared to conventional petrol-powered vehicles. Therefore, the results support the efficient and sustainable usage of hydrogen aimed at vehicle application and, thus, a green energy transition.
Author Contributions
Conceptualization, J.E.; methodology, software, and investigation, K.D., A.K., P.L., A.S.-E., A.S. and L.T.; writing—original draft preparation, T.S.A.; writing—review and editing, K.D., A.K., P.L., A.S.-E., A.S., L.T. and J.E.; supervision T.S.A. and J.E. All authors have read and agreed to the published version of the manuscript.
Funding
T.S.A. acknowledges the financial support from Chalmers’ Area of Advance Transport.
Data Availability Statement
The raw data supporting the conclusions of this article will be made available by the authors on request.
Conflicts of Interest
The authors declare no conflicts of interest.
References
- Wang, F.; Harindintwali, J.D.; Yuan, Z.; Wang, M.; Wang, F.; Li, S.; Yin, Z.; Huang, L.; Fu, Y.; Li, L.; et al. Technologies and Perspectives for Achieving Carbon Neutrality. Innovation 2021, 2, 100180. [Google Scholar] [CrossRef] [PubMed]
- Yoro, K.O.; Daramola, M.O. CO2 emission sources, greenhouse gases, and the global warming effect. In Advances in Carbon Capture; Woodhead Publishing: Cambridge, UK, 2020; pp. 3–28. [Google Scholar]
- Solaymani, S. CO2 Emissions Patterns in 7 Top Carbon Emitter Economies: The Case of Transport Sector. Energy 2019, 168, 989–1001. [Google Scholar] [CrossRef]
- Acar, C.; Dincer, I. The Potential Role of Hydrogen as a Sustainable Transportation Fuel to Combat Global Warming. Int. J. Hydrogen Energy 2020, 45, 3396–3406. [Google Scholar] [CrossRef]
- IEA. The Future of Hydrogen—Seizing Today’s Opportunities; Report Prepared by IEA for the G20, Japan; International Energy Agency: Paris, France, 2019. [Google Scholar]
- Muthukumar, M.; Rengarajan, N.; Velliyangiri, B.; Omprakas, M.A.; Rohit, C.B.; Raja, U.K. The Development of Fuel Cell Electric Vehicles—A Review. Mater. Today Proc. 2021, 45, 1181–1187. [Google Scholar] [CrossRef]
- Shadidi, B.; Najafi, G.; Yusaf, T. A Review of Hydrogen as a Fuel in Internal Combustion Engines. Energies 2021, 14, 6209. [Google Scholar] [CrossRef]
- Toyota. Toyota Developing Hydrogen Engine Technologies through Motorsports; Toyota: Toyota, Japan, 2021; pp. 1–3. [Google Scholar]
- Chen, W.H.; Singh, Y.; Negi, P. Biofuel Technologies for a Sustainable Future: India and Beyond; Taylor & Francis Ltd.: London, UK, 2023. [Google Scholar]
- Quispe, J. Path to Zero Emissions: Honda Latest Automaker Focusing on Hydrogen Technology; Nippon Foundation: Tokyo, Japan, 2023; Volume 4, pp. 88–100. [Google Scholar]
- Kyjovský, Š.; Vávra, J.; Bortel, I.; Toman, R. Drive Cycle Simulation of Light Duty Mild Hybrid Vehicles Powered by Hydrogen Engine. Int. J. Hydrogen Energy 2023, 8, 3–14. [Google Scholar] [CrossRef]
- Sagaria, S.; Costa Neto, R.; Baptista, P. Assessing the Performance of Vehicles Powered by Battery, Fuel Cell and Ultra-Capacitor: Application to Light-Duty Vehicles and Buses. Energy Convers. Manag. 2021, 229, 113767. [Google Scholar] [CrossRef]
- Yuan, X.H.; Yan, G.D.; Li, H.T.; Liu, X.; Su, C.Q.; Wang, Y.P. Research on Energy Management Strategy of Fuel Cell–Battery–Supercapacitor Passenger Vehicle. Energy Rep. 2022, 8, 1339–1349. [Google Scholar] [CrossRef]
- Candelaresi, D.; Valente, A.; Iribarren, D.; Dufour, J.; Spazzafumo, G. Comparative Life Cycle Assessment of Hydrogen-Fuelled Passenger Cars. Int. J. Hydrogen Energy 2021, 46, 35961–35973. [Google Scholar] [CrossRef]
- Roma, T.I.S. Hydrogen-Powered Vehicles in Urban Transport Systems—Current State and Development. Transp. Res. Procedia 2020, 45, 835–841. [Google Scholar]
- International: Light-Duty: Worldwide Harmonized Light Vehicles Test Procedure (WLTP); TransportPolicy.net: Tokyo, Japan, 2009.
- Wang, S.; Xu, Y. Battery Electric Vehicle with a Fuel Cell Stack A System Study of Propulsion Concepts and Scenarios; Chalmers University of Technology: Gothenburg, Sweden, 2019. [Google Scholar]
- Lohse-Busch, H. Toyota Mirai Testing; Argonne National Laboratory: Lemont, IL, USA, 2018; pp. 1–7. [Google Scholar]
- Lohse-Busch, H.; Stutenberg, K.; Duoba, M.; Liu, X.; Elgowainy, A.; Wang, M.; Wallner, T.; Richard, B.; Christenson, M. Automotive Fuel Cell Stack and System Efficiency and Fuel Consumption Based on Vehicle Testing on a Chassis Dynamometer at Minus 18 °C to Positive 35 °C Temperatures. Int. J. Hydrogen Energy 2020, 45, 861–872. [Google Scholar] [CrossRef]
- Gillespie, T. Livros Fundamentals of Vehicle Dynamics—Google Livros; SAE International: Warrendale, PA, USA, 2021; pp. 2–3. [Google Scholar]
- Hen Ortega, B.L.E.; German, R.; Bouscayrol, A.; Boulon, L. Merging Control for the Hybrid Energy Storage Subsystem of a Fuel-Cell Vehicle. In Proceedings of the 2021 23rd European Conference on Power Electronics and Applications (EPE’21 ECCE Europe), Ghent, Belgium, 6–10 September 2021. [Google Scholar] [CrossRef]
- Guzzella, L.; Amstutz, A. QSS-Toolbox Manual; ETH Zürich: Zürich, Switzerland, 1999. [Google Scholar]
- Tremblay, O.; Dessaint, L.A.; Dekkiche, A.I. A Generic Battery Model for the Dynamic Simulation of Hybrid Electric Vehicles. In Proceedings of the IEEE Vehicle Power and Propulsion Conference, Arlington, TX, USA, 9–12 September 2007; pp. 284–289. [Google Scholar] [CrossRef]
- Zheng, Y.; Ouyang, M.; Lu, L.; Li, J.; Han, X.; Xu, L.; Ma, H.; Dollmeyer, T.A.; Freyermuth, V. Cell State-of-Charge Inconsistency Estimation for LiFePO4 Battery Pack in Hybrid Electric Vehicles Using Mean-Difference Model. Appl. Energy 2013, 111, 571–580. [Google Scholar] [CrossRef]
- Ehsani, M.; Gao, Y.; Longo, S.; Ebrahimi, K. Modern Electric, Hybrid Electric, and Fuel Cell Vehicles, 3rd ed.; CRC Press, Taylor & Francis Group: Boca Raton, FL, USA, 2018. [Google Scholar]
- Natural Resources Canada; Energy Efficiency. Factors That Affect Fuel Efficiency; Government of Canada: Ottawa, ON, Canada, 2023; pp. 3–5. [Google Scholar]
- Katebah, M.; Al-Rawashdeh, M.; Linke, P. Analysis of Hydrogen Production Costs in Steam-Methane Reforming Considering Integration with Electrolysis and CO2 Capture. Clean. Eng. Technol. 2022, 10, 100552. [Google Scholar] [CrossRef]
- Franz, S.; Liljenroth, A. Life Cycle Assessment of a Fuel Cell Electric Vehicle with an MS-100 System A Comparison between a Fuel Cell Electric Vehicle and a Battery Electric Vehicle; Chalmers University of Technology: Gothenburg, Sweden, 2020. [Google Scholar]
- Unander, F. Energy Indicators and Sustainable Development: The International Energy Agency Approach. Nat. Resour. Forum 2005, 29, 377–391. [Google Scholar] [CrossRef]
- U.S. Environmental Protection Agency. Greenhouse Gas Equivalencies Calculator; U.S. Environmental Protection Agency: Washington, DC, USA, 2019.
- Winnipeg, C.A. Emission Factors in Kg CO2-Equivalent per Unit; U.S. Environmental Protection Agency: Washington, DC, USA, 2014.
- Gerloff, N. Comparative Life-Cycle-Assessment Analysis of Three Major Water Electrolysis Technologies While Applying Various Energy Scenarios for a Greener Hydrogen Production. J. Energy Storage 2021, 43, 102759. [Google Scholar] [CrossRef]
- Massarweh, O.; Al-khuzaei, M.; Al-Shafi, M.; Bicer, Y.; Abushaikha, A.S. Blue Hydrogen Production from Natural Gas Reservoirs: A Review of Application and Feasibility. J. CO2 Util. 2023, 70, 102438. [Google Scholar] [CrossRef]
- Tang, O.; Rehme, J.; Cerin, P. Levelized Cost of Hydrogen for Refueling Stations with Solar PV and Wind in Sweden: On-Grid or off-Grid? Energy 2022, 241, 122906. [Google Scholar] [CrossRef]
- Hosseini, S.E.; Butler, B. An Overview of Development and Challenges in Hydrogen Powered Vehicles. Int. J. Green Energy 2020, 17, 13–37. [Google Scholar] [CrossRef]
- Average CO2 Emissions from New Cars and New Vans Increased Again in 2019. Available online: https://www.eea.europa.eu/highlights/average-co2-emissions-from-new-cars-vans-2019 (accessed on 24 May 2023).
- WLTP Facts.EU. What Is the Link between CO2 Emissions and Fuel Consumption of My Car? Available online: https://www.wltpfacts.eu/link-between-co2-emissions-fuel-consumption/ (accessed on 5 February 2024).
- European Commission. Energy Policy Fuel Prices in Europe; European Commission: Brussels, Belgium, 2021; pp. 3–5. [Google Scholar]
Figure 1.
System diagram for the powertrain of the hydrogen-powered vehicles: hydrogen fuel cell vehicle (A), and hydrogen combustion engine vehicle (B).
Figure 1.
System diagram for the powertrain of the hydrogen-powered vehicles: hydrogen fuel cell vehicle (A), and hydrogen combustion engine vehicle (B).
Figure 2.
WLTP driving cycle and its different speed regions.
Figure 2.
WLTP driving cycle and its different speed regions.
Figure 3.
Electric machine efficiency map for the WLTP drive cycle.
Figure 3.
Electric machine efficiency map for the WLTP drive cycle.
Figure 4.
Internal combustion engine efficiency map for the WLTP driving cycle.
Figure 4.
Internal combustion engine efficiency map for the WLTP driving cycle.
Figure 5.
Fuel cell and battery power during the WLTP driving cycle.
Figure 5.
Fuel cell and battery power during the WLTP driving cycle.
Figure 6.
Average powertrain efficiency for HICEV vs. HFCV for the WLTP drive cycle, the region of low and medium speeds (WLTP-LS), and the region of high and extra-high speeds (WLTP-HS).
Figure 6.
Average powertrain efficiency for HICEV vs. HFCV for the WLTP drive cycle, the region of low and medium speeds (WLTP-LS), and the region of high and extra-high speeds (WLTP-HS).
Table 1.
Vehicle model parameters based on a commercial fuel cell vehicle [
17,
18,
19].
Table 1.
Vehicle model parameters based on a commercial fuel cell vehicle [
17,
18,
19].
| Parameter (Initials) | Value (Unit) |
|---|
| Weight (m) | 1928 (kg) |
| Cross-sectional area (A) | 2.8 (m2) |
| Aerodynamic drag coefficient (Cd) | 0.29 (-) |
| Rolling resistance coefficient (Cr) | 0.008 (-) |
| Road inclination (α) | 0 (o) |
Table 2.
Gear specifications used for the HFCV model.
Table 2.
Gear specifications used for the HFCV model.
| Parameter (Initials) | Value (Unit) |
|---|
| Wheels radius () | 0.334 (m) |
| Vehicle’s top speed () | 175 (km/h) |
| Electric machine top speed () | 12,000 (rpm) |
| Gear ratio () | 8.63 (-) |
| Gear efficiency (ƞgear) | 95 (%) |
| Idle losses (P0) | 50 (W) |
| Minimum wheel speed | 1 (rad/s) |
Table 3.
Battery model parameters used for the HFCV model.
Table 3.
Battery model parameters used for the HFCV model.
| Parameter (Initials) | Value (Unit) |
|---|
| Battery open-circuit voltage () | 1.205 (V) |
| Polarization voltage () | 0.01875 (V) |
| Battery resistance (R) | 0.0046 (Ω) |
| Battery capacity () | 6.5 (Ah) |
| Initial SOC (SOC) | 47.4–48.7% |
| Exponential zone amplitude () | 0.144 (V) |
| Exponential zone time constant inverse (B) | 2.3007 (Ah−1) |
| Number of cells in series (Ns) | 204 (-) |
| Number of cells in parallel (Np) | 1 (-) |
Table 4.
Fuel cell model parameters used for the HFCV model.
Table 4.
Fuel cell model parameters used for the HFCV model.
| Parameter (Initials) | Value (Unit) |
|---|
| Theoretical voltage () | 1.2 (V) |
| Total active area () | 52 (m2) |
| Number of cells () | 370 (-) |
| Idle power (Pid) | 0 (W) |
| Air compressor efficiency | 0.85 (-) |
| Air temperature | 20 (°C) |
| Air compressor ratio | 1.3 (-) |
| Air-to-fuel ratio | 1.5 (-) |
Table 5.
Hydrogen tank parameters used in both the HFCV and HICEV models.
Table 5.
Hydrogen tank parameters used in both the HFCV and HICEV models.
| Parameter (Initials) | Value (Unit) |
|---|
| Lower heating value (Hu) | 119.96 (MJ·kg−1) |
| Fuel density (ρf) | 38.63 (kg·m−3) |
| Pressure (Pfuel) | 700 (bar) |
| Temperature (Tfuel) | 20 (°C) |
Table 6.
Multi-step gear parameters used in the HICEV model.
Table 6.
Multi-step gear parameters used in the HICEV model.
| Parameter (Initials) | Value (Unit) |
|---|
| Gear ratio 1 () | 12.35 (-) |
| Gear ratio 2 () | 9.29 (-) |
| Gear ratio 3 () | 6.99 (-) |
| Gear ratio 4 () | 5.40 (-) |
| Gear ratio 5 () | 3.96 (-) |
| Multi-step gear efficiency (ƞmuti,gear) | 98 (%) |
| Idle losses (Pmulti,0) | 300 (W) |
| Minimum wheel speed | 1 (rad/s) |
Table 7.
Combustion engine parameters used in the HICEV model.
Table 7.
Combustion engine parameters used in the HICEV model.
| Parameter (Initials) | Value (Unit) |
|---|
| Maximum power | 114 (kW) |
| Inertia momentum | 0.05 (kg·m2) |
| Idle speed | 0 (rad/s) |
| Idle power | 0 (W) |
| Auxiliary power | 0 (W) |
| Cut-off torque | 5 (Nm) |
| Cut-off power | 0 (W) |
Table 8.
Summary of carbon emissions and cost related to grey, blue, and green hydrogen used in this work based on published data.
Table 8.
Summary of carbon emissions and cost related to grey, blue, and green hydrogen used in this work based on published data.
| | Grey | Blue | Green |
|---|
| Carbon emissions (kg CO2-eq/kg H2) | 25.25 | 16.64 | <5 |
| Production cost (EUR/kg H2) | 0.85 | 1.17 | 3.04–13.27 |
Table 9.
HICEV and HFCV hydrogen consumption for the WLTP drive cycle, the region of low and medium speeds (WLTP-LS), and the region of high and extra-high speeds (WLTP-HS).
Table 9.
HICEV and HFCV hydrogen consumption for the WLTP drive cycle, the region of low and medium speeds (WLTP-LS), and the region of high and extra-high speeds (WLTP-HS).
| | HICEV | HFC |
|---|
| WLTP | 1.79 kg/100 km | 1.055 kg/100 km |
| WLTP-LS | 1.87 kg/100 km | 0.89 kg/100 km |
| WLTP-HS | 1.73 kg/100 km | 1.134 kg/100 km |
Table 10.
Carbon emissions (kg CO2/100 km) for the HICEV, HFCV, and petrol-powered vehicles considering their fueling with grey, blue, or green hydrogen for the hydrogen-powered vehicles, or petrol for the petrol-powered vehicle.
Table 10.
Carbon emissions (kg CO2/100 km) for the HICEV, HFCV, and petrol-powered vehicles considering their fueling with grey, blue, or green hydrogen for the hydrogen-powered vehicles, or petrol for the petrol-powered vehicle.
| | HICEV | HFCV | Petrol-Powered Vehicle |
|---|
| Grey | 45.2 | 26.6 | - |
| Blue | 29.8 | 17.5 | - |
| Green | 8.9 | 5.3 | - |
| Petrol | - | - | 15–16 |
Table 11.
Fuel price (EUR/100 km) in the WTLP driving cycle for the HICEV, HFCV, and petrol-powered vehicles considering their fueling with grey, blue, or green hydrogen for the hydrogen-powered vehicles, or petrol for the petrol-powered vehicle.
Table 11.
Fuel price (EUR/100 km) in the WTLP driving cycle for the HICEV, HFCV, and petrol-powered vehicles considering their fueling with grey, blue, or green hydrogen for the hydrogen-powered vehicles, or petrol for the petrol-powered vehicle.
| | HICEV | HFCV | Petrol-Powered Vehicle |
|---|
| Grey | 1.52 | 0.90 | - |
| Blue | 2.09 | 1.28 | - |
| Green | 5.44–23.75 | 3.20–14.00 | - |
| Petrol | - | - | 4–6 |
| Disclaimer/Publisher’s Note: The statements, opinions and data contained in all publications are solely those of the individual author(s) and contributor(s) and not of MDPI and/or the editor(s). MDPI and/or the editor(s) disclaim responsibility for any injury to people or property resulting from any ideas, methods, instructions or products referred to in the content. |
© 2024 by the authors. Licensee MDPI, Basel, Switzerland. This article is an open access article distributed under the terms and conditions of the Creative Commons Attribution (CC BY) license (https://creativecommons.org/licenses/by/4.0/).


 and
and 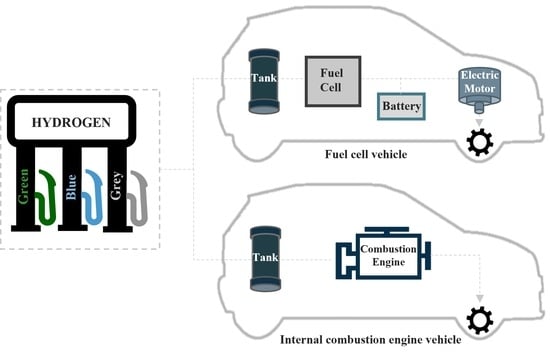


