Article

Research of Proton Exchange Membrane Fuel Cell Modeling on Concentration Polarization under Variable-Temperature Operating Conditions

School of Mechanical, Electronic and Control Engineering, Beijing Jiaotong University, Beijing 100044, China
*
Author to whom correspondence should be addressed.
Energies 2024, 17(3), 730; https://doi.org/10.3390/en17030730
Submission received: 18 December 2023 / Revised: 24 January 2024 / Accepted: 30 January 2024 / Published: 3 February 2024
(This article belongs to the Special Issue Advances in Hydrogen Energy III)

Abstract

:
In this study, a concentration overvoltage model that focuses on describing variable-temperature operating condition properties for PEMFCs is established. Sensitivity analysis and a quantification study of oxygen transport resistance are carried out based on the oxygen transport resistance model and measurement data. By analyzing the influence of temperature on cathode oxygen transport resistance, the key structural parameters of the cathode oxygen transport resistance models are estimated, and the parameter modification method of fuel cell limiting current density under variable temperatures is proposed. Based on the polarization curve test experiments under variable-temperature conditions, it is demonstrated that the newly developed concentration overvoltage model reduces the relative error of simulation for a low Pt loading fuel cell in the high current region by 2.97% and 10.06% at 60 °C and 80 °C, respectively. The newly established concentration overvoltage model of a PEMFC solves the problem that the parameter of limiting current density is set without considering the influence of fuel cell temperature fluctuation, which leads to the poor simulation accuracy of the concentration overvoltage model in the high current region.

1. Introduction

Under the common vision of human efforts to achieve carbon neutrality, proton exchange membrane fuel cells (PEMFCs) possess the potential for large-scale application in future power generation and energy storage systems due to their zero-emission and high energy efficiency features [1]. As one of the alternatives to traditional internal combustion engine vehicles, with long endurance, fast refueling capability and adaptability to ambient temperature, PEMFC vehicles have ushered in a rapid development stage [2]. However, a series of technical bottlenecks, such as high cost of catalyst, high complexity of power system integration and short PEMFC lifetime, still put PEMFC vehicles at a disadvantage in competition with traditional internal combustion engine vehicles [3]. At the present stage, applying PEMFCs as an auxiliary power source and developing a compact PEMFC system to reduce the vehicle cost has become a favored technical solution [4] used in, for example, the BAIC Motor Corporation Limited CF53FCV extended range PEMFC vehicle, Mercedes-Benz GLC F-Cell and Audi A7 Sportback H-tron Quattro. Coping with high load conditions, a compact PEMFC system needs to run in a high-power (high-current) operating state. The voltage output of a PEMFC in the high-current range is dominated by concentration polarization [5]. Although the PEMFC thermal management system restricts the stack within a certain range of operating temperatures, the temperature fluctuation of the PEMFC stack due to cold starting or instantaneous power load change may still influence the voltage output [6]. At present, there is no unified analytical scheme of concentration overvoltage model suitable for characterizing PEMFCs under variable operating conditions (such as stack temperature, inlet pressure, humidity, etc.) [7].
In 1986, a concentration overvoltage model for describing mass transport in the high-current region of PEMFCs based on temperature, partial pressure of reaction gas and morphological characteristic assumptions of proton exchange membranes was proposed in Physical Chemistry by an Oxford University scholar named Atkins. Owing to its theoretical significance, this model has been widely used to describe the concentration overvoltage of PEMFCs [8]. In 1989, a simplified semi-empirical model for describing the PEMFC volt-ampere characteristics was first proposed by Srinivasan from Los Alamos National Laboratory in the United States [9]. The model of open-circuit voltage was obtained by Gibbs free energy theory, the activated overvoltage was expressed by the Tafel equation summarized from experimental rules and the ohmic overvoltage was represented by the slope of the linear region of a polarization curve. The model could not give the analytical mechanism interpretation of the concentration overvoltage or ohmic overvoltage. In 1995, Kim introduced a concentration overvoltage term described by an exponential function on the basis of the Srinivasan model to describe the overvoltage caused by mass transport in high-current regions [10]. The same year, Amphlett proposed a semi-empirical voltage model considering multiple PEMFC operating parameters, which accurately expressed the PEMFC-activated overvoltage through the parameterization formula [11,12]. In 2000, Mann and Amphlett gave an analytical expression of ohm overvoltage in PEMFCs by analyzing the topology of a proton exchange membrane [13]. This model is recognized as the semi-empirical model that can best reflect the polarization characteristics of PEMFCs under different operating conditions at present. The model was widely used in the study of stack parameter identification, since there is no evidence of a relationship between Kim’s exponential function parameters and experimental mass transport variables for describing concentration overvoltage. In 1999, Squadrito proposed an improved empirical formula of concentration overvoltage based on the Atkins model [14]. The model requires fewer identification parameters; however, different stack operating conditions have a remarkable impact on the model precision in fitting concentration overvoltage. In 2004, Kulikovsky started with the Srinivasan and Kim models and took the influence of oxygen supply into consideration by applying stoichiometry of activation overvoltage and concentration overvoltage of PEMFCs [15]. In 2009, Jiang Hui Yin established a PEMFC model that considered all areas of PEMFCs and could characterize the influence of membrane water content variation on PEMFC performance [16]. In 2018, Chakraborty analyzed the nonequilibrium state error of the Nernst voltage for PEMFCs [17].
Low platinum (Pt) loading and high performance requirements have impelled the researchers to explore the influence mechanism of the membrane electrode assembly (MEA) structure and material composition on overpotential of PEMFCs. [18]. The essence of concentration polarization is the phenomenon that cathode reaction gas encounters mass transport resistance in the process of passing through a gas diffusion layer, microporous layer and catalyst layer, resulting in an insufficient catalytic reaction of reaction gas [19]. Model simulation and experimental studies on mass transport resistance for the gas diffusion layer, microporous layer and catalyst layer of a PEMFC become a promising research direction to explore the possibility of improving the catalytic efficiency, reducing mass transport resistance of reactant gas and improving the performance of PEMFCs in the high-current region [20].
Nonoyama quantified the oxygen transport resistance in the PEMFC structural layer under different operating conditions (temperature, pressure, humidity) by carrying out an oxygen transport resistance measurement experiment. The simplified models of each oxygen transport subresistances were presented [21]. Hydrophobic particle materials were added to the cathode catalyst layer by Wan Zhaohui to analyze the influence on the oxygen transport resistance of the catalyst layer. The transport resistances were measured by limiting current testing [22]. In view of the difficulty in determining the key structural parameters of the catalyst layer, Epting used typical PEMFC electrodes with nano-CT imaging to measure the diameter distribution and analyzed the effect of agglomeration size distribution on concentration overvoltage of PEMFCs. The data source of concentration overvoltage was not mentioned in the literature [23]. Li Shan considered the structure of the catalyst layer and the effect of liquid water on a spherical agglomerate model to determine the electrochemical kinetics of the cathode catalyst layer. The effects of the agglomerate radius r a g g and the volume fraction of the ionomer L i , a g g on PEMFC local mass transport characteristics were studied by using the established agglomerate model [24].
The limiting current is defined as the current at which oxygen diffuses through the GDL and CL layers to the active site of the catalyst and is consumed instantaneously, and the voltage drops sharply to zero [21]. This physical quantity can indirectly represent the oxygen transport resistance in the gas diffusion layer and catalyst. In order to obtain a relatively stable measurement value of the fuel cell limiting current density, it is necessary to control the oxygen supply of the cathode to a certain flow, that is, to control the oxygen supply with a constant flow rate rather than a fixed stoichiometric ratio.
Many scholars have carried out relevant studies by taking advantage of the fact that there is zero oxygen concentration on the surface of catalysts under limiting current conditions. For example, Reshetenko proposed an experimental method to determine the mass transport coefficient of oxygen in the gas phase and ionomer. The method was based on the mathematical model of limiting current density distribution and diluted gases of different molecular weights, and gave the conclusion that the total transport coefficient had a linear relationship with the molecular weight of the diluent gas [25]. Spingle and Schuler [26] developed a hydrogen pump limiting current device to analyze the mass transport loss and gas diffusion for the catalyst layer and microporous layer. Attuluri’s experimental data on the PEMFC polarization curve at variable temperatures show that the limiting current density is positively correlated with the PEMFC temperature in general; however, this paper does not give the mechanism explanation [27].
High-performance PEMFCs for automobiles are important platforms for the application of hydrogen energy, and the breakthroughs in PEMFC technology will strongly support the large-scale application of hydrogen energy as a sustainable energy source. Based on analyzing mass transport rules of PEMFCs under the condition of variable temperature, it will be a potential modeling direction to combine the concentration overvoltage model of a PEMFC with a mass transport resistance mechanism. This study aims to explore the temperature dependence of the cathode mass transport resistance of PEMFCs in the high-current region and to optimize the performance of the model fitting for concentration overvoltage under variable temperature conditions. The novelty of this study is that we focused on modeling analysis of the ionomer/water membrane permeation resistance, which dominates the oxygen transport resistance under low Pt loading conditions of the catalyst, and reconstructed the ionomer/water membrane permeation resistance model based on the key structural parameters of the catalyst layer at the microscopic level. Meanwhile, the experimental methods for the separation of oxygen transport resistance in PEMFCs are systematically summarized for the first time. The importance of this study is to reveal the law of the PEMFC oxygen transport resistance in the high current density interval as affected by the difference in operating temperature, which provides a theoretical analysis basis for the development of high-performance PEMFCs and simulation research of cold-start operating conditions for a PEMFC stack.

2. Model Description

2.1. Concentration Overvoltage Model

At present, the most widely used concentration overvoltage electrochemical model of a PEMFC is a semi-empirical model proposed by Atkins [8], and the subsequent models proposed by Amphlett, Squadrito and others are developed based on this model. The concentration overvoltage of PEMFCs can be calculated by using the Nernst equation during concentration variation of the reaction gas at the electrode site [7].
The reversible voltage of PEMFCs can be expressed according to the Nernst equation.
E N e r n s t = E 0 + R T 2 F ln ( P H 2 · P O 2 1 2 P H 2 O )
The concentration overvoltage derivation process is detailed in Section S2 of the Supplementary Materials.
V c o n = R T F 1 4 + ϒ α ln ( 1 i i lim )

2.2. Limiting Current Density

As a highly sensitive parameter, i lim can significantly affect the simulation result of the concentration overvoltage model in the high-current region. Correa [28] conducted a sensitivity analysis on the i lim parameter based on BCS Technology stack experiment data, which also confirmed the conclusion above. Attuluri and Ozen, through experiments, proved the conclusion that appropriately increasing the operating temperature can significantly increase the i lim of PEMFCs and reduce concentration overvoltage [29]. In the past, according to the actual operation condition of PEMFCs, researchers generally set a fixed value or range estimate value for the i lim , ignoring the influence of PEMFC temperature fluctuation on i lim [30,31,32,33]. Therefore, in dealing with the situation of temperature fluctuation, simulation accuracy will decline in the high-current region of the classic concentration overvoltage model. The problem can be proved in Riascos’s simulation polarization curve image, which indicates convergence tendency on PEMFC concentration overvoltage (high-current region) under different temperature conditions. This trend is obviously inconsistent with the actual PEMFC polarization curve [34]. Therefore, it is necessary to introduce temperature as an influencing factor to modify the i lim (Equation (S5), Supplementary Materials) parameter in the classical concentration overvoltage model.
Atkins characterized the relationship between the molar conductivity of the electrolyte and the ionic diffusion coefficient by combining the Nernst–Einstein Equation (3), where the molar conductivity μ = 2 u F , and u is the ionic mobility.
D = R T μ z 2 F 2
Substituting Equation (3) into (Equation (S5), Supplementary Materials), the limiting current formula described by molar conductivity is obtained. δ N e r n s t is the thickness of Nernst diffusion layer.
i lim = c R T μ z F δ N e r n s t
Due to the complexity of the multilayer and multimaterial structure of the PEMFC MEA, it is difficult to use some fuzzy, immeasurable or undefinable boundary parameters such as ionic conductivity or Nernst diffusion layer thickness to characterize it.
PEMFC concentration overvoltage is dominated by the oxygen transport resistance of the cathode. The mass transport resistances with different cathode materials, structures and components are significantly different [35,36,37,38,39]. Oxygen transport resistance can be expressed by Formula (5) [40].
R t o t a l = Δ C J
According to equation (Equation (S5), Supplementary Materials), i lim is negatively correlated with oxygen transport resistance. Nonoyama et al. found in their study that the sensitivity of each oxygen transport subresistance was different under the influence of PEMFC temperature [21]. As a result, coupling subresistances of cathode mass transport into the analytic expression i lim , with oxygen an transport resistance measurement experiment to confirm the temperature effect of mass transport, putting analytical expression i lim into the classic PEMFC concentration overvoltage model, will be a meaningful research direction.

2.3. Mass Transport Resistance

At present, it is known that PEMFC cathode oxygen transport resistance consists of three kinds of mass transport subresistances, which are molecular diffusion resistance R M D , Knudsen diffusion resistance R C L , K n u d and ionomer/water membrane permeation resistance R C L , i o n . Due to the structural difference of each layer of the MEA, the location of the mass transport resistance is determined by the structural characteristics [41]. Molecular diffusion resistance mainly exists in the gas diffusion layer (support layer, microporous layer) of the MEA, in which the microporous layer is dominant, and the catalyst layer takes up a very small proportion. Knudsen diffusion resistance mainly exists in the catalyst layer, and a small part exists in the microporous layer. The permeation resistance of the ionomer mainly exists in the catalyst layer. Some studies have suggested that the outer boundary of the agglomerates that produce ionomer permeability resistance is surrounded by ionomer and water film (Figure 1). In this paper, the ionomer/water film on the surface of the agglomerates is considered as the same medium. Then the permeation characteristics of oxygen through the ionomer/water film can be effectively described.
In terms of R M D calculation, Wilke and Fuller–Schetler–Giddings equations are applied to calculate the molecular diffusion coefficient, where Equation (6) is used to calculate the binary diffusion coefficient of oxygen in a single gas component.
D A : B = 0.001 T 1.75 P ( v A 1 / 3 + v B 1 / 3 ) 1 M A + 1 M B
As cathode gas usually contains nitrogen, vapor and other components, the multicomponent gas diffusion coefficient for oxygen must be calculated. According to Equation (6), binary diffusion coefficients of oxygen in nitrogen and water vapor are calculated respectively. Then, taking the coefficients into the multicomponent gas diffusion coefficient calculation formula, the calculation formula for the oxygen diffusion coefficient in the air D O 2 : A i r , are (7).
D O 2 : A i r = j = 1 j A N c x j D A : j 1 = W N 2 · M C a , i n W C a , i n · M N 2 · D O 2 : N 2 + W V a · M C a , i n W C a , i n · M V a · D O 2 : V a 1
In Equation (7), nitrogen and vapor mass flow derivation process details can be seen in Supplementary Materials (S4. Humidification and mass flow rate conversion modules). Since the gas diffusion layer structure will affect molecular diffusion resistance R M D , in the actual analytic expression fitting process on R M D , the coefficient should be modified with the actual R M D measurement result of the PEMFC. Then the effective molecular diffusion coefficient D D M , O 2 e f f is introduced. The R M D is the equation dividing the thickness of the diffusion layer h D M by the effective molecular diffusion coefficient D D M , O 2 e f f , which is correlated with the molecular diffusion coefficient D O 2 : A i r .
R M D = h D M D D M , O 2 e f f 1 D O 2 : A i r
The diffusion coefficient of Knudsen diffusion D K n u d , O 2 can be expressed as (15).
D K n u d , O 2 = 2 r K n u d 3 8 R T π M A
Knudsen diffusion mainly exists in the catalyst layer. Considering the heterogeneity and complexity of the catalyst, the catalyst effective thickness h C L e f f and effective diffusion coefficient D C L , O 2 e f f are introduced to modify Knudsen diffusion resistance. The expression of Knudsen diffusion resistance R C L , K n u d for the catalyst layer is (10).
R C L , K n u d = h C L e f f D C L , O 2 e f f h C L e f f D K n u d , O 2
At present, there are still controversies about the catalyst layer ionomer binder and the Pt/C particle morphology. The interface model, homogeneous model and aggregate model are the most commonly used models to describe the catalyst layer structure [42]. This paper intends to introduce the agglomerate model as the architectural basis for the ionomer permeation resistance modeling. The permeation resistance of the ionomer R C L , i o n is expressed as Equation (11).
R C L , i o n = δ i o n e f f A i o n e f f H i o n , O 2 D i o n , O 2 R T δ i o n e f f A i o n e f f 1 ψ i o n , O 2 T
ψ i o n , O 2 is the permeation coefficient; this parameter is the ratio of the diffusion coefficient D i o n , O 2 to Henry’s constant H i o n , O 2 . Henry’s constant was introduced into the analytical Formula (11) to describe the oxygen permeation phenomenon at the interface of the ionomer film. The variation in oxygen diffusion concentration between the gas phase and the ionomer phase in the catalyst layer was effectively characterized by H i o n , O 2 .

2.4. Parameter Sensitivity of Oxygen Transport Resistances under Operating Conditions

The mathematical model of oxygen transport resistances in the section above indicates significant diversity in terms of temperature sensitivity (Table 1); R C L , i o n is significantly affected by temperature. For the factor of pressure, R M D is positively correlated with the change of cathode pressure, and R C L , K n u d and R C L , i o n are not affected by pressure variation. R C L , i o n was significantly affected by the condition of variable humidity. The type of balance gas also affects the oxygen transport resistance, for example, the diffusion coefficient of oxygen in different balance gases (such as N 2 and H e ), resulting in different R M D . In addition, some key structural parameters of the MEA, such as the thickness of the gas diffusion layer, the thickness of the catalyst layer h C L , the thickness of ionomer film δ i o n e f f and the radius of the agglomerate r a g g , also have significant effects on oxygen transport resistance. According to the analysis above, under the operating condition of variable temperature (60–90 °C), the R C L , i o n changes drastically compared with R C L , K n u d and R M D .

2.5. Method for Measuring Oxygen Transport Resistance

Due to the complexity and difficulty of observing the microstructure characteristics of the MEA, the structural parameters are difficult to obtain in general. In order to accurately fit each oxygen transport resistance with a mathematical model, it is necessary to appropriately modify the key structural parameters of oxygen transport resistance. Before modification, oxygen transport subresistance values should be measured. Some relevant measurement methods to separate and measure the oxygen transport subresistances under specific operating conditions have been proposed. The core idea to quantify oxygen transport subresistances is taking advantage of the sensitivity difference for cathode pressure, temperature, humidity and the type of balance gas. The experimental measurements of oxygen transport resistance methods are summarized and evaluated in (Supplementary Materials Table S1).
This paper summarizes the typical experimental methods of oxygen transport resistance measurement from the aspects of experimental variables, theory and implementation difficulties, for the first time. The four experimental methods can be used cooperatively according to existing experimental equipment and experimental conditions in order that oxygen transport resistance can be separated efficiently and accurately. Finally, the key structural parameters of each subresistance model are modified by using the measurement results of oxygen transport resistances under operating conditions. The key parameters to be corrected include r a g g , r K n u d , h D M , etc.

2.6. Structural Parameter Analysis and Optimization for Ionomer Permeation Resistance

According to the temperature sensitivity analysis above, the penetration resistance of the ionomer can significantly affect the PEMFC output voltage in the high-current region in terms of different temperatures. Due to the complexity and irregularity of the aggregate structure, effective thickness δ i o n e f f and effective area A i o n e f f of the ionomer film can only be estimated and measured in a certain accuracy range by imaging tools such as a scanning electron microscope [43,44,45]. Nonoyama et al. estimated the two parameters above at same time based on the experimental measurement data R C L , i o n (setting the value ranges of δ i o n e f f and A i o n e f f respectively, selecting the appropriate δ i o n e f f and A i o n e f f values to be used in conjunction with the formula of R C L , i o n , so as to fit the measurement results of R C L , i o n ). However, the direct simultaneous estimation of δ i o n e f f and A i o n e f f lacks the estimation basis, and the estimated value is likely to be far beyond the actual size range of the topological structure for the ionomer film [46].
In this paper, catalyst component parameters are used to effectively characterize the effective thickness δ i o n e f f and effective area A i o n e f f of ionomer film. The ionomer film thickness is expressed by the following relationship (18). For the detailed derivation, please refer to Li Shan’s literature [24]. In that paper, catalyst component parameters are used to effectively characterize δ i o n e f f and A i o n e f f . The ionomer film thickness is expressed by following relationship.
δ i o n e f f = r a g g L i 1 L i , a g g L P t / C L i , a g g + 1 3 1
The idea of deducing the effective area of ionomer film per unit of MEA area A i o n e f f is to share the effective area of the ionomer film to the surface of each agglomerate, which is the sum of the agglomerates’ effective area S a g g , i per unit catalyst volume. A i o n e f f can be represented by Formula (13).
A i o n e f f = S a g g , i · N · ε C L · A C L · h C L A C L = 3 L P t / C · ε C L · h C L r a g g 3 1 L i , a g g r a g g + δ i o n e f f 2
where S a g g , i is the area of a single aggregate, N is the number of aggregates, A C L · h C L is the volume of unit catalyst layer and ε C L is the pore volume fraction of catalyst layer.
According to Formula (13), by introducing catalyst component parameters, δ i o n e f f / A i o n e f f can be expressed as (14).
δ i o n e f f / A i o n e f f = r a g g 2 L i 1 L i , a g g / L P t / C L i , a g g + 1 3 1 3 L P t / C · ε C L · h C L
Substituting (14) into (11), then the newly constructed ionomer film resistance formula R C L , i o n is obtained (15).
R C L , i o n = r a g g 2 L i 1 L i , a g g / L P t / C L i , a g g + 1 3 1 3 L P t / C · ε C L · h C L · H i o n , O 2 D i o n , O 2 R T
Compared with Nonoyama’s model, Equation (15) uses the catalyst layer component parameters (Pt/C particle volume fraction L P t / C , volume fraction of ionomer L i and other measurable parameters) to effectively connect the two isolated catalyst structural parameters δ i o n e f f and A i o n e f f , which is worthy of putting forward to analyze the R C L , i o n detailed mechanism with more structural parameters.

3. Electrochemical Model of PEMFC

This paper is based on the electrochemical model of a PEMFC proposed by Amphlett, in which the Nernst reversible voltage is:
E N e r n s t = 1.229 0.85 × 10 3 ( T 298.15 ) + 4.3085 × 10 5 T ln P H 2 + 0.5 ln P O 2
Based on the Tafel equation obtained from the electrode reaction kinetics, the activation overvoltage is:
V a c t = R T α 0 F ln ( i i 0 )
The ohmic overvoltage is:
V o h m i c = i R m + R c
R m is membrane equivalent resistance, which dominates in ohmic overvoltage, and R c is electronic impedance.
R m = l · A C L 1 · 181.6 1 + 0.03 i A + 0.062 T 303 2 i A 2.5 λ 0.634 3 i A exp 4.18 T 303 T
From Equations (2), (8), (10) and (11), the newly established analytical formula of concentration overvoltage can be derived (20), in which the mathematical description related to oxygen transport resistance has not been expanded in detail. For detailed mathematical descriptions, please refer to (7), (9) and (15) above.
V c o n = R T F 1 4 + ϒ α ln 1 i R T 4 F P x O 2 h D M D D M , O 2 e f f + h C L e f f D D M , O 2 e f f + δ i o n e f f A i o n e f f H i o n , O 2 D i o n , O 2 R T

4. Result and Discussion

In this paper, the electrochemical mathematical one-dimensional model of a PEMFC is developed in the Matlab2021b environment; the model realizes oxygen transport resistance numerical simulation and PEMFC V-I characteristic curve simulation analysis. Nonoyama’s and Zhaohui Wan’s experimental operation conditions and MEA parameters were used in this paper (details in Supplementary Materials Tables S2 and S3). The experimental data of PEMFC cathode oxygen transport subresistances under the condition of different temperatures in Nonoyama’s and Wan’s literature are extracted and analyzed. The ultimate purpose is to apply the modified subresistances’ key structural parameters into the newly established PEMFC concentration overvoltage model, so as to analyze the simulation result in the high-current region.

4.1. Oxygen Transport Resistance Numerical Simulation

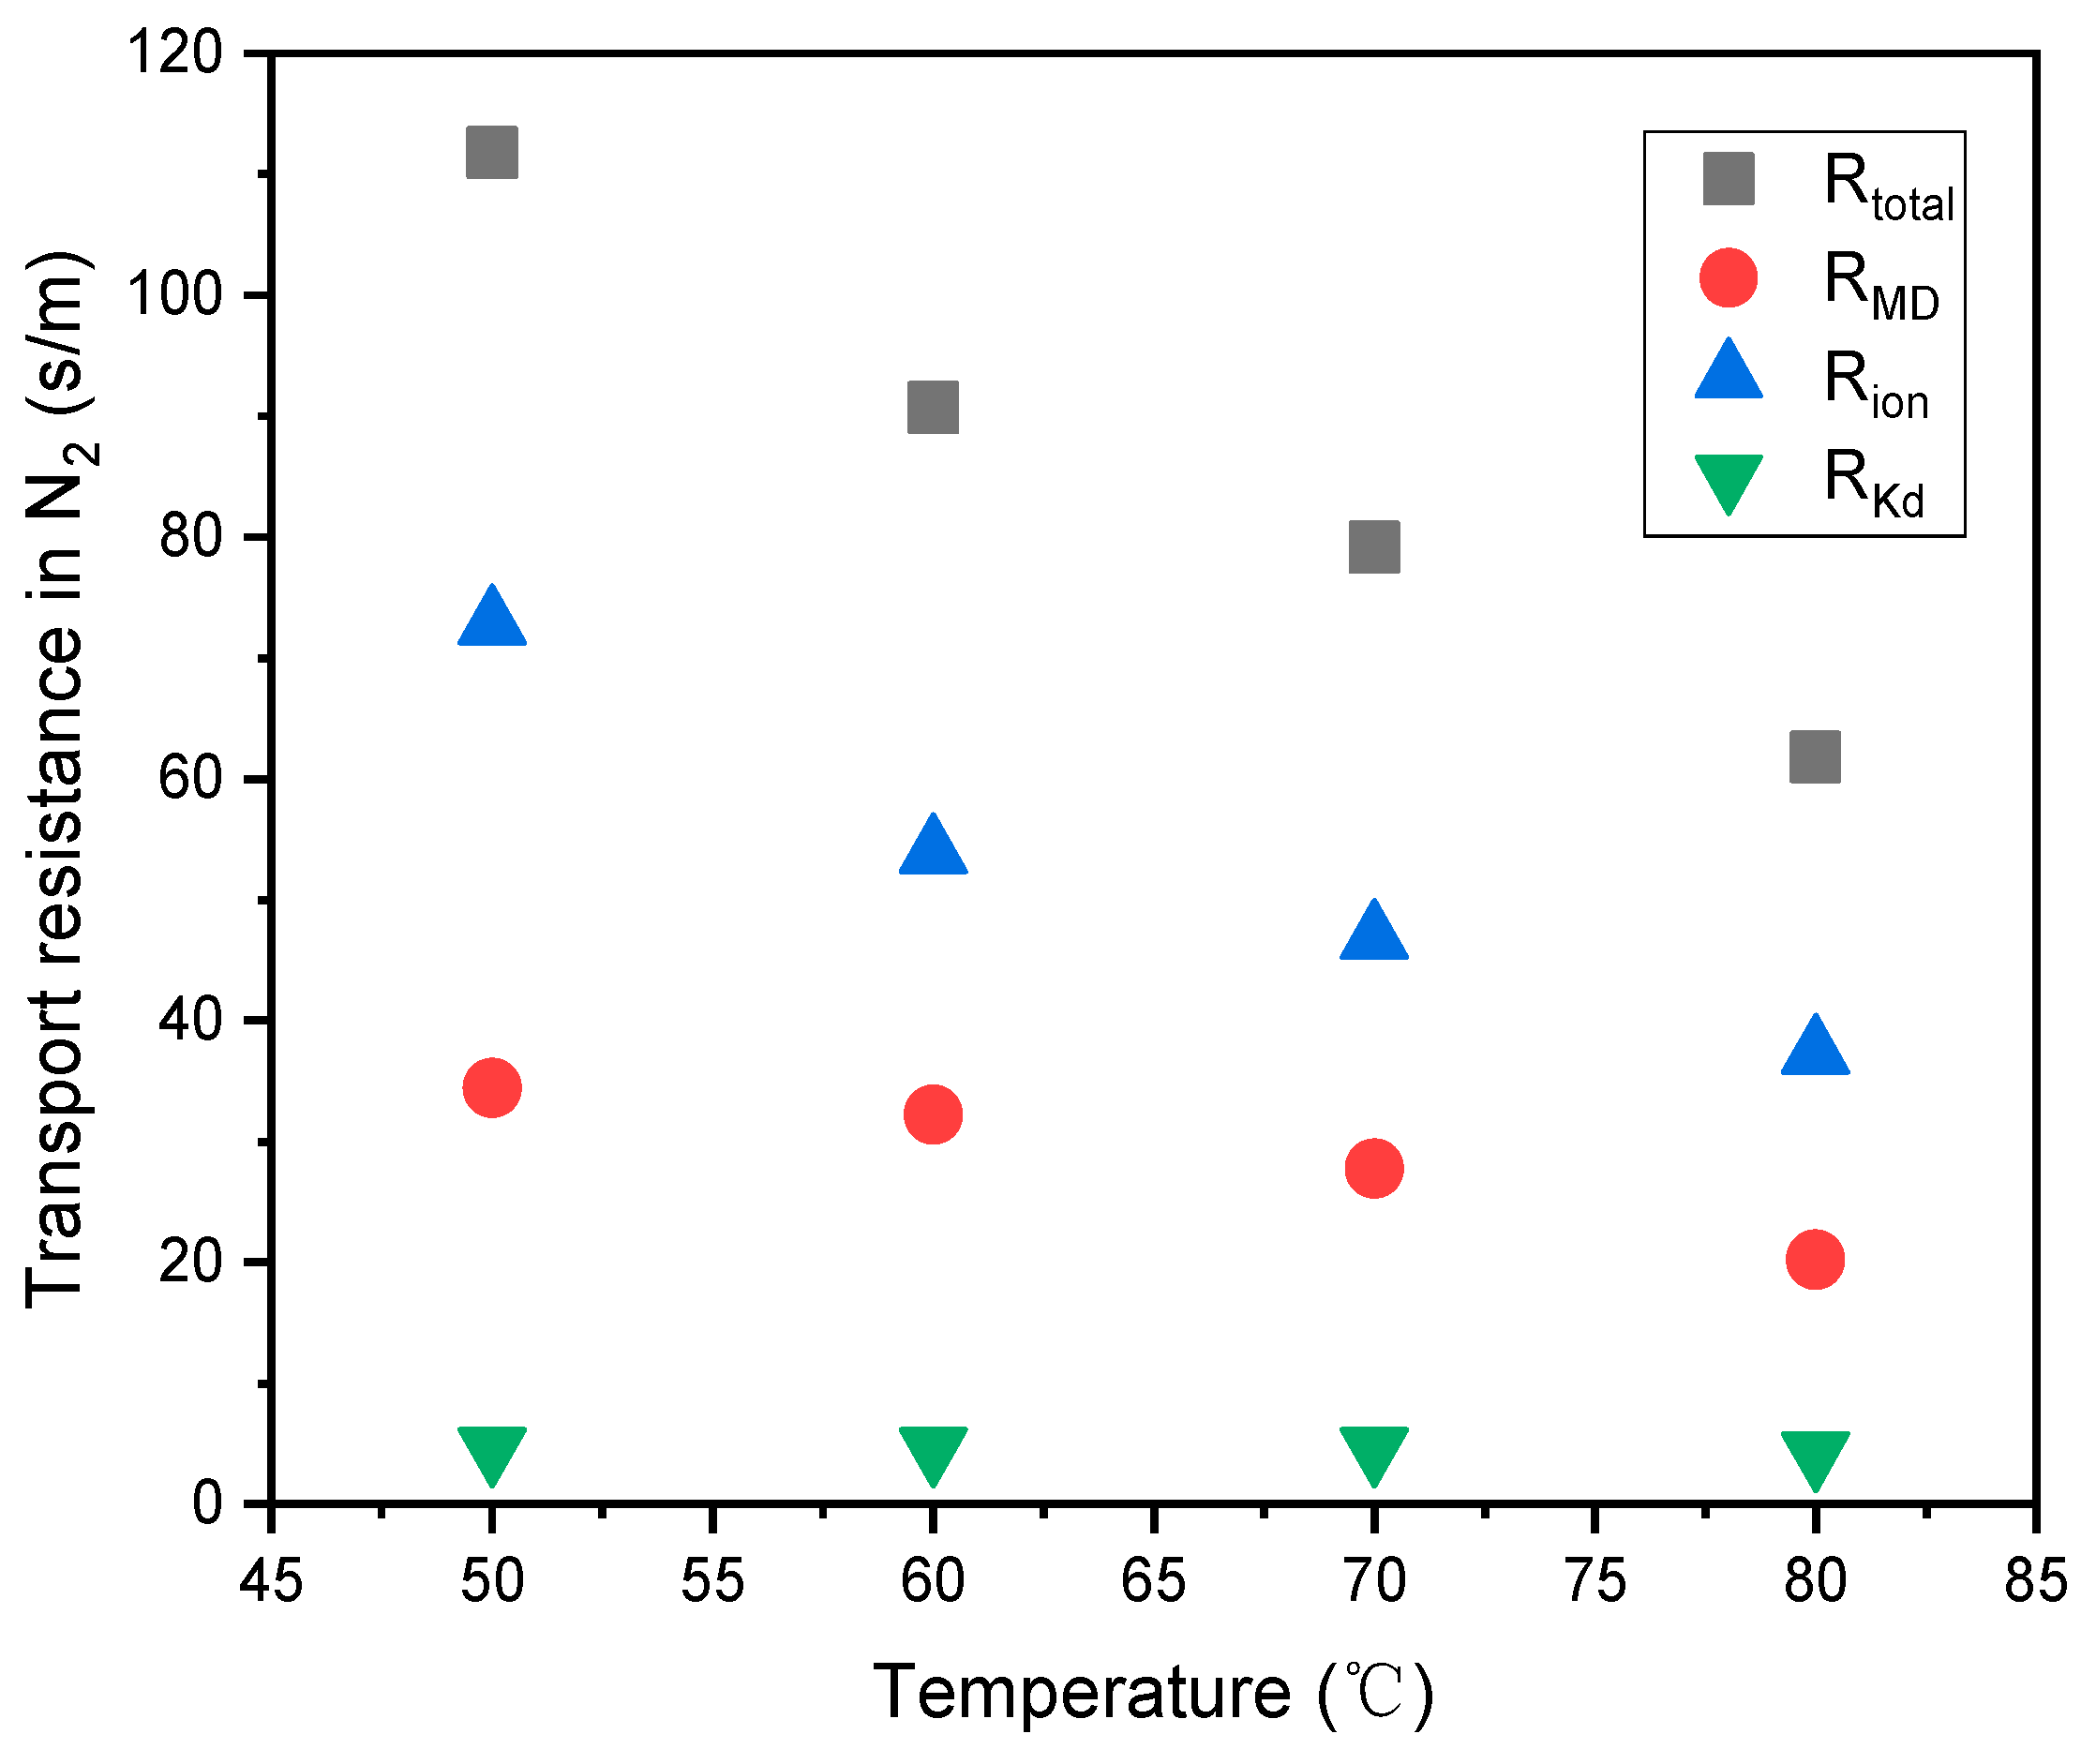
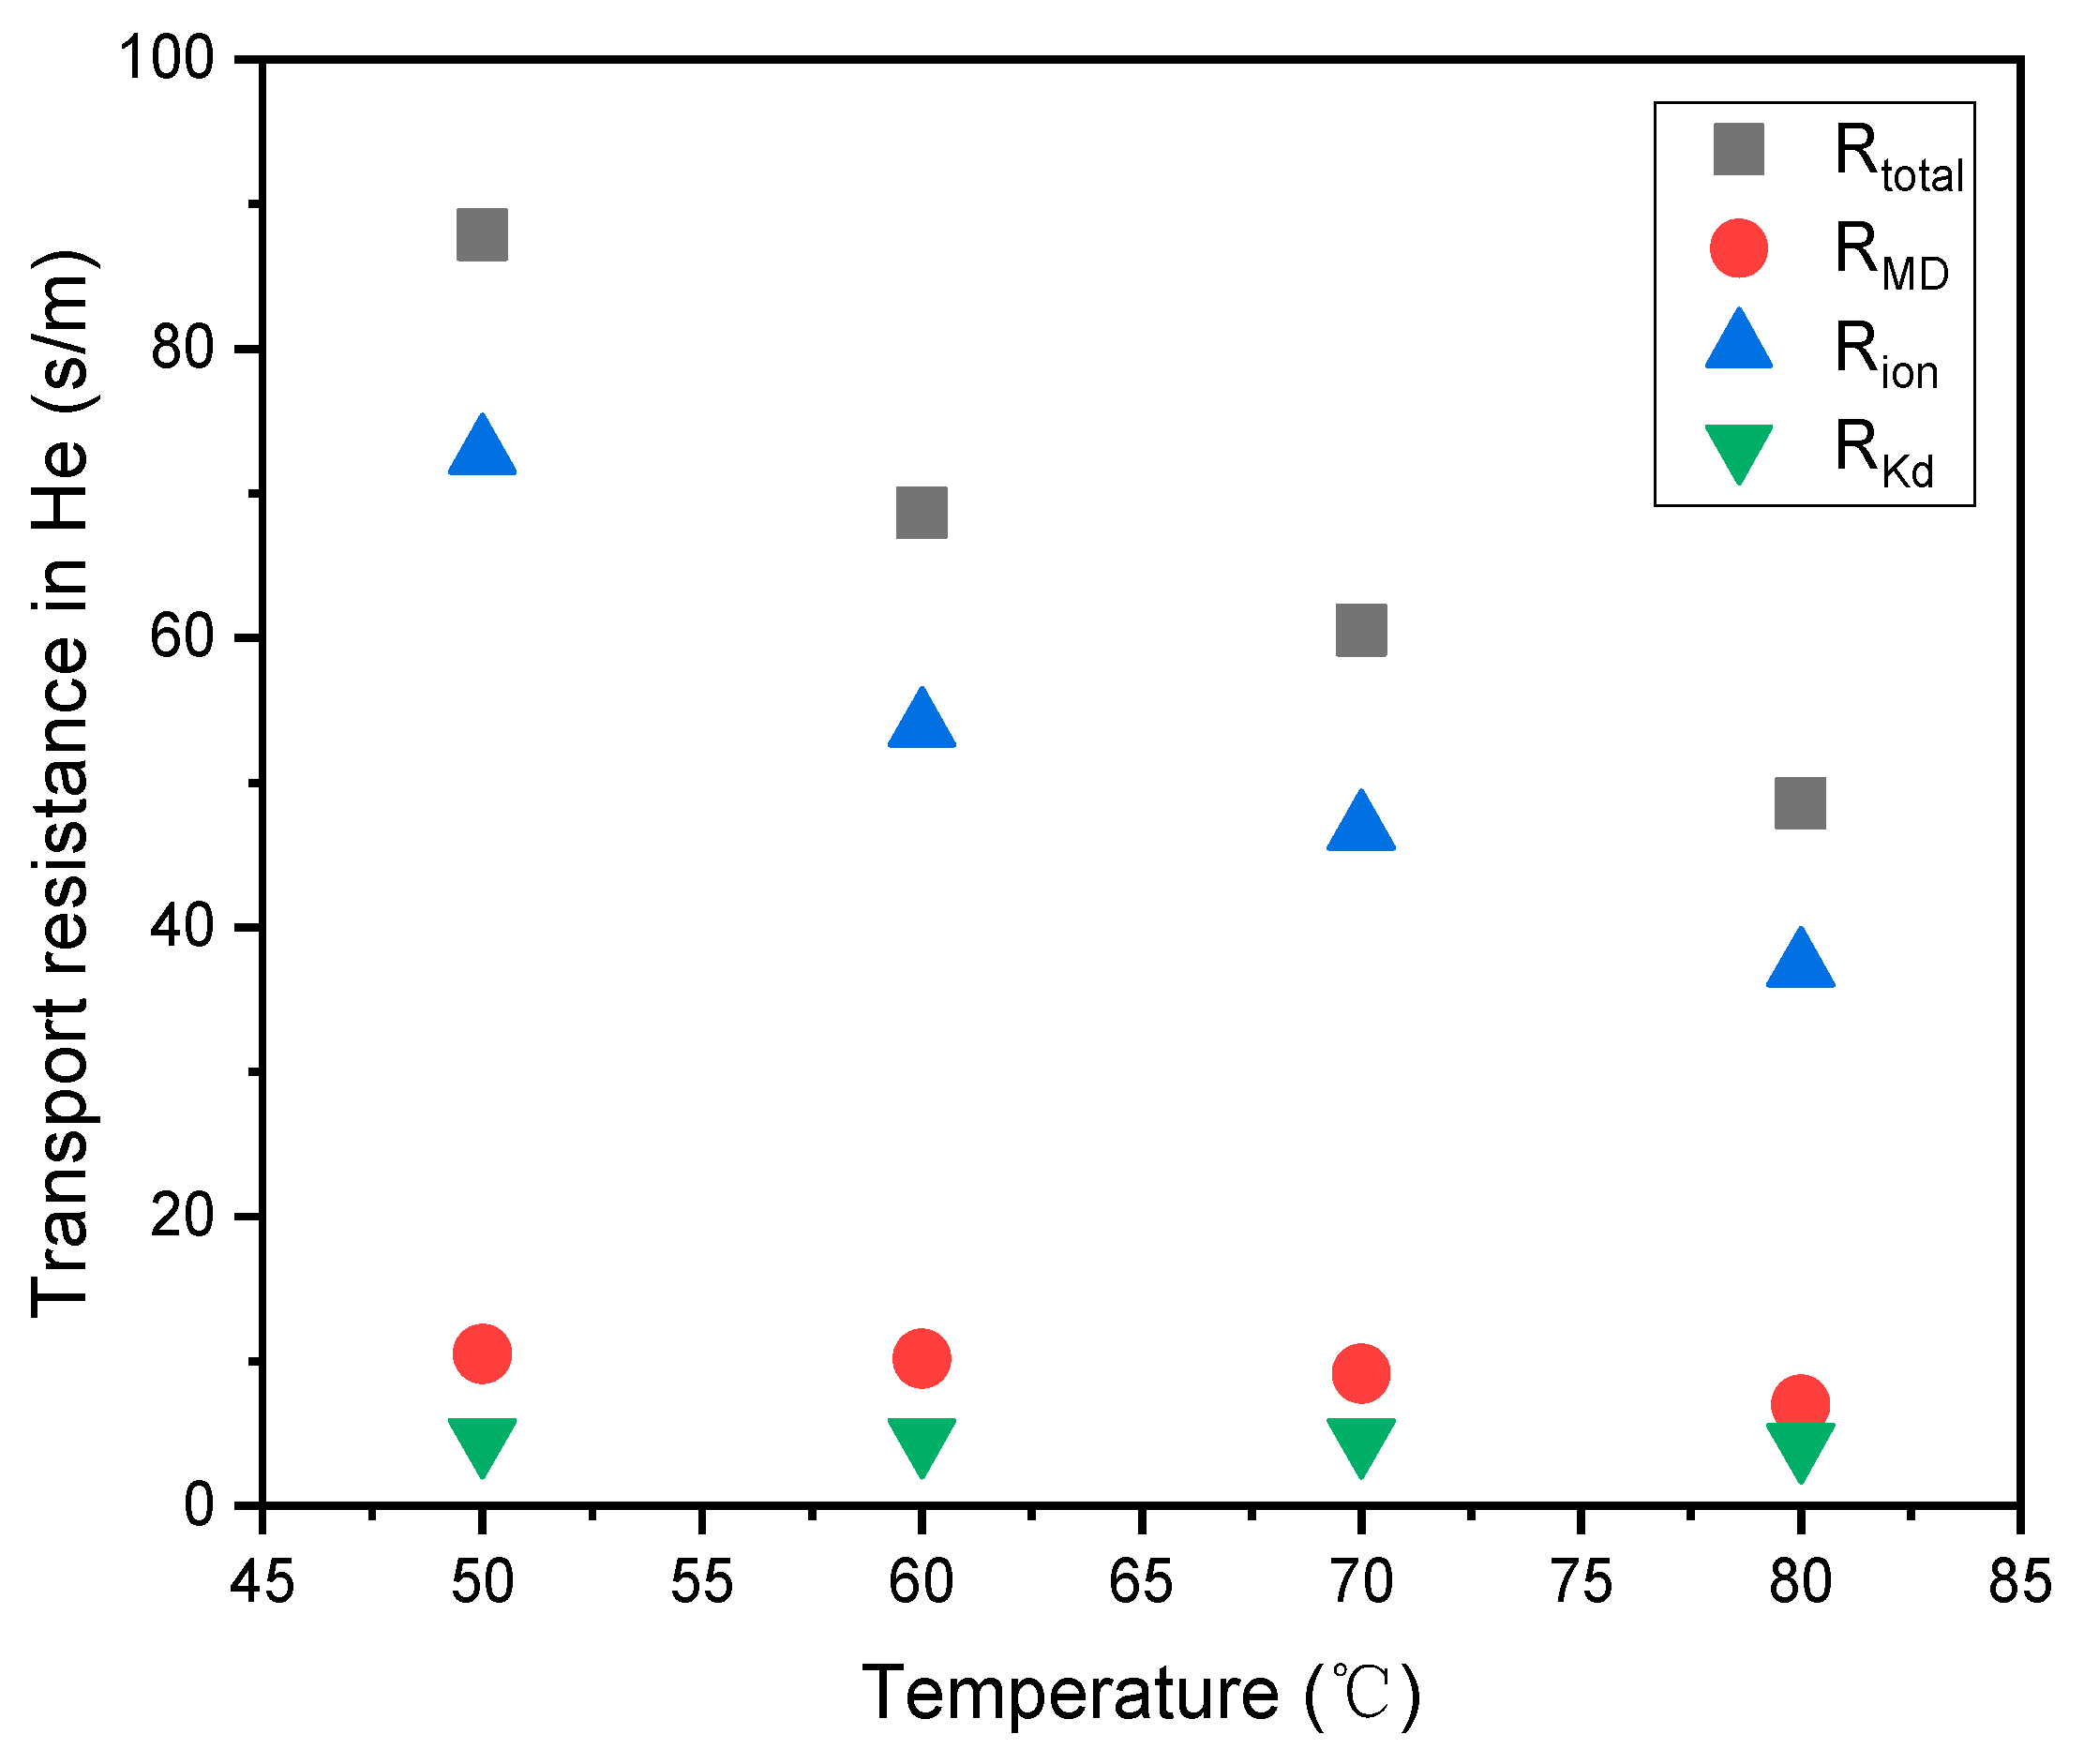
In Figure 2 and Figure 3, R M D is separated by switching the balance gas method while R C L , K n u d , R C L , i o n are separated by variable temperature operating conditions in MEA1. In Figure 4, R M D is separated by intercept method, while R C L , K n u d , R C L , i o n are separated by variable temperature operating conditions in MEA2. It can be seen from Figure 2 and Figure 3 that R M D is significantly different in balance gases ( N 2 , H e ), which reflects distinct diffusion difference in different balance gases. According to Tables S2 and S3 (Supplementary Materials) and comparatively analyzing Figure 3, Figure 4 shows that the Pt loading level can significantly affect the magnitude of R C L , i o n . At lower Pt loading conditions, R C L , i o n could even dominate R t o t a l , which indicates that Pt loading level is an important factor to describe the difficulty of oxygen molecules being catalyzed. Meanwhile, R C L , i o n can be seen to be more significantly affected by temperature than R M D and R C L , K n u d by observing its slope with temperature variation.

4.2. Experiment

The fuel cell MEAs were prepared according to the parameters in (Supplementary Materials Tables S2 and S3), and the fuel cell polarization curves were collected on an HTS-125 Hephas fuel cell test bench at variable working temperature. The effective area of the single fuel cell used for testing with carbon plate structure and serpentine flow channels is 2 cm2.
The polarization curve test conditions are as follows: H2/air flow rate, 500 cm3/min and 650 cm3/min for MEA1; 1700 cm3/min and 4600 cm3/min for MEA2; H2/air humidity 100/70% RH; H2/air back pressure 150/150 kPa (relative pressure). Fuel cell test temperatures are 60, 70 and 80 °C.
Although the problem of flooding in the high-current region should be considered, the literature experiment and our experiment adopted the measures of low oxygen concentration, high flow and small-reaction-area membrane electrode, which effectively avoided the problem of flooding for the single fuel cell [47].

4.3. The Effect of Variable-Temperature Operating Conditions on PEMFC Concentration Polarization

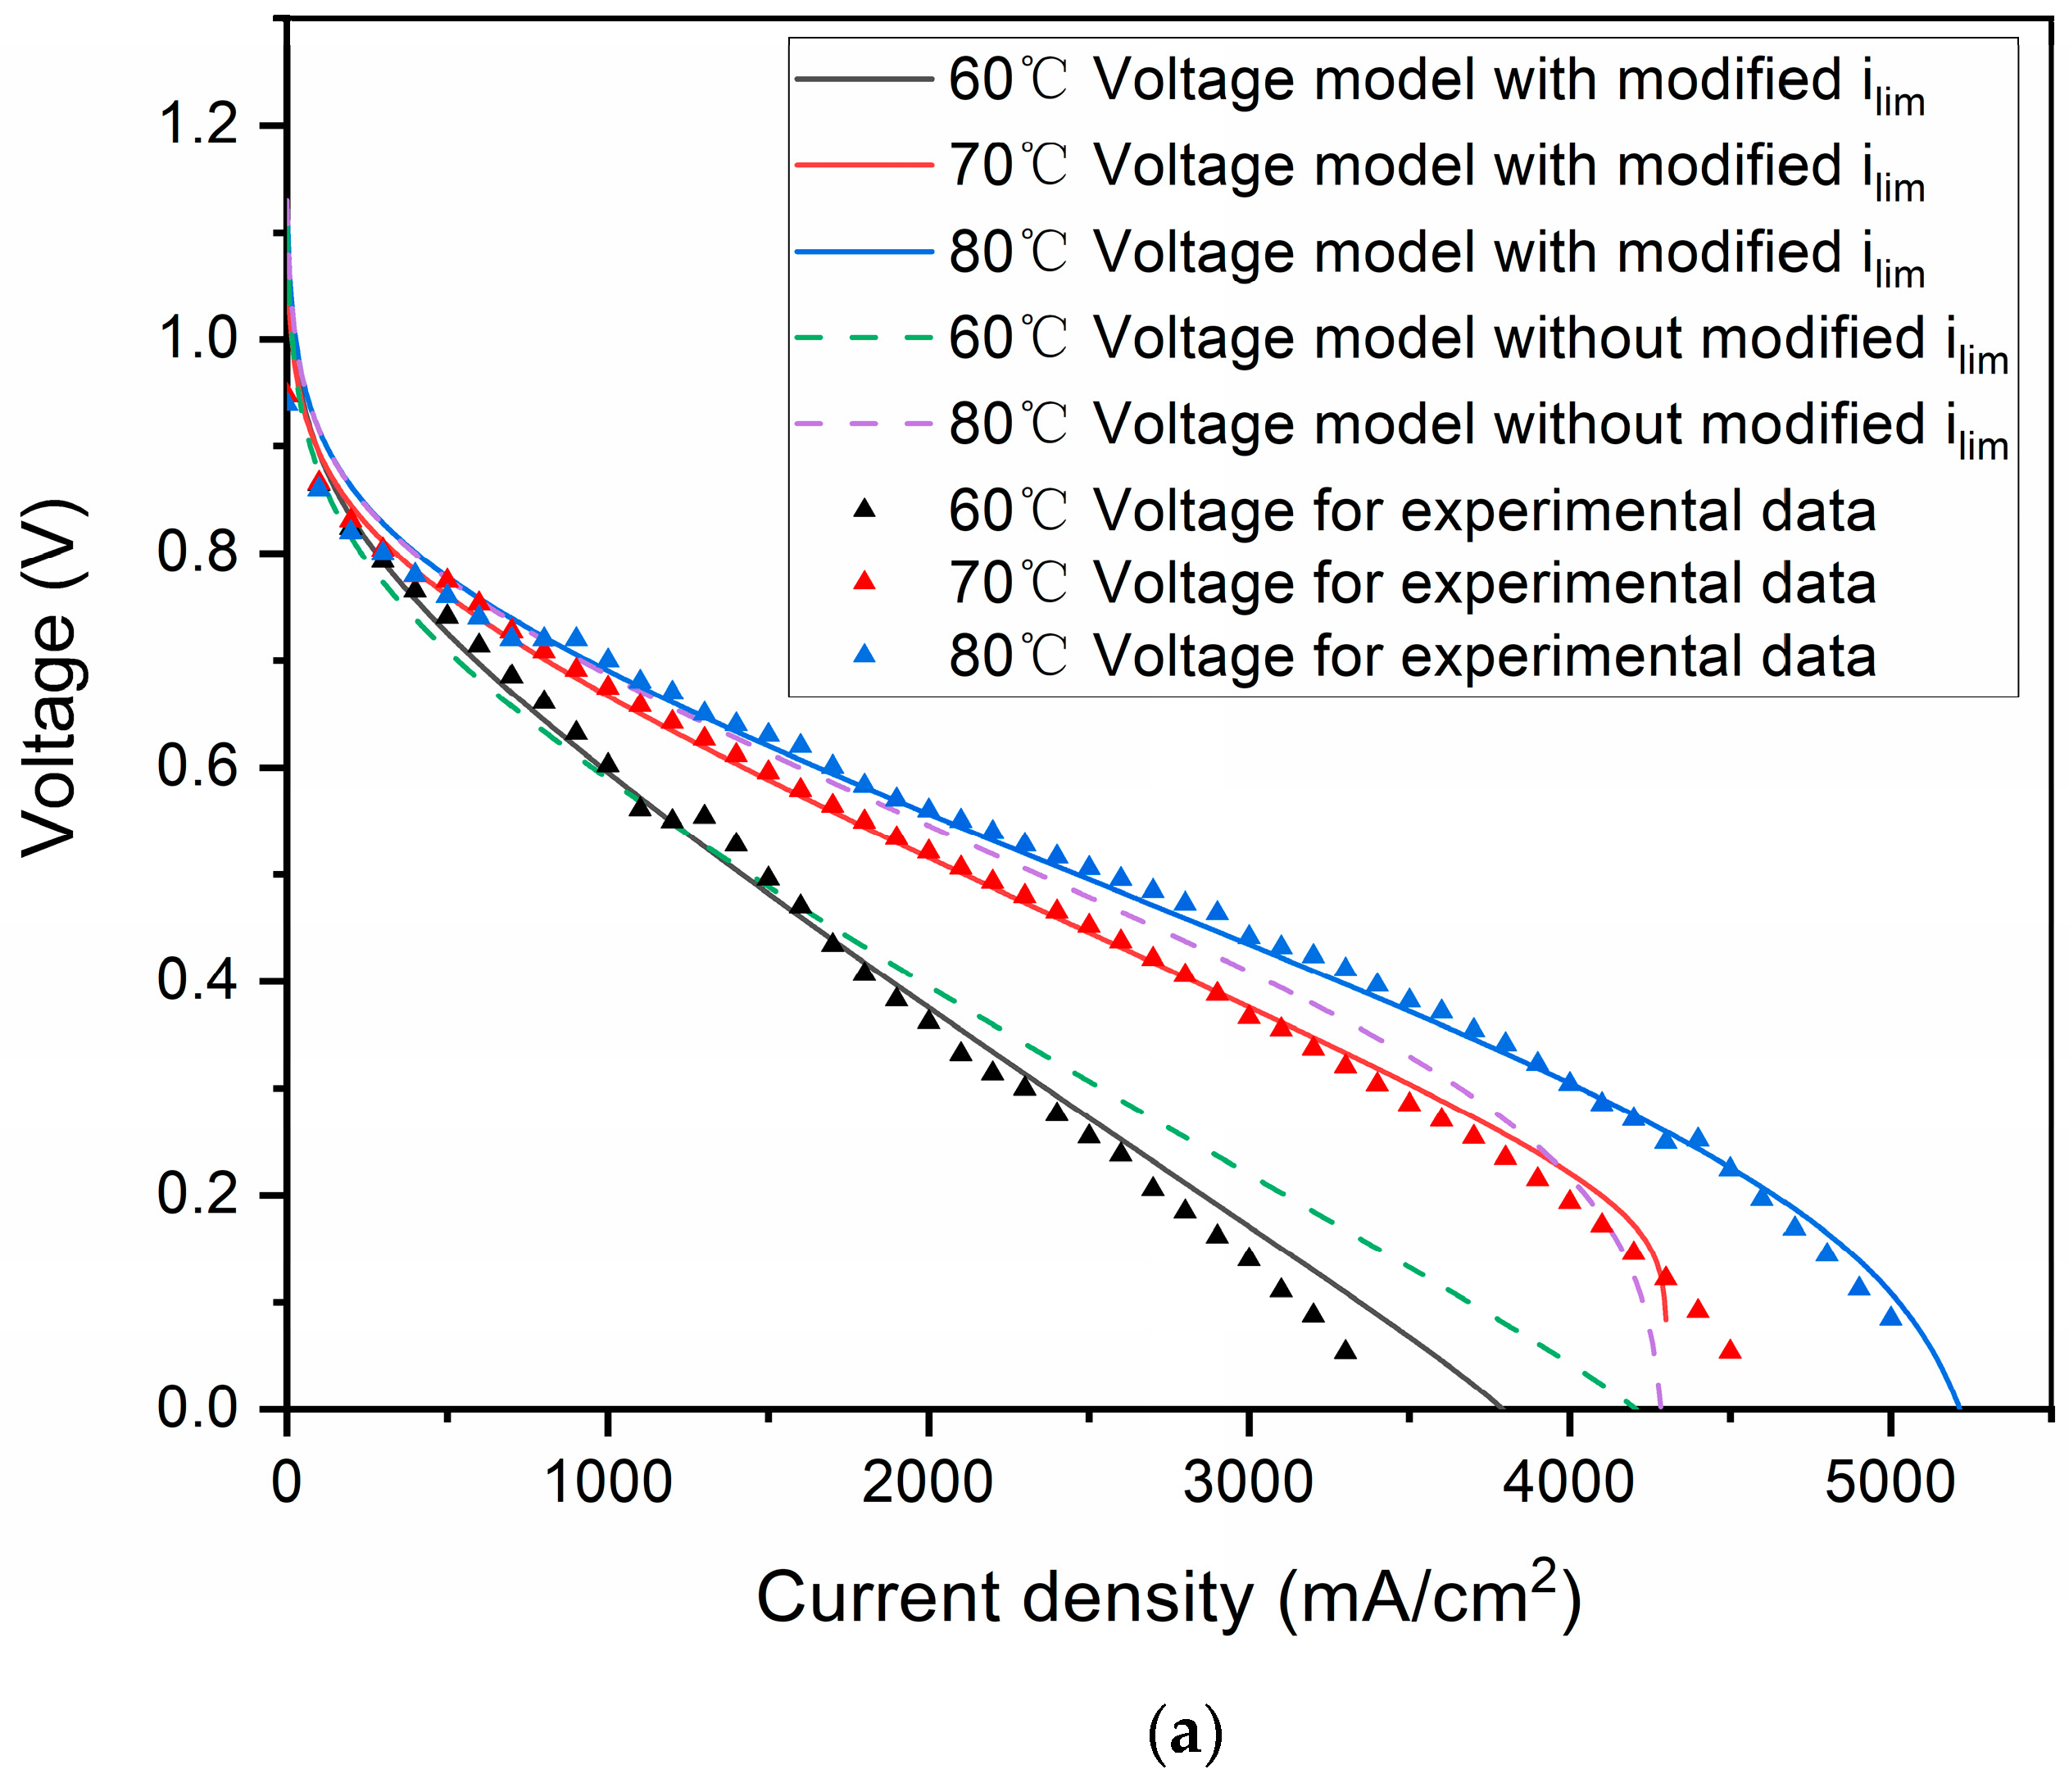
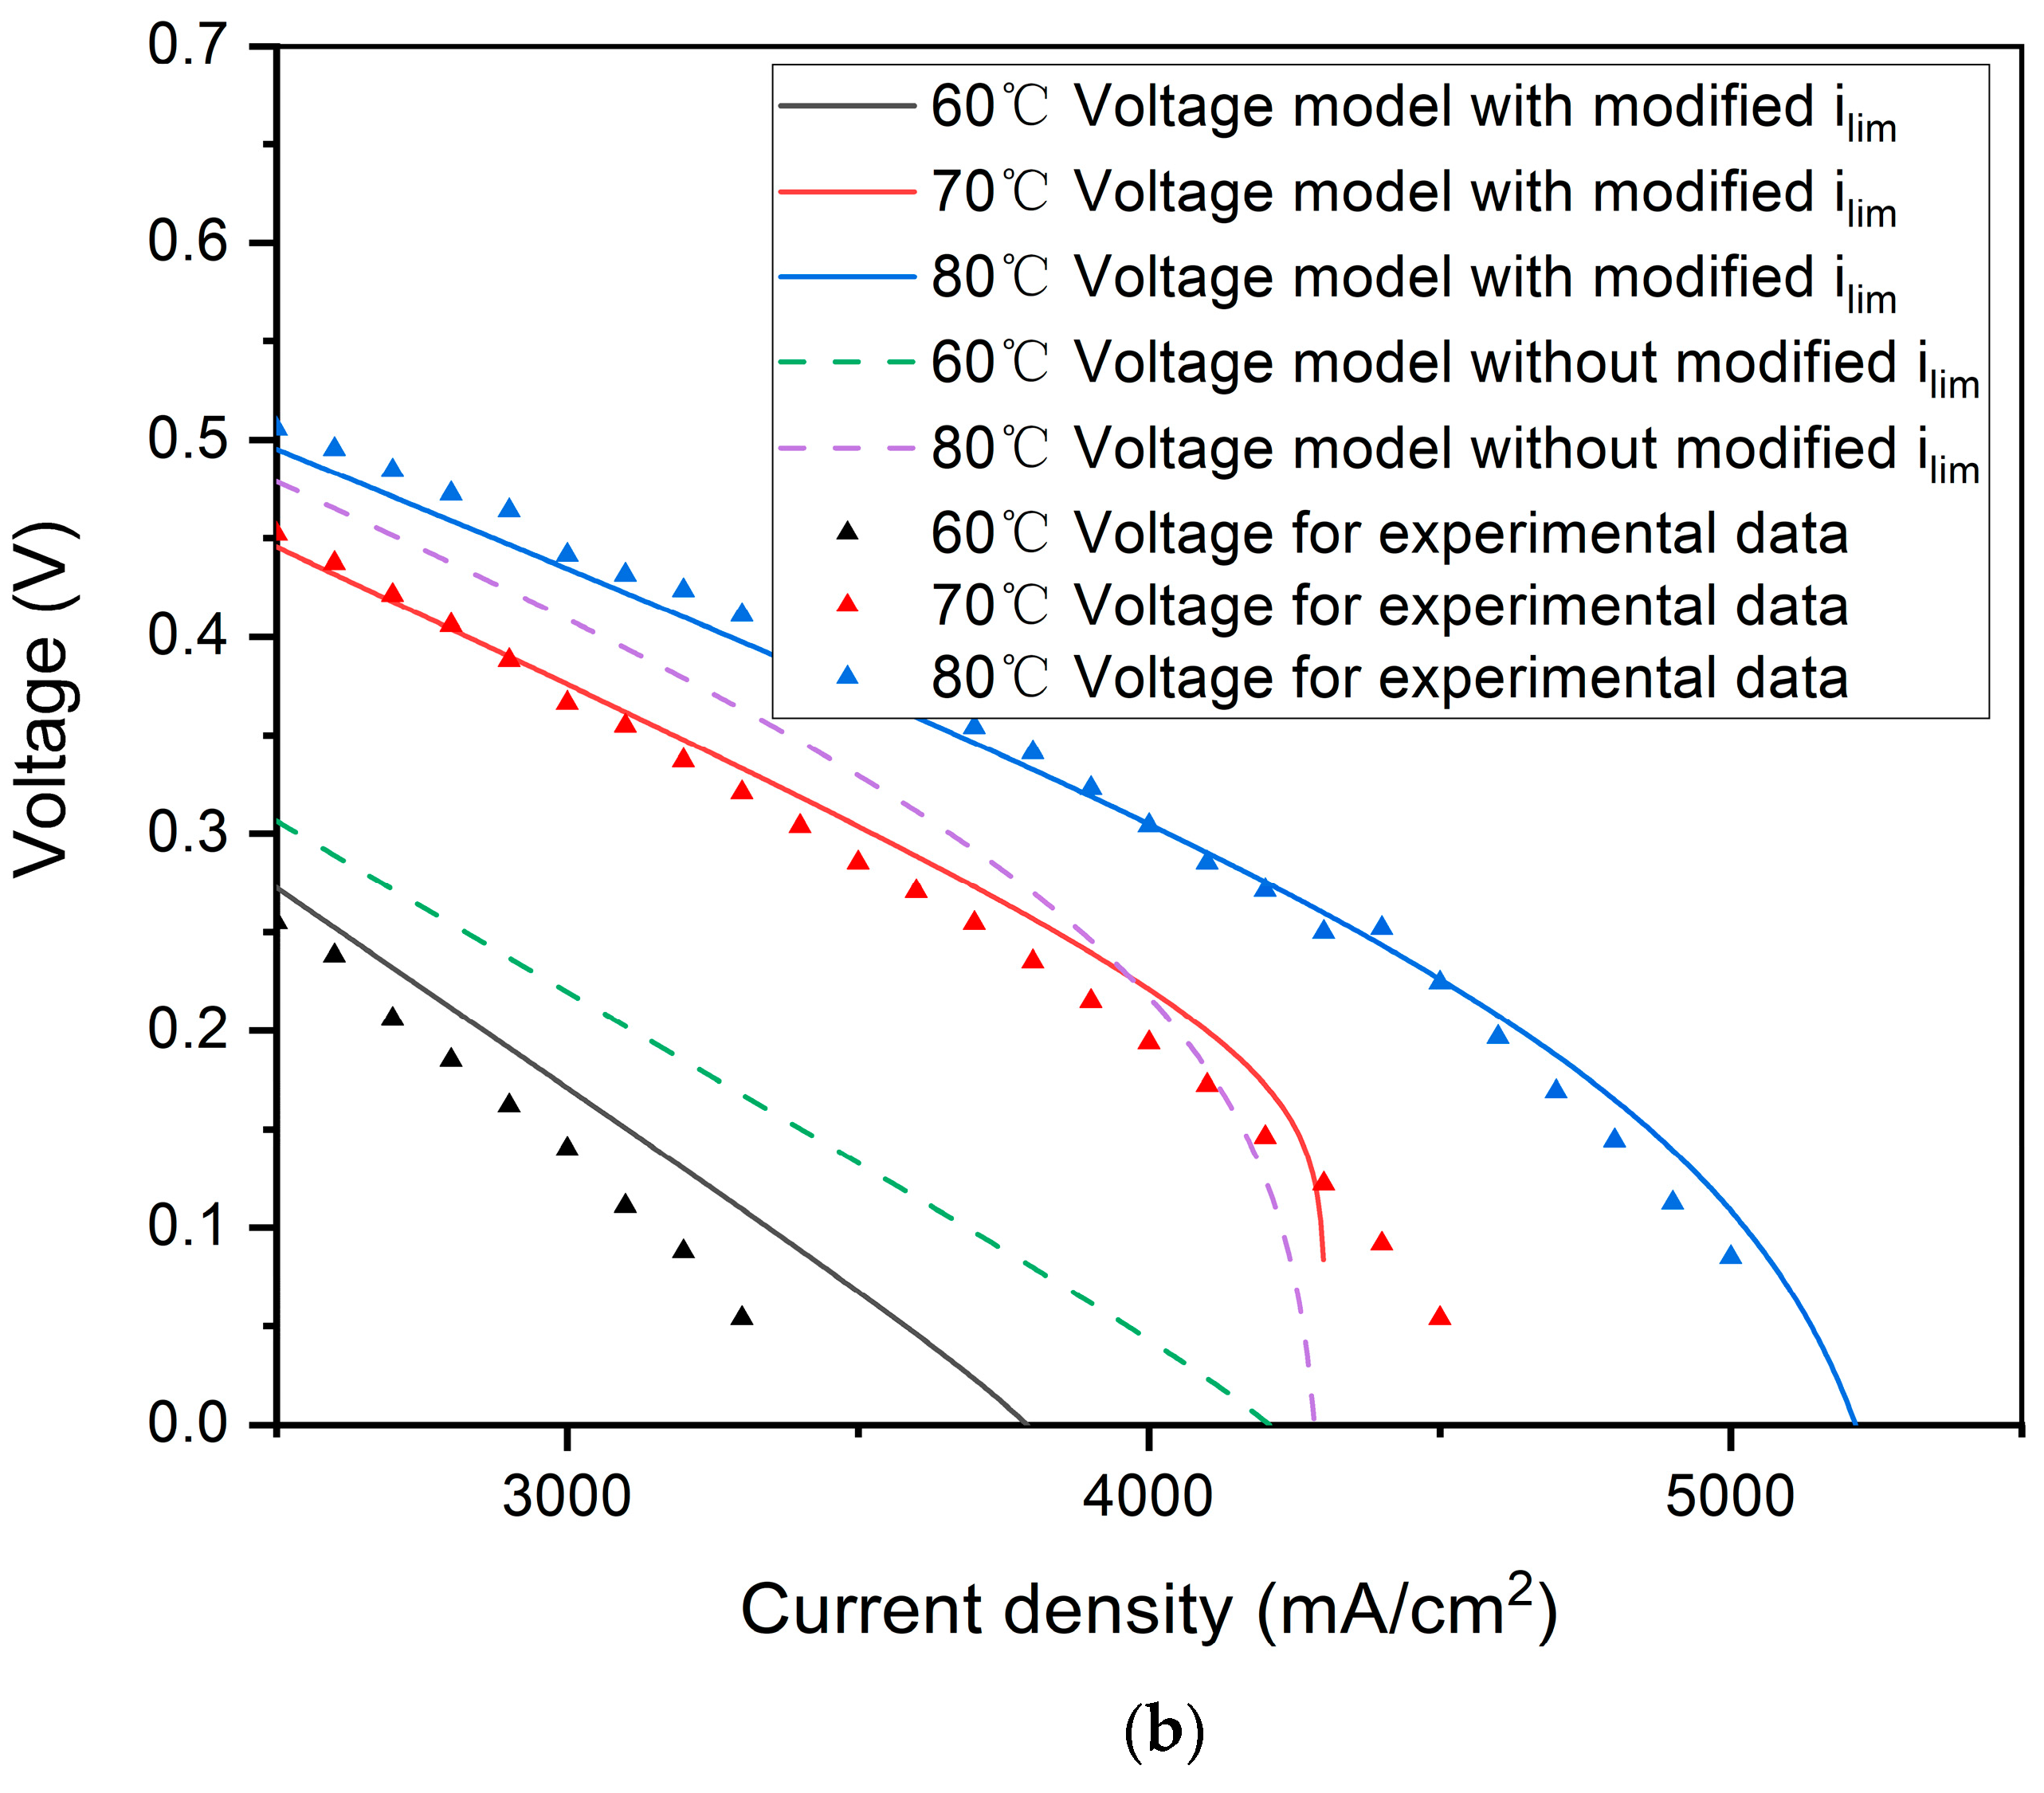
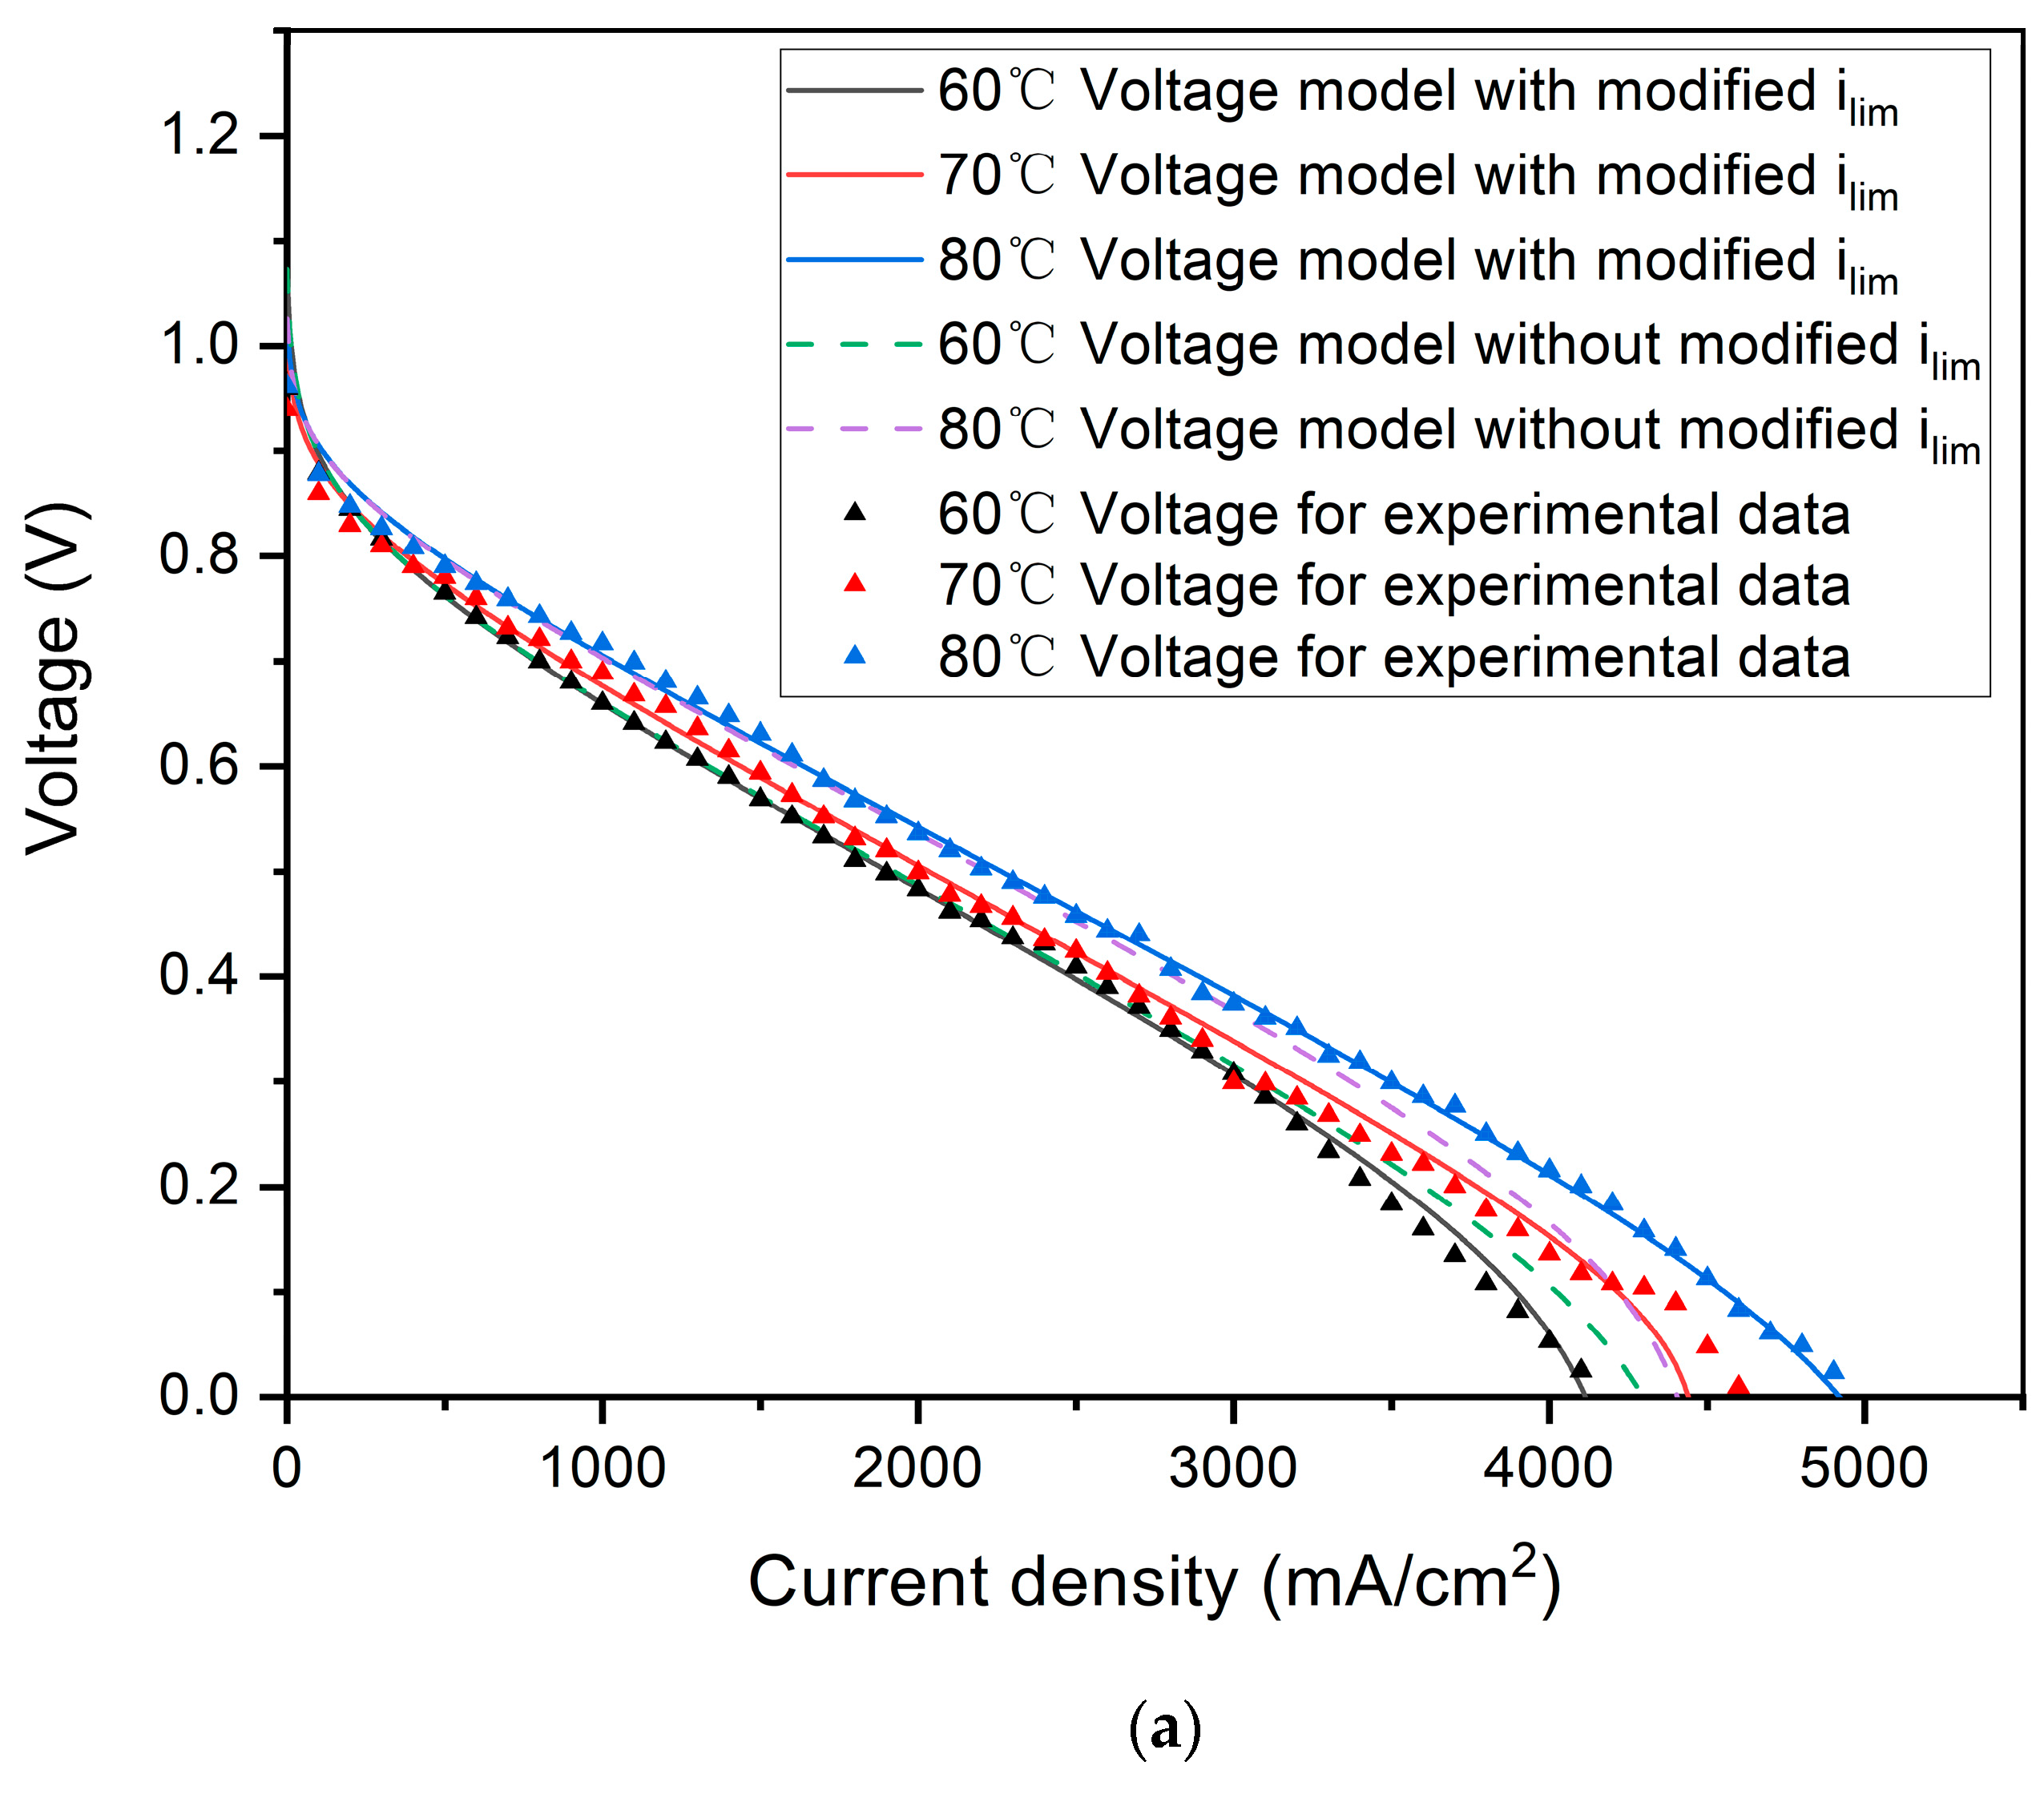
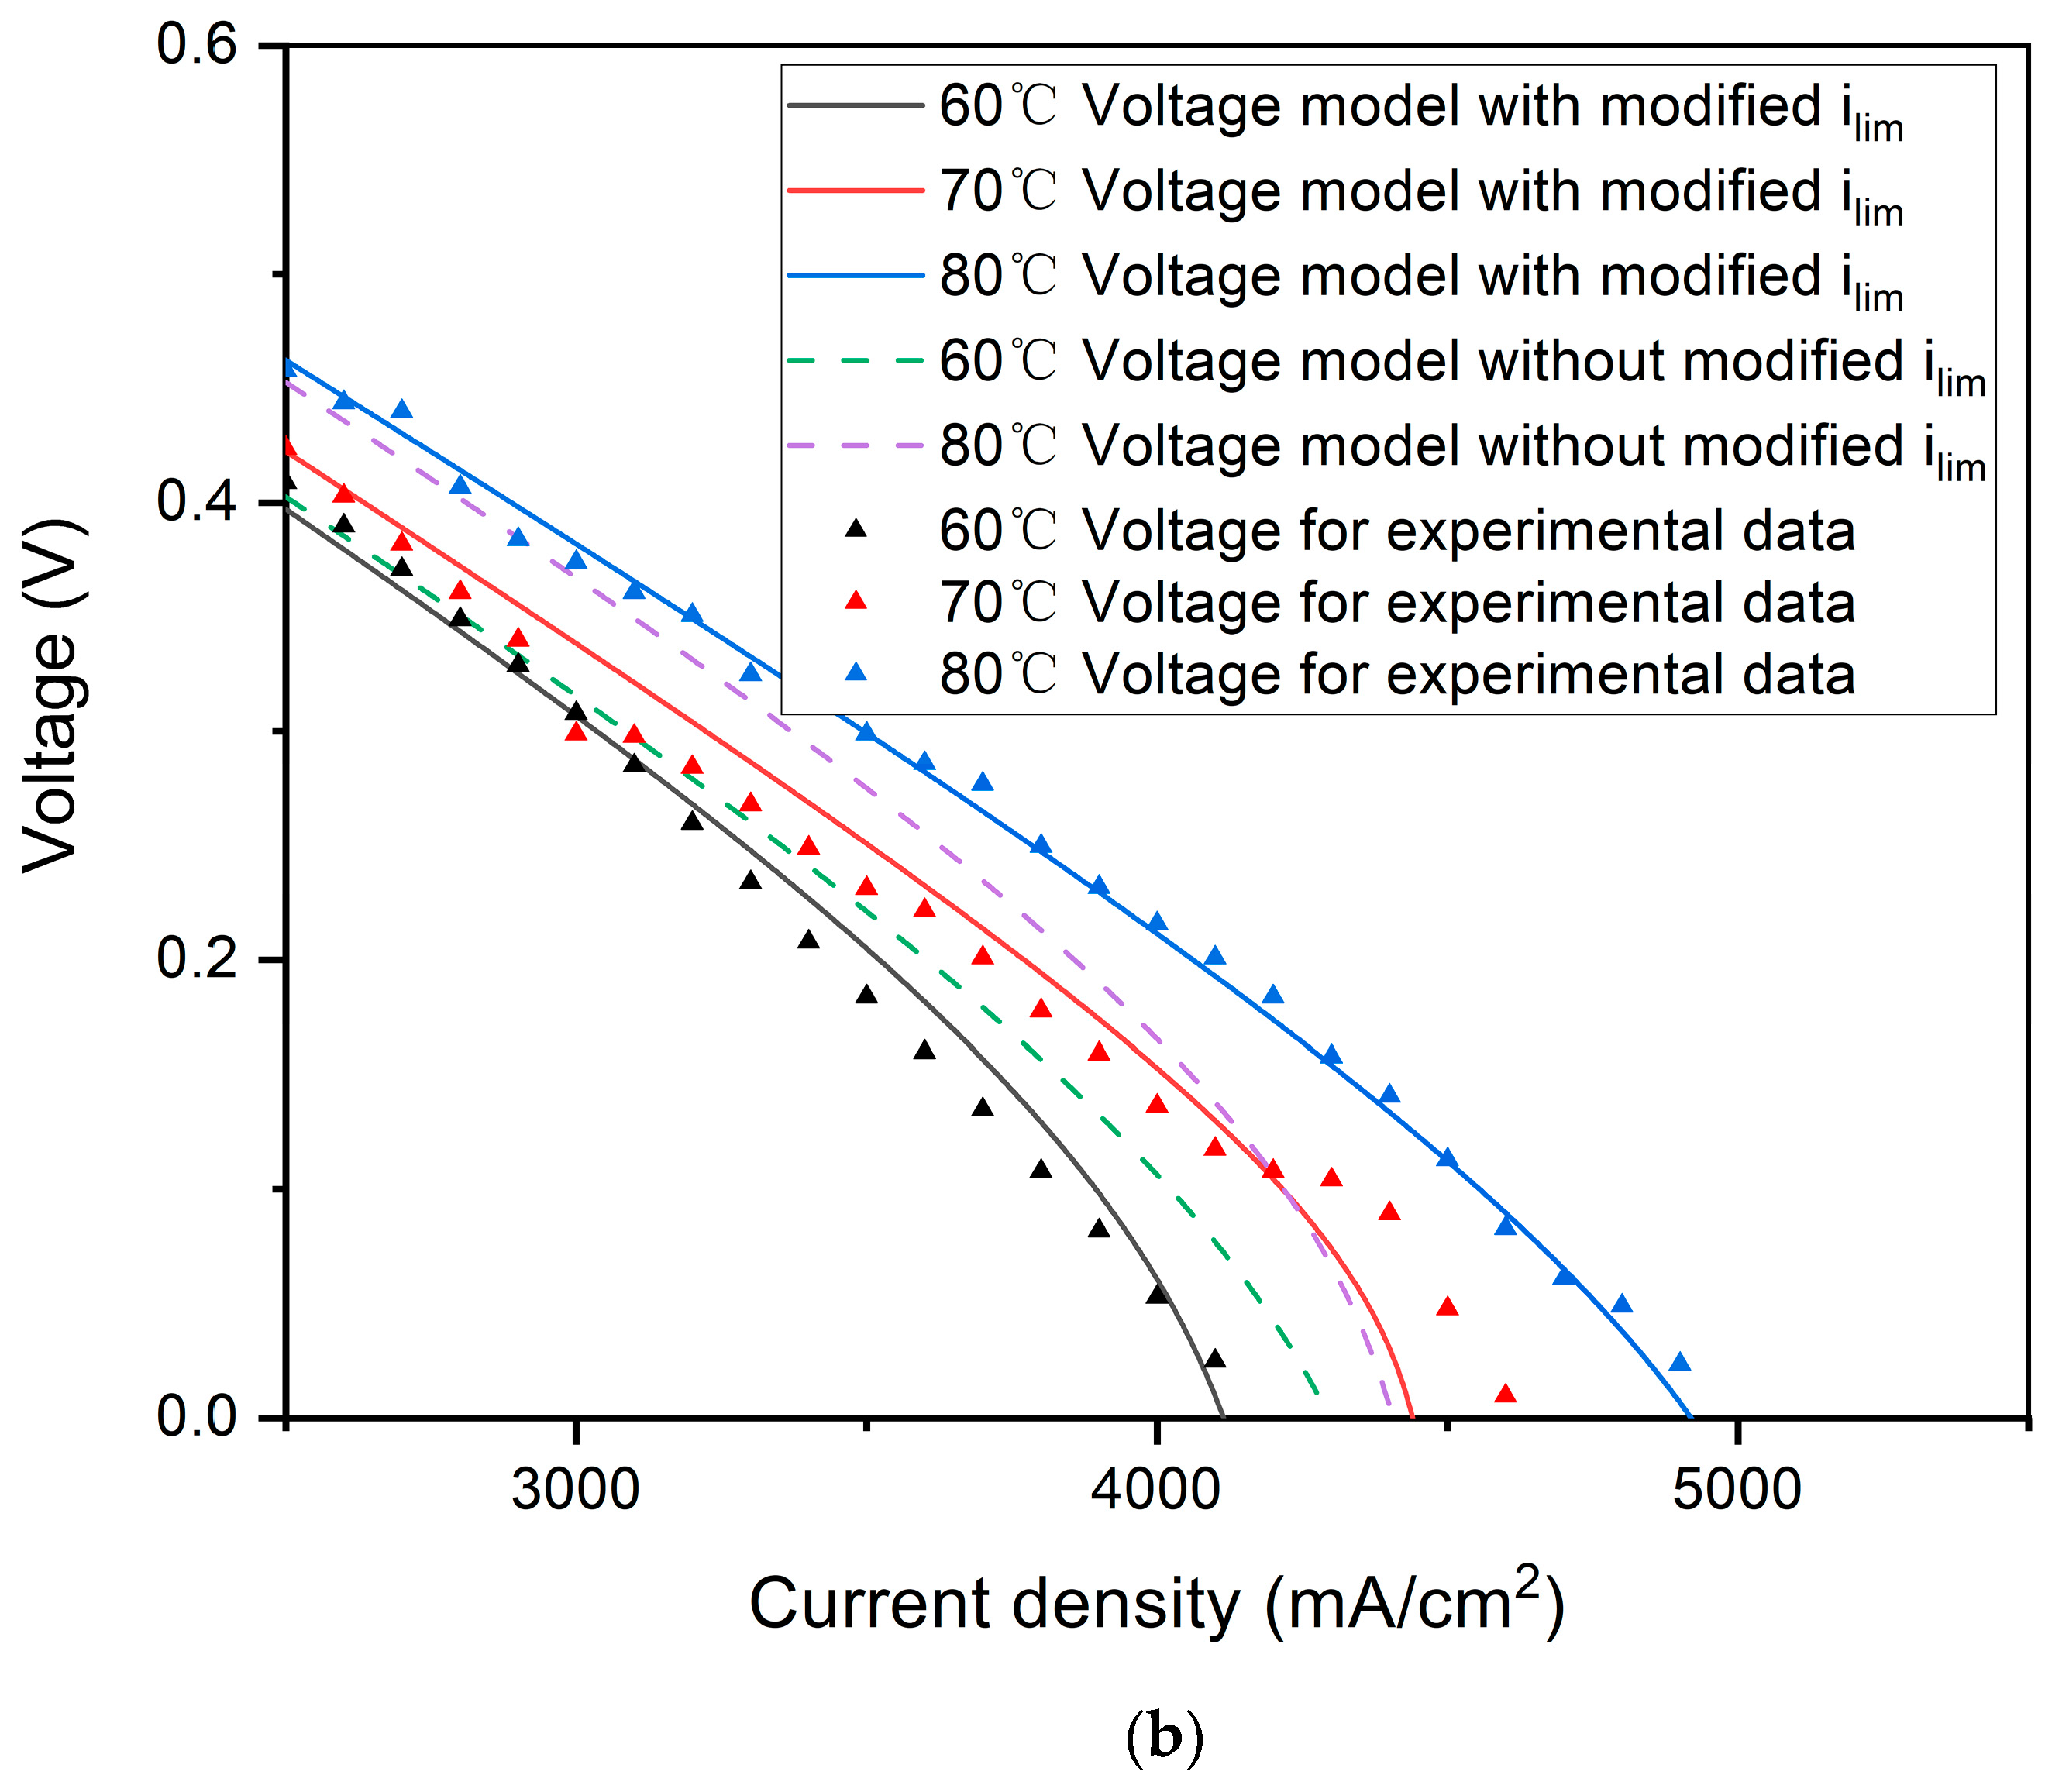
Both the simulation results of concentration overvoltage models based on i lim parameter correction and the classical concentration overvoltage model in the high-current region have been compared with experiment data in Figure 5 and Figure 6. It can be seen from Figure 5 and Figure 6 that when i lim is set at a constant value without considering the influence of temperature, the polarization curve of the classical PEMFC voltage model in the temperature range of ±10 °C tends to converge to the point of fixed current density in the high-current region, which is inconsistent with the experimental data of the PEMFC polarization curve under the actual temperature change condition. The i lim should be positively correlated with the working temperature of the PEMFC between 60 and 80 °C. Through relative error analysis, it is found that the relative errors of the concentration overvoltage model based on parameter modification are reduced by 1.94% and 4.58% when fitting MEA2 at 60 °C and 80 °C. The relative errors of the fitting effect for MEA1 decrease by 2.97% and 10.06% for the modified model at 60 °C and 80 °C. There is a more reasonable result for the parameter modification concentration overvoltage model on describing the variation of i lim affected by temperature fluctuation in the high-current region.

5. Conclusions

Reducing catalyst Pt loading is the PEMFC development direction. The permeation resistance of ionomer film will increase sharply with the decrease in Pt loading, which will significantly improve the total oxygen transport resistance of the PEMFC and even make the permeation resistance of the ionomer film become the dominant mass transport resistance in the high-current region. The limiting current density is an important physical quantity to characterize the total oxygen transport resistance of PEMFCs. The high sensitivity of ionomer film permeation resistance to temperature makes the factor of temperature fluctuation cannot be neglected when setting the PEMFC voltage model parameter of limiting current density. In this paper, the influence laws of temperature on the oxygen transport subresistances of cathodes are analyzed in detail. Experimental methods of oxygen transport resistance measurement are summarized comprehensively. The analytic expression of ionomer permeation resistance was optimized by reconstructing the representation of effective ionomer film area. Combined with the cathode structure parameters determined by oxygen transport resistance measurement data, a modification analytic expression for limiting current density parameter of a PEMFC under variable temperature has been proposed. Finally, a concentration overvoltage model of a PEMFC has been established under the condition of temperature variation. The newly established concentration overvoltage model of a PEMFC solves the problem of the limiting current density parameter setting with the traditional method of fixed or range estimation value, which does not consider the influence of PEMFC temperature fluctuation, leading to the poor simulation accuracy of concentration overvoltage in the high-current region. This paper provides theoretical support for the design and modeling of high-performance and high-power density PEMFCs.

Supplementary Materials

The following supporting information can be downloaded at: https://www.mdpi.com/article/10.3390/en17030730/s1. Figure S1: Flowchart of research procedure and methodology; Figure S2: 2 cm2 single fuel cell; Figure S3: Oxygen transport resistances simulation result compared with experiment data; Figure S4: Concentration overvoltage model validation with polarization curve at 250 kPa cathode pressure for MEA2. (a) General diagram of polarization curve. (b) Partial enlargement of polarization curve; Table S1: Method for measuring oxygen transport resistances; Table S2: Operating conditions and parameters of MEA1; Table S3: Operating conditions and parameters of MEA2; Table S4: Structural parameters of MEA1; Table S5: Structural parameters of MEA2. References [48,49,50,51,52] are cited in the supplementary materials.

Author Contributions

Investigation, Data curation, Writing—Original draft preparation, Writing—Review & Editing, Conceptualization, Visualization, Validation, T.T., Q.X. and B.Z.; Supervision, Resources, Project administration, X.Z.; Software, Methodology, B.Z. All authors have read and agreed to the published version of the manuscript.

Funding

This work was funded by the National Key Research and Development Program of China (Funding Number: 2022YFB2502402).

Data Availability Statement

Data is contained within the article (and Supplementary Materials).

Conflicts of Interest

The authors declare no conflicts of interest.

Nomenclature

A C L effective area of MEA (m2)
A i o n e f f effective ionomer film area for unit area of MEA (m2/m2)
C c h oxygen concentration in flow channel (mol/m3)
C P t oxygen concentration on platinum surface of catalyst (mol/m3)
D A : B binary molecular diffusion coefficient between gas species A and B (m2/s)
D ionic diffusion coefficient (m2/s)
D O 2 : A i r diffusion coefficient of oxygen in air (m2/s)
D D M , O 2 e f f effective molecular diffusion coefficient of oxygen (m2/s)
D C L , O 2 e f f effective Knudsen diffusion coefficient of catalyst layer (m2/s)
D K n u d , O 2 Knudsen diffusion coefficient of oxygen (m2/s)
D i o n , O 2 diffusion coefficient of oxygen through ionomer film (m2/s)
E N e r n s t Nernst reversible voltage of fuel cell (V)
F Faraday constant (C/mol)
h D M thickness of gas diffusion layer (m)
h C L thickness of catalyst layer (m)
h C L e f f effective thickness of catalyst layer (m)
H i o n , O 2 Henry constant of oxygen dissolved in ionomer (Pa m3/mol)
i lim limiting current density (mA/cm2)
J diffusion flux (mol/m2·s)
l thickness of proton exchange membrane r
L i volume fraction of ionomer in catalyst layer
L i , a g g volume fraction of ionomer in agglomerates
L P t / C Pt/C particle volume fraction
M A , M B binary diffusion gas A and B molar weight (g/mol)
M O 2 oxygen molar weight (g/mol)
M A i r air molar weight (g/mol)
M v vapor molar weight (g/mol)
M N 2 nitrogen molar weight (g/mol)
M C a , i n cathode inlet gas molar weight (g/mol)
N Number of agglomerates for unit catalyst volume
P O 2 partial pressure of water oxygen (kPa)
P H 2 O partial pressure of water vapor (kPa)
P H 2 partial pressure of hydrogen (kPa)
P C a cathode pressure (kPa)
P H 2 O s a t vapor saturation pressure (kPa)
r K n u d catalyst pore radius (m)
r a g g effective agglomerate radius (m)
R M D molecular diffusion resistance (s/m)
R C L , K n u d Knudsen diffusion resistance (s/m)
R C L , i o n oxygen permeation resistance (s/m)
R m equivalent resistance of proton exchange membrane (Ω)
R c electronic resistance (Ω)
S a g g , i surface area of a single agglomerate (m2)
T temperature (K)
v A , v B binary gas A and B diffusion volume (cm3/mol)
V a c t activation overpotential (V)
V o h m i c ohmic overpotential (V)
V c o n concentration overpotential (V)
W N 2 nitrogen mass flow rate (g/s)
W V a vapor mass flow rate (g/s)
W C a , i n cathode inlet gas mass flow rate (g/s)
x j mole fraction of gas j in multiple mixture gases
x O 2 oxygen mole fraction
y O 2 oxygen mass content in dry air
y N 2 nitrogen mass content in dry air
Greek Symbols
δ diffusion distance (m)
δ N e r n s t thickness of the Nernst layer (m)
δ i o n e f f effective thickness of the ionomer film (m)
Δ C difference in oxygen concentration (mol/m3)
Δ V difference in cathode overpotential (V)
ε C L pore volume fraction of catalyst layer
λ water content of proton exchange membrane
μ ionic conductivity (m2/(V·s))
ξ n (n = 1~4) activation loss related semi-empirical coefficients
ϕ a t m relative humidity
ψ i o n , O 2 oxygen permeation coefficient (mol/s·m·Pa)
ω c a , a t m cathode specific humidity
α 0 charge transfer coefficient
ϒ ORR reaction order related to oxygen partial pressure
Abbreviations
PEMFCproton exchange membrane fuel cell
MEAmembrane electrode assembly

References

  1. Ananthachar, V.; Duffy, J.J. Efficiencies of hydrogen storage systems onboard fuel cell vehicles. Sol. Energy 2005, 78, 687–694. [Google Scholar] [CrossRef]
  2. Chang, X.; Ma, T.; Wu, R. Impact of urban development on residents’ public transportation travel energy consumption in China: An analysis of hydrogen fuel cell vehicles alternatives. Int. J. Hydrogen Energy 2019, 44, 16015–16027. [Google Scholar] [CrossRef]
  3. Gröger, O.; Gasteiger, H.A.; Suchsland, J. Review-Electromobility: Batteries or Fuel Cells? J. Electrochem. SOC 2015, 162, A2605–A2622. [Google Scholar] [CrossRef]
  4. Oh, H.; Lee, Y.I.; Lee, G.; Min, K.; Yi, J.S. Experimental dissection of oxygen transport resistance in the components of a polymer electrolyte membrane fuel cell. J. Power Sources 2017, 345, 67–77. [Google Scholar] [CrossRef]
  5. Iden, H.; Takaichi, S.; Furuya, Y.; Mashio, T.; Ono, Y.; Ohma, A. Relationship between gas transport resistance in the catalyst layer and effective surface area of the catalyst. J. Electroanal. Chem. 2013, 694, 37–44. [Google Scholar] [CrossRef]
  6. Shan, Y.; Choe, S. Modeling and simulation of a PEM fuel cell stack considering temperature effects. J. Power Sources 2006, 158, 274–286. [Google Scholar] [CrossRef]
  7. Larminie, J.; Dicks, A. Fuel Cell Systems Explained, 2nd ed.; John Wiley & Sons Ltd.: Chichester, UK, 2003. [Google Scholar]
  8. Atkins, P.; De Paula James, J. Atkins’ Physical Chemistry, 8th ed.; W. H. Freeman and Company: New York, NY, USA, 2006. [Google Scholar]
  9. Srinivasan, S.; Enayetullah, M.A.; Somasundaram, S.; Swan, D.H.; Manko, D.; Koch, H.; Appleby, A.J. Recent advances in solid polymer electrolyte fuel cell technology with low platinum loading electrodes. In Proceedings of the 24th Intersociety Energy Conversion Engineering Conference IEEE, Washington, DC, USA, 6–11 August 1989; pp. 1623–1629. [Google Scholar]
  10. Kim, J. Modeling of Proton Exchange Membrane Fuel Cell Performance with an Empirical Equation. J. Electrochem. Soc. 1995, 142, 2670. [Google Scholar] [CrossRef]
  11. Amphlett, J.C.; Baumert, R.M.; Mann, R.F.; Peppley, B.A.; Roberge, P.R.; Harris, T.J. Performance modeling of the Ballard Mark IV solid polymer electrolyte fuel cell: I: Mechanistic model development. J. Electrochem. Soc. 1995, 142, 1. [Google Scholar] [CrossRef]
  12. Amphlett, J.C.; Baumert, R.M.; Mann, R.F.; Peppley, B.A.; Roberge, P.R.; Harris, T.J. Performance modeling of the Ballard Mark IV solid polymer electrolyte fuel cell: II. Empirical model development. J. Electrochem. Soc. 1995, 142, 9. [Google Scholar] [CrossRef]
  13. Mann, R.; Amphlett, J.; Hooper, M. Development and application of a generalised steady-state electrochemical model for a PEM fuel cell. J. Power Sources 2000, 86, 173–180. [Google Scholar] [CrossRef]
  14. Squadrito, G.; Maggio, G.; Passalacqua, E.; Lufrano, F.; Patti, A. Empirical equation for polymer electrolyte fuel cell (PEFC) behaviour. J. Appl. Electrochem. 1999, 29, 1449–1455. [Google Scholar] [CrossRef]
  15. Kulikovsky, A.A. Semi-analytical 1D+1D model of a polymer electrolyte fuel cell. Electrochem. Commun. 2004, 6, 969–977. [Google Scholar] [CrossRef]
  16. Yin, J.H.; Cao, J. Modeling of Pem Fuel Cells with Finite-Thickness Catalysts. Mod. Phys. Lett. B Condens. Matter Phys. Stat. Phys. Appl. Phys. 2009, 23, 537–540. [Google Scholar] [CrossRef]
  17. Chakraborty, U. Reversible and Irreversible Potentials and an Inaccuracy in Popular Models in the Fuel Cell Literature. Energies 2018, 11, 1851. [Google Scholar] [CrossRef]
  18. Liu, J.X.; Guo, H.; Ye, F.; Ma, C.F. Two-dimensional analytical model of a proton exchange membrane fuel cell. Energy 2017, 119, 299–308. [Google Scholar] [CrossRef]
  19. Baricci, A.; Casalegno, A. A novel (ex situ) method to quantify oxygen diffusion coefficient of polymer fuel cells backing and catalyst layers. J. Power Sources 2016, 325, 664–669. [Google Scholar] [CrossRef]
  20. O’Neil, K.; Meyers, J.P.; Darling, R.M.; Perry, M.L. Oxygen gain analysis for proton exchange membrane fuel cells. Int. J. Hydrogen Energy 2012, 37, 373–382. [Google Scholar] [CrossRef]
  21. Nonoyama, N.; Okazaki, S.; Weber, A.Z.; Ikogi, Y.; Yoshida, T. Analysis of Oxygen-Transport Diffusion Resistance in Proton-Exchange-Membrane Fuel Cells. J. Electrochem. Soc. 2011, 158, B416. [Google Scholar] [CrossRef]
  22. Wan, Z.; Liu, S.; Zhong, Q.; Jin, A.; Pan, M. Mechanism of improving oxygen transport resistance of polytetrafluoroethylene in catalyst layer for polymer electrolyte fuel cells. Int. J. Hydrogen Energy 2018, 43, 7456–7464. [Google Scholar] [CrossRef]
  23. Epting, W.K.; Litster, S. Effects of an agglomerate size distribution on the PEFC agglomerate model. Int. J. Hydrogen Energy 2012, 37, 8505–8511. [Google Scholar] [CrossRef]
  24. Li, S.; Yuan, J.; Xie, G.; Sundén, B. Effects of agglomerate model parameters on transport characterization and performance of PEM fuel cells. Int. J. Hydrogen Energy 2018, 43, 8451–8463. [Google Scholar] [CrossRef]
  25. Reshetenko, T.V.; St-Pierre, J. Separation Method for Oxygen Mass Transport Coefficient in Gas and Ionomer Phases in PEMFC GDE. J. Electrochem. Soc. 2014, 161, F1089–F1100. [Google Scholar] [CrossRef]
  26. Spingler, F.B.; Phillips, A.; Schuler, T.; Tucker, M.C.; Weber, A.Z. Investigating fuel-cell transport limitations using hydrogen limiting current. Int. J. Hydrogen Energy 2017, 42, 13960–13969. [Google Scholar] [CrossRef]
  27. Vijay Babu, A.R.; Manoj Kumar, P.; Srinivasa Rao, G. Parametric study of the proton exchange membrane fuel cell for investigation of enhanced performance used in fuel cell vehicles. Alex. Eng. J. 2018, 57, 3953–3958. [Google Scholar] [CrossRef]
  28. Correa, J.M.; Farret, F.A.; Popov, V.A.; Simoes, M.G. Sensitivity Analysis of the Modeling Parameters Used in Simulation of Proton Exchange Membrane Fuel Cells. IEEE Trans. Energy Conver 2005, 20, 211–218. [Google Scholar] [CrossRef]
  29. Ozen, D.N.; Timurkutluk, B.; Altinisik, K. Effects of operation temperature and reactant gas humidity levels on performance of PEM fuel cells. Renew. Sustain. Energy Rev. 2016, 59, 1298–1306. [Google Scholar] [CrossRef]
  30. Ettihir, K.; Higuita Cano, M.; Boulon, L.; Agbossou, K. Design of an adaptive EMS for fuel cell vehicles. Int. J. Hydrogen Energ. 2017, 42, 1481–1489. [Google Scholar] [CrossRef]
  31. Kandidayeni, M.; Macias, A.; Amamou, A.A.; Boulon, L.; Kelouwani, S. Comparative Analysis of Two Online Identification Algorithms in a Fuel Cell System. Fuel Cells 2018, 18, 347–358. [Google Scholar] [CrossRef]
  32. Kandidayeni, M.; Macias, A.; Amamou, A.A.; Boulon, L.; Kelouwani, S.; Chaoui, H. Overview and benchmark analysis of fuel cell parameters estimation for energy management purposes. J. Power Sources 2018, 380, 92–104. [Google Scholar] [CrossRef]
  33. Ye, M.; Wang, X.; Xu, Y. Parameter identification for proton exchange membrane fuel cell model using particle swarm optimization. Int. J. Hydrogen Energy 2009, 34, 981–989. [Google Scholar] [CrossRef]
  34. Riascos, L.A.M.; Pereira, D.D. Limit Operating Temperature in Polymer Electrolyte Membrane Fuel Cells. J. Electrochem. Soc. 2009, 156, B1051. [Google Scholar] [CrossRef]
  35. Myles, T.D.; Kim, S.; Maric, R.; Mustain, W.E. Application of a Coated Film Catalyst Layer Model to a High Temperature Polymer Electrolyte Membrane Fuel Cell with Low Catalyst Loading Produced by Reactive Spray Deposition Technology. Catalysts 2015, 5, 1673–1691. [Google Scholar] [CrossRef]
  36. He, P.; Mu, Y.; Park, J.W.; Tao, W. Modeling of the effects of cathode catalyst layer design parameters on performance of polymer electrolyte membrane fuel cell. Appl. Energy 2020, 277, 115555. [Google Scholar] [CrossRef]
  37. Freiberg, A.T.S.; Tucker, M.C.; Weber, A.Z. Polarization loss correction derived from hydrogen localresistance measurement in low Pt-loaded polymer-electrolyte fuel cells. Electrochem. Commun. 2017, 79, 14–17. [Google Scholar] [CrossRef]
  38. Kudo, K.; Jinnouchi, R.; Morimoto, Y. Humidity and Temperature Dependences of Oxygen Transport Resistance of Nafion Thin Film on Platinum Electrode. Electrochim. Acta 2016, 209, 682–690. [Google Scholar] [CrossRef]
  39. Shukla, S.; Stanier, D.; Saha, M.S.; Stumper, J.; Secanell, M. Analysis of Inkjet Printed PEFC Electrodes with Varying Platinum Loading. J. Electrochem. Soc. 2016, 163, F677–F687. [Google Scholar] [CrossRef]
  40. Hao, L.; Moriyama, K.; Gu, W.; Wang, C. Modeling and Experimental Validation of Pt Loading and Electrode Composition Effects in PEM Fuel Cells. J. Electrochem. Soc. 2015, 162, F854–F867. [Google Scholar] [CrossRef]
  41. Hou, Y.; Deng, H.; Pan, F.; Chen, W.; Du, Q.; Jiao, K. Pore-scale investigation of catalyst layer ingredient and structure effect in proton exchange membrane fuel cell. Appl. Energy 2019, 253, 113561. [Google Scholar] [CrossRef]
  42. Gao, Y.; Zhang, X. Geometrical structures of catalyst layer and their impact on oxygen reduction in proton exchange membrane fuel cell. Electrochim. Acta 2016, 218, 101–109. [Google Scholar] [CrossRef]
  43. Inoue, G.; Kawase, M. Effect of porous structure of catalyst layer on effective oxygen diffusion coefficient in polymer electrolyte fuel cell. J. Power Sources 2016, 327, 1–10. [Google Scholar] [CrossRef]
  44. Zhang, X.; Gao, Y. Impact of liquid water on oxygen reaction in cathode catalyst layer of proton exchange membrane fuel cell: A simple and physically sound model. J. Power Sources 2016, 318, 251–263. [Google Scholar] [CrossRef]
  45. Zhang, X.; Gao, Y.; Ostadi, H.; Jiang, K.; Chen, R. Method to improve catalyst layer model for modeling proton exchange membrane fuel cell. J. Power Sources 2015, 289, 114–128. [Google Scholar] [CrossRef]
  46. Zhang, X.; Ostadi, H.; Jiang, K.; Chen, R. Reliability of the spherical agglomerate models for catalyst layer in polymer electrolyte membrane fuel cells. Electrochim. Acta 2014, 133, 475–483. [Google Scholar] [CrossRef]
  47. Yan, S.; Yang, M.; Sun, C.; Xu, S. Liquid Water Characteristics in the Compressed Gradient Porosity Gas Diffusion Layer of Proton Exchange Membrane Fuel Cells Using the Lattice Boltzmann Method. Energies 2023, 16, 6010. [Google Scholar] [CrossRef]
  48. Striednig, M.; Cochet, M.; Boillat, P.; Schmidt, T.J.; Büchi, F.N. A model based investigation of evaporative cooling for polymer electrolyte fuel cells—Stack level analysis. J. Power Sources 2022, 517, 230706. [Google Scholar] [CrossRef]
  49. Zihrul, P.; Hartung, I.; Kirsch, S.; Huebner, G.; Hasché, F.; Gasteiger, H.A. Voltage Cycling Induced Losses in Electrochemically Active Surface Area and in H2/Air-Performance of PEM Fuel Cells. J. Electrochem. Soc. 2016, 163, F492–F498. [Google Scholar] [CrossRef]
  50. Baker, D.R.; Caulk, D.A.; Neyerlin, K.C.; Murphy, M.W. Measurement of Oxygen Transport Resistance in PEM Fuel Cells by Limiting Current Methods. J. Electrochem. Soc. 2009, 156, B991. [Google Scholar] [CrossRef]
  51. Schuler, T.; Chowdhury, A.; Freiberg, A.T.; Sneed, B.; Spingler, F.B.; Tucker, M.C.; More, K.L.; Radke, C.J.; Weber, A.Z. Fuel-Cell Catalyst-Layer Resistance via Hydrogen Limiting-Current Measurements. J. Electrochem. Soc. 2019, 166, F3020–F3031. [Google Scholar] [CrossRef]
  52. Beuscher, U. Experimental Method to Determine the Mass Transport Resistance of a Polymer Electrolyte Fuel Cell. J. Electrochem. Soc. 2006, 153, A1788. [Google Scholar] [CrossRef]
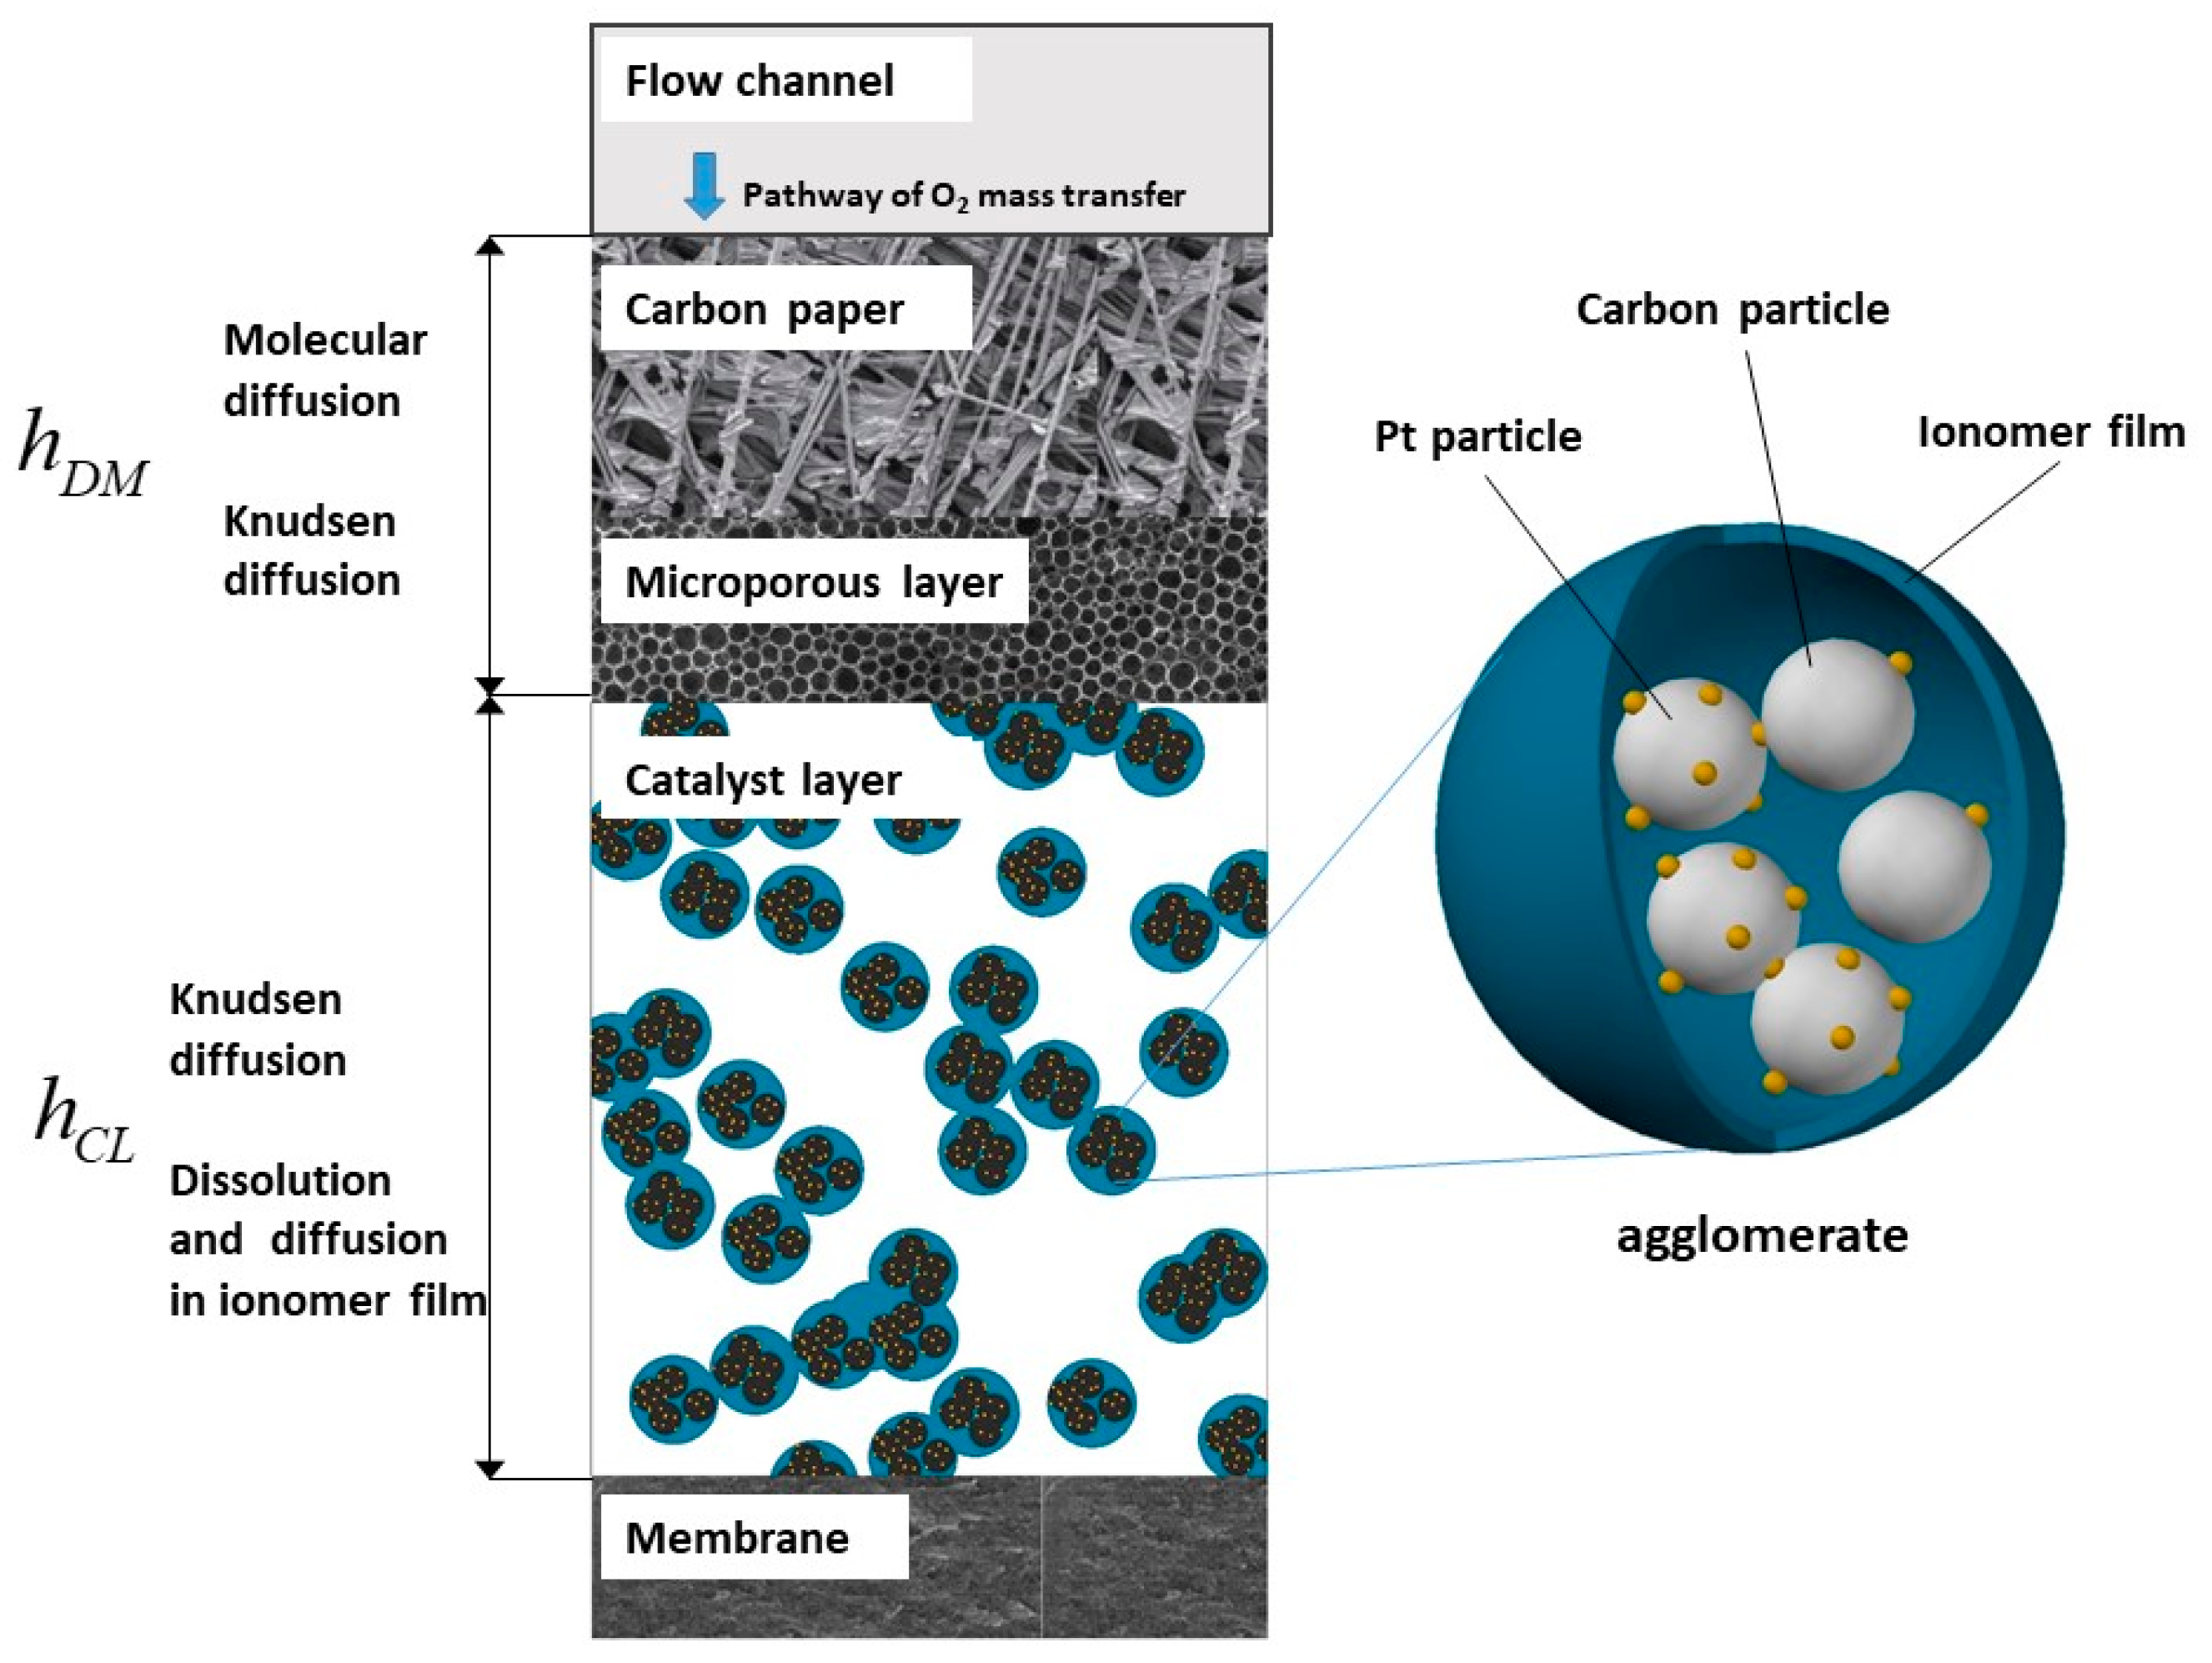
Figure 1. Schematic of oxygen mass transport pathway in the MEA and microstructure of the catalyst layer.
Energies 17 00730 g001
Figure 2. Temperature influence of oxygen transport resistances in N2 balance gas for MEA1.
Energies 17 00730 g002
Figure 3. Temperature influence of oxygen transport resistances in He balance gas for MEA1.
Energies 17 00730 g003
Figure 4. Temperature influence of oxygen transport resistances in N2 balance gas for MEA2.
Energies 17 00730 g004
Figure 5. Concentration overvoltage model validation with polarization curve in the high-current region for MEA1. (a) General diagram of polarization curve. (b) Partial enlargement of polarization curve.
Energies 17 00730 g005aEnergies 17 00730 g005b
Figure 6. Concentration overvoltage model validation with polarization curve in the high-current region for MEA2. (a) General diagram of polarization curve. (b) Partial enlargement of polarization curve.
Energies 17 00730 g006aEnergies 17 00730 g006b
Table 1. Sensitivity of transport resistances toward operating temperature.
Transport ResistanceTemperature Sensitivity
R M D T 1.75
R C L , K n u d T 0.5
R C L , i o n T 1 e 17200 / R T 1
Disclaimer/Publisher’s Note: The statements, opinions and data contained in all publications are solely those of the individual author(s) and contributor(s) and not of MDPI and/or the editor(s). MDPI and/or the editor(s) disclaim responsibility for any injury to people or property resulting from any ideas, methods, instructions or products referred to in the content.