Article

Cross-Borehole ERT Monitoring System for CO2 Geological Storage: Laboratory Development and Validation

1
State Key Laboratory of Enhanced Oil Recovery, Research Institute of Petroleum Exploration and Development, PetroChina, Beijing 100083, China
2
College of Control Science and Engineering, China University of Petroleum (East China), Qingdao 266580, China
*
Authors to whom correspondence should be addressed.
Energies 2024, 17(3), 710; https://doi.org/10.3390/en17030710
Submission received: 29 December 2023 / Revised: 27 January 2024 / Accepted: 30 January 2024 / Published: 1 February 2024
(This article belongs to the Section B3: Carbon Emission and Utilization)

Abstract

:
Cross-borehole electrical resistivity tomography (CHERT) technology has been implemented in field-scale CCS/CCUS (carbon capture and storage/carbon capture, utilization and storage) projects. It is highly desirable to investigate how to optimize the design of the ERT electrode arrays and corresponding working schemes for both laboratory experiments and field applications. A CHERT system was developed for laboratory experiments of CO2 geological storage applications. An optimization method was established for optimizing the structure of electrode arrays and corresponding working schemes. The developed CHERT system was calibrated systematically to determine the measurement range and accuracy of electrical impedance. Laboratory experiments were designed and implemented to validate the performance of the developed CHERT system. It has been illustrated that: (1) It is an essential step to optimize the structure of electrode arrays and corresponding working schemes of CHERT according to the real application background. The optimization method based on finite-element modelling provides an effective means for designing a field-scale CHERT system. (2) The quality of the images inverted from the CHERT data is highly dependent on the working schemes and specific modes, which is closely related to the size of the data sets used for the inversion. The AM-BN scheme is recommended due to the better uniformity of the resultant sensitivity field and application to larger borehole spacing. (3) Based on the calibration, the measurement range of the developed CHERT system can be determined as 100 Ω to 4.5 kΩ with an error limit of 1.5%. The maximum relative errors of the impedance magnitude and phase angle are 5.0% and 7.0%, respectively. Based on the test results the location of the CO2-bearing objects can be identified accurately. The shapes of the tested objects present distortion to some extent, but this can be alleviated by selecting working modes with a larger size of data set.

1. Introduction

Carbon dioxide (CO2) is the most important greenhouse gas, which accounts for around 77% of global greenhouse gas emissions. Currently, only 10% of CO2 emissions have been converted and utilized through various means [1,2]. Carbon capture and storage (CCS) technology is a low-cost greenhouse gas control technology that can effectively reduce CO2 emissions into the atmosphere. CCS technology is considered as one of the key technologies for achieving carbon neutrality. This technology refers to the transportation of CO2 captured from industrial plants or other emission sources to underground areas that are almost isolated from the atmosphere for storage [3]. The leakage risk of CO2 stored in geological formations is one of the key issues with CCS technology draws much attention. The technologies for monitoring the CO2 storage status and migration behavior in geological formations become an indispensable part of CCS technologies [4]. Several techniques for monitoring the injected CO2 into formations have been used in laboratories and trial experiments in the field, such as the tracer method, acid–base analysis method, isotope method, acoustic logging technology, neutron logging technology, annular pressure monitoring, 3D/4D seismic monitoring, and electrical resistance tomography (ERT) technology [5,6,7].
ERT is a simplified form of electrical impedance tomography (EIT), which is widely used in medicine. It inherits the characteristics of EIT, which is simple, flexible, efficient, non-destructive, and of low cost. Currently, it has been applied in multiple engineering fields, such as coalfield exploration engineering, water conservancy and hydropower engineering, environmental geological engineering, and urban survey engineering [8,9,10]. Shima and Sakayama developed a two-dimensional inversion algorithm and implemented the practical application of ERT technology [11]. A smoothly constrained least squares method was developed for inverting the true resistivity of the measured sample by Sasaki, Loke and Barker, among others [12,13]. Chambers et al. obtained images of shallow rock contamination caused by landfills with 2D and 3D ERT techniques, and described the geological characteristics of the studied site [14]. Maillol et al. comprehensively utilized surface and cross-borehole ERT to detect abandoned water-rich mine tunnels of shallow depths [15]. Fikos et al. used ERT systems to achieve real-time dynamic imaging and monitoring of dry hot rocks and geothermal fields [16]. There are limited application cases of ERT in geological CO2 monitoring. Nakatsuka et al. conducted simulation experiments and established a method for evaluating the CO2 saturation in clayey formations based on the resistivity index [17]. Breen et al. verified the effectiveness of ERT technology for monitoring the CO2 leakage in formations based on simulation experiments and reconstructed images [18]. The cross-borehole ERT (CHERT) technology has been implemented in field-scale CCS projects such as CO2-SINK in Germany and Cranfield in the United States [19,20].
Both surface and cross-hole ERT have shown great potentials for monitoring the CO2 plumes in formations. CHERT is more applicable in deep saline water formations than surface ERT due to its limited detection depth. Compared with the seismic techniques, ERT is more appropriate for low saturation of CO2 in formations, i.e., lower than 20% [17]. Moreover, the low cost and permanent implementation of ERT ensures day-based real-time monitoring of dynamic migration of the injected CO2 for years [21]. This cannot be feasible using seismic survey techniques. Compared with the ground penetrating radar (GPR) technique, which only responses to the change of gaseous CO2, ERT is able to sense the electrical conductivity changes induced by both gaseous and dissolved CO2 in pore water. Thus, both gaseous and dissolved CO2 plumes can be monitored by ERT. Considering the merits of ERT and limited trial cases, it is of great significance to further validate its strengths and drawbacks for monitoring CO2 in various geological formations [22]. There are still some issues of interest to be addressed. The configuration of ERT electrode arrays and the working scheme of electrodes are highly related to the sampled data amount and quality, which has direct impacts on data acquisition time and image reconstruction quality [23]. Thus, it is highly desirable to investigate how to optimize the design of ERT electrode arrays and corresponding working schemes.
In the work presented in this paper, a CHERT experimental system was designed and developed for CO2 geological storage applications. First, a finite element numerical model was constructed to optimize the structural parameters and working scheme of the electrode array, and an optimization design method was established. Then, the hardware and software parts of the designed CHERT system were developed, and the system was calibrated to determine the performance. Finally, laboratory experiments were conducted to test the developed CHERT-based system.

2. Overall Design and Optimization of Electrode Array of CHERT

2.1. Overall Design of CHERT System

The CHERT experimental system consists of three parts: sample vessel and electrode arrays, signal excitation and data acquisition, software of instrument control and data inversion. Figure 1 shows the structural framework diagram of the CHERT system. The electrode array is fixed at the predetermined positions of the sample vessel. The structural configuration of the electrodes needs to be optimized before implementation. In the part of the signal excitation and data acquisition, an electric current of predetermined specifications is provided to designated current electrodes and voltage signals are acquired from designated potential electrodes. It is essential to arrange the combinations of current and potential electrodes in the working scheme of electrode arrays. Parameters related to the specifications of current excitation, voltage acquisition, and the working scheme of electrode arrays need to be configured through the software of instrument control. The data inversion software is used to process the acquired data first and then implement the inversion algorithm for obtaining the images of conductivity/resistivity distributions.

2.2. Numerical Modelling for Electrode Optimization

The numerical models were implemented based on finite-element analysis platform (COMSOL Multiphysics, Version 5.6). The physical models, i.e., governing equations, solved to obtain the parameters of electrical field are Maxwell’s equations. According to Maxwell’s equation and the quasi-static field assumption, the relationship between current density (J), conductivity (σ) and electric field intensity (E) in any point of the sensitive field generated by current electrode of ERT system is formulated as Equations (1) and (2) [24].
· J = 0
J = σ E
Assuming the potential distribution in the sensitive field is denoted as ϕ , which can be related to the electric field intensity (E).
E = ϕ
Then the mathematical model of the electric sensitive field for ERT can be expressed as Equations (4) and (5).
· σ · ϕ = 0
σ · ϕ + σ 2 ϕ = 0
Based on the assumption of a homogeneous, linear and isotropic medium, Equation (5) can be simplified into Equation (6) based on the Laplace equation.
2 ϕ = 0
The ERT system using ‘current excitation and voltage detection’ operating mode satisfies Neumann boundary conditions as expressed in Equation (7) [25].
σ ϕ · n s = σ ϕ n s = J
where n is the unit normal vector of boundary S.
The potential distribution in the simulated zone can be obtained by solving the above governing equations. Then, the sensitivity distribution can be computed from the solutions to the numerical model based on the reciprocity theorem. The sensitivity function can be expressed as Equation (8) [26].
S i , j x , y , z = E i x , y , z I i E j x , y , z I j d Ω
where S i , j x , y , z represents the sensitivity at a point in the field when selecting the ith and jth electrode pairs; E i x , y , z and E j x , y , z represent the electric field intensity at a point in the field when using the the ith and jth electrodes to apply the excitation current, respectively; I i and I j represent the amplitude of the excitation current applied to the sample using the ith and jth electrodes, respectively.
The distribution of the sensitivity field in ERT systems is non-uniform, i.e., the sensitivity is higher near the current electrodes than when further away. The sensitivity field can be quantitatively represented by a sensitivity coefficient matrix. A larger value of the element in the matrix indicates a higher sensitivity of the electrical field. A smaller variation of the values of the matrix elements means a better uniformity of the sensitivity field. The uniformity of the sensitive field can be expressed by the ratio of the standard deviation of the sensitivity coefficient matrix to the mean (Equation (9)) [27]. The uniformity index of a sensitivity field is represented as P. A smaller p value indicates better uniformity.
P = 1 N i , j N S i , j d e v S i , j a v g
where N is the number of independent measurements; S i , j d e v and S i , j a v g are the standard deviation and mean of the sensitivity coefficient matrix for the i-j electrode pair, which can be calculated using Equations (10) and (11).
S i , j a v g = 1 n e = 1 n S i , j ( e )
S i , j d e v = 1 n 1 e = 1 n S i , j e S i , j a v g 2 1 / 2
where n is the number of cells of the sensitivity field; and S i , j e is the sensitivity coefficient at the cell labeled as e.
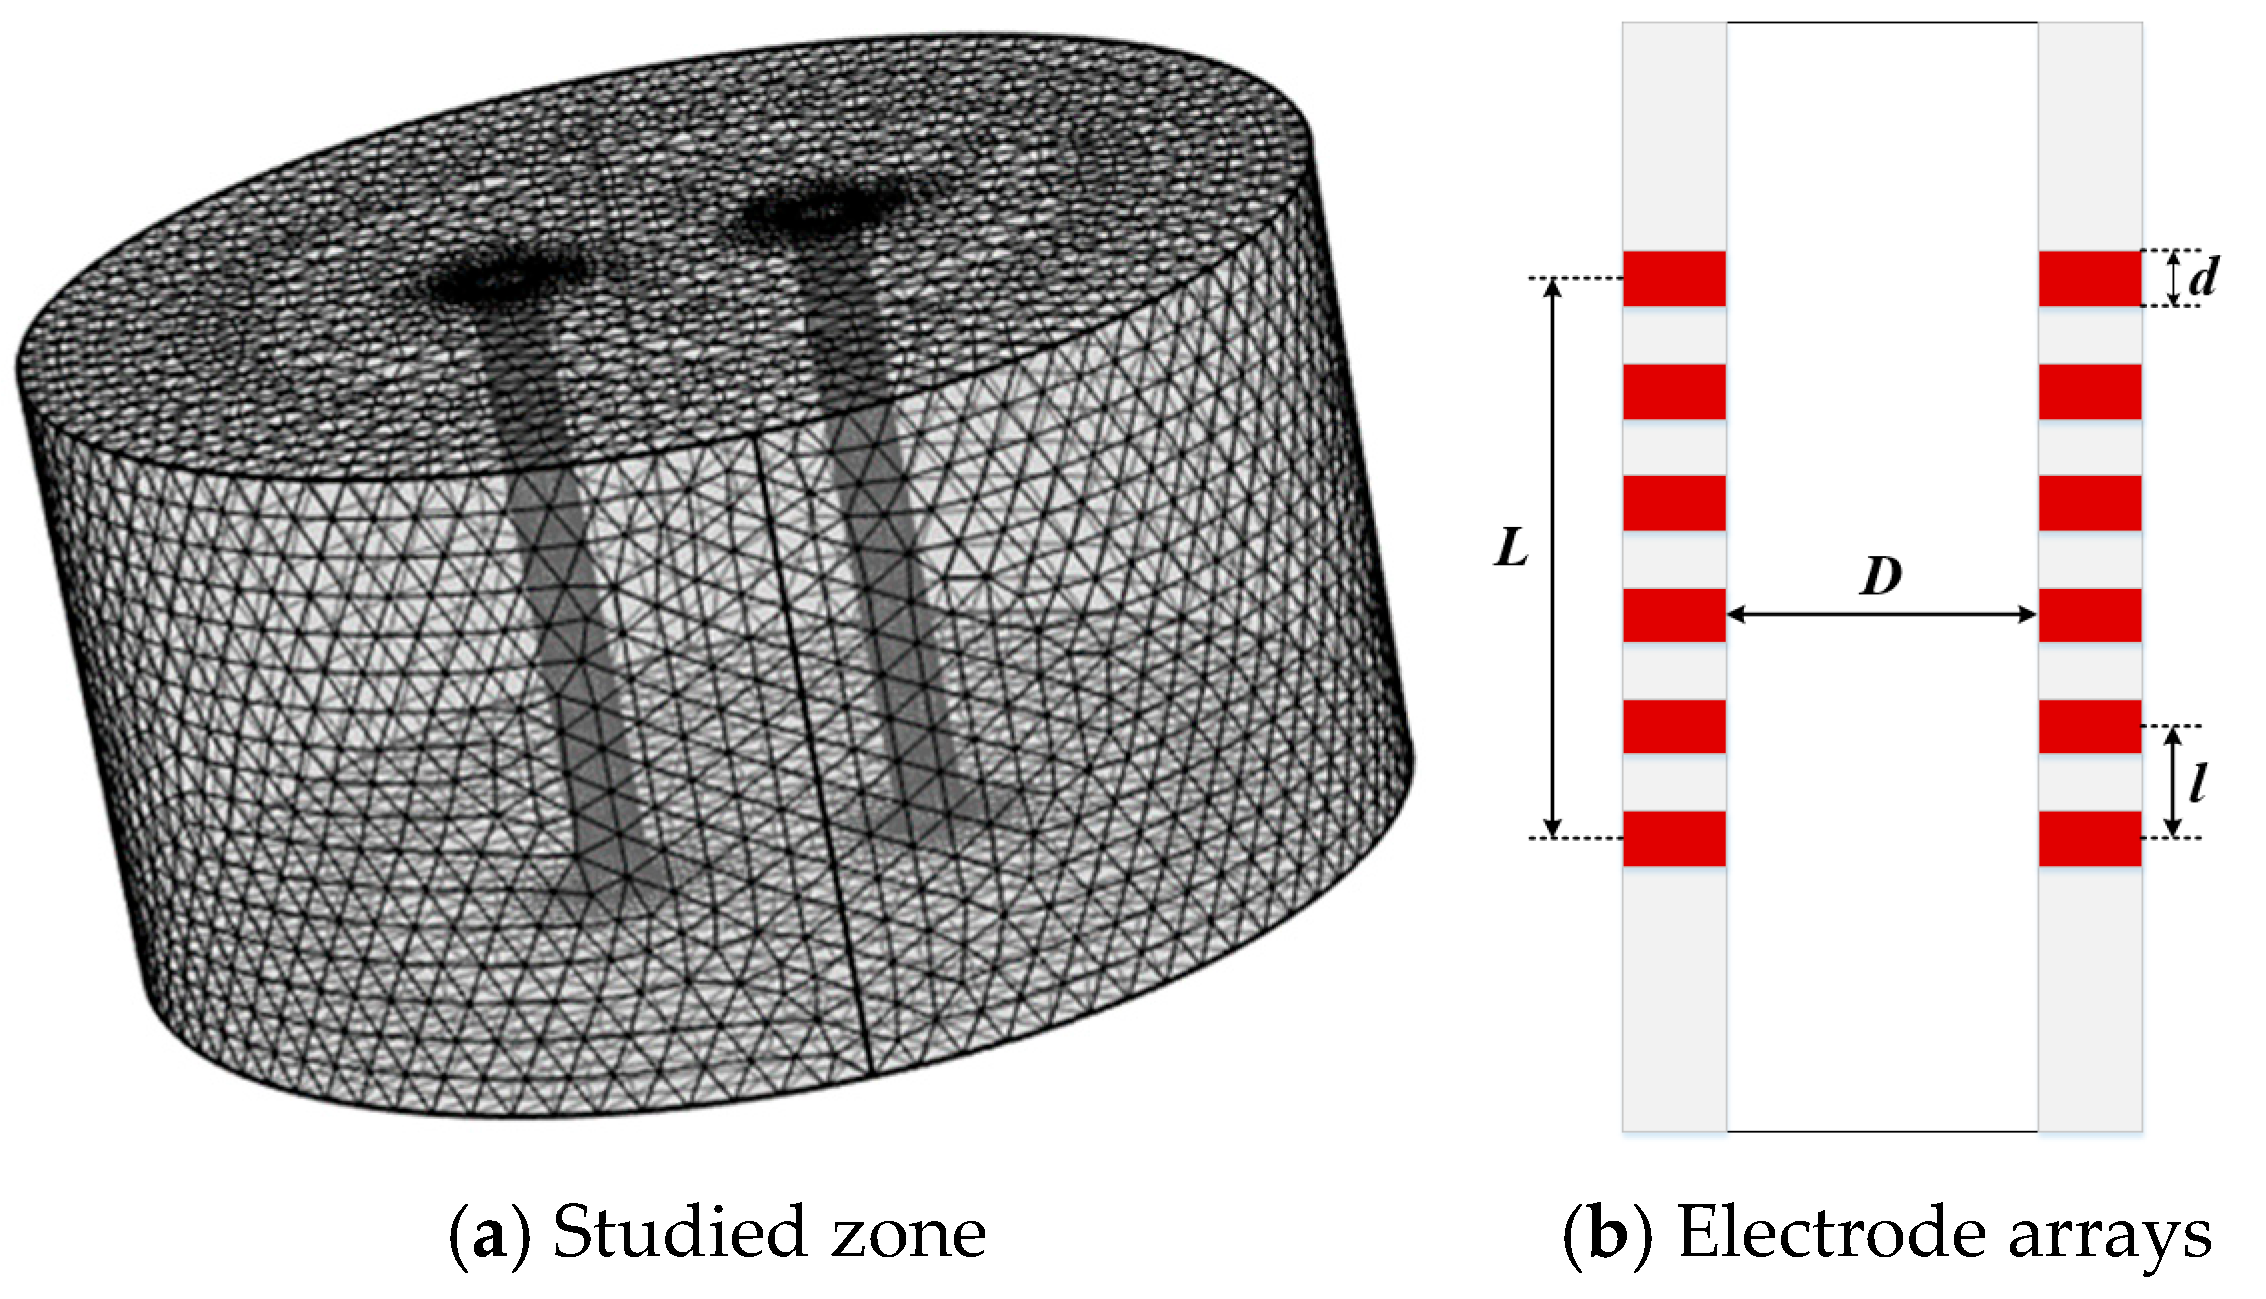
To investigate the effects of the structural parameters and working scheme of electrode arrays a numerical model was established based on the finite element principle. The schematic of a model structure including the studied zone and electrode arrays is shown in Figure 2.
As shown in Figure 2a the larger cylinder represents the simulated geological formation zone. The surface serves as the outer boundary of the model and is set to be insulated. The two smaller cylinders inside the zone represent the simulated borehole casings with electrode arrays. The contact surface between the simulated casings and the simulated formation are described as the inner boundaries. The electrode material is defined as copper, and the material used to simulate the formation is defined as a homogeneous material with designated electrical conductivity. The studied zone is meshed with the grid elements near the inner boundary relatively smaller and those near the outer boundary lager. As shown in Figure 2b the distance (denoted as L) between the electrodes at the upper and lower ends is considered as the effective monitoring range in the vertical direction. The distance between the two boreholes is denoted as D. Under the conditions of fixed L and D a series of numerical simulations can be conducted by changing the axial distance between two adjacent electrodes (denoted as l) and the axial width of each electrode (denoted as d).

2.3. Optimization of Electrode Arrays

In the numerical model presented in Section 2.2, the distance between the electrodes at the upper and lower ends was set as 120 mm and the distance between the two boreholes was set to be 40 mm. A direct current with the amplitude of 2 mA was used as the excitation to the current electrodes. The optimal electrode parameters were determined based on the analysis of the uniformity of field sensitivity with different electrode spacing and axial width.
Taking the electrode with an axial width (d) of 1 mm as an example, different numbers of electrode pairs were used to achieve a range of the ratios (l/L) of the electrode spacing to the length of electrode array from 0.20 to 0.08. The variations of the uniformity index (P) of the sensitivity field with l/L is shown in Figure 3. It can be seen in Figure 3 that the p-value first increases and then decreases as the number of electrode pairs increases. This means that the uniformity of the sensitivity field decreases first and then increases accordingly. Based on the above results, six electrodes for one electrode array was selected for the use below due to the higher uniformity of the resultant sensitivity field and smaller number of electrodes.
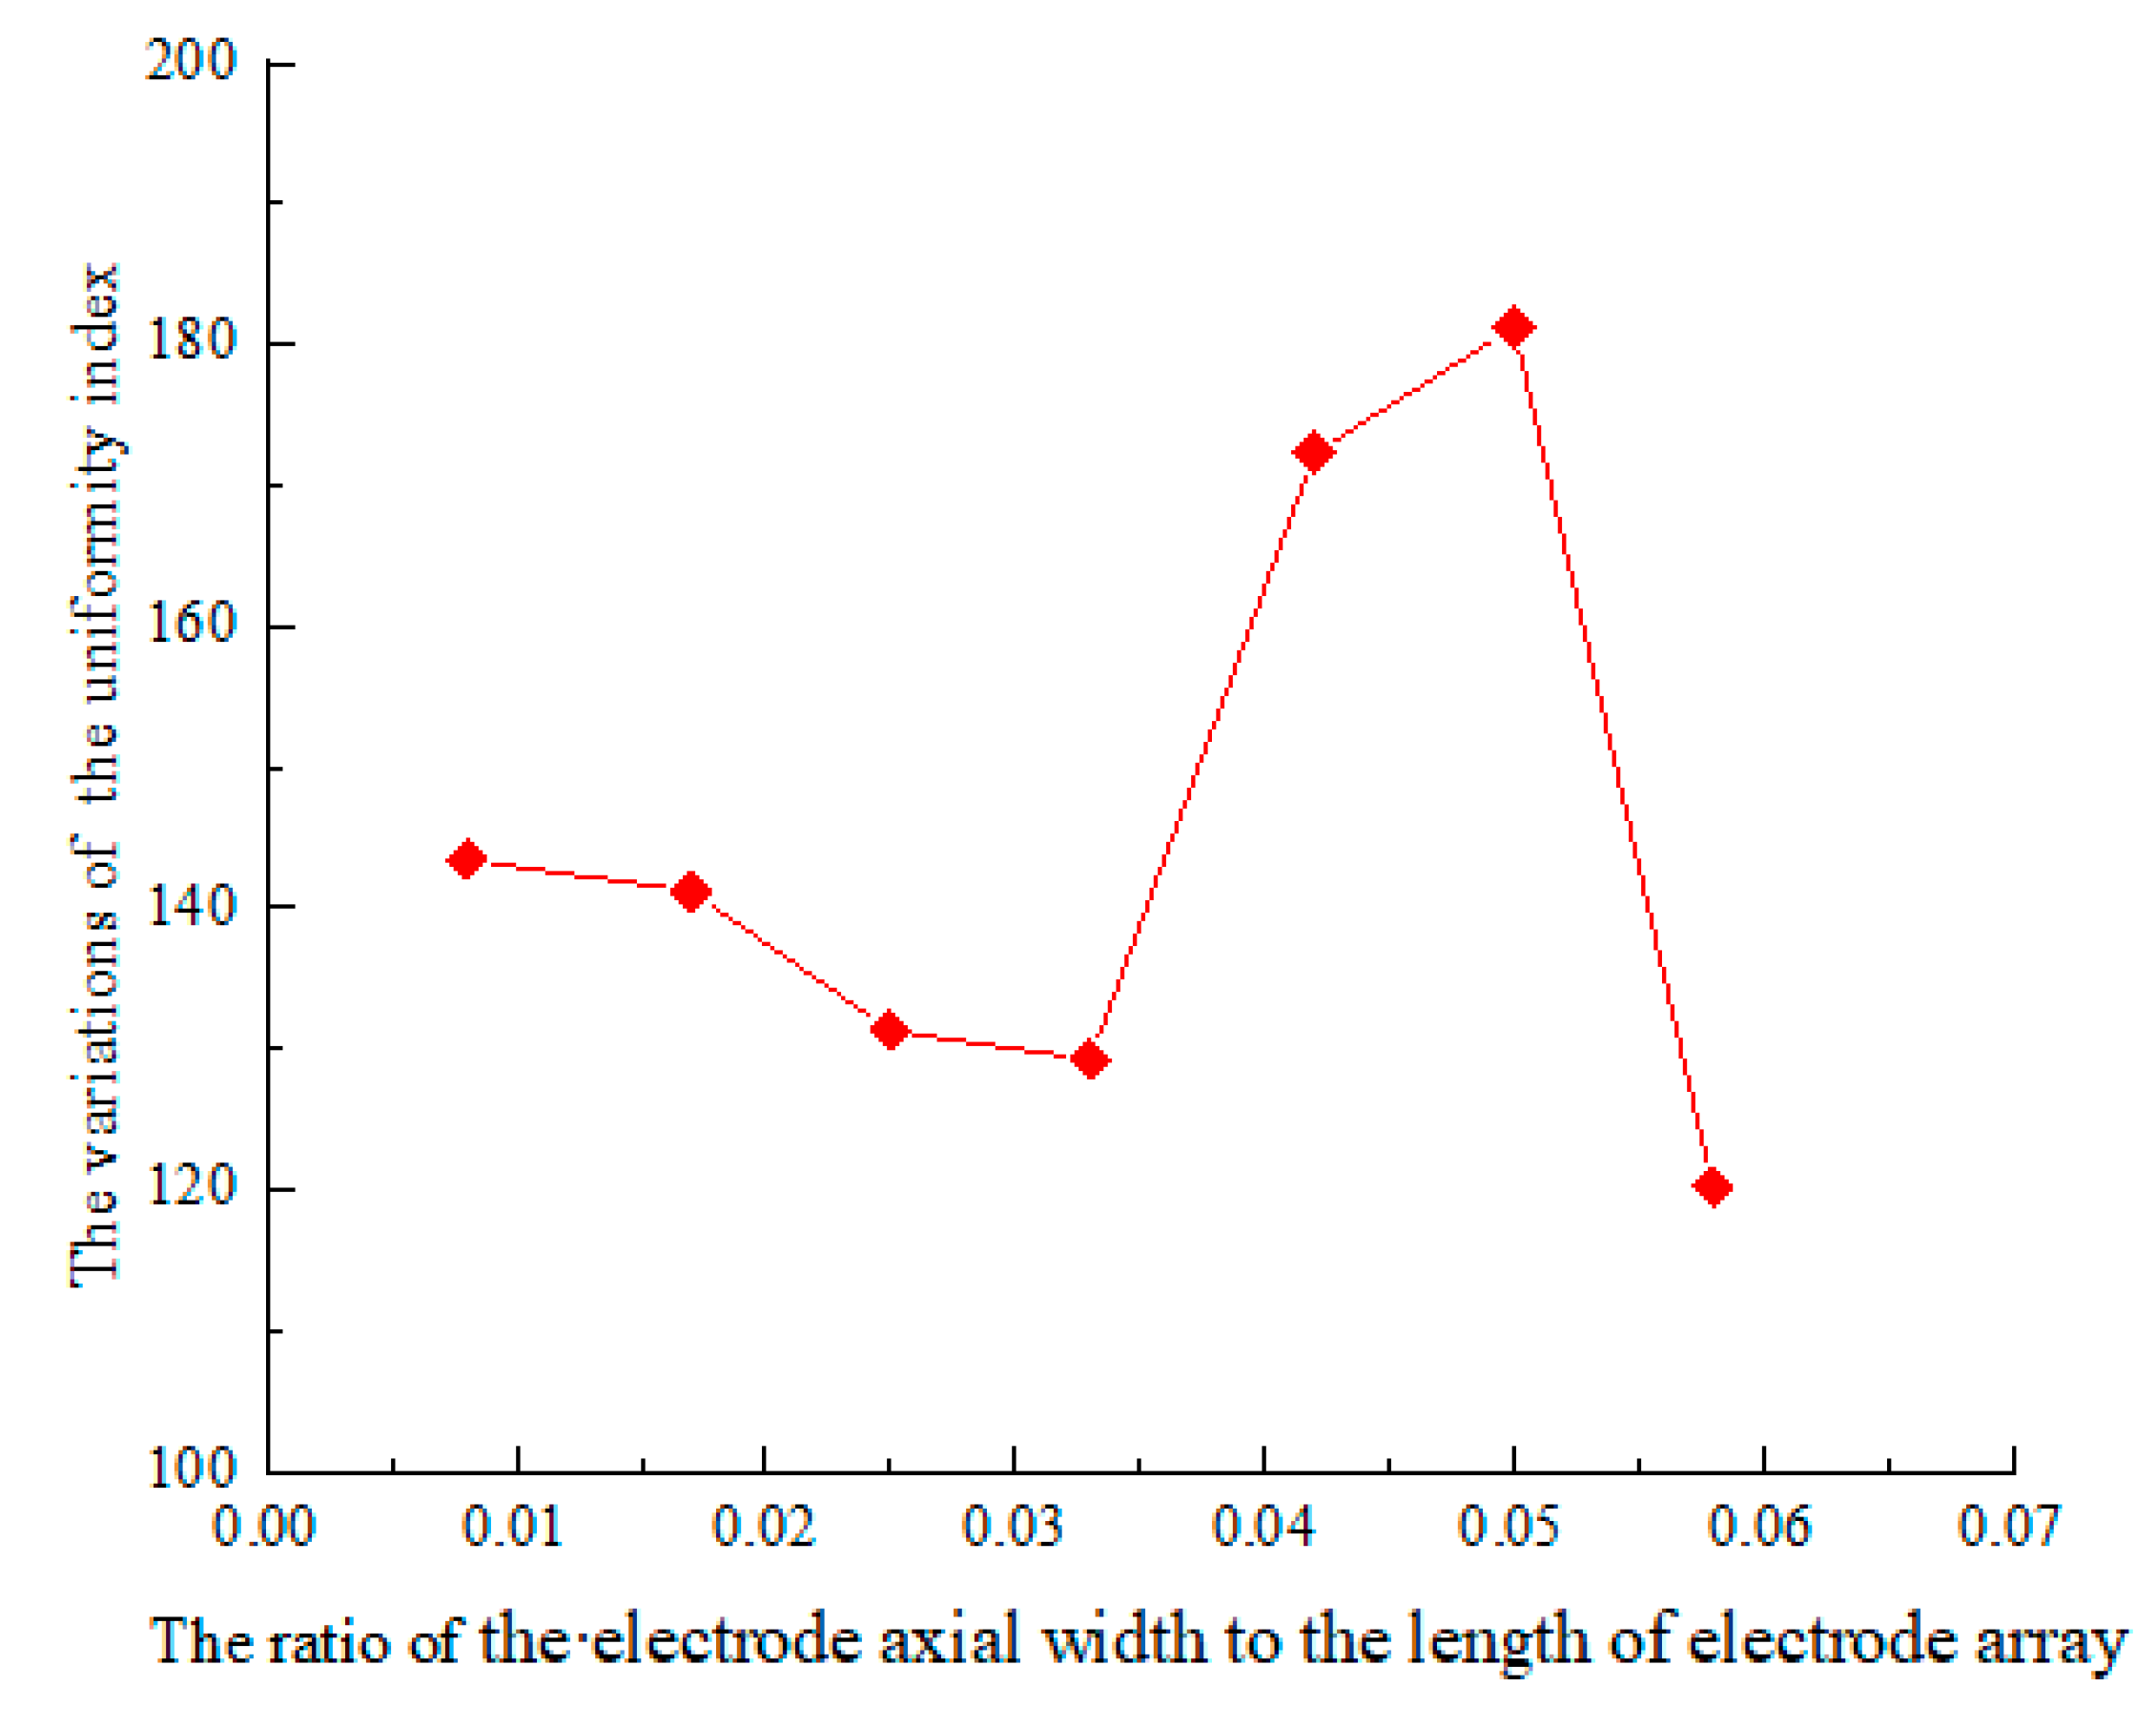
After the determination of the number of electrodes for one array, the effects of the axial widths of electrodes were examined through the numerical model. The electrode width ranged from 1 to 7 mm and the ratio (d/L) of the width to the length of electrode array ranged from 0.008 to 0.058. The variations of the uniformity index (P) of the sensitivity field with d/L is shown in Figure 4. It can be seen in Figure 4 that the p-value varies with d/L in a complex pattern, i.e., decreases first, then increases and decreases finally. This means that the uniformity of the sensitivity field increases first, then decreases and increases finally. Based on the above results, a d/L ratio ranging from 0.025 to 0.035 or greater than 0.055 is preferred as the resultant sensitivity field is more uniform.

2.4. Optimization of Working Scheme of Electrodes

There are three commonly used working schemes of electrode arrays for implementing CHERT measurements, i.e., AM-BN, AB-MN, and AMN-B, where electrodes A and B are current electrodes and electrodes M and N are potential electrodes. Based on the above finite-element model, numerical simulations were conducted on the three working schemes. The sensitivity fields under various scheme conditions were obtained and shown in Figure 5.
In the AM-BN working scheme the A and M electrodes are located in one borehole and the B and N are located in the other one. The distance between A and M remains the same with that between B and N. In the AB-MN scheme the current electrodes (A and B) are located in the same borehole while the potential electrodes (M and N) are located in the other borehole. The distance between A and B remains the same with that between M and N. In the AMN-B scheme the current electrode A and both the potential electrodes (M and N) are located in the same borehole while the other current electrode (B) is located in the other borehole. The current electrodes are located on the same horizontal level [28,29,30].
The uniformity of the three schemes presented in Figure 5 can be evaluated based on the p values. The AM-BN scheme has the best uniformity (p = 156.7), while the AMN-B scheme is the worst (p = 201.2). It can be observed in Figure 5a that there is a region with a large sensitivity gradient that changes from positive to negative values. This region is mainly distributed near the electrode arrays but limited in a small spatial range. The area of the region with a large sensitivity gradient for the AB-MN scheme is much larger than that for the AM-BN working scheme. There are two regions with a large sensitivity gradient at the top and bottom of the monitoring zone respectively. For the AMN-B scheme, the spatial distribution of the region with a large sensitivity gradient is highly affected by the locations of the electrodes. It has been accepted that when there is a region in the resistivity field with a large gradient that changes from positive to negative, artifacts will appear in the resultant images [28]. Furthermore, the sensitivity in the central area between the two boreholes is smaller than that near the electrode arrays. A better uniformity of the sensitivity field means that the sensitivity value in the central area is closer to that near the electrode arrays and a better image for the central area may be obtained [29,31]. To sum up, based on the above analysis and comparison, the AM-BN working scheme with a better uniformity and smaller region of large sensitivity gradient that changes from positive to negative values was selected for use in this work. It is also reported that the AM-BN scheme has a higher signal-to-noise ratio and suitable for situations with large borehole spacing.

3. Development and Calibration of CHERT System

3.1. Development of Hardware Part

The hardware part of the CHERT system consists of two units, i.e., sample vessel and electrode array, and signal excitation and data acquisition. The sample vessel provides a space for the tested sample and a frame for the installation of electrodes. The electrodes are divided into two groups, i.e., current and potential electrodes. The two groups of electrodes are connected to the unit of signal excitation and data acquisition.
As shown Figure 6 the sample vessel is made of two clamps, two transparent plates, one U-shaped clapboard, and one top cover. A flat cubic space with the dimensions of 300 mm × 150 mm × 10 mm was obtained in the sample vessel. The two arrays of electrodes were installed on the U-shaped clapboard. Holes were drilled on the U-shaped clapboard and top cover, and hoses were connected for the injection of CO2 and water in the experiments. There are eight electrodes in each of the two arrays. The structural parameters are designed based on the optimization results as presented in Section 2.3. The electrodes are made of copper and has an axial width of 7 mm. The ratios of the electrode width and spacing to the length of electrode array are 0.015 and 0.143, respectively.
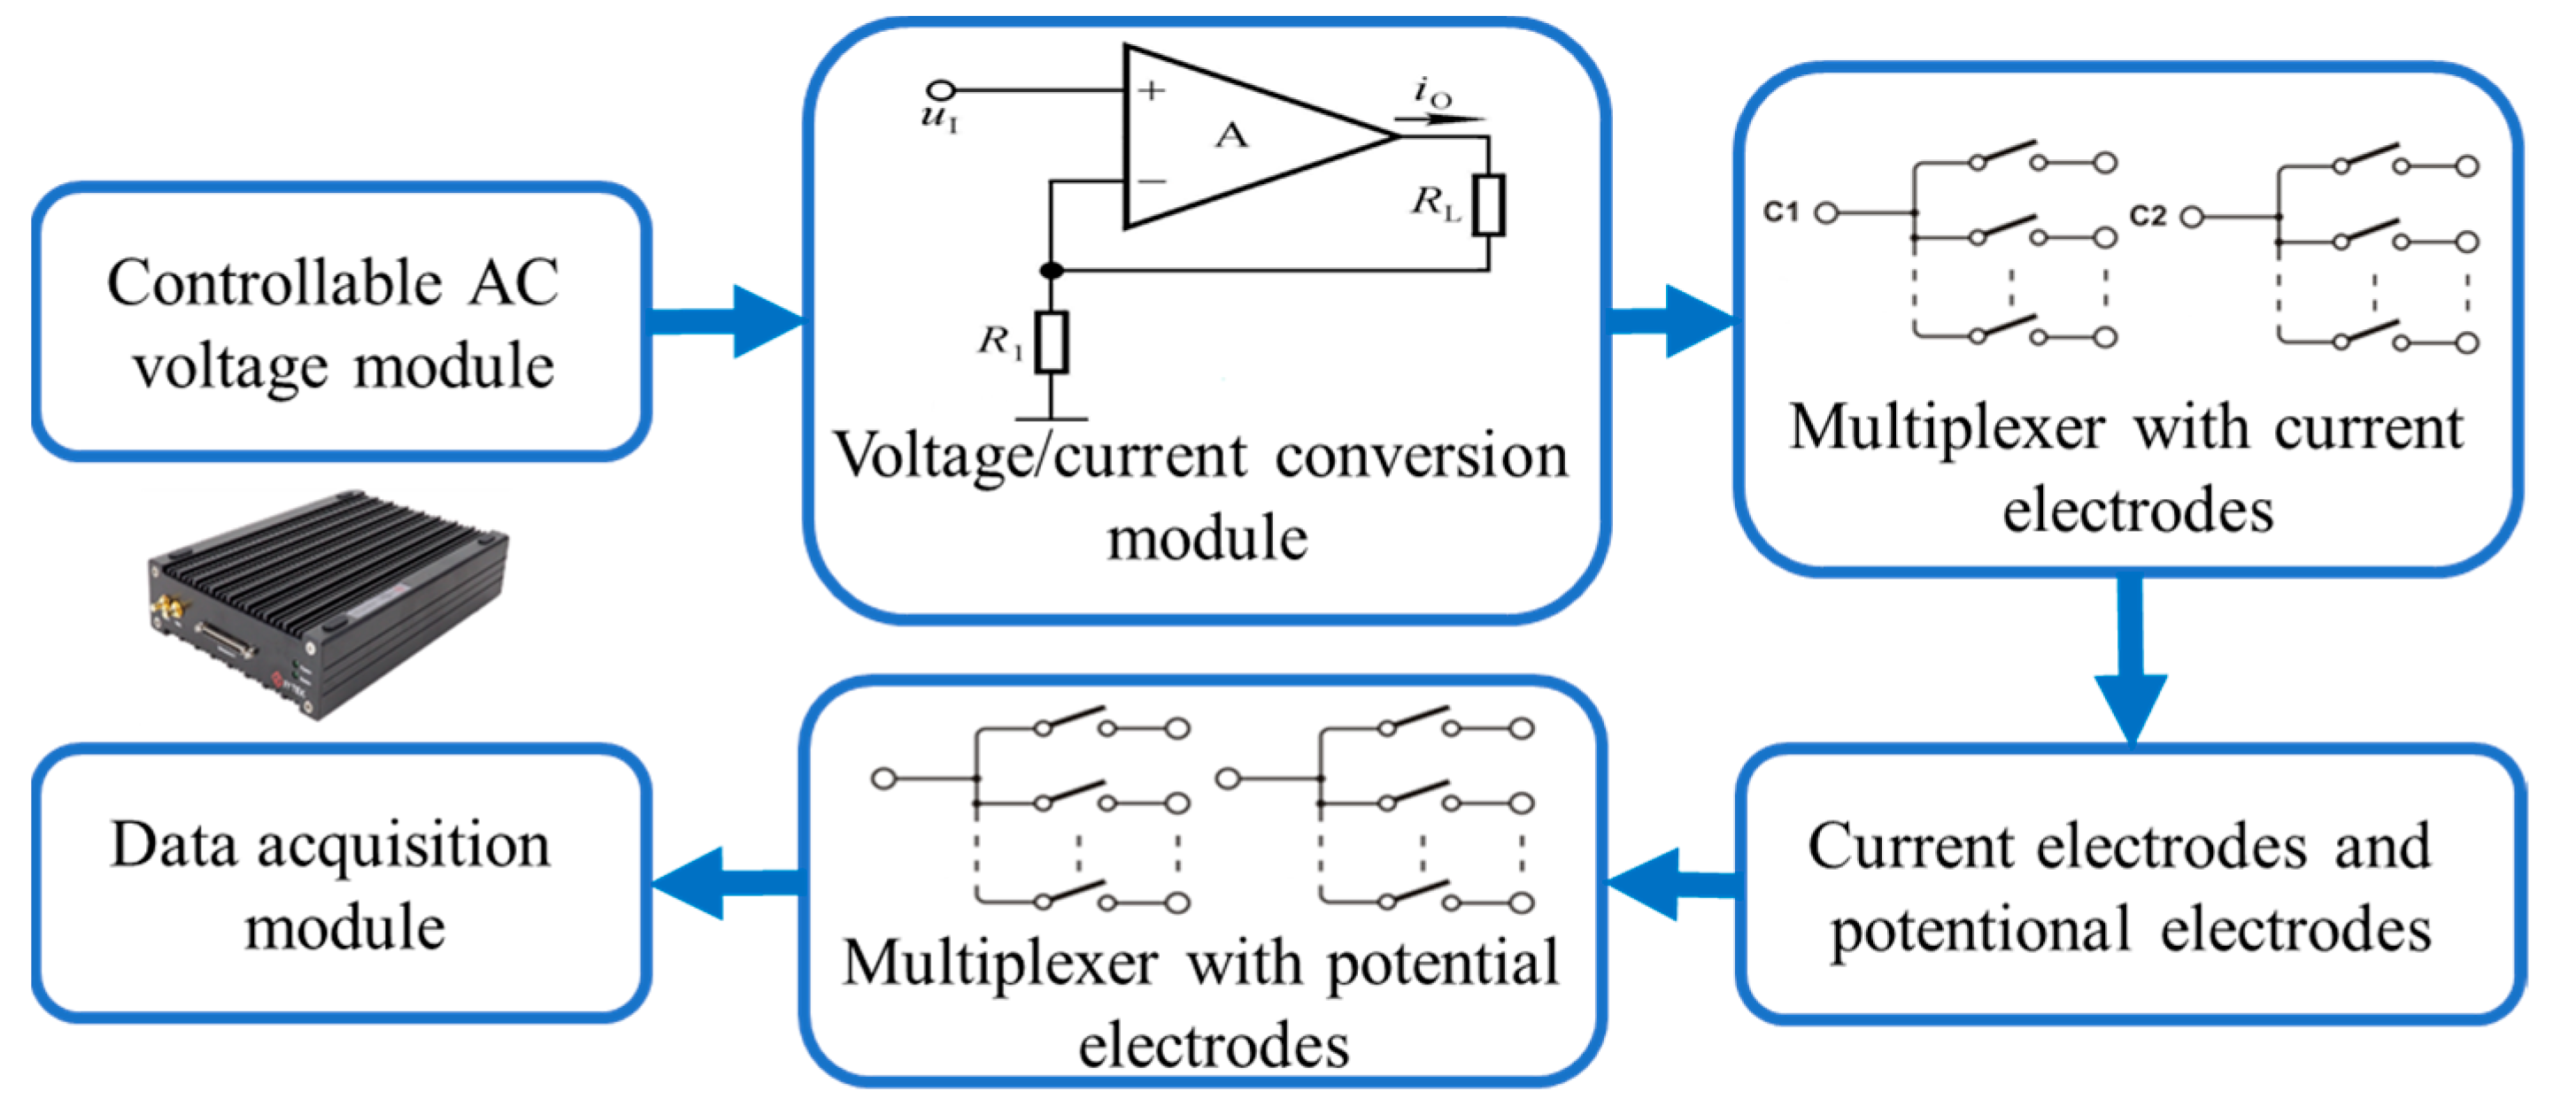
The signal excitation and data acquisition unit includes a controllable AC voltage module (model USB-5515 by Jianyi Technology, Shanghai, China), a voltage/current conversion module (model SC-VCO-8 by Jianyi Technology), and a data acquisition module (model USB-5515 by Jianyi Technology). A voltage signal is generated in the AC voltage module and then sent to the voltage/current conversion module. The output current of the voltage/current conversion module has a magnitude ranging from 0 to 10 mA and a frequency from 20 Hz to 100 kHz. The current is sent to the group of current electrodes through a multiplexer. An electric field is generated by the excited current electrodes, and potential differences (i.e., voltages) can be measured from the group of potential electrodes. The voltage to be sampled is sent to the data acquisition module through the other multiplexer. The voltage measured by the data acquisition module is limited to range from −5 to 5 V and the maximum data acquisition frequency is 1 MHz.

3.2. Development of Software Part

The software part of the CHERT system has modular functions of instrument control, data processing and data inversion for imaging. The functions of instrument control and data processing was implemented with self-developed software modules based on LabVIEW (Version 2019), while the data inversion function was accomplished through a commercial code (i.e., Res2D/3D, Version 5.0.2).
The instrument control module is developed to configure the operating parameters of signal excitation, electrode selection, and data acquisition. The module works in conjunction with the controllable AC voltage module, multiplexers and data acquisition module as presented in Figure 7. For the signal excitation module, the frequency, magnitude, phase angle and wave mode (e.g., sine wave, square wave, pulse wave, etc.) of the excitation signal can be configured. The sampling parameters such as rate and point number can be set for the data acquisition module. Several working modes of CHERT can be designed and implemented by manipulating the multiplexers under the framework of the AM-BN working scheme. Three working modes, i.e., I, II and III, were designed as shown in Figure 8. In Mode I as shown in Figure 8a, the current electrodes (A and B) are located at the same horizontal level. An excitation current is transmitted to A and B and a sensitivity field is generated. The potential electrodes (M and N) are also located at the same horizontal level. For the first run, the first group of A and B are selected, and the other groups of M and N are selected sequentially from the top to the bottom. Then, the second pair of A and B are selected for the second run. The other groups of M and N are selected sequentially. The above selection process is repeated until all the groups of current electrodes have been utilized. In Mode II as shown in Figure 8b,c, the potential electrodes (M and N) are located at the same horizontal level, but the current electrodes are not. First the location of electrode A is lower than that of B, and then the location of electrode B is lower than that of A. Following the same procedure with that of Model II, the selection process is repeated until all the groups of current electrodes have been utilized. Essentially, Mode III is a combination of Mode I and II.
The data processing module is used to preprocess the measured voltage first and then convert it into the apparent resistivity or conductivity to prepare for further data inversion. Digital filtering algorithms are used for the preprocessing of the raw voltage data. A moving average algorithm is used to filter out the high-frequency noises and a band-pass filter is implemented to remove the noises beyond the predesignated frequency band of real signals. The apparent electrical impedance (Z) is obtained from the measured voltage and preset current based on a cross-correlation approach. Then, the electrical impedance is converted into apparent resistivity by ρ = K × Z, where K is the instrument coefficient as shown in Equation (12).
K = 2 π 1 AM 1 AN 1 BM + 1 BN
where AM, AN, BM and BN is the distance between each pair of electrodes with the labeled name, respectively.

3.3. System Calibration

The CHERT experimental system was calibrated to examine the performance specifications. The photos of the CHERT system developed in this work are shown in Figure 9. An instrument cabinet is designed to gather various modules such as signal excitation module, multiplexers, data acquisition module and so on. Electromagnetic noises can be mitigated to some extent by the cabinet to improve the quality of the excitation signal and sample data. The CO2 injection equipment is used to inject the required amount of CO2 into the sample vessel to prepare samples for test. Photos of the prepared samples are taken for a comparison with the images inverted from CHERT data.
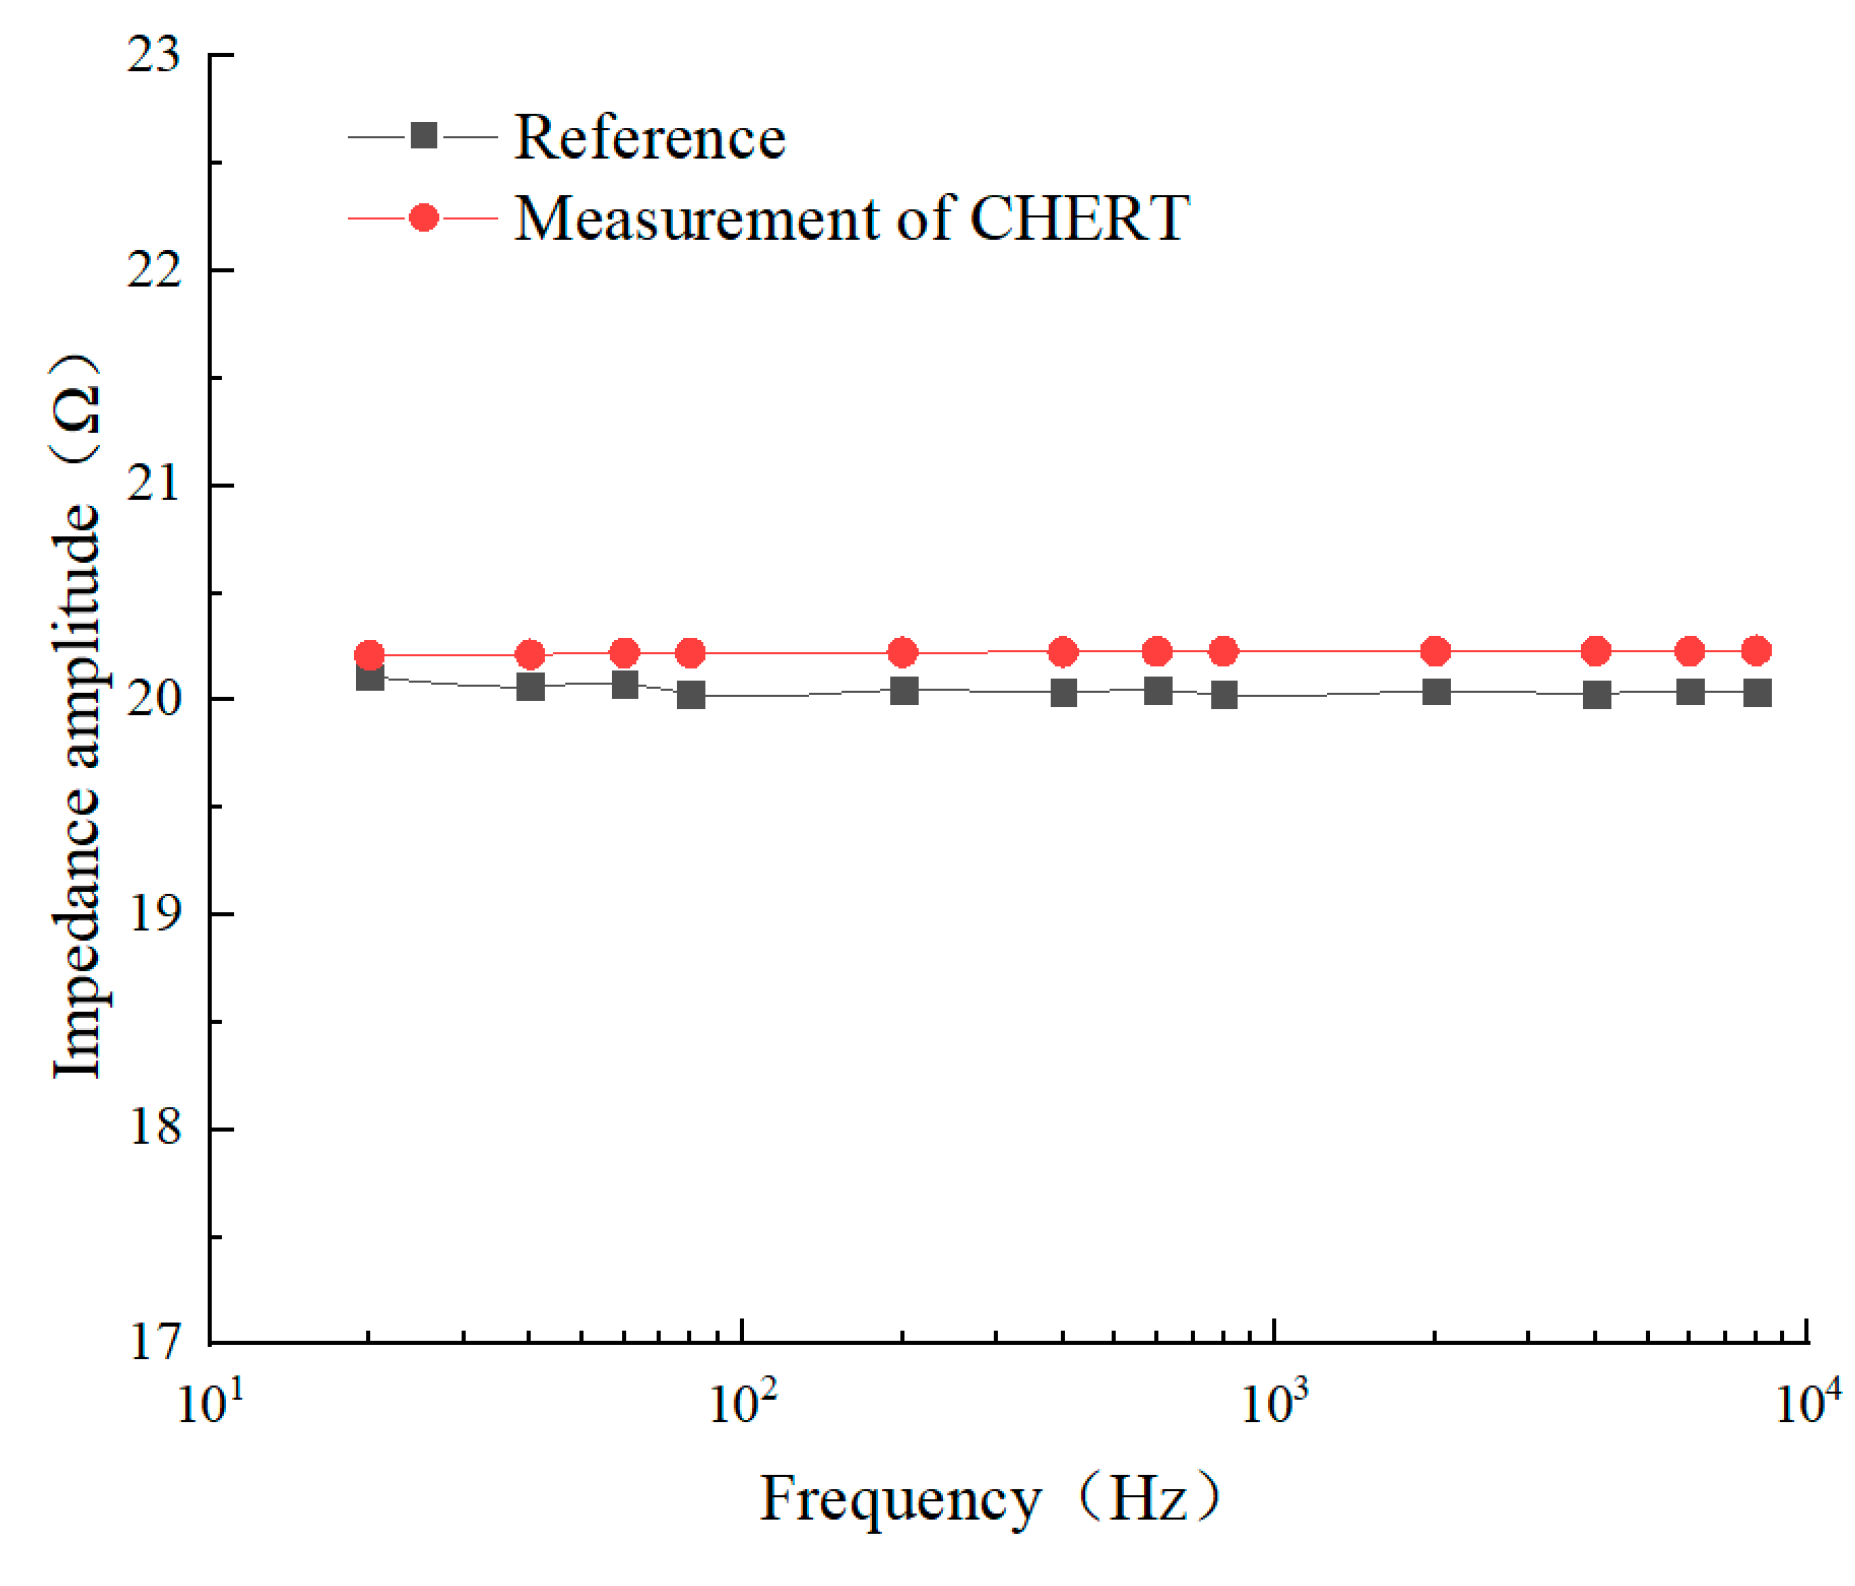
To determine the measurement range of the CHERT system, six resistors with resistance values of 20 Ω, 100 Ω, 680 Ω, 3.0 kΩ, 4.5 kΩ, and 5.6 kΩ were tested with the measurements from an Agilent 4284 A precision digital bridge instrument as the reference. The measurements on the resistor of 20 Ω are shown in Figure 10. It can be seen that the measurements from the CHERT system and digital bridge instrument are generally consistent with each other. The maximum relative errors for the six resistors are 1.8, 1.0, 0.6, 0.8, 1.1, and 1.9%, respectively. Based on the test results, the measurement range of the CHERT system can be determined as 100 Ω to 4.5 kΩ with the error limit of 1.5%.
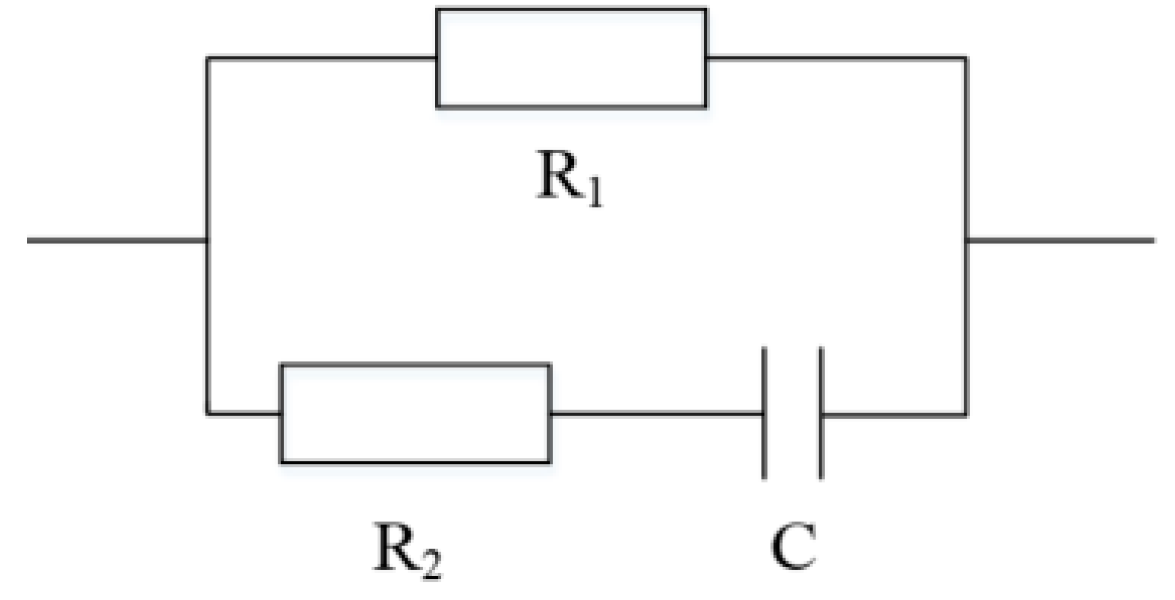
The measurement accuracy was further calibrated by testing a group of R-C electrical circuits. The schematic of the tested circuit is shown in Figure 11. The resistors R1 and R2 range from 100 Ω to 3.0 kΩ and from 20 Ω to 680 Ω, respectively, while the capacitor ranges from 0.1 to 1.0 μF. The measurements of the impedance magnitude and phase angle from the CHERT system and digital bridge instrument on one of the R-C electrical circuits are shown in Figure 12. The maximum relative errors of the impedance magnitude and phase angle are 5.0% and 7.0%, respectively.

4. Experimental Validation and Discussion

To validate the performance of the CHERT system developed in this work, a series of validation experiments were designed and implemented. The experiments include two groups, i.e., tests on ideal insulating objects in brine and tests on CO2-bearing objects in sand. During the experiments, actual photos of the tested objects were taken by camera for comparison with the images inverted from the CHERT measurements by Res2D/3D (Version 5.0.2). Moreover, a commercial system, IRIS SYSCAL PRO, was also used for data sampling in each test of the experiments, and the Res2D/3D was also used for data inversion. With the actual photos and images obtained through the commercial system as the references, the quality of the CHERT measurements and resultant images were analyzed and evaluated. In the above way the CHERT experimental system developed in this work was validated for future utilization.

4.1. Tests on Insulating Objects in Brine

(1)
Sample preparation and tests
The first step is to prepare the NaCl solution. To simulate the deep saline aquifers for storing CO2, a certain amount of NaCl solution with 4.0% by mass was prepared. The required NaCl and deionized water was weighed using a high-precision electronic scale and mixed in a beaker. A glass rod was used to stir the solution to ensure a thorough mixing of the added NaCl and deionized water.
The second step is to allocate the object into the sample vessel for test. To enhance the contrast of resistivity between the background and tested object, a shaped eraser was used to simulate a high-resistivity object. The object has a circular-disk shape with a diameter of 35 mm. It was then clamped in the middle of the two arrays of electrodes by the two transparent plates.
The third step is to inject the prepared brine into the sample vessel as the background for test. A long-necked glass funnel (280 mm) was used to conduct the NaCl solution into the sample vessel. First, the outlet of the funnel was extended into the bottom of the sample vessel. Second, the brine was poured into the vessel slowly—to avoid bubbles being trapped—until the tested object was fully surrounded by the solution.
After completion of the sample preparation process, the CHERT system began to collect the test data under different working modes of electrode arrays, as illustrated in Figure 8 in Section 3.2. Then, the IRIS SYSCAL PRO was used to repeat the tests at the same environmental conditions.
(2)
Data inversion and image analysis
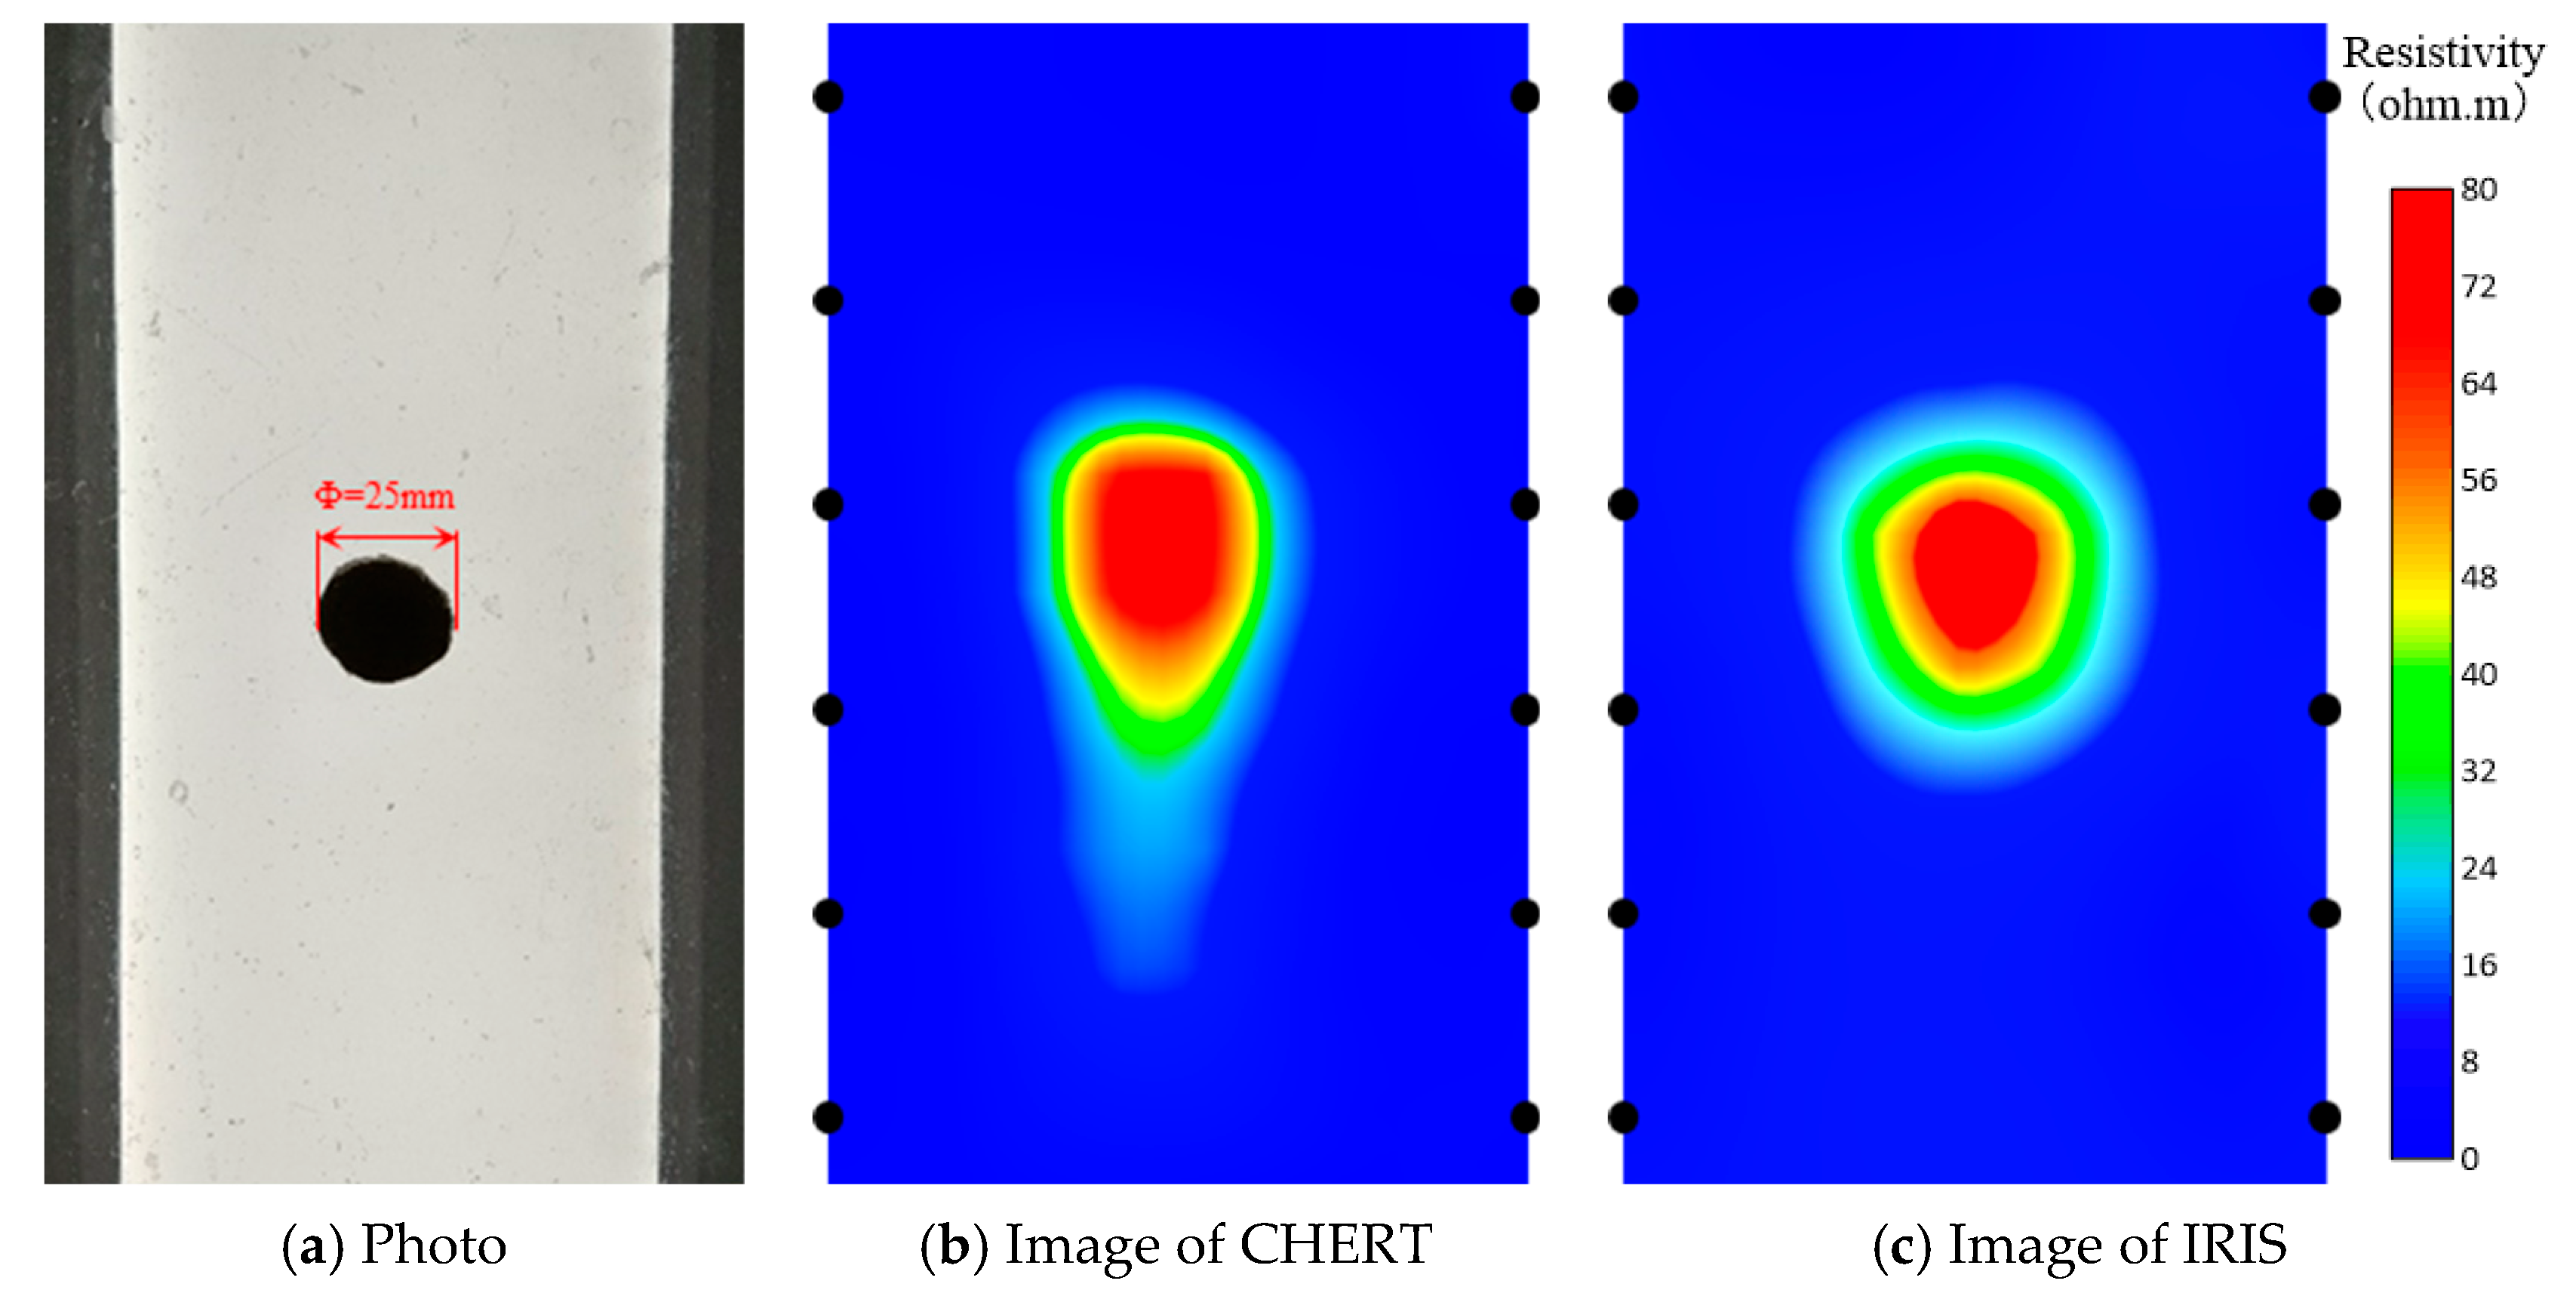
The photos taken by camera and images obtained from different modes are illustrated in Figure 13, Figure 14 and Figure 15 respectively. It needs to be noted that only the zone covered by the six pairs of electrodes in the middle of the arrays are presented because the zones located on the edges always include artifacts due to uncompleted data sets.
Based on a comparison between the photo and resultant images, it can be seen that the images from both the CHERT (developed in this work) and IRIS systems can illustrate the location of the tested object accurately. In particular, the center of the tested object for the photo and images are the same, which shows the correctness of the inversion process and the performance of the CHERT system in this work. The areas of the tested object presented in both the resultant images are generally larger than the actual area and the shapes in the resultant images are not the same with the truth. This is reasonable if considering the limited pairs of electrodes (i.e., eight pairs) and number of measurements (i.e., 56, 84 and 140 for Model I, II and III, respectively) in the data sets used for data inversion. Based on a comparison between the images obtained from different working modes of electrode arrays, it can be seen that the images from Mode III are better than those from Mode I and II. This is reasonable because the date set of Mode III is essentially a combination of those of Mode I and II. More data have been applied in the data inversion process for Mode III.

4.2. Tests on CO2-Bearing Objects in Sand

(1)
Sample preparation and tests
A series of tests on CO2-bearing objects in sand were performed. Generally, two types of samples were prepared, i.e., samples with one and two objects for tests. Fine sand saturated with NaCl solution was set as the background in the samples, while medium and coarse sand with CO2 was considered to be the object for tests.
As the first step, sand with different diameter ranges was prepared, i.e., 0.18–0.25 mm (fine sand), 0.30–0.35 mm (medium sand), and 0.35–0.45 mm (coarse sand). The sand was washed using deionized water for removing impurities and salts. The NaCl solution used in the experiments in Section 4.1 was used in the experiments of this section. The purity of CO2 used in these experiments was 99.9%.
As the second step a long-necked glass funnel (280 mm) was used to conduct the fine sand into the sample vessel. First, sand with a diameter ranging from 0.18 to 0.25 mm was introduced into the vessel. Vibrations were triggered after each addition of 15 mm in depth in the vessel to ensure a homogeneous distribution of the injected sand. According to the design of the first type of samples there was only one object for tests. Thus, second, sand with the diameter range of 0.30–0.35 mm (medium sand) was injected into the central zone located at the third pair of electrodes between the two electrode arrays. An arched area with the height of 40 mm consisting of the medium sand is formed to store CO2. According to the design of the second type of samples there were two objects (CO2-bearing coarse sand) for tests. The two tested objects also took the form of an arched area, but were located at the seventh and third pairs of electrodes, respectively. Third, the remaining space of the sample vessel was filled with sand with a diameter range of 0.18 to 0.25 mm (fine sand).
The third step is to inject the fluids, i.e., pore water and CO2, into the sand that has been introduced into the sample vessel. First the CO2 was injected into the medium and coarse sand in the sample vessel through the bottom hole with the aid of the injection equipment. Due to the density difference between CO2 and air, the air in the vessel was substituted gradually at a low injection flowrate. The CO2 injection process lasted for about one hour. After that the NaCl solution was injected into the sand in the sample vessel through the top hole. A low injection flowrate, e.g., 0.2 mL/s, was used to ensure that the solution preferentially permeated into the fine sand. As a result, the fine sand was filled with the NaCl solution, while the medium and coarse sands were saturated with CO2.
After the completion of the sample preparation process, the CHERT system began to collect the test data under different working modes of electrode arrays as illustrated in Figure 8 in Section 3.2. Then, the IRIS SYSCAL PRO was used to repeat the tests at the same environmental conditions.
(2)
Data inversion and image analysis
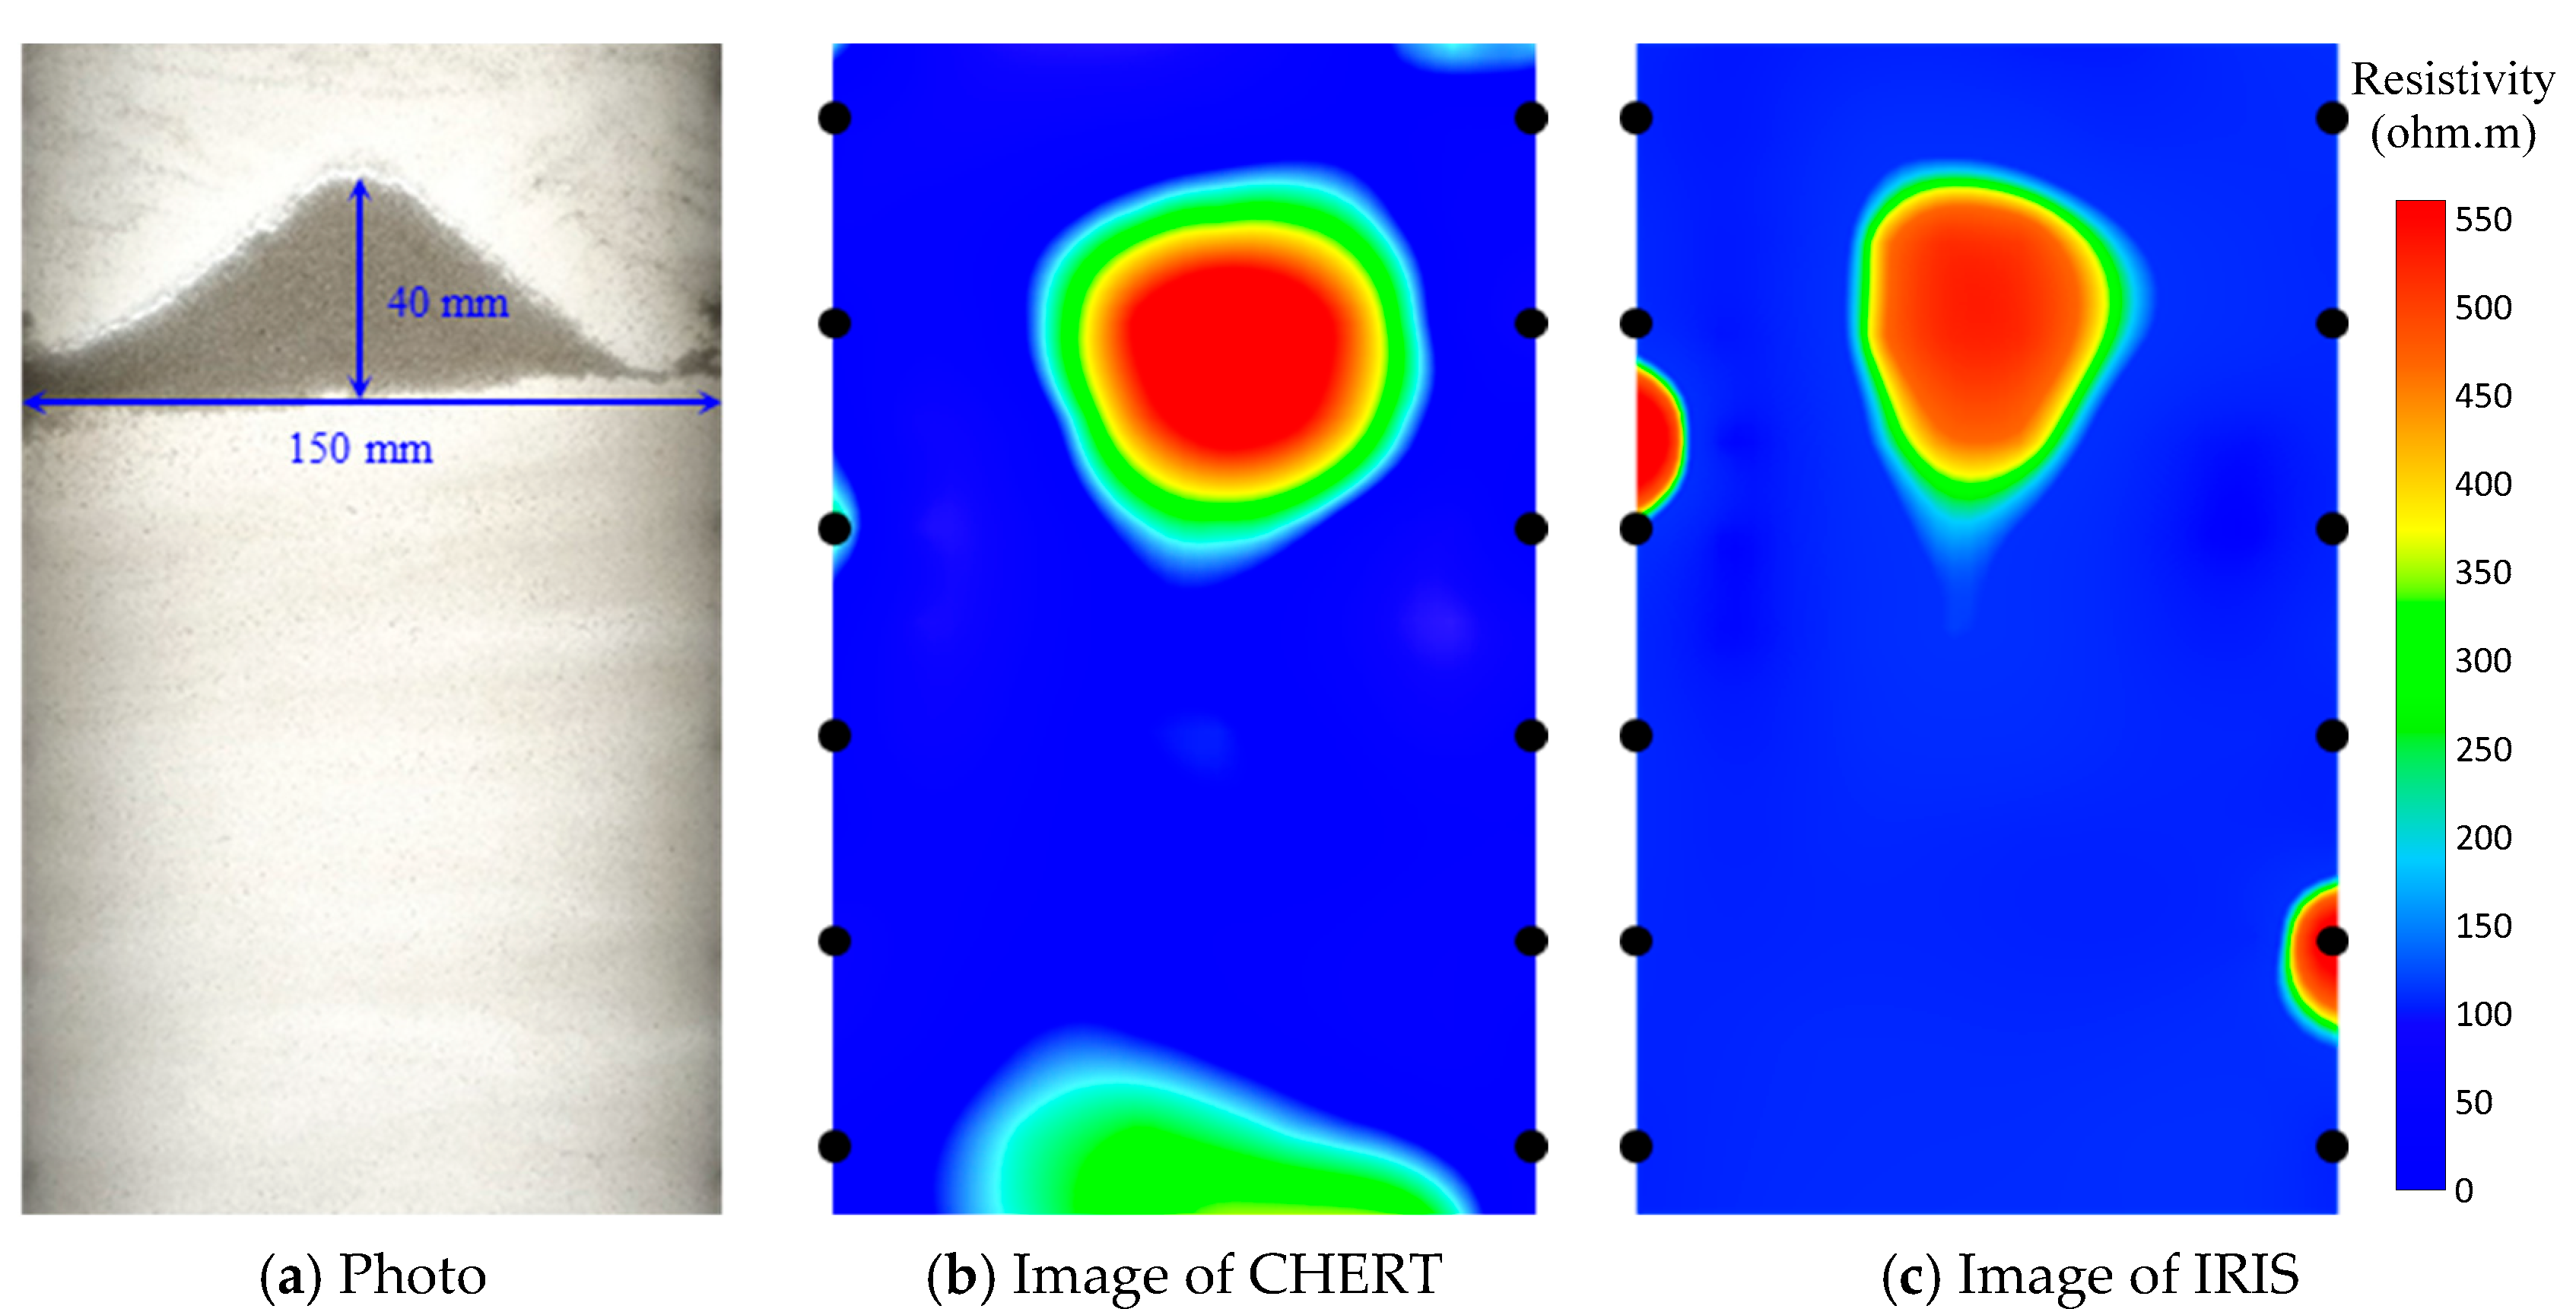
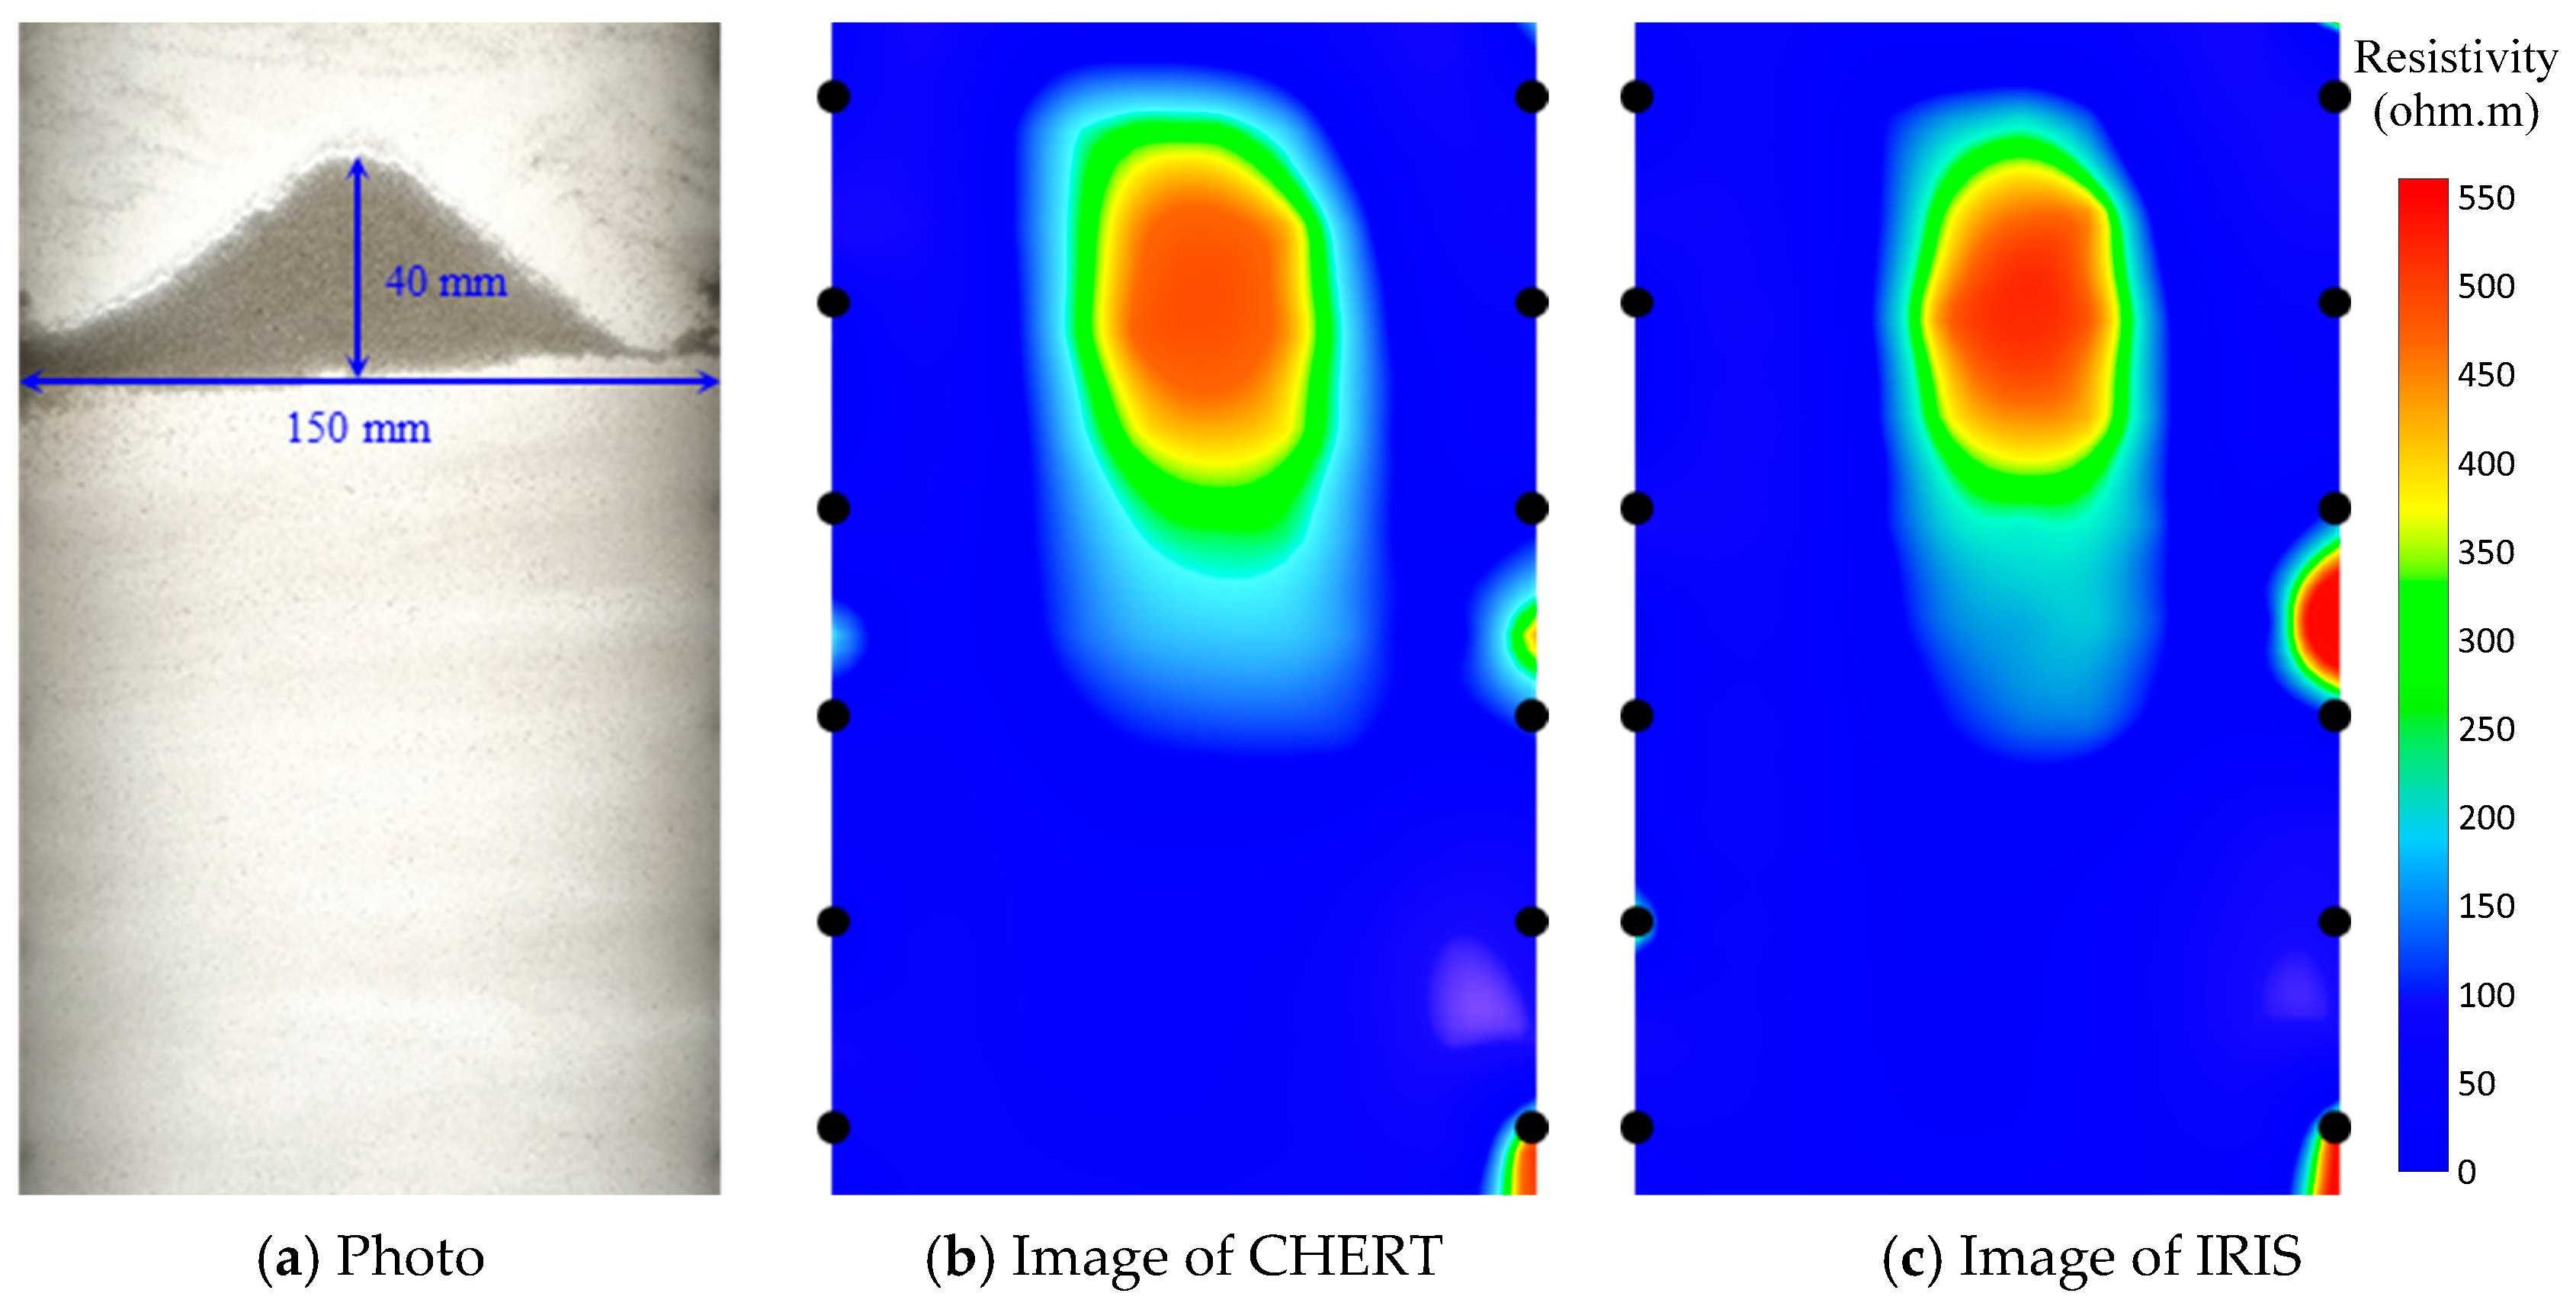
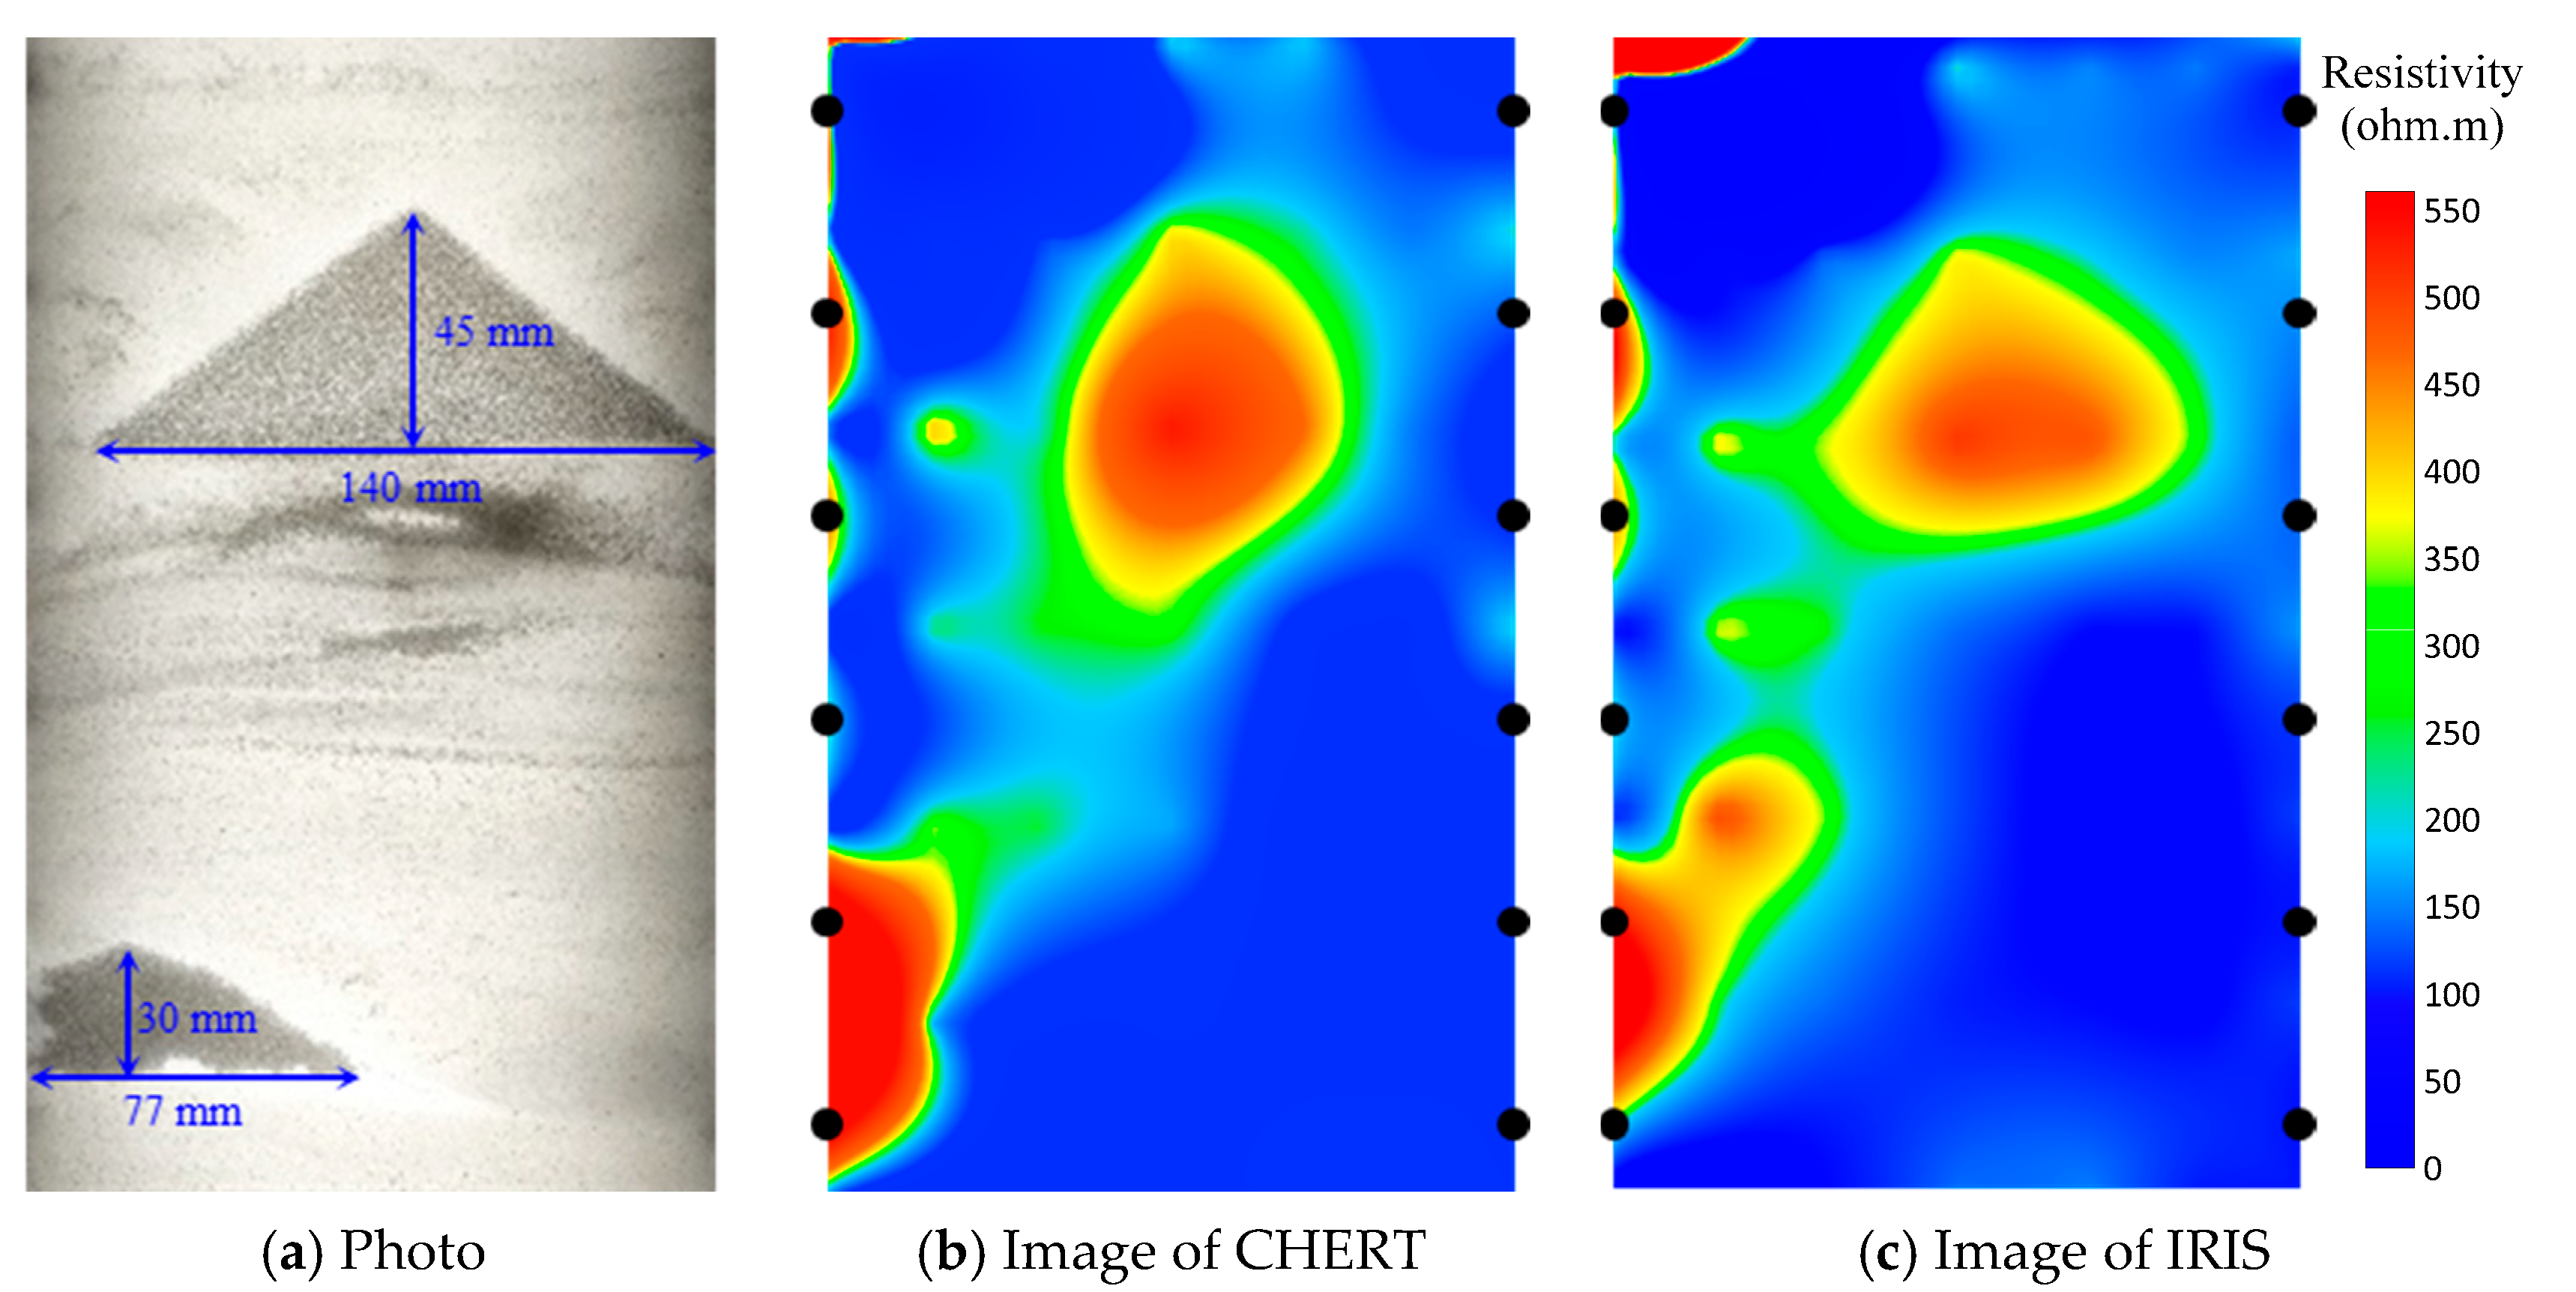
The photos taken by camera and images obtained from different modes for the first type of samples are illustrated in Figure 16 and Figure 17, respectively. There is only one CO2-bearing object for tests in each of these samples. It needs to be noted that only the zone covered by the six pairs of electrodes in the middle of the arrays are presented because the zones located on the edges always include artifacts due to uncompleted data sets.
It can be seen from Figure 16 and Figure 17 that the position of the single CO2-bearing object can be identified clearly in the images of the CHERT and IRIS systems. This indicates the reliability of the voltage measurements and correctness of the inversion processes. However, it has to be noted that the shape of the tested object cannot be described properly although the area covered by the object in the images are similar to that in the photo. The mismatch between the true and resultant shapes can be attributed to the simplicity of the electrode working modes and limited acquired data used for the inversion [23]. This can be further verified by a comparison of the images obtained from Mode II (in Figure 16) and Mode III in Figure 17. There are more obvious artifacts in the Mode II-based images than Mode III.
The photos taken by camera and the images obtained from different modes for the second type of samples are illustrated in Figure 18 and Figure 19, respectively. It can be seen from Figure 18 and Figure 19 that the positions of the two CO2-bearing objects can be identified in the images obtained from Mode III. In the case of Mode II as shown in Figure 18, the resultant ‘object’ located at the lower part has been blurred by ‘artifacts’. The ‘artifacts’ are quite similar to those in the single-object images as presented in Figure 16. It can be concluded that Mode III has to be adopted for the purpose of identifying the two CO2-bearing objects.

4.3. Discussion

(1)
Data inversion method
This work focuses on the development of a cross-borehole ERT experimental system for data acquisition and the validation of the usability of the system through a comparison with the commercial system (i.e., IRIS SYSCAL PRO) in laboratory tests. To achieve the comparison, the same data inversion method (i.e., the standard smoothness-constrained method) was applied on the data collected from the two systems. It has been shown in Section 4.1 and Section 4.2 that consistent results of the resultant resistivity images were obtained and thus the usability of the system developed in this work for CHERT data acquisition was validated.
However, it needs to be mentioned that the quality of the resultant resistivity images could be improved by applying more advanced data inversion methods. Tso et al. claimed that conventional smoothness-constrained inversion of ERT data is efficient and robust, and consequently very popular. However, it does not resolve sharp interfaces of a resistivity field well, and tends to reduce and smooth resistivity variations [32]. The sharp change in resistivity of the tested zone is treated as a violation of the assumption of the smoothness-constrained inversion method. As a result, the identification of the sharp interface between objects in the tested zone is significantly restricted. This explains the mismatch of the shapes and areas between the objects in the photo and resultant images as shown in Section 4.1 and Section 4.2. In future work, advanced data inversion methods will be investigated not only to improve the quality of the resultant images but also to quantify the uncertainty in CHERT estimates.
(2)
Effects of borehole
In the CHERT experimental system developed in this work, the electrodes remain to be contacted to the simulated formation directly. This setup follows the method in which the electrodes are installed on the outside of the insulated well-casing in field applications. Therefore, there is no significant effect of borehole fluid. However, as indicated by Lee et al. [33], there are several ways to allocate the electrode arrays in boreholes. One popular way is that the electrodes are placed in the borehole fluid that provides an electrical contact between the electrodes and rock formation. In this case, they demonstrated that the borehole effects depend on the borehole radius and on the resistivity contrast between the borehole fluid and the surrounding rock formation. Moreover, a 2.5D inversion algorithm incorporating the boreholes was developed to overcome the borehole effects in CHERT surveys.
As the future work, the CHERT methodology developed in this work will be tested in the fields for verifying the applicability and reliability of the system [34]. Before that, the effects of the properties of the fluid and formation, and borehole geometry need to be clarified and corresponding data inversion approaches should be established accordingly.

5. Conclusions

A cross-borehole ERT (CHERT) system was developed for laboratory experiments of CO2 geological storage applications. An optimization method was established for optimizing the structure of electrode arrays and corresponding working schemes. The developed CHERT system was calibrated systematically to determine the measurement range and accuracy of electrical impedance. Laboratory experiments were designed and implemented to validate the performance of the developed CHERT system. The following conclusions are derived from this work.
(1)
It is an essential step to optimize the structure of electrode arrays and corresponding working schemes of CHERT according to the real application background. The optimization method based on finite-element modelling provides an effective means for designing a field-scale CHERT system.
(2)
The quality of the images inverted from the CHERT data is highly dependent on the working schemes and specific modes, which is closely related to the size of the data sets used for the inversion. The AM-BN scheme is recommended due to the better uniformity of the resultant sensitivity field and applicability to larger borehole spacing.
(3)
Based on the calibration the measurement range of the developed CHERT system can be determined as 100 Ω to 4.5 kΩ with an error limit of 1.5%. The maximum relative errors of the impedance magnitude and phase angle are 5.0% and 7.0%, respectively. Based on the test results the location of the CO2-bearing objects can be identified accurately. The shapes of the tested objects exhibit distortion to some extent, but this can be alleviated by selecting a working mode with a larger size of data sets.

Author Contributions

Conceptualization, W.L. and L.X.; Methodology, N.J. and C.W.; Software, C.W., C.H. and Z.J.; Validation, C.W., C.H. and Z.J.; Formal analysis, C.W., C.H., W.L., Z.J. and L.X.; Data curation, C.W.; Writing—original draft, N.J.; Writing—review & editing, N.J., C.W., C.H., W.L. and L.X.; Project administration, W.L. and L.X.; Funding acquisition, L.X. All authors have read and agreed to the published version of the manuscript.

Funding

This work was supported by Major Special Science and Technology Project of CNPC (2021ZZ01), State Scholarship Fund of China Scholarship Council (202106455003), Yazhou Bay Elite talents Science and Technology Project (SCKJ-JYRC-2023-06), Innovation Fund of CNPC (2018D-5007-0214), and Shandong Provincial Natural Science Foundation (ZR2019MEE095).

Data Availability Statement

Data are contained within the article.

Conflicts of Interest

N.J., C.H., W.L. and Z.J. were employed by PetroChina. The remaining authors declare that the research was conducted in the absence of any commercial or financial relationships that could be construed as a potential conflict of interest. The authors declare that this study received funding from CNPC. The funder was not involved in the study design, collection, analysis, interpretation of data, the writing of this article or the decision to submit it for publication.

References

  1. Hu, Y.; Wu, W. Can fossil energy make a soft landing?—The carbon-neutral pathway in China accompanying CCS. Energy Policy 2023, 174, 113440. [Google Scholar] [CrossRef]
  2. Aghaie, M.; Rezaei, N.; Zendehboudi, S. A systematic review on CO2 capture with ionic liquids: Current status and future prospects. Renew. Sustain. Energy Rev. 2018, 96, 502–525. [Google Scholar] [CrossRef]
  3. Van Riet, E.; Van Wittenberghe, J.; Van Hoecke, D.; Roijmans, R.; Vanderschueren, M.; Thibaux, P. On the suitability of premium OCTG tubing connections for CCS CO2 injection wells—A full scale physical evaluation. Int. J. Greenh. Gas Control 2023, 123, 103834. [Google Scholar] [CrossRef]
  4. García, J.H.; Torvanger, A. Carbon leakage from geological storage sites: Implications for carbon trading. Energy Policy 2019, 127, 320–329. [Google Scholar] [CrossRef]
  5. Sato, K.; Mito, S.; Horie, T.; Ohkuma, H.; Saito, H.; Watanabe, J.; Yoshimura, T. Monitoring and simulation studies for assessing macro- and meso-scale migration of CO2 sequestered in an onshore aquifer: Experiences from the Nagaoka pilot site, Japan. Int. J. Greenh. Gas Control 2011, 5, 125–137. [Google Scholar] [CrossRef]
  6. Arts, R.; Chadwick, A.; Eiken, O.; Thibeau, S.; Nooner, S. Ten years’ experience of monitoring CO2 injection in the Utsira Sand at Sleipner, offshore Norway. First Break. 2008, 26, 65–72. [Google Scholar] [CrossRef]
  7. Yang, X.; Lassen, R.N.; Jensen, K.H.; Looms, M.C. Monitoring CO2 migration in a shallow sand aquifer using 3D cross-hole electrical resistivity tomography. Int. J. Greenh. Gas Control 2015, 42, 534–544. [Google Scholar] [CrossRef]
  8. Dickin, F.; Wang, M. Electrical resistance tomography for process applications. Meas. Sci. Technol. 1996, 7, 247–260. [Google Scholar] [CrossRef]
  9. Miller, C.R.; Routh, P.S.; Brosten, T.R.; McNamara, J.P. Application of time-lapse ERT imaging to watershed characterization. Geophysics 2008, 73, G7–G17. [Google Scholar] [CrossRef]
  10. Song, S.Y.; Kim, B.; Cho, A.; Jeong, J.; Lee, D.; Nam, M.J. Electrical resistivity survey and interpretation considering excavation effects for the detection of loose ground in urban area. Geomech. Eng. 2023, 35, 109–119. [Google Scholar]
  11. Shima, H.; Sakayama, T. Resistivity tomography: An approach to 2-Dresistivity inverse problems. Soc. Explor. Geophys. 1987, 18, 59–61. [Google Scholar]
  12. Sasaki, Y. Two-dimensional joint inversion of magnetotelluric and dipole-dipole resistivity data. Geophysics 1989, 54, 254–262. [Google Scholar] [CrossRef]
  13. Loke, M.H.; Barker, R.D. Least-squares deconvolution of apparent resistivity pseudosections. Geophysics 1995, 60, 1682–1690. [Google Scholar] [CrossRef]
  14. Chambers, J.E.; Kuras, O.; Meldrum, P.I.; Ogilvy, R.D.; Hollands, J. Electrical resistivity tomography applied to geologic, hydrogeologic, and engineering investigations at a former waste-disposal site. Geophysics 2006, 71, B231–B239. [Google Scholar] [CrossRef]
  15. Maillol, J.; Seguin, M.; Gupta, O.; Akhauri, H.; Sen, N. Electrical resistivity tomography survey for delineating uncharted mine galleries in West Bengal, India. Geophys. Prospect. 1999, 47, 103–116. [Google Scholar] [CrossRef]
  16. Fikos, I.; Vargemezis, G.; Zlotnicki, J.; Puertollano, J.R.; Alanis, P.B.; Pigtain, R.C.; Villacorte, E.U.; Malipot, G.A.; Sasai, Y. Electrical resistivity tomography study of Taal volcano hydrothermal system, Philippines. Bull. Volcanol. 2012, 74, 1821–1831. [Google Scholar] [CrossRef]
  17. Nakatsuka, Y.; Xue, Z.; Garcia, H.; Matsuoka, T. Experimental study on CO2 monitoring and quantification of stored CO2 in saline formations using resistivity measurements. Int. J. Greenh. Gas Control 2010, 4, 209–216. [Google Scholar] [CrossRef]
  18. Breen, S.J.; Carrigan, C.R.; LaBrecque, D.J.; Detwiler, R.L. Bench-scale experiments to evaluate electrical resistivity tomography as a monitoring tool for geologic CO2 sequestration. Int. J. Greenh. Gas Control 2012, 9, 484–494. [Google Scholar] [CrossRef]
  19. Carrigan, C.R.; Yang, X.; LaBrecque, D.J.; Larsen, D.; Freeman, D.; Ramirez, A.L.; Daily, W.; Aines, R.; Newmark, R.; Friedmann, J.; et al. Electrical resistance tomographic monitoring of CO2 movement in deep geologic reservoirs. Int. J. Greenh. Gas Control 2013, 18, 401–408. [Google Scholar] [CrossRef]
  20. Schmidt-Hattenberger, C.; Bergmann, P.; Kießling, D.; Krüger, K.; Rücker, C.; Schütt, H.; Ketzin Group. Application of a Vertical Electrical Resistivity Array (VERA) for monitoring CO2 migration at the Ketzin site: First performance evaluation. Energy Procedia 2011, 4, 3363–3370. [Google Scholar] [CrossRef]
  21. Bergmann, P.; Schmidt-Hattenberger, C.; Labitzke, T.; Wagner, F.M.; Just, A.; Flechsig, C.; Rippe, D. Fluid injection monitoring using electrical resistivity tomography—Five years of CO2 injection at Ketzin, Germany: Fluid injection monitoring. Geophys. Prospect. 2017, 65, 859–875. [Google Scholar] [CrossRef]
  22. Kiessling, D.; Schmidt-Hattenberger, C.; Schuett, H.; Schilling, F.; Krueger, K.; Schoebel, B.; Danckwardt, E.; Kummerow, J. Geoelectrical methods for monitoring geological CO2 storage: First results from cross-hole and surface–downhole measurements from the CO2SINK test site at Ketzin (Germany). Int. J. Greenh. Gas Control 2010, 4, 816–826. [Google Scholar] [CrossRef]
  23. Bellmunt, F.; Marcuello, A.; Ledo, J.; Queralt, P. Capability of cross-hole electrical configurations for monitoring rapid plume migration experiments. J. Appl. Geophys. 2016, 124, 73–82. [Google Scholar] [CrossRef]
  24. Lesparre, N.; Boyle, A.; Grychtol, B.; Cabrera, J.; Marteau, J.; Adler, A. Electrical resistivity imaging in transmission between surface and underground tunnel for fault characterization. J. Appl. Geophys. 2016, 128, 163–178. [Google Scholar] [CrossRef]
  25. Khambampati, A.K.; Kim, K.Y.; Lee, Y.G.; Kim, S. Boundary element method to estimate the time-varying interfacial boundary in horizontal immiscible liquids flow using electrical resistance tomography. Appl. Math. Model. 2016, 40, 1052–1068. [Google Scholar] [CrossRef]
  26. Geselowitz, D.B. An Application of Electrocardiographic Lead Theory to Impedance Plethysmography. IEEE Trans. Biomed. Eng. 1971, 38–41. [Google Scholar] [CrossRef] [PubMed]
  27. Isaacson, D. Distinguishability of Conductivities by Electric Current Computed Tomography. IEEE Trans. Med. Imaging 1986, 5, 91–95. [Google Scholar] [CrossRef]
  28. Leontarakis, K.; Apostolopoulos, G.V. Laboratory study of the cross-hole resistivity tomography: The Model Stacking (MOST) Technique. J. Appl. Geophys. 2012, 80, 67–82. [Google Scholar] [CrossRef]
  29. Zhou, B.; Greenhalgh, S.A. Cross-hole resistivity tomography using different electrode configurations. Geophys. Prospect. 2010, 48, 887–912. [Google Scholar]
  30. Goes, B.J.M.; Meekes, J.A.C. An effective electrode configuration for the detection of DNAPLs with electrical resistivity tomography. J. Environ. Eng. Geophys. 2012, 9, 127–141. [Google Scholar] [CrossRef]
  31. Daily, W.; Owen, E. Cross-borehole resistivity tomography. Geophysics 1991, 56, 1228–1235. [Google Scholar] [CrossRef]
  32. Binley, A.; Tso, M.; Iglesias, M.; Wilkinson, P.; Kuras, O.; Chambers, J. Efficient multi-scale imaging of subsurface resistivity with uncertainty quantification using ensemble Kalman inversion. Geophys. J. Int. 2021, 225, 887–905. [Google Scholar]
  33. Lee, K.S.; Cho, I.K.; Kim, Y.J. Borehole effect in 2.5D crosshole resistivity tomography. J. Appl. Geophys. 2016, 135, 212–222. [Google Scholar] [CrossRef]
  34. Madsen, L.M.; Kühl, A.K.; Levy, L.; Christiansen, A.V. Cross-borehole ERT: Sensitivity, model resolution, and field data quality. In Proceedings of the 27th European Meeting of Environmental and Engineering Geophysics of the Conference, Bordeaux, France, 29 August–2 September 2021. [Google Scholar]
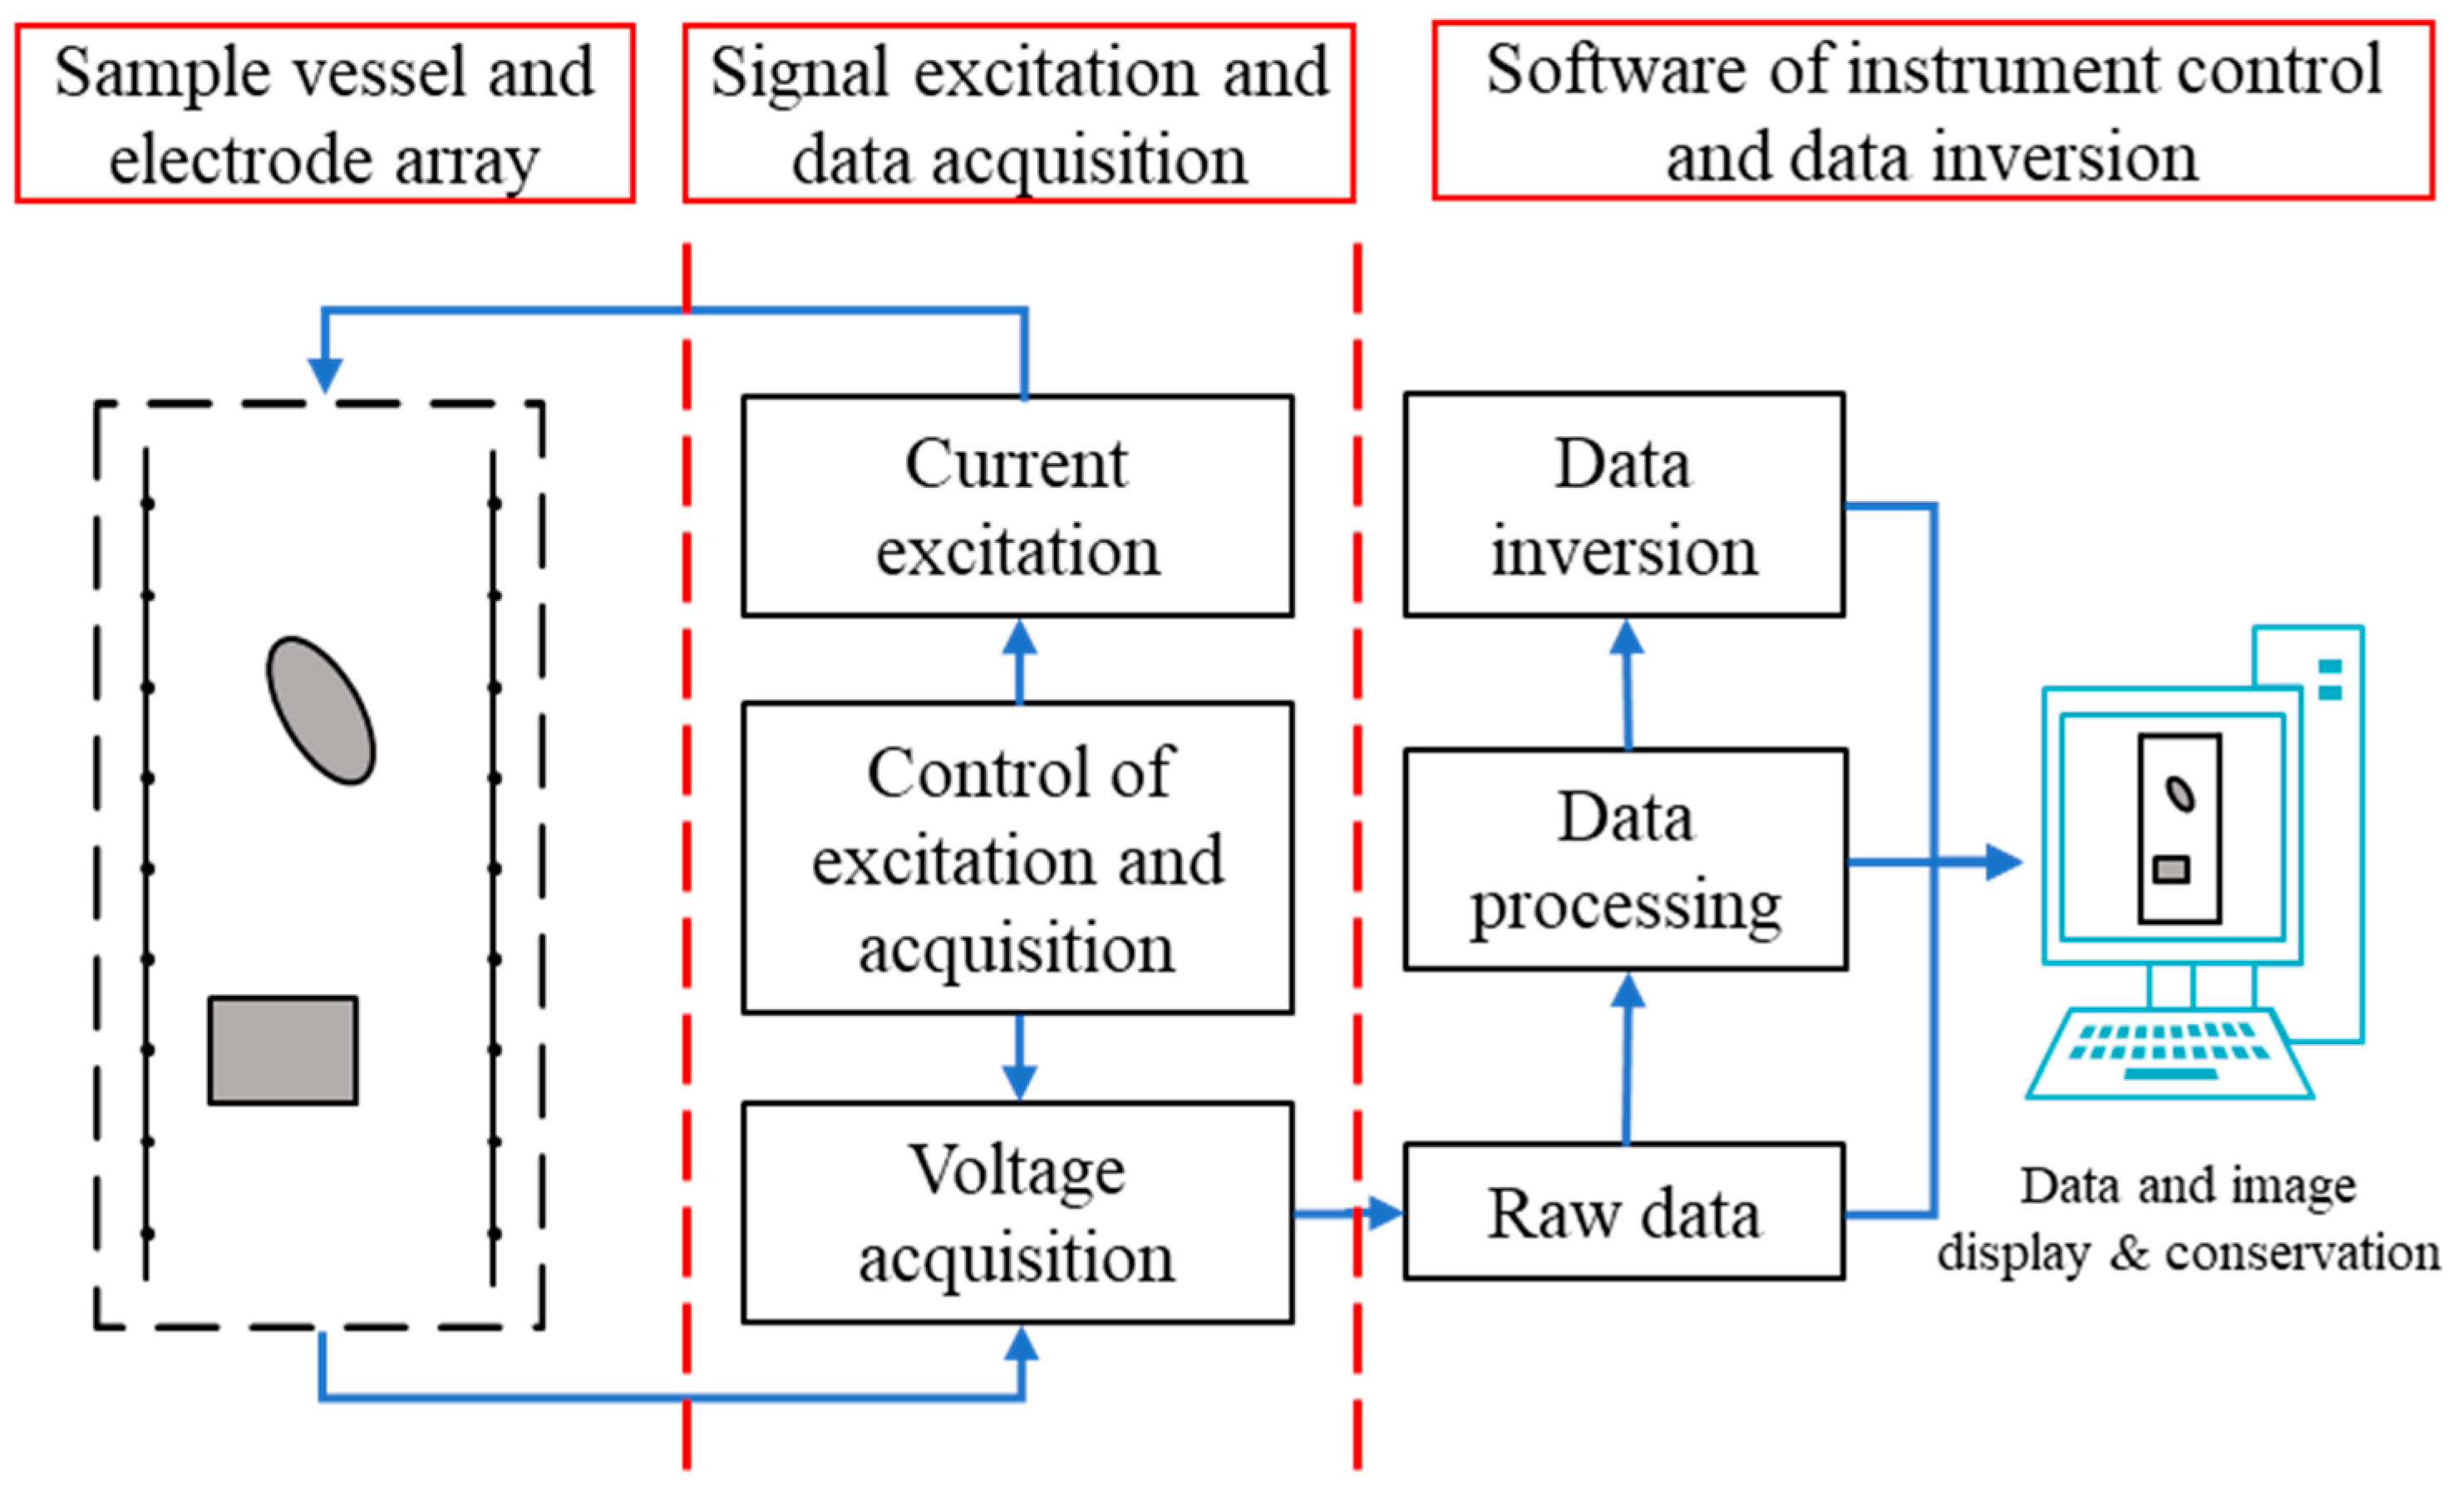
Figure 1. Structural diagram of the CHERT system.
Energies 17 00710 g001
Figure 2. Schematic of model structure including the studied zone and electrode arrays.
Energies 17 00710 g002
Figure 3. Variations of the uniformity index of the sensitivity field with the ratio of the electrode spacing to the length of electrode array.
Energies 17 00710 g003
Figure 4. Variations of the uniformity index of the sensitivity field with the ratio of the electrode width to the length of electrode array.
Energies 17 00710 g004
Figure 5. Sensitivity fields under conditions of typical working schemes of CHERT electrodes (A and B: current electrodes; M and N: potential electrodes).
Energies 17 00710 g005
Figure 6. Layout of the sample vessel and electrode array unit.
Energies 17 00710 g006
Figure 7. Schematic of the signal excitation and data acquisition unit.
Energies 17 00710 g007
Figure 8. Schematic of three modes of electrodes for the AM-BN working scheme (A and B: current electrodes; M and N: potential electrodes; black arrows: directions for switching electrodes).
Energies 17 00710 g008
Figure 9. Photos of the CHERT system developed in this work.
Energies 17 00710 g009
Figure 10. Measurements on the resistor of 20 Ω by the CHERT and digital bridge instrument.
Energies 17 00710 g010
Figure 11. Schematic of the tested circuits.
Energies 17 00710 g011
Figure 12. Measurements on an R-C circuit by the CHERT and digital bridge instrument.
Energies 17 00710 g012
Figure 13. Comparison between the photo and images obtained from Mode I for one insulating object in brine (Black dots: electrodes).
Energies 17 00710 g013
Figure 14. Comparison between the photo and images obtained from Mode II for one insulating object in brine (Black dots: electrodes).
Energies 17 00710 g014
Figure 15. Comparison between the photo and images obtained from Mode III for one insulating object in brine (Black dots: electrodes).
Energies 17 00710 g015
Figure 16. Comparison between the photo and images obtained from Mode II for one CO2-bearing object in sand (Black dots: electrodes).
Energies 17 00710 g016
Figure 17. Comparison between the photo and images obtained from Mode III for one CO2-bearing object in sand (Black dots: electrodes).
Energies 17 00710 g017
Figure 18. Comparison between the photo and images obtained from Mode II for two CO2-bearing objects in sand (Black dots: electrodes).
Energies 17 00710 g018
Figure 19. Comparison between the photo and images obtained from Mode III for two CO2-bearing objects in sand (Black dots: electrodes).
Energies 17 00710 g019
Disclaimer/Publisher’s Note: The statements, opinions and data contained in all publications are solely those of the individual author(s) and contributor(s) and not of MDPI and/or the editor(s). MDPI and/or the editor(s) disclaim responsibility for any injury to people or property resulting from any ideas, methods, instructions or products referred to in the content.