Article

Chemostratigraphic Approach to the Study of Resources’ Deposit in the Upper Silesian Coal Basin (Poland)

Silesian University of Technology, 44-100 Gliwice, Poland
Energies 2024, 17(3), 642; https://doi.org/10.3390/en17030642
Submission received: 9 December 2023 / Revised: 21 January 2024 / Accepted: 26 January 2024 / Published: 29 January 2024

Abstract

:
The Upper Silesian Coal Basin (USCB), located in southern Poland, is the major coal basin in Poland, and all technological types of hard coal, including coking coal, are exploited. It is also an area of high potential for coal-bed methane (CBM). Despite the increasing availability of alternative energy sources globally, it is a fact that the use of fossil fuels will remain necessary for the next few decades. Therefore, research on coal-bearing formations using modern research methods is still very important. The application of geochemistry and chemostratigraphy in reservoir characterization has become increasingly common in recent years. This paper presents the possibility of applying chemostratigraphic techniques to the study of the Carboniferous coal-bearing succession of the Upper Silesian Coal Basin. The material studied comes from 121 core samples (depth 481–1298 m), representing the Mudstone Series (Westphalian A, B). Major oxide concentrations of Al2O3, SiO2, Fe2O3, P2O5, K2O, MgO, CaO, Na2O, K2O, MnO, TiO2, and Cr2O3 were obtained using X-ray fluorescence (XRF) spectrometry. Trace elements were analyzed using inductively coupled plasma mass spectrometry (ICP/MS). The geochemical record from the Mudstone Series shows changes in the concentration of major elements and selected trace elements, leading to the identification of four chemostratigraphic units. These units differ primarily in the content of Fe, Ca, Mg, Mn, and P as well as the concentration of Zr, Hf, Nb, Ta, and Ti. The study also discusses quartz origin (based on SiO2 and TiO2), sediment provenance and source-area rock compositions (based on Al2O3/ TiO2, TiO2/Zr, and La/Th), and paleoredox conditions (based on V/Cr, Ni/Co, U/Th, (Cu+Mo)/Zn, and Sr/Ba) for the chemostratigraphic units. Chemostratigraphy was used for the first time in the study of the Carboniferous coal-bearing series of the USCB, concluding that it can be used as an effective stratigraphic tool and provide new information on the possibility of correlating barren sequences of the coal-bearing succession.

1. Introduction

The Upper Silesian Coal Basin (USCB) is located in southern Poland and in the region of Ostrava–Karviná in the Czech Republic. It is the major coal basin in Poland.
In the USCB, all technological types of hard coal occur, including coking coal, which, since 2014, has been included in the European list of critical raw materials [1,2,3]. The total prognostic resources of hard coal in the USCB amounted to 4616.17 Mt and 20,926.58 Mt of prospective resources. Energy coals represent almost three-fourths of the resources (70.96%) and coke coals are above one-fourth (27.83%), whereas other types of coals remain negligible. [1]. The USCB has also a high potential for coal-bed methane (CBM) [3,4,5,6,7,8].
In the USCB, methane is extracted from the methane drainage of working and abandoned coal mines in an approximate amount of 200–300 million m3 per year. Methane is also present in undeveloped coal deposits, where it may be a potential target for exploration [6]. The amount of methane resources in areas outside of hard coal mining in the USCB has been estimated to be over 38 billion m3 as of now [3].
Although, in a global context, other energy sources are increasingly emerging, it is known that the use of fossil fuels will continue to be necessary for the next few decades. Therefore, research on their effective and sustainable exploitation is still relevant and justified, and research on coal-bearing formations using modern research methods is still essential. A thorough understanding of the stratigraphy and correlation of lithological units in coal-bearing formations is a crucial aspect of this research. In recent years, chemostratigraphy techniques have been increasingly used for these purposes.
Chemostratigraphy uses a chemical record of sedimentary rocks for stratigraphic correlation. Chemostratigraphy is based on the recognition of stratigraphical variations in the geochemistry of the depositional sequences, but the success of the technique depends on relating chemical variations to changes in mineralogy. The inorganic geochemistry of sediments is highly variable and depends on the type of clastic material and its provenance, paleoenvironmental conditions, and diagenesis [9,10,11,12,13,14,15,16,17].
Even apparently homogeneous sequences demonstrate some chemical composition differences, which make chemocorrelation a commonly usable technique to determine stratigraphy and correlate boreholes [11,12,13,14,15,16,17,18,19,20].
The application of geochemistry and chemostratigraphy in hydrocarbon exploration and reservoir characterization has become increasingly common in recent years, particularly with the advent of developments in analytical instrumentation [10,15,16,17,19,20,21].
A precise, high-resolution, objective, and quantitative stratigraphic division method for macroscopically homogeneous mudstone successions has consistently been required in response to the increasing demand for unconventional energy worldwide [20].
Chemostratigraphy comprises the geochemical classification and correlation of sedimentary layers using major and trace element geochemistry, which is very helpful when applied to sequences with poor biostratigraphic records [8].
Important advantages of chemostratigraphy are that ICP analyses can obtain reliable geochemical data from small sample volumes (core samples and cuttings) and improvements in analytical methods that now enable the rapid analysis of samples. As such, it is probably the most versatile stratigraphic tool available to the industry at this moment.
Chemostratigraphic studies have been successfully performed for most of the European coal basins [9,10,11,12,13,22,23,24], but, so far, chemostratigraphic tools have not been used in the study of the Polish part of the Upper Silesian Coal Basin. The first study on the chemostratigraphy of carboniferous coal-bearing deposits in the USCB was published in 2022, but it focused only on the Czech part of this basin [24]. The authors of this paper also indicated that there was a lack of a systematic and modern study of the geochemistry of coal-bearing sediments from the USCB region.
The coal-bearing succession of the Upper Silesia Coal Basin has a very long and complicated sedimentary history. The up-to-8500 m thick coal-bearing succession has been subdivided into two parts. The older Paralic series contains marine and brackish fauna horizons, while the younger Limnic series is deposited in a continental paleoenvironment [25]. Most of the coal seams are placed in the Mudstone Series and the Upper Silesian Sandstone Series (Westphalian), where over 3 m thick coal seams are deposited [26]. These series belong to limnic deposits. The Mudstone Series, which was the subject of this study, occupies the largest area compared to all other continental coal-bearing units in the Upper Silesian Coal Basin [25]. It is homogeneous and highlighted primarily by the dominance of fine clastic rocks [27]. The Mudstone Series includes a correlation between a freshwater fauna horizon and a key tuffite horizon. However, both of these horizons are not present everywhere [25]. Hence, the correlation of this series causes many problems.
It is also important to determine the chemical composition of rocks accompanying coal seams in terms of the storage or potential management of mining waste. The geochemical investigation of the presence of trace and major elements in the sedimentary rocks of the coal-bearing succession from the USCB has primarily focused on rocks from the roof and floor or interlayers of coal seams [28,29]. The USCB’s geochemical research in recent years has been mainly focused on the critical elements, particularly rare earth elements, found in coal, coal ashes, and coal mining waste. [30,31,32,33]. Furthermore, some data on the distribution of critical and toxic elements in sedimentary rocks were also presented [34,35]. Chemostratigraphic studies have not been carried out for the carboniferous coal-bearing succession in the USCB so far.
Therefore, the main goals of this study were (1) to analyze the major and trace elements’ concentrations in the sedimentary rocks of the coal-bearing succession of the USCB, (2) to demonstrate the distribution and stratigraphical variability of the selected elements, (3) to discuss quartz origin, sediment provenance, and source-area rock compositions, and (4) to establish if chemostratigraphy tools could be successfully applied to analyze the coal-bearing series of the USCB.

2. Outline of Geology

The Upper Silesian Coal Basin (USCB) belongs to the Northwest European Carboniferous Basin (NWECB), which is a large sedimentary basin that extends from Ireland in the west to Poland in the east [27,36,37,38].
Due to its economic importance, many authors have extensively studied the geology of the USCB, e.g., [27,35,36,37,38,39,40,41,42]. The total area of the Polish part of the USCB is estimated to cover about 5600 km2, of which the area of documented deposits amounts to over 3045 km2. At present, the USCB’s anticipated economic resources account for approximately 79.99% of the hard coal domestic resources in Poland [1].
The basement of the Upper Silesian Coal Basin consists of Precambrian, Cambrian, and Devonian deposits. The lower Carboniferous level (middle and upper Tournaisian) of the USCB is made up of carbonate rocks, which are the continuation of platform sedimentation begun in the Devonian. The upper series (lower and middle Visean) is made up of dark gray limestone that contains sediments such as mudstones, tuffites, and lidites [27].
The Carboniferous coal-bearing succession in the USCB lies unconformably on the older substrate. The main coal-bearing series of the USCB is composed of the paralic series (Namurian A) and the limnic series (Namurian B, C, and Westphalian A, B, C, D) (Figure 1). The paralic series is mainly composed of fine- and medium-grained sandstones. The thickness of the paralic series in the eastern part of the USCB is about 200 m and almost 3800 m in the western part. In the paralic series, 110 coal seams have been discovered, with a thickness of up to 1.5 m. The upper part of the coal-bearing series, the limnic succession, is subdivided into three series (from oldest to youngest): the Upper Silesian Sandstone Series, the Mudstone Series, and the Krakow Sandstone Series. The Upper Silesian Sandstone Series is made up of coarse, clastic continental sediments, with 60 coal seams of considerable thickness (6–8 m) determined [4,27].
The Mudstone Series, which is the subject of the research presented in this study, contains coal seams, including coking coal of economic relevance. It is homogeneous and highlighted primarily by the dominance of fine clastic rocks [27]. The sediments of the Mudstone Series were deposited in a braided-rivers alluvial plain [25]. This series is composed mainly of fine-grained sediments (up to 80%) in lithological composition. Coarse-grained deposits (mainly fine- and medium-grained sandstones) constitute 20–30% and phytogenic material constitutes 3–5%. The Mudstone Series includes 158 coal seams, of which 71 are of economic importance [27]. Coal seams in mudstones and claystones of the Mudstone Series show high (>50%) methane saturation levels [25].
The Krakow Sandstone Series is characterized by a uniform structure and is composed mainly of coarse-grained clastic rocks [4,27]. The series has a maximum thickness of 1140 m and there are only a few coal seams with a thickness of up to 6–7 m. Additionally, coal seams in the Mudstone Series are distinguished by relatively high methane contents (>3 m3/t coaldaf) [7].
The upper boundary of the Carboniferous coal-bearing succession is unconformable and erosional and it is covered by Permian, Triassic, Jurassic, and Cenozoic sediments. The maximum thickness of the overburden is more than 1850 m [27].

3. Materials and Methods

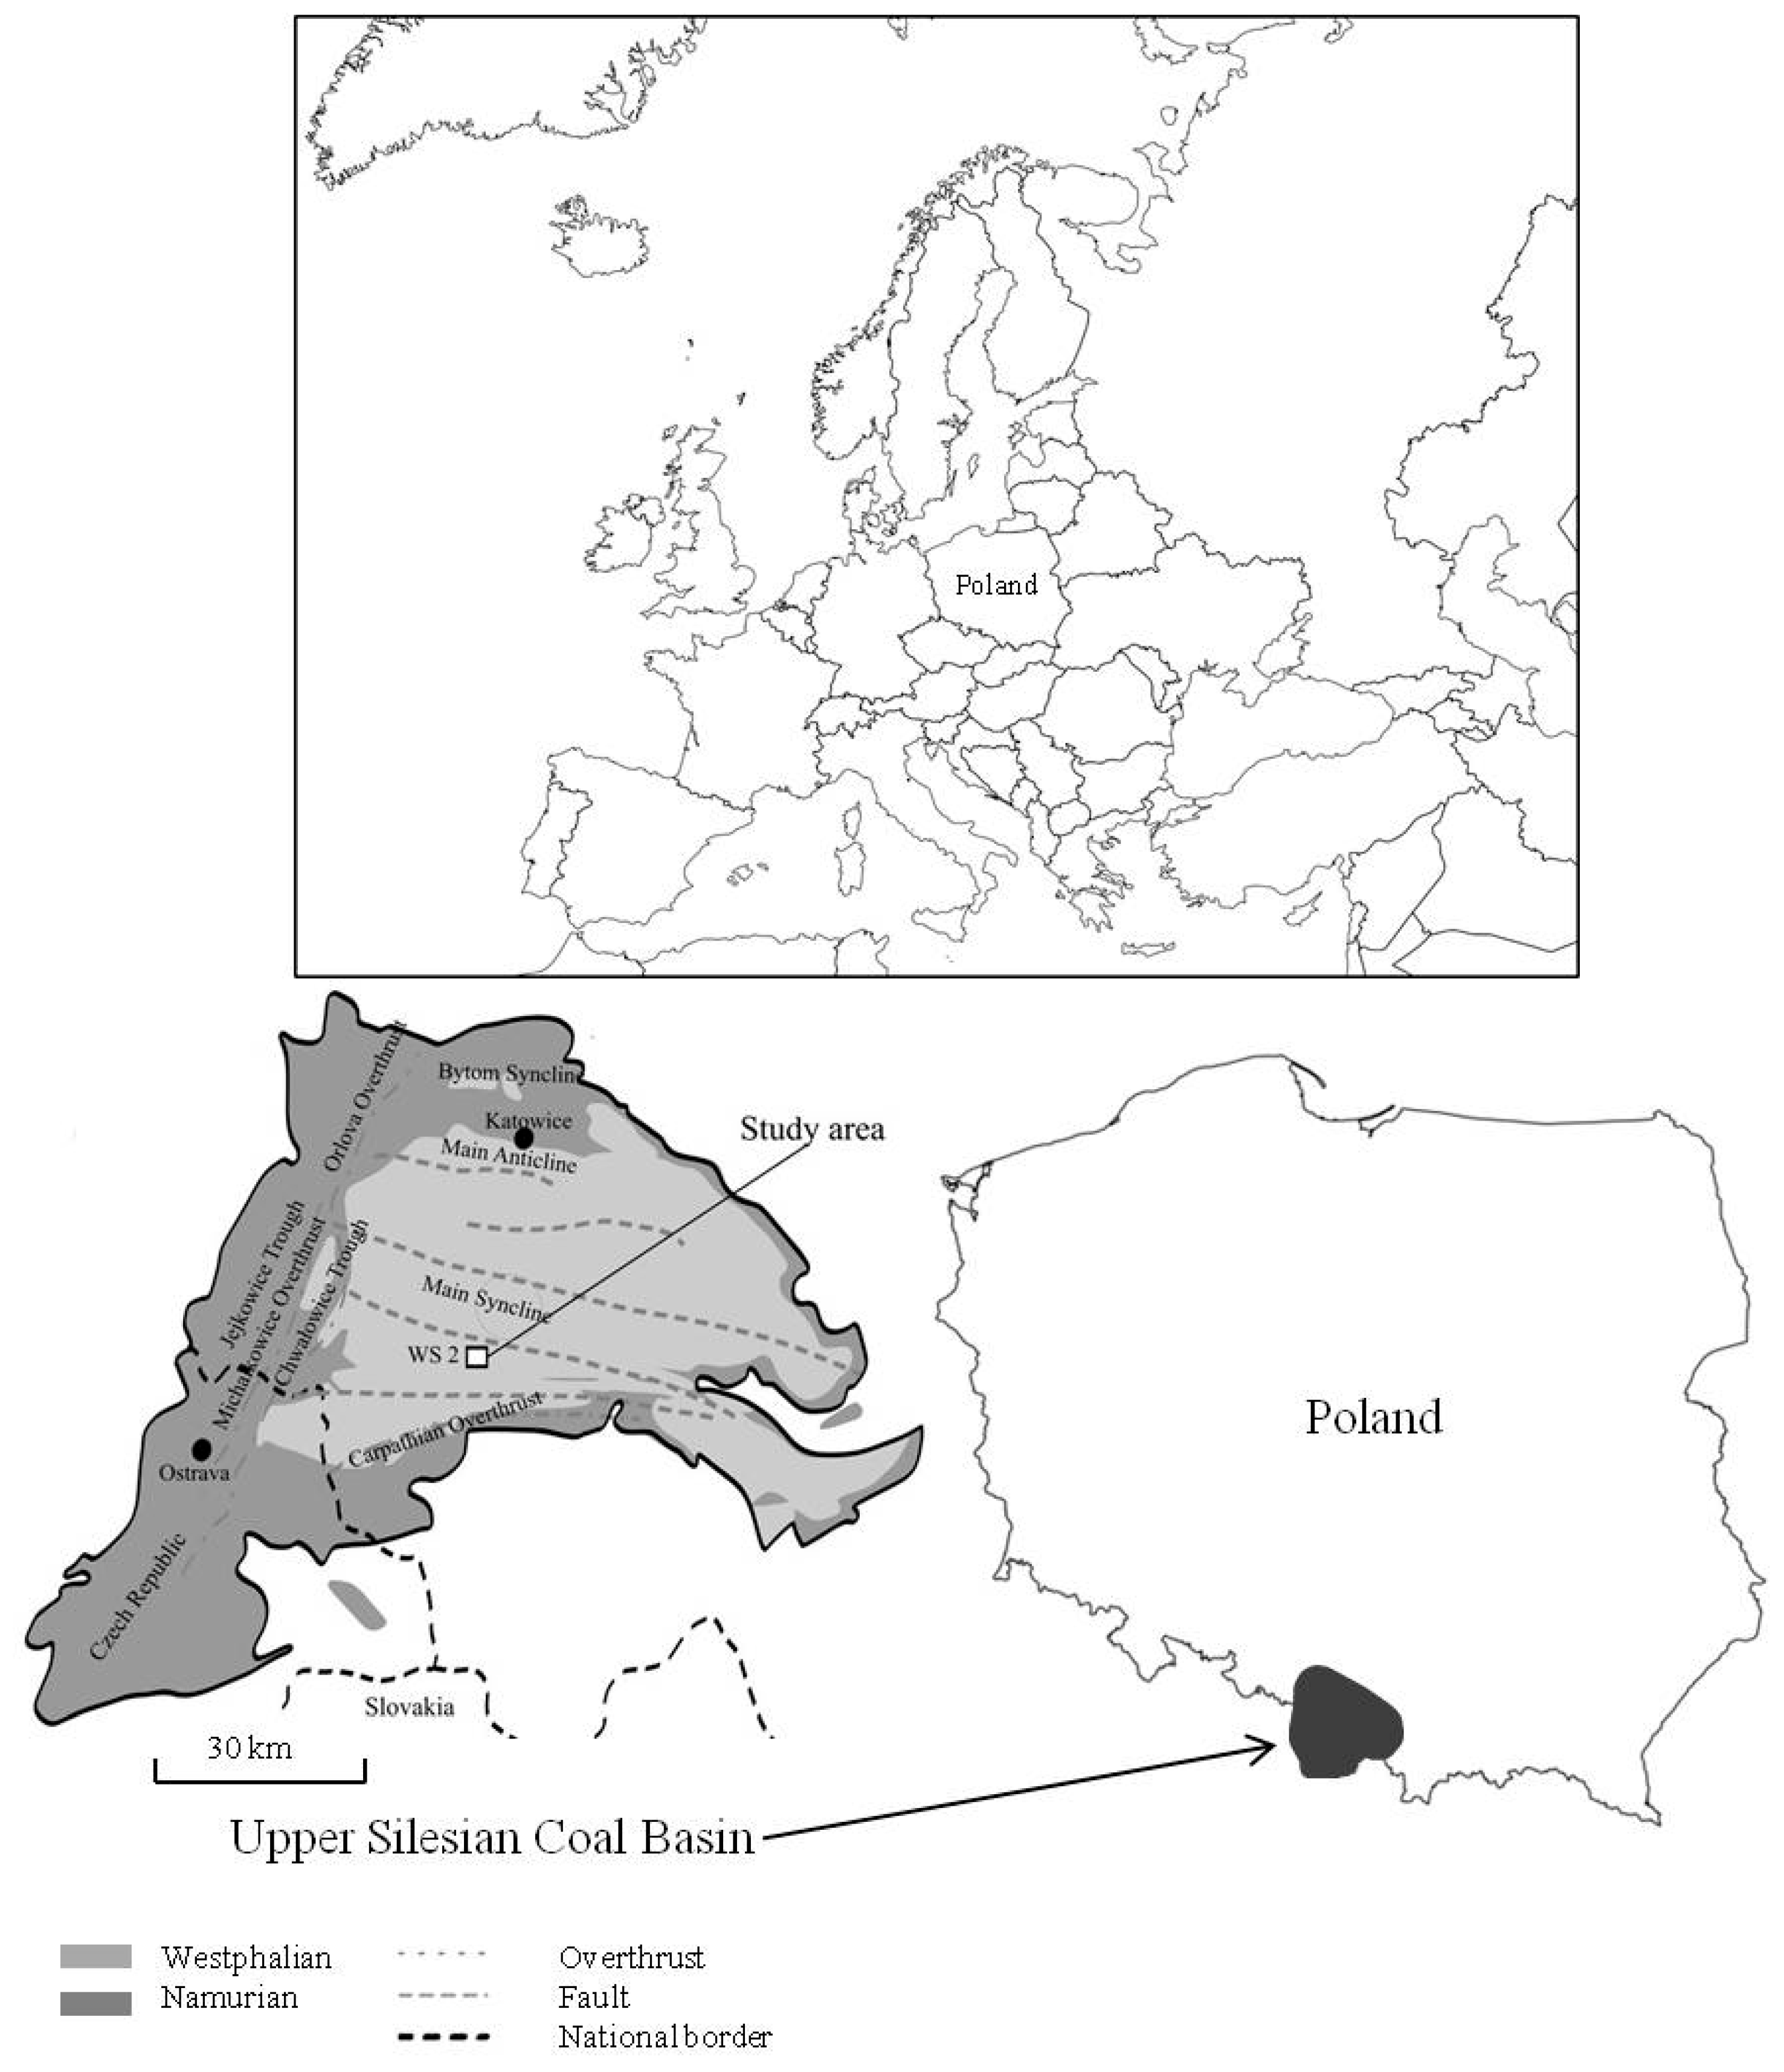
The material studied comes from core samples obtained from borehole WS located in the central part of the USCB. The samples represent sedimentary rock from the Carboniferous coal-bearing series. The location of borehole WS (USCB) is shown in Figure 2.
This study utilized data from 121 representative core samples. The distribution of lithological types in the borehole WS profile corresponds well to the general lithological composition of the Mudstone Series (Westphalian A, B); therefore, this profile can be considered representative.
The study interval in borehole WS ranges from a depth of 481 m (top of the coal-bearing series) to 1298 m (end of the drill hole). This study utilized data from 121 representative core samples, representing different lithological types. Freshly exposed and unweathered rock samples were collected during drilling works. The spacing between the collected samples ranged from 2 m to a maximum of 13 m. When sampling, attention was paid to any changes in the lithology of the sediments. The maximum distances between samples were caused by coal seams and carbonaceous shales that were not sampled.
The samples from borehole WS2 represent the Mudstone Series (Westphalian A, B) (Figure 1) of the Carboniferous coal-bearing succession from the Upper Silesian Coal Basin. Sample preparation and analytical procedures were performed at the AcmeLab Analytical Laboratory (currently, Bureau Veritas Commodities Canada Ltd.) in Vancouver, Canada [34,35]. The samples were crushed, split, and pulverized, with a 250 g rock being reduced to a 200 mesh size (0.074 mm). The oxides of major element concentrations (Al2O3, SiO2, Fe2O3, P2O5, K2O, MgO, CaO, Na2O, K2O, MnO, TiO2, and Cr2O3) were obtained using X-ray fluorescence (XRF) spectrometry and Li2B4O7/LiBO2 fusion. Trace elements were analyzed using inductively coupled plasma mass spectrometry (ICP/MS) following four-acid digestion (HF + HClO4 + HCl + HNO3). This study presents data for elements such as Zr, Hf, Nb, Ta, and Ti, which are “key” elements in chemostratigraphic studies. Additionally, geochemical proxies such as Al2O3/TiO2, TiO2/Zr, Th/Sc, La/Th V/Cr, Ni/Co, U/Th, and (Cu+Mo)/Zn were analyzed.

4. Results and Discussion

4.1. Chemical Composition

A chemical composition total of 121 core samples, representing different lithological types, was analyzed. To avoid geochemical trends related to changes in grain size and lithology, samples were classified into groups, taking into account their chemical composition. The chemical classification of lithological types, based on the chemical compositions of siliciclastic rocks, proposed by Sprague et al. (2009) was applied [45]. This classification was based on the share of SiO2, Al2O3, MgO, and Fe2O3 in a sample (Table 1). The classification of samples into different lithological types seems to be necessary because it is well known that, in any siliciclastic sequence, fundamental differences in whole-rock geochemistry can occur between different lithological types. Sandstones, with their quartz-rich nature, have a distinctly different whole-rock geochemistry than mudrocks containing clay minerals. Therefore, to recognize geochemical changes occurring over time, within and between different lithostratigraphic formations, mudstone and sandstone lithologies must be considered separately. In contrast to sandstones, mudstones and claystones have uniform grain sizes, which means they are likely to possess more homogeneous elemental distributions. Integrating interpretations from both lithologies is essential for achieving a complete understanding of the chemostratigraphy [8,9,10,11,12,13,18].
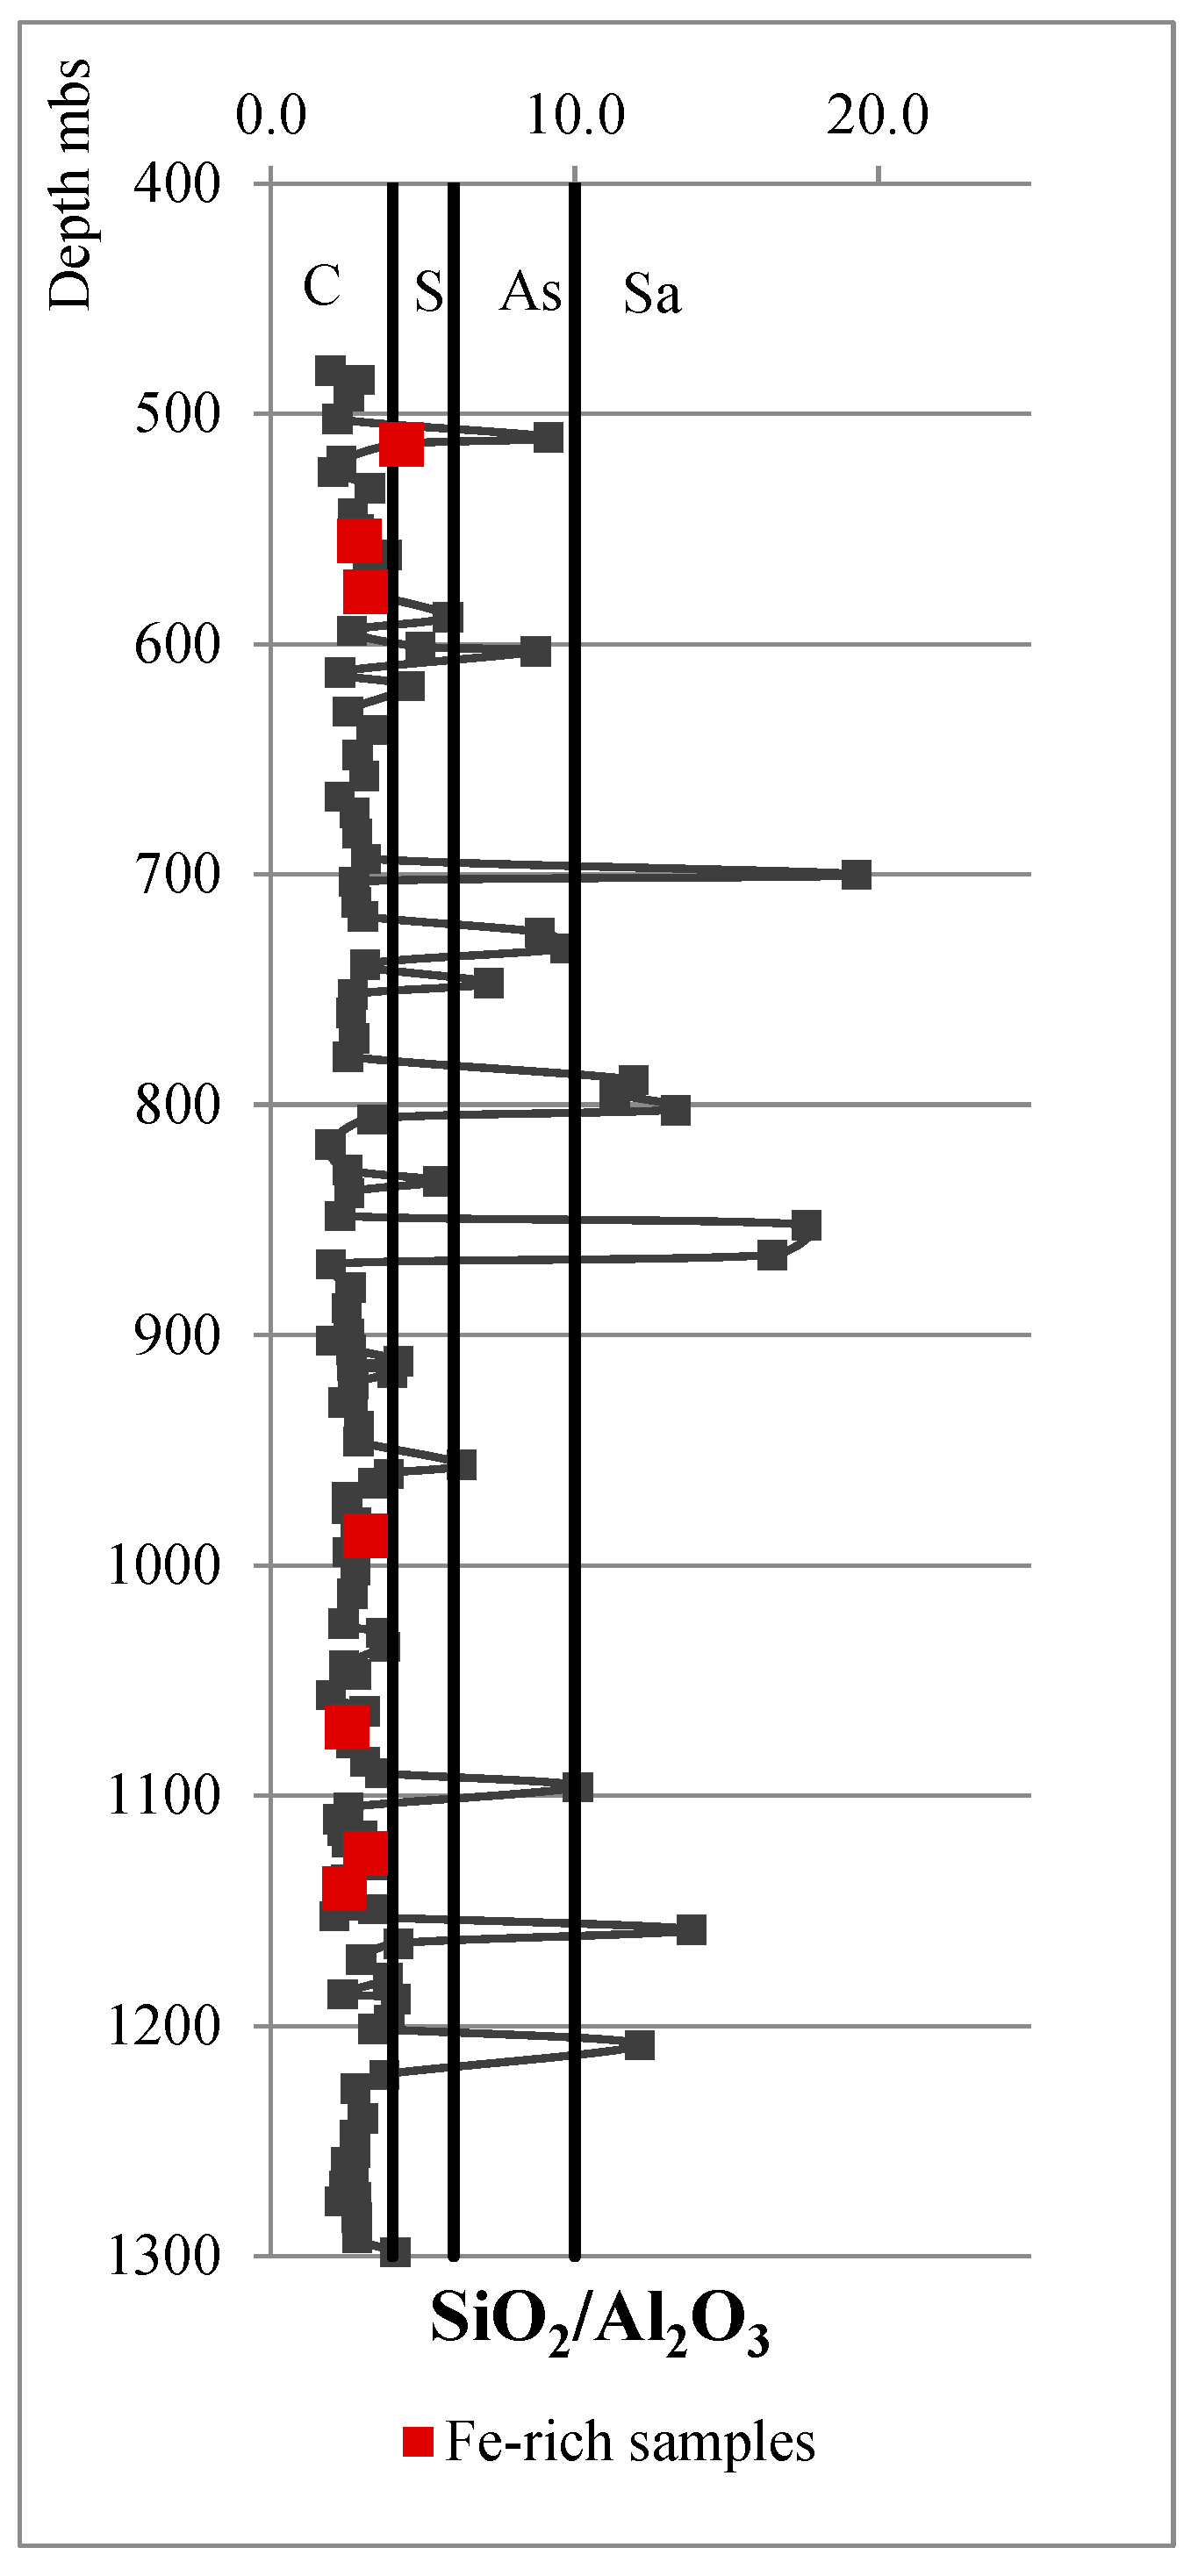
Based on the classification proposed by Sprague et al. (2009), most of the samples (96 samples) were classified as claystones (SiO2/Al2O3 < 4%) including six Fe-rich claystones (Fe2O3 > 10%). Nine samples were classified as silty claystones and one sample was classified as Fe-rich silty claystones. The remaining samples (15 samples) were classified as sandstones (9 samples) and argillaceous sandstones (6 samples). The variability in the lithological types in the profile analyzed is presented in Figure 3. The study profile was built mainly of fine clastic rocks with discrete sandstone intervals, resulting in the claystones’ and siltstones’ dataset being notably larger than the sandstone dataset. Importantly, such a share of lithological types is representative of the Mudstone Series of the USCB. Therefore, geochemical data for claystones and siltstones were the basis for the interpretation of chemostratigraphic zonation. The sandstone geochemical dataset was relatively small and was only an additional issue.
The chemical composition of the samples from the Mudstone Series of the Upper Silesian Coal Basin is presented in Table 2.
The major oxides SiO2 and Al2O3 were the predominant constituents, with contents ranging from 23.5% to 69.8% and 8.6% to 27.28%, respectively, in the claystones and siltstones, and from 70.2% to 90.2% and 4.7% to 11.4%, respectively, in the sandstones (Table 2). The concentration of Fe2O3 was diverse, ranging from 1.0% to 32.9% in the claystones and siltstones and from 1.1% to 8.2% in the sandstones.
High Fe2O3 concentrations are usually accompanied by an increase in CaO and MgO contents, which are related to the occurrence of dolomite and siderite. The CaO contents were very low, averaging 0.22% in the claystones and siltstones and 0.30% in the sandstones. Other major oxides, such as MgO, Na2O, K2O, P2O5, MnO, Cr2O3, and TiO2, were present in low concentrations.

4.2. Chemostratigraphic Zonation

4.2.1. Major Elements

In a stratigraphic context, differences in mineralogy and/or chemistry can lead to the formation of a geochemical system, which provides valuable information about geological settings, climate, and the processes of sediment production and preservation. The stratigraphic record exhibited changes in the concentration of certain elements over time as a result of geological conditions, such as tectonic, climatic, redox, oceanographic, biotic, and other processes [15,16,17,26,46].
Geochemical profiles are the most effective way to present geochemical data when they plot element concentrations against sample depth.
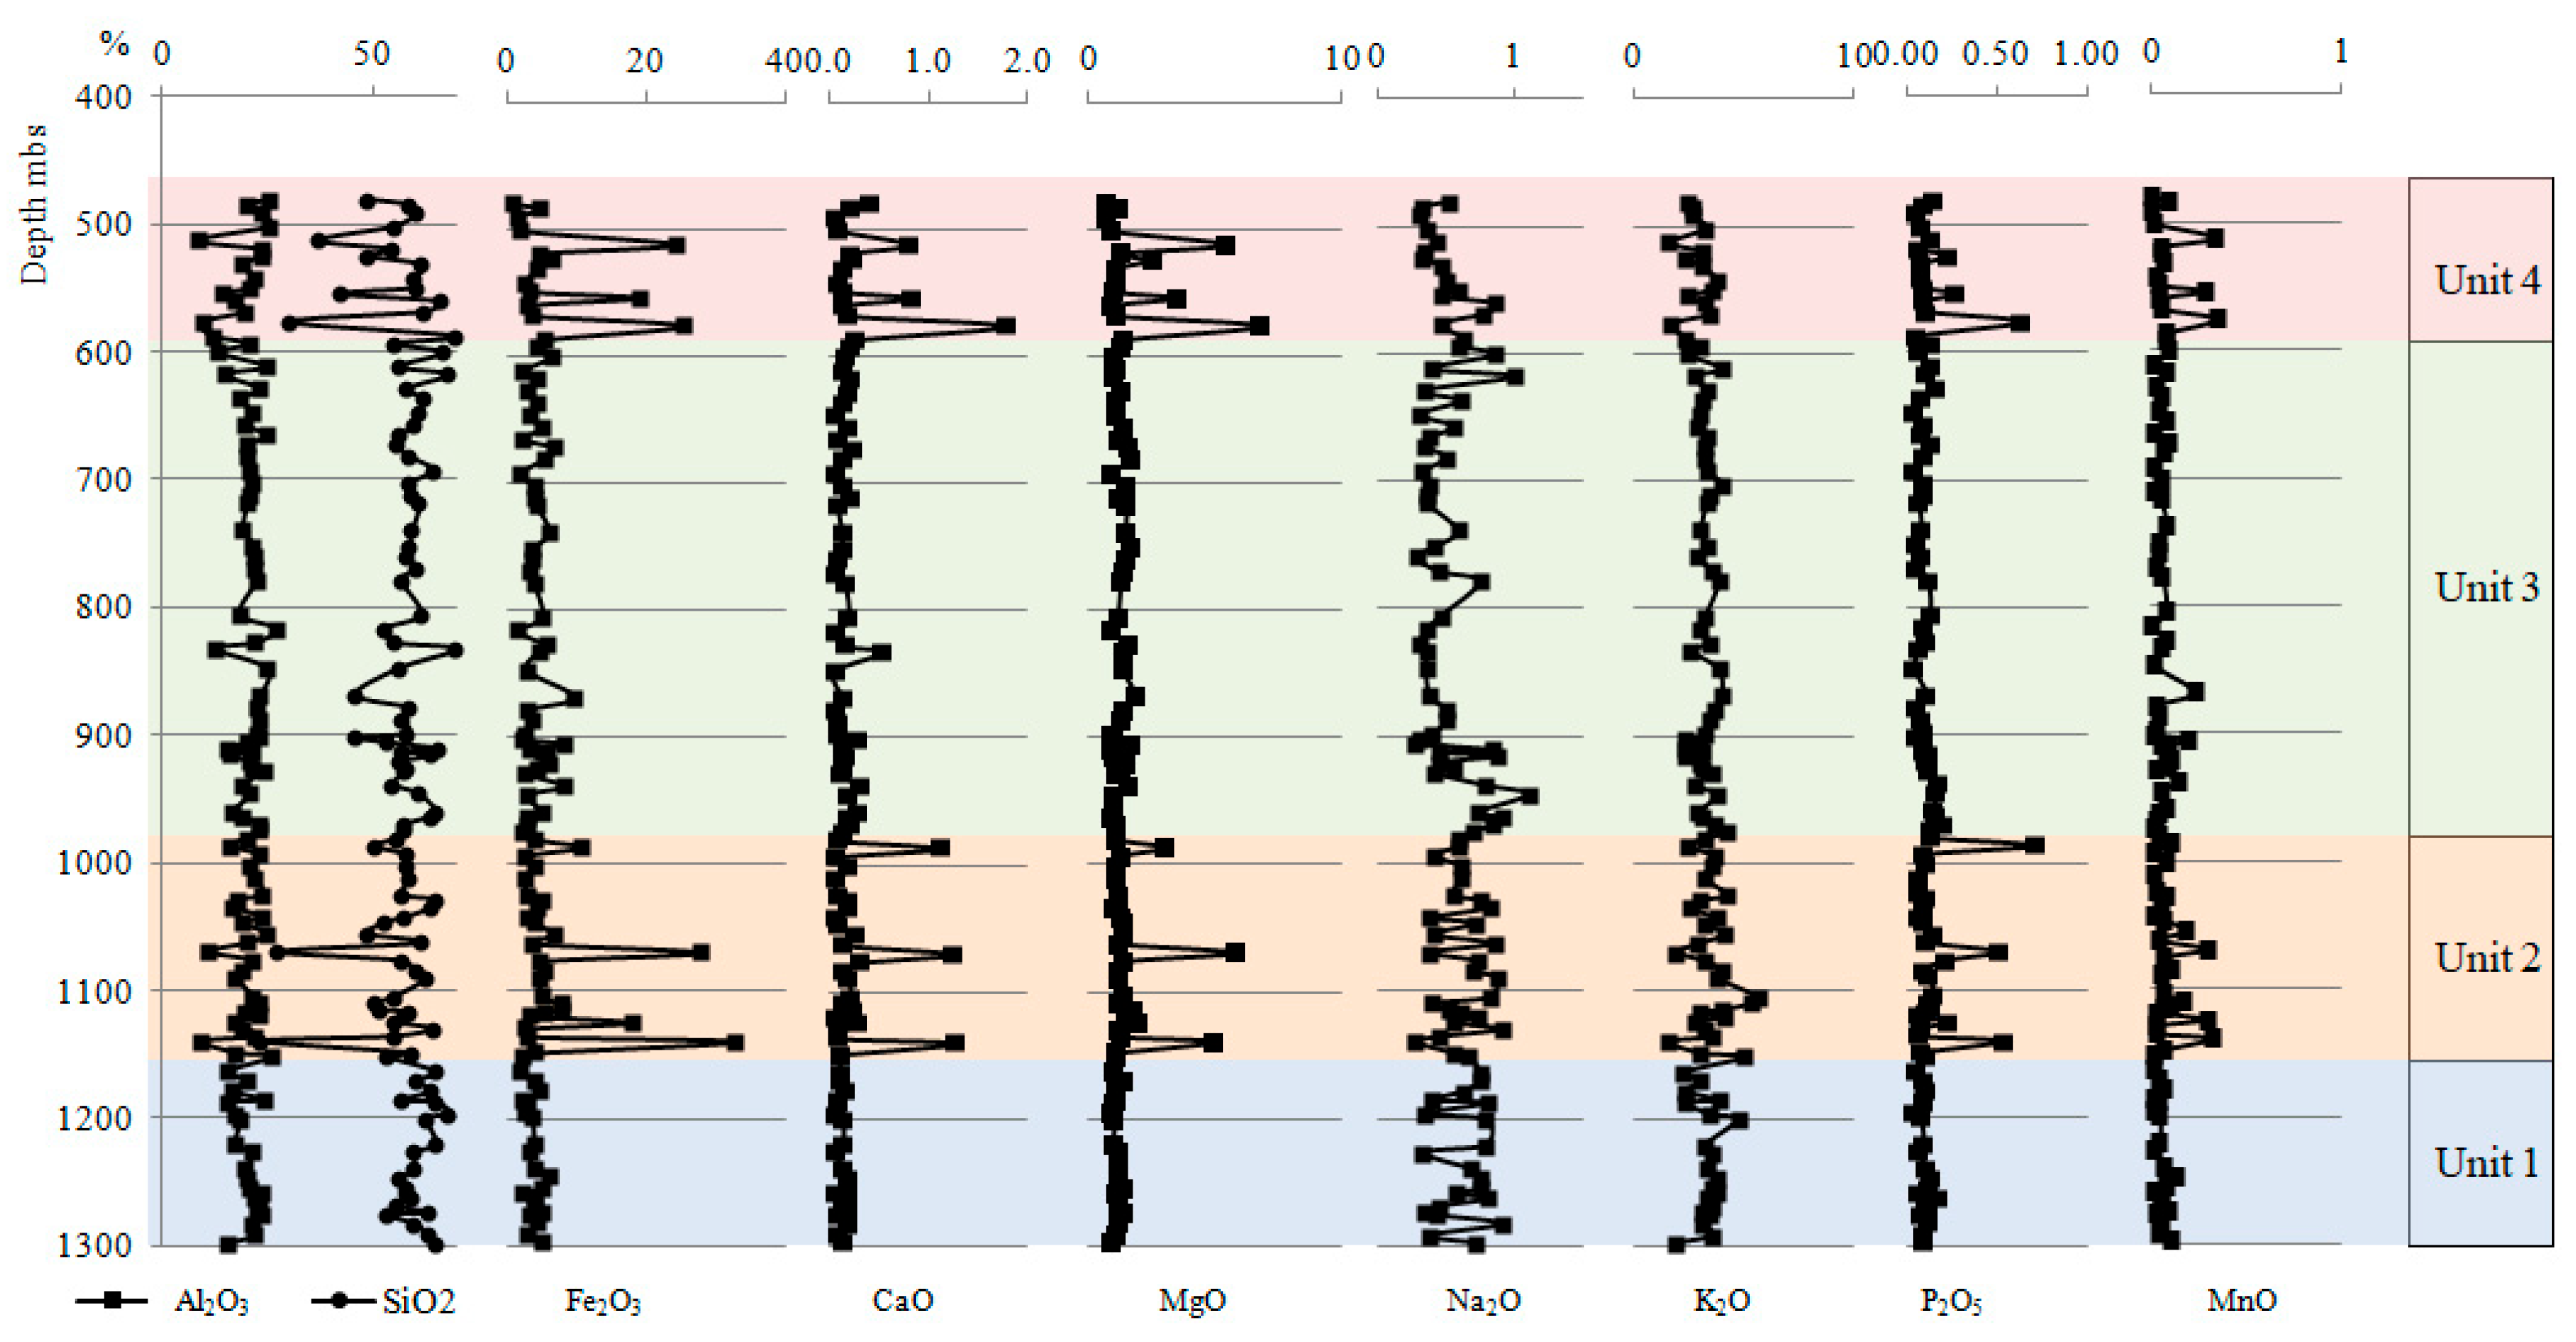
The geochemical profiles of major element concentrations usually enable us to see the principal geochemical features of the profile and to divide it into geochemically distinct intervals [12,13,15,16]. The geochemical data derived from the claystones and siltstones from borehole WS are presented in Figure 4. Vertical variations in major element concentrations and relative enrichment or depletion levels have resulted in the recognition of chemostratigraphic units. The geochemical profiles of the WS borehole showed levels of relative enrichment in elements such as Fe, Ca, Mag, Mn, and P as well as levels of relative depletion in Al and Si. It should be mentioned here that the results presented in this work are the first study on the chemozonation of the coal-bearing formations in the USCB. Some data on the distribution of major and trace elements were presented for the Czech part of the USCB, but they mostly concerned older stratigraphic units.
Interpretation of the geochemical data acquired resulted in the recognition of four chemostratigraphic units: Unit 1 (depth 1298–1145 m), Unit 2 (depth 1145–985 m), Unit 3 (depth 985–585 m), and Unit 4 (depth 585–481 m). The main geochemical characteristics of these divisions are described below.
Unit 1 (depth 1298–1145 m), the deepest chemostratigraphic unit, and Unit 3, from a depth of 985–585 m, are characterized by comparable principal geochemical features. Therefore, they were analyzed together.
Chemical analyses of Unit 1 and Unit 3 samples showed that they were remarkably uniform in chemical composition (Figure 4). To verify the geochemical homogeneity of this interval, the average values and range of selected major element concentrations are presented in Figure 5.
The major oxides SiO2 and Al2O3 were the predominant constituents. The SiO2 content ranged from 53.4% to 68.0% and from 45.8% to 69.8%, respectively, in Unit 1 and in Unit 3. The Al2O3 content ranged from 15.6% to 26.0% in Unit 1 and from 12.0% to 27.3% in Unit 3 (Figure 4 and Figure 5).
The content of major elements is crucial for determining the silica composition’s origin [45,47,48]. The primary sources for silica are terrigenous clastic quartz, Si-bearing hydrothermal fluid input, the conversion of smectite to illite, and biogenic quartz. The origin of the quartz is especially important when analyzing the main determinants of the quality of hydrocarbon reservoirs [19]. Several geochemical criteria have been reported for determining the origin of silicon in sedimentary rocks [10,19,46,49].
In this study, the relationships between TiO2 and SiO2 were analyzed to determine the quartz origin. A strong positive correlation between TiO2 and SiO2 suggests that terrigenous quartz is a primary source of silica, while a clear negative relationship indicates a high proportion of biogenic silica [10,19,46,49].
The correlation diagrams between SiO2 and TiO2 for the study sample from Unit 1 and Unit 3 showed a moderate negative correlation. The values of Pearson’s correlation coefficient (R) were −0.56 and −0.51, respectively, in Unit 1 and Unit 3 (Figure 6a, Table 3), indicating that terrigenous quartz is not a primary source of silica.
Moreover, it was observed that there was a strong negative correlation between SiO2 and Al2O3, with values of Pearson’s correlation coefficient R −0.80 and −0.77, in Unit 1 and Unit 3, respectively (Table 3). The Al vs. Si binary diagram showed a negative trend between the two elements, with relatively high concentrations of Al and low concentrations of Si (Figure 7a). This can be explained by the proportion of Al-bearing clay minerals decreasing as Si-bearing minerals (e.g., quartz, zircon, and titanite) increased and vice versa [9,26,50].
The Al2O3 vs. K2O graph illustrates a positive trend between the two elements (R 0.70 and 0.66, in Unit 1 and Unit 3, respectively) (Figure 8a, Table 3), suggesting that K, along with Al, was at least partly concentrated in clay minerals. The lack of correlation between these elements would suggest that part of the K was related to the feldspars’ and micas’ K [9,12,13].
The average Fe2O3 content of the studied samples from Unit 1 was 3.67% (range 2.00–6.06%) and from Unit 3 was 4.26% (range 1.67–9.70%), whereas the share of CaO ranged from 0.06 to 0.20% (average 0.13%) and from 0.06 to 0.54% (average 0.16%) in Unit 1 and Unit 3, respectively (Figure 5). In Unit 1, where the Fe2O3 content was slightly lower (Figure 5), this element is associated with carbonate minerals, which was indicated by the strong correlation of Fe vs. CaO (R = 0.79) (Figure 9a, Table 3) and vs. Mn (R = 0.94). A moderate positive correlation between Fe and P (R = 0.61) and a very weak positive correlation between Fe and Mg (R = 0.44) were also found (Table 3).
Within Unit 3, Fe is probably associated with oxyhydroxides rather than carbonates because there was no correlation between Fe and Ca (R = 0.27) (Figure 9a, Table 3) [7,9,18]. The correlation between Fe and Mg was moderately positive (R = 0.62), while the correlation between Fe and Mn was strongly positive (R = 0.92) (Table 3).
The analysis of the main elements’ content showed great similarities in the geochemistry of Unit 1 and Unit 3. The main difference was the strong correlation of Fe with Ca in Unit 1 and its lack in Unit 3 (Table 4)
Unit 2 (depth 1145–985 m) and Unit 4 (depth 585 −481 m) were characterized by high vertical variability of the major element concentrations.
SiO2 and Al2O3 contents ranged from 53.4% to 65.0% and 11.2% to 20.3%, respectively, in Unit 2 and from 30.3% to 66.4%, and 8.6% to 25.5%, in Unit 4, respectively (Figure 4 and Figure 5).
The strong positive relationship between Si and Ti contents was observed for the sample from Unit 2 as well as for the sample from Unit 4. Strong positive correlations for Si vs. Ti (R = 0.80 and R = 0.89 for Unit 2 and Unit 4, respectively) suggest that terrigenous quartz is a primary source of silica (Figure 6b).
In Unit 2 and Unit 4, a positive correlation was found between SiO2 and Al2O3, with Pearson’s correlation coefficient (R) values of 0.61 and 0.76 in Unit 2 and Unit 4, respectively (Figure 7b, Table 3). This may indicate similar proportions of Al-bearing clay minerals and Si-bearing minerals (e.g., quartz, zircon, and titanite) [9,26,50]. It should be noted that, in the samples from Units 2 and 4, lower concentrations of Si and Al were observed related to the carbonate dilution, as these samples were enriched in Ca-bearing carbonate minerals. The correlations diagram for Al2O3 vs. K2O for Units 2 and 4 exhibits similar positive trends as those observed for Units 1 and 3 (Figure 8b, Table 3).
The average values for Fe2O3, CaO, MgO, MnO, and P2O5 in Units 2 and 4 were only slightly higher than in Units 1 and 3; the larger ranges of values of these elements are remarkable (Figure 4 and Figure 5).
This is related to the presence of levels with significantly increased concentrations of these elements. Enrichment with elements such as Ca, Mg, and Mn is generally associated with carbonate minerals, mainly siderite, calcite, and dolomite; enrichment in Fe is associated with Fe oxyhydroxides such as hematite and goethite (in red deposits), ferroan dolomite cements in the sandstones, and with siderite, pyrite, and ferroan dolomite in the gray beds and coal measures [9,12,13].
The share of Fe2O3 in Unit 2 ranged from 2.56 to 27.76% and in Unit 4 from 0.97 to 25.28%, while the content of CaO varied from 0.07 to 1.24% in Unit 2 and from 0.06 to 1.78% in Unit 4 (Figure 4 and Figure 5).
High Fe2O3 concentrations in the analyzed samples were usually accompanied by an increase in MgO and CaO contents. A very high positive correlation (R = 0.87 and R = 0.89 for Unit 2 and Unit 4, respectively) was noted between Fe and Ca (Figure 9b, Table 3), which indicated that Fe was mainly associated with carbonate minerals and that was related to the presence of siderite and dolomite interlayers. Also, strong correlations between Fe vs. Mg and Fe vs. Mn were observed (Table 3).
Enrichment in P can also be associated with siderite, since P levels are recorded from sideritic horizons where the element is linked with Fe [12,13]. In the study samples from Unit 2 and Unit 4, a high correlation was found between Fe and P (R = 0.76, R = 0.72, respectively), which indicates that P enrichment was also associated with siderite (Table 3).
It is also worth noting that enrichment in the elements presented above was usually accompanied by depletion in Si. Correlation diagrams of SiO2 with Fe2O3 showed a strong negative correlation between these elements (R = −0.89, R = −0.88, respectively) (Figure 10b, Table 3). The analysis of the share of the main elements and their relationships in Unit 2 and Unit 4 showed their great similarity.
A summary of the main geochemical features of the chemostratigraphic units is presented in Table 4.

4.2.2. Provenance

Trace element composition can potentially provide information regarding the provenance of terrigenous sediments and source-area rock compositions [26,46,49,50,51,52,53,54,55,56].
The ratios of Al2O3/TiO2 and TiO2/Zr as well as the abundance of trace elements, such as Zr, La, Sc, Th, and their elemental ratios (Th/Sc and La/Th), are commonly used in provenance studies (e.g., [18,26,46,49,50,51,52,53,54,55,56,57,58,59]).
The Al2O3/TiO2 ratio is used to identify source materials, since the Al2O3/TiO2 values in sedimentary rocks are basically preserved from their parent rocks and do not change significantly during chemical weathering, transport, sedimentation, and diagenesis [18,45,47,50,51,52,53,54,55]. Al2O3/TiO2 ratios range from 3 to 8, 8–21, and 21–70 for mafic, intermediate, and felsic sources, respectively [52]. The Al2O3/TiO2 ratios of all the studied samples (from Units 1, 2, 3, and 4) ranged from 16.2 to 29.1 (average 20.4), indicating that they were derived from felsic to intermediate igneous rocks. A crossplot of Al2O3 vs. TiO2 showed that all samples were placed near the borderline between felsic and intermediate igneous rocks (Figure 11a,b).
A plot of the contents of TiO2 versus Zr can also be used for characterizing the nature and composition of source-area rocks. The TiO2 being associated with heavy minerals can be transported with the coarser particles [60]. The TiO2/Zr weight ratio generally decreases with increasing SiO2 content, from >~200 for mafic igneous rocks, to 195–55 for intermediate rocks, and <55 for felsic rocks [50,60]. The TiO2/Zr weight ratio of the studied samples ranged from 50.4 to 109.5 (average 83.7). On the plot, TiO2 versus Zr for all analyzed samples (except one point) fell into the intermediate rock field close to the felsic igneous rocks’ field (Figure 12a,b).
The ratios Th/Sc and La/Th are commonly applied determinants of sediment provenance due to their immobile nature and abundance/concentration in felsic (La and Th) and mafic (Sc) rocks [46,49,50,54,56,58,59].
The La/Th ratio value of 2.80 represents the upper continental crust [61]; values below this belong to felsic and intermediate sources. The La/Th ratios of the samples ranged from 0.8 to 3.0 (average 2.1); for almost all the samples, the La/Th ratios were lower than the La/Th = 2.8 ratio of the upper continental crust, suggesting a felsic to intermediate source for the sediments. Only four samples were placed slightly above the line La/Th = 2.8, suggesting a mafic source (Figure 13a,b).
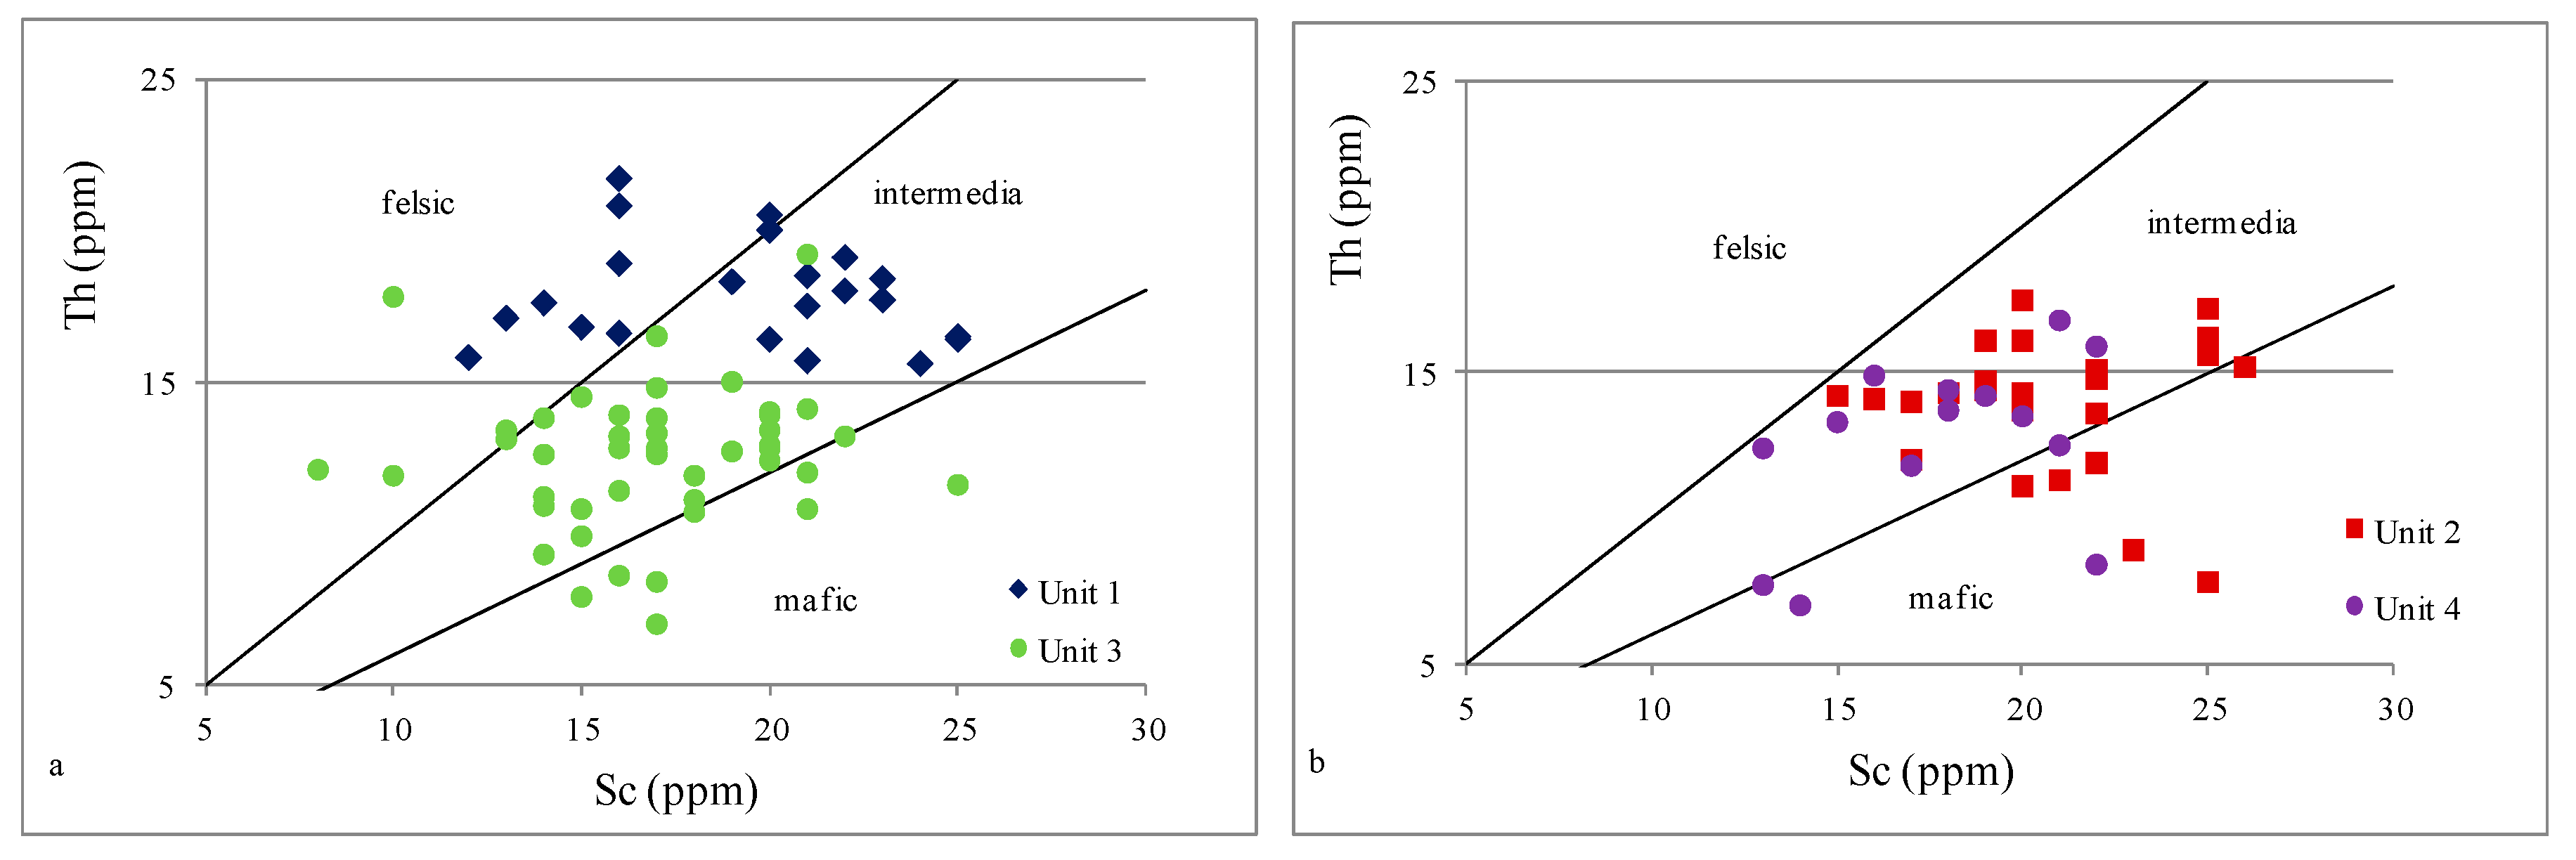
Sc and Th are transferred quantitatively from source to sediment. Thus, the Th/Sc ratio can be used to distinguish between felsic and mafic sources [46,49,52,54,55,56,57,58,59]. Th/Sc ratios of ≥1.0 are typical of continental crust enriched in incompatible elements, ≥0.6–1.0 indicates an andesitic composition, and <0.6 typifies a mafic signature.
The Th/Sc ratios of the study core samples were diversified and ranged from 0.3 to 1.8. In the Th/Sc diagram, the sample data were placed in three different fields, indicating a mixed source.
The samples from Unit 1 fell mainly into the felsic and intermediate rock fields. The samples from Unit 2 and Unit 4 had similar distributions on the Th/Sc diagrams, with the samples clustered at the field indicating the intermediate or mafic source for the sediments, while the samples from Unit 3 fell into three different fields (Figure 14a,b).
Indicators such as Al2O3/TiO2, TiO2/Zr, and La/Th suggested a felsic to intermediate source of the sediments, while the Th/Sc ratio indicated also a mafic source of the sediments for Unit 1, Unit 2, and Unit 3 (Table 4).

4.2.3. Redox Conditions

Redox-sensitive trace element (TEs) concentrations (such as U, Th, V, Mo, Cr, Co, Ni, Cu, Zn, and Pb) and their ratios have been frequently used as indicators of redox conditions in modern and ancient sedimentary systems [13,19,51,52,57,58,59,62,63,64]. The elements V, Ni, Cr, and Co hardly migrate during diagenesis. They are readily soluble in oxidizing conditions but less soluble in reducing conditions. Therefore, they preserve the original sedimentary records and are effective indicators of redox conditions of the sedimentary paleoenvironment [64].
In this study, V/Cr, Ni/Co, U/Th, and (Cu+Mo)/Zn ratios were used to evaluate paleoredox conditions [18,46,63,64,65,66]. According to Jones and Manning (1994) and Rimmer (2004), these various ratios cannot be used reliably individually but, rather, must be considered collectively [64,65].
High V concentrations generally occur under reducing conditions, while Cr usually occurs in sediments. Therefore, V/Cr can be used as an indicator of oxygen content [18,62,63,64,65,66,67]. Jones and Manning (1994) proposed the use of V/Cr ratios to estimate the paleoredox depositional conditions. When the V/Cr value is greater than 4.25, it suggests an oxygen-poor or anaerobic environment. When the V/Cr value is between 2.0 and 4.25, it suggests an oxygen-poor environment. When the V/Cr value is less than 2, it indicates an oxygen-rich environment [18,46,64,66]. Ni/Co ratios <5 indicate oxic environments and Ni/Co ratios between 5 and 7 suggest dysoxic environments, while higher ratios (Ni/Co > 7) suggest anoxic conditions [18,46,65,66,67].
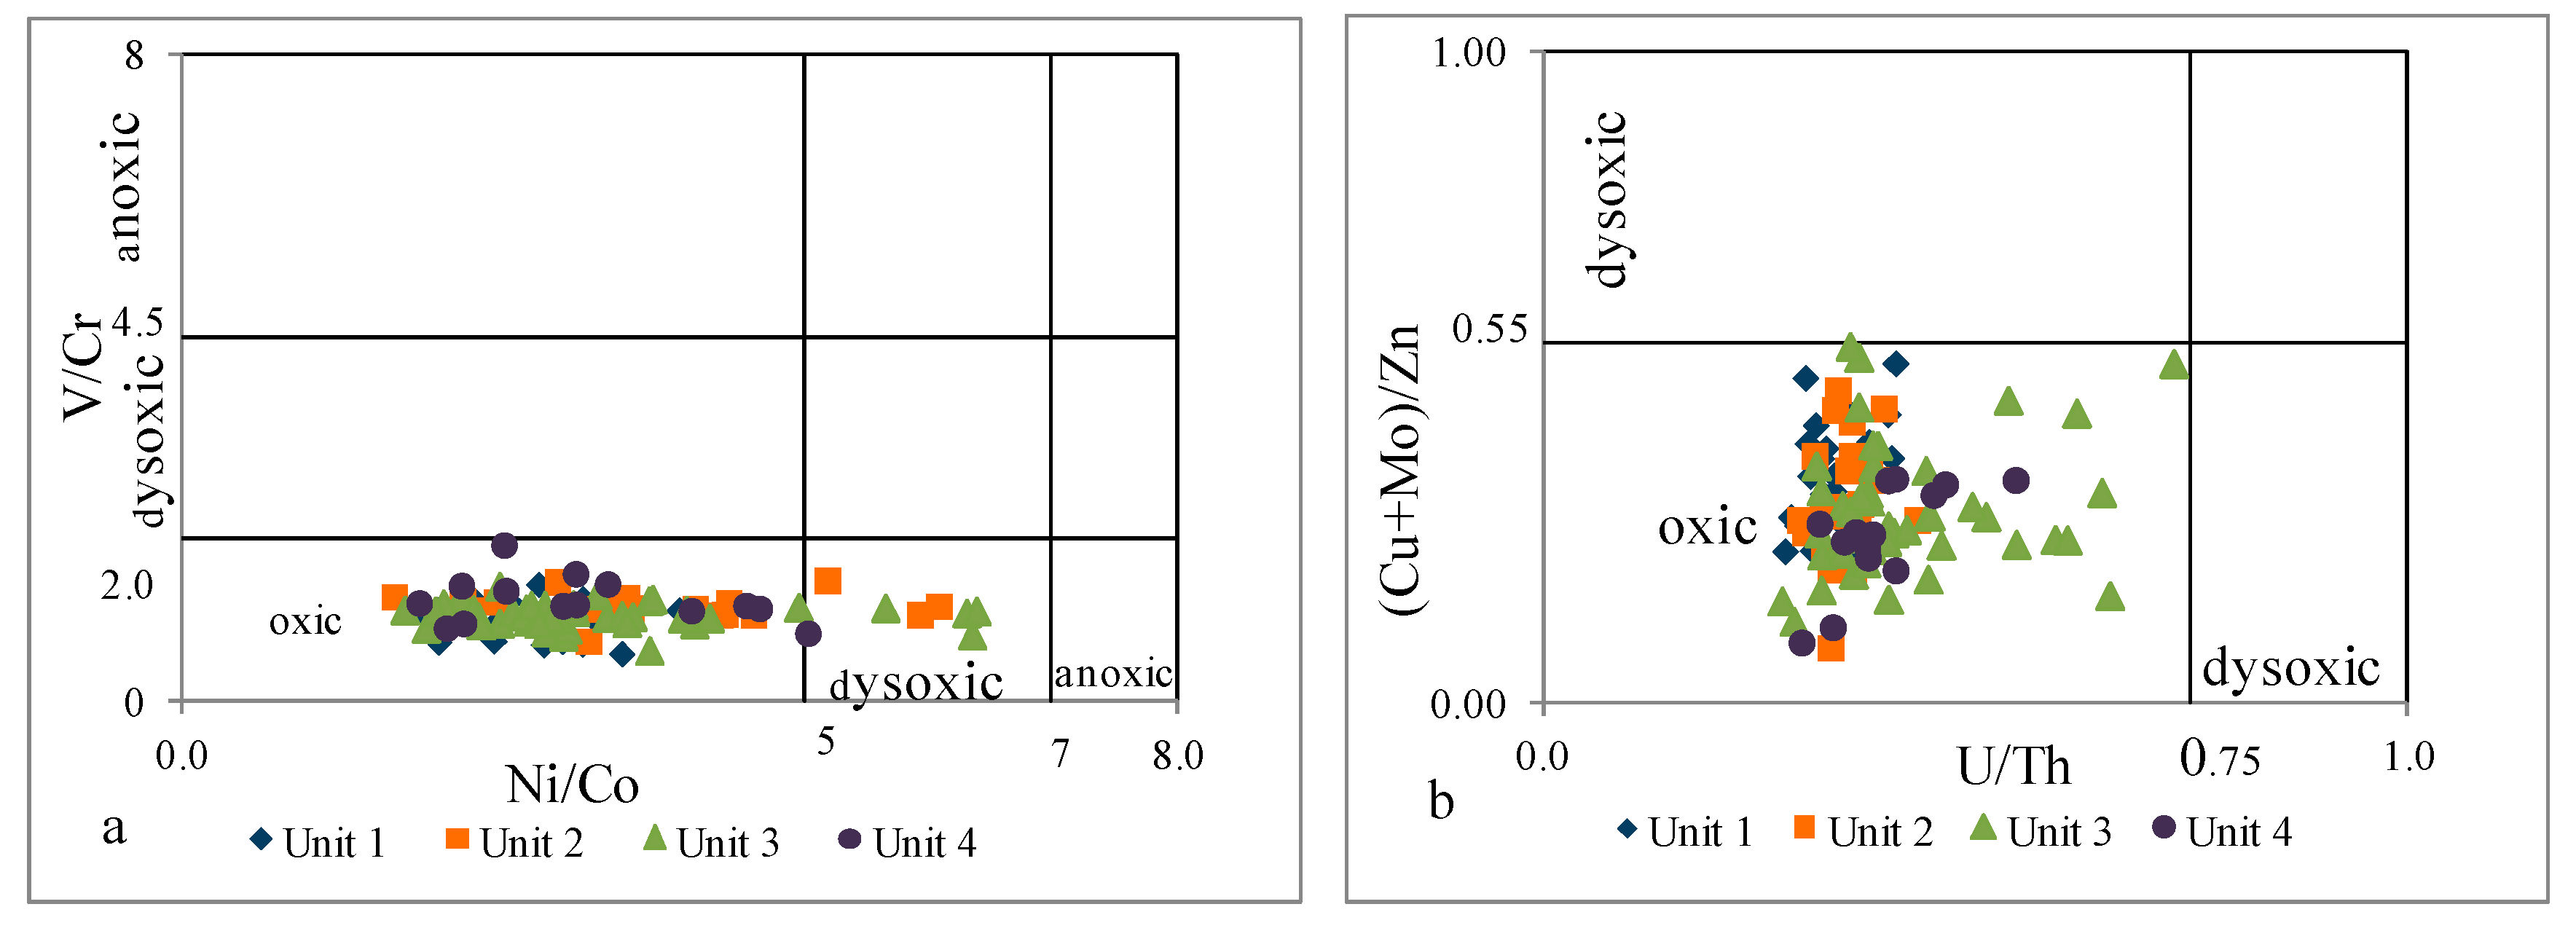
The V/Cr ratios for the analyzed samples were relatively low (0.6–1.8), suggesting oxic environments, while Ni/Co ratios varied from 3.3 to 6.4 and, for most of the samples, indicated oxic environments. Only five samples (from Unit 2 and Unit 3) were placed in the field of dysoxic conditions based on the Ni/Co ratio (Figure 15a). Considering that the paleoredox proxies should be analyzed together [64,65], it can be concluded that the oxic paleoredox conditions prevailed.
Cu and Zn in sediments are mainly controlled by redox and not influenced by diagenetic changes, so the (Cu+Mo)/Zn ratio can also be used as an oxidation-reduction parameter. Generally, a value of the Cu+Mo)/Zn ratio less than 0.55 suggests oxic environments [46,59,68].
The (Cu+Mo)/Zn ratios of all samples were low, ranging from 0.08 to 0.54, which indicates oxic environments (Figure 15b).
The ratio U/Th or Th/U is also often applied in paleoredox conditions research [17,46,64,65,66,67]. U/Th ratios <0.75 suggest oxic environments and U/Th ratios between 0.75 and 1.25 suggest dysoxic environments, while a U/Th ratio >1.25 suggests anoxic conditions [63].
The U/Th ratios for the sample from all distinguished units were less than 0.75, indicating oxic environments (Figure 15b).
The redox-sensitive proxies V/Cr, Ni/Co, U/Th, and (Cu+Mo)/Zn suggest mostly permanently oxygenated conditions. Oxygen-restricted conditions were suggested only by the values of Ni/Co for a few samples from Unit 2 and Unit 3 (Table 4).
The Sr/Ba ratio, which is typically used to evaluate the salinity of sedimentary water, was also tested [18,46,62,63]. Sr/Br < 1 indicates a freshwater environment, whereas Sr/Ba > 1 indicates a saltwater environment [18]. The Sr/Ba ratios of samples from all units were <1, indicating that they were deposited in freshwater environments.

4.2.4. Trace Elements

Chemostratigraphic studies are also commonly based on the analysis of elements concentrated in heavy minerals such as Zr, Hf, Nb, Ta, Ti, Y, MREE, HREE, Cr, and Th. These are high-field-strength elements; their distributions are largely unaffected by post-depositional weathering/diagenesis [9,15,16,18,69]. These elements are derived from terrigenous sources and are delivered to the sediment within the detrital input. Relatively high Ti, Nb, and Ta abundances are related to the presence of heavy minerals (mostly rutile), although they also have affinities with authigenic anatase and detrital clay [12,13,17,69]. Zr and Hf are concentrated almost exclusively in zircon [9,12,13].
The element Zr is considered the most diagnostic in terms of detrital input.
Zr is commonly used as a proxy for the heavy mineral zircon in both siliciclastic and carbonate studies. The only source of zircon is a terrigenous source; therefore, it is an effective indicator for the terrigenous input. The concentration of Zr in carbonate sediments is related to the amount of detrital material in the carbonate [9,12,13,15,16,17,18].
In this study, selected trace elements such as Zr, Hf, Nb, Ta, and Ti were applied for chemostratigraphic analyses. The average concentration values of these elements were significantly higher for claystones and siltstones than for sandstones (Table 5).
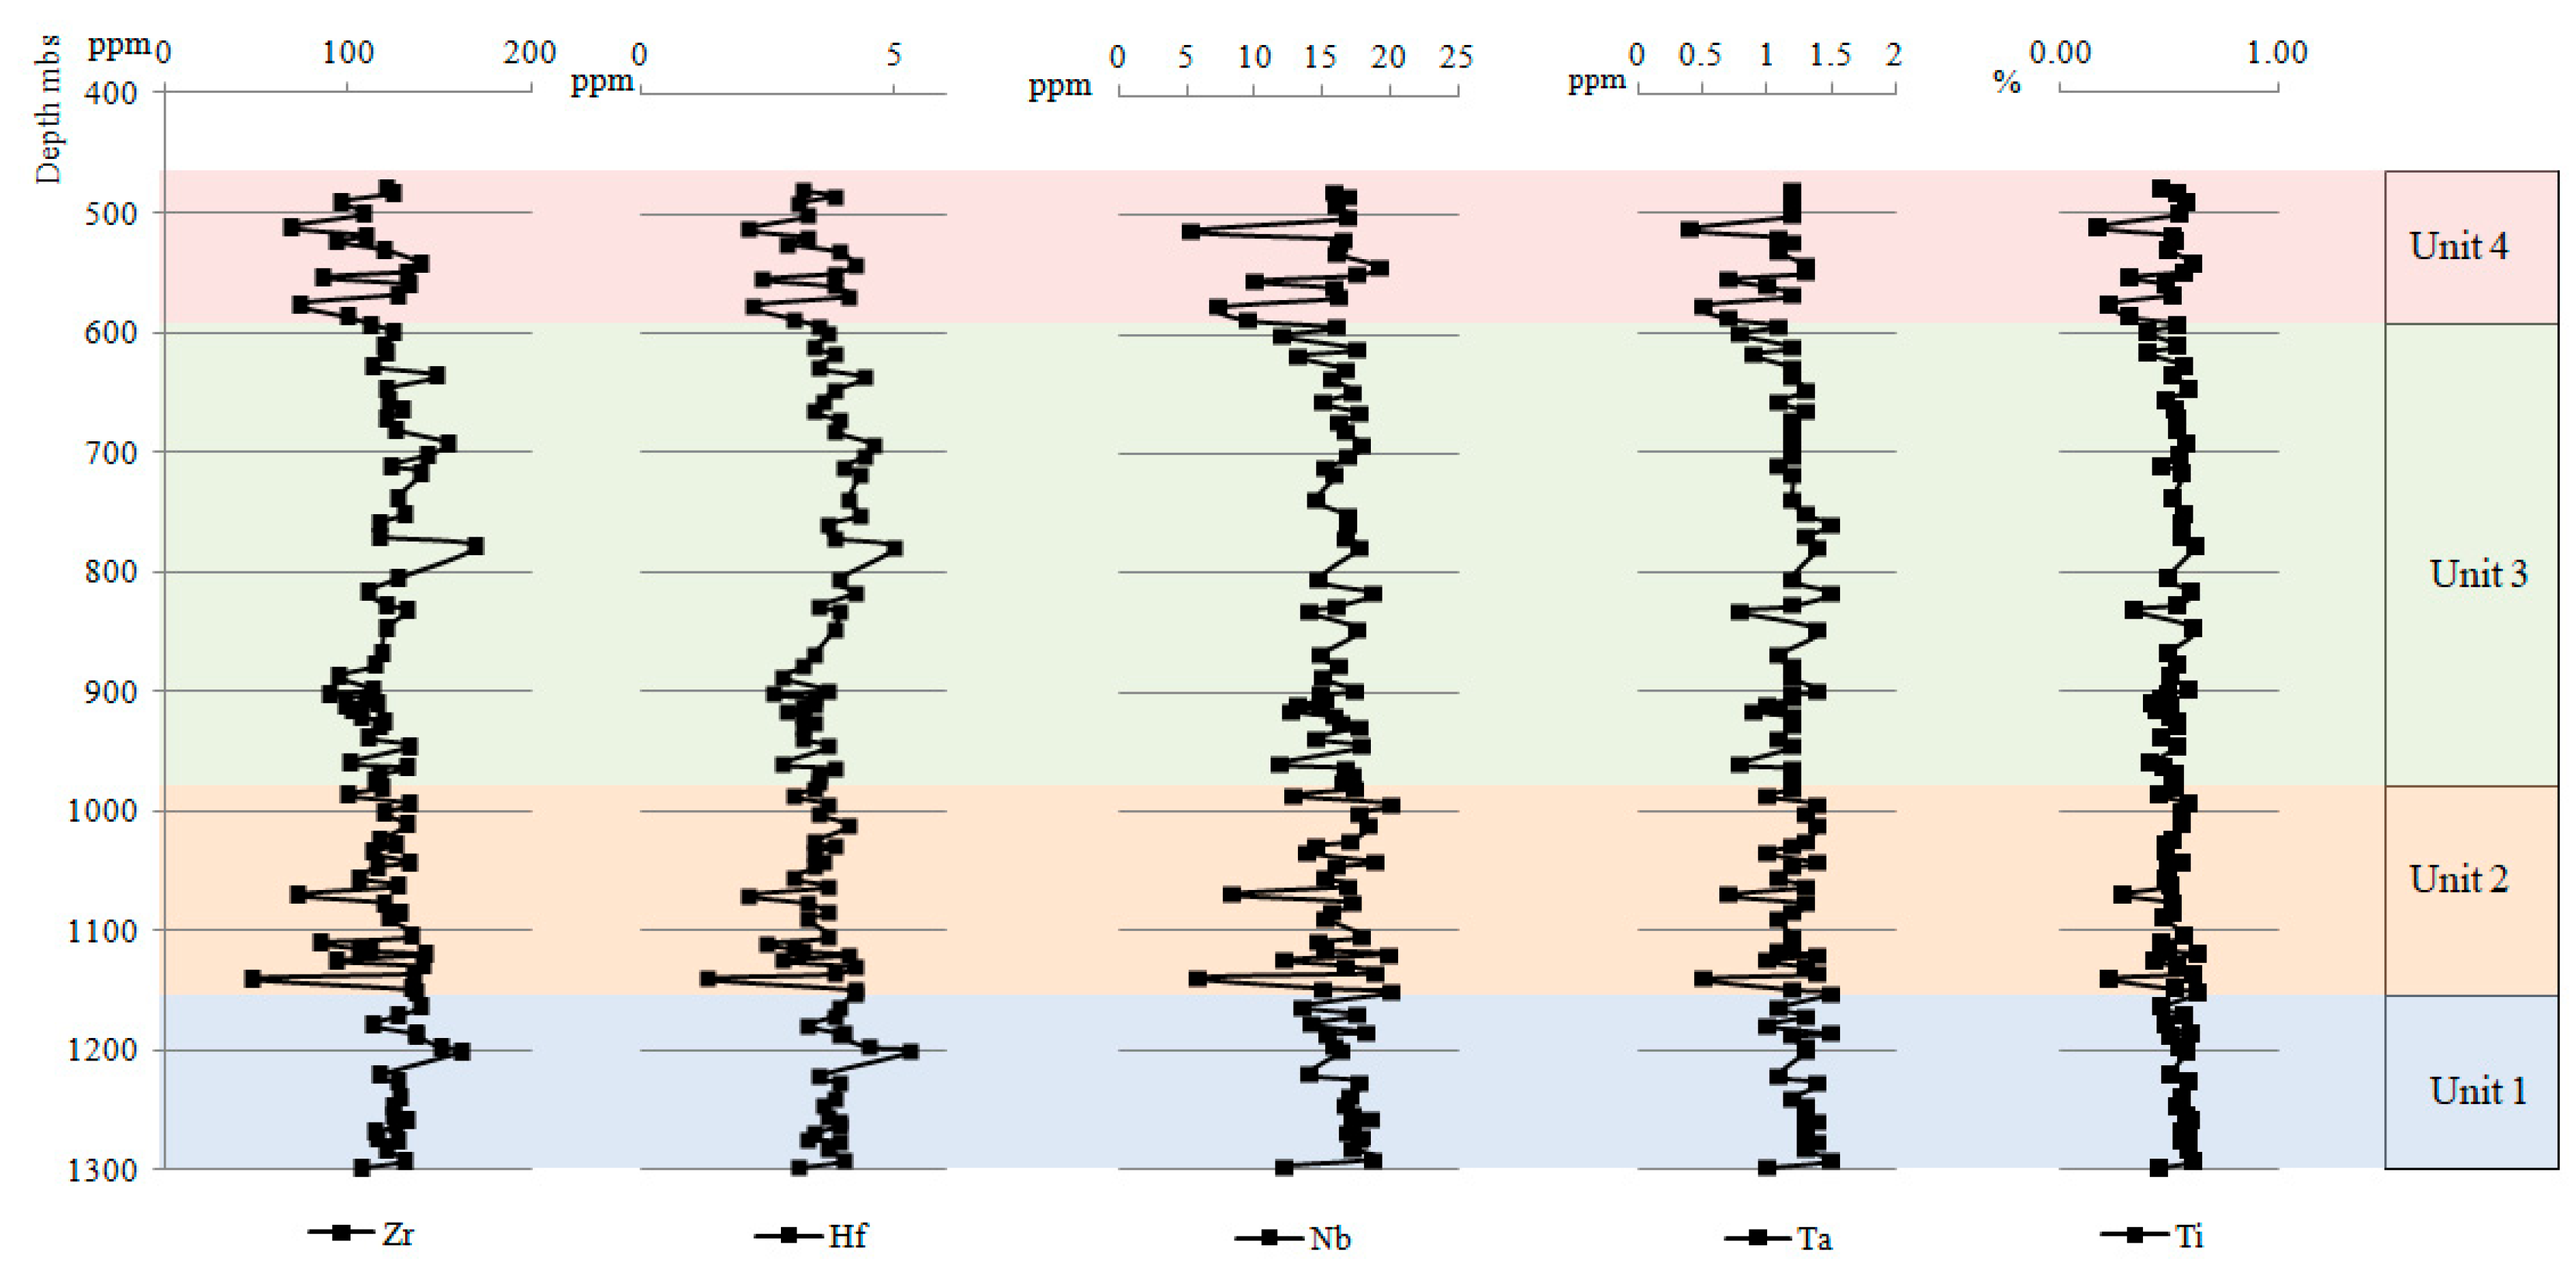
The vertical distributions of Zr, Hf, Nb, Ta, and Ti for claystones and siltstones were analyzed and are presented in Figure 16.
The distribution of Zr and Hf in the profile showed exactly the same pattern of variation. In Units 1 and 3, enrichment of these elements was present, while in Units 2 and 4, depletion of Hr and Zr was much more common. Analyzing the vertical variability of the concentrations of elements such as Nb, Ta, and Ti, similar trends were found as those observed for Hf and Zr. Units 1 and 3 were characterized by relatively low variability in the Nb, Ta, and Ti contents, while within Unit 2 and Unit 4, significant losses of these elements were observed. It is important to note that levels with lower terrigenous input within Unit 2 and Unit 4 also exhibited a higher content of Fe, Ca, and Mg, which are linked to carbonate minerals, mainly siderite (Table 4).
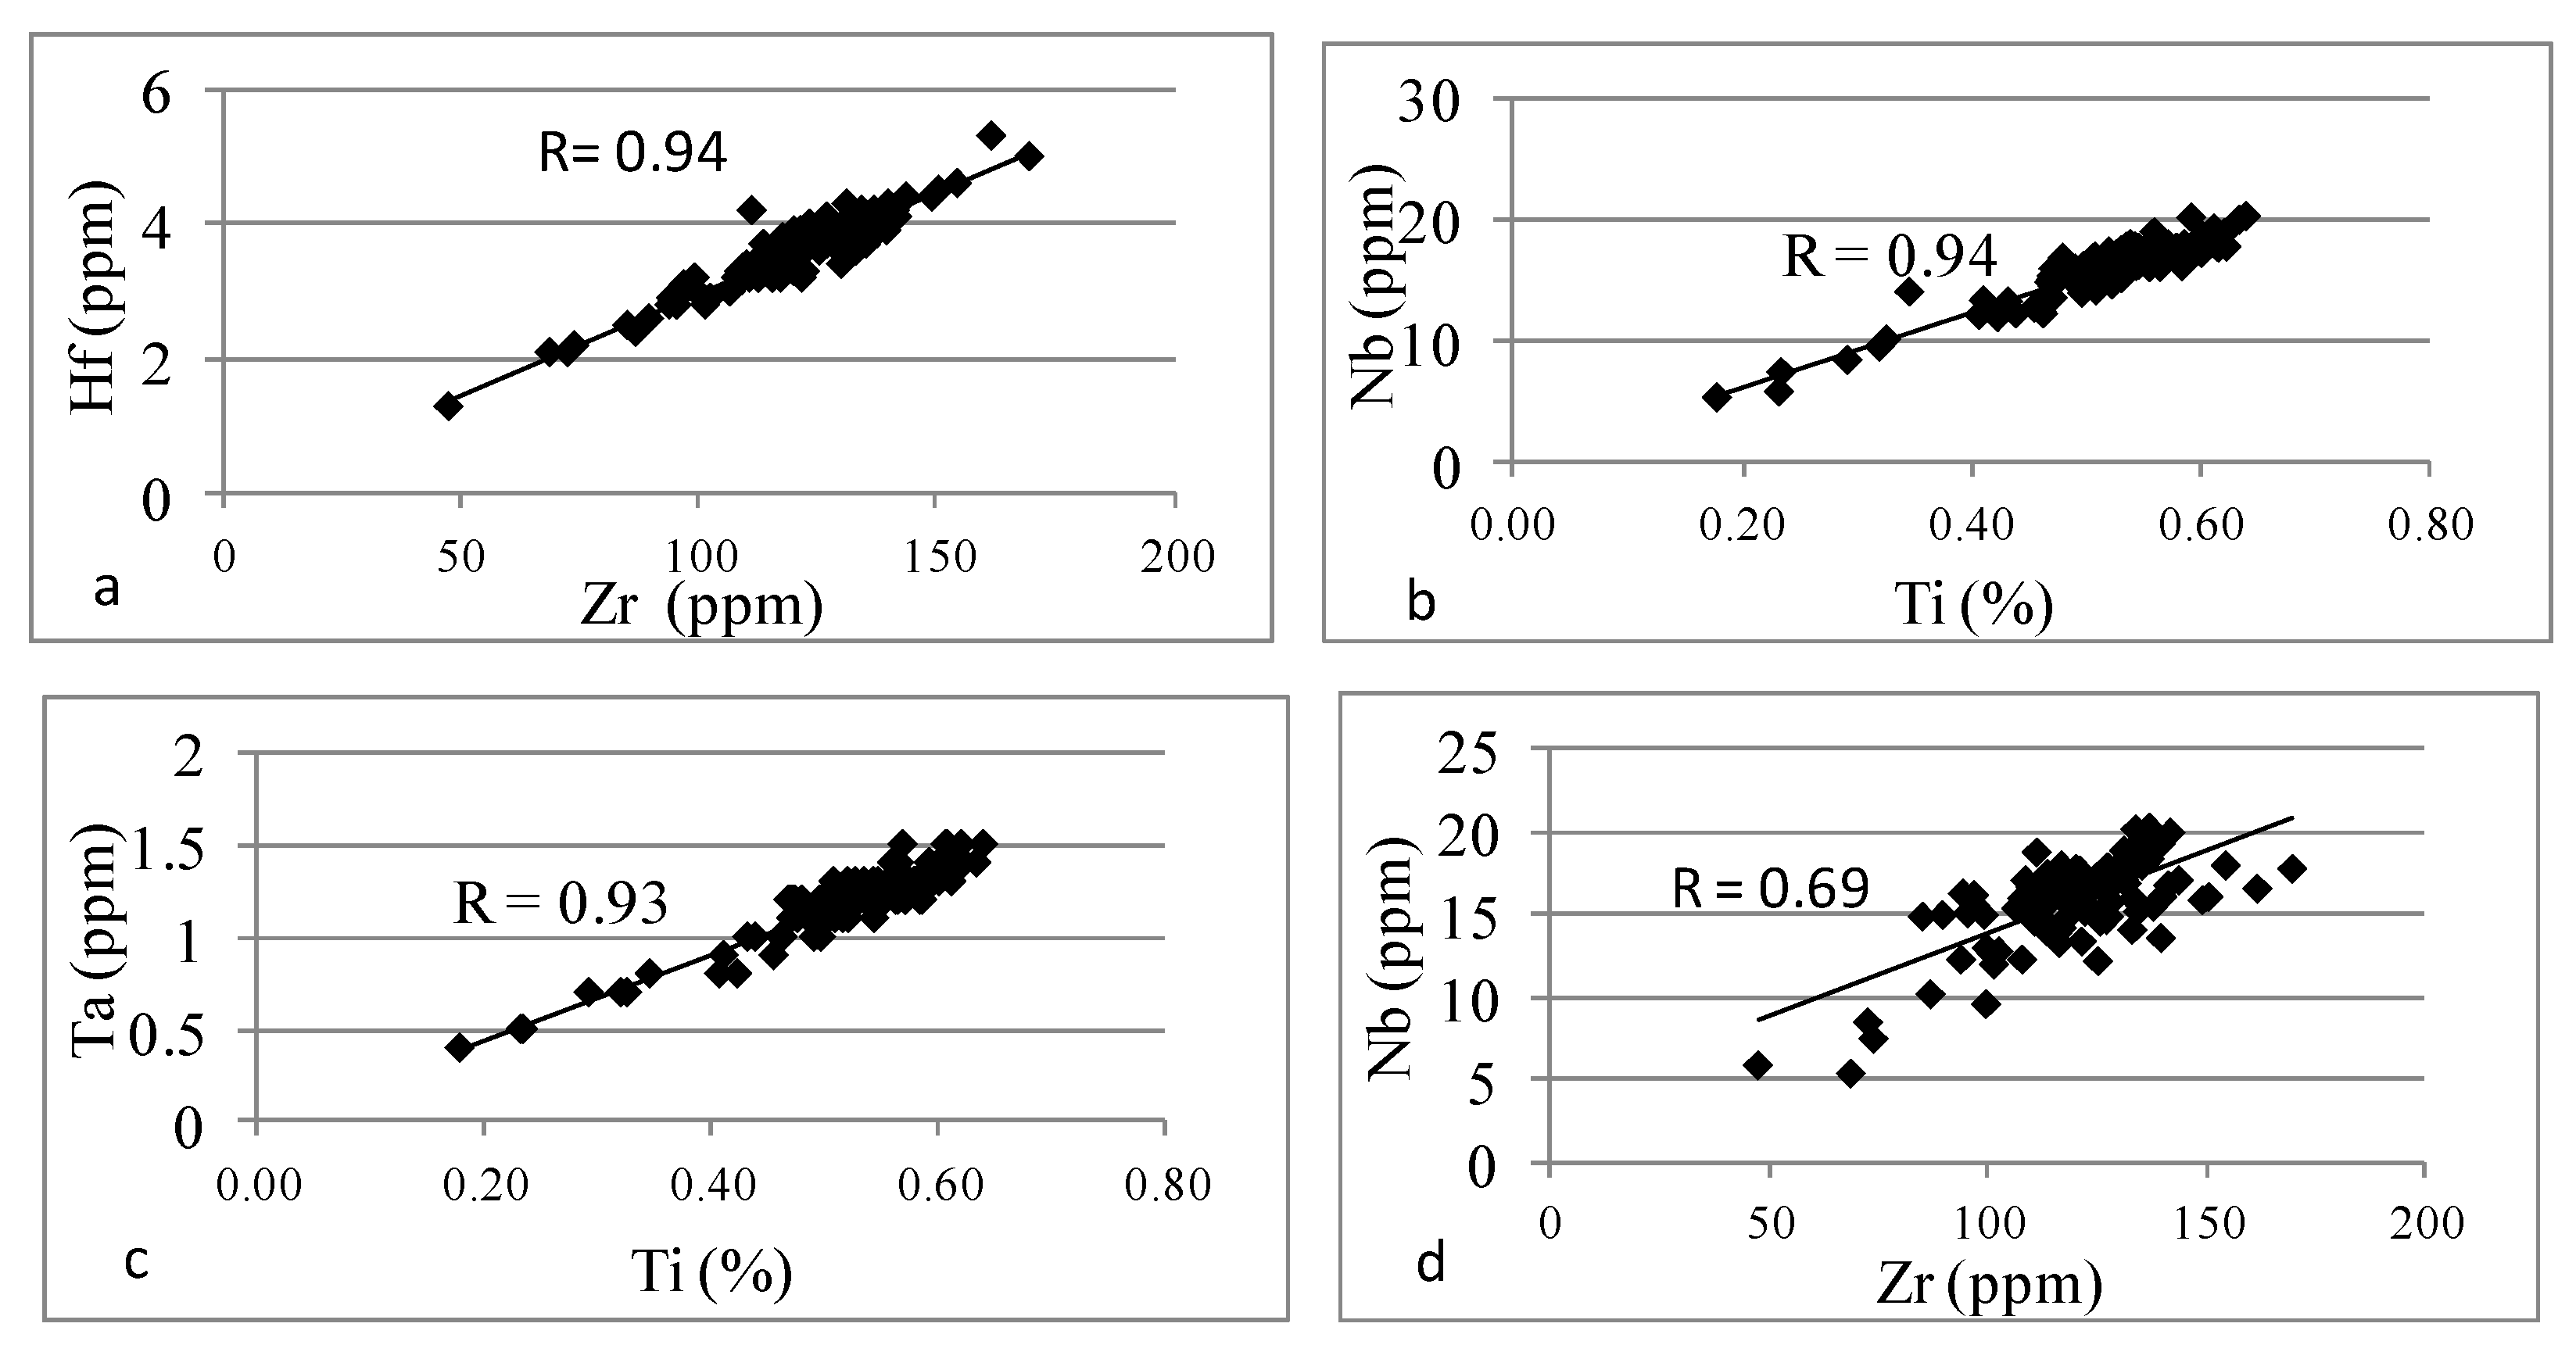
Additionally, an exceptionally strong positive correlation between Zr and Hf (R = 0.94) (Figure 17a) was found. This is explained by the fact that these elements are strongly associated with zircon. Similar correlations were reported from the Carboniferous of other European Coal Basins [9,12,13,15,16]. Moreover, very strong positive correlations were observed for Ti vs. Nb (R = 0.94) and Ti vs. Ta (R = 0.93) (Figure 17b,c). This suggests those elements were concentrated in the same heavy mineral(s), though the precise mineralogical affinities cannot be established by graphical/statistical analysis alone. On the other hand, moderately developed positive trends were observed in Zr vs. Nb (R = 0.69), which may indicate that Zr and Nb were linked with different heavy minerals (Figure 17d).

5. Conclusions

  • The geochemical record from the profile of the Mudstone Series shows changes in the concentration of major elements and selected trace elements, leading to the identification of four chemostratigraphic units. These units differ primarily in the content of Fe, Ca, Mg, Mn, and P as well as their different relationships.
  • Unit 2 and Unit 4 demonstrated an enrichment with elements such as Fe, Ca, and Mg, which are associated with carbonate minerals, while Unit 1 and Unit 3 demonstrated an enrichment with Zr, Hf, Nb, Ta, and Ti associated with the presence of heavy minerals.
  • Studies of silica origin showed that, in Unit 2 and Unit 4, terrigenous quartz was a primary source of silica, while in Unit 1 and Unit 3, different sources of silica were observed.
  • Based on indicators such as Al2O3/TiO2, TiO2/Zr, and La/Th, it can be concluded that all analyzed samples were possibly derived from felsic to intermediate igneous rocks; only the Th/Sc ratio suggested a mixed sediment source.
  • Paleoenvironmental analyses, based on V/Cr, Ni/Co, U/Th, (Cu+Mo)/Zn, and Sr/Ba, indicated an oxic, freshwater depositional environment.
  • Chemostratigraphy was used for the first time in the study of the Carboniferous coal-bearing series of the USCB, concluding that it can be used as an effective stratigraphic tool providing new information on the possibility of correlating barren sequences of the coal-bearing succession.

Funding

This research received no external funding.

Data Availability Statement

The data presented in this study are available on request from the corresponding author. The data are not publicly available due to author do not have permission from the coal company to publish the full database.

Conflicts of Interest

The author declares no conflicts of interest.

References

  1. Mazurek, S.; Tymiński, M.; Malon, A.; Szuflicki, M. Mineral Resources of Poland; Polish Geological Institute—National Research Institute: Warsaw, Poland, 2022.
  2. European Commission. Study on the Critical Raw Materials for the EU 2023; Final Report; European Commission: Brussels, Belgium, 2023.
  3. Szuflicki, M.; Malon, A.; Tymiński, M. Balance of Mineral Deposits in Poland as of 31 December 2018; Geological Institute—National Research Institute: Warsaw, Poland, 2019.
  4. Kędzior, S.; Dreger, M. Methane occurrence, emissions and hazards in the Upper Silesian Coal Basin, Poland. Int. J. Coal Geol. 2019, 211, 103226. [Google Scholar] [CrossRef]
  5. Kędzior, S.; Dreger, M. Geological and Mining Factors Controlling the Current Methane Conditions in the Rydułtowy Coal Mine (Upper Silesian Coal Basin, Poland). Energies 2022, 15, 6364. [Google Scholar] [CrossRef]
  6. Kędzior, S.; Dreger, M. Time variability of methane extraction from hard coal deposits in the Upper Silesian Coal Basin (Poland) in relation to geological and mining conditions. J. Sustain. Min. 2023, 22, 2. [Google Scholar] [CrossRef]
  7. Kędzior, S.; Teper, L. Coal Properties and Coalbed Methane Potential in the Southern Part of the Upper Silesian Coal Basin, Poland. Energies 2023, 16, 3219. [Google Scholar] [CrossRef]
  8. Sechman, H.; Kotarba, M.J.; Kędzior, S.; Kochman, A.; Twaróg, A. Fluctuations in methane and carbon dioxide concentrations in the near-surface zone and their genetic characterization in abandoned and active coal mines in the SW part of the Upper Silesian Coal Basin, Poland. Int. J. Coal Geol. 2020, 227, 103529. [Google Scholar] [CrossRef]
  9. Craigie, N.W.; Pierre, B.; Ahmed, K. Chemostratigraphy and biostratigraphy of Devonian, Carboniferus and Permian sediments encountered in the eastern Saudi Arabia: An integrated approach to reservoir correlation. Mar. Pet. Geol. 2016, 72, 156–178. [Google Scholar] [CrossRef]
  10. Guo, W.; Zheng, M.; Liu, Z.; Shen, W.; Zhou, S.; Liang, P.; Chen, Y. Rock Physical Properties of Longmaxi Shale Gas Formation in South Sichuan Province, China. Minerals 2023, 13, 485. [Google Scholar] [CrossRef]
  11. Pearce, T.J.; Besly, B.M.; Wray, D.S.; Wright, D.K. Chemostratigraphy: A Method to Improve Interwell Correlation in Barren Sequences—A Case Study Using Onshore Duckmantian/Stephanian Sequences (West Midlands, U.K.). Sediment. Geol. 1999, 124, 197–220. [Google Scholar] [CrossRef]
  12. Pearce, T.J.; Mclean, D.; Wright, D.K.; Jeans, C.J.; Mearns, E.W. Stratigraphy of the Upper Carboniferous Schooner Formation, southern North Sea: Chemostratigraphy, mineralogy, palynology and Sm-Nd isotope analysis. In Carboniferous Hydrocarbon Geology: The Southern North Sea and Surrounding Onshore Areas; Collinson, J.D., Evans, D.J., Holliday, D.W., Jones, N.S., Eds.; Occasional Publications Series 7; Yorkshire Geological Society: York, UK, 2005; pp. 165–182. [Google Scholar]
  13. Pearce, T.J.; Martin, J.H.; Cooper, D.; Wray, D.S. Chemostratigraphy of Upper Carboniferous (Pennsylvanian) sequences from the southern North Sea (United Kingdom). In Modern Alternative Stratigraphic Techniques: Theory and Case Histories—Special Publication 94; Ratcliffe, K.T., Zaitlin, B.A., Eds.; SEPM (Society for Sedimentary Geology): Claremore, OK, USA, 2010; pp. 109–129. [Google Scholar]
  14. Playter, T.; Corlett, H.; Konhauser, H.; Robbins, L.; Rohais, S.; Crombez, V.; MacCormack, K.; Rokosh, D.; Prenoslo, D.; Furlong, C.M.; et al. Clinoform identification and correlation in fine grained sediments: A case study using the Triassic Montney Formation. Sedimentology 2018, 65, 263–302. [Google Scholar] [CrossRef]
  15. Ramkumar, M.; Alberti, M.; Fürsich, F.T. Chemostratigraphy of the Dhosa Oolite Member (Oxfordian), Kachchh Basin, western India: Implications for completeness of the stratigraphic record and correlation with global oolite peak. In Chemostratigraphy: Concepts, Techniques and Applications; Ramkumar, M., Ed.; Elsevier: Amsterdam, The Netherlands, 2015; pp. 309–340. [Google Scholar]
  16. Ramkumar, M.; Nagarajan, R.; Santosh, M. Advances in sediment geochemistry and chemostratigraphy for reservoir characterization. Energy Geosci. 2021, 2, 308–326. [Google Scholar] [CrossRef]
  17. Ratcliffe, K.; Playton, T.E.; Montgomery, P.; Wray, D.; Caulfield-Kerney, S.; Tohver, E.; Hocking, R.M.; Haines, P.; Kirschvink, J.; Yan, M. Using elemental chemostratigraphy on mid–late frasnian Platform-top successions from the lennard shelf outcrops, Canning basin, western Australia. In New Advances in Devonian Carbonates: Outcrop Analogues, Reservoirs and Chronostratigraphy; SEPM Special Publication; Playton, T.E., Kerans, C., Weissenberger, J.A.W., Eds.; SEPM: Claremore, OK, USA, 2017; pp. 319–331. [Google Scholar]
  18. Chen, Z.; Li, X.; Chen, H.; Duan, Z.; Qiu, Z.; Zhou, X.; Hou, Y. The Characteristics of Lithofacies and Depositional Model of Fine-Grained Sedimentary Rocks in the Ordos Basin, China. Energies 2023, 16, 2390. [Google Scholar] [CrossRef]
  19. Zhang, Y.; Li, R.; Xi, S.; Gao, J.; Chen, L.; Huang, H.; Zhao, B.; Khaled, A. Quartz Origins and Pleoenvronmental Controls on Organic Matter Accumulation of Marine Shale in the Ordovician Wulalike Formation, Northwestern Ordos Basin, China: Significance for Shale Gas Exploration. Energies 2023, 16, 5278. [Google Scholar] [CrossRef]
  20. Zhang, Z.; Huang, Y.; Ran, B.; Liu, W.; Li, X.; Wang, C. Chemostratigraphic Analysis of Wufeng and Longmaxi Formation in Changning, Sichuan, China: Achieved by Principal Component and Constrained Clustering Analysis. Energies 2021, 14, 7048. [Google Scholar] [CrossRef]
  21. Yin, S.; Zhang, Z.; Huang, Y. Geochemical Characteristics and Chemostratigraphic Analysis of Wufeng and Lower Longmaxi Shales, Southwest China. Minerals 2022, 12, 1124. [Google Scholar] [CrossRef]
  22. Wang, Q.; Huang, Y.; Zhang, Z.; Wang, C.; Li, X. Application of Chemical Sequence Stratigraphy to the Prediction of Shale Gas Sweet Spots in the Wufeng and Lower Longmaxi Formations within the Upper Yangtze Region. Minerals 2022, 12, 859. [Google Scholar] [CrossRef]
  23. Kombrink, H.; Van Os, B.J.H.; Van der Zwan, C.J.; Wong, T.E. Geochemistry of marineand lacustrine bands in the Upper Carboniferous of The Netherlands. Geol. Mijnb. Neth. J. Geosci. 2008, 87, 309–322. [Google Scholar] [CrossRef]
  24. Vöröš, D.; Geršlová, E.; Šimoníková, L.; Díaz-Somoano, M. Late Carboniferous palaeodepositional changes recorded by inorganic proxies and REE data from the coal-bearing strata: An example on the Czech part of the Upper Silesian Coal basin (USCB). J. Nat. Gas Sci. Eng. 2022, 107, 104789. [Google Scholar] [CrossRef]
  25. Kędzior, A.; Gradziński, R.; Doktor, M.; Gmur, D. Sedimentary history of a Mississippian to Pennsylvanian coal-bearing succession: An example from the Upper Silesia Coal Basin, Poland. Geol. Mag. 2007, 144, 487–496. [Google Scholar] [CrossRef]
  26. Bukowska, M.; Sanetra, U.; Wadas, M. Zonation of deposits of hard coals of different porosityin the Upper Silesian Coal Basin. Gospod. Surowcami Miner. Miner. Resour. Manag. 2016, 32, 5–24. [Google Scholar]
  27. Jureczka, J.; Kotas, A. Upper Silesian Coal Basin. In The Carboniferous System in Poland; Zdanowski, A., Żakowa, H., Eds.; Prace Państwowego Instytutu Geologicznego; Polish Geological Institute: Warsaw, Poland, 1995; Volume 148, pp. 164–173. [Google Scholar]
  28. Kokowska-Pawłowska, M. Petrographic and mineral variability of the rocks accompanying selected coal seams of the Poruba beds and their influence of the trace elements content. Miner. Resour. Manag. 2015, 31, 73–92. [Google Scholar]
  29. Parzentny, H.R.; Róg, L. Initial assessment of variability in the modes of occurrence of some trace elements in coal seams with vertical profiles in the Upper Silesian Coal Basin in Poland. Arch. Min. Sci. 2020, 65, 723–736. [Google Scholar]
  30. Morga, R. Structure of variability of phosphorus content in exploited seams of bituminous coal in the Pniówek Mine. Miner. Resour. Manag. 2007, 23, 29–48. [Google Scholar]
  31. Strzałkowska, E. Fly ash—A valuable material for the circular economy. Miner. Resour. Manag. 2021, 37, 49–62. [Google Scholar]
  32. Strzałkowska, E. Rare earth elements and other critical elements in the magnetic fraction of fly ash from several Polish power plants. Int. J. Coal Geol. 2022, 258, 104015. [Google Scholar] [CrossRef]
  33. Strzałkowska, E. Ashes qualified as a source of selected critical elements (REY, Co, Ga, V). Energies 2023, 16, 3331. [Google Scholar] [CrossRef]
  34. Kokowska-Pawłowska, M.; Krzeszowska, E. Toxic elements in carboniferous sedimentary rocks from the Upper Silesian Coal Basin. Miner. Resour. Manag. 2023, 39, 63–86. [Google Scholar]
  35. Krzeszowska, E.; Kokowska-Pawłowska, M.; Krzeszowski, Ś. Distribution of the selected critical elements in the Carboniferous coal-bearing series of the Upper Silesian Coal Basin and the Lublin Coal Basin (Poland). Acta Geol. Sin. Engl. Ed. 2022, 96, 273–292. [Google Scholar] [CrossRef]
  36. Kombrink, H. The Carboniferous of the Netherlands and surrounding areas; a basin analysis. Geol. Ultraiectina 2008, 294, 184. [Google Scholar]
  37. Szamałek, K.; Szuflicki, M.; Malon, A.; Tymiński, M. Mineral Resources of Poland; Geological Institute—National Research Institute: Warsaw, Poland, 2017.
  38. Ciesielczuk, J.; Fabiańska, M.J.; Misz-Kennan, M.; Jura, D.; Filipiak, P.; Matuszewska, A. The Disappearance of Coal Seams Recorded in Associated Gangue Rocks in the SW Part of the Upper Silesian Coal Basin, Poland. Minerals 2021, 11, 735. [Google Scholar] [CrossRef]
  39. Bielowicz, B. Selected Critical Raw Materials in Waste from Coal Gasification in Poland. Energies 2021, 14, 8071. [Google Scholar] [CrossRef]
  40. Koteras, A.; Chećko, J.; Urych, T.; Magdziarczyk, M.; Smoliński, A. An Assessment of the Formations and Structures Suitable for Safe CO2 Geological Storage in the Upper Silesia Coal Basin in Poland in the Context of the Regulation Relating to the CCS. Energies 2020, 13, 195. [Google Scholar] [CrossRef]
  41. Sutkowska, K.; Teper, L.; Czech, T.; Walker, A. Assessment of the Condition of Soils before Planned Hard Coal Mining in Southern Poland: A Starting Point for Sustainable Management of Fossil Fuel Resources. Energies 2023, 16, 737. [Google Scholar] [CrossRef]
  42. Wetzel, M.; Otto, C.; Chen, M.; Masum, S.; Thomas, H.; Urych, T.; Bezak, B.; Kempka, T. Hydromechanical Impacts of CO2 Storage in Coal Seams of the Upper Silesian Coal Basin (Poland). Energies 2023, 16, 3279. [Google Scholar] [CrossRef]
  43. Heckel, P.H.; Clayton, G. The carboniferous system. Use of the new official names for the subsystems, series, and stages. Geol. Acta 2006, 4, 403–407. [Google Scholar]
  44. Wang, X.; Hu, K.; Qie, W.; Sheng, Q.; Chen, B.; Lin, W.; Yao, L.; Wang, Q.; Qi, Y.; Chen, J.; et al. Carboniferous integrative stratigraphy and timescale of China. Science China. Earth Sci. 2019, 62, 135–153. [Google Scholar]
  45. Sprague, R.A.; Melvin, J.A.; Conradi, F.G.; Pearce, T.J.; Dix, M.A.; Hill, S.D.; Canham, H. Integration of Core-based Chemostratigraphy and Petrography of the Devonian Jauf Sandstones, Uthmaniya Area, Ghawar Field, Eastern Saudi Arabia. AAPG Search Discov. 2009, 34, 20065. [Google Scholar]
  46. Chen, M.; Nie, F.; Xia, F.; Yan, Z.; Yang, D. Provenance, Sedimentary Environment, Tectonic Setting, and Uranium Mineralization Implications of the Yaojia Formation, SW Songliao Basin, NE China. Minerals 2023, 13, 1053. [Google Scholar] [CrossRef]
  47. Metz Metzger, J.G.; Fike, D.A.; Smith, L.B. Applying carbon-isotope stratigraphy using well cuttings for high-resolution chemostratigraphic correlation of the subsurface. AAPG Am. Assoc. Pet. Geol. Bull. 2014, 98, 1551–1576. [Google Scholar] [CrossRef]
  48. Wright, A.M.; Spain, D.; Ratcliffe, K.T. Application of inorganic whole rock geochemistry of shale resource plays. In Proceedings of the Canadian Unconventional Resources and International Petroleum Conference, Calgary, AB, Canada, 19–21 October 2010. [Google Scholar]
  49. Cai, Y.; Ouyang, F.; Luo, X.; Zhang, Z.; Wen, M.; Luo, X.; Tang, R. Geochemical Characteristics and Constraints on Provenance, Tectonic Setting, and Paleoweathering of Middle Jurassic Zhiluo Formation Sandstones in the Northwest Ordos Basin, North-Central China. Minerals 2022, 12, 603. [Google Scholar] [CrossRef]
  50. Hayashi, K.; Fujisawa, H.; Holland, H.; Ohmoto, H. Geochemistry of ~1.9 Ga sedimentary rocks from northeastern Labrador, Canada. Geochim. Cosmochim. Acta 1997, 61, 4115–4137. [Google Scholar] [CrossRef]
  51. Cullers, R.L. The geochemistry of shales, siltstones and sandstones of Pennsylvanian-Permian age, Colorado, USA: Implications for provenance and metamorphic studies. Lithos 2000, 51, 305–327. [Google Scholar] [CrossRef]
  52. Cullers, R.L. Implications of elemental concentrations for provenance, redox conditions, and metamorphic studies of shales and limestones near Pueblo, CO, USA. Chem. Geol. 2002, 191, 305–327. [Google Scholar] [CrossRef]
  53. Harnois, L. The CIW index: A new chemical index of weathering. Sediment. Geol. 1988, 55, 319–322. [Google Scholar] [CrossRef]
  54. Makoundi, C.; Endut, Z.; Zaw, K. Geochemistry of the Devonian and Permo-Triassic Black Shales in Peninsular Malaysia: Insights into Provenance, Tectonic Setting, and Source Rock Weathering. Minerals 2023, 13, 911. [Google Scholar] [CrossRef]
  55. Phillips, O.A.; Falana, A.O.; Adebayo, A.J. The geochemical composition of sediment as a proxy of provenance and weathering intensity: A case study of Southwest nigeria’s coastal creeks geology. Geophys. Environ. 2017, 43, 229–248. [Google Scholar] [CrossRef]
  56. Qi, L.; Wang, H.; Shi, Z.; Zhou, T.; Li, G.; Sun, S.; Cheng, F. Mineralogical and Geochemica Chaacteristics of the Deeply Buried Wufeng–Longmaxi Shale in the Southern Sichuan Basin, China: Implications for Provenance and Tectonic Setting. Minerals 2023, 13, 1502. [Google Scholar] [CrossRef]
  57. McLennan, S.M. Rrare earth elements in sedimentary rocks. influence of provenance and sedimentary processes. Rev. Mineral. 1989, 21, 169–200. [Google Scholar]
  58. McLennan, S.M. Weathering and global denudation. J. Geol. 1993, 101, 295–303. [Google Scholar] [CrossRef]
  59. McLennan, S.M.; Hemming, S.; McDaniel, D.K.; Hanson, G.M. Geochemical approaches to sedimentation, provenance, and tectonics. In Processes Controlling the Composition of Clastic Sediments; Johnsson, M.J., Basu, A., Eds.; GSA Special Papers; Geological Society of America: Boulder, CO, USA, 1993; Volume 284, pp. 21–40. [Google Scholar]
  60. Armstrong-Altrin, J.S.; Pandarinath, K.; Verma, S.K. Geochemical Treasures and Petrogenetic Processes; Springer: Berlin/Heidelberg, Germany, 2022. [Google Scholar]
  61. Taylor, S.R.; McLennan, S.H. The Continental Crust: Its Composition and Evolution; Blackwell: Oxford, UK, 1985. [Google Scholar]
  62. Algeo, T.J.; Maynard, J.B. Trace element behavior and redox facies in core shales of Upper Pennsylvanian Kansas type cyclothems. Chem. Geol. 2004, 206, 289–318. [Google Scholar] [CrossRef]
  63. Algeo, T.J.; Maynard, J.B. Trace-metal covariation as a guide to water mass conditions in ancient anoxic marine environments. Geosphere 2008, 4, 872–887. [Google Scholar] [CrossRef]
  64. Jones, B.; Manning, D. Comparison of geochemical indices used for the interpretation of palaeoredox conditions in ancient mudstones. Chem. Geol. 1994, 111, 111–129. [Google Scholar] [CrossRef]
  65. Rimmer, S.M.; Thompson, J.A.; Goodnight, S.A.; Robl, T.L. Multiple controls on the preservation of organic matter in Devonian-Mississippian marine black shales: Geochemical and petrographic evidence. Palaeogeogr. Palaeoclimatol. Palaeoecol. 2004, 215, 125–154. [Google Scholar] [CrossRef]
  66. Yao, Z.; Yu, H.; Yang, F.; Jianatayi, D.; Zhang, B.; Li, T.; Jia, C.; Pan, T.; Zhang, Z.; Aibibuli, N.; et al. Provenance, Depositional Environment, and Paleoclimatic Conditions of a Near-Source Fan Delta: A Case Study of the Permian Jiamuhe Formation in the Shawan Sag, Junggar Basin. Minerals 2023, 13, 1251. [Google Scholar] [CrossRef]
  67. Pattan, J.N.; Pearce, N.J.G.; Mislankar, P.G. Constrains in using cerium-anomaly of bulk sediments as an indicator of paleo bottom water redox environment: A case study from the Central Indian Ocean Basin. Chem. Geol. 2005, 221, 260–278. [Google Scholar] [CrossRef]
  68. Hallberg, R.O. A geochemical method for investigation of paleoredox conditions in sediments. Ambio Spec. Rep. 1976, 4, 139–147. [Google Scholar]
  69. Mange, M.A.; Morton, A.C. Geochemistry of heavy minerals. Dev. Sedimentol. 2007, 58, 345–391. [Google Scholar]
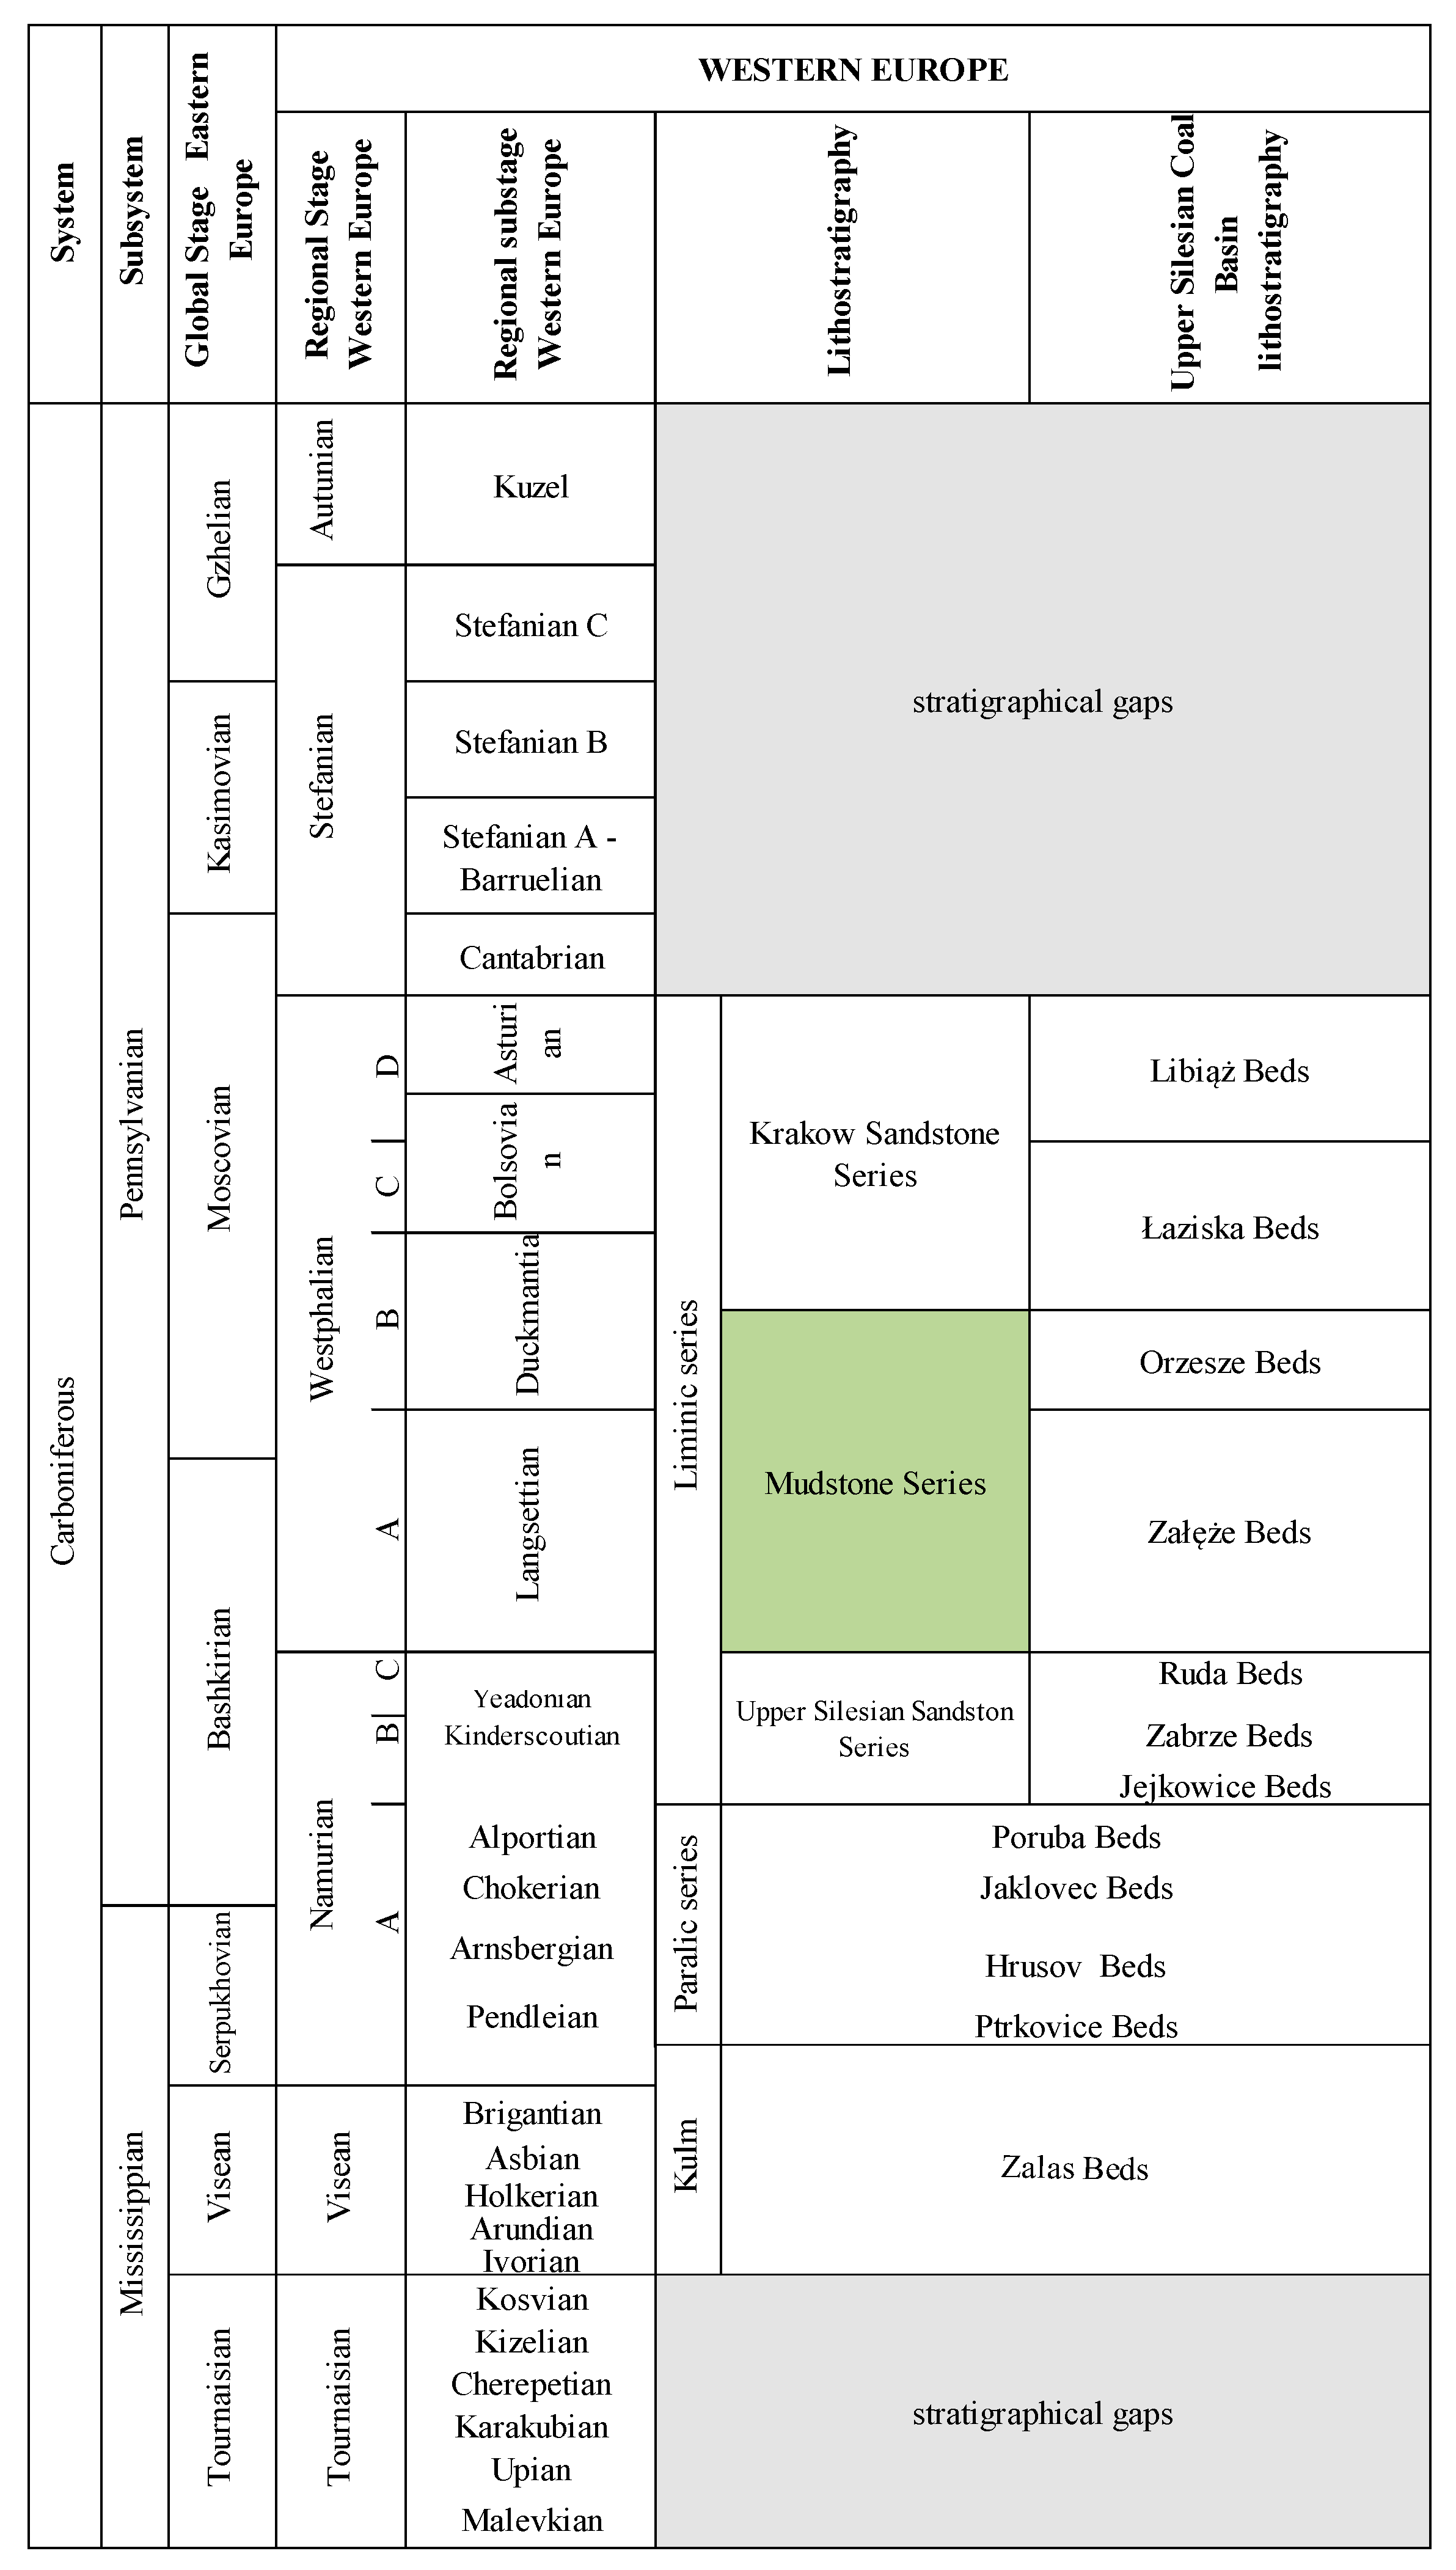
Figure 1. Lithostratigraphic division of the Carboniferous succession of Western Europe, North America, and China (A, B, C, D are part of the stages from older to younger, respectively) (simplified [27,35,43,44]).
Energies 17 00642 g001
Figure 2. Location of the study area (modified [34]).
Energies 17 00642 g002
Figure 3. Stratigraphical variability of the lithological types for the borehole WS within the Mudstone Series of the USCB. Explanations: C, claystones; S, siltstones; As, argillaceous sandstones; Sa, sandstones.
Energies 17 00642 g003
Figure 4. Major element geochemical profiles of the Mudstone Series from the borehole WS and chemostratigraphic zonation of the profile.
Energies 17 00642 g004
Figure 5. Average, minimum, and maximum values for the selected major elements within the chemostratigraphic units.
Energies 17 00642 g005
Figure 6. Correlation diagrams of SiO2 with TiO2 for the samples from Unit 1 and Unit 3 (a) and Unit 2 and Unit 4 (b).
Energies 17 00642 g006
Figure 7. Correlation diagrams of SiO2 with Al2O3 for the samples from Unit 1 and Unit 3 (a) and Unit 2 and Unit 4 (b).
Energies 17 00642 g007
Figure 8. Correlation diagrams of K2O with Al2O3 for the samples from Unit 1 and Unit 3 (a) and Unit 2 and Unit 4 (b).
Energies 17 00642 g008
Figure 9. Correlation diagrams of CaO with Fe2O3 for the samples from Unit 1 and Unit 3 (a) and Unit 2 and Unit 4 (b).
Energies 17 00642 g009
Figure 10. Correlation diagrams of SiO2 with Fe2O3 for the samples from Unit 1 and Unit 3 (a) and Unit 2 and Unit 4 (b).
Energies 17 00642 g010
Figure 11. Crossplot of Al2O3 vs. TiO2 for the samples from Unit 1 and Unit 3 (a) and Unit 2 and Unit 4 (b).
Energies 17 00642 g011
Figure 12. Crossplot of TiO2 vs. Zr for the samples from Unit 1 and Unit 3 (a) and Unit 2 and Unit 4 (b).
Energies 17 00642 g012
Figure 13. Crossplot of La vs. Th for the samples from Unit 1 and Unit 3 (a) and Unit 2 and Unit 4 (b).
Energies 17 00642 g013
Figure 14. Crossplot of Th vs. Sc for the samples from Unit 1 and Unit 3 (a) and Unit 2 and Unit 4 (b).
Energies 17 00642 g014
Figure 15. Crossplot of Ni/Co vs. V/Cr (a) and of U/Th vs. (Cu+Mo)/Zn (b) for the analyzed samples.
Energies 17 00642 g015
Figure 16. The vertical distributions of Zr, Hf, Nb, Ta, Ti in the profile of the Mudstone Series from the borehole WS.
Energies 17 00642 g016
Figure 17. Relationship between selected trace elements Zr vs. Hf (a), Ti vs. Nb (b), Ti vs. Ta (c), and Zr vs. Nb (d).
Energies 17 00642 g017
Table 1. Chemical classification of the siliciclastic rocks [45].
SiO2/Al2O3<4Fe2O3 < 10%Claystones
SiO2/Al2O34–6Siltstones
SiO2/Al2O36–10Argillaceous sandstone
SiO2/Al2O3>10Sandstones
SiO2/Al2O3<4Fe2O3 > 10%Fe-rich claystone
SiO2/Al2O34–6Fe-rich siltstone
SiO2/Al2O36–10Fe-rich argillaceous sandstone
SiO2/Al2O3>10Fe-rich sandstone
SiO2/Al2O3>10MgO > 5%Dolomitic sandstone
Table 2. Major element contents of the Mudstone Series of the USCB.
Major OxidesDetection LevelClaystones and SiltstonesSandstones
Average (n = 106)Max.Min.SDAverage (n = 15)Max.Min.SD
SiO2 (%)0.0157.569.823.57.581.790.270.25.9
Al2O3 (%)0.0120.327.38.63.67.511.74.71.9
Fe2O3 (%)0.045.332.91.05.22.88.21.11.8
CaO (%)0.010.221.780.060.260.301.200.070.28
MgO (%)0.011.476.790.760.940.681.860.170.48
Na2O (%)0.010.571.110.280.200.571.070.250.21
K2O (%)0.013.265.691.560.701.682.220.940.39
P2O5 (%)0.010.120.720.040.100.050.100.020.02
MnO (%)0.010.070.350.010.070.050.140.010.03
Cr2O3 (%)0.0020.020.020.010.000.010.030.000.01
TiO2 (%)0.010.991.260.440.150.340.630.130.14
Table 3. The values of the correlation coefficient (R) for selected major elements.
ElementUnit 1 Unit 1 Unit 2Unit 3Unit 4
SiSi vs. Ti−0.560.80−0.510.89
Si vs. Al−0.800.58−0.770.62
Si vs. Fe0.00−0.89−0.11−0.88
KK vs. Al.0.700.760.660.61
FeFe vs. Ca0.790.870.270.89
Fe vs. Mg0.440.930.620.97
Fe vs. P0.610.760.040.72
Fe vs. Mn0.940.920.920.99
CaCa vs. Mg0.490.940.010.93
Table 4. A summary of the main geochemical features of the chemostratigraphic units.
UnitDepth Chemical CompositionRelationship between Selected Major ElementsProvenanceRedox ConditionsTrace Elements
Si vs. TiSi vs. AlAl. vs. KFe vs. Ca Fe vs. MgFe vs. PFe vs. MnCa vs. MgAl2O3/TiO2 La/Th Th/ScTiO2/Zr Th/LaV/Cr U/Th (Cu+Mo)/Zn Ni/CoZr, Hf, Nb, Ta, Ti
Unit 4585–481 mlevels enriched in Fe, Ca, Mg, Mn, and P strong positive moderate positive moderate positive strong positive strong positive strong positive strong positive strong positive inter felsicmafic inter inter mostly inter felsic oxicoxicdepletion
Unit 3985–585 mgeochemical homogeneity moderate negative strong negative moderate positive nonemoderate positive nonestrong positive noneinter felsic inter felsic inter mostly inter felsic oxicoxic dysoxicenrichment
Unit 2 1145–985 mlevels enriched in Fe, Ca, Mg, Mn, and P strong positive moderate positive moderate positive strong positive strong positive strong positive strong positive strong positive inter felsic mafic inter inter mostly inter felsic oxicoxic dysoxicdepletion
Unit 1 1298–1145 mgeochemical homogeneity moderate negative strong negative moderate positive strong positive weak positivemoderate positive strong positive weak positiveinter felsic mafic inter felsic inter inter felsic oxicoxicenrichment
Table 5. Selected trace contents of the Mudstone Series of the USCB.
Trace ElementDetection LevelClaystones and SiltstonesSandstones
Average (n = 106)Max.Min.SDAverage (n = 15)Max.Min.SD
Zr (ppm)0.01119.7169.547.418.463.693.929.623.0
Hf (ppm)0.013.565.301.300.591.872.800.900.68
Ti (%)0.0010.520.640.180.080.160.330.060.07
Nb (ppm)0.0115.8120.205.302.664.448.502.001.96
Ta (ppm)0.011.181.500.400.210.360.700.100.16
Disclaimer/Publisher’s Note: The statements, opinions and data contained in all publications are solely those of the individual author(s) and contributor(s) and not of MDPI and/or the editor(s). MDPI and/or the editor(s) disclaim responsibility for any injury to people or property resulting from any ideas, methods, instructions or products referred to in the content.