
Chemostratigraphic Approach to the Study of Resources’ Deposit in the Upper Silesian Coal Basin (Poland)


Abstract
1. Introduction
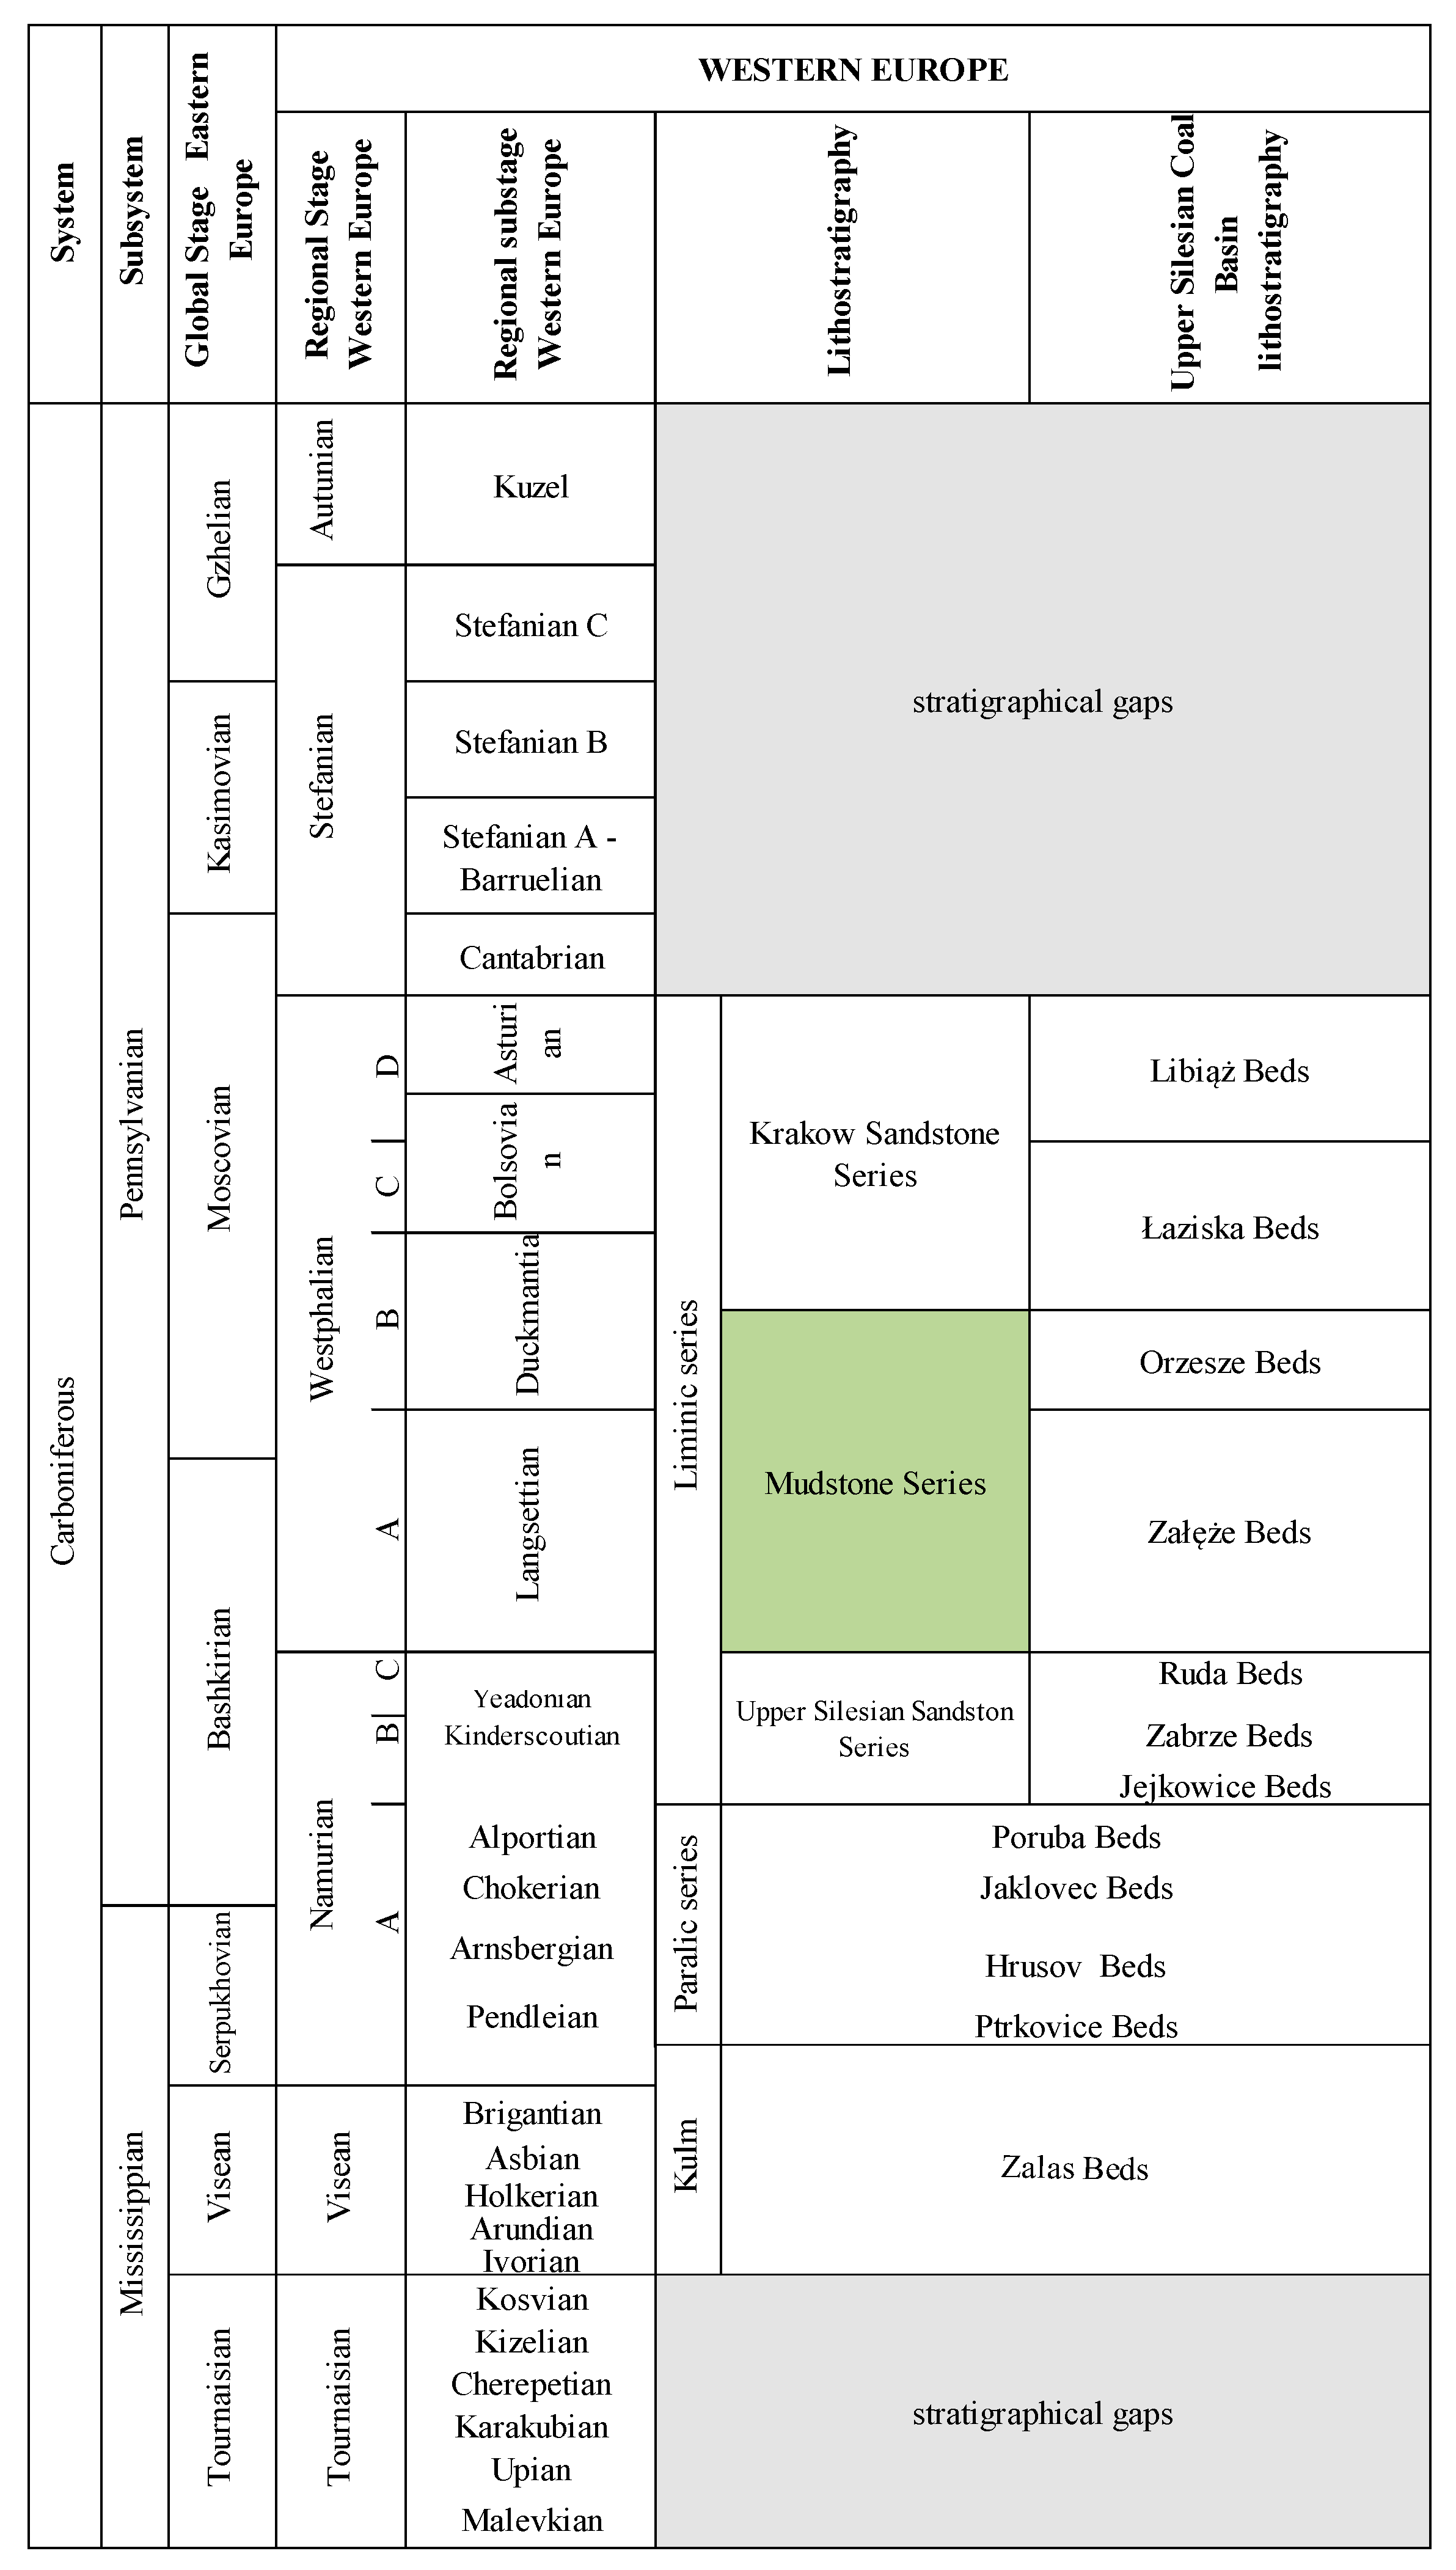
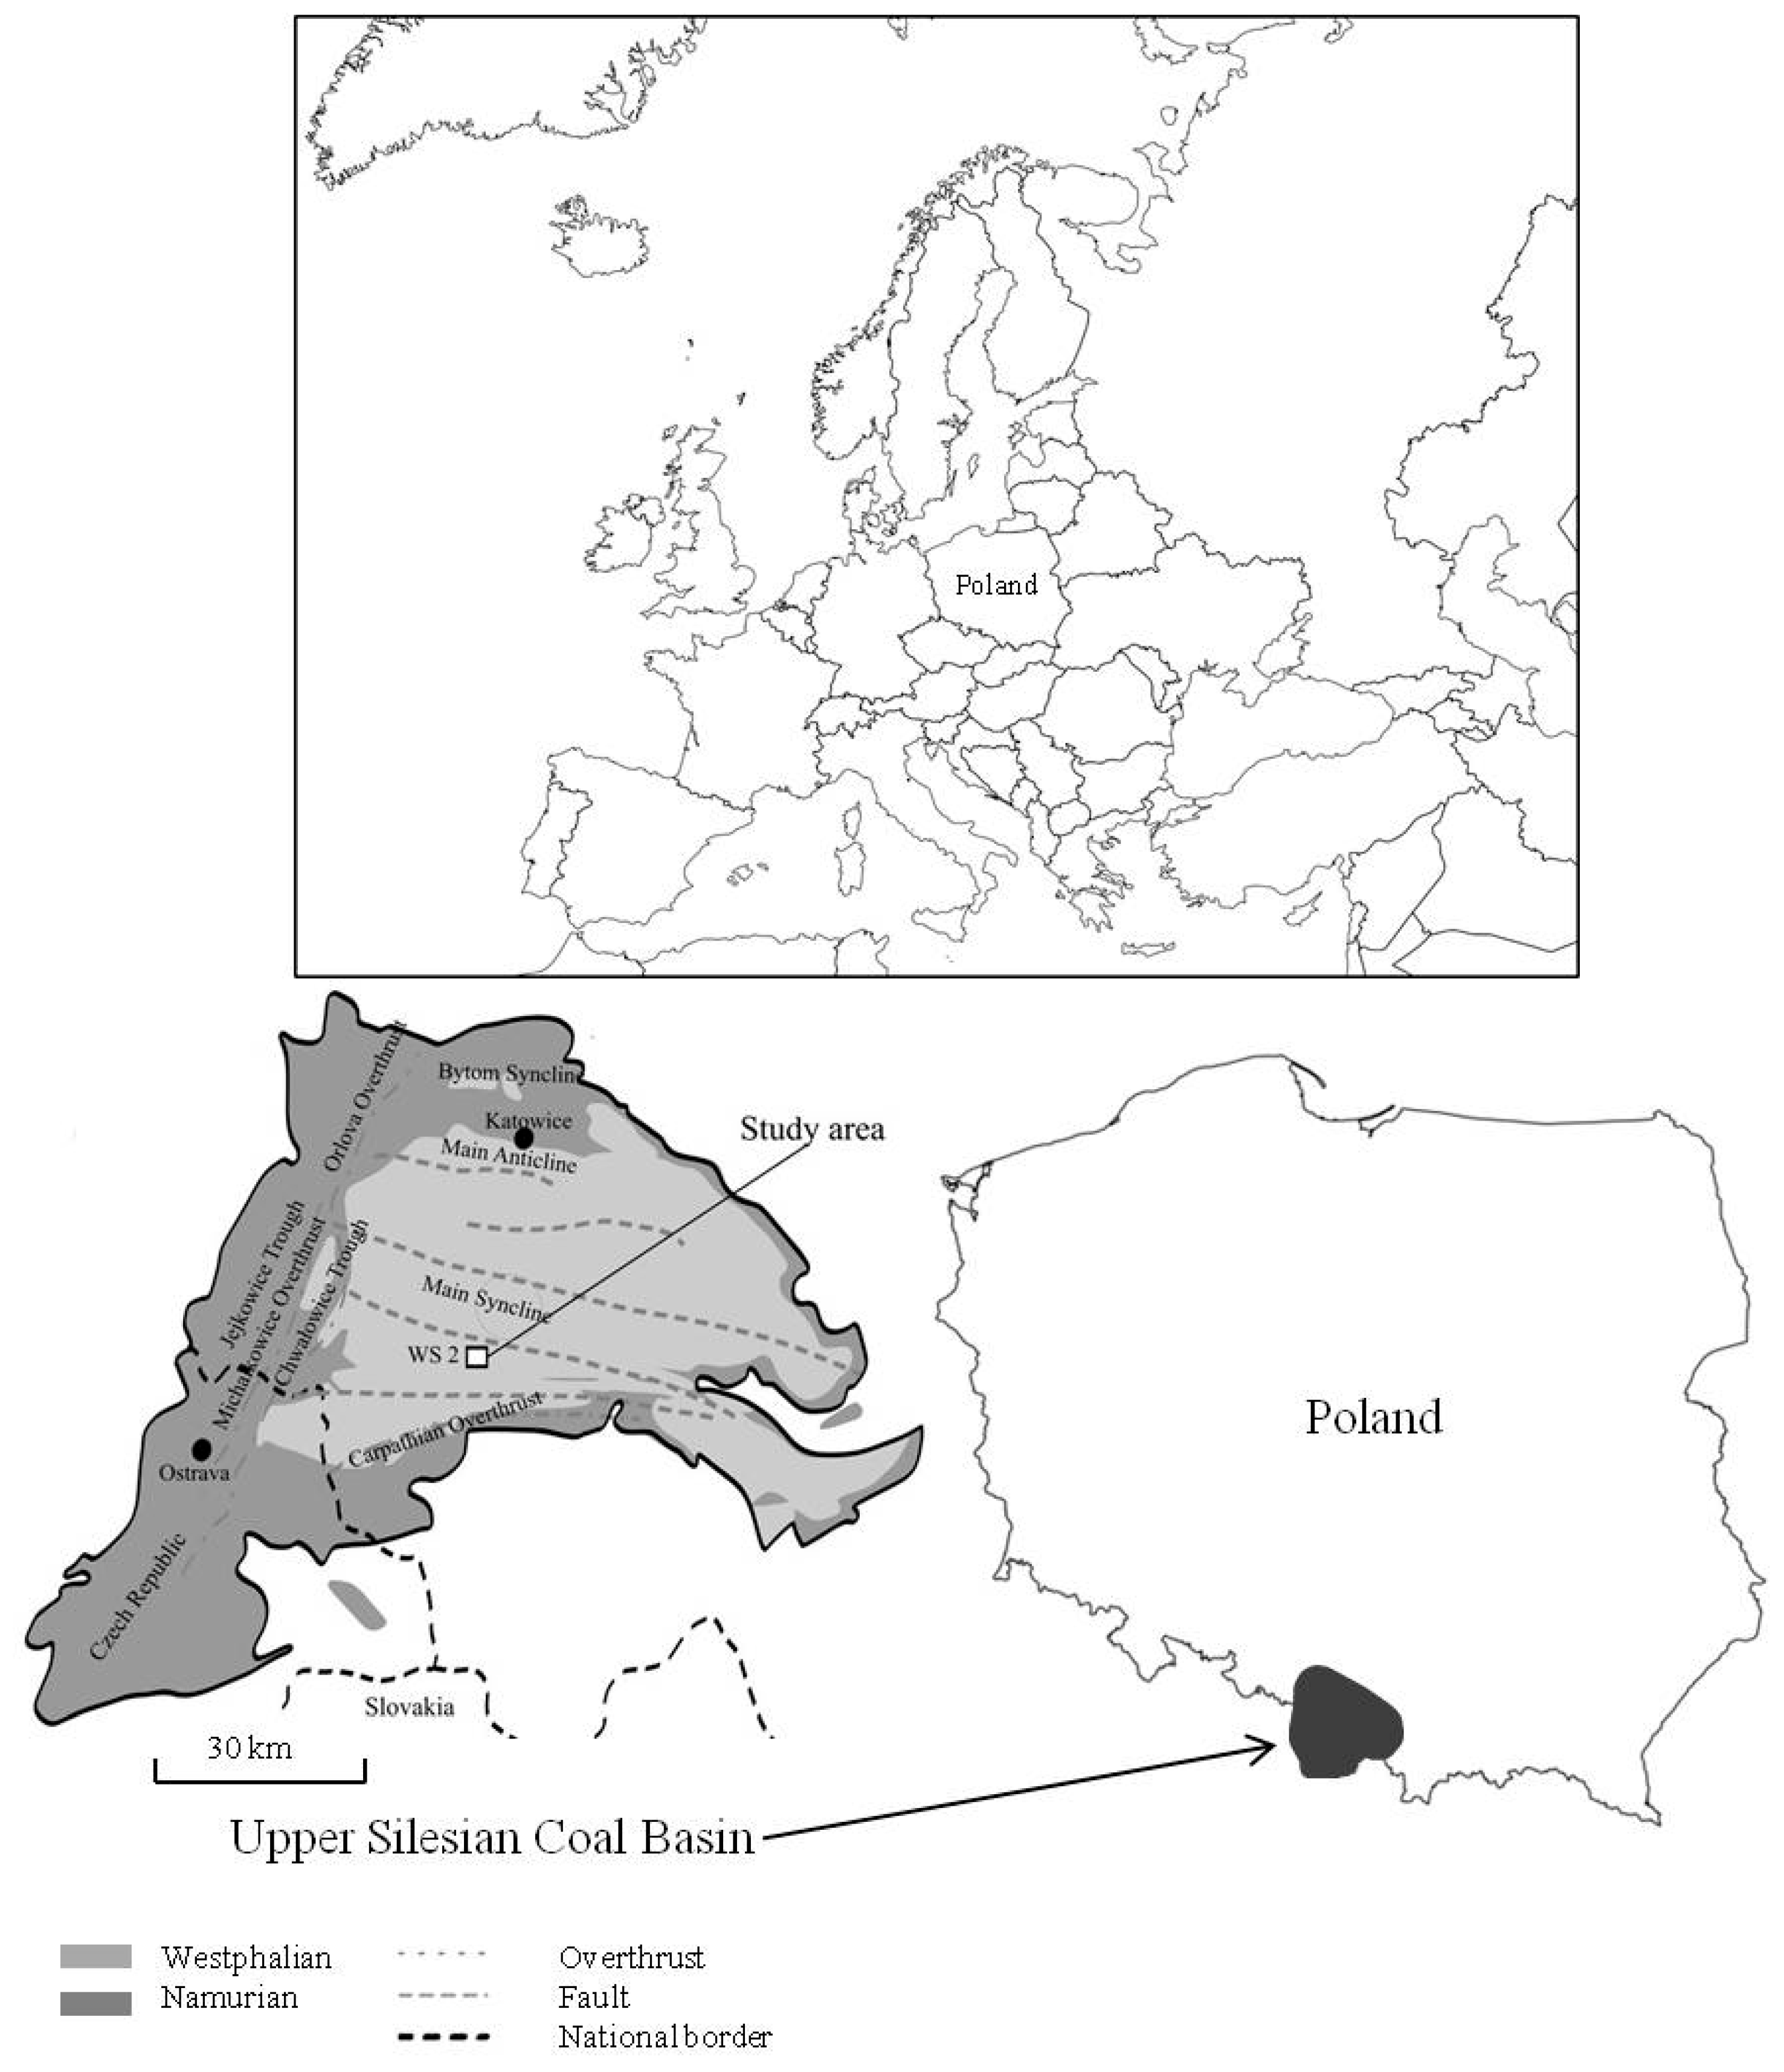
2. Outline of Geology
3. Materials and Methods
4. Results and Discussion
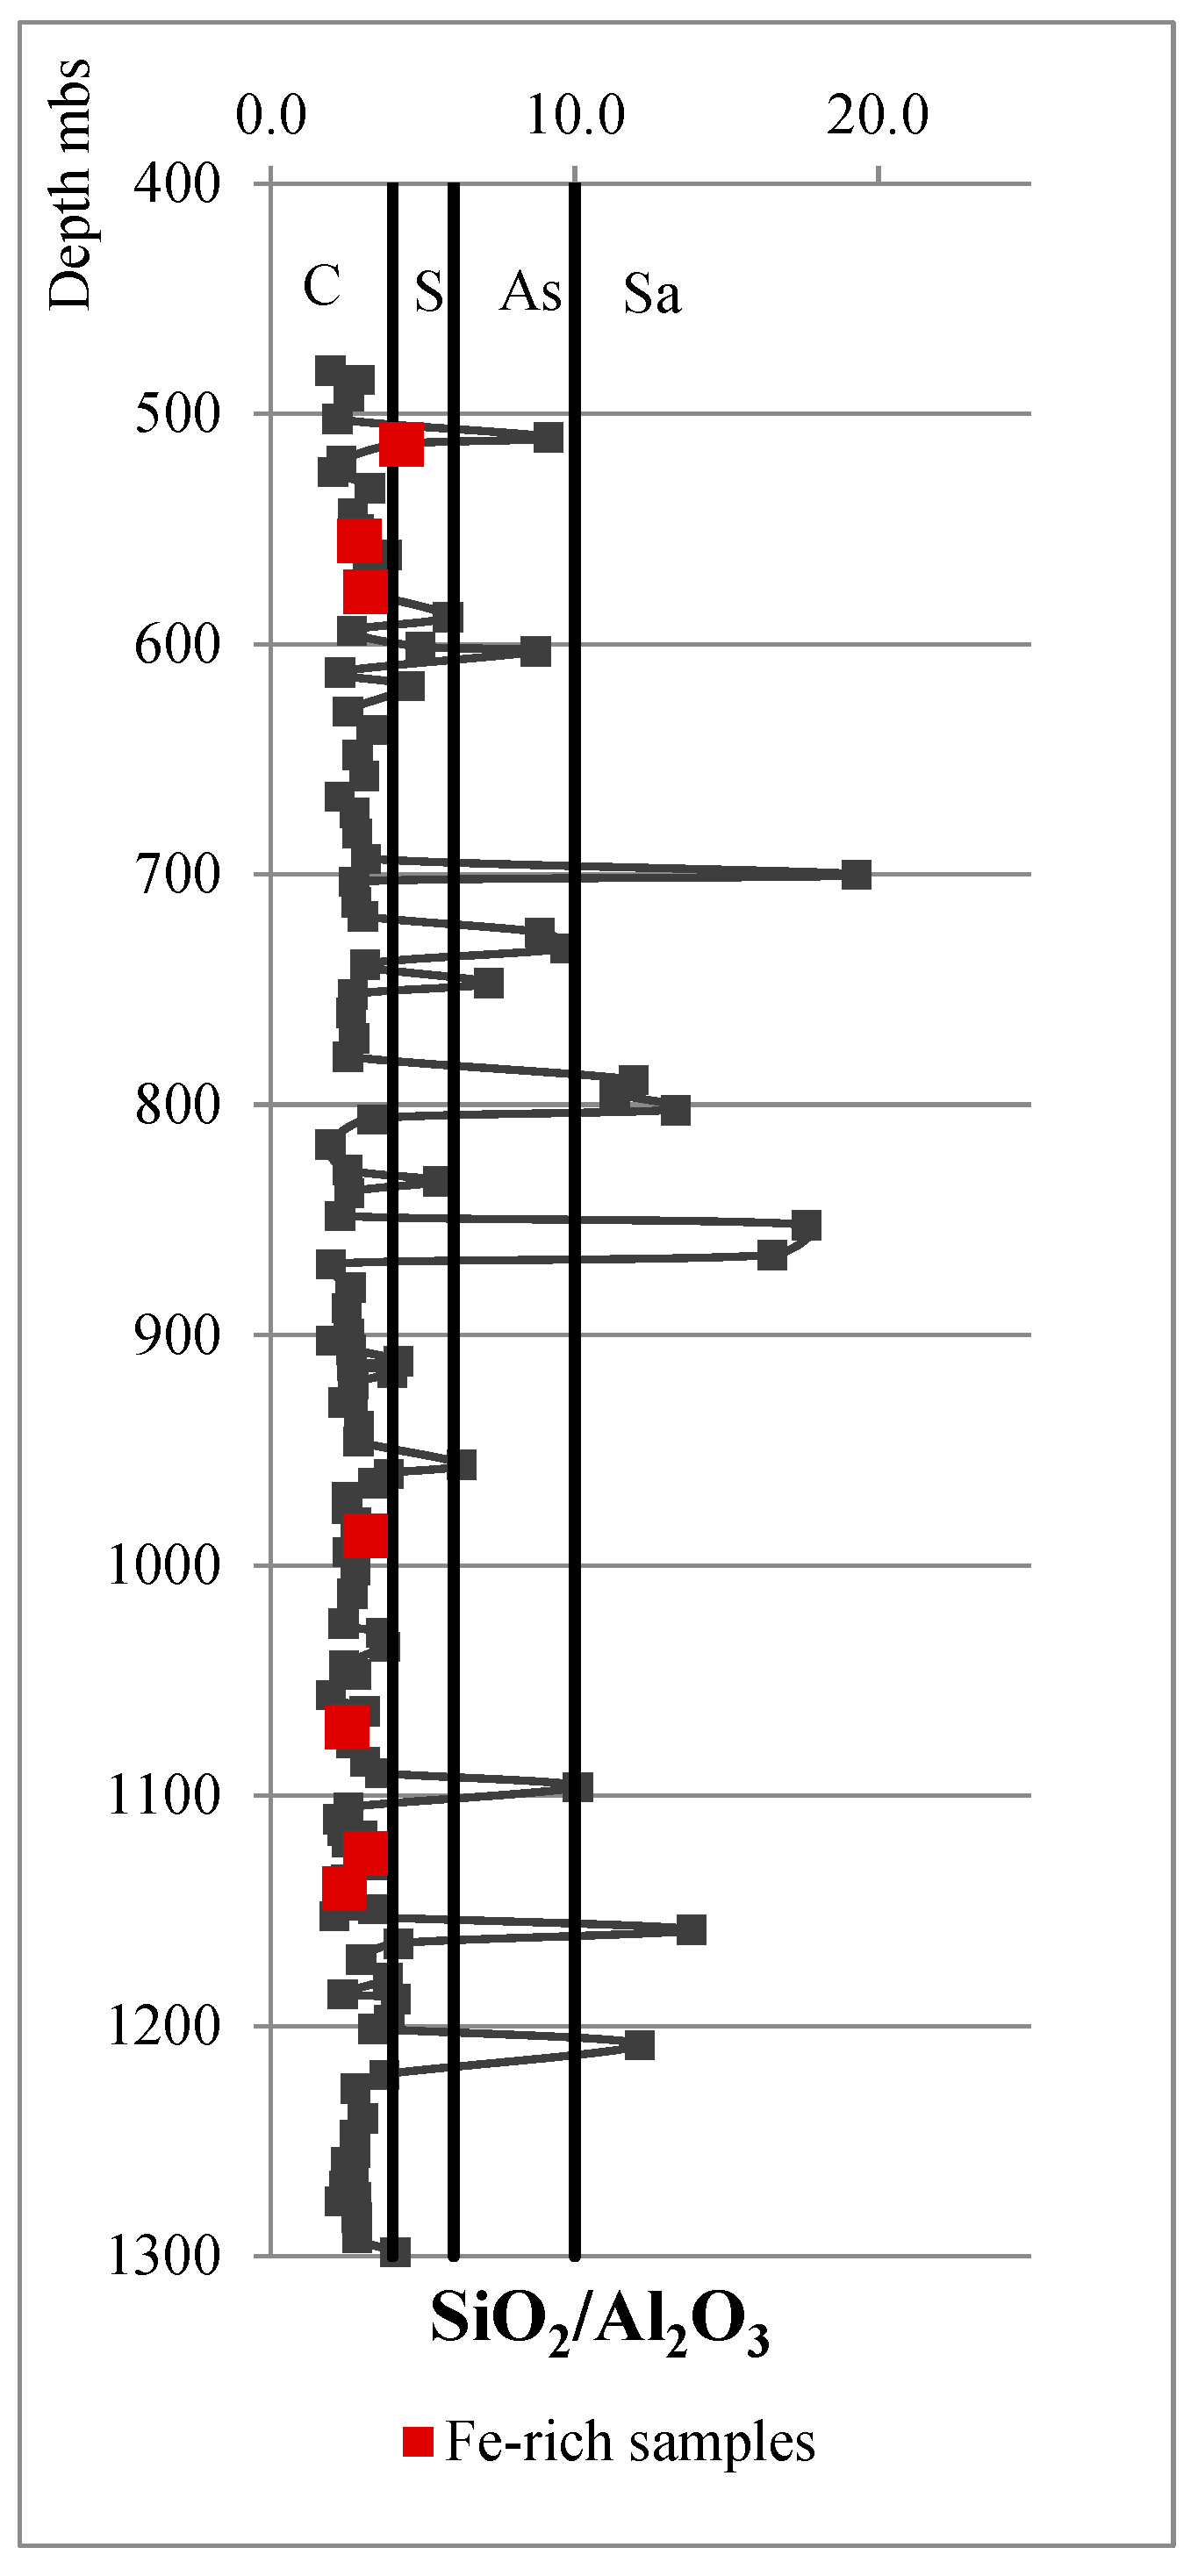
4.1. Chemical Composition
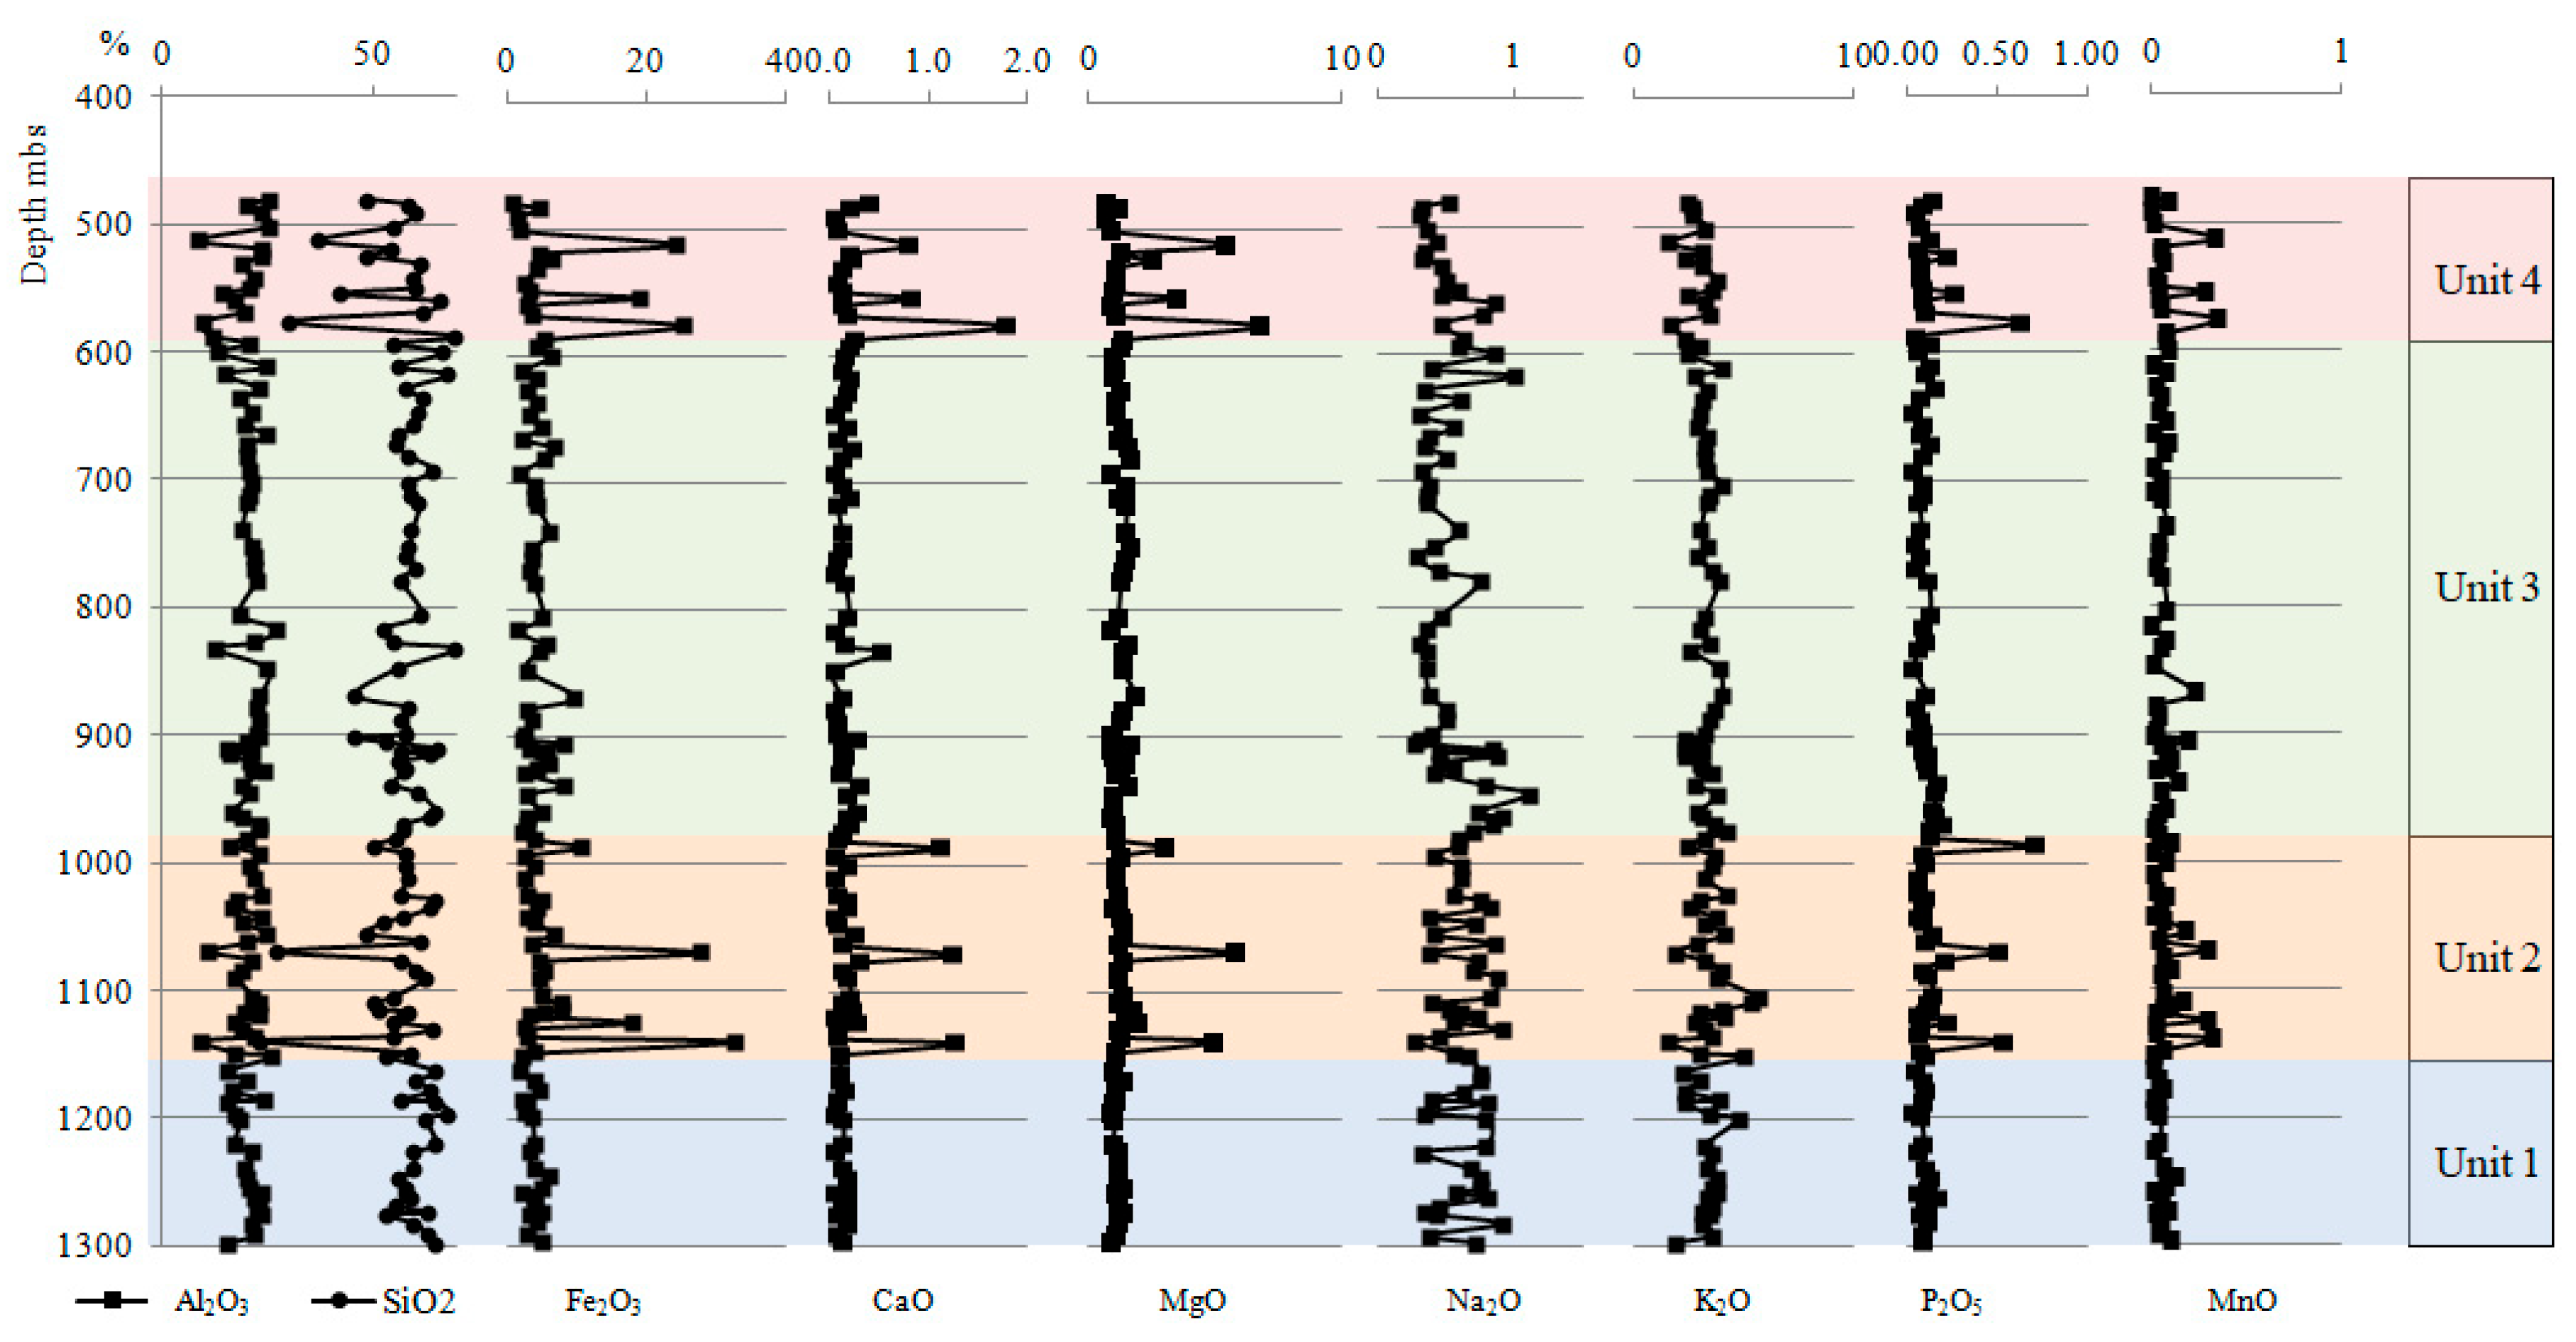
4.2. Chemostratigraphic Zonation
4.2.1. Major Elements
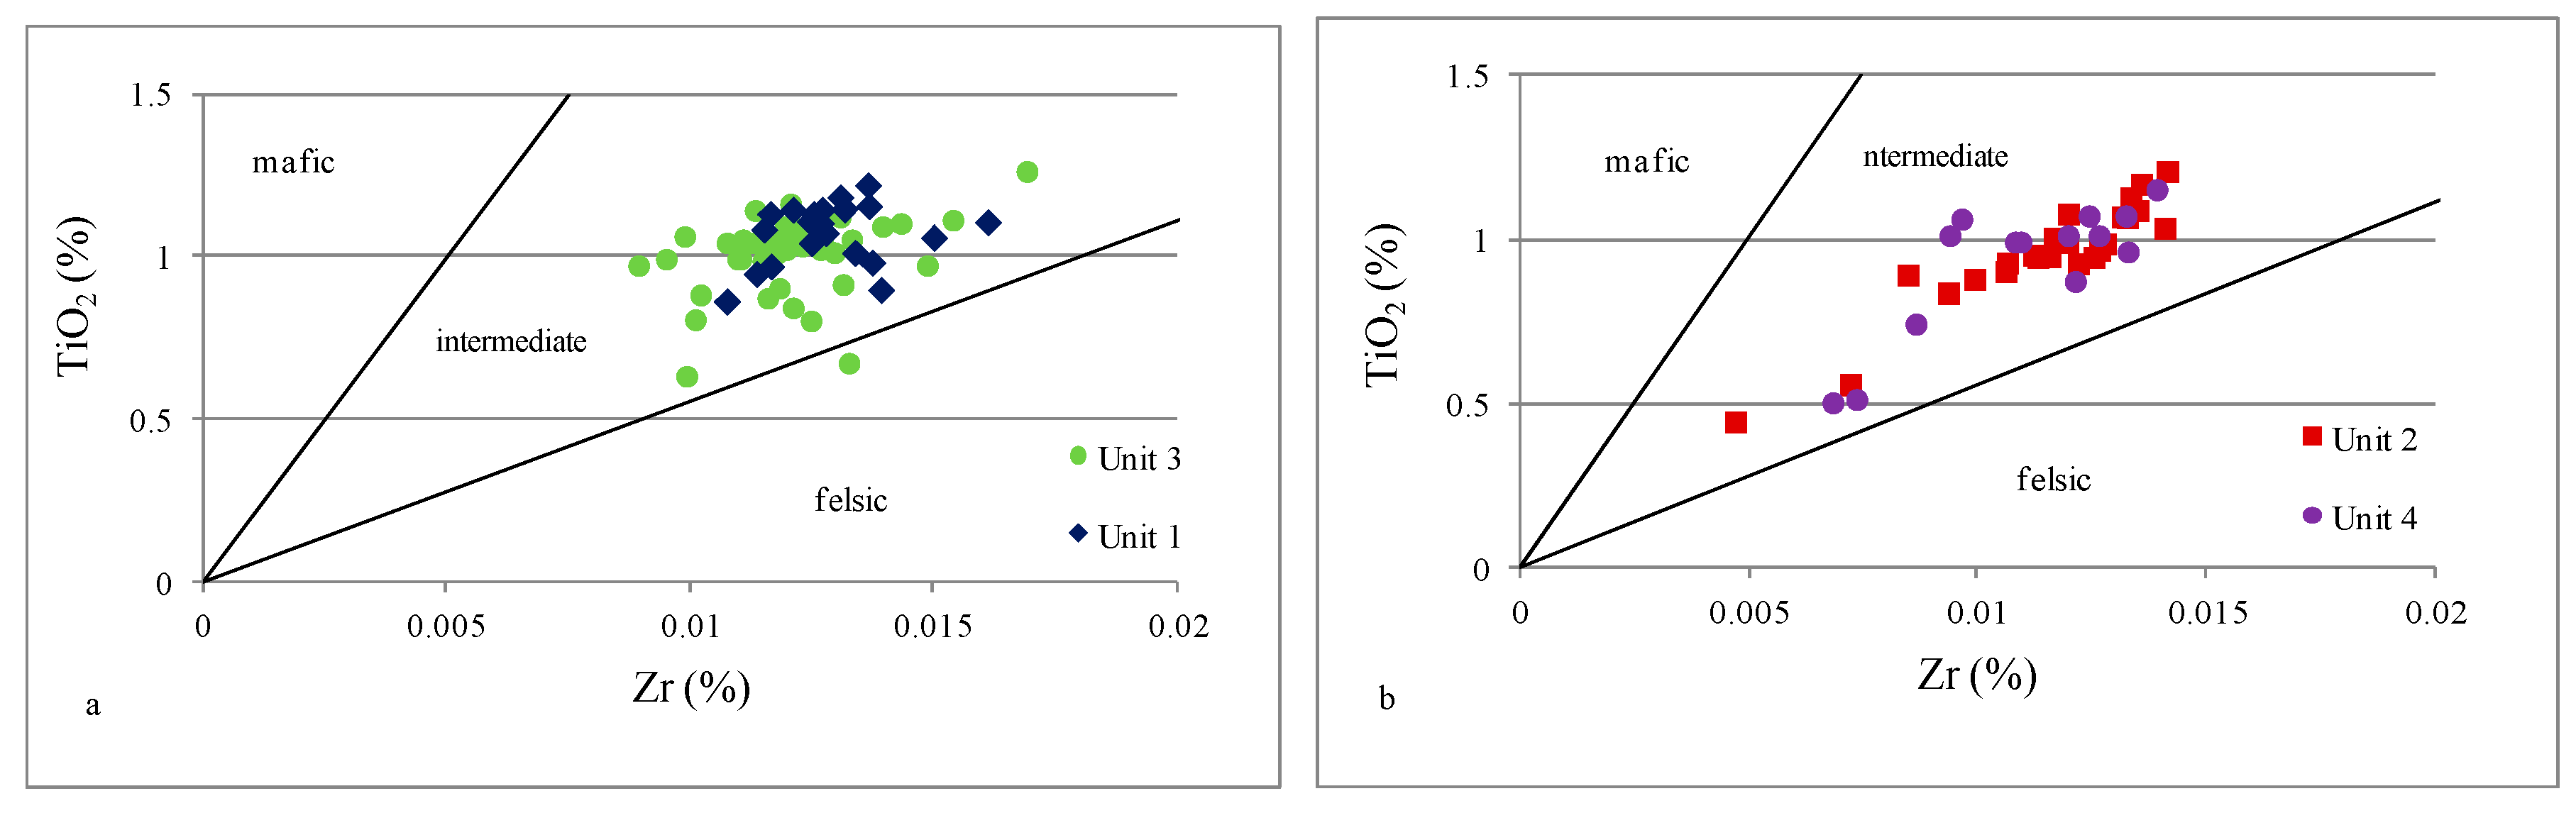
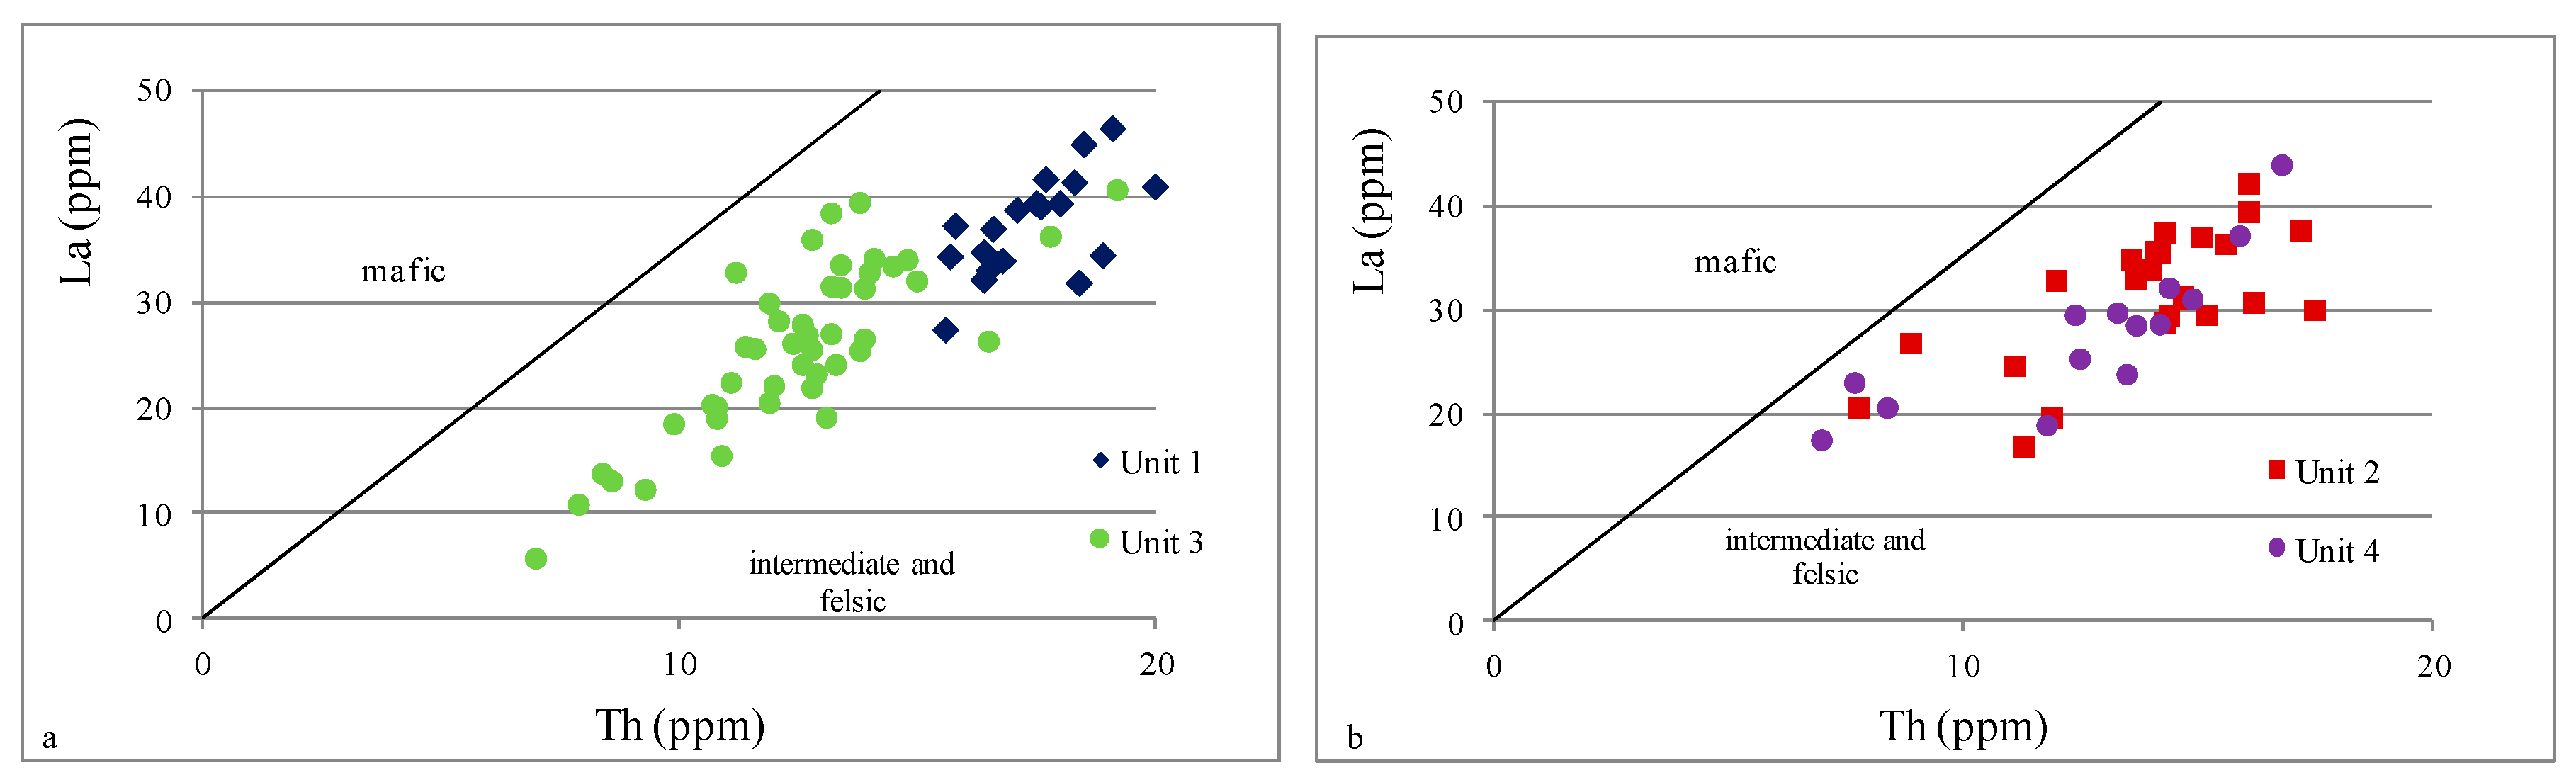
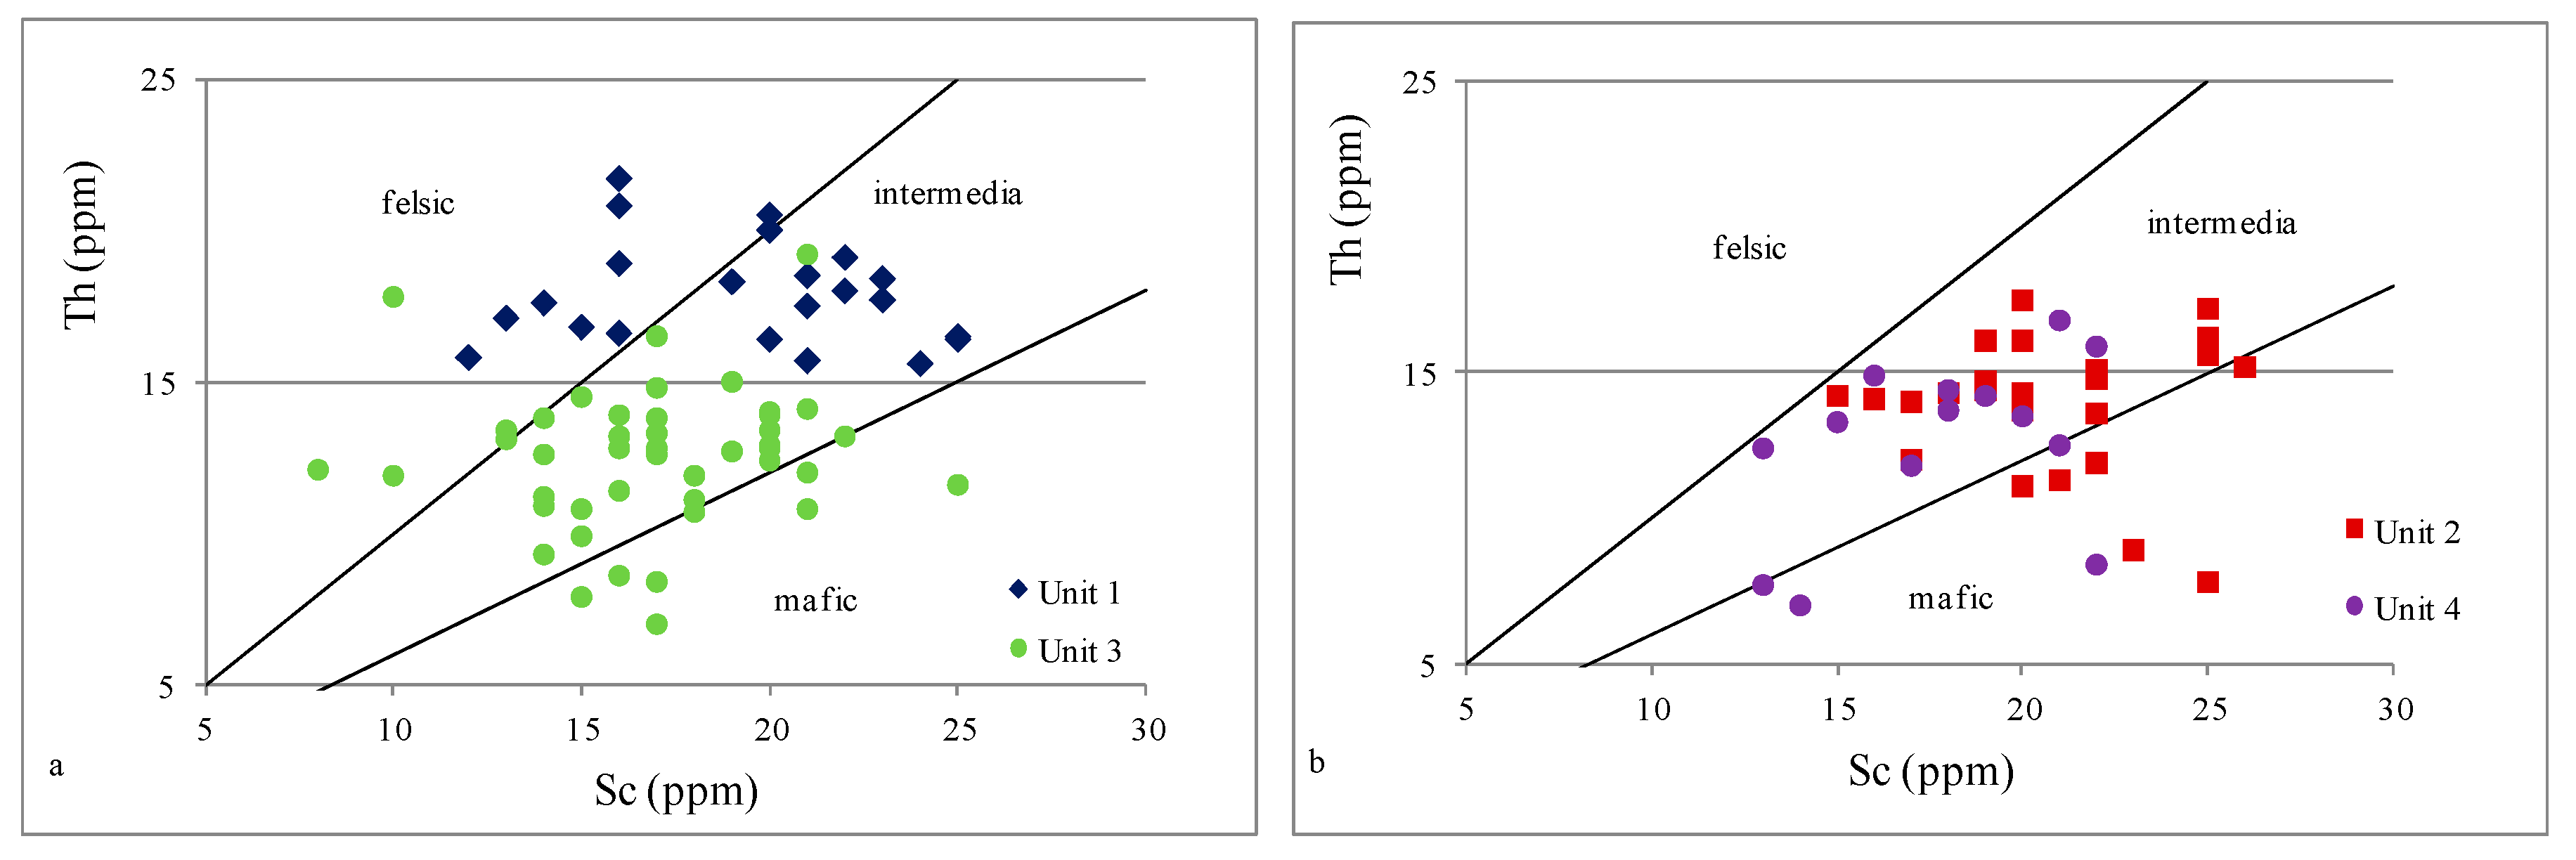
4.2.2. Provenance
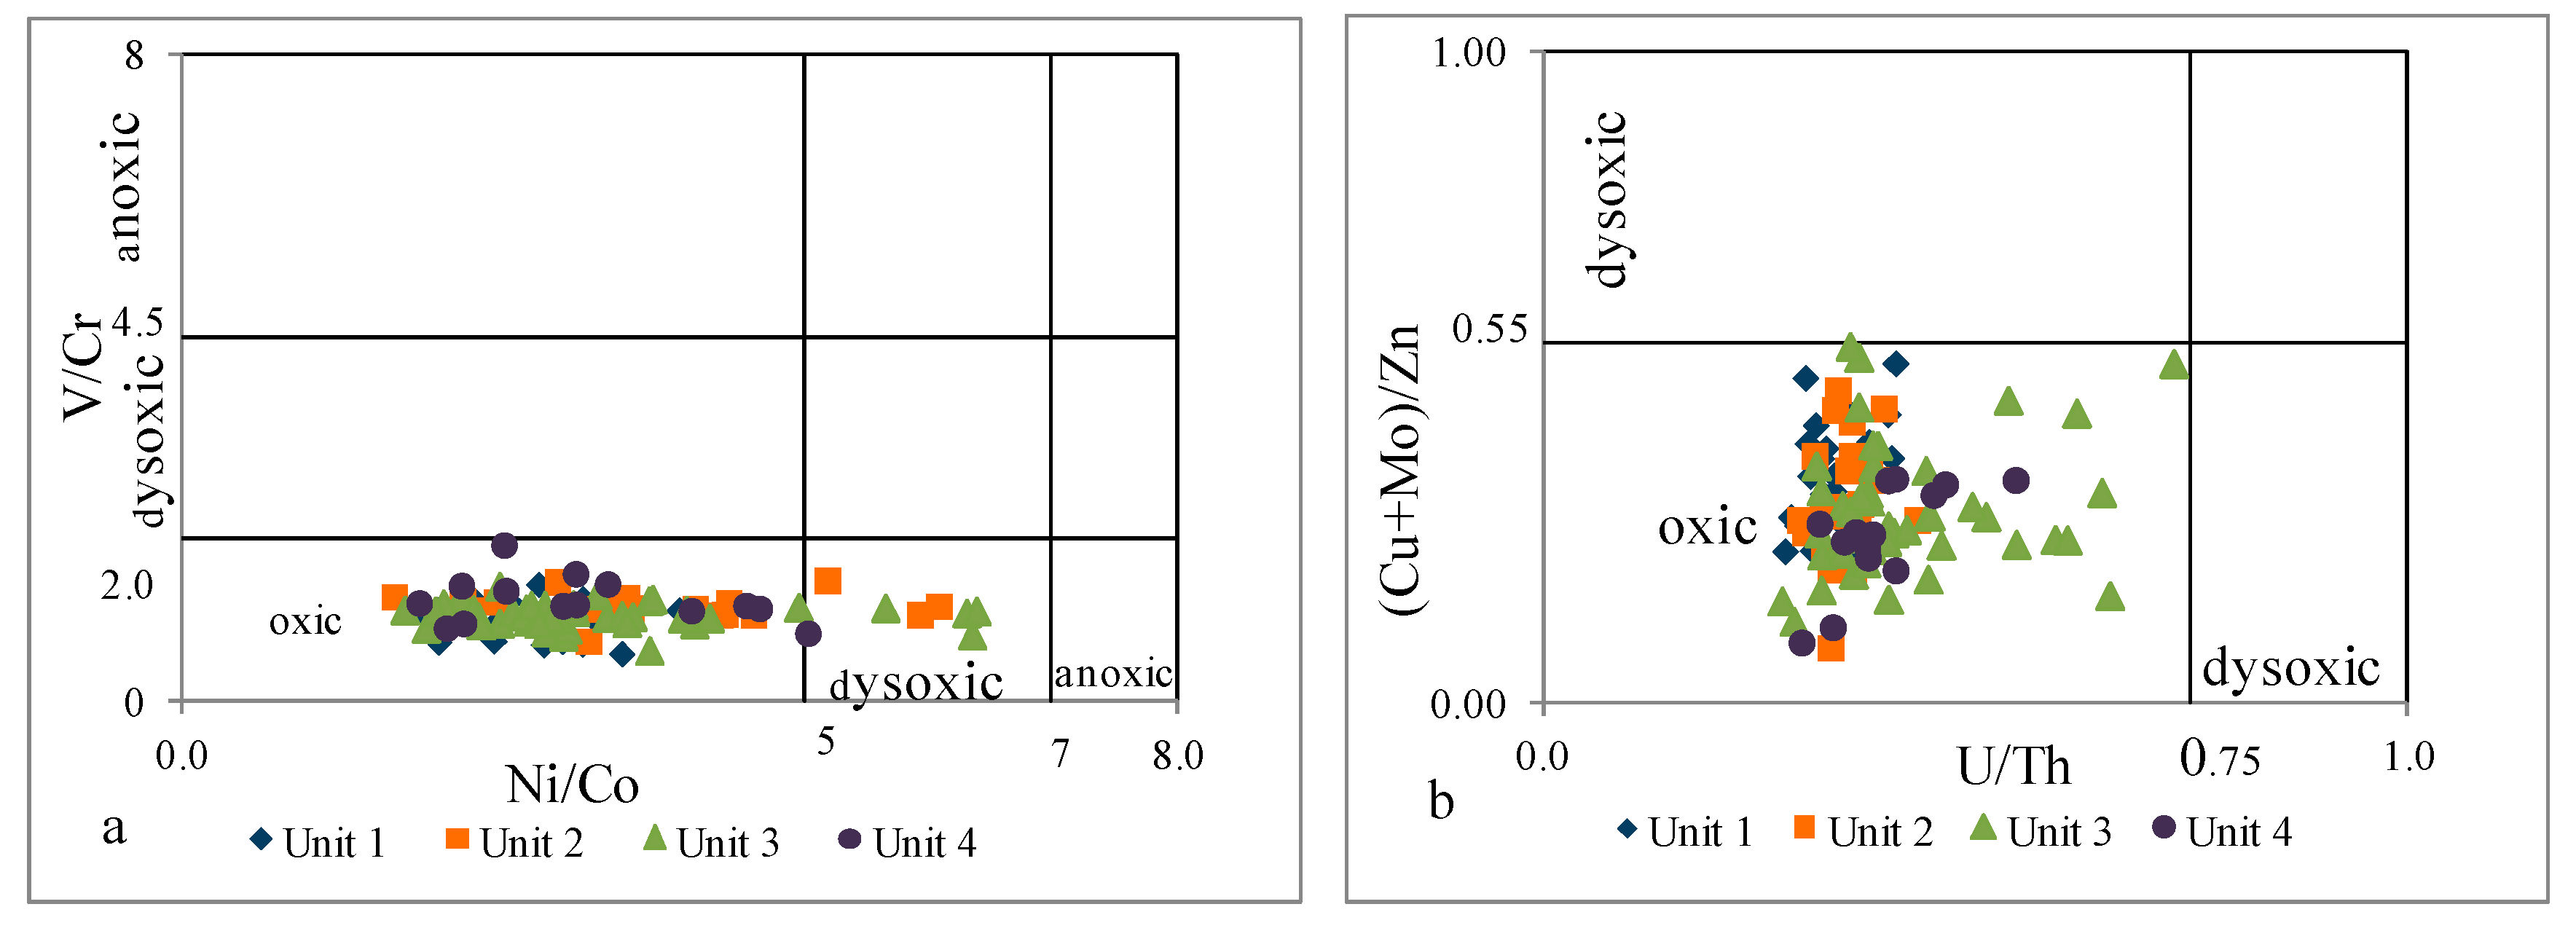
4.2.3. Redox Conditions
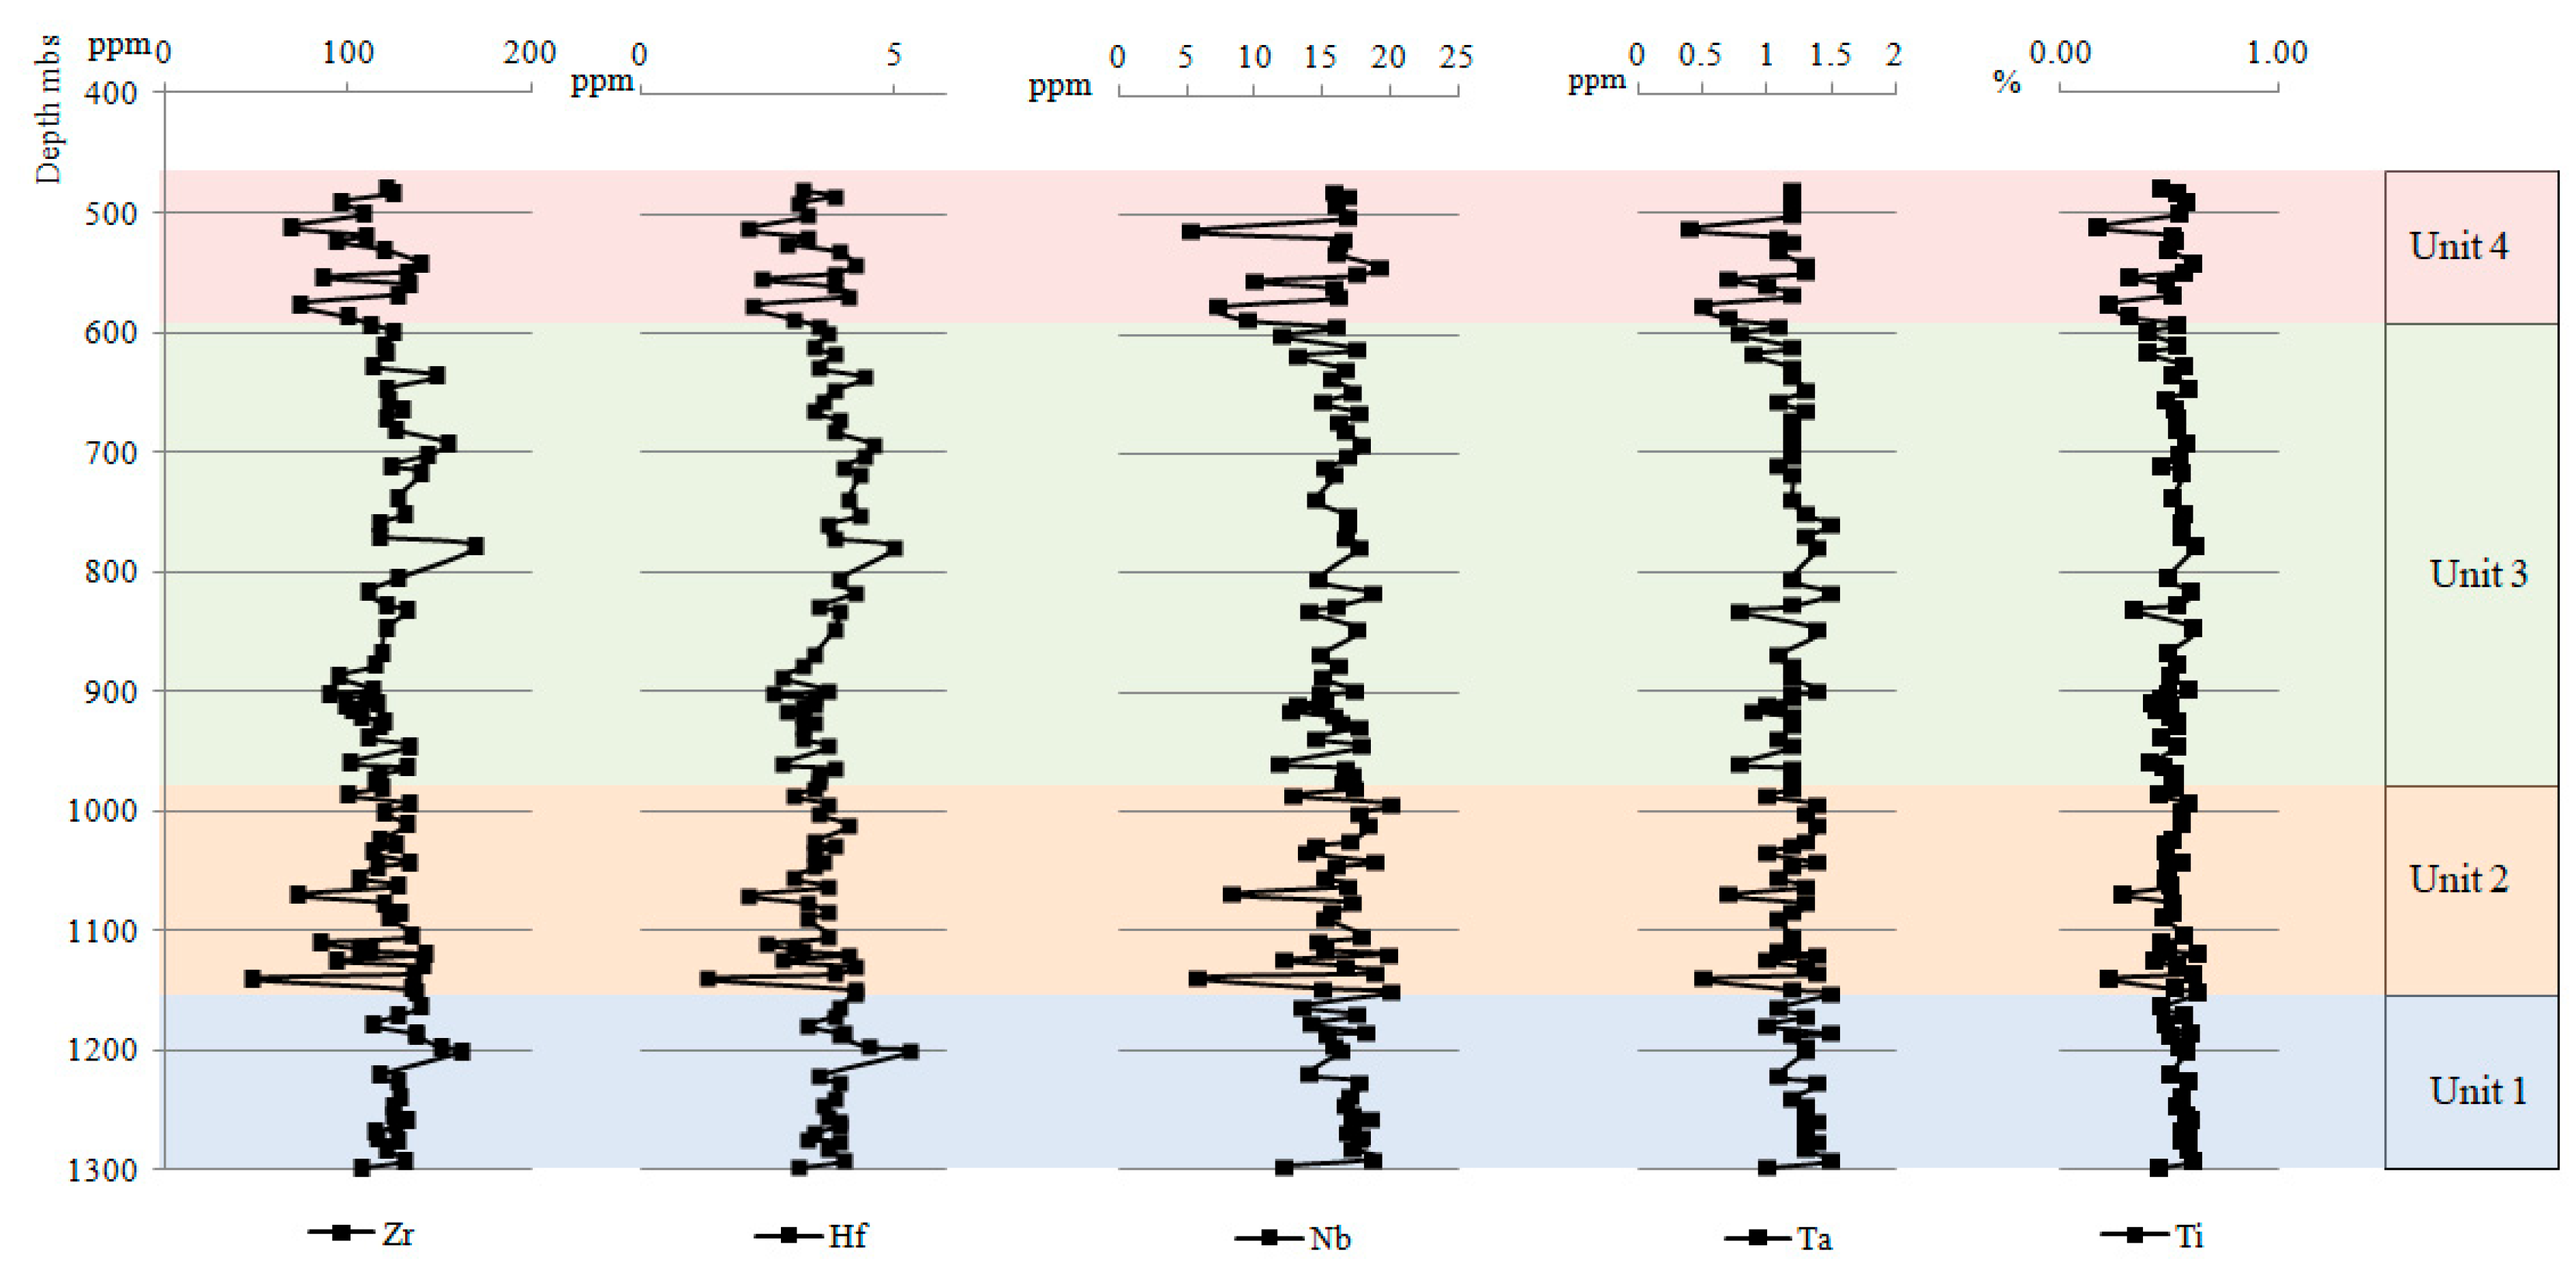
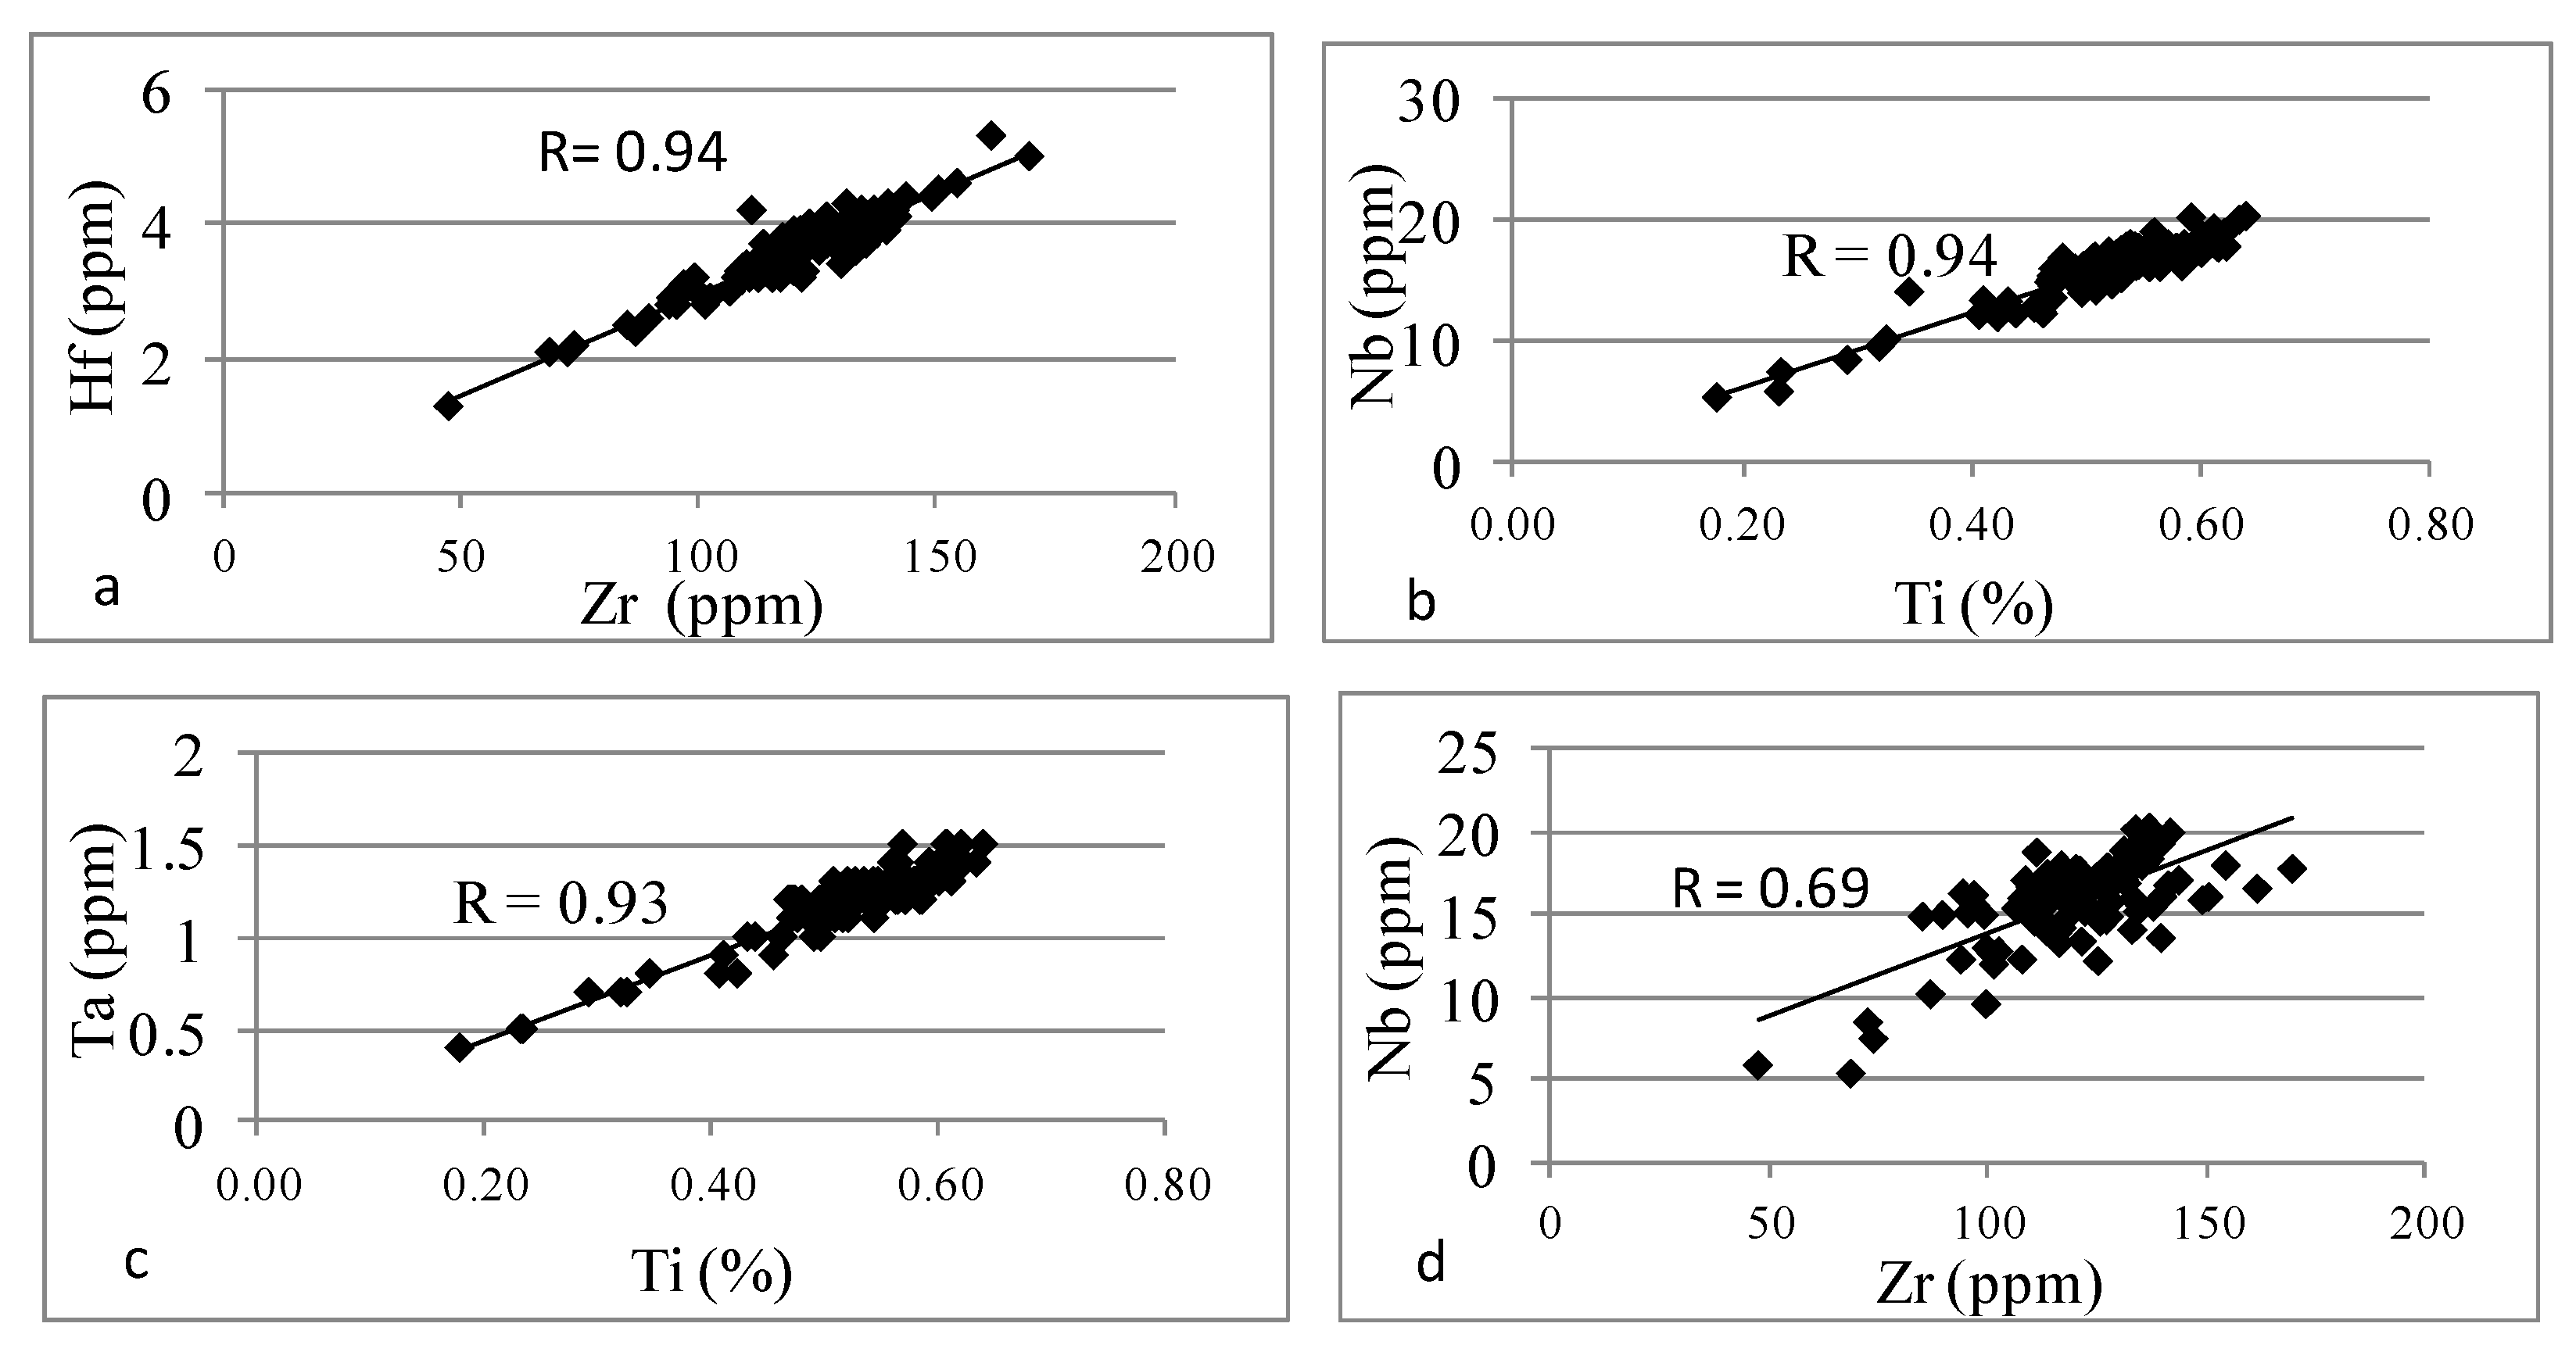
4.2.4. Trace Elements
5. Conclusions
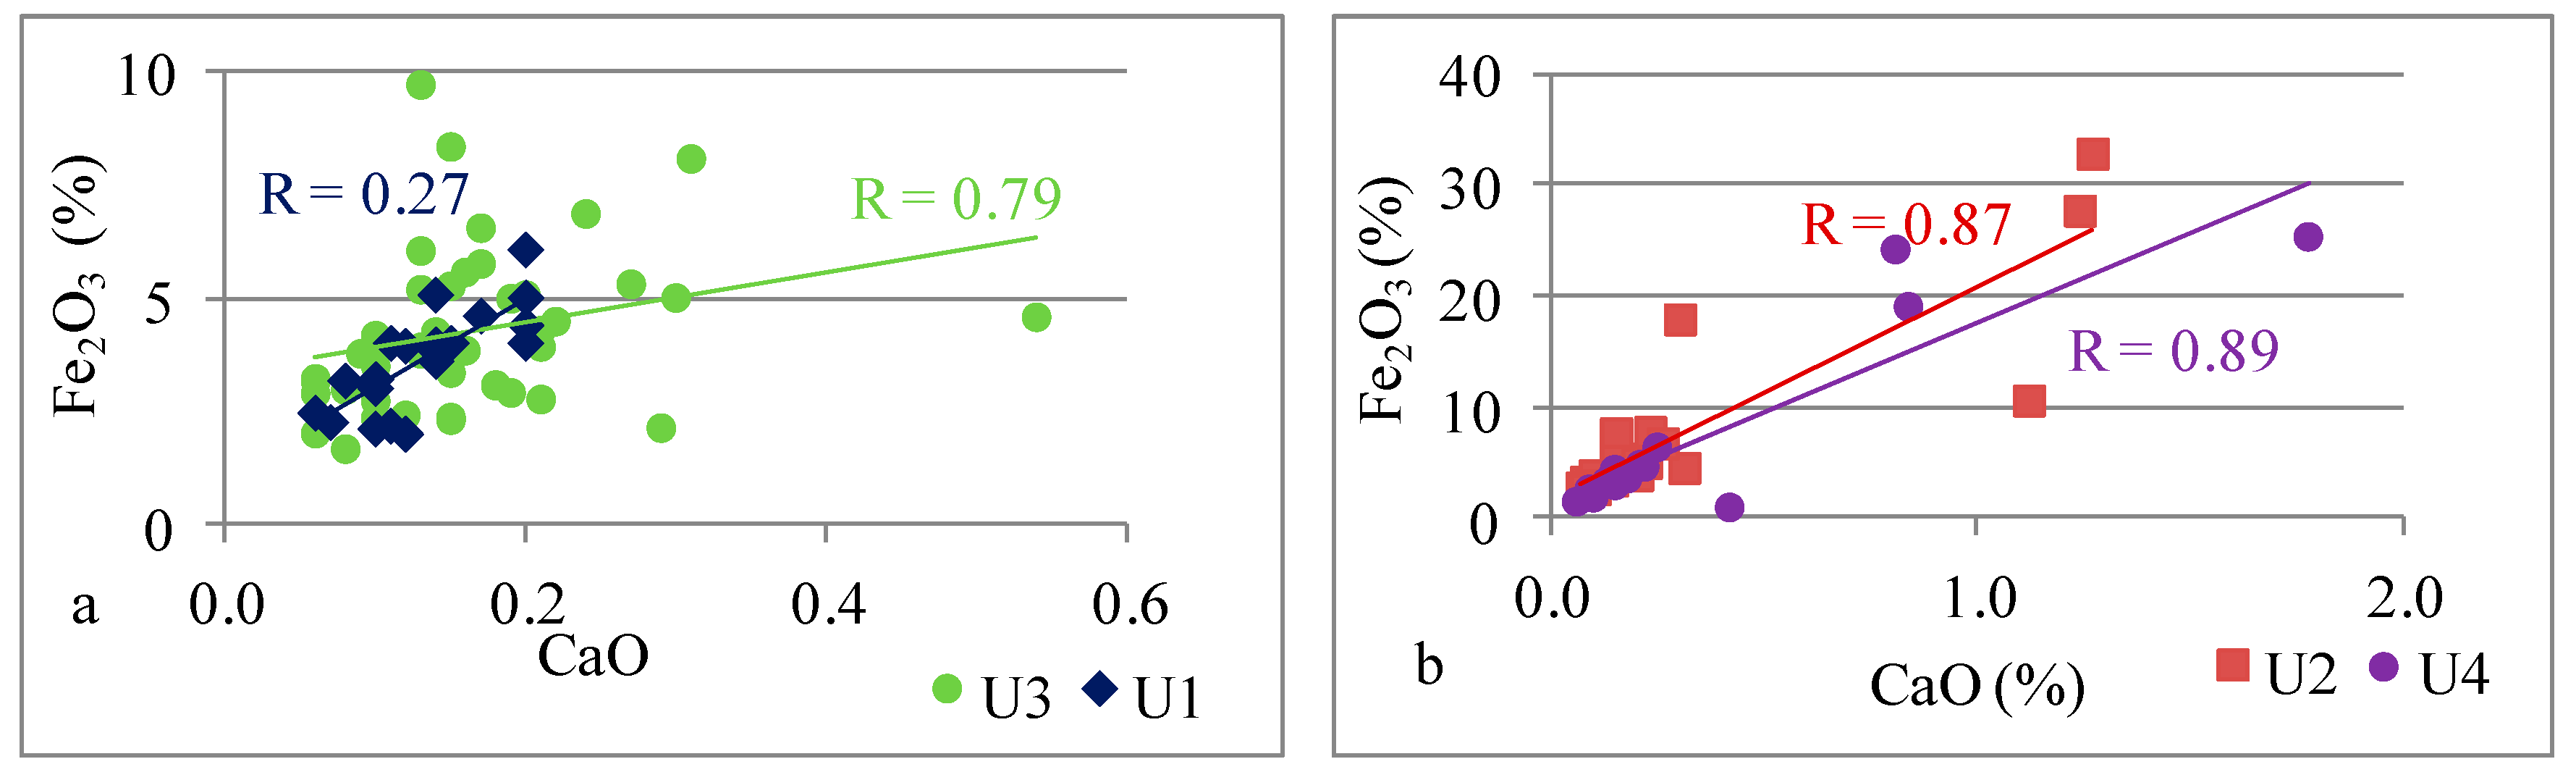
- The geochemical record from the profile of the Mudstone Series shows changes in the concentration of major elements and selected trace elements, leading to the identification of four chemostratigraphic units. These units differ primarily in the content of Fe, Ca, Mg, Mn, and P as well as their different relationships.
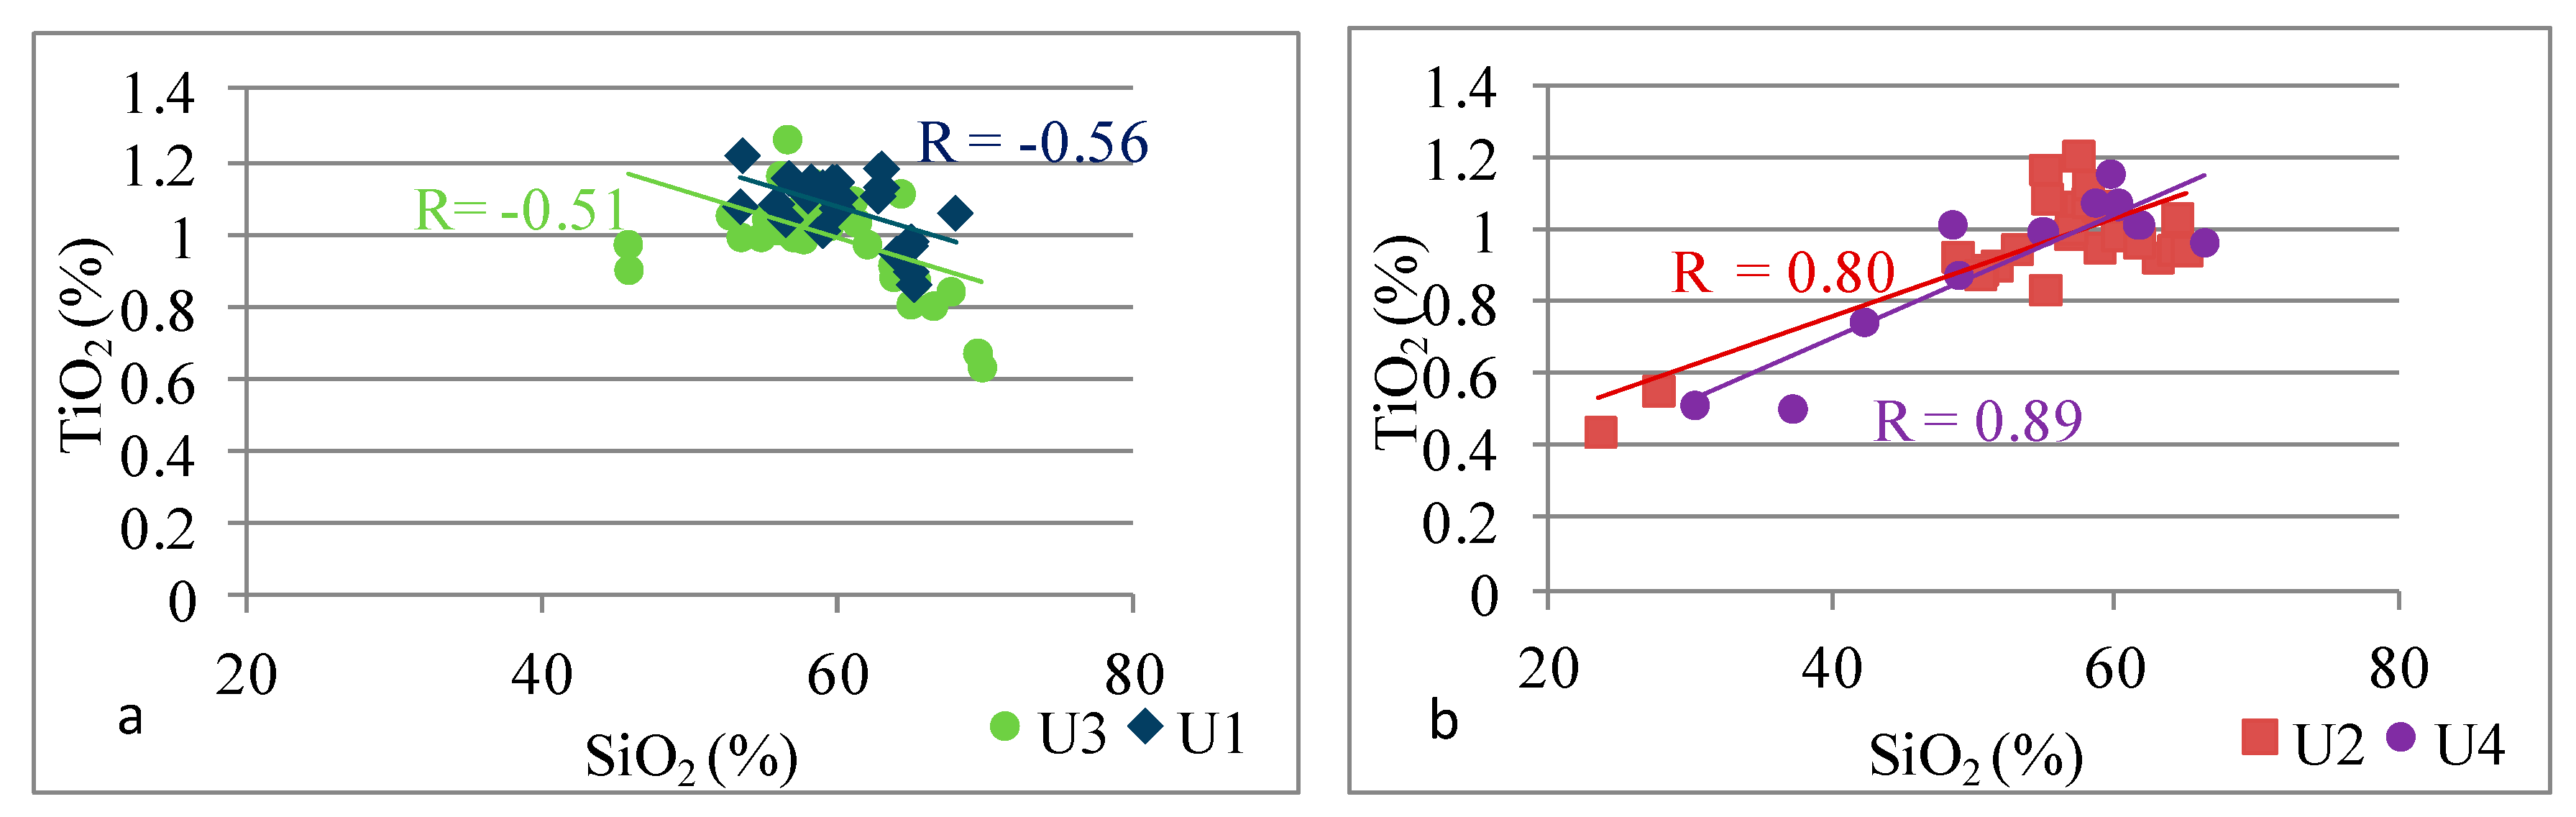
- Unit 2 and Unit 4 demonstrated an enrichment with elements such as Fe, Ca, and Mg, which are associated with carbonate minerals, while Unit 1 and Unit 3 demonstrated an enrichment with Zr, Hf, Nb, Ta, and Ti associated with the presence of heavy minerals.
- Studies of silica origin showed that, in Unit 2 and Unit 4, terrigenous quartz was a primary source of silica, while in Unit 1 and Unit 3, different sources of silica were observed.
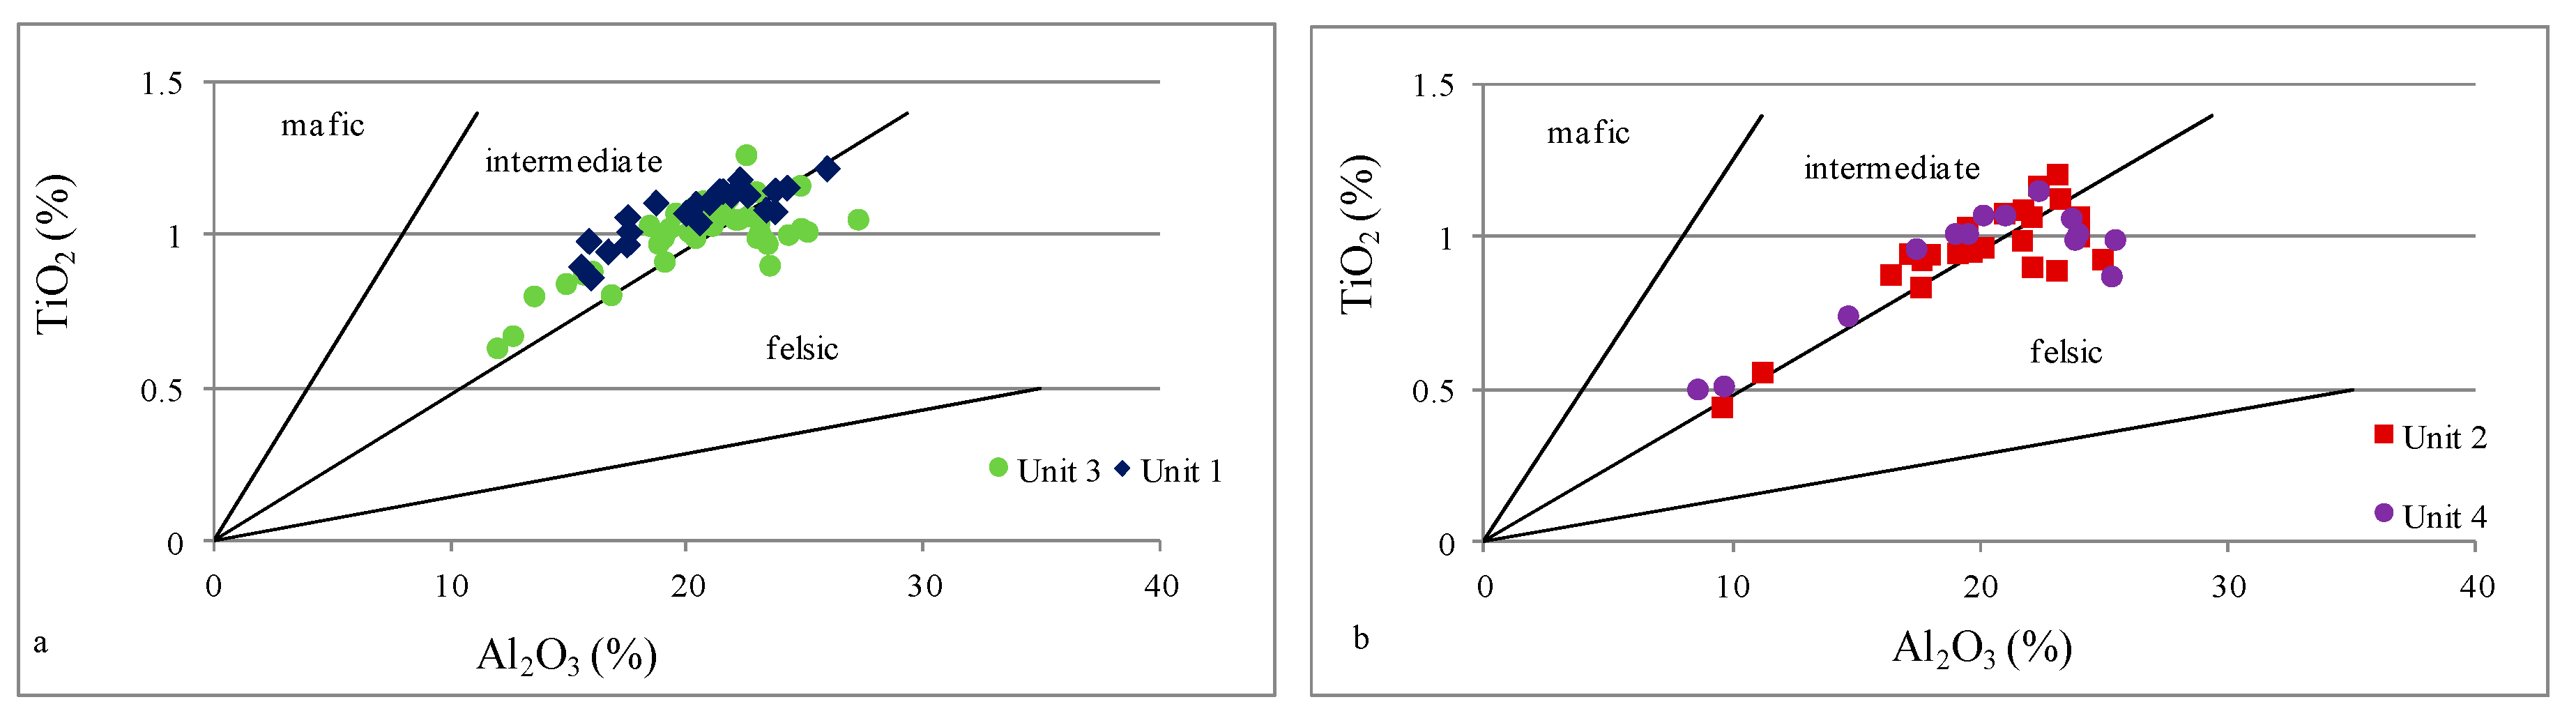
- Based on indicators such as Al2O3/TiO2, TiO2/Zr, and La/Th, it can be concluded that all analyzed samples were possibly derived from felsic to intermediate igneous rocks; only the Th/Sc ratio suggested a mixed sediment source.
- Paleoenvironmental analyses, based on V/Cr, Ni/Co, U/Th, (Cu+Mo)/Zn, and Sr/Ba, indicated an oxic, freshwater depositional environment.
- Chemostratigraphy was used for the first time in the study of the Carboniferous coal-bearing series of the USCB, concluding that it can be used as an effective stratigraphic tool providing new information on the possibility of correlating barren sequences of the coal-bearing succession.
Funding
Data Availability Statement
Conflicts of Interest
References
- Mazurek, S.; Tymiński, M.; Malon, A.; Szuflicki, M. Mineral Resources of Poland; Polish Geological Institute—National Research Institute: Warsaw, Poland, 2022.
- European Commission. Study on the Critical Raw Materials for the EU 2023; Final Report; European Commission: Brussels, Belgium, 2023.
- Szuflicki, M.; Malon, A.; Tymiński, M. Balance of Mineral Deposits in Poland as of 31 December 2018; Geological Institute—National Research Institute: Warsaw, Poland, 2019.
- Kędzior, S.; Dreger, M. Methane occurrence, emissions and hazards in the Upper Silesian Coal Basin, Poland. Int. J. Coal Geol. 2019, 211, 103226. [Google Scholar] [CrossRef]
- Kędzior, S.; Dreger, M. Geological and Mining Factors Controlling the Current Methane Conditions in the Rydułtowy Coal Mine (Upper Silesian Coal Basin, Poland). Energies 2022, 15, 6364. [Google Scholar] [CrossRef]
- Kędzior, S.; Dreger, M. Time variability of methane extraction from hard coal deposits in the Upper Silesian Coal Basin (Poland) in relation to geological and mining conditions. J. Sustain. Min. 2023, 22, 2. [Google Scholar] [CrossRef]
- Kędzior, S.; Teper, L. Coal Properties and Coalbed Methane Potential in the Southern Part of the Upper Silesian Coal Basin, Poland. Energies 2023, 16, 3219. [Google Scholar] [CrossRef]
- Sechman, H.; Kotarba, M.J.; Kędzior, S.; Kochman, A.; Twaróg, A. Fluctuations in methane and carbon dioxide concentrations in the near-surface zone and their genetic characterization in abandoned and active coal mines in the SW part of the Upper Silesian Coal Basin, Poland. Int. J. Coal Geol. 2020, 227, 103529. [Google Scholar] [CrossRef]
- Craigie, N.W.; Pierre, B.; Ahmed, K. Chemostratigraphy and biostratigraphy of Devonian, Carboniferus and Permian sediments encountered in the eastern Saudi Arabia: An integrated approach to reservoir correlation. Mar. Pet. Geol. 2016, 72, 156–178. [Google Scholar] [CrossRef]
- Guo, W.; Zheng, M.; Liu, Z.; Shen, W.; Zhou, S.; Liang, P.; Chen, Y. Rock Physical Properties of Longmaxi Shale Gas Formation in South Sichuan Province, China. Minerals 2023, 13, 485. [Google Scholar] [CrossRef]
- Pearce, T.J.; Besly, B.M.; Wray, D.S.; Wright, D.K. Chemostratigraphy: A Method to Improve Interwell Correlation in Barren Sequences—A Case Study Using Onshore Duckmantian/Stephanian Sequences (West Midlands, U.K.). Sediment. Geol. 1999, 124, 197–220. [Google Scholar] [CrossRef]
- Pearce, T.J.; Mclean, D.; Wright, D.K.; Jeans, C.J.; Mearns, E.W. Stratigraphy of the Upper Carboniferous Schooner Formation, southern North Sea: Chemostratigraphy, mineralogy, palynology and Sm-Nd isotope analysis. In Carboniferous Hydrocarbon Geology: The Southern North Sea and Surrounding Onshore Areas; Collinson, J.D., Evans, D.J., Holliday, D.W., Jones, N.S., Eds.; Occasional Publications Series 7; Yorkshire Geological Society: York, UK, 2005; pp. 165–182. [Google Scholar]
- Pearce, T.J.; Martin, J.H.; Cooper, D.; Wray, D.S. Chemostratigraphy of Upper Carboniferous (Pennsylvanian) sequences from the southern North Sea (United Kingdom). In Modern Alternative Stratigraphic Techniques: Theory and Case Histories—Special Publication 94; Ratcliffe, K.T., Zaitlin, B.A., Eds.; SEPM (Society for Sedimentary Geology): Claremore, OK, USA, 2010; pp. 109–129. [Google Scholar]
- Playter, T.; Corlett, H.; Konhauser, H.; Robbins, L.; Rohais, S.; Crombez, V.; MacCormack, K.; Rokosh, D.; Prenoslo, D.; Furlong, C.M.; et al. Clinoform identification and correlation in fine grained sediments: A case study using the Triassic Montney Formation. Sedimentology 2018, 65, 263–302. [Google Scholar] [CrossRef]
- Ramkumar, M.; Alberti, M.; Fürsich, F.T. Chemostratigraphy of the Dhosa Oolite Member (Oxfordian), Kachchh Basin, western India: Implications for completeness of the stratigraphic record and correlation with global oolite peak. In Chemostratigraphy: Concepts, Techniques and Applications; Ramkumar, M., Ed.; Elsevier: Amsterdam, The Netherlands, 2015; pp. 309–340. [Google Scholar]
- Ramkumar, M.; Nagarajan, R.; Santosh, M. Advances in sediment geochemistry and chemostratigraphy for reservoir characterization. Energy Geosci. 2021, 2, 308–326. [Google Scholar] [CrossRef]
- Ratcliffe, K.; Playton, T.E.; Montgomery, P.; Wray, D.; Caulfield-Kerney, S.; Tohver, E.; Hocking, R.M.; Haines, P.; Kirschvink, J.; Yan, M. Using elemental chemostratigraphy on mid–late frasnian Platform-top successions from the lennard shelf outcrops, Canning basin, western Australia. In New Advances in Devonian Carbonates: Outcrop Analogues, Reservoirs and Chronostratigraphy; SEPM Special Publication; Playton, T.E., Kerans, C., Weissenberger, J.A.W., Eds.; SEPM: Claremore, OK, USA, 2017; pp. 319–331. [Google Scholar]
- Chen, Z.; Li, X.; Chen, H.; Duan, Z.; Qiu, Z.; Zhou, X.; Hou, Y. The Characteristics of Lithofacies and Depositional Model of Fine-Grained Sedimentary Rocks in the Ordos Basin, China. Energies 2023, 16, 2390. [Google Scholar] [CrossRef]
- Zhang, Y.; Li, R.; Xi, S.; Gao, J.; Chen, L.; Huang, H.; Zhao, B.; Khaled, A. Quartz Origins and Pleoenvronmental Controls on Organic Matter Accumulation of Marine Shale in the Ordovician Wulalike Formation, Northwestern Ordos Basin, China: Significance for Shale Gas Exploration. Energies 2023, 16, 5278. [Google Scholar] [CrossRef]
- Zhang, Z.; Huang, Y.; Ran, B.; Liu, W.; Li, X.; Wang, C. Chemostratigraphic Analysis of Wufeng and Longmaxi Formation in Changning, Sichuan, China: Achieved by Principal Component and Constrained Clustering Analysis. Energies 2021, 14, 7048. [Google Scholar] [CrossRef]
- Yin, S.; Zhang, Z.; Huang, Y. Geochemical Characteristics and Chemostratigraphic Analysis of Wufeng and Lower Longmaxi Shales, Southwest China. Minerals 2022, 12, 1124. [Google Scholar] [CrossRef]
- Wang, Q.; Huang, Y.; Zhang, Z.; Wang, C.; Li, X. Application of Chemical Sequence Stratigraphy to the Prediction of Shale Gas Sweet Spots in the Wufeng and Lower Longmaxi Formations within the Upper Yangtze Region. Minerals 2022, 12, 859. [Google Scholar] [CrossRef]
- Kombrink, H.; Van Os, B.J.H.; Van der Zwan, C.J.; Wong, T.E. Geochemistry of marineand lacustrine bands in the Upper Carboniferous of The Netherlands. Geol. Mijnb. Neth. J. Geosci. 2008, 87, 309–322. [Google Scholar] [CrossRef]
- Vöröš, D.; Geršlová, E.; Šimoníková, L.; Díaz-Somoano, M. Late Carboniferous palaeodepositional changes recorded by inorganic proxies and REE data from the coal-bearing strata: An example on the Czech part of the Upper Silesian Coal basin (USCB). J. Nat. Gas Sci. Eng. 2022, 107, 104789. [Google Scholar] [CrossRef]
- Kędzior, A.; Gradziński, R.; Doktor, M.; Gmur, D. Sedimentary history of a Mississippian to Pennsylvanian coal-bearing succession: An example from the Upper Silesia Coal Basin, Poland. Geol. Mag. 2007, 144, 487–496. [Google Scholar] [CrossRef]
- Bukowska, M.; Sanetra, U.; Wadas, M. Zonation of deposits of hard coals of different porosityin the Upper Silesian Coal Basin. Gospod. Surowcami Miner. Miner. Resour. Manag. 2016, 32, 5–24. [Google Scholar]
- Jureczka, J.; Kotas, A. Upper Silesian Coal Basin. In The Carboniferous System in Poland; Zdanowski, A., Żakowa, H., Eds.; Prace Państwowego Instytutu Geologicznego; Polish Geological Institute: Warsaw, Poland, 1995; Volume 148, pp. 164–173. [Google Scholar]
- Kokowska-Pawłowska, M. Petrographic and mineral variability of the rocks accompanying selected coal seams of the Poruba beds and their influence of the trace elements content. Miner. Resour. Manag. 2015, 31, 73–92. [Google Scholar]
- Parzentny, H.R.; Róg, L. Initial assessment of variability in the modes of occurrence of some trace elements in coal seams with vertical profiles in the Upper Silesian Coal Basin in Poland. Arch. Min. Sci. 2020, 65, 723–736. [Google Scholar]
- Morga, R. Structure of variability of phosphorus content in exploited seams of bituminous coal in the Pniówek Mine. Miner. Resour. Manag. 2007, 23, 29–48. [Google Scholar]
- Strzałkowska, E. Fly ash—A valuable material for the circular economy. Miner. Resour. Manag. 2021, 37, 49–62. [Google Scholar]
- Strzałkowska, E. Rare earth elements and other critical elements in the magnetic fraction of fly ash from several Polish power plants. Int. J. Coal Geol. 2022, 258, 104015. [Google Scholar] [CrossRef]
- Strzałkowska, E. Ashes qualified as a source of selected critical elements (REY, Co, Ga, V). Energies 2023, 16, 3331. [Google Scholar] [CrossRef]
- Kokowska-Pawłowska, M.; Krzeszowska, E. Toxic elements in carboniferous sedimentary rocks from the Upper Silesian Coal Basin. Miner. Resour. Manag. 2023, 39, 63–86. [Google Scholar]
- Krzeszowska, E.; Kokowska-Pawłowska, M.; Krzeszowski, Ś. Distribution of the selected critical elements in the Carboniferous coal-bearing series of the Upper Silesian Coal Basin and the Lublin Coal Basin (Poland). Acta Geol. Sin. Engl. Ed. 2022, 96, 273–292. [Google Scholar] [CrossRef]
- Kombrink, H. The Carboniferous of the Netherlands and surrounding areas; a basin analysis. Geol. Ultraiectina 2008, 294, 184. [Google Scholar]
- Szamałek, K.; Szuflicki, M.; Malon, A.; Tymiński, M. Mineral Resources of Poland; Geological Institute—National Research Institute: Warsaw, Poland, 2017.
- Ciesielczuk, J.; Fabiańska, M.J.; Misz-Kennan, M.; Jura, D.; Filipiak, P.; Matuszewska, A. The Disappearance of Coal Seams Recorded in Associated Gangue Rocks in the SW Part of the Upper Silesian Coal Basin, Poland. Minerals 2021, 11, 735. [Google Scholar] [CrossRef]
- Bielowicz, B. Selected Critical Raw Materials in Waste from Coal Gasification in Poland. Energies 2021, 14, 8071. [Google Scholar] [CrossRef]
- Koteras, A.; Chećko, J.; Urych, T.; Magdziarczyk, M.; Smoliński, A. An Assessment of the Formations and Structures Suitable for Safe CO2 Geological Storage in the Upper Silesia Coal Basin in Poland in the Context of the Regulation Relating to the CCS. Energies 2020, 13, 195. [Google Scholar] [CrossRef]
- Sutkowska, K.; Teper, L.; Czech, T.; Walker, A. Assessment of the Condition of Soils before Planned Hard Coal Mining in Southern Poland: A Starting Point for Sustainable Management of Fossil Fuel Resources. Energies 2023, 16, 737. [Google Scholar] [CrossRef]
- Wetzel, M.; Otto, C.; Chen, M.; Masum, S.; Thomas, H.; Urych, T.; Bezak, B.; Kempka, T. Hydromechanical Impacts of CO2 Storage in Coal Seams of the Upper Silesian Coal Basin (Poland). Energies 2023, 16, 3279. [Google Scholar] [CrossRef]
- Heckel, P.H.; Clayton, G. The carboniferous system. Use of the new official names for the subsystems, series, and stages. Geol. Acta 2006, 4, 403–407. [Google Scholar]
- Wang, X.; Hu, K.; Qie, W.; Sheng, Q.; Chen, B.; Lin, W.; Yao, L.; Wang, Q.; Qi, Y.; Chen, J.; et al. Carboniferous integrative stratigraphy and timescale of China. Science China. Earth Sci. 2019, 62, 135–153. [Google Scholar]
- Sprague, R.A.; Melvin, J.A.; Conradi, F.G.; Pearce, T.J.; Dix, M.A.; Hill, S.D.; Canham, H. Integration of Core-based Chemostratigraphy and Petrography of the Devonian Jauf Sandstones, Uthmaniya Area, Ghawar Field, Eastern Saudi Arabia. AAPG Search Discov. 2009, 34, 20065. [Google Scholar]
- Chen, M.; Nie, F.; Xia, F.; Yan, Z.; Yang, D. Provenance, Sedimentary Environment, Tectonic Setting, and Uranium Mineralization Implications of the Yaojia Formation, SW Songliao Basin, NE China. Minerals 2023, 13, 1053. [Google Scholar] [CrossRef]
- Metz Metzger, J.G.; Fike, D.A.; Smith, L.B. Applying carbon-isotope stratigraphy using well cuttings for high-resolution chemostratigraphic correlation of the subsurface. AAPG Am. Assoc. Pet. Geol. Bull. 2014, 98, 1551–1576. [Google Scholar] [CrossRef]
- Wright, A.M.; Spain, D.; Ratcliffe, K.T. Application of inorganic whole rock geochemistry of shale resource plays. In Proceedings of the Canadian Unconventional Resources and International Petroleum Conference, Calgary, AB, Canada, 19–21 October 2010. [Google Scholar]
- Cai, Y.; Ouyang, F.; Luo, X.; Zhang, Z.; Wen, M.; Luo, X.; Tang, R. Geochemical Characteristics and Constraints on Provenance, Tectonic Setting, and Paleoweathering of Middle Jurassic Zhiluo Formation Sandstones in the Northwest Ordos Basin, North-Central China. Minerals 2022, 12, 603. [Google Scholar] [CrossRef]
- Hayashi, K.; Fujisawa, H.; Holland, H.; Ohmoto, H. Geochemistry of ~1.9 Ga sedimentary rocks from northeastern Labrador, Canada. Geochim. Cosmochim. Acta 1997, 61, 4115–4137. [Google Scholar] [CrossRef]
- Cullers, R.L. The geochemistry of shales, siltstones and sandstones of Pennsylvanian-Permian age, Colorado, USA: Implications for provenance and metamorphic studies. Lithos 2000, 51, 305–327. [Google Scholar] [CrossRef]
- Cullers, R.L. Implications of elemental concentrations for provenance, redox conditions, and metamorphic studies of shales and limestones near Pueblo, CO, USA. Chem. Geol. 2002, 191, 305–327. [Google Scholar] [CrossRef]
- Harnois, L. The CIW index: A new chemical index of weathering. Sediment. Geol. 1988, 55, 319–322. [Google Scholar] [CrossRef]
- Makoundi, C.; Endut, Z.; Zaw, K. Geochemistry of the Devonian and Permo-Triassic Black Shales in Peninsular Malaysia: Insights into Provenance, Tectonic Setting, and Source Rock Weathering. Minerals 2023, 13, 911. [Google Scholar] [CrossRef]
- Phillips, O.A.; Falana, A.O.; Adebayo, A.J. The geochemical composition of sediment as a proxy of provenance and weathering intensity: A case study of Southwest nigeria’s coastal creeks geology. Geophys. Environ. 2017, 43, 229–248. [Google Scholar] [CrossRef]
- Qi, L.; Wang, H.; Shi, Z.; Zhou, T.; Li, G.; Sun, S.; Cheng, F. Mineralogical and Geochemica Chaacteristics of the Deeply Buried Wufeng–Longmaxi Shale in the Southern Sichuan Basin, China: Implications for Provenance and Tectonic Setting. Minerals 2023, 13, 1502. [Google Scholar] [CrossRef]
- McLennan, S.M. Rrare earth elements in sedimentary rocks. influence of provenance and sedimentary processes. Rev. Mineral. 1989, 21, 169–200. [Google Scholar]
- McLennan, S.M. Weathering and global denudation. J. Geol. 1993, 101, 295–303. [Google Scholar] [CrossRef]
- McLennan, S.M.; Hemming, S.; McDaniel, D.K.; Hanson, G.M. Geochemical approaches to sedimentation, provenance, and tectonics. In Processes Controlling the Composition of Clastic Sediments; Johnsson, M.J., Basu, A., Eds.; GSA Special Papers; Geological Society of America: Boulder, CO, USA, 1993; Volume 284, pp. 21–40. [Google Scholar]
- Armstrong-Altrin, J.S.; Pandarinath, K.; Verma, S.K. Geochemical Treasures and Petrogenetic Processes; Springer: Berlin/Heidelberg, Germany, 2022. [Google Scholar]
- Taylor, S.R.; McLennan, S.H. The Continental Crust: Its Composition and Evolution; Blackwell: Oxford, UK, 1985. [Google Scholar]
- Algeo, T.J.; Maynard, J.B. Trace element behavior and redox facies in core shales of Upper Pennsylvanian Kansas type cyclothems. Chem. Geol. 2004, 206, 289–318. [Google Scholar] [CrossRef]
- Algeo, T.J.; Maynard, J.B. Trace-metal covariation as a guide to water mass conditions in ancient anoxic marine environments. Geosphere 2008, 4, 872–887. [Google Scholar] [CrossRef]
- Jones, B.; Manning, D. Comparison of geochemical indices used for the interpretation of palaeoredox conditions in ancient mudstones. Chem. Geol. 1994, 111, 111–129. [Google Scholar] [CrossRef]
- Rimmer, S.M.; Thompson, J.A.; Goodnight, S.A.; Robl, T.L. Multiple controls on the preservation of organic matter in Devonian-Mississippian marine black shales: Geochemical and petrographic evidence. Palaeogeogr. Palaeoclimatol. Palaeoecol. 2004, 215, 125–154. [Google Scholar] [CrossRef]
- Yao, Z.; Yu, H.; Yang, F.; Jianatayi, D.; Zhang, B.; Li, T.; Jia, C.; Pan, T.; Zhang, Z.; Aibibuli, N.; et al. Provenance, Depositional Environment, and Paleoclimatic Conditions of a Near-Source Fan Delta: A Case Study of the Permian Jiamuhe Formation in the Shawan Sag, Junggar Basin. Minerals 2023, 13, 1251. [Google Scholar] [CrossRef]
- Pattan, J.N.; Pearce, N.J.G.; Mislankar, P.G. Constrains in using cerium-anomaly of bulk sediments as an indicator of paleo bottom water redox environment: A case study from the Central Indian Ocean Basin. Chem. Geol. 2005, 221, 260–278. [Google Scholar] [CrossRef]
- Hallberg, R.O. A geochemical method for investigation of paleoredox conditions in sediments. Ambio Spec. Rep. 1976, 4, 139–147. [Google Scholar]
- Mange, M.A.; Morton, A.C. Geochemistry of heavy minerals. Dev. Sedimentol. 2007, 58, 345–391. [Google Scholar]


| SiO2/Al2O3 | <4 | Fe2O3 < 10% | Claystones |
| SiO2/Al2O3 | 4–6 | Siltstones | |
| SiO2/Al2O3 | 6–10 | Argillaceous sandstone | |
| SiO2/Al2O3 | >10 | Sandstones | |
| SiO2/Al2O3 | <4 | Fe2O3 > 10% | Fe-rich claystone |
| SiO2/Al2O3 | 4–6 | Fe-rich siltstone | |
| SiO2/Al2O3 | 6–10 | Fe-rich argillaceous sandstone | |
| SiO2/Al2O3 | >10 | Fe-rich sandstone | |
| SiO2/Al2O3 | >10 | MgO > 5% | Dolomitic sandstone |
| Major Oxides | Detection Level | Claystones and Siltstones | Sandstones | ||||||
|---|---|---|---|---|---|---|---|---|---|
| Average (n = 106) | Max. | Min. | SD | Average (n = 15) | Max. | Min. | SD | ||
| SiO2 (%) | 0.01 | 57.5 | 69.8 | 23.5 | 7.5 | 81.7 | 90.2 | 70.2 | 5.9 |
| Al2O3 (%) | 0.01 | 20.3 | 27.3 | 8.6 | 3.6 | 7.5 | 11.7 | 4.7 | 1.9 |
| Fe2O3 (%) | 0.04 | 5.3 | 32.9 | 1.0 | 5.2 | 2.8 | 8.2 | 1.1 | 1.8 |
| CaO (%) | 0.01 | 0.22 | 1.78 | 0.06 | 0.26 | 0.30 | 1.20 | 0.07 | 0.28 |
| MgO (%) | 0.01 | 1.47 | 6.79 | 0.76 | 0.94 | 0.68 | 1.86 | 0.17 | 0.48 |
| Na2O (%) | 0.01 | 0.57 | 1.11 | 0.28 | 0.20 | 0.57 | 1.07 | 0.25 | 0.21 |
| K2O (%) | 0.01 | 3.26 | 5.69 | 1.56 | 0.70 | 1.68 | 2.22 | 0.94 | 0.39 |
| P2O5 (%) | 0.01 | 0.12 | 0.72 | 0.04 | 0.10 | 0.05 | 0.10 | 0.02 | 0.02 |
| MnO (%) | 0.01 | 0.07 | 0.35 | 0.01 | 0.07 | 0.05 | 0.14 | 0.01 | 0.03 |
| Cr2O3 (%) | 0.002 | 0.02 | 0.02 | 0.01 | 0.00 | 0.01 | 0.03 | 0.00 | 0.01 |
| TiO2 (%) | 0.01 | 0.99 | 1.26 | 0.44 | 0.15 | 0.34 | 0.63 | 0.13 | 0.14 |
| Element | Unit 1 | Unit 1 | Unit 2 | Unit 3 | Unit 4 |
|---|---|---|---|---|---|
| Si | Si vs. Ti | −0.56 | 0.80 | −0.51 | 0.89 |
| Si vs. Al | −0.80 | 0.58 | −0.77 | 0.62 | |
| Si vs. Fe | 0.00 | −0.89 | −0.11 | −0.88 | |
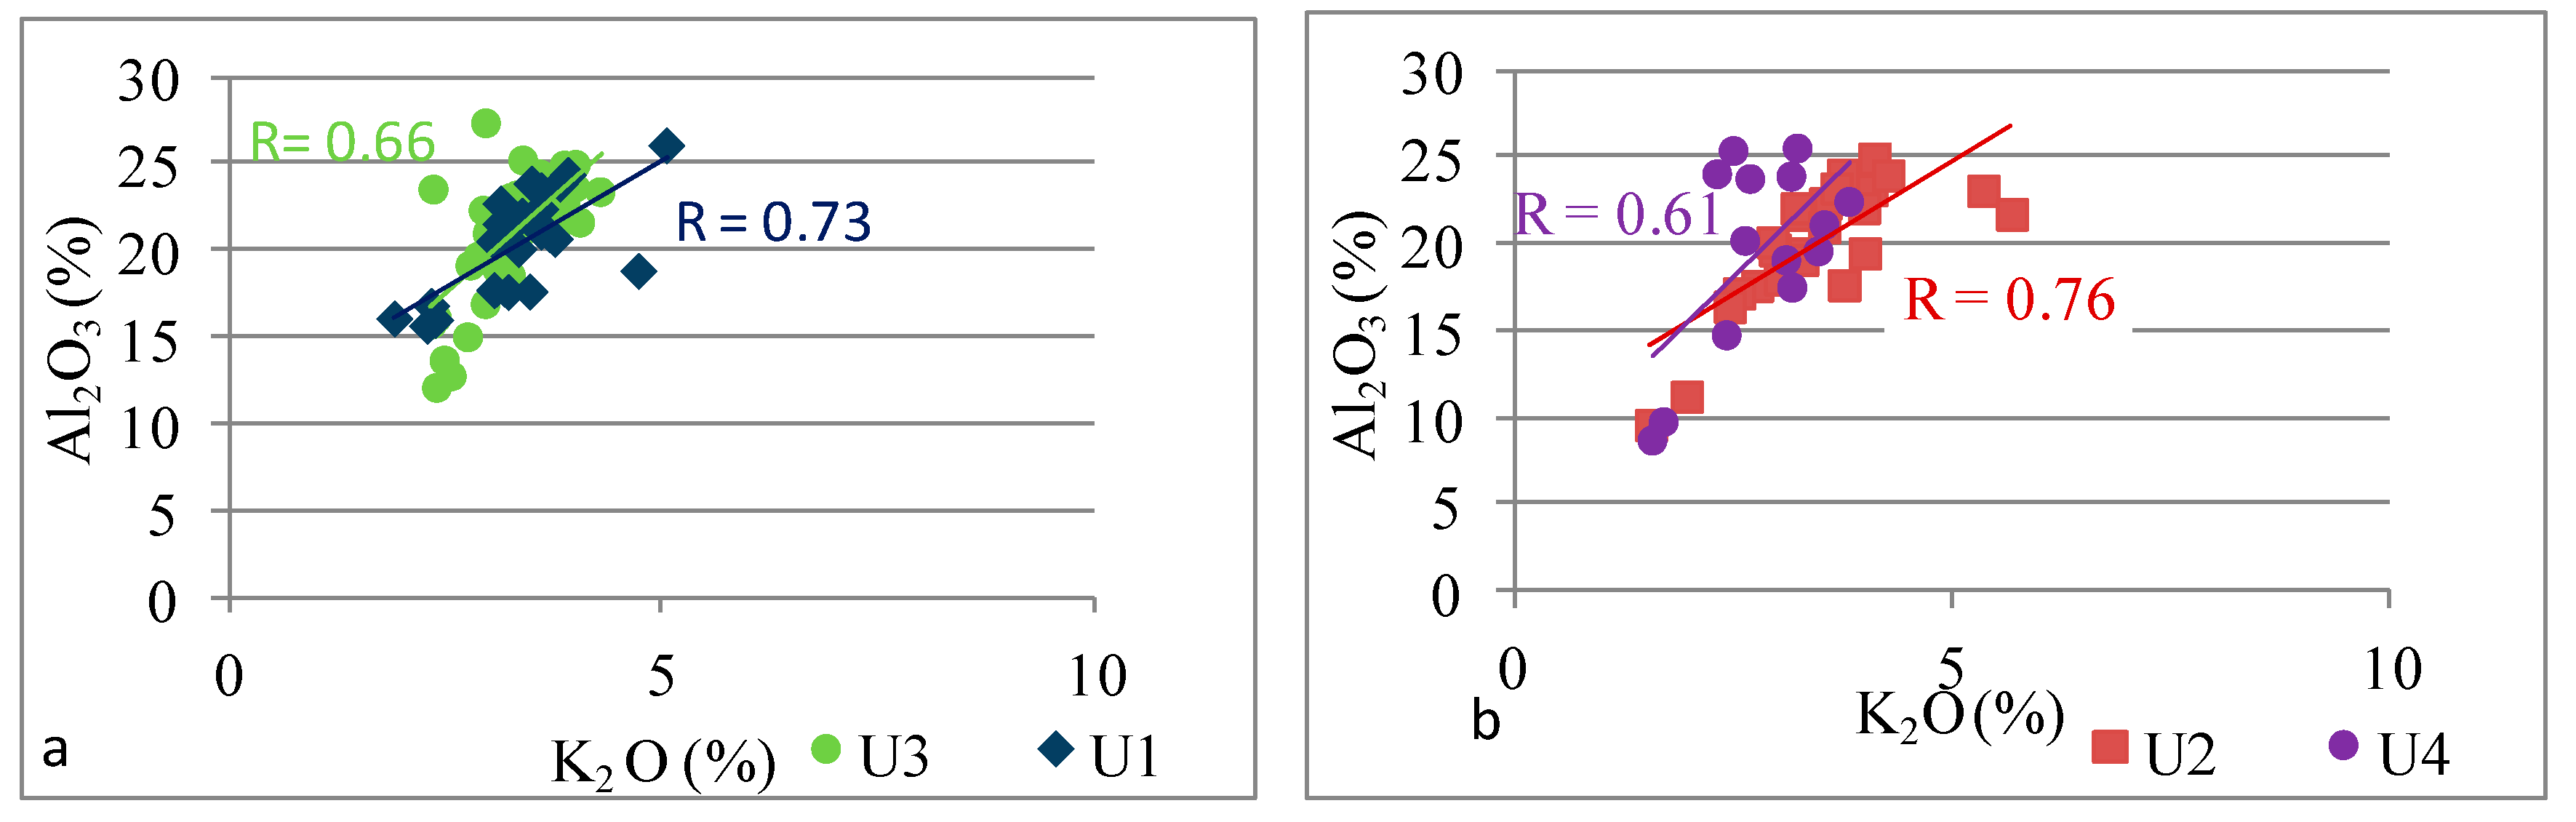
| K | K vs. Al. | 0.70 | 0.76 | 0.66 | 0.61 |
| Fe | Fe vs. Ca | 0.79 | 0.87 | 0.27 | 0.89 |
| Fe vs. Mg | 0.44 | 0.93 | 0.62 | 0.97 | |
| Fe vs. P | 0.61 | 0.76 | 0.04 | 0.72 | |
| Fe vs. Mn | 0.94 | 0.92 | 0.92 | 0.99 | |
| Ca | Ca vs. Mg | 0.49 | 0.94 | 0.01 | 0.93 |
| Unit | Depth | Chemical Composition | Relationship between Selected Major Elements | Provenance | Redox Conditions | Trace Elements | |||||||||||
|---|---|---|---|---|---|---|---|---|---|---|---|---|---|---|---|---|---|
| Si vs. Ti | Si vs. Al | Al. vs. K | Fe vs. Ca | Fe vs. Mg | Fe vs. P | Fe vs. Mn | Ca vs. Mg | Al2O3/TiO2 La/Th | Th/Sc | TiO2/Zr | Th/La | V/Cr U/Th (Cu+Mo)/Zn | Ni/Co | Zr, Hf, Nb, Ta, Ti | |||
| Unit 4 | 585–481 m | levels enriched in Fe, Ca, Mg, Mn, and P | strong positive | moderate positive | moderate positive | strong positive | strong positive | strong positive | strong positive | strong positive | inter felsic | mafic inter | inter | mostly inter felsic | oxic | oxic | depletion |
| Unit 3 | 985–585 m | geochemical homogeneity | moderate negative | strong negative | moderate positive | none | moderate positive | none | strong positive | none | inter felsic | inter felsic | inter | mostly inter felsic | oxic | oxic dysoxic | enrichment |
| Unit 2 | 1145–985 m | levels enriched in Fe, Ca, Mg, Mn, and P | strong positive | moderate positive | moderate positive | strong positive | strong positive | strong positive | strong positive | strong positive | inter felsic | mafic inter | inter | mostly inter felsic | oxic | oxic dysoxic | depletion |
| Unit 1 | 1298–1145 m | geochemical homogeneity | moderate negative | strong negative | moderate positive | strong positive | weak positive | moderate positive | strong positive | weak positive | inter felsic | mafic inter felsic | inter | inter felsic | oxic | oxic | enrichment |
| Trace Element | Detection Level | Claystones and Siltstones | Sandstones | ||||||
|---|---|---|---|---|---|---|---|---|---|
| Average (n = 106) | Max. | Min. | SD | Average (n = 15) | Max. | Min. | SD | ||
| Zr (ppm) | 0.01 | 119.7 | 169.5 | 47.4 | 18.4 | 63.6 | 93.9 | 29.6 | 23.0 |
| Hf (ppm) | 0.01 | 3.56 | 5.30 | 1.30 | 0.59 | 1.87 | 2.80 | 0.90 | 0.68 |
| Ti (%) | 0.001 | 0.52 | 0.64 | 0.18 | 0.08 | 0.16 | 0.33 | 0.06 | 0.07 |
| Nb (ppm) | 0.01 | 15.81 | 20.20 | 5.30 | 2.66 | 4.44 | 8.50 | 2.00 | 1.96 |
| Ta (ppm) | 0.01 | 1.18 | 1.50 | 0.40 | 0.21 | 0.36 | 0.70 | 0.10 | 0.16 |
Disclaimer/Publisher’s Note: The statements, opinions and data contained in all publications are solely those of the individual author(s) and contributor(s) and not of MDPI and/or the editor(s). MDPI and/or the editor(s) disclaim responsibility for any injury to people or property resulting from any ideas, methods, instructions or products referred to in the content. |
© 2024 by the author. Licensee MDPI, Basel, Switzerland. This article is an open access article distributed under the terms and conditions of the Creative Commons Attribution (CC BY) license (https://creativecommons.org/licenses/by/4.0/).
Share and Cite
Krzeszowska, E. Chemostratigraphic Approach to the Study of Resources’ Deposit in the Upper Silesian Coal Basin (Poland). Energies 2024, 17, 642. https://doi.org/10.3390/en17030642
Krzeszowska E. Chemostratigraphic Approach to the Study of Resources’ Deposit in the Upper Silesian Coal Basin (Poland). Energies. 2024; 17(3):642. https://doi.org/10.3390/en17030642
Chicago/Turabian StyleKrzeszowska, Ewa. 2024. "Chemostratigraphic Approach to the Study of Resources’ Deposit in the Upper Silesian Coal Basin (Poland)" Energies 17, no. 3: 642. https://doi.org/10.3390/en17030642
APA StyleKrzeszowska, E. (2024). Chemostratigraphic Approach to the Study of Resources’ Deposit in the Upper Silesian Coal Basin (Poland). Energies, 17(3), 642. https://doi.org/10.3390/en17030642