Article

Power Generation Mix Optimization under Auction Mechanism for Carbon Emission Rights

1
School of Management and Economics, Beijing Institute of Technology, Beijing 100081, China
2
International Business School, University of International Business and Economics, Beijing 100029, China
*
Author to whom correspondence should be addressed.
Energies 2024, 17(3), 617; https://doi.org/10.3390/en17030617
Submission received: 6 December 2023 / Revised: 4 January 2024 / Accepted: 18 January 2024 / Published: 27 January 2024
(This article belongs to the Special Issue Studies of Energy Economics and Environmental Policies in China)

Abstract

:
As the international community attaches importance to environmental and climate issues, carbon dioxide emissions in various countries have been subject to constraints and limits. The carbon trading market, as a market tool to reduce greenhouse gas emissions, has gone through a development process from a pilot carbon market to a national carbon market in China. At present, the industries included in the national carbon market are mainly the electric power industry, and the carbon emissions of the electric power industry account for about 40% of the national carbon emissions. According to the construction history of foreign carbon markets, China’s future carbon quota allocation will gradually transition from free allocation to auction allocation, and the auction mechanism will bring a heavy economic burden to the electric power industry, especially the thermal power generation industry. Therefore, this study takes Guangdong Province as an example to optimize the power generation mix with the objective of minimizing the total economic cost after the innovative introduction of the carbon quota auction mechanism, constructs an optimization model of the power generation mix based on the auction ratio by comprehensively applying the system dynamics model and the multi-objective linear programming model, systematically researches the power generation structure under different auction ratios with the time scale of months, and quantitatively evaluates the economic inputs needed to reduce the greenhouse gas emissions. The results of the study show that after comprehensively comparing the total economic cost, renewable energy development, and carbon emissions, it is the most scientific and reasonable to set the auction ratio of carbon allowances at 20%, which achieves the best level of economic and environmental benefits.

1. Introduction

As the international community attaches more attention to environmental and climate issues, carbon dioxide emissions have become limited, whereas fossil energy consumption has become the main source of carbon dioxide emissions [1]. Since coal occupies a large proportion of China’s energy structure, the carbon emissions generated by the power industry, which is mainly coal-fired power generation, account for the largest share of carbon emissions from the combustion of fossil energy, so the economic development of China’s power industry is facing severe pressure to reduce emissions [2]. Not only does the international community pay attention to carbon emissions from fossil fuels, but the Chinese government has also introduced a series of policy plans to guide carbon reduction in the electricity industry. The program to build a new type of power system was released in 2021, which signals the future development of the power industry toward a more secure, efficient, clean, and low-carbon direction [3]. With the introduction of the dual carbon target and green technological innovation of power generation [4], the restructuring and optimization of the national and regional power generation mix will need to be flexible and responsive to environmental changes to enable power utilities to better serve other industries and promote sustainable development for the whole of society [5].
What are the key future challenges facing the power sector? The primary challenge lies in the transition from free allocation to auction allocation as the method of carbon allowance distribution [6]. Under the guidance of the Chinese government, seven carbon trading pilot schemes including Guangdong were launched in 2011. Like the real-time multi-energy market, power generation companies of different scales and technologies will also take turns bidding for carbon quotas in the carbon market to obtain them. In the end, auction transactions are carried out based on the carbon quota subscription and bidding quantities of multiple enterprises, with the highest bids becoming successful [7]. However, to consider the economic pressure of incorporated enterprises (power generation enterprises) in these carbon trading pilot projects, only Guangdong Province started the earliest attempt at a carbon allowance auction with the auction ratio set at 3% in China. Although the auction proportion of carbon allowance in Guangdong Province has risen to 5% by 2019, there is still a considerable gap compared with the more mature carbon market abroad. According to the ICAP Status Report (2019) and HER’s report, most carbon emission trading systems in the world have started to auction carbon quotas or intend to introduce an auction mechanism (as shown in Figure 1). Among them, the United States Western Climate Initiative (WCI) and the Regional Greenhouse Gas Initiative (RGGI) regularly auction quotas, and the auction ratio is set at 100%. The European Union Carbon Emissions Trading System (EUETS) also sets the auction ratio at nearly 60% and plans to achieve more ambitious emission reduction targets with a higher auction ratio in the third stage of the carbon trading market. On the one hand, China aims to promote international trade in a more environmentally friendly manner with the introduction of the carbon border tax. On the other hand, to fulfill emission reduction responsibilities and achieve a dual carbon target, the construction of a carbon market aligned with international standards becomes crucial. This involves gradually adopting measures such as compensated allocation of quotas and increasing auction ratios. These are important issues that need urgent consideration [8].
The second major challenge lies in the increased costs for power producers resulting from the auctioning of carbon allowances [9]. This impact will be particularly pronounced for thermal power generators, as carbon emission reduction costs will become a significant component of their overall expenses in the future. Failure to optimize the power generation structure in the power generation sector with the objective of minimizing total economic costs will burden thermal power generation enterprises economically, hampering their sustainable development capacity and international competitiveness. In more severe cases, it may even pose a threat to national energy security. The carbon allowance auction mechanism exerts influence on the power generation structure using two primary pathways. Firstly, the carbon allowance auction mechanism induces carbon price distortions through the bidding process for power generation enterprises in the short term. Secondly, the carbon quota auction mechanism plays a role in controlling the overall carbon emissions of power generation enterprises by regulating the carbon emission cap.
In addressing the challenges, this study aims to optimize the power generation mix with the objective of minimizing economic costs under different carbon allowance auction ratios. The current research on the optimization of power generation mix primarily innovates from the perspectives of data accuracy and optimization methods, with limited consideration for forward-looking aspects such as the introduction of a carbon quota auction mechanism. While some studies have incorporated carbon emissions trading systems into renewable energy dispatch and generation expansion planning [10], the majority still tend to opt for free allocation in the apportionment approaches about carbon quotas. Additionally, existing literature tends to focus on different spatial scales, paying little attention to temporal scales, especially at the monthly time scale, regarding changes in power generation structure. The power generation portfolios in different regions are constrained by variations in resource endowments, and there is heterogeneity in the power supply capabilities of various power generation technologies across different months and seasons [11].
Although several studies have attempted to predict the power generation structure at both national and provincial levels, a consensus has not yet been reached. Existing literature on power generation portfolios has predominantly employed optimization methods and simulation tools such as the LEAP model, CGE model, Power Planning Optimization Model of China (PPOM-CHINA) [12], superstructure optimization model [13], and multi-regional optimization methods [14]. However, these models have primarily focused on minimizing the cost of power generation and have often overlooked the potential improvement and adjustment of the power generation structure resulting from the environmental shift in carbon allowance allocation methods, specifically from free allocation to auction allocation. In terms of originality, limited research has quantitatively examined the shadow price of carbon emission rights across different carbon allowance auction ratios and internalized the external costs associated with the power generation industry’s greenhouse gas emissions. Moreover, there is a dearth of studies focusing on the optimization of the regional power structure at a monthly resolution. Building upon the traditional power structure analysis, which primarily considers power generation costs, this study introduces additional influencing factors, including the cost of carbon emission reduction, air pollution emission costs, and net costs of purchased power. These factors are derived from market practices such as carbon trading and the demand for policy support. Existing research suggests that as the potential for emission reduction decreases in China’s electric power industry over time, the cost of carbon emission reduction will gradually escalate, eventually constituting a larger proportion of the power generation sector’s total economic cost. It is essential to acknowledge that the exclusion of external costs, such as carbon abatement expenses, from the total economic cost is both mathematically illogical and incongruent with the principles of sustainable development in terms of environmental impacts. Currently, the electricity market inadequately internalizes carbon abatement costs, resulting in economic costs of power generation that solely reflect the private costs of the product or service, without considering the environmental and climate impacts of greenhouse gas emissions. Consequently, there is an urgent imperative to internalize the cost of carbon emission reduction through policy instruments or market mechanisms. By implementing such measures, power generation companies can be aptly incentivized to proactively address greenhouse gas emissions, leading to the mitigation of environmental impacts and the promotion of sustainable development.
In this study, we focus on Guangdong Province as the geographical scope, constructing a comprehensive auction-ratio-based power structure optimization model. This model allows for systematic research of the power structure in a month-based time scale, enabling a quantitative assessment of the economic inputs required for greenhouse gas emissions reduction. Guangdong Province was selected due to its significant carbon trading activities, evident in its high carbon trading turnover and volume as reported by reputable statistical websites. Being the second-largest carbon trading market globally and the first large-scale domestic carbon trading market following the European Union, this province offers a valuable context for analysis [15]. Notably, Guangdong Province stands out among other carbon trading pilots as it implemented the auctioning of allowances, a market base already exists when the auction percentage is 3–5%. Investigating the optimal generation portfolio under different carbon allowance auction ratios in Guangdong Province and quantitatively assessing the corresponding total economic costs associated with the power supply planning can contribute to minimizing economic losses in the region. The subsequent sections of this paper are organized as follows: Section 2 provides a review of relevant studies, Section 3 presents an optimization model of the power generation mix based on the auction ratio, Section 4 outlines the data sources and presents the analysis of results, and Section 5 concludes with the policy implications derived from this study. The table below presents the variables and coefficients employed in this research.

2. Literature Review

The allocation of carbon allowances is a crucial aspect of carbon trading, which involves limiting and reducing greenhouse gas emissions, particularly carbon dioxide, through the trading of carbon allowances. This trading system aims to achieve global carbon emission reduction. In the carbon trading market, companies have the option to purchase carbon allowances to compensate for their inability to reduce greenhouse gas emissions or sell their excess allowances to other companies for profit. The carbon quota auction is expected to play a crucial role in China’s efforts to reduce emissions and achieve international alignment. In this context, it is imperative for the power generation industry to closely monitor the uncertainty associated with the auction ratio, which holds greater significance than ever before [16].
The accurate measurement of the scarcity value of carbon allowances is crucial to internalizing the external costs in the power generation industry. Currently, the carbon price in the carbon trading market does not fully account for the environmental cost. Additionally, the fluctuating auction transaction price makes it challenging to determine the true price of carbon emission rights. To better understand the cost burden imposed by carbon emission rights on the power industry’s emission reduction cost and overall economic cost, numerous scholars have researched the shadow price of carbon dioxide emission rights. They have specifically analyzed the various impacts of each production element on the national or regional GDP to facilitate the measurement of the emission reduction cost in the power generation industry. The shadow price reflects the scarcity of resources and environmental value, although there is no consensus on the most accurate estimation method for the shadow price. In previous studies, the measurement of the shadow price of carbon emission rights has been conducted through various methods, including the marginal cost method, model estimation method, and transaction data method. The marginal cost method, as exemplified by Zhou, estimates the shadow price by considering the relationship between production cost and carbon emission intensity [17]. However, this method has limitations as it does not fully account for market supply and demand dynamics and may be subject to bias due to simplified assumptions. The model estimation method, as demonstrated by Lee, employs economic models and statistical techniques to calculate the shadow price of carbon emission rights [18]. Nonetheless, this method necessitates extensive data requirements and may introduce uncertainties in parameter estimation, thereby affecting the accuracy of the results. The transaction data method, commonly utilized in certain reports, analyzes carbon trading activities and price fluctuations to infer future expectations of carbon emission rights prices. The main limitation of this method is that it relies on market participants’ expectations, which can be influenced by various factors such as the overall economic environment. The uncertainty of these expectations can also impact the accuracy of the calculation results. This study proposes the use of the system dynamics model to calculate the shadow price of carbon emission rights. The system dynamics model is advantageous as it can comprehensively consider multiple factors and is dynamic and effective. This approach also addresses the limitations of existing research. Additionally, the SD model requires relatively fewer data and enables more accurate analysis and prediction when dealing with the complex nonlinear relationship between the auction ratio and the shadow price of carbon emission rights.
Regarding the application of carbon quota allocation theory in the power industry, existing studies can be broadly categorized into three main areas. Firstly, research focuses on decision making in the power generation industry when faced with the choice between upgrading power generation equipment or purchasing carbon allowances when allowances are allocated free of charge. Secondly, studies explore the optimization of the power supply structure and the associated costs of carbon emission reduction when carbon allowances are allocated based on auction ratios. Lastly, investigations center on the number of allowances that can be obtained by the power generation industry under different allocation methods, followed by a comparative analysis of the economic costs and benefits of power generation enterprises using publicly available power industry data. Over the past decade, with increasing energy demands and the imperative for carbon emission reduction, optimizing the power generation mix has become a prominent research focus in the power industry. This study further enriches the existing research and expands its depth by introducing the carbon quota auction ratio and considering economic costs. The introduction of the carbon quota auction ratio can significantly impact the power market’s supply–demand relationship and price formation mechanism. As the auction ratio increases, both the power generation costs and emission reduction costs for power generation enterprises will also rise, thereby affecting the price and supply structure of the power market. From the perspective of the power generation sector, there are opportunities to alleviate economic pressures and achieve sustainable development by proactively addressing future carbon allowance allocation through auction ratios and devising comprehensive power generation portfolios on both monthly and annual scales.
Regarding the research on power generation structure, the existing papers have made innovative contributions in the following areas. Firstly, they have considered factors such as carbon constraints, carbon emission reduction, and the transition to a low carbon economy, which are all related to the control of greenhouse gas emissions [19]. Carbon constraints and emission reduction primarily restrict the carbon emissions of power generation enterprises, aiming to increase the usable hours for renewable energy generation while maintaining the stability of power supply and demand [20]. Low-carbon economy generally takes the function related to power generation cost as the objective function or brings the external environmental cost into the optimization of the generation portfolio. Both approaches influence the power generation mix from the perspectives of carbon emission control or economic cost constraints [21]. Secondly, there have been improvements and upgrades in the algorithms used to solve the model. For example, to enhance global search capability and eliminate local optimal solutions, Niknam employed an improved multi-phase modified shuffled frog leaping algorithm (MSFLA) to optimize the power generation structure [22]. Xu utilized the Markov chain model to predict the power generation portfolios of the power sector within the context of low-carbon economic development. The model was validated using data from the Ningxia region [23]. In the study on China’s efficient power generation portfolios, Shuang Zhang employed portfolio theory to explore the optimal power generation mix in 2030 [5]. It was found that preferences for non-fossil generation technologies were greatly influenced by the goals of pursuing cost or risk minimization and different policy targets. Utilizing multi-objective optimization and heuristic algorithms, Zhao et al. conducted a study on the short-term impact of the carbon quota auction ratio on the share of renewable power generation [24]. Their findings indicated that the inclusion of renewable power generation in the power generation mix did not exhibit significant changes when the auction ratio ranged from 0% to 5%. Building upon these existing studies and considering factors relevant to greenhouse gas emissions control, this paper introduces an innovative perspective by focusing on the carbon quota auction as a future trend in carbon trading. The study sets the auction ratio at intervals of 20% ranging from 0% to 100% to examine the optimal power structure of the region on a monthly time scale.

3. Methodology

Based on the theory of mathematical dynamic systems, this paper utilizes the SD model to simulate the electric carbon market under the carbon allowance auction mechanism. The objective is to depict the shadow price of carbon emission rights under different ratios of carbon allowance auctions. In comparison to other models, the SD model offers several advantages such as requiring less data, considering multiple influencing factors, and being dynamic. The interaction between the carbon allowance auction mechanism and the electricity carbon market is profound and multidimensional, making the SD model particularly suitable for studying the actual value of carbon emission rights in complex environments. The impact of the carbon allowance auction mechanism on the power generation mix is transmitted to the power generation structure through auction costs and environmental costs on the one hand, and through carbon cap on the other hand, which affect the production activities of electricity generation, such as the carbon emissions generated by thermal power generation. Using a multi-objective linear programming model, this study constructs a complete power generation structure optimization model based on the auction ratio to minimize the total economic cost, and its research framework is designed as follows (Figure 2):

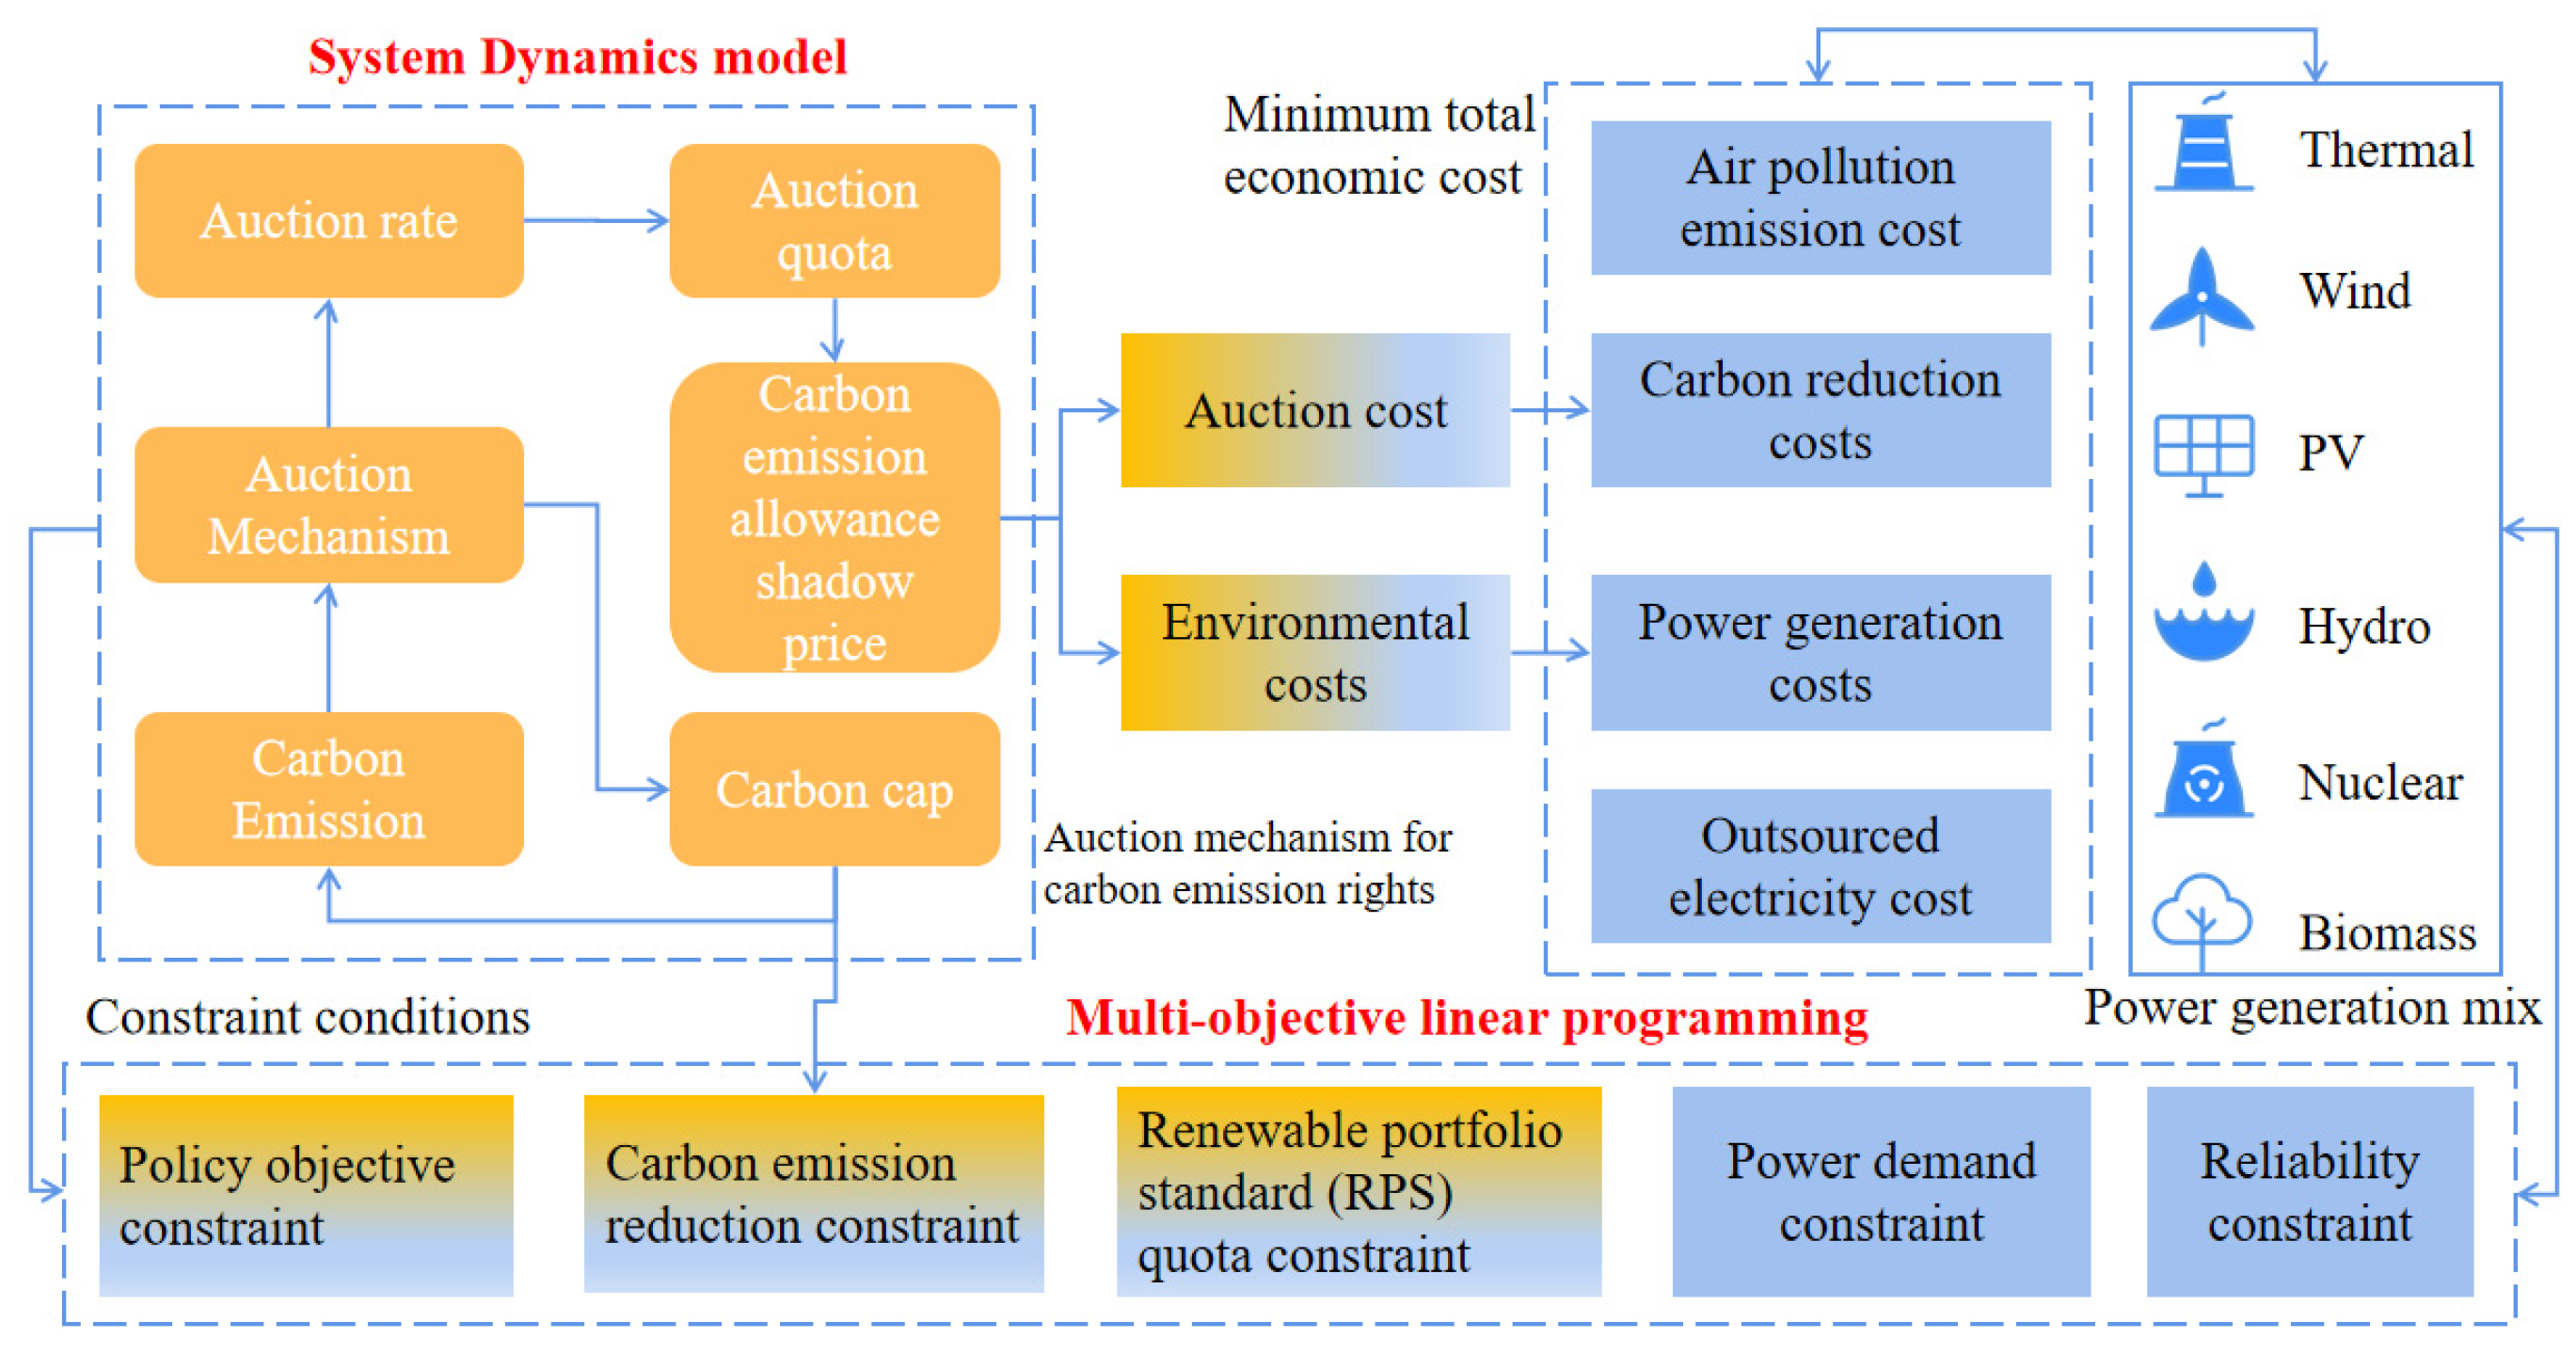
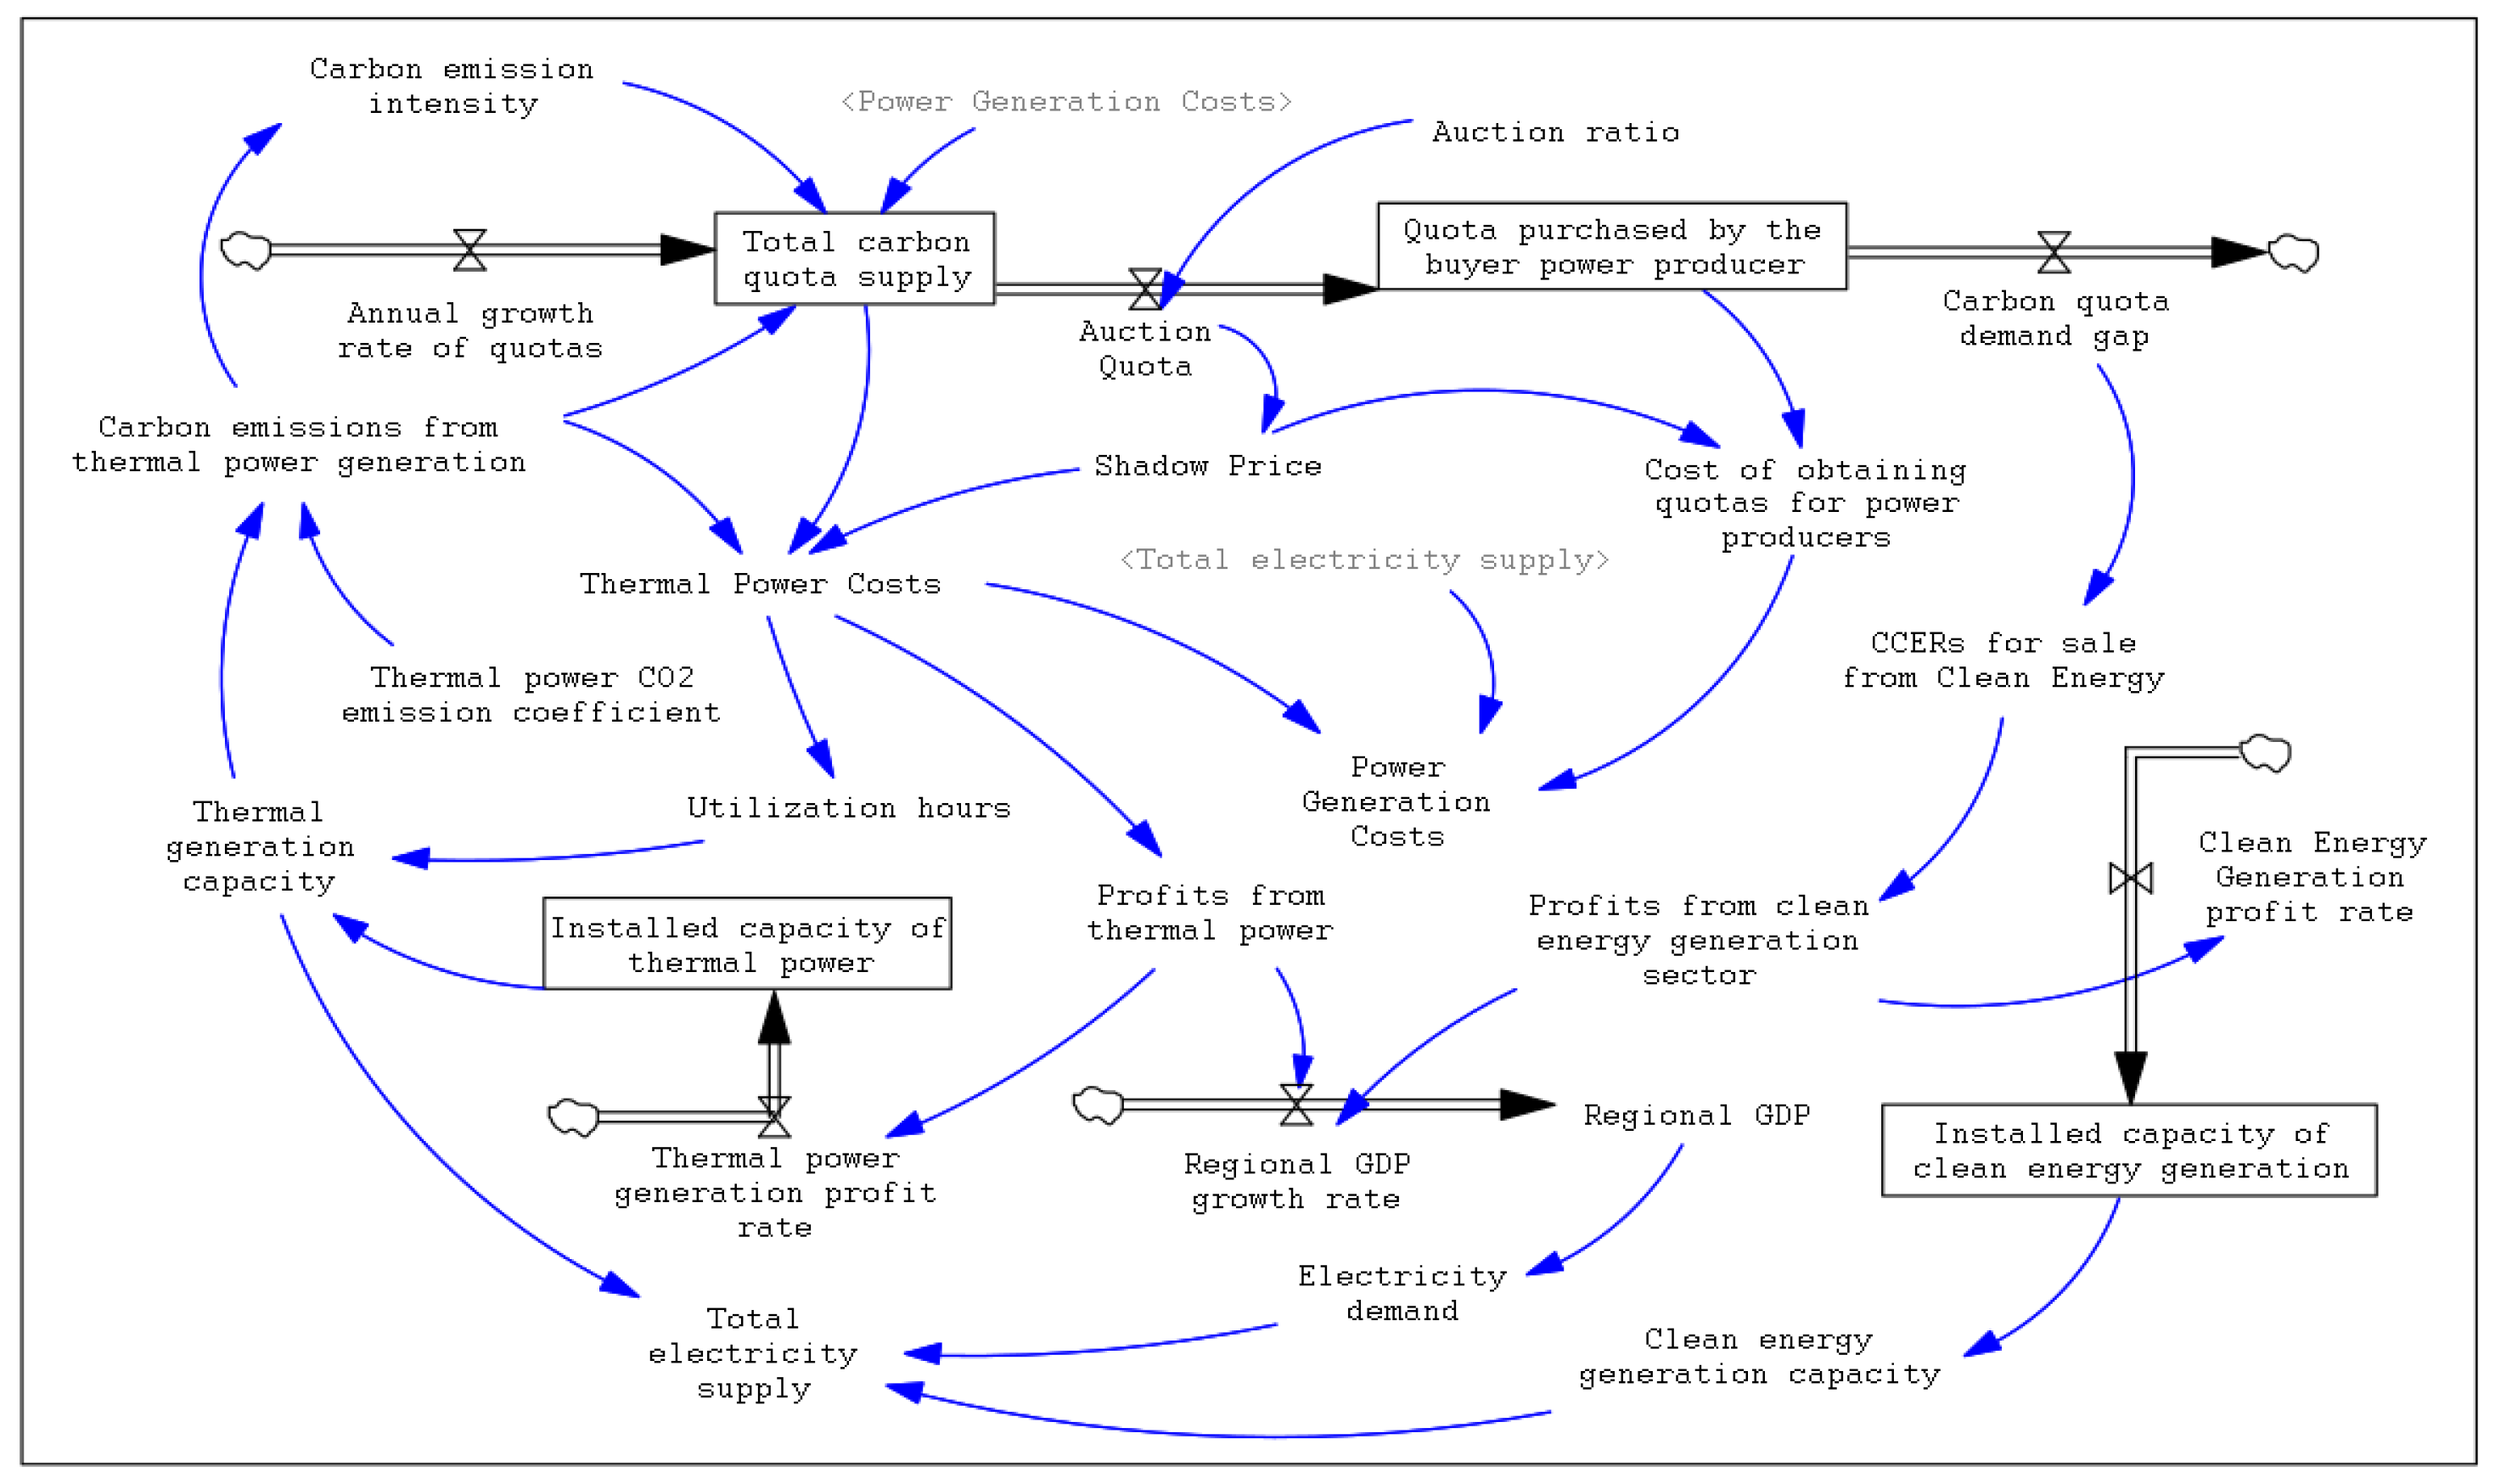
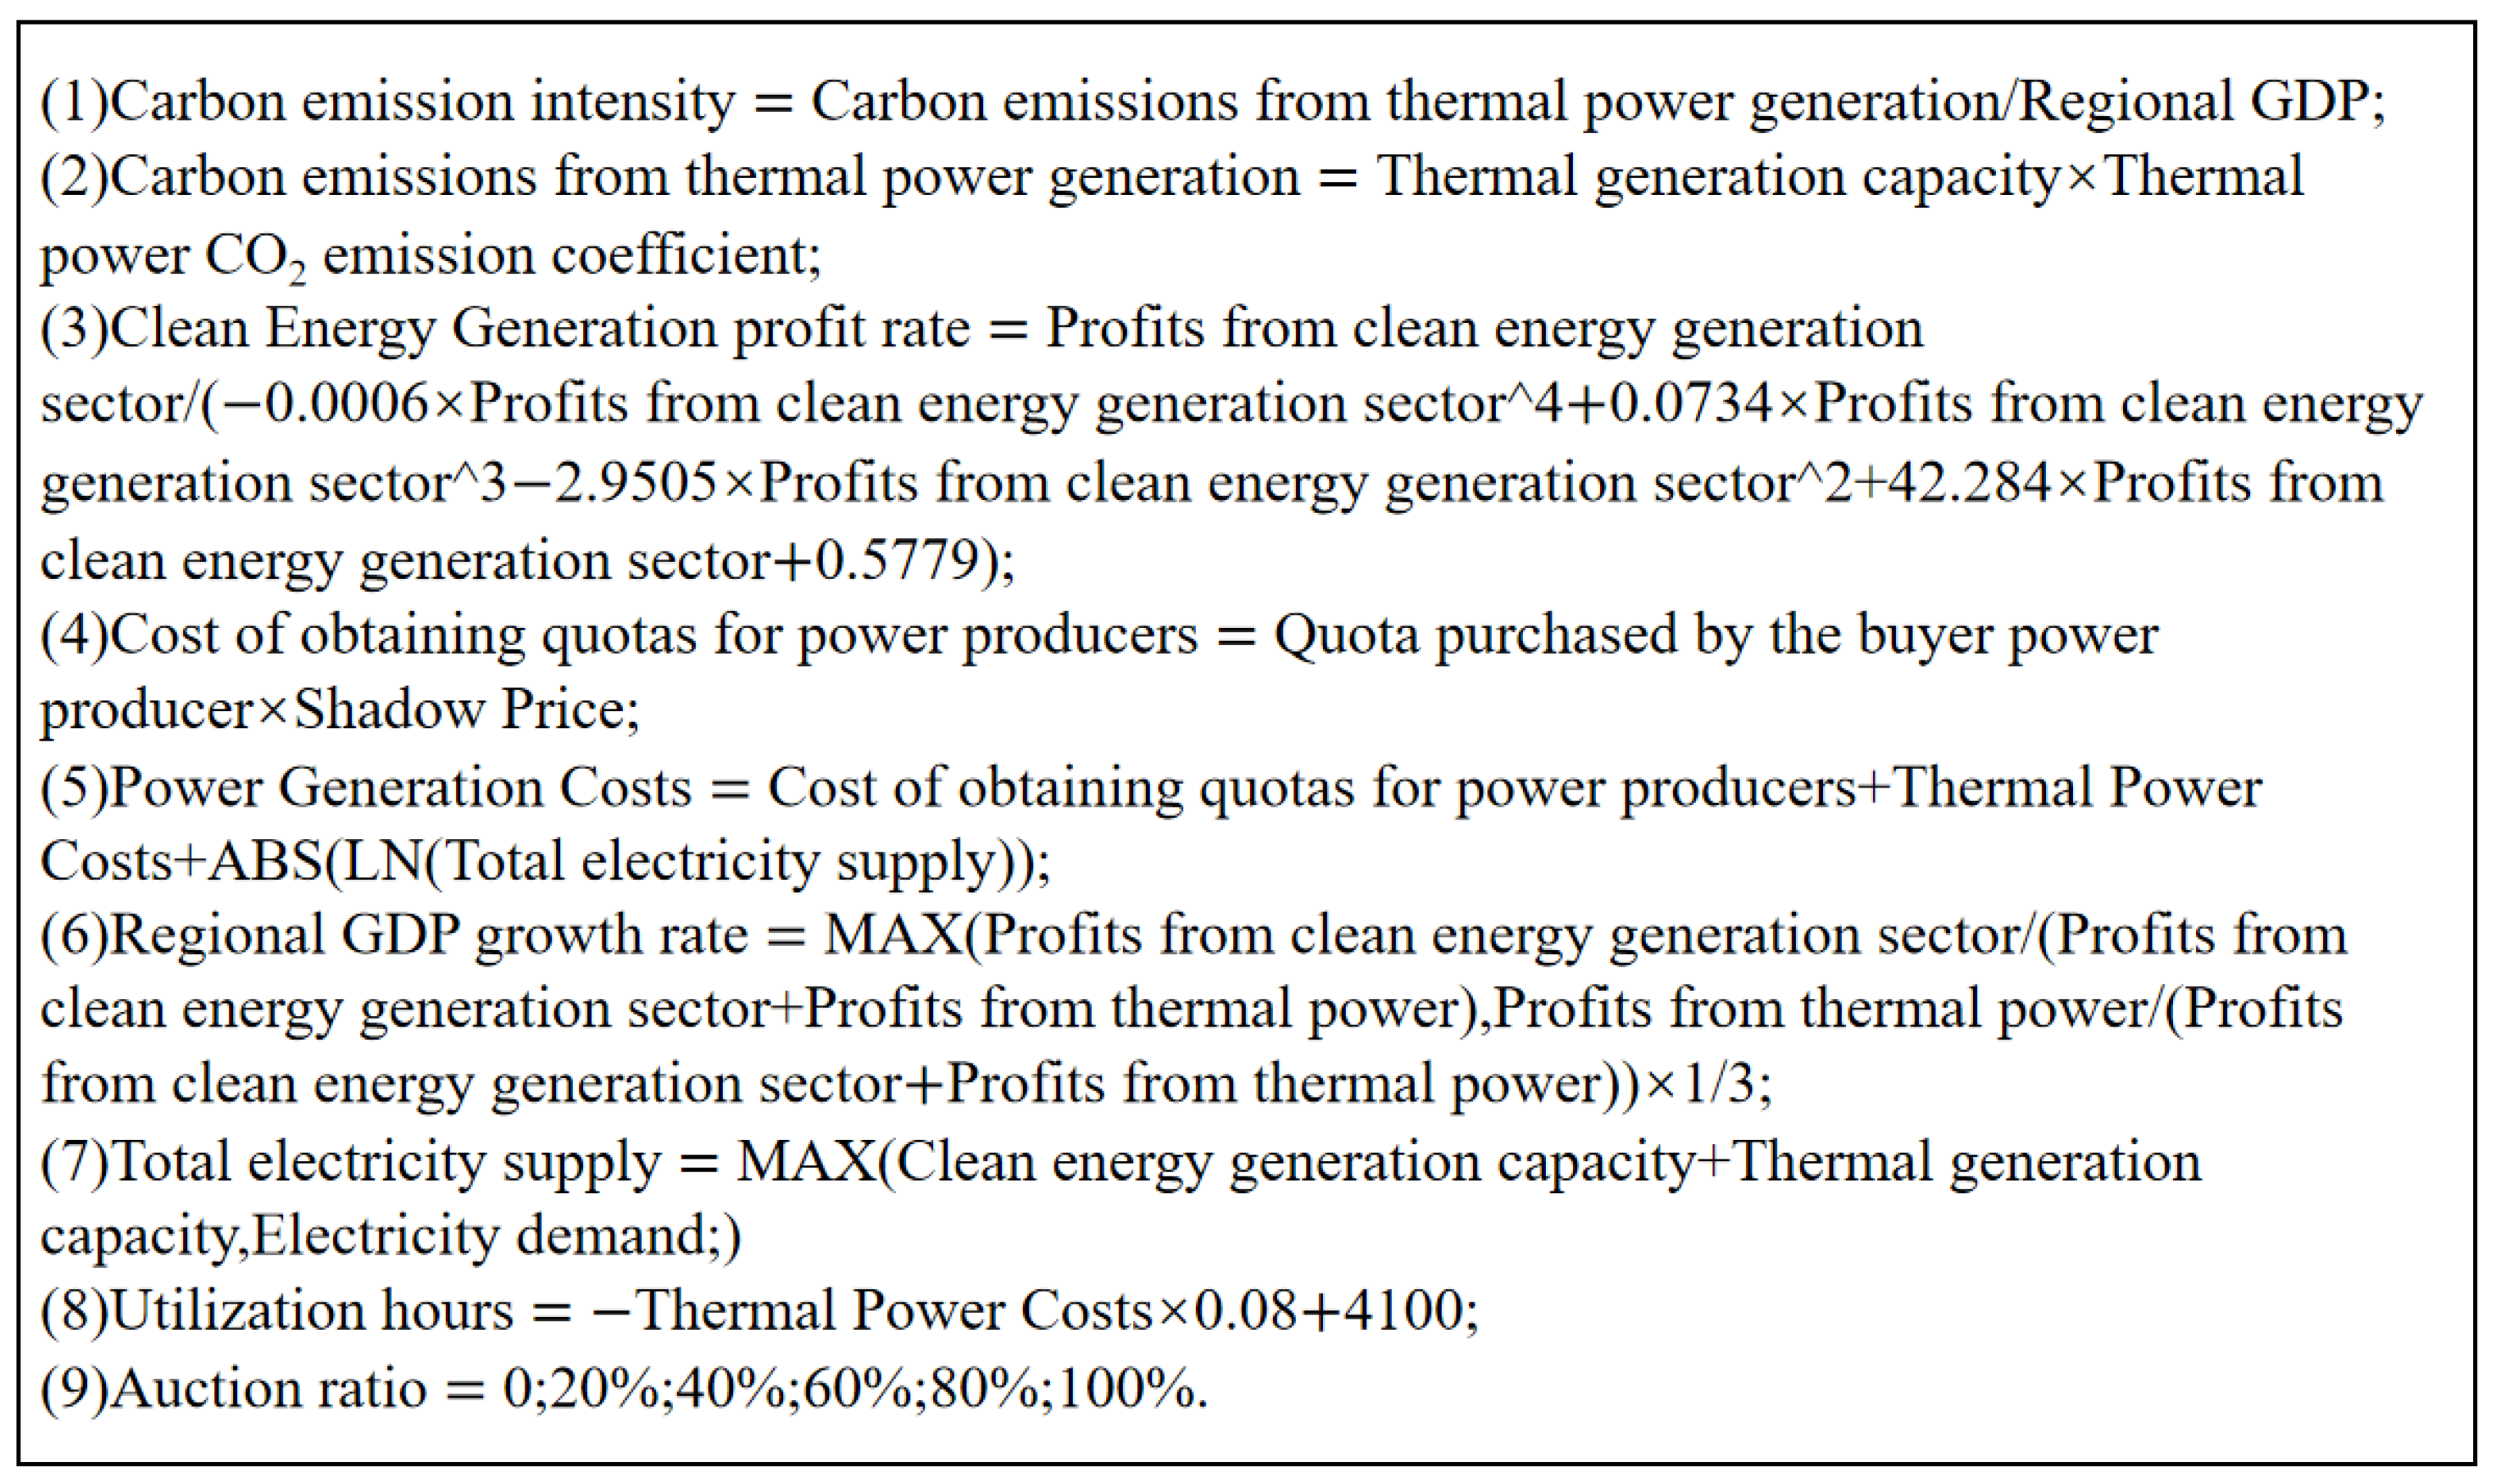
3.1. System Dynamics Model

This paper employs a system dynamics model to estimate the actual price of carbon emission rights. The carbon emission rights pricing model is developed based on the auction ratio, specifically focusing on the electric carbon market and the incorporation of carbon quota auction ratios [25]. Two key assumptions are considered as follows: (1) Carbon emission caps are allocated below the total carbon emissions of the power generation sector to enhance the emission reduction effectiveness of the carbon trading market. (2) The primary source of profit for the clean energy generation sector is measured by the sale of Chinese Certified Emission Reductions (CCERs). Figure 3 presents the carbon emission rights pricing model, comprising a stock-flow diagram and a mathematical–logical relationship equation derived through diverse methodologies. The carbon emission rights pricing model was constructed based on the carbon allowance auction mechanism and the overall operation of the power industry. Using a combination of qualitative description and quantitative research, the stock flow diagrams for the simulation model are shown in Figure 3.
When performing the simulation analysis, it is necessary to establish the differential equation, difference equation, or algebraic equation of the relationship between the variables, and then determine the initial values and parameters in the model by reviewing the information and literature. The simulation formulas for the interactions between variables are obtained through emission factor analysis, direct estimation, data fitting, and references to existing literature. Some of the key simulation equations are presented below (Figure 4).

3.2. Multi-Objective Linear Programming

In this paper, a multi-objective linear programming model is used to optimize the total economic cost under the introduction of a carbon allowance auction mechanism. Existing literature widely agrees that as the allocation of carbon allowances shifts from free allocation to proportional auction allocation, power-producing companies will face growing economic pressure. Consequently, it becomes imperative to optimize the power generation mix to minimize the economic burden.
(1)
Objective function
To assist power generation enterprises in reducing cost pressure and achieving sustainable development, this research incorporates four objectives into the optimization scope: total power generation cost, total emission reduction cost, air pollution emission cost, and net cost of outsourced electricity. As all four objectives are cost functions related to the decision variables, it is feasible to consolidate them into a single objective function, namely optimizing the total economic cost C :
M i n   C = C 1 + C 2 + C 3 + C 4
C 1 = i = 1 6 t = 1 12 ( C i , t × x i , t F i , t )
C i , t = C i B a s i c + C i , t E n v i r
C 1 B a s i c = C D 1 + C F 1 + C O 1
C i , t E n v i r = ϑ i , t × P E ( κ )
F i , t = π i × α i × γ i × x i , t
C 1 is the total power generation cost of each energy generation technology in Guangdong Province; C 2 is the total carbon emission reduction cost of each energy generation; C 3 is the air pollution emission cost; C 4 is the net cost of outsourced electricity; i denotes the various power generation technologies, i = 1,2 , 3,4 , 5,6 , which stands for thermal power generation, hydroelectric power generation, wind power generation, nuclear power generation, solar power generation, and biomass power generation, respectively. The implications represented by the other variables have been explained in detail in Table 1.
When evaluating the overall abatement cost of both thermal power generation and clean energy generation, the total abatement cost consists of two components. Firstly, it includes the cost incurred by thermal power enterprises when participating in the auction to acquire allowances at the initial stage. Secondly, it encompasses the cost that needs to be paid when the total carbon emissions of the power generation industry exceed the allocated allowances [26]. C 2 represents the total cost of carbon emission reduction for each energy source used in power generation.
C 2 = t = 1 12 κ × C E C A P t × P E ( κ ) + t = 1 12 P t × ( η i , t × x 1 , t + τ t × d t C E C A P t )
To effectively address policies pertaining to the development of a new power system and facilitate the transition towards a cleaner and low-carbon power sector, it is crucial to consider the costs associated with air pollution emissions during the optimization of the power generation mix. This entails accounting for the pollutants released into the atmosphere during the power generation process, specifically from thermal power plants and biomass power plants. These pollutants can be represented by the index p = 1,2 , 3,4 , corresponding to sulfur dioxide, nitrogen oxides, smoke and dust, and PM2.5, respectively. C 3 is the air pollution emission cost.
C 3 = i = 1,6 t = 1 12 p = 1 4 E C p × λ p , i × x i , t
= t = 1 12 [   E C 1 λ 1,1 + E C 2   λ 2,1 + E C 3 λ 3,1 + E C 4 λ 4,1 x 1 , t +   E C 1 λ 1,6 + E C 2 λ 2,6 + E C 4 λ 4,6 x 6 , t ]
Annually, the Guangdong power generation sector procures electricity from external regions to address occasional electricity shortages. The purchased electricity is then supplied to the province. According to the Guangdong Statistical Yearbook 2022, the share of purchased electricity concerning the province’s total electricity demand has shown a steady increase, rising from 9.5% in 2002 to 30.5% in 2018. Consequently, it becomes crucial and imperative to consider the cost associated with the procurement of electricity to meet the province’s demand.
C 4 = t = 1 12 ( d t × C t i n W t × C t o u t )
(2)
Constraint conditions
Electricity balance constraint. Local power generation plus outsourced electricity in Guangdong Province should be equal to the total social power demand plus the exported electricity [27].
i = 1 6 x i , t × 1 ε i , t 1 δ i , t + d t = D t + W t
Reliability constraint. The total available installed capacity should be not less than the maximum electricity load demand and the exported power demand in period t , and includes the installed capacity of the constructed units and the outsourced electricity [28].
M t + N t G t = i = 1 6 U i , t × α i + Y t
U i , t = x i , t H i , t , Y t = d t H t i n
System reserve margin constraint. The power system should have a certain amount of reserve capacity to meet the demand of power users in case of equipment maintenance or unexpected accidents; however, too much backup capacity will lead to overcapacity and waste of resources, so it is necessary to set a reasonable reserve margin.
i = 1 6 U i , t × α i + Y t N t M t 1 + β p
Renewable portfolio standard quota constraint. According to the document issued by the National Energy Administration (NEA) in 2022, “Circular of the National Energy Administration on the Completion of the Responsibility Weights for Renewable Energy Electricity Consumption in 2021”, each province should complete the assigned responsibility weights for total renewable energy electricity consumption. This means that the weight of responsibility for total renewable electricity consumption is located between the minimum value and the incentive value.
θ l o w t = 1 12 ( x 2 , t + x 3 , t + x 5 , t + x 6 , t + d t ) / t = 1 12 D t θ h i g h
Peaking constraint. When a significant share of renewable power sources are integrated into the grid, the conflict is intensified between peaking demand and the regulation of renewable energy. To ensure the secure operation of the grid, the depth of thermal power peaking needs to adhere to the following constraints [29].
ψ t h × x 1 , t H 1 , t     P 3 , t m a x + P 5 , t m a x + M t
Policy objective constraint. To curtail thermal power generation and promote renewable energy generation, government departments will further restrict the proportion of electricity generated from non-fossil energy sources and non-water renewable energy sources, with the following corresponding constraints:
X i , t = x i , t t = 1 12 D t
t = 1 12 ( X 2 , t + X 3 , t + X 4 , t + X 5 , t + X 6 , t ) X N F G t a r g e t
t = 1 12 ( X 3 , t + X 5 , t + X 6 , t ) X N H R t a r g e t
Carbon emission reduction constraints. According to the 14th Five-Year Plan of Guangdong Province, carbon emissions from the power generation sector must be kept below the carbon cap [27]:
C E = t = 1 12 i = 1 6 η i , t × x i , t E  
Actual constraint. The amount of power generation under various energy generation technologies should also be constrained by the corresponding installed capacity and equipment utilization hours [30].
U i , t × H i , t m i n x i , t     U i , t × H i , t m a x
Y t × H t , m i n i n   d t     Y t × H t , m a x i n
Non-negative constraint. The amount of power generation from energy type i in month t should not be less than zero and outsourced electricity in month t should not be less than zero.
x i , t 0 , d t 0

4. Data and Empirical Results

4.1. Data Collection

(1)
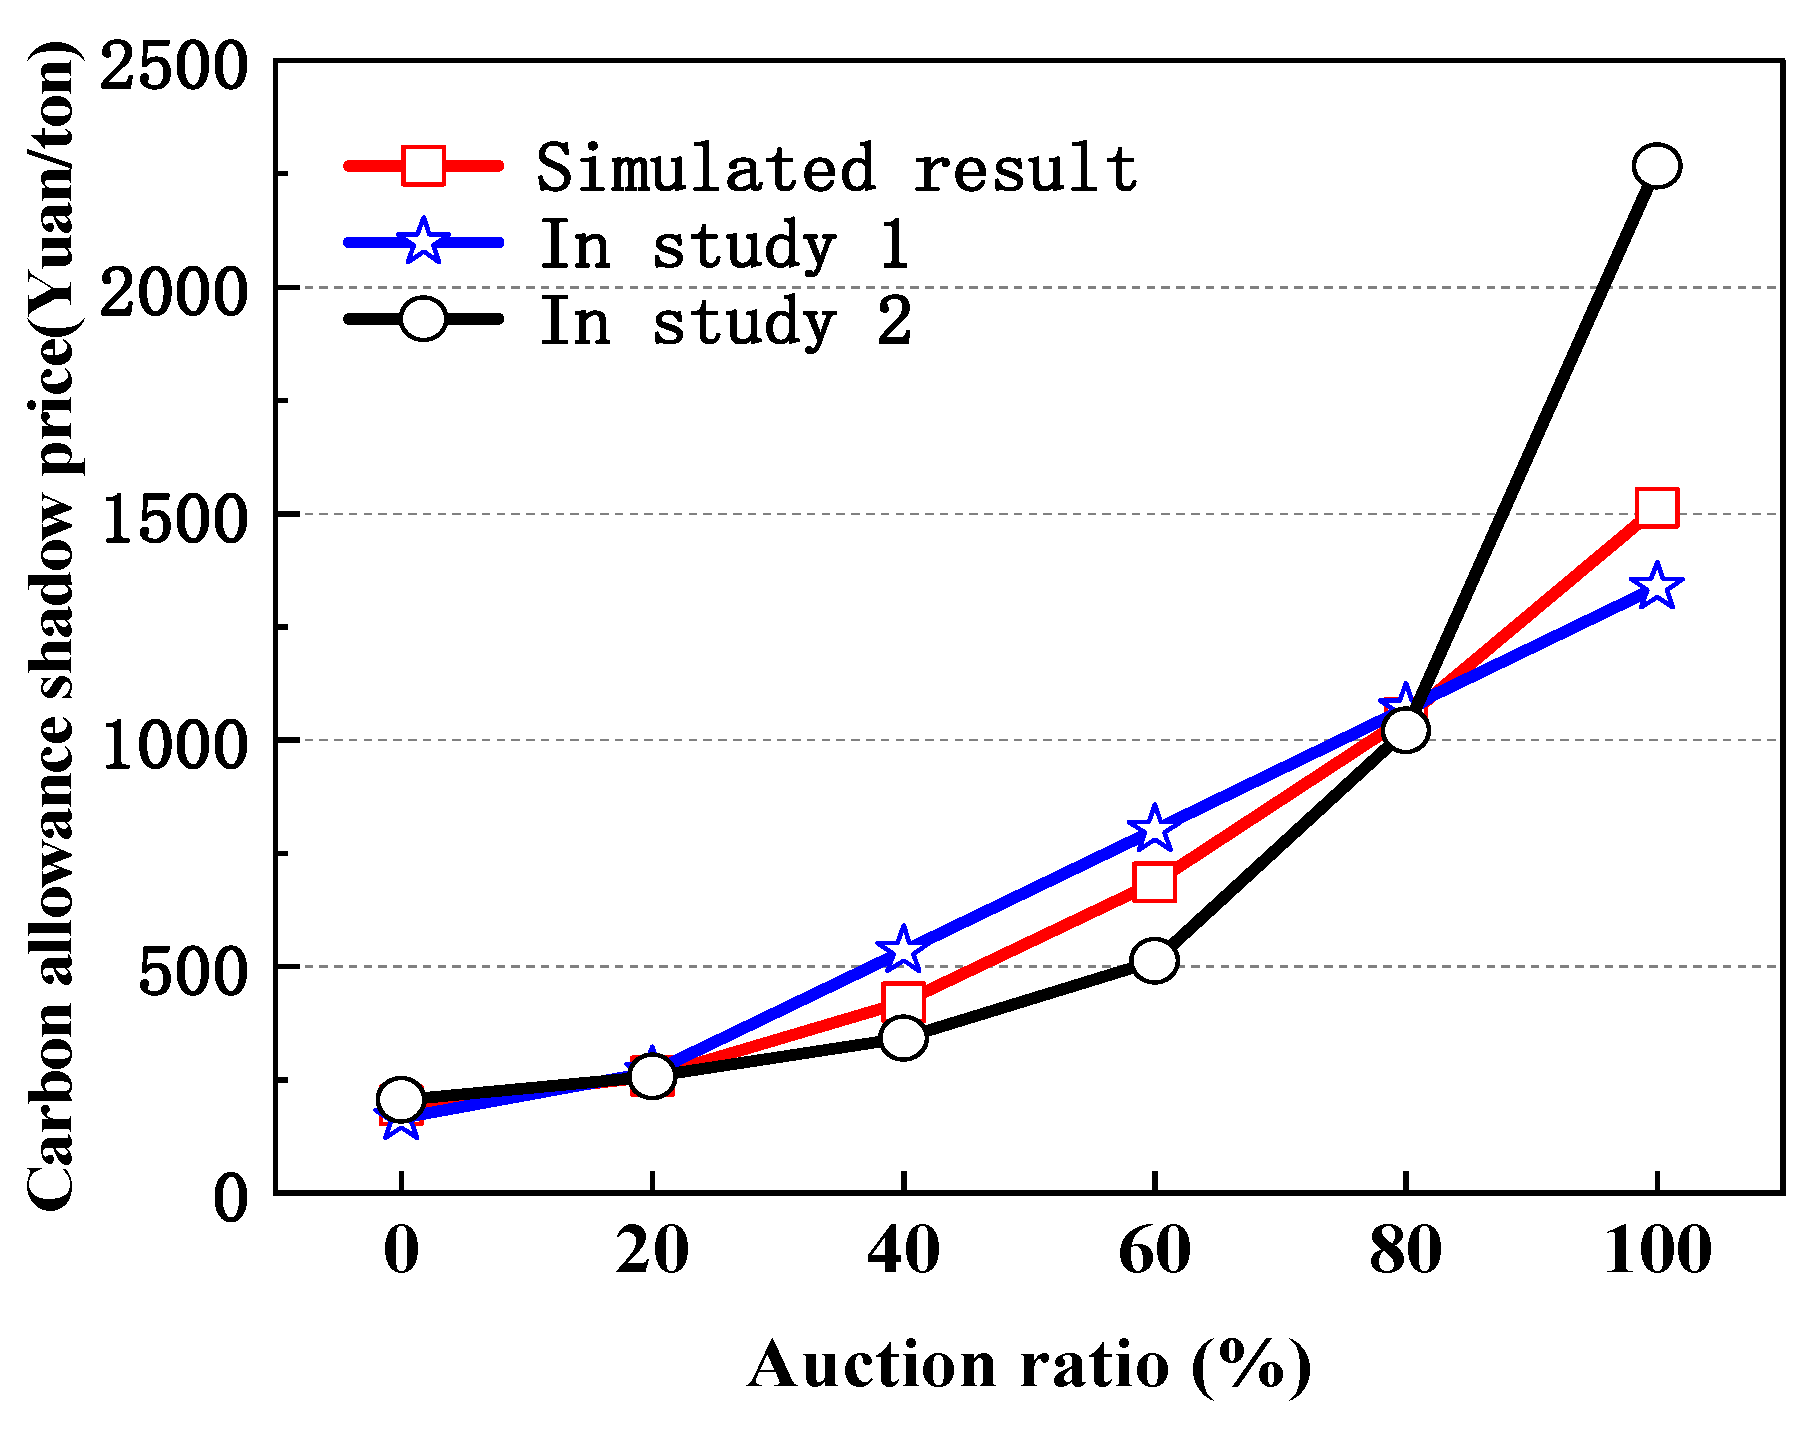
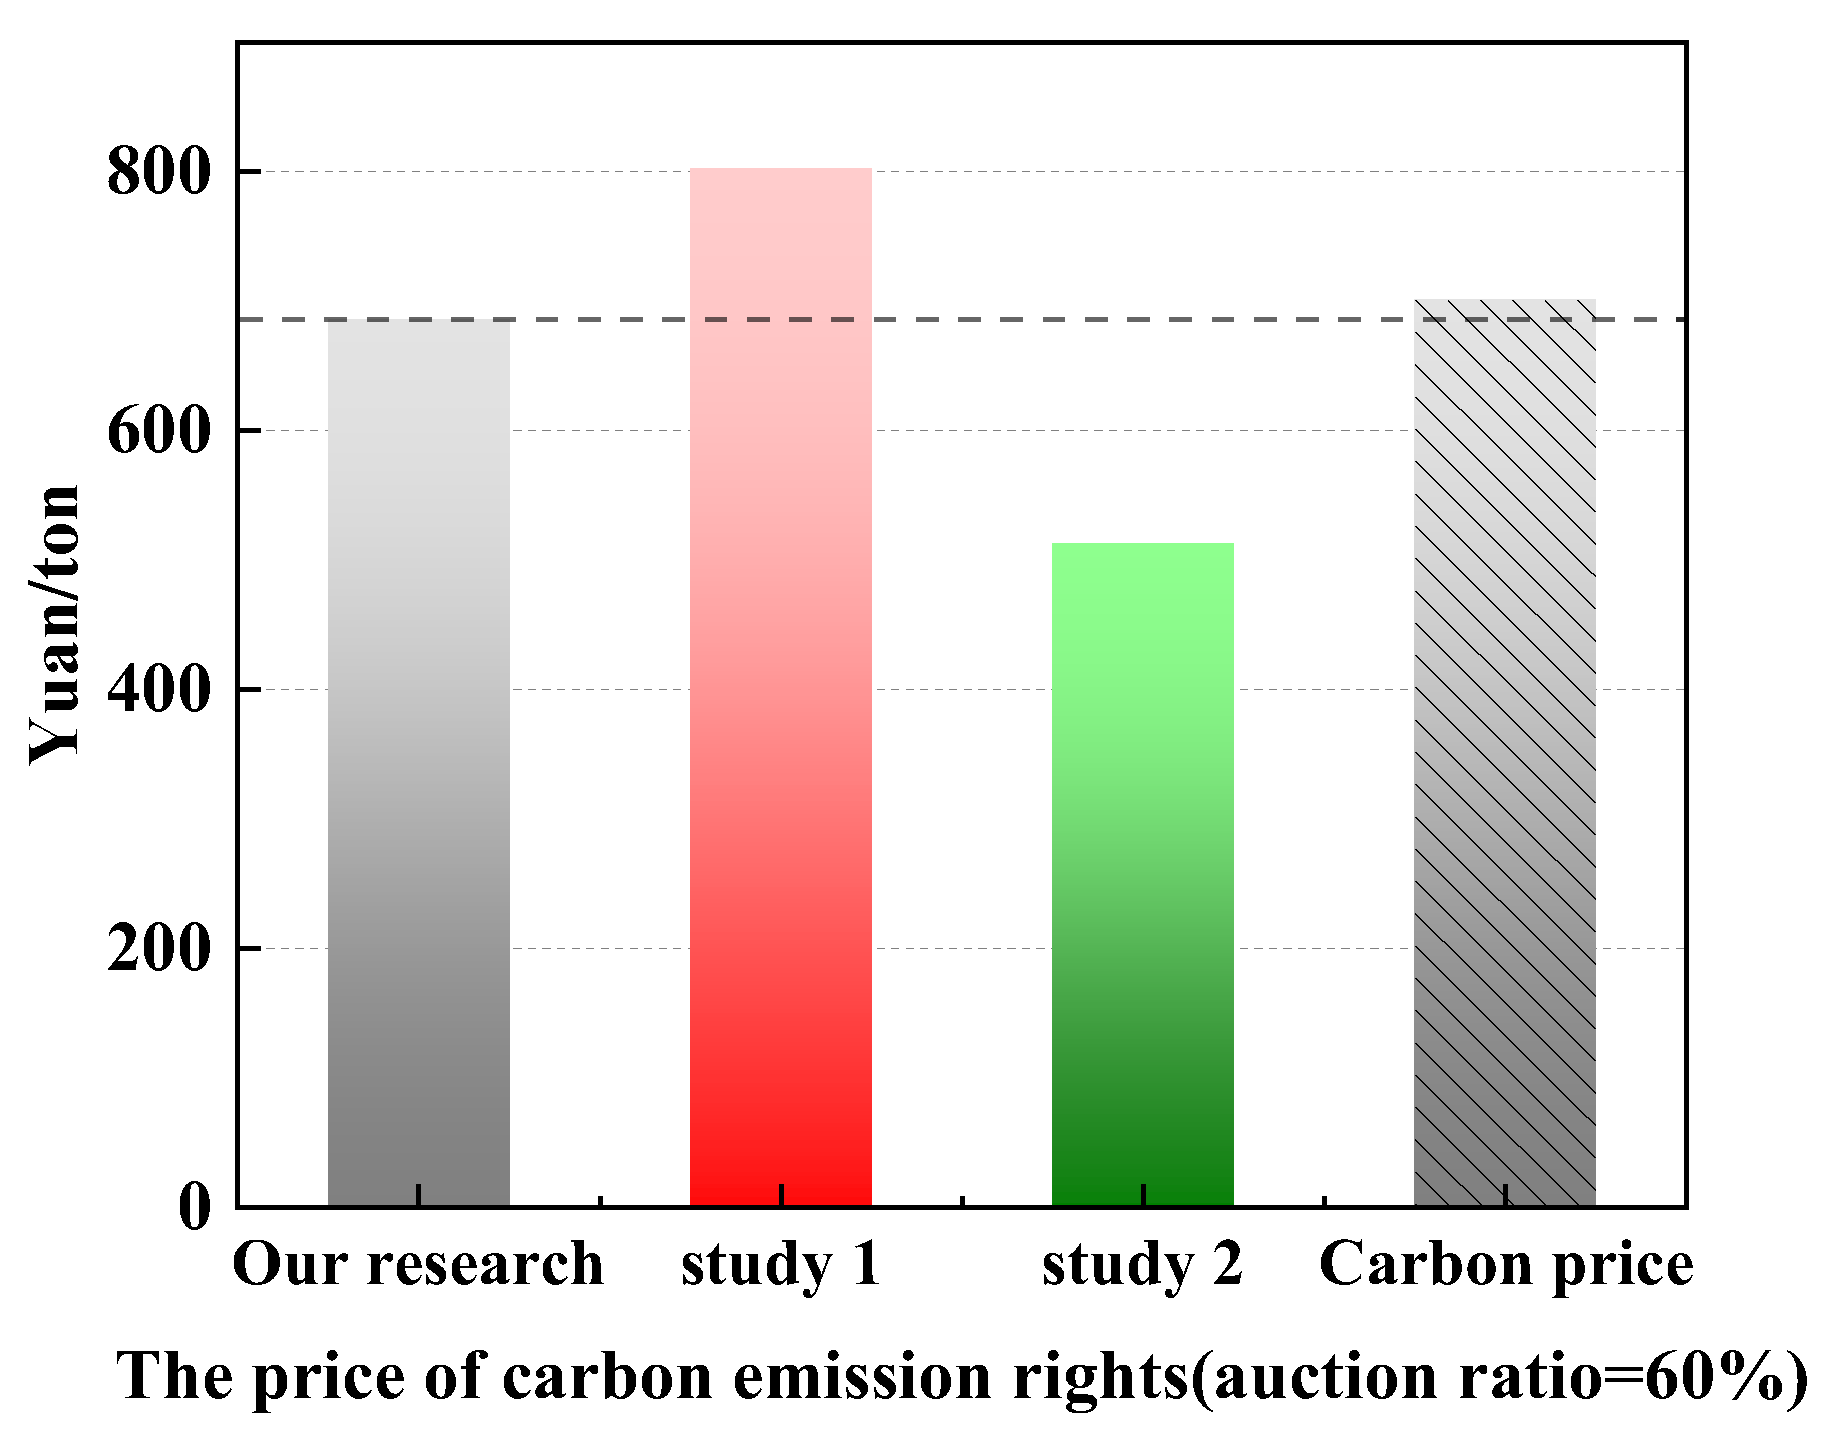
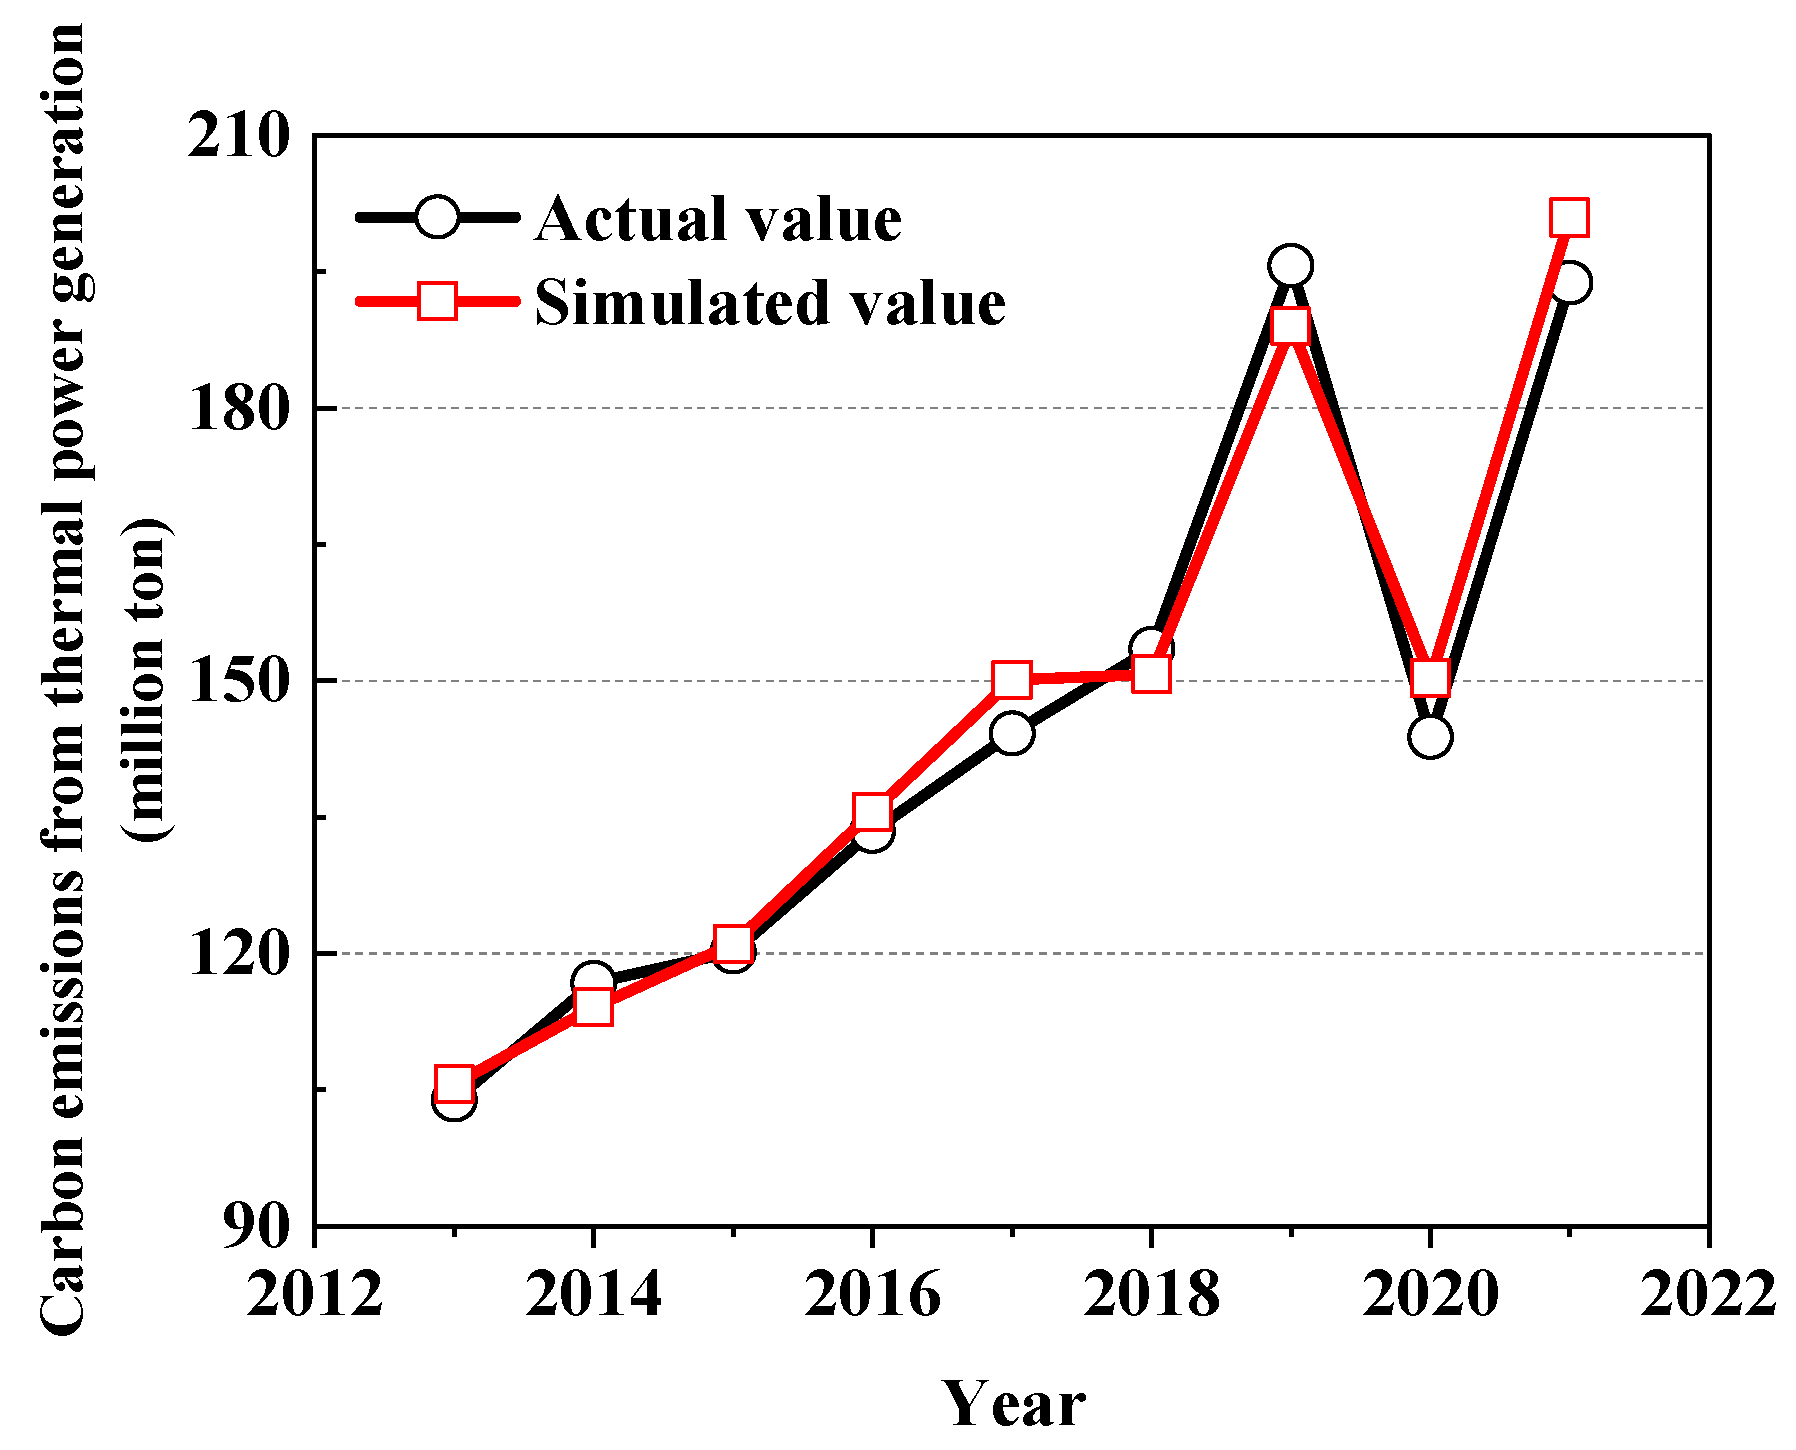
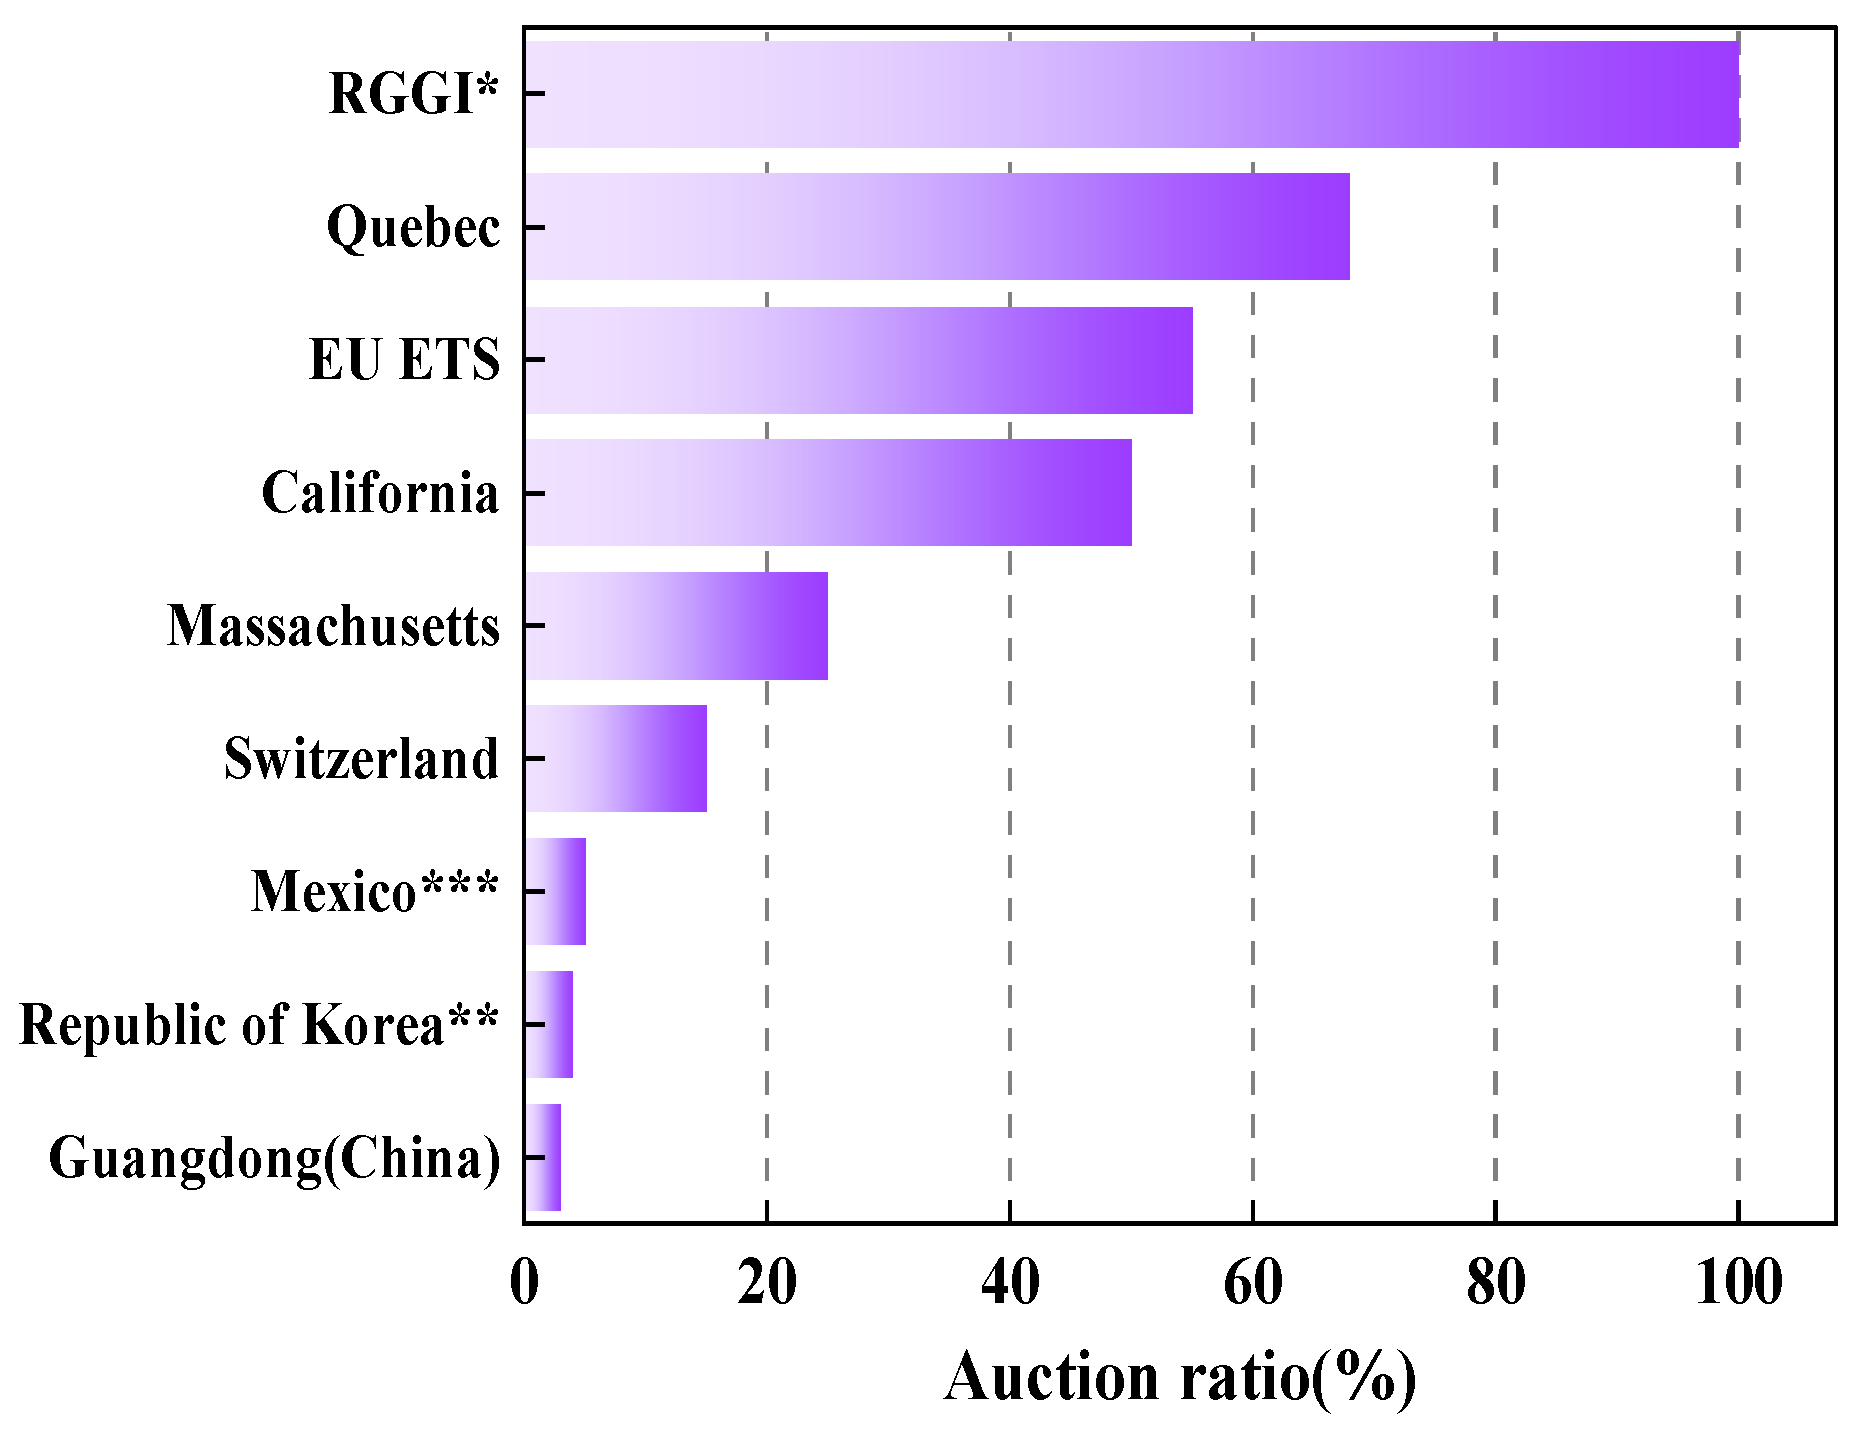
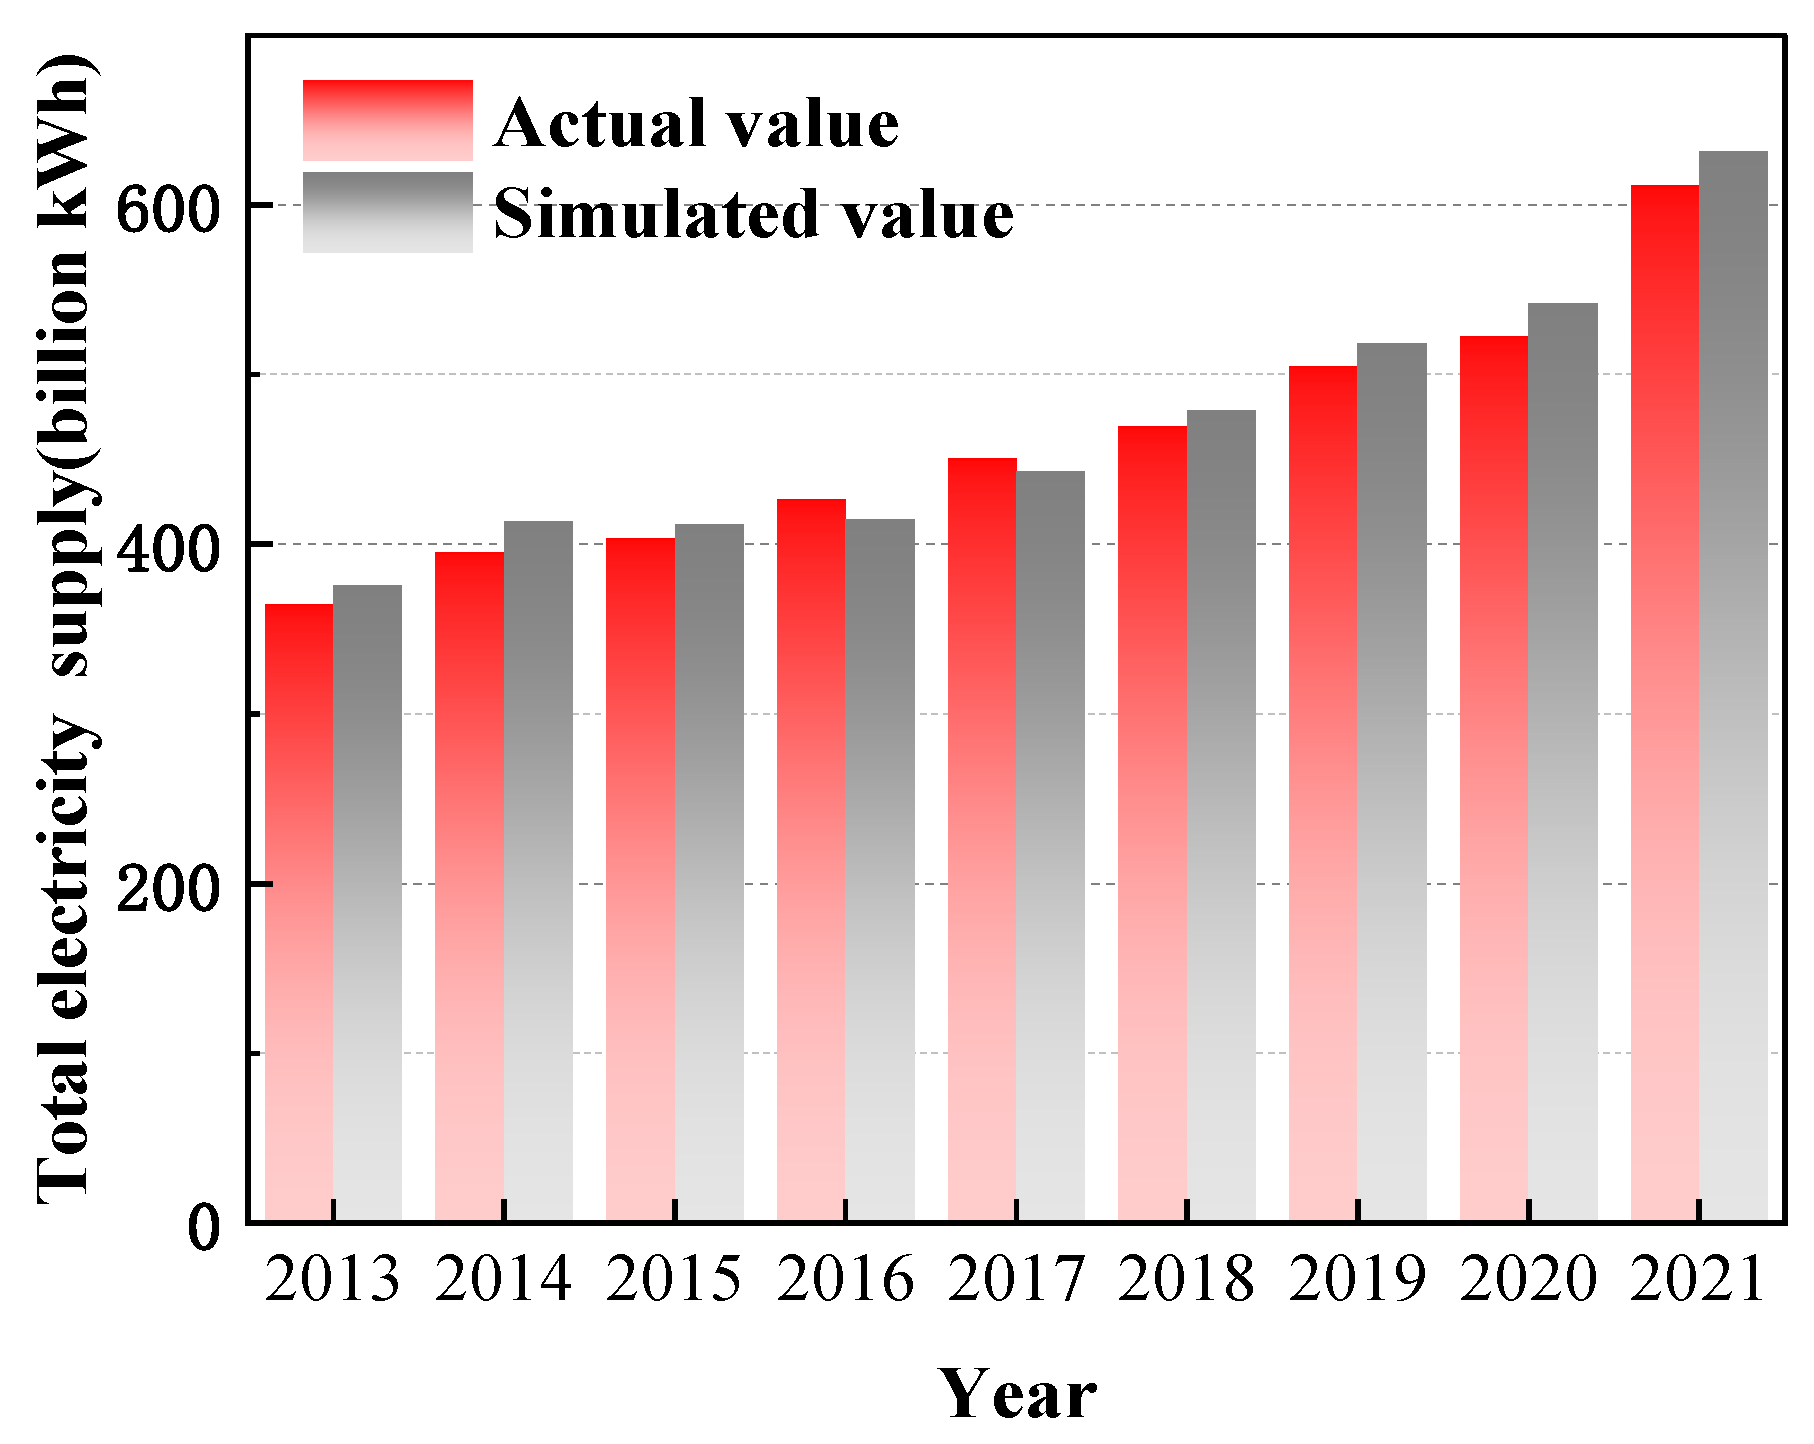
Through the sensitivity analysis, the Output results of the simulation model of the electric carbon industry based on the carbon quota auction ratio passed the test and proved the accuracy, and the simulation values of some of the variables could not be compared with the historical values, so the data results from similar studies were chosen to compare with the simulation values. By comparing with existing studies [24,31], it is found that the simulation results of the model on the shadow price of carbon allowances are reasonable under different auction ratios. The shadow prices of carbon allowances under different auction ratios are shown below (Figure 5). Comparing with similar studies and the transaction prices under the carbon allowances auction ratio at 60% in EUETS, it can be observed that the pricing model constructed in this study exhibits higher accuracy and smaller deviation in terms of the auction transaction prices in established carbon markets (Figure 6). There are many methods for model sensitivity analysis, and this research mainly adopts the methods of scene analysis and historical data comparison. As shown in Figure 7 and Figure 8, we selected three variables from the model and conducted an error analysis on these three variables. These three variables are the shadow prices of carbon allowances under different auction ratios, the total electricity supply, and carbon emissions from thermal power generation, respectively. We observed the absolute errors between the simulated values and the actual values of these variables from 2013 to 2021, further validating the effectiveness of the model. By comparison, the maximum absolute errors for these three key variables are all within 5% to 10%, falling within an acceptable range. This verifies the sensitivity of the model to past events and indicates the reliability and credibility of the simulation results of the carbon emission rights pricing model.
(2)
The Table 2 presents data on the environmental costs associated with the reduction in emissions for different pollutants, as discussed in the relevant literature [32,33].
(3)
Other data that were used in the study, including basic operating costs, power generation subsidies, and carbon emission coefficients, are shown in Table 3. The basic operating costs include depreciation expenses, operating costs, and daily operating expenses, of which the depreciation expenses are measured using the straight-line depreciation method, and the daily operating expenses mainly include fuel costs and labor costs. The data on power generation subsidy refer to the benchmark on-grid tariff published on the government website. The data on average carbon price is obtained from Polaris Power Network.
(4)
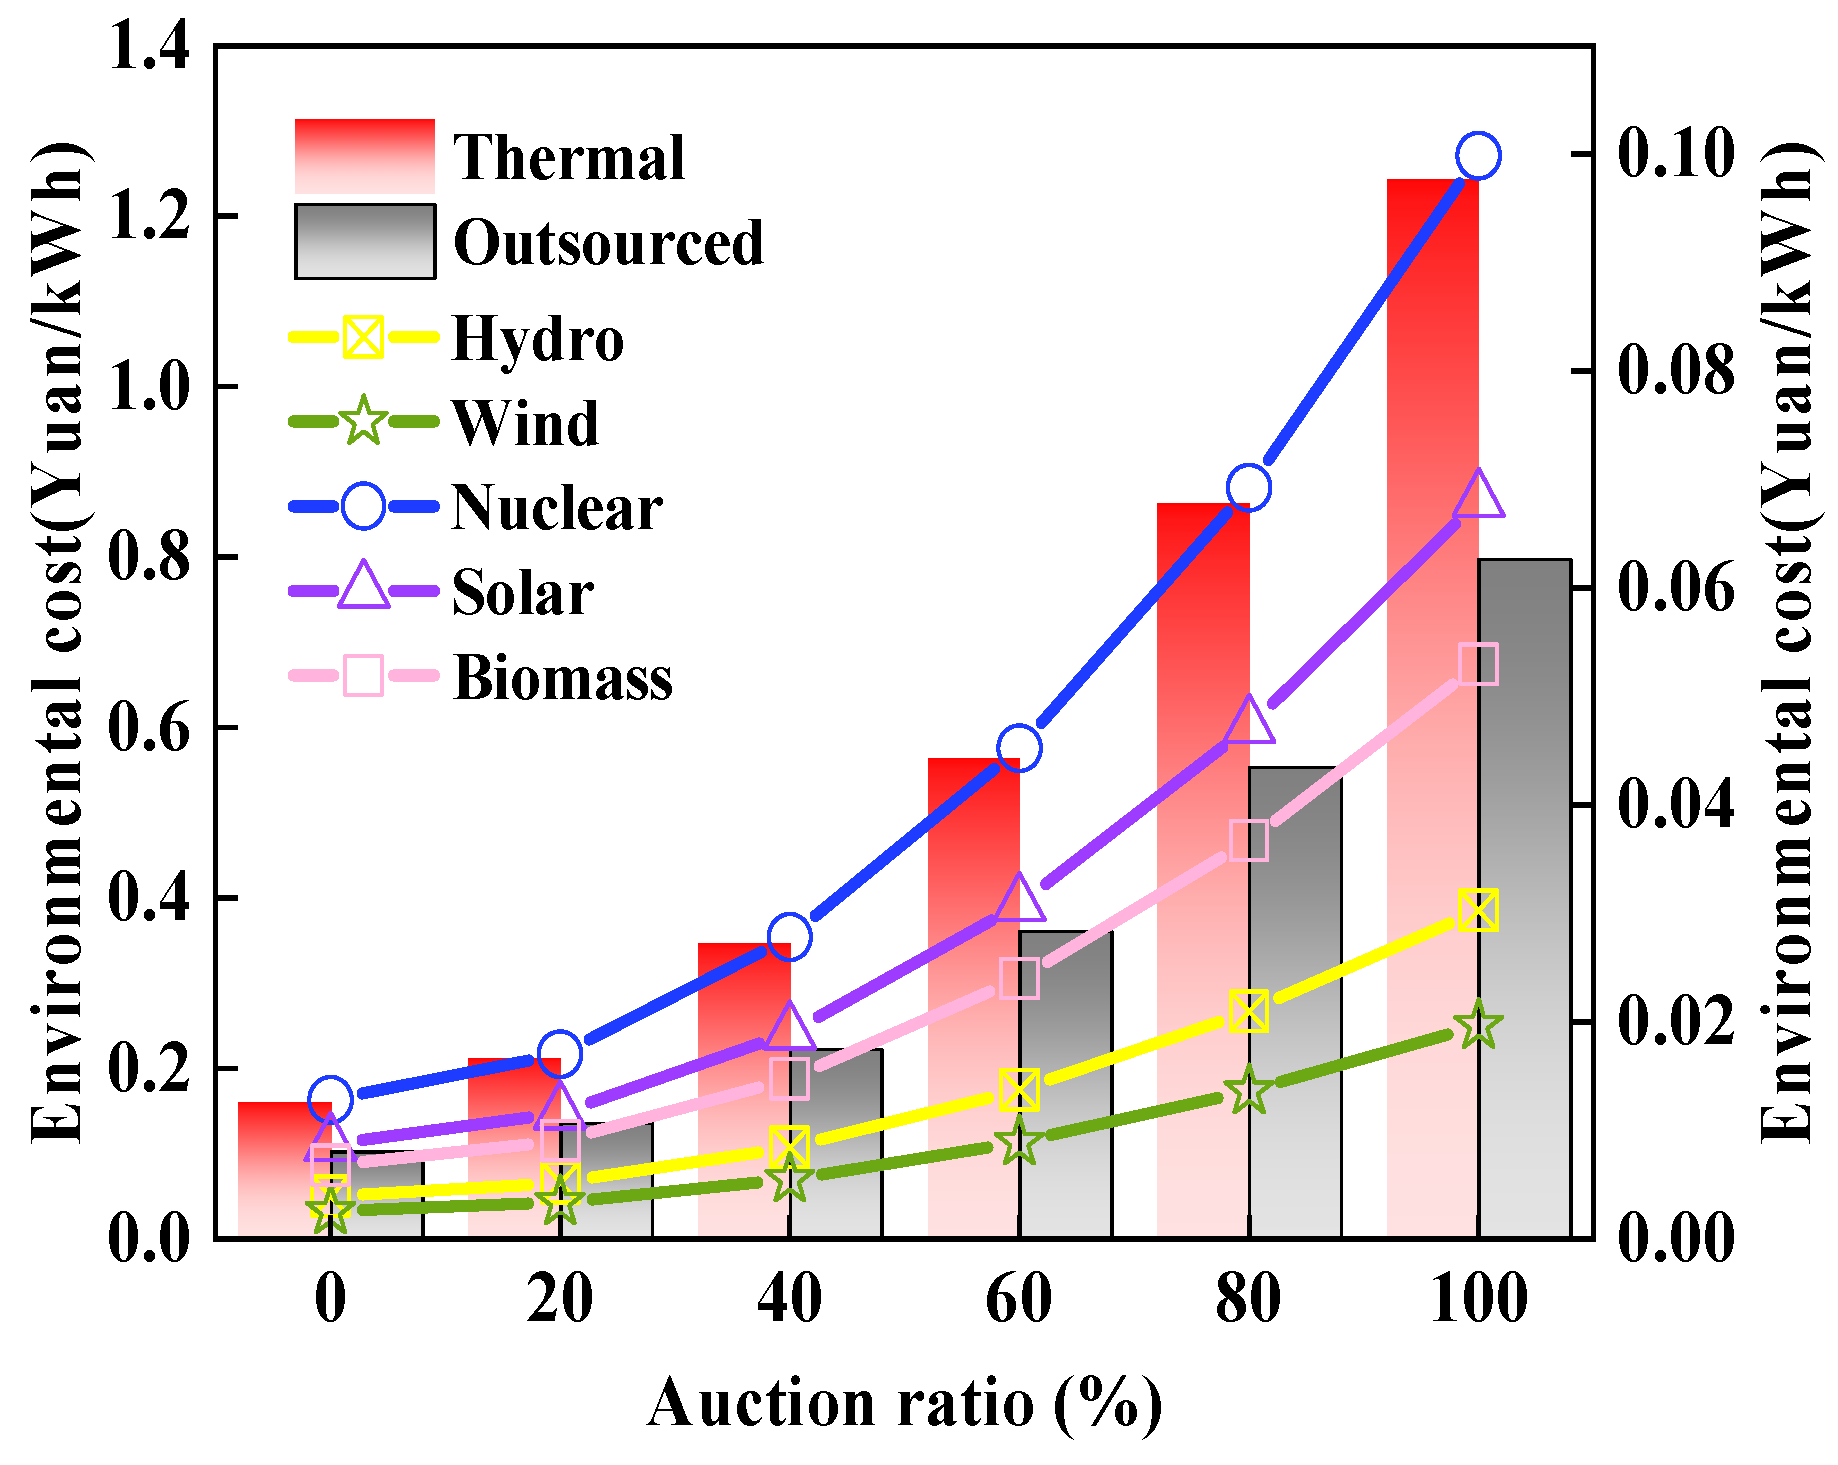
The environmental cost is measured by Equation (5) and presented in Figure 9. It can be found that the environmental cost of thermal power generation and outsourced electricity increases the most as the auction ratio grows, while the maximum environmental cost of other energy generation technologies does not exceed 0.1 Yuan/kWh.

4.2. Empirical Results
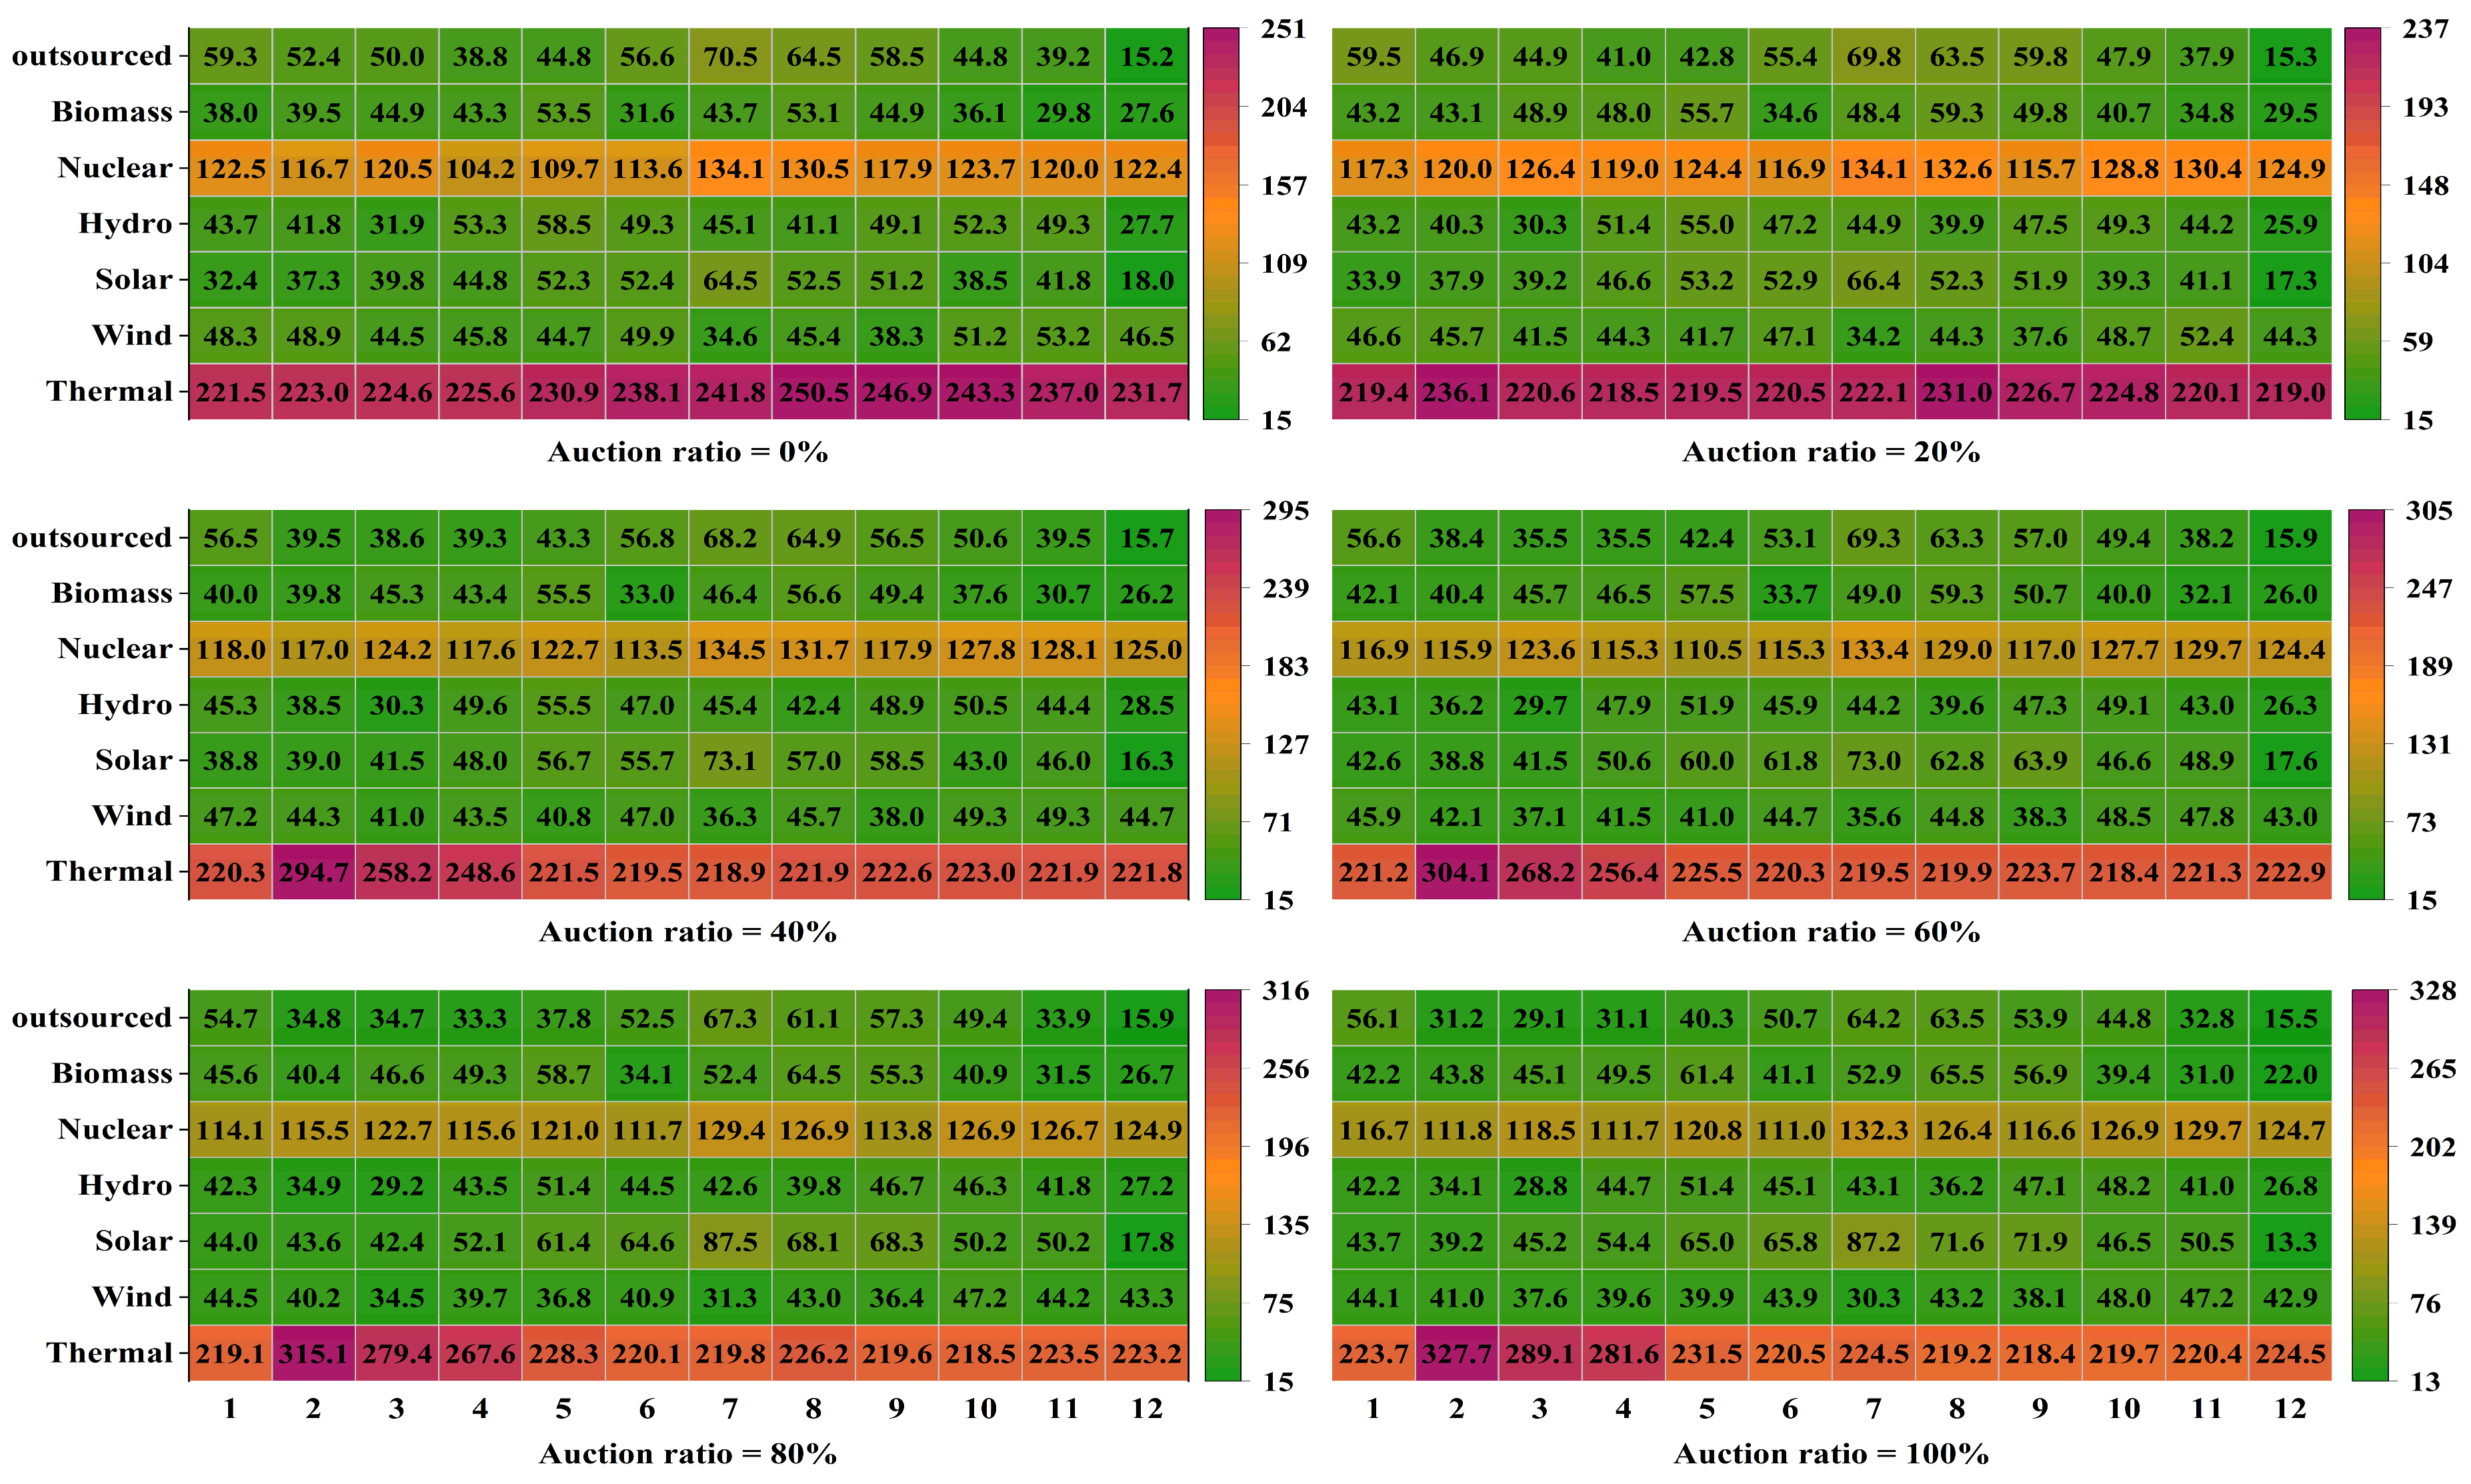
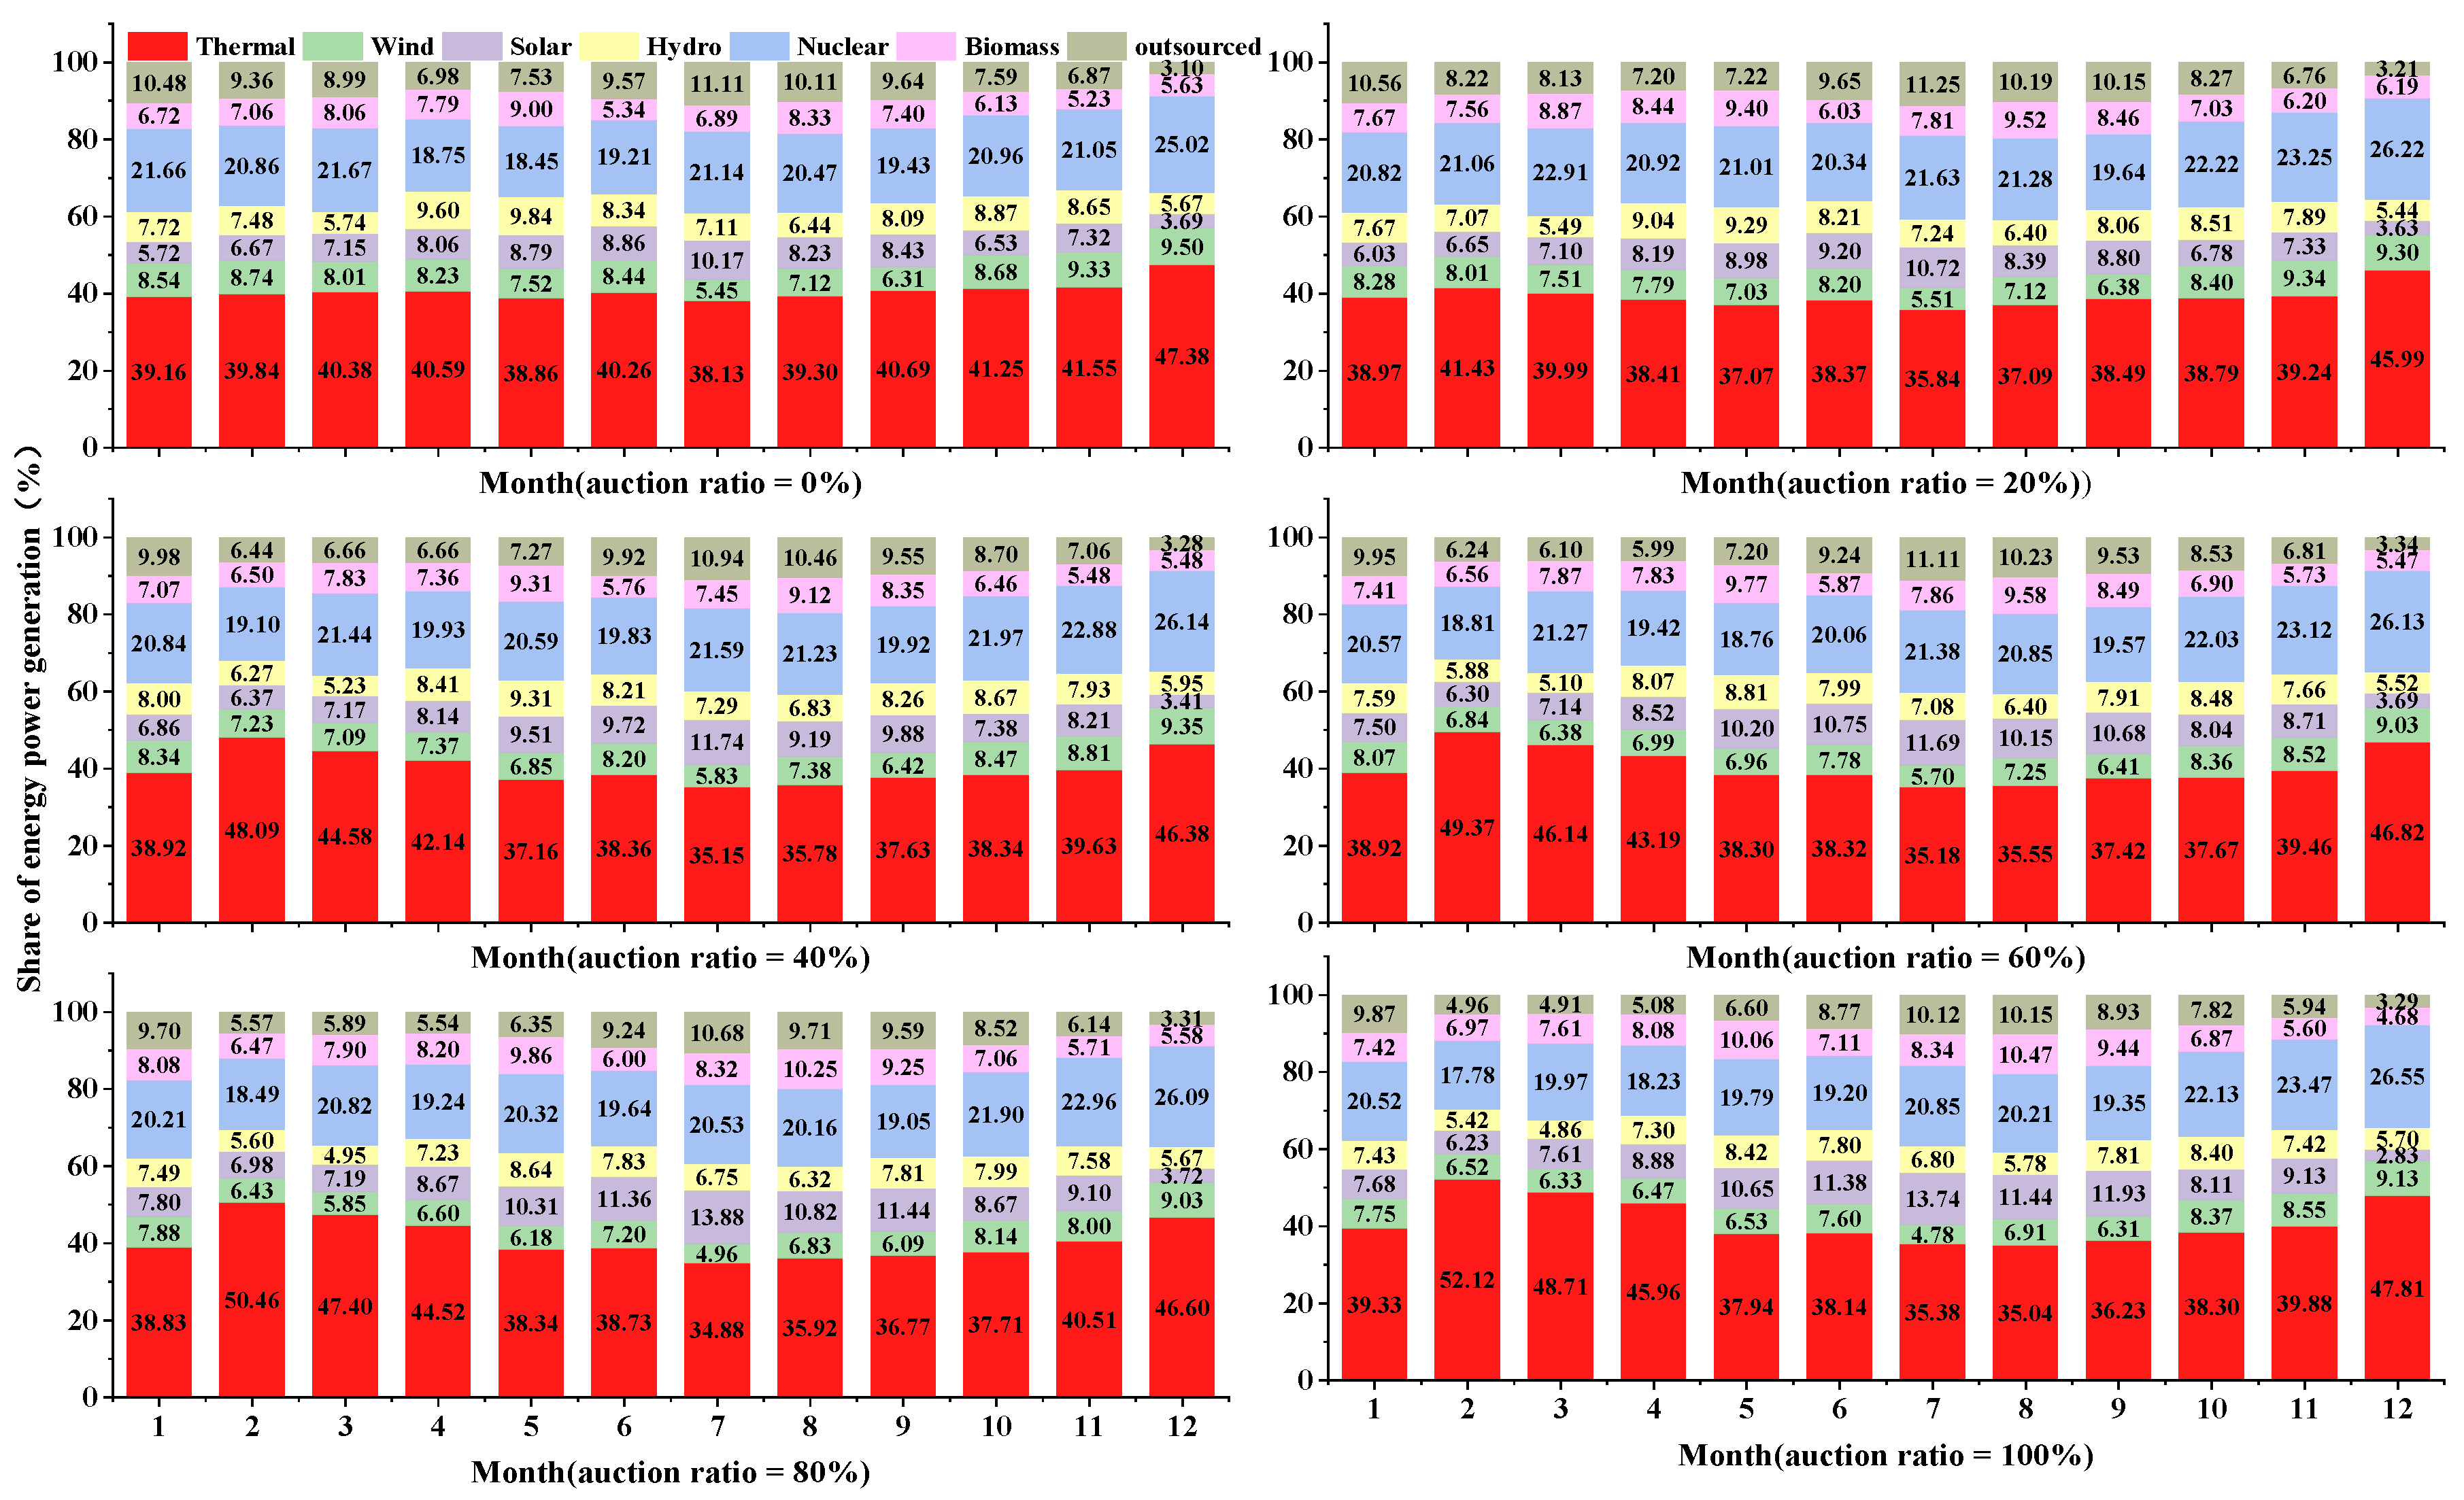
Using the aforementioned data, the carbon quota auction mechanism is integrated into the power generation structure optimization process, with the aim of minimizing the total economic cost and optimizing the power generation mix of Guangdong Province on a monthly time scale. In this paper, a combination of the system dynamics model and the multi-objective linear programming model is employed, and the resulting model is solved using a genetic algorithm. The empirical results are as follows:
(1)
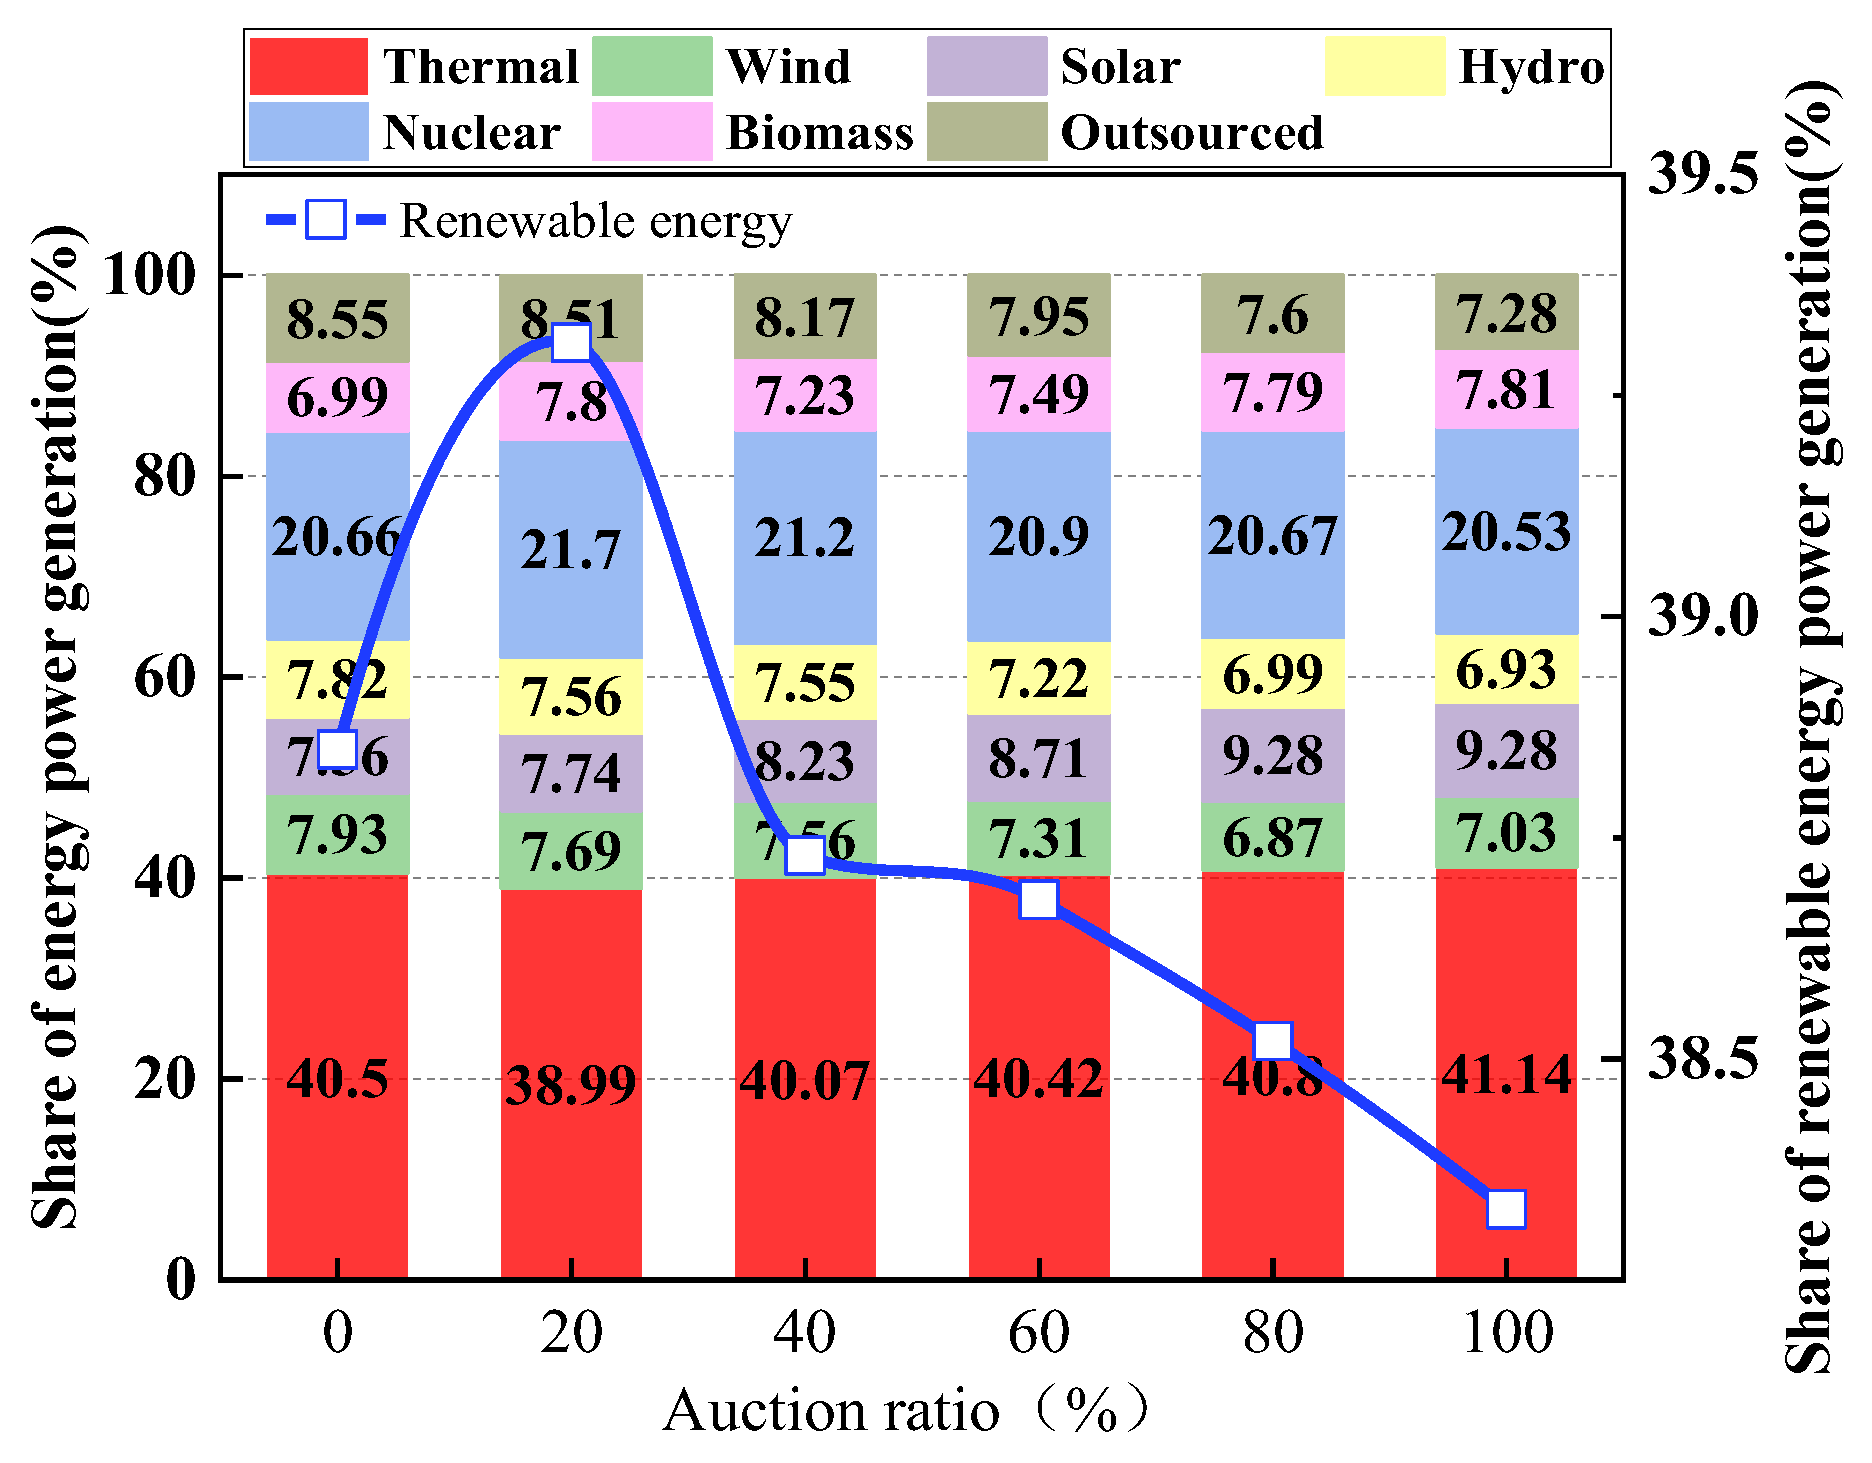
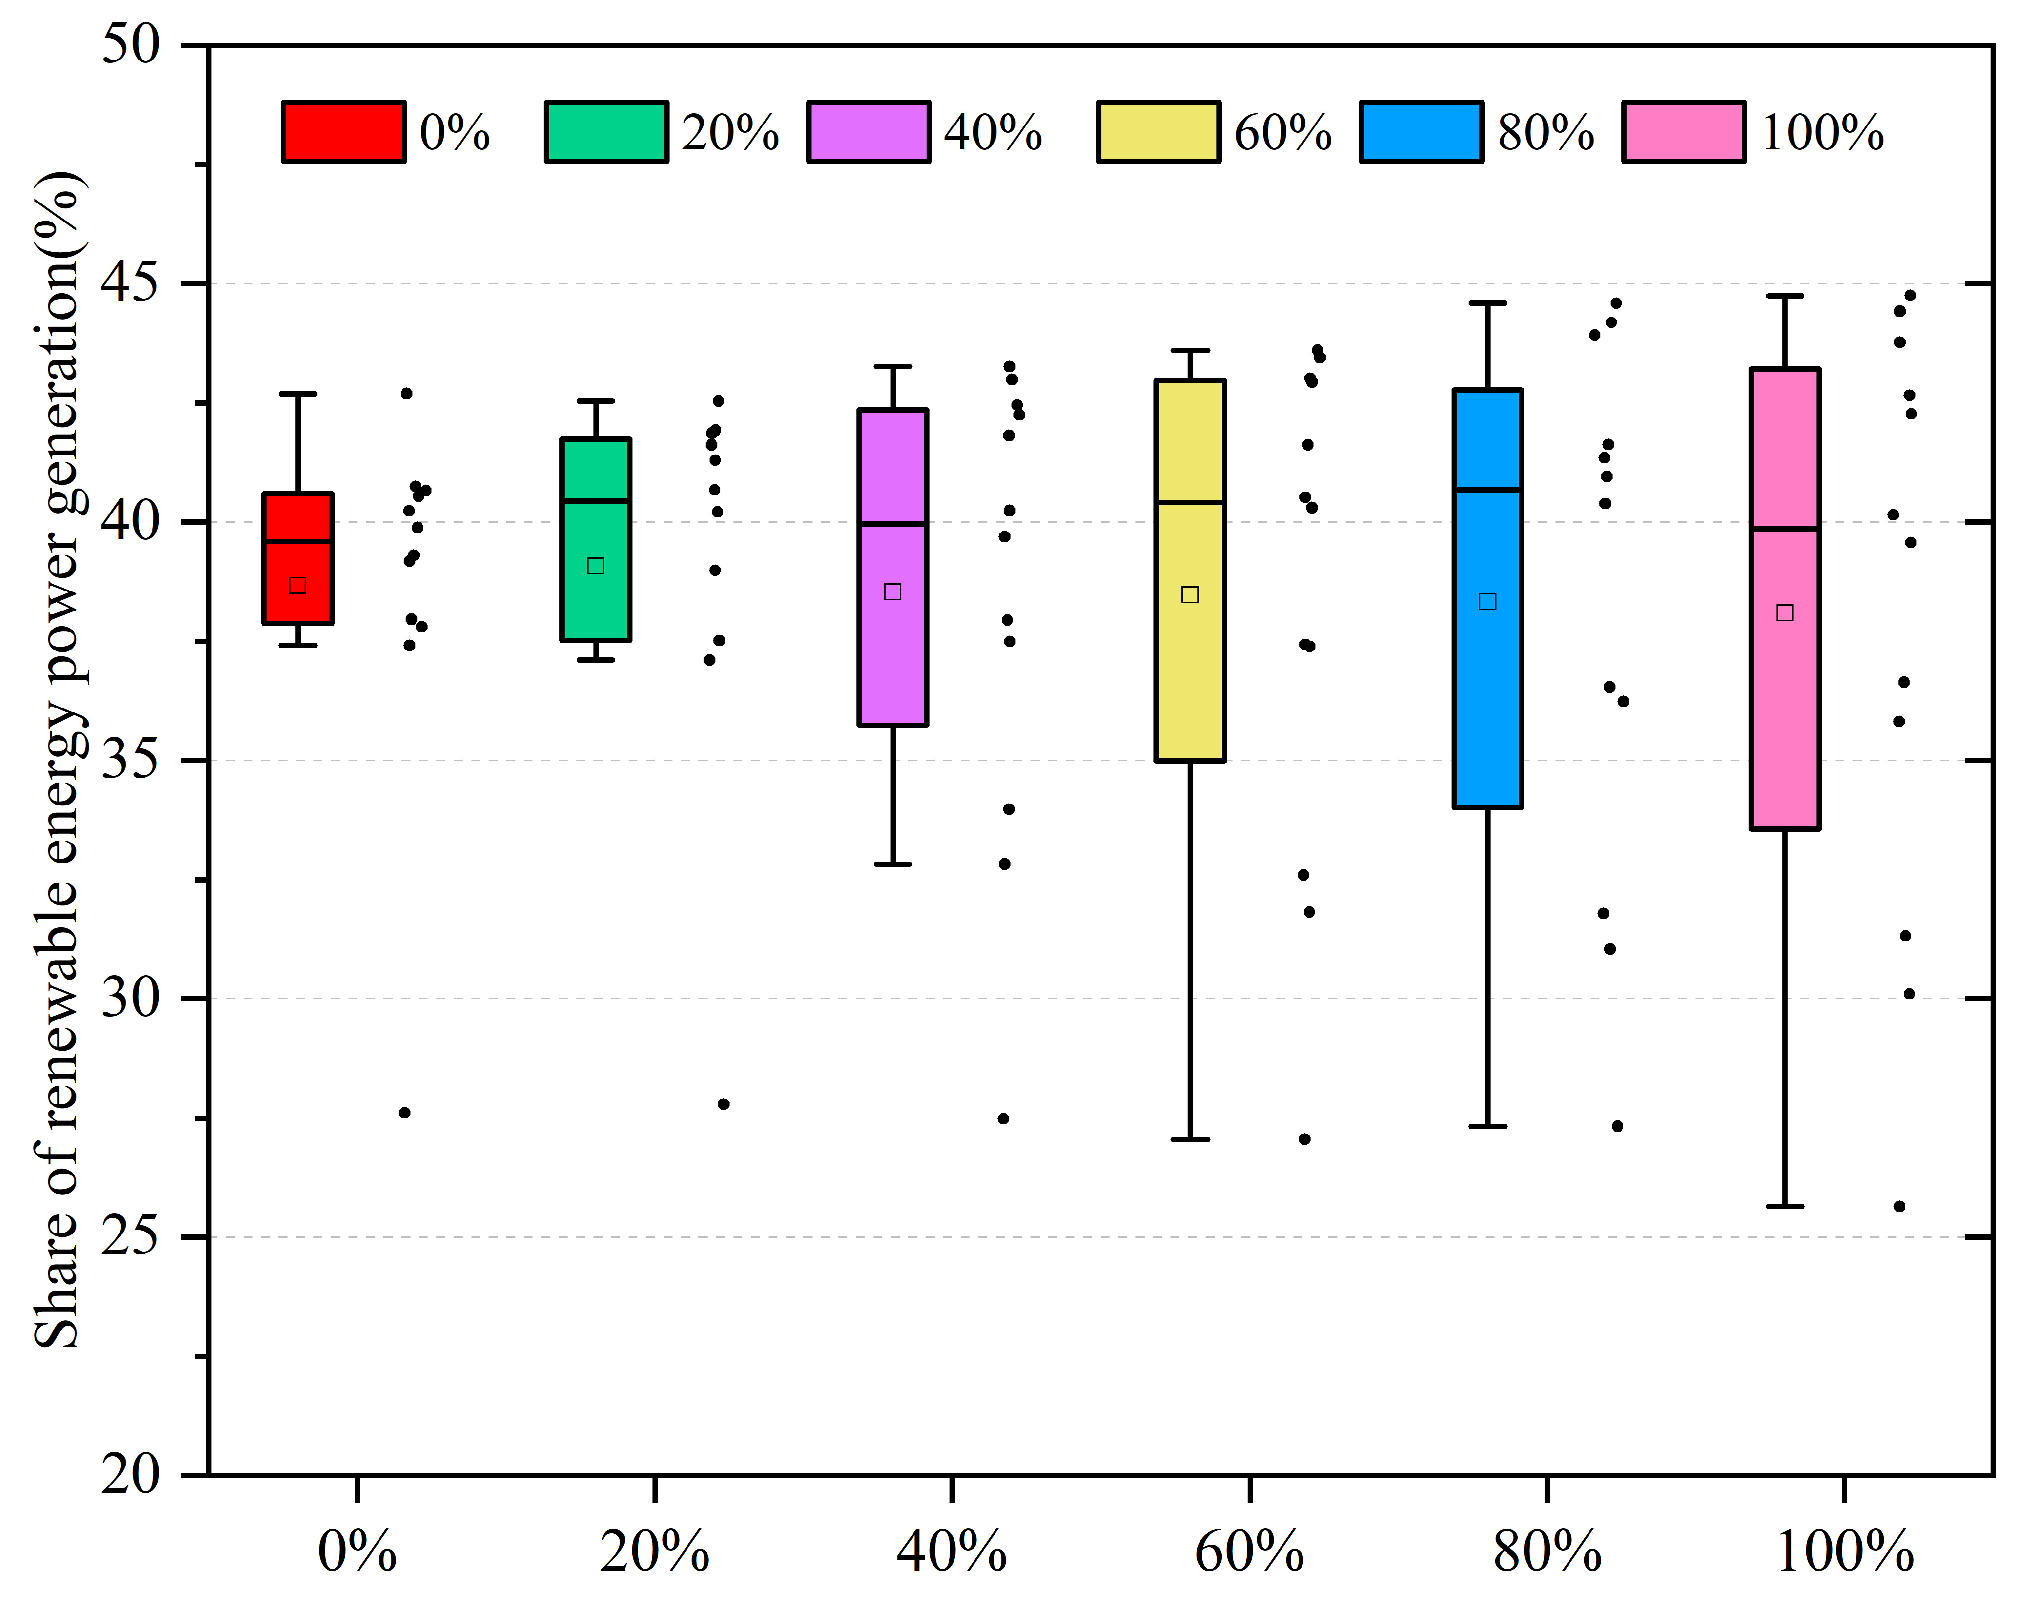
Optimization results of the power generation mix
After the introduction of the carbon allowance auction mechanism, this paper optimizes the power generation structure to minimize the total economic cost and finally obtains the output results with the time scale of months, as shown in Figure 10. From the heat map, when the auction ratio ascends from 0% to 100%, power generation by thermal power and nuclear power contribute a higher share of the amount of power generation. In terms of months, when the auction ratio is 100%, power generation by thermal power peaks at 52.12 kWh in February, meanwhile, power generation by nuclear power peaks at 26.55 kWh in December. In other words, to ensure that the total economic burden of the power generation industry is minimized, when the carbon allowance auction mechanism is aligned with the international carbon market in the future, each month thermal power and nuclear power generation should prepare at least 52.12 kWh and 26.55 kWh of stabilized power supply.
The share of power generation of various power generation technologies in the whole society’s electricity consumption is shown in Figure 11. The horizontal axis of each graph represents months 1–12, and the vertical axis represents the share of electricity generated by each energy source. Each month corresponds to a bar chart, and the proportion represented by the bar chart is the share of total electricity demand accounted for by each power generation technology. Figure 11 is a composite of six subfigures representing the power generation mix for each month when the auction ratio is 0%, 20%, 40%, 60%, 80%, and 100%. Each bar graph consists of a different color block, representing thermal, wind, solar, hydro, nuclear, biomass, and outsourced electricity from bottom to top. As can be seen from the graph, the share of thermal power generation has remained largely at 40% even when considering outsourced electricity. When the auction percentage rises from 0% to 100%, from the monthly power generation structure, the smallest share of thermal power generation is 34.88% (auction ratio is 80%, July), and the largest share is 52.12% (auction ratio is 100%, February). In other words, to meet the challenge of the carbon quota auction mechanism, the Guangdong power sector should train in advance to reduce the share of thermal power generation to 34.88% per month, as participating in the carbon quota auction can help alleviate the economic burden on the power generation sector to some extent.
Another noteworthy phenomenon requires attention. Regardless of how the auction ratio fluctuates, February, November, and December consistently exhibit the highest proportion of thermal power generation each year. The elevated share of thermal power in February might be attributed to the surge in electricity consumption due to the approaching New Year, where an increase in thermal power generation is needed to meet the demand for electricity consumption more flexibly. Similarly, the peak share of thermal power generation in November and December could be associated with the rise in energy demand during winter, leading to an increase in electricity consumption, and subsequently an escalation in thermal power generation as one of the primary sources of electricity supply. Moreover, the decline in rainfall during November and December in Guangdong contributes to reduced hydropower generation, which is compensated by increased thermal power generation to meet the electricity demand.
Another significant discovery is the consistent decline in the share of annual outsourced electricity as the auction ratio increases. As depicted in Figure 12, when the auction ratio is set at 0%, the share of outsourced electricity amounts to 8.55%, whereas with a rise in the auction ratio to 100%, the share of outsourced electricity diminishes to 7.28%. This trend is attributed to the constraints imposed on indirect carbon emissions associated with outsourced electricity under the carbon trading market mechanism. The more electricity a power generation company buys, the greater the pressure to reduce emissions when accounting for carbon emissions, which will impose a heavier financial burden on the company. Consequently, to alleviate the overall economic burden of power generation enterprises, the share of outsourced power continues to be curtailed. Currently, the share of outsourced electricity in Guangdong Province comprises nearly 30% of the total electricity consumption in the entire society. To further alleviate the economic burden on power generation enterprises, the proportion of outsourced electricity must be reduced by two-thirds, thereby enhancing the self-sufficiency rate of electricity to 92.72%.
It can be observed in Figure 12 that the proportion of electricity generated from renewable sources does not exhibit a consistent increasing trend as the auction ratio rises. With the auction ratio increasing from 0% to 20%, the share of electricity generated from renewable energy sources increased by 0.46%; however, when the auction ratio was further raised from 20% to 100%, the share of electricity generated from renewable sources declined by 0.98%. Furthermore, in conjunction with Figure 13, the monthly data on renewable energy generation reveals that the average share of renewable electricity generation is higher when the auction ratio is set to 20% or 80%. When the auction ratio is 0%, the proportion of renewable power generation is more concentrated each month, and the distribution of the share of renewable power generation gradually becomes more dispersed as the auction ratio increases. Notably, at auction percentages of 0%, 20%, and 40%, the corresponding box plots appear as outliers, attributed to the more concentrated distribution of the share data at the median level of 40%. As depicted in Figure 12 and Figure 13, the annual share of renewable power generation exhibits a slight downward trend when the auction ratio exceeds 20%, while the fluctuations in the changes in the monthly share of renewable power generation tend to stabilize.
(2)
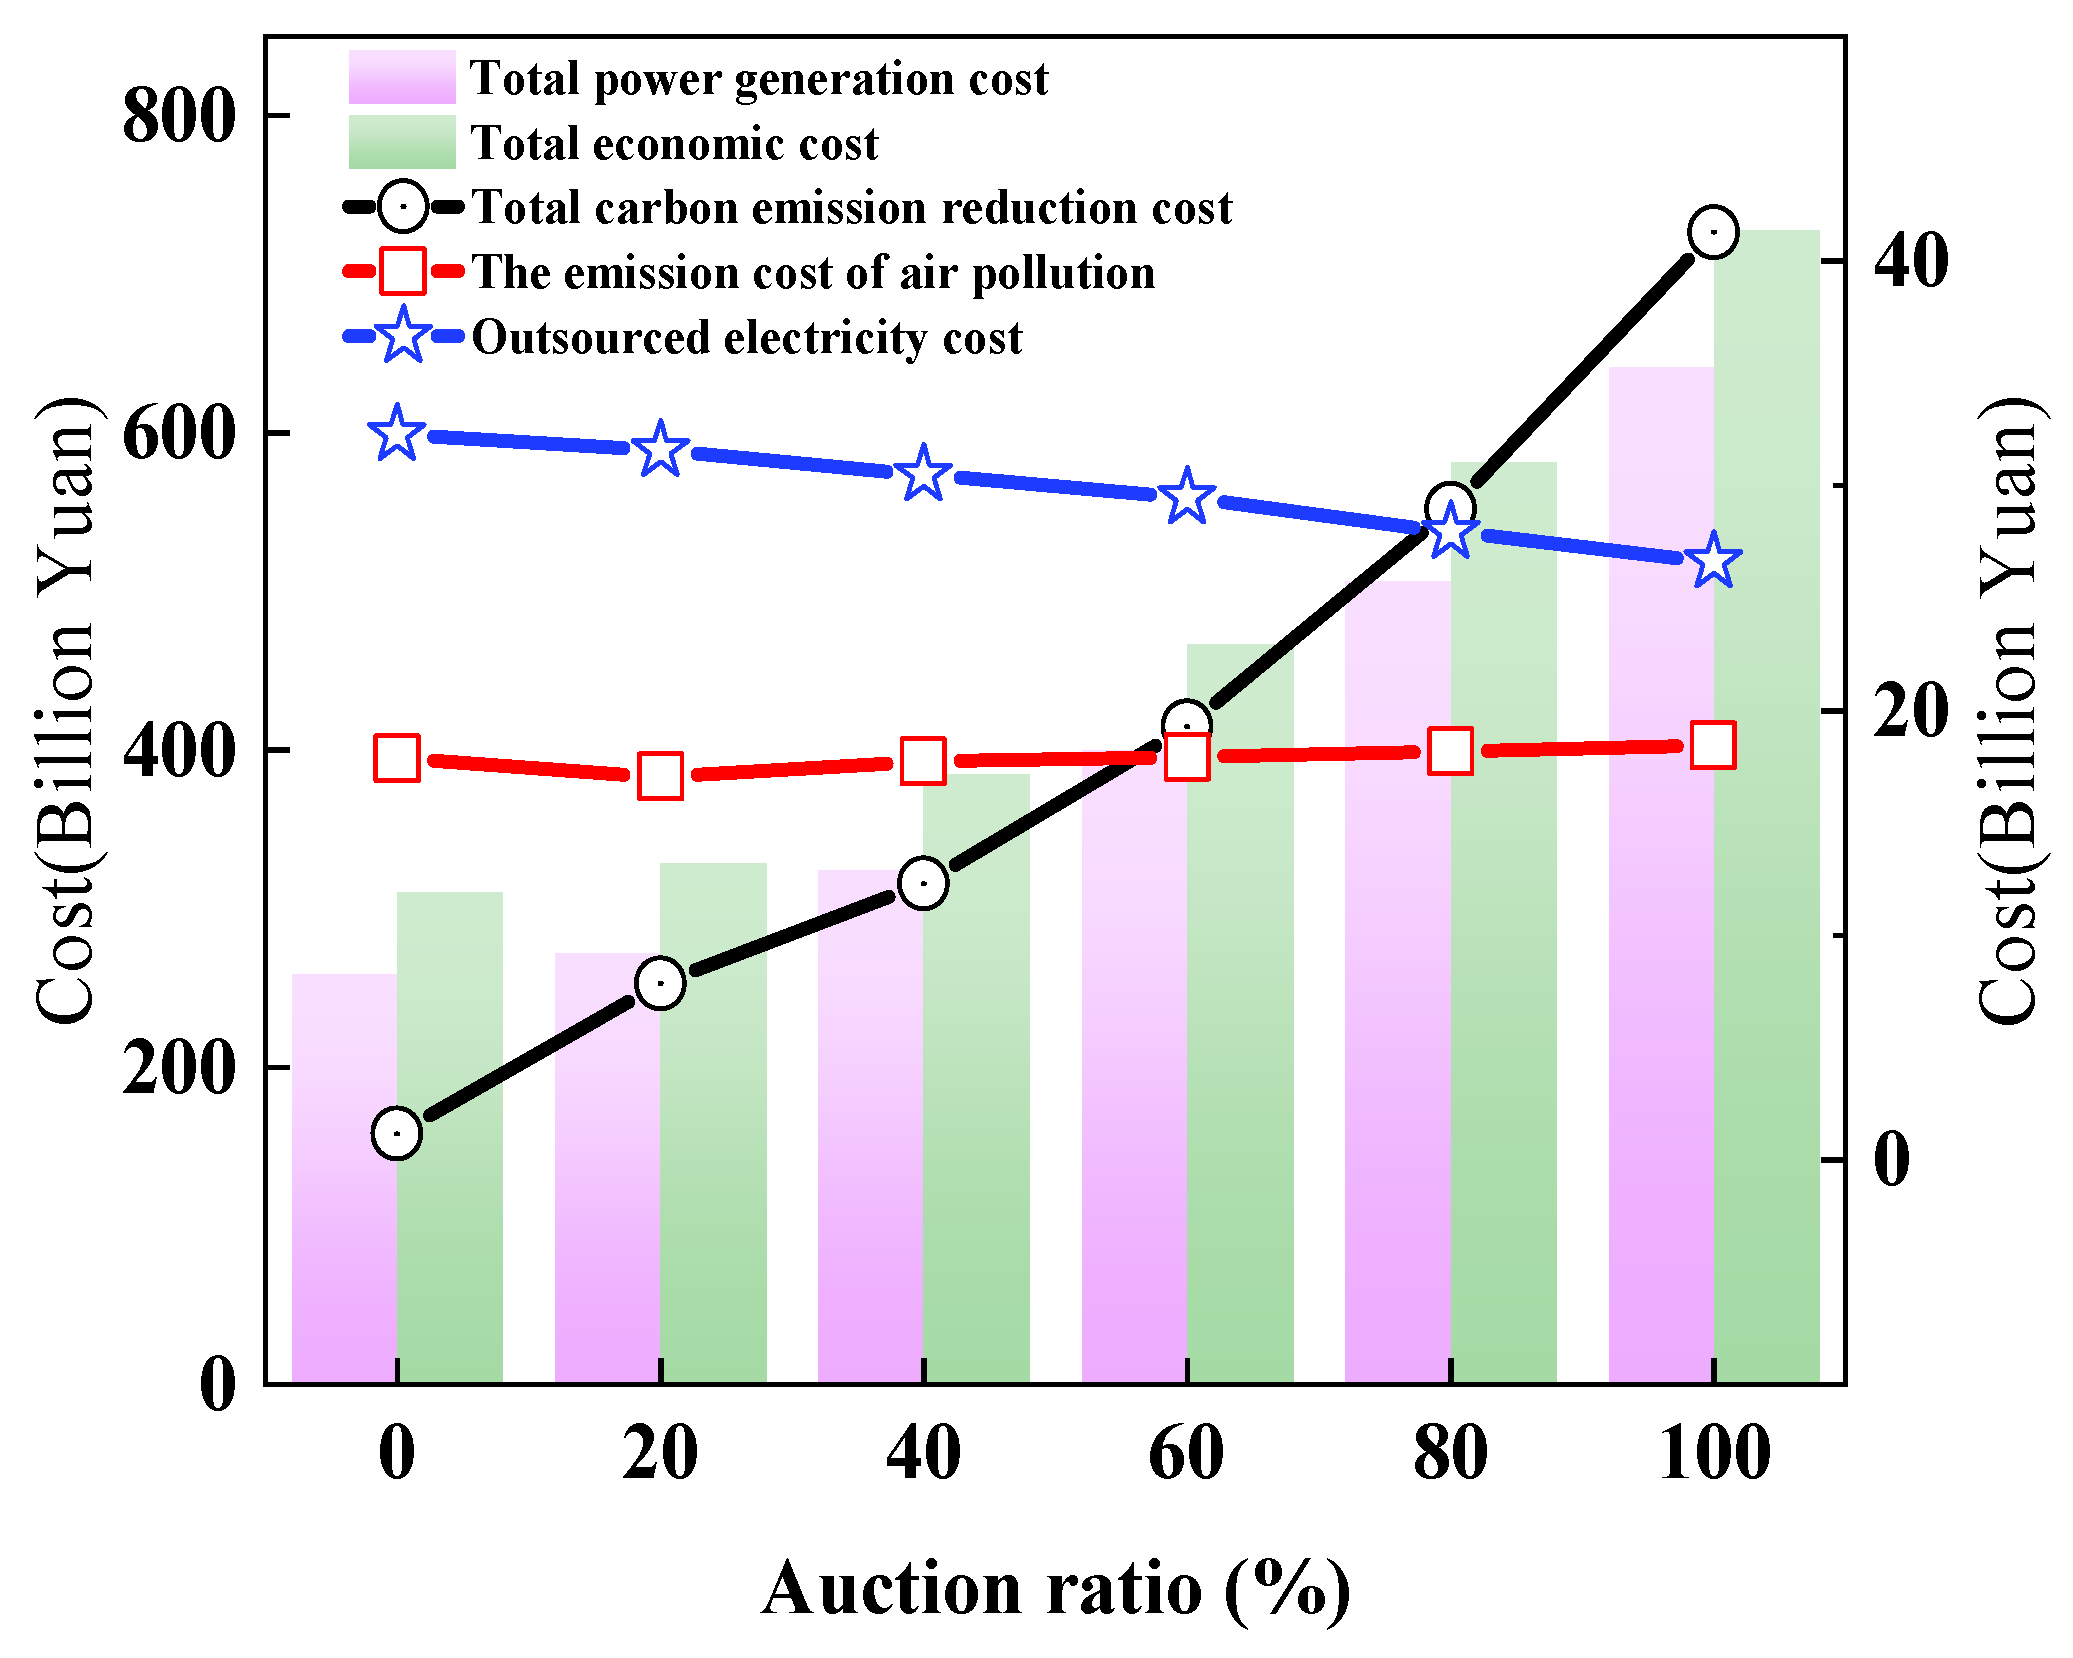
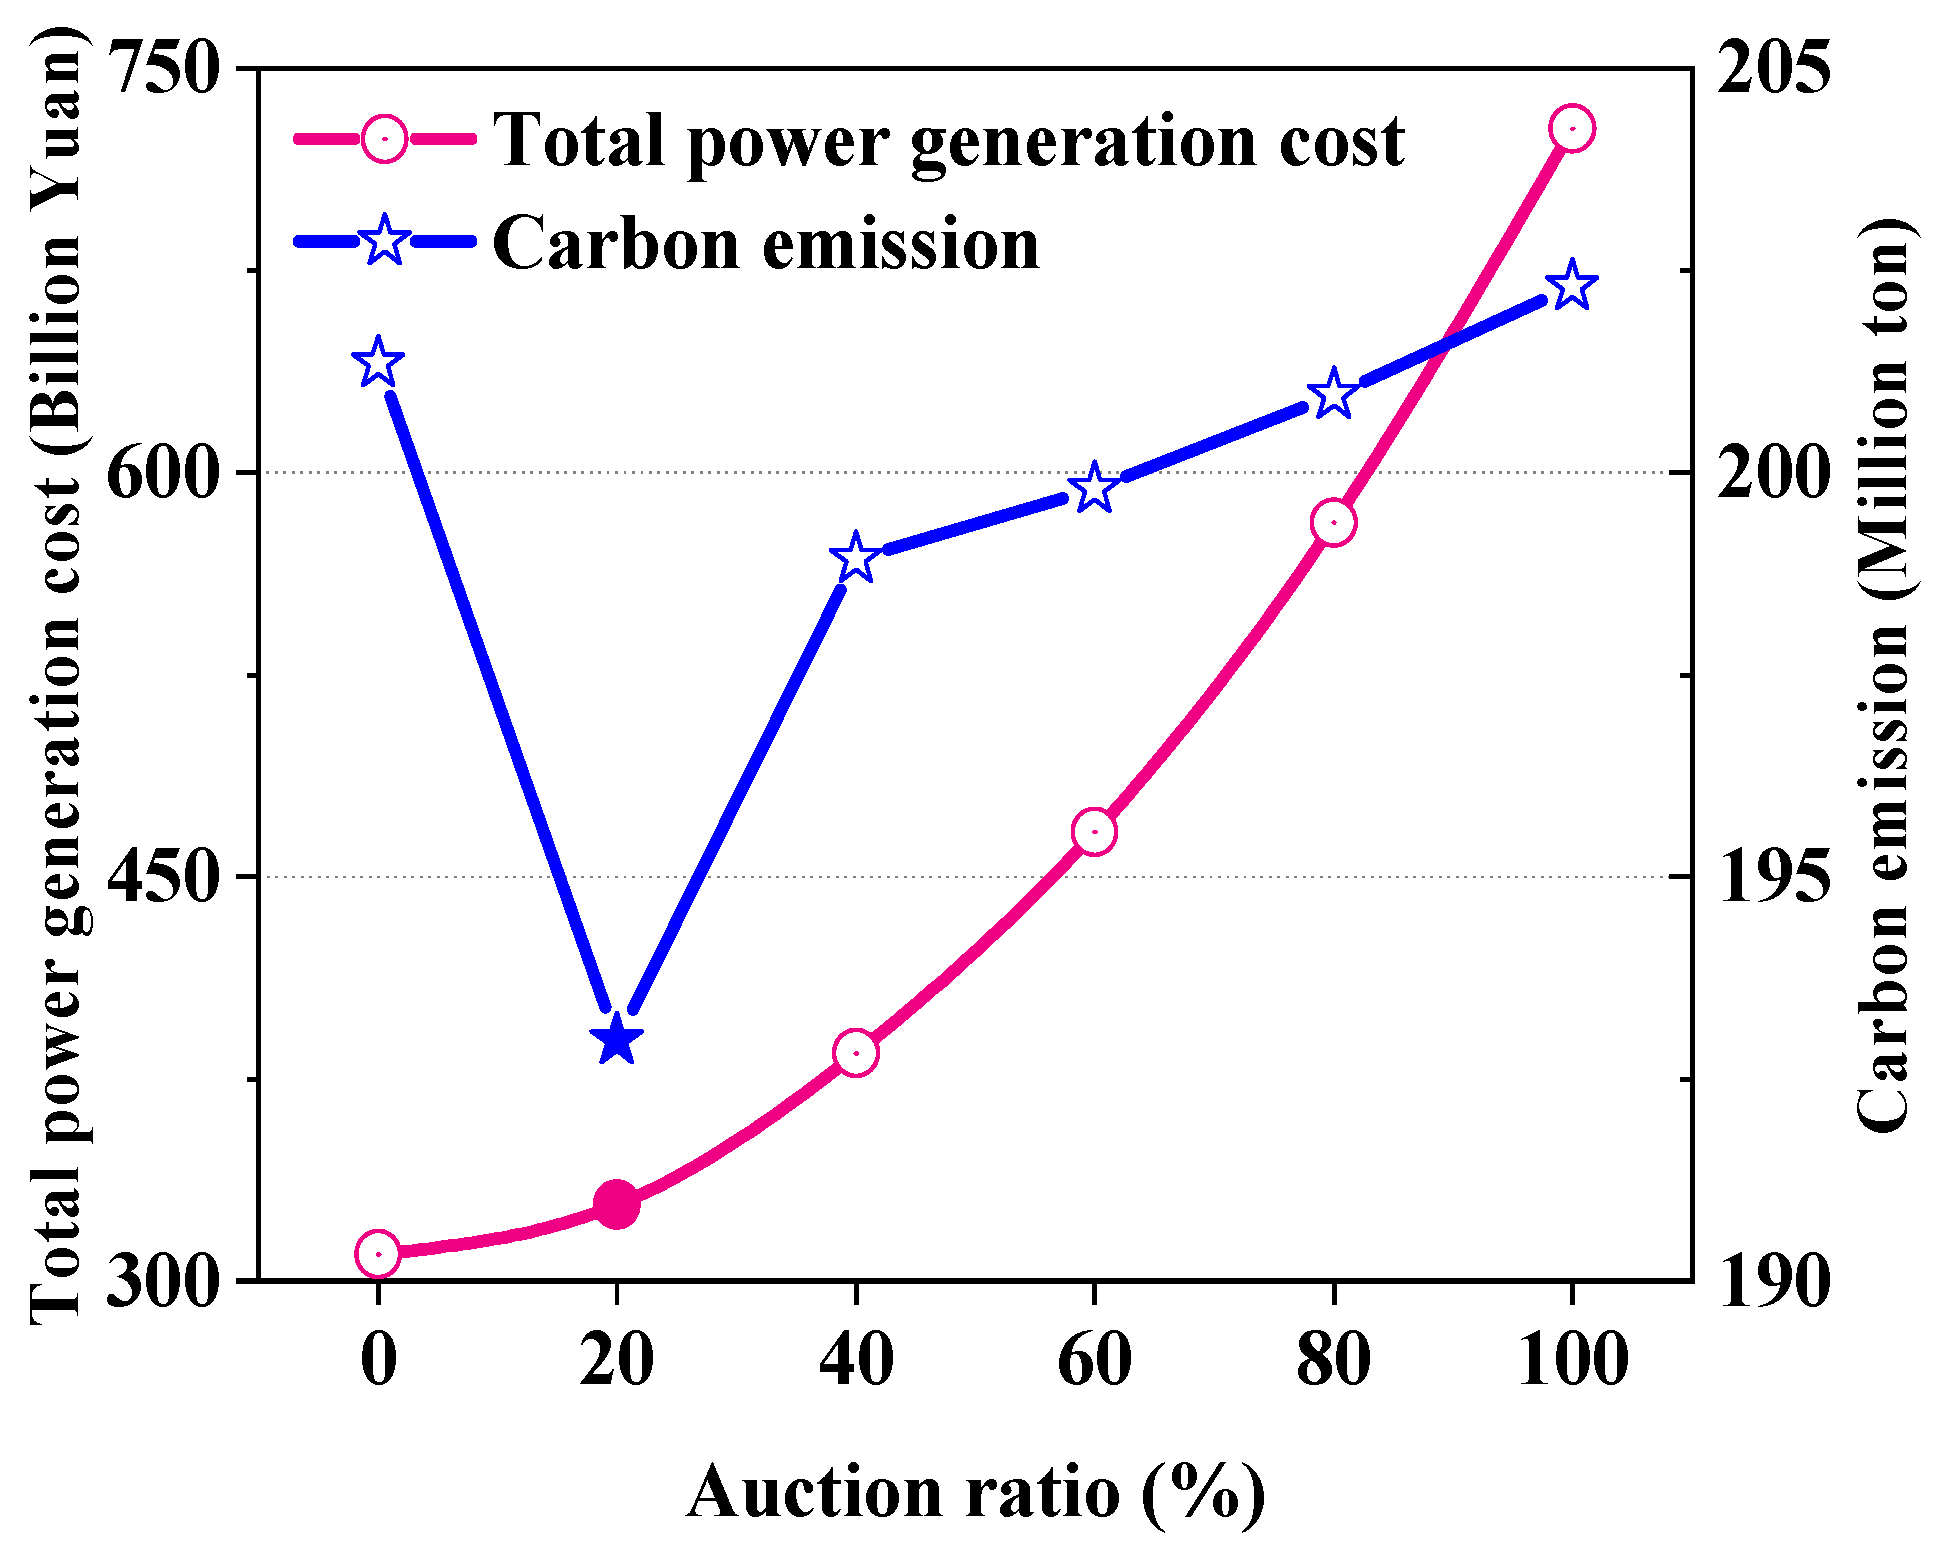
Results of cost indicators
Figure 14 represents the cost indicators at different auction ratios, which are the various costs associated with the objective function for this study. The horizontal scale of Figure 14 represents the auction ratios from 0% to 100%, and the vertical scale represents the cost. As can be shown in the figure, the total economic cost is strongly influenced by the total generation cost, and their trends are particularly similar. Within the composition of total economic costs, total generation costs are an order of magnitude higher than total carbon abatement costs, air pollution emission costs, and outsourced electricity costs, and are therefore measured using two different cost scales in the following figure.
Figure 14 presents the trends of various costs under different auction ratios. As the auction ratio grows, the total power generation cost shows an obvious growth trend, and the total carbon emission reduction cost also shows a dramatic growth trend, yet the change in the air pollution emission cost is relatively moderate, and the cost of outsourced power even shows a decreasing trend. Further analysis of the modeling results reveals that the air pollution emission cost is mainly bound to the pollutants generated by thermal power generation and biomass power generation, while the results from Figure 12 show that with an increase in the auction ratio, the range of the share change in thermal power generation is from 38.99% to 41.14%, the range of the proportion change in biomass power generation is from 6.99% to 7.81%, and the fluctuation of the changes is not particularly drastic; therefore, the corresponding cost of air pollution emissions will not change particularly significantly. The reason for the decrease in the cost of outsourced electricity is mainly due to the requirement to prioritize power generation technologies with low unit costs under the constraint of minimizing the total economic cost. When the auction ratio is increased from 0 to 60%, the unit cost of outsourced electricity is higher than the unit cost of thermal generation in all cases, by 41.4%, 34.9%, 22.3%, and 9.3%, respectively. Even when the auction ratio is set to 80% and 100%, the difference between the unit cost of outsourced electricity and thermal power generation is only 0.02 and 0.15 Yuan/kWh, so the total economic cost can be minimized by the reduction in outsourced electricity purchase.
This research examines the correlation between total economic cost and carbon emissions, illustrated by the black and blue curves, respectively, in Figure 15. The graph reveals that despite optimization efforts, the total economic cost exhibits a notable upward trend as the auction ratio increases. Specifically, when the auction ratio rises from 0% to 100%, the total economic cost of the power generation sector nearly doubles. In contrast, the trend in carbon emissions follows a ‘V’ shape as the proportion of auctions increases. The lowest carbon emissions, at 192.98 million tons, are observed when the auction ratio is set at 20%. Beyond this point, carbon emissions gradually increase. This phenomenon can be attributed to the current carbon emission cap of 250 million tons, which is considered non-strict according to relevant documents. After successfully achieving the emission reduction target, the power generation sector can still strive for maximum benefits in the carbon control space and have a certain degree of flexibility in emission reduction. It is essential to set an appropriate carbon emission cap and auction ratio, which will contribute to the carbon emission reduction in power generation enterprises and facilitate the achievement of greenhouse gas emission mitigation objectives.

5. Conclusion and Policy Implication

5.1. Discussion

Based on the data on electricity and carbon emissions in Guangdong Province, this paper introduces the carbon quota auction mechanism into the power generation industry using empirical research and provides scientific decision-making theoretical support for the sustainable and healthy development of high-carbon power generation enterprises in Guangdong Province from the perspective of government policy makers. If some researchers want to extend the conclusion of this paper to other countries or regions, they may need to pay attention to the following problems in theoretical application. Firstly, the region should have a market base for carbon quota auction allocation; for example, participating enterprises in the carbon market should understand the carbon quota subscription process and auction rules. Secondly, if the carbon market in a certain region includes not only the power generation industry but also the steel, petrochemical, cement, and other industries, then the applicability of the conclusions of this research will become limited. When the carbon market incorporates various high-carbon emission industries, the research paradigm of the paper is still valid, but the specific research details may need to be systematically revised and updated. Only in this way can the conclusions of the paper adapt to more complex social demands.
The conclusion of the carbon emission rights pricing model is based on two assumptions, which have been explained in detail in Section 3.1. In addition, the extended application of this research conclusion needs to pay attention to the two problems mentioned above. These assumptions and problems provide more space for further study of the carbon quota auction mechanism and its incorporated enterprises. In future research directions, there are many perspectives worthy of further exploration. For example, how can the carbon quota auction mechanism and the Renewable Portfolio Standard work together to achieve more optimized carbon emission reduction in the power generation industry? Furthermore, the carbon trading market will accept more industries with high carbon emissions in the future. Therefore, it will be a more valuable frontier exploration to conduct research on the quota allocation and auction ratio setting among multiple industries from the perspective of policy makers when they consider carbon emission reduction and economic growth. Finally, this paper mainly considers the scenario that the power generation industry participates in the carbon quota auction. If we change our perspective from the meso level to the micro level, such as researching the non-cooperative game between power generation enterprises through the primary auction market and the secondary auction market, then the decision-making theories of different power generation enterprises are also of research value from the perspective of power generation companies.

5.2. Conclusions

This paper presents a comprehensive power generation structure optimization model based on auction ratios, focusing on Guangdong Province as the research area. The model systematically optimizes the power generation mix on a monthly time scale and provides a quantitative evaluation of the economic inputs needed to reduce greenhouse gas emissions. Through empirical research, the following conclusions are drawn:
After considering the costs of power generation, emission reduction, air pollution emission, and outsourced electricity, the unit cost of electricity for thermal power generation is projected to increase by approximately three times, while the unit cost of outsourced electricity will nearly double when the auction ratio of carbon allowances rises from 0% to 100%. Specifically, the unit cost of electricity for thermal power generation at a 100% auction ratio is estimated to be 1.66 Yuan/kwh, and the unit cost of outsourced electricity is projected to be 1.51 Yuan/kwh. These unit costs represent a 58.1% and 43.8% increase, respectively, compared to the average peak price set by the Guangdong Development and Reform Commission (1.05 Yuan/kwh). Consequently, the power sector should proactively prepare and plan tariffs on thermal power and outsourced electricity to address the potential challenge of high tariffs and enhance tariff competitiveness.
Secondly, with an increase in the auction ratio, July is the month with the least thermal power generation and February is the month with the highest thermal power generation from the monthly results, and its share of power generation fluctuates between 34.88% and 52.12%, respectively. In other words, after the implementation of the carbon quota auction mechanism, to maximize the reduction in economic burden for the power generation sector, if it is difficult to meet the requirement of 34.88% of thermal power generation share in each month, then it should try its best to ensure that the share of thermal power generation in July reaches the level of 34.88%; this approach enables the sustainable and healthy development of the power sector. Additionally, to address the decrease in rainfall and the surge in power demand, additional thermal power generation is required during the months of November and December, apart from February.
Thirdly, from the annual results, the carbon allowance auction mechanism can promote the development of renewable energy power generation when the auction ratio increases between 0% and 20%, and the promotion effect diminishes in the short term after exceeding the 20% ratio red line. Intuitively, we would expect the share of renewable energy to surge as the auction percentage grows. However, the results of the optimization provide new insights for policy makers, namely the coordinated carbon reduction problem of the Renewable Portfolio Standards and the carbon auction mechanism. According to the optimization results, if these two mechanisms are not improved, it will be difficult to achieve the emission reduction effect of one plus one, which is greater than two emission reductions in the future.
Fourthly, the total economic cost of the power generation sector almost doubled, and the total carbon emission reduction cost increased by nearly 40 times from 0% to 100% auction ratio. However, the cost of outsourced electricity gradually decreased as the ratio increased. The total carbon abatement cost is a significant component of the overall economic cost. The reason for the substantial increase in carbon abatement cost is the dramatic growth in the cost of carbon quota auction and compliance cost for the power generation sector, which puts pressure on the sector. The decreasing cost of outsourced electricity is due to the unit cost of outsourced electricity is higher than the unit cost of thermal power as the ratio increases. This leads to a suppression of outsourced electricity purchases and an expected increase in the self-sufficiency rate of local electricity in Guangdong Province in the future.
Finally, a comprehensive comparison of the indicators of total economic cost, renewable energy development, and carbon emissions reveals that setting the carbon allowance auction ratio at 20% is scientific and reasonable. When the ratio of carbon quota auction is 20%, the total economic cost has the smallest growth rate of 5.92% compared with the auction ratio of 0%; when the ratio rises to 40%, 60%, 80%, and 100%, the growth rate of the total economic cost reaches 24.08%, 50.57%, 87.59%, and 134.77%, correspondingly. For renewable energy development, the percentage of renewable energy generation reaches its highest value of 39.31% when the auction ratio is 20%. For carbon emissions, the smallest amount of carbon emissions can be realized when the auction ratio is 20%, reaching 192.98 million ton under the current cap of 250 million tons of carbon emissions.

5.3. Policy Implication

The conclusions are further analyzed and discussed, and the policy recommendations of this research are as follows:
Firstly, the conclusions of this research suggest that the Guangdong provincial government should consider increasing investment in clean energy power generation, with a particular focus on nuclear power. This would serve as a key strategy for reducing high carbon emission costs. It is observed that the carbon abatement cost associated with thermal power and outsourced power in Guangdong Province is considerably high. Considering sustainable development, the government can address the issue by allocating more resources to clean energy power generation. Due to the significant initial investment required for carbon emission reduction, it is possible that numerous thermal power enterprises may not actively participate in the carbon trading market. However, this situation provides clean energy power generation enterprises a comparative advantage, especially after introducing the auction ratio of carbon quotas. Leveraging its existing geographical and resource advantages, Guangdong Province can gradually expand the scale of clean energy power generation. The Daya Bay Nuclear Power Station in Guangdong Province is China’s largest nuclear power facility, boasting the highest operational installed capacity. As a result, the government can give priority to the development of nuclear power while considering other forms of clean energy generation as supplementary sources. Subsequently, the focus can be gradually shifted towards the development of other clean energy power generation.
Secondly, to alleviate the economic pressure brought about by the cost of carbon emission reduction, and in response to the new power system reformation program “Several Opinions on Further Deepening the Reform of Power System” (referred to as “No. 9 Government Document”), the Guangdong provincial government can liberalize the decision-making power of electricity pricing to a certain extent. To address this problem, it is necessary to appropriately incorporate the costs of carbon emission reduction into residential and industrial electricity prices through a reasonable auction ratio. These measures would incentivize the production and consumption of clean energy, facilitating energy transformation. For instance, setting the auction ratio of carbon quotas to 100% would result in thermal power generation and outsourced electricity having unit electricity costs that are 58.1% and 43.8% higher than the average peak electricity price, respectively. Therefore, it is crucial for the government to respond to the policy outlined in the “No. 9 Government Document” and promote reforms and improvements in the electricity trading mechanism. This includes a gradual and regional adjustment of electricity prices.
Thirdly, the Guangdong provincial government aims to address the mutual constraints between Carbon Emissions Trading and Renewable Portfolio Standards. This research presents the carbon quota auction mechanism and considers the constraints imposed by the Renewable Portfolio Standards. Our research identifies a potential issue where the minimum and incentive responsibility weights of the Renewable Portfolio Standards might limit the emission reduction impact that the carbon quota auction mechanism should have achieved. Moreover, increasing the auction ratio may not effectively promote the utilization of renewable energy when the carbon emissions cap in the auction mechanism is not strictly set.
Fourthly, the relevant government departments can set the auction ratio at 20% in the short term to achieve various policy objectives considering the total economic cost of renewable energy development and carbon emission indicators. Compared to an auction ratio of 0%, a ratio of 20% will minimize the increase in total economic costs and impose a minimal and acceptable economic burden on the power generation sector. Additionally, the share of electricity generated from renewable sources peaks and carbon emissions are reduced to a minimum level when the auction ratio is 20%. If the auction ratio exceeds 20%, it will be necessary to redesign the cap on carbon emissions for the auction mechanism, as well as adjust the minimum value and incentive value under the Renewable Portfolio Standards. These adjustments are crucial to realizing the expected emission reduction targets while reducing the economic burden on the power generation sector.
Finally, it can be inferred from the conclusion of this research that different stakeholders have different responses to the auction ratio set by the government in the future. First, government decision makers are more concerned about the economic pressure borne by power generation enterprises and the responsibility of emission reduction in the region. Therefore, setting the auction ratio at 20% is a more appropriate short-term optimal choice. Secondly, from the investor’s point of view, if the government decision makers introduce the carbon quota auction mechanism and ensure that the total carbon emission cap is gradually tightened, investing in power generation enterprises with a significant ratio for outsourced electricity seems more prudent. Because the total cost of outsourced electricity gradually decreases with an increase in the auction proportion, which may bring scale benefits to those power generation companies. In addition, if the auction ratio set by the government decision makers exceeds 20% and the RPS of each province is not adjusted, it will be a more rational choice to reduce the holdings of enterprises with a high proportion of renewable energy power generation. Given that the economic cost and carbon emissions have played many games to minimize the economic burden of the power generation industry first, the proportion of renewable energy power generation will be slightly reduced in the end. Finally, power generation enterprises are more concerned about economic costs and power generation plans. This research has provided the optimal monthly and annual power generation mix under different auction ratios, so power generation enterprises could make their own production plans according to the total power industry. It will be a feasible choice to prepare for the high unit electricity price of thermal power generation and outsourced electricity in advance if the enterprise does not implement a carbon reduction plan for thermal power generation or undergo technical upgrading.
The power generation mix optimization model based on the auction ratio, constructed in this research, can serve as a benchmark for the government in the allocation of carbon quota auctions in Guangdong Province in the future. Additionally, it provides a reference and suggestion for including more industries in the national carbon trading market.

Author Contributions

Conceptualization, E.Z. and L.L.; methodology, E.Z. and L.L.; software, J.C.; validation, E.Z., J.C. and J.L.; formal analysis, J.C.; investigation, E.Z.; resources, E.Z.; writing—original draft preparation, J.C.; writing—review and editing, E.Z., J.L. and L.L.; visualization, J.C.; supervision, E.Z.; project administration, E.Z.; funding acquisition, E.Z. and J.L. All authors have read and agreed to the published version of the manuscript.

Funding

This research was funded by [National Natural Science Foundation of China: Research on the analysis model of carbon allowance auctioning’s pass-through effect on the abatement cost of the electric power generation sector in China and its policy] grant number [71673086] and [Special Project on Smart Campus Construction of the University of International Business and Economics in 2022] grant number [ZHXY202201].

Data Availability Statement

The key data utilized in the model can be found in the following literatures and websites. The Carbon emission intensity during various energy generation periods is sourced from reputable scholars or websites, such as those literature [34,35,36,37]. The Average carbon price is obtained from the carbon trading website, while the data of Carbon emission cap is derived from the Guangdong Provincial Bureau of Statistics. The data of Line loss rate originates from the Wind database, and maximum electricity load is collected from the typical power load curves of provincial-level power grids.

Conflicts of Interest

The authors declare no conflict of interest.

References

  1. Gao, J. Research on the Forecast and Optimization of Power Supply Structure in Jiangsu Considering Renewable Energy Power. Master’s Thesis, China University of Mining and Technology, Beijing, China, 2019. [Google Scholar]
  2. Udara Willhelm Abeydeera, L.H.; Wadu Mesthrige, J.; Samarasinghalage, T.I. Global Research on Carbon Emissions: A Scientometric Review. Sustainability 2019, 11, 3972. [Google Scholar] [CrossRef]
  3. Wu, F. Analysis and optimization of power supply structure in Guangdong in the 14th Five-Year Plan. China Energy 2021, 43, 64–73. [Google Scholar] [CrossRef]
  4. Cai, J.; Zheng, H.; Vardanyan, M.; Shen, Z. Achieving carbon neutrality through green technological progress: Evidence from China. Energy Policy 2023, 173, 113397. [Google Scholar] [CrossRef]
  5. Zhang, S.; Zhao, T.; Xie, B.-C. What is the optimal power generation mix of China? An empirical analysis using portfolio theory. Appl. Energy 2018, 229, 522–536. [Google Scholar] [CrossRef]
  6. Miao, Y. Research on Optimization System of Carbon Abatement Costs in Guangdong Province under Paid Allowance. Master’s Thesis, North China Electric Power University, Beijing, China, 2019. [Google Scholar]
  7. Li, Z.; Wu, L.; Xu, Y.; Wang, L.; Yang, N. Distributed tri-layer risk-averse stochastic game approach for energy trading among multi-energy microgrids. Appl. Energy 2023, 331, 120282. [Google Scholar] [CrossRef]
  8. Ao, Z.; Fei, R.; Jiang, H.; Cui, L.; Zhu, Y. How can China achieve its goal of peaking carbon emissions at minimal cost? A research perspective from shadow price and optimal allocation of carbon emissions. J. Environ. Manag. 2023, 325, 116458. [Google Scholar] [CrossRef] [PubMed]
  9. Zhao, J.J.; Gan, Y.H.; Ma, X.Q.; Yang, Z.L. The cost of electric power generation in Guangdong Province. Energy Sources Part B Econ. Plan. Policy 2016, 11, 1014–1019. [Google Scholar] [CrossRef]
  10. Jin, J.; Zhou, P.; Li, C.; Guo, X.; Zhang, M. Low-carbon power dispatch with wind power based on carbon trading mechanism. Energy 2019, 170, 250–260. [Google Scholar] [CrossRef]
  11. Latif, S.N.A.; Chiong, M.S.; Rajoo, S.; Takada, A.; Chun, Y.-Y.; Tahara, K.; Ikegami, Y. The Trend and Status of Energy Resources and Greenhouse Gas Emissions in the Malaysia Power Generation Mix. Energies 2021, 14, 2200. [Google Scholar] [CrossRef]
  12. Chen, H.; Tang, B.-J.; Liao, H.; Wei, Y.-M. A multi-period power generation planning model incorporating the non-carbon external costs: A case study of China. Appl. Energy 2016, 183, 1333–1345. [Google Scholar] [CrossRef]
  13. Cai, W.; Wang, C.; Wang, K.; Zhang, Y.; Chen, J. Scenario analysis on CO2 emissions reduction potential in China’s electricity sector. Energy Policy 2007, 35, 6445–6456. [Google Scholar] [CrossRef]
  14. Cheng, R.; Xu, Z.; Liu, P.; Wang, Z.; Li, Z.; Jones, I. A multi-region optimization planning model for China’s power sector. Appl. Energy 2015, 137, 413–426. [Google Scholar] [CrossRef]
  15. Chen, Y.; Xu, X. Research Report on Carbon Trading Pilot in Seven Provinces and Cities of China. Mod. Bus. 2016, 53–54, preprint. [Google Scholar] [CrossRef]
  16. Wang, H.; Feng, T.; Zhong, C. Effectiveness of CO2 cost pass-through to electricity prices under “electricity-carbon” market coupling in China. Energy 2023, 266, 126387. [Google Scholar] [CrossRef]
  17. Zhou, X.; Fan, L.W.; Zhou, P. Marginal CO2 abatement costs: Findings from alternative shadow price estimates for Shanghai industrial sectors. Energy Policy 2015, 77, 109–117. [Google Scholar] [CrossRef]
  18. Lee, J.-D.; Park, J.-B.; Kim, T.-Y. Estimation of the shadow prices of pollutants with production/environment inefficiency taken into account: A nonparametric directional distance function approach. J. Environ. Manag. 2002, 64, 365–375. [Google Scholar] [CrossRef] [PubMed]
  19. Sun, B. A multi-objective optimization model for fast electric vehicle charging stations with wind, PV power and energy storage. J. Clean. Prod. 2021, 288, 125564. [Google Scholar] [CrossRef]
  20. Stringer, T.; Joanis, M.; Abdoli, S. Power generation mix and electricity price. Renew. Energy 2024, 221, 119761. [Google Scholar] [CrossRef]
  21. Matsuo, Y.; Endo, S.; Nagatomi, Y.; Shibata, Y.; Komiyama, R.; Fujii, Y. A quantitative analysis of Japan’s optimal power generation mix in 2050 and the role of CO2-free hydrogen. Energy 2018, 165, 1200–1219. [Google Scholar] [CrossRef]
  22. Niknam, T.; Firouzi, B.B.; Mojarrad, H.D. A new evolutionary algorithm for non-linear economic dispatch. Expert Syst. Appl. 2011, 38, 13301–13309. [Google Scholar] [CrossRef]
  23. Xu, X.; Niu, D.; Qiu, J.; Wang, P.; Chen, Y. Analysis and Optimization of Power Supply Structure Based on Markov Chain and Error Optimization for Renewable Energy from the Perspective of Sustainability. Sustainability 2016, 8, 634. [Google Scholar] [CrossRef]
  24. Zhao, E.-D.; Song, J.-C.; Chen, J.-M.; Liu, L.-W.; Chen, M.-S. Will auctioning promote the renewable energy generation in China? Adv. Clim. Chang. Res. 2022, 13, 107–117. [Google Scholar] [CrossRef]
  25. Hsiao, C.-T.; Liu, C.-S.; Chang, D.-S.; Chen, C.-C. Dynamic modeling of the policy effect and development of electric power systems: A case in Taiwan. Energy Policy 2018, 122, 377–387. [Google Scholar] [CrossRef]
  26. Zhang, D.; Liu, P.; Ma, L.; Li, Z.; Ni, W. A Multi-Period Modelling and Optimization Approach to the Planning of China’s Power Sector with Consideration of Carbon Dioxide Mitigation. Comput. Chem. Eng. 2012, 37, 227–247. [Google Scholar] [CrossRef]
  27. Yu, S.; Zhou, S.; Zheng, S.; Li, Z.; Liu, L. Developing an Optimal Renewable Electricity Generation Mix for China Using a Fuzzy Multi-Objective Approach. Renew. Energy 2019, 139, 1086–1098. [Google Scholar] [CrossRef]
  28. Yu, X.; Chen, Z.; Liu, Y. Research on Power Grid Development Strategy in Pearl River Delta Region. South. Power Syst. Technol. 2010, 4, 37–39. [Google Scholar] [CrossRef]
  29. Wei, Y.; Ye, Q.; Ding, Y.; Ai, B.; Tan, Q.; Song, W. Optimization model of a thermal-solar-wind power planning considering economic and social benefits. Energy 2021, 222, 119752. [Google Scholar] [CrossRef]
  30. Zhang, Y.; Wang, J.; Zhang, L.; Liu, J.; Zheng, H.; Fang, J.; Hou, S.; Chen, S. Optimization of China’s electric power sector targeting water stress and carbon emissions. Appl. Energy 2020, 271, 115221. [Google Scholar] [CrossRef]
  31. Liu, L.; Sun, X.; Chen, C.; Zhao, E. How will auctioning impact on the carbon emission abatement cost of electric power generation sector in China? Appl. Energy 2016, 168, 594–609. [Google Scholar] [CrossRef]
  32. Fang, Y. An analysis of the estimation of environmental value criteria for emission reduction of pollutants in thermal power generation industry. Technol. Innov. 2017, 41, preprint. [Google Scholar] [CrossRef]
  33. Li, Z.; Fang, T.; Chen, C. Research on Environmental Cost from the Perspective of Coal-Fired Power Plant. Pol. J. Environ. Stud. 2021, 30, 1695–1705. [Google Scholar] [CrossRef]
  34. Song, H.; Qu, H.; Zhang, Z.; Wang, Z. Analyzing Carbon Emissions from Nuclear Power Generation from a Life Cycle Perspective. In China Nuclear Science and Technology Progress Report (Volume II)—Proceedings of the 2011 Annual Academic Conference of the Chinese Nuclear Society, Volume 10 (Nuclear Intelligence (Including Computer Technology) Sub-Volume, Nuclear Technology Economics and Management Modernization Sub-Volume); China Nuclear Society: Beijing, China, 2011; Volume 2, pp. 233–239. [Google Scholar]
  35. Fan, J.; Sun, J.; Zhao, R. Carbon Emission and Carbon Circulation Map of China’s Coal Industry in the Whole Life Cycle. Coal Econ. Res. 2017, 37, 34–37. [Google Scholar] [CrossRef]
  36. Jacobson, M.Z. Evaluation of Nuclear Power as a Proposed Solution to Global Warming, Air Pollution, and Energy Security; Cambridge University Press: Cambridge, UK, 2020. [Google Scholar]
  37. Wang, Y.; Sun, T. Life Cycle Assessment of CO2 Emissions from Wind Power Plants: Methodology and Case Studies. Renew. Energy 2012, 43, 30–36. [Google Scholar] [CrossRef]
Figure 1. The comparative analysis with other regions or countries that have implemented carbon quota auction mechanisms. * Auctioning is the only RGGI-wide allocation approach, but the actual percentage may be less than 100% because some states have small dedicated “set-aside” accounts. ** While entities in the Korea Emissions Trading Scheme are generally required to purchase 3% of their allowances at auction, sub-sectors that are considered vulnerable to international competitiveness and carbon leakage are exempted. This means auctioning system-wide is currently below 3%. *** The Pilot ETS in Mexico is yet to launch in 2019 and is planned to transition from a pilot phase to a fully operational economy-wide emissions trading system in 2024.
Energies 17 00617 g001
Figure 2. Framework design for power generation structure optimization under carbon auction mechanism.
Energies 17 00617 g002
Figure 3. The carbon emission rights pricing model based on system dynamics.
Energies 17 00617 g003
Figure 4. Key simulation equations in the carbon emission rights pricing model.
Energies 17 00617 g004
Figure 5. Shadow price of carbon allowances under different auction ratios.
Energies 17 00617 g005
Figure 6. The price of carbon emission rights compared with existing studies.
Energies 17 00617 g006
Figure 7. The sensitivity analysis regarding total electricity supply.
Energies 17 00617 g007
Figure 8. The sensitivity analysis regarding carbon emissions from thermal power generation.
Energies 17 00617 g008
Figure 9. Environmental cost of power generation from different energy sources under different auction ratios of carbon quotas.
Energies 17 00617 g009
Figure 10. The power generation structure of Guangdong Province in different months under different auction ratios of carbon quotas.
Energies 17 00617 g010
Figure 11. Share of energy power generation in different months under different auction ratios of carbon quotas.
Energies 17 00617 g011
Figure 12. The power generation structure and share of renewable energy power generation under different carbon quota auction ratios at the annual level.
Energies 17 00617 g012
Figure 13. Share of renewable power generation in different months with different carbon allowance auction ratios.
Energies 17 00617 g013
Figure 14. Cost indicators for different carbon allowance auction ratios.
Energies 17 00617 g014
Figure 15. The total economic costs and carbon emissions under different carbon allowance auction ratios.
Energies 17 00617 g015
Table 1. Standardization and explanation of the indexes, parameters, and variables used in modeling.
IndexExplanation
i The set of electricity generation types;
t Every month from January to December;
κ Carbon quota auction ratio;
p The set of pollutant types generated by power generation.
ParameterExplanation
ϑ i , t CO2 emissions per unit of energy generated;
π i Subsidized unit price for technology i ;
α i Unit output coefficient for technology i ;
γ i 0–1 variables, γ i = 0 indicates that no subsidy policy is considered for technology i ;
When γ i = 1 , it means the opposite situation;
η i , t Carbon emission intensity coefficient for technology i during equipment operation;
τ t Regional grid average CO2 emission factor;
λ p , i Average emission factor of pollutant P generated by electricity generation for technology i ;
ε i , t Plant electricity consumption rate of generator set for technology i ;
δ i , t Line loss rate of generator set for technology i ;
β p Power reserve ratio;
θ l o w Minimum weighted responsibility for renewable energy power integration;
ψ t h Peak shaving depth of thermal power generators.
VariableExplanation
x i , t The amount of power generation by technology i in month t ;
d t The outsourced electricity in month t ;
C Total economic cost;
C 1 Total generation cost of various power generation technologies;
C 2 Total carbon abatement cost of various power generation technologies;
C 3 Cost of atmospheric pollution emissions;
C 4 Net cost of the outsourced electricity;
C i , t Unit cost of electricity generation by technology i in month t ;
F i , t Total subsidy of electricity generation for technology i in month t ;
C i B a s i c Basic operating costs for technology i ;
C i , t E n v i r Environmental costs for technology i in month t ;
C D 1 Depreciation cost of thermal power generation units;
C F 1 Fuel cost of thermal power generation;
C O 1 Operation and maintenance costs of thermal power generation;
P E k The shadow price of carbon emissions when the carbon quota auction ratio is k ;
P t Average carbon price in carbon emission trading market in month t ;
C E C A P t Carbon emission quota allocated to thermal power units in month t ;
E C p Environmental costs of pollutant p ;
C t i n Average transaction price of the outsourced electricity in month t ;
C t o u t Average transaction price of the exported electricity in month t ;
W t The exported electricity in month t ;
D t Total social electricity demand in month t ;
M t Maximum electricity load demand in month t ;
M t Peak-to-valley difference of grid load;
N t Exported electricity load;
G t Available installed capacity;
P i , t m a x Output power fluctuation range;
M t Grid load peak-to-valley difference;
X i , t The proportion of the i -th energy generation in the t-th month to the annual generation;
X N F G t a r g e t Non-fossil energy generation as a percentage of total electricity generation;
X N H R t a r g e t Non-hydro renewable energy generation as a percentage of total electricity generation;
C E Carbon emissions from the power generation sector;
E Carbon emission cap for the power generation sector;
U i , t Historical average installed capacity;
H i , t m i n Minimum utilization hours for technology i in month t ;
H i , t m a x Maximum utilization hours for technology i in month t ;
Y t Historical average installed capacity of the outsourced electricity;
H t , m i n i n Minimum utilization hours for the outsourced electricity in month t ;
H t , m a x i n Maximum utilization hours for the outsourced electricity in month t .
Table 2. Environmental costs resulting from the emission of various pollutants.
PollutantsUnit S O 2 N O x T S P P M 2.5
Average emission factor for thermal power generationg/kWh1.656.360.51.06
Average emission factor for biomass power generationg/kWh0.3570.742/0.103
Environmental costsYuan/kg682.20.12
Table 3. Results of cost-related data measurements in the research.
Power Generation TechnologyUseful Life (Year)The Basic Operating Costs (Yuan/kWh)Power Generation Subsidy (Yuan/kWh)Carbon Emission Coefficients (g/kWh)
Thermal250.33630822
Hydro500.0966020
Wind200.41500.19213
Nuclear450.3420066
Solar300.70000.137745
Biomass250.46480.179535
Disclaimer/Publisher’s Note: The statements, opinions and data contained in all publications are solely those of the individual author(s) and contributor(s) and not of MDPI and/or the editor(s). MDPI and/or the editor(s) disclaim responsibility for any injury to people or property resulting from any ideas, methods, instructions or products referred to in the content.

