Article

Forest Stand Growth Forecasting in the Context of Changes in the Insolation of Building Roofs

by
Renata Pelc-Mieczkowska
,
Wioleta Błaszczak-Bąk
*,
Joanna Janicka
and
Tomasz Kozakiewicz
Faculty of Geoengineering, University of Warmia and Mazury in Olsztyn, Oczapowskiego 1, 10-719 Olsztyn, Poland
*
Author to whom correspondence should be addressed.
Energies 2024, 17(3), 594; https://doi.org/10.3390/en17030594
Submission received: 15 December 2023 / Revised: 22 January 2024 / Accepted: 24 January 2024 / Published: 26 January 2024
(This article belongs to the Special Issue Photovoltaic Solar Cells and Systems: Fundamentals and Applications)

Abstract

:
This article analyzed the long-term impact of tree growth on the decrease in sunlight of a planned photovoltaic installation. As trees grow, they can obstruct sunlight and reduce the amount of insolation reaching the PV panels, and knowledge about the degree of this reduction is crucial when assessing the long-term economic effects of the investment. Currently, when planning PV installation, the roof facing, latitude, topography, and neighboring buildings are taken into account. However, there is no tool to assess the impact of tree growth over time on changes in the level of sunlight on the roof surface. The authors propose a tool for performing such an assessment using geospatial analysis techniques. The data from airborne laser scanning (ALS) and unmanned aerial vehicles with laser scanning (ULS) were used to model trees in two epochs. The authors used two epochs of data to evaluate mathematical models of tree growth. The evaluated tree growth model was then used to predict forest stand growth over a 30-year period and to assess the change in sunlight due to the modeled growth. For the case study, two test sites have been taken into account. At site 1 and site 2, respectively, 25 and 12 points representing the centers of potential photovoltaic panels were designed, for which the annual sum of minutes during which the point remained exposed to sunlight was calculated. The results showed that the use of ALS and ULS provided valuable data for determining current and predicted shading of trees. Moreover, the presented studies showed that the changes in forest stand growth had a significant impact on decreasing the insolation of building construction. In the case of both test sites, the change in tree height after 30 years resulted in a reduction in the number of minutes of sunlight by more than 50%. The authors suggest that the developed technique should be incorporated into PV installation planning tools to ensure reliable prediction of the long-term profitability of designed PV installations.

1. Introduction

The use of photovoltaic (PV) panels mounted on building roofs is becoming increasingly popular as a means of generating renewable energy. Undoubtedly, this is one of the best solutions because it can be used in urban developments and single-family houses without the need to reserve additional space for the installation of PV panels, as the roof surface provides this space [1]. Such solutions can even be used on renovated historical buildings [2]. Rooftop integration should be prioritized since it provides the best annual solar energy harvesting (in any climate zone). At the same time, combining PV systems with different azimuth and tilt angles contributes to better load matching, reducing storage needs [3]. Additionally, when planning PV installation, the latitude, topography, exposure, and neighboring buildings are usually taken into account to assess the degree of sunlight on the roof surface. There are some studies in the literature that take into account additionally factors such as snow, dust, leaves, and animal excrement [4]. However, the impact of trees and their growth over the years should also be taken into consideration. Both the position and height of trees around solar panels have direct impacts on how shaded (and thus less efficient) an installed solar panel system is. It is important to assess the trees around objects, specifically their height to the PV system, before installing solar panels [5]. The property owner does not always have influence and decision making on changes occurring in the natural environment but they should be able to predict certain situations that may affect the change in solar radiation of roofs. The analysis of insolation allows for an increase in the efficiency of the photovoltaic installation, and the basis for calculating insolation is accurate spatial information about the area and its covering elements. Therefore, the complex information about current and predicted curtains that may affect the insolation of building roofs in the context of mounted PV panels is an important consideration for sustainable and efficient energy production [6,7].
In many cases, when a photovoltaic installation is planned, there are young self-seeding trees in the vicinity of the building, trees planted by the owner or neighbor or planted as part of forest management. As trees grow taller, they can obstruct sunlight and reduce the amount of insolation reaching the PV panels. This can have a direct impact on the efficiency and output of the PV system, as well as the overall energy production and cost-effectiveness of the system over time. Therefore, understanding the relationship between tree growth and the insolation of building roofs in the context of mounted PV panels is critical for the effective planning, design, and maintenance of renewable energy systems [8,9]. In this context, this topic presents a unique opportunity to explore the complex interactions between trees, building roofs, and renewable energy production and to identify strategies for balancing these competing interests for optimal energy production and sustainable forest management.
There are many tools called solar calculators available that can be used when designing solar PV systems. These calculators are free to use or download; however, they only take into account the solar radiation of roofs during the seasons, without considering the potential changes in the natural environment surrounding the building (such as the height and growth of trees). Such calculations, for example, include the Photovoltaic Geographical Information System (PVGIS) (source: https://re.jrc.ec.europa.eu/pvg_tools/en/tools.html, accessed on 17 November 2023 ), Solar Panels-PV System Sizing and Power Yield Calculator (https://www.inbalance-energy.co.uk/articles/solar_panels_pv_calculator.html, accessed on 17 November 2023), or others described and tested in the literature [10]. Although the lifetime of photovoltaic panels is specified in warranty leaflets as up to 20–30 years, their actual lifetime is approximately 12–15 years [11,12]. Insolation forecasts for the facilities where the solar PV system is planned to be installed do not take into account the fact that the owner will have to replace the panels. However, it should be taken into account when estimating the installation and subsequent operation of a photovoltaic installation, as well as when calculating the overall costs of obtaining solar energy, to check how quickly the cost of installing a photovoltaic panel system will be recovered. Unlike landforms or buildings, trees are curtains that cause some modeling problems [13], and, above all, they are characterized by variability over time. This variability can and should be predicted [14].
In order to examine the surroundings of buildings planned for installing PV panels, some geodata should be collected. Forests, wooded areas, and tree stands require a special approach. Airborne laser scanning (ALS) and unmanned aerial vehicles with Light Detection and Ranging (LiDAR) sensor (ULS) technology are both capable of generating point cloud data of forested areas [15,16]. These point clouds can be used to accurately measure the height and growth of trees in the area and forecast their growth in the coming years. To determine the height of trees using ALS, a laser scanner is mounted on an aircraft that flies over the forested area. The laser scanner emits laser pulses that bounce off the trees and return to the scanner, creating a point cloud of the area. The height of each tree can be determined by subtracting the ground elevation from the top of the tree, as represented by the point cloud [17]. UAVs, equipped with LiDAR sensors, can also be used to generate point cloud data of forested and tree-lined areas. The LiDAR sensors emit laser pulses that bounce off the trees and return to the drone, creating a point cloud of the area [18]. These data can be used to create a digital surface model (DSM) that shows the height of the trees.
Combining the point cloud data generated by ALS and ULS can provide an even more accurate measurement of tree height and growth. By comparing multiple point clouds taken over time, changes in tree height can be detected, allowing for the forecasting of tree growth in the coming years. Therefore, by comparing the heights of trees determined based on datasets obtained using ALS, ULS, or in a mixed way, it is possible to calculate how much the trees we are interested in have grown in a certain unit of time, e.g., 5 or 10 years. In addition, growth models of individual tree species are described in the literature.
Efficient and accurate models for growth and yield are a fundamental tool in forest sciences, playing a key role in forest management, forest planning, ecological studies, or, in fact, any discipline within the field. Data of this type are kept by national forest inventories around the world in individual countries, e.g., in Germany [19], in Brazil [20,21], in Asian countries [22], and in other European countries [23]. In Poland, mathematical models of tree growth can be found in the studies of Szymkiewicz’s “Tables of holdings measurement and growth of timber stock” (1971) [24] and Bruchwald’s “MDI−1 growth model for pine” (1985) [25].
Tree growth is a function of time and other conditions such as habitat class, climatic conditions, etc. By analyzing the literature and tree growth models, it can be observed that in different places in the world and in different climatic zones, the growth dynamics of the same tree species may be different. Forest resource administrations around the world maintain their statistics and update information on the status of these resources from time to time. Dendrologists are currently observing the phenomenon of trees growing faster than indicated via existing mathematical models, due to, among others, climate change and higher carbon dioxide emissions into the atmosphere. In the case of private forested areas, such documentation is not kept at all (at least in Poland). Therefore, it is worth using available modern technologies such as ALS or ULS and checking the growth of the tree stand we are interested in, for example, in terms of the possible installation of photovoltaic panels.
The main aim of this paper was to forecast the growth of tree stands in the context of changes in sunlight on building roofs. To achieve the set goal, the following specific goals were formulated: (1) using ALS and ULS data, the actual growth of trees was examined at two research sites located in north-eastern Poland; (2) the obtained tree growth was verified by comparing it with available tables in force in Poland; (3) a forecast of tree growth over the next 30 years was prepared, fitting the obtained forecast into a tree growth model; and (4) a dedicated tool was developed to calculate the current and forecasted solar radiation of the roof. This tool allows for the estimation of the change in roof solar radiation at any point in the future.

2. Materials and Methods

2.1. Methodology

The proposed methodology takes into consideration two elements: roof solar radiation and prediction of the shape of curtains for n-year, based on the growth of trees located near the roof. To determine the insolation, without taking into account curtains for now, a roof model and an algorithm for determining the sun’s position depending on the season and time of day are necessary. Roof models were made based on point clouds. The sun position is available from the pvlib python tool [26].
For canopy shape modeling as well as for roof modeling, the point clouds from two measurement epochs for two test sites were used. Data from the first measurement epoch (e1) came from ALS, while the second measurement epoch (e2) data came from ULS and tachymetry. ULS data were used for individual tree detection in the vicinity of the roof. Additionally, data from ALS, ULS, and tachymetry were used to determine tree growth between e1 and e2.
Determining the growth of individual trees based on point clouds between e1 and e2 required the following steps (Figure 1):
Step 1
DSM generation: a DSM of the area around the building was generated as a TIN model.
Step 2
Digital terrain model (DTM) acquisition: a DTM of the area around the building to provide a reference surface for the tree height measurements was downloaded from geoportal.gov.pl.
Step 2
Calculating the Canopy Height Models (CHM) for e1 and e2 epochs: this can be carried out by simply differencing DSM and DTM in both epochs.
Step 4
Individual tree tops identification: to identify individual tree tops in the CHM, the Local Maximum Function was used.
Step 5
Calculating tree growth: the growth of each tree was calculated by comparing the heights of tree tops between two epochs.
Step 6
Verification of the methodology used in steps 3 to 5: direct and indirect measurements on the point cloud were used for this verification.
Step 7
Future growth prediction: statistical models to predict the future growth validated by actual tree growth obtained in step 5 were used.
Figure 1. Steps 1 to 7 of the proposed methodology.
Energies 17 00594 g001
The most important is step 7 because the building’s solar access depends on the correct future growth prediction and future tree height estimation. To find statistical models of tree growth, there are several sources that can be used:
  • Open access journals: there are several open access journals that publish research on tree growth models.
  • Research repositories: many research institutions and universities have repositories where researchers can publish their work.
  • Government agencies: government agencies such as the United States Forest Service and the Canadian Forest Service often publish research on tree growth models [27].
  • Commercial software: commercial software providers such as Sim4Tree v. 4.2, Heureka v. 2.21.3, and Forest Vegetation Simulator (FVS v 2023.07.28) provide access to their tree growth models.
  • Scientific conferences: attending scientific conferences such as the International Union of Forest Research Organizations (IUFRO) and the International Society of Arboriculture (ISA) can also provide opportunities to learn about tree growth models [28].
It is essential to assess the quality and validity of any statistical model of tree growth that can be used. Also, it is important to consider the specific tree species, environmental conditions, and other factors that may affect tree growth in tested areas.
In this paper, tables of tree growth [25] were used. The test was carried out in Poland, so these tables take into account the appropriate valuation classes of the soil, which are distinguished in Polish law, as well as weather conditions for the growth of individual tree species. Due to the dynamic climate changes taking place all over the world, including in Poland, it is necessary to verify the growth data provided in the tables. This verification was performed by measuring the actual tree growth in the proposed test sites.
The influence of tree growth on building insolation is presented in Figure 2.
To assess the impact of tree growth on roof insolation, in the next stage of this study, a method was designed to estimate the actual roof insolation at any time in the future in the form of a tool called Sun Exposition based on Tree Growth Planner (SEPtree+). The proposed method is schematically presented in Figure 3. The main part of the method was realized by our own Python script. The tree growth algorithm and the algorithm to calculate the Sun’s position for a given moment were implemented in SEPtree+. The ALS-born or UVB-born point cloud of a roof vicinity as input data is needed, as well as tree tops identified from this cloud. As a result, a report of the sum of minutes of insolation for subsequent days of the selected year is received.

2.2. Equipment and Access to the Data

For the presented research, two test sites located in north-eastern Poland were selected. At both test sites, there are trees (mostly pines) located near the building on the roof, of which the installation of solar panels can be considered. The differences between the test sites include the available space on the roof surface, the number of panels placed on the roof, the arrangement of trees around the houses, the age of the trees, and the distance in which they are located. For site 1, the size of the roof with panels is 8 m × 14 m (about 112 m2), while for site 2, the size of the roof with panels is 6 m × 16 m (about 96 m2). The tree’s age surrounding the house on site 1 is 15 to 30 years old in 2023, while for site 2 is 20 to 80 years old in 2023.

2.2.1. ALS Point Cloud–e1 Epoch

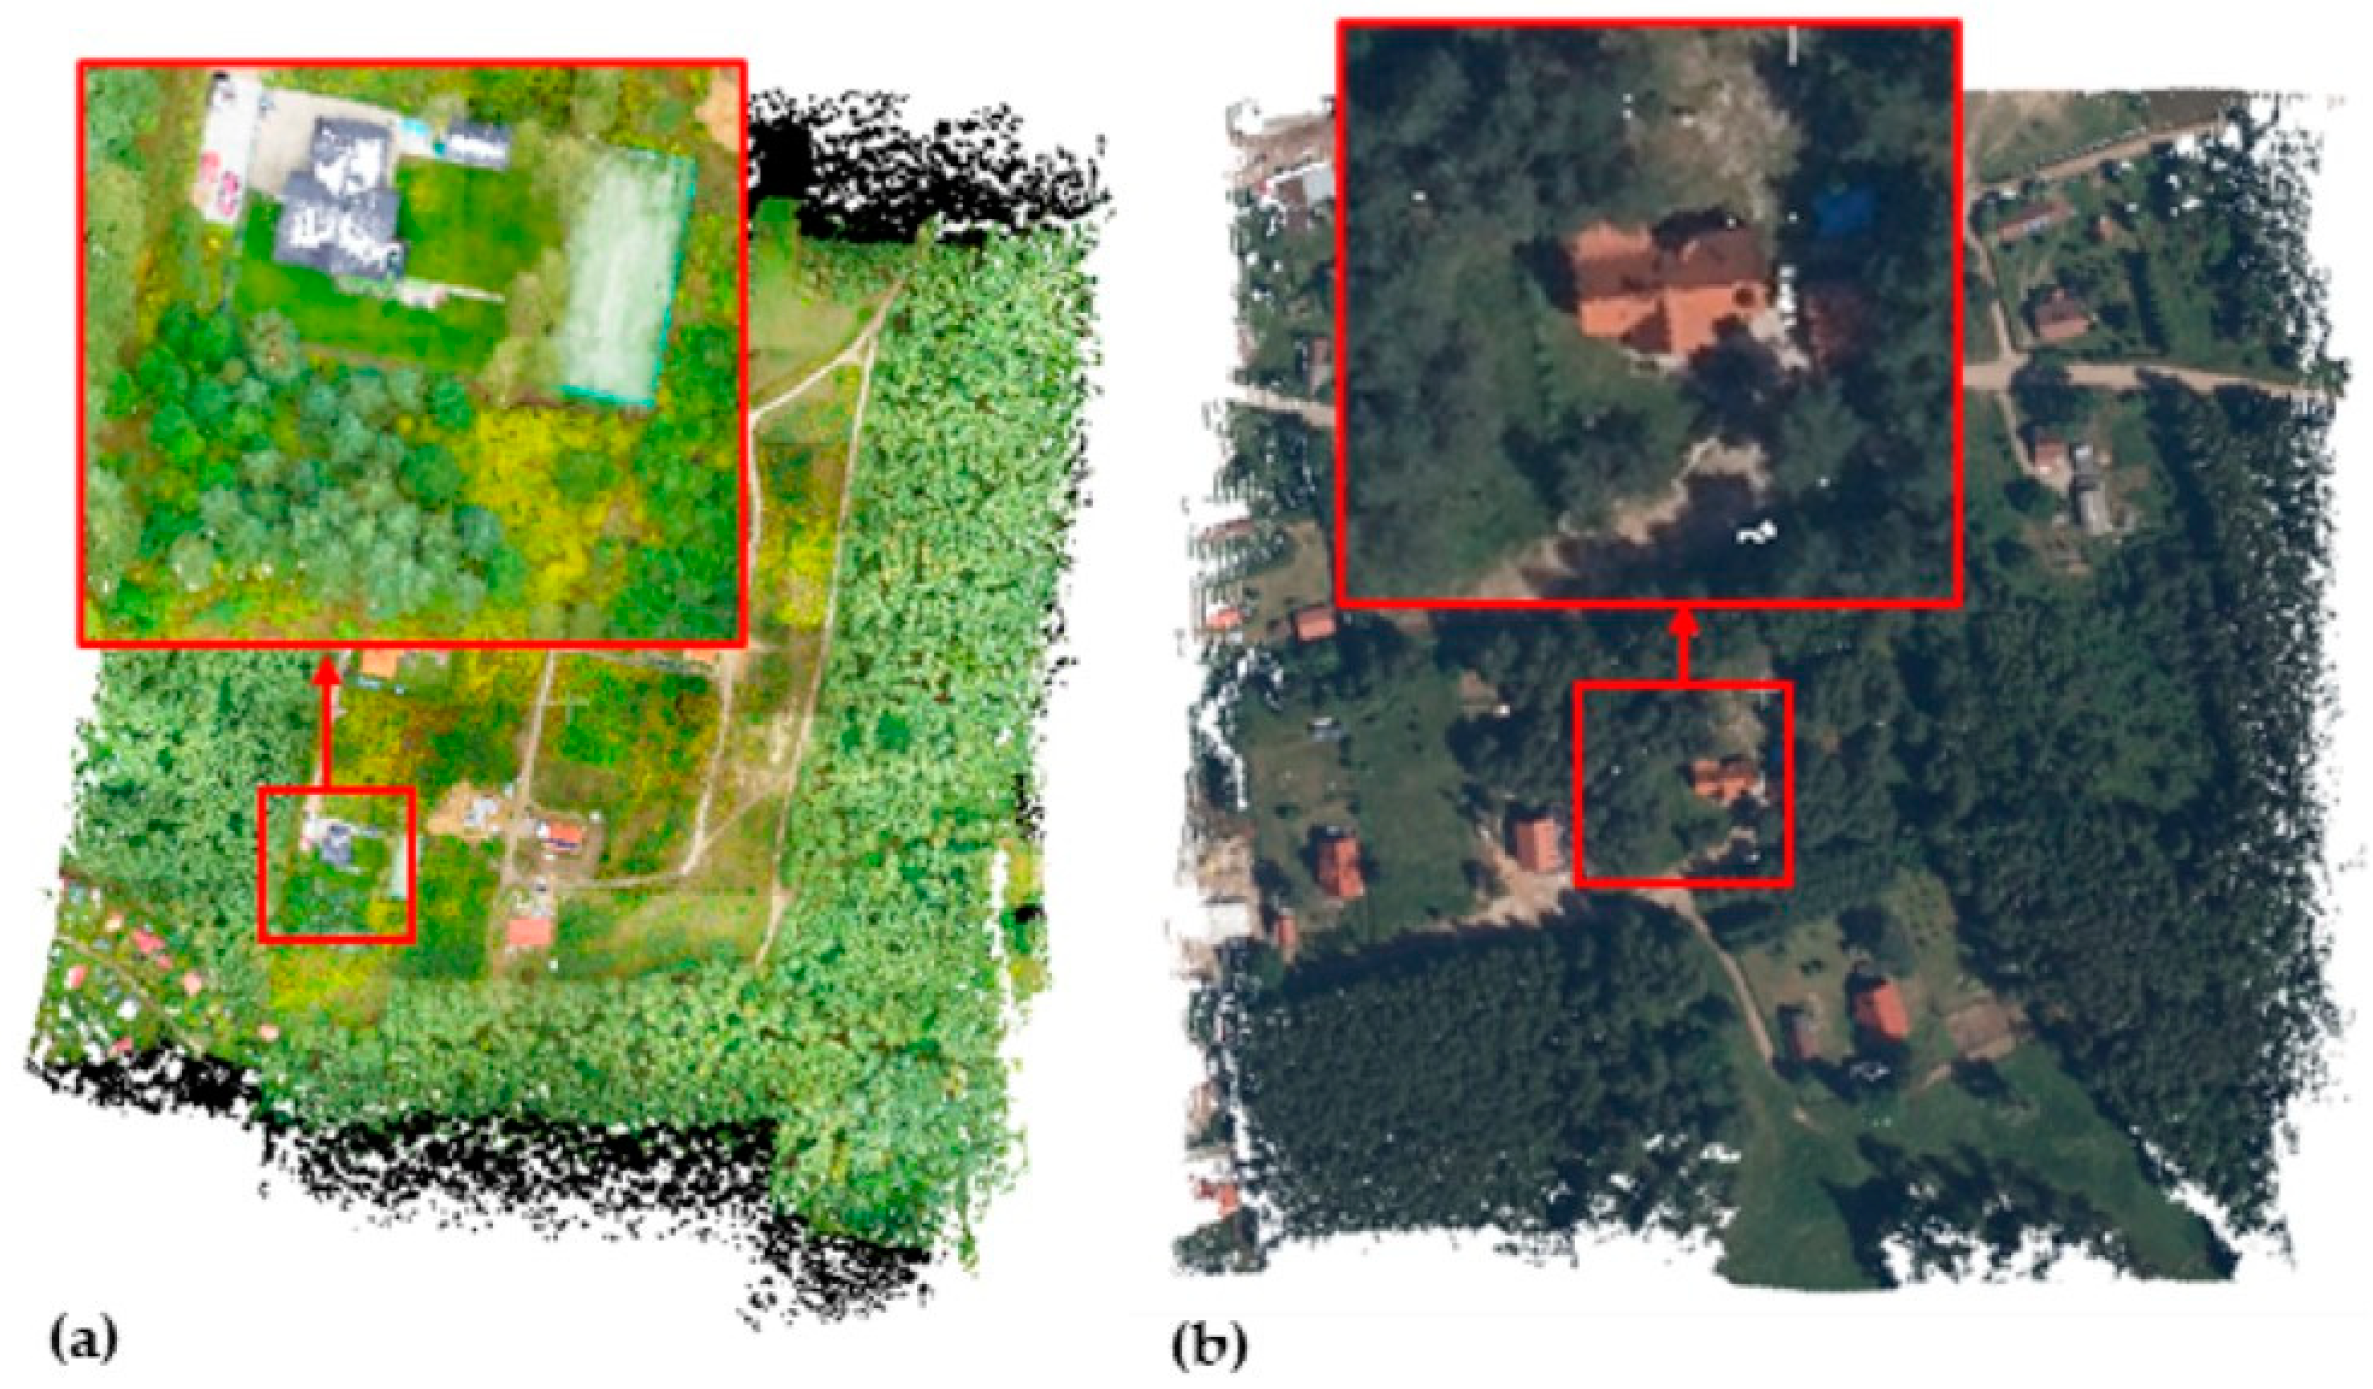
The ALS dataset was obtained for free from the website https://pzgik.geoportal.gov.pl/imap/ (date of data download: 3 March 2023). The data were collected as part of the ISOK Project (IT system for protecting the country against extraordinary threats). The datasets 4804_434128_N-34-89-B-b-1-3-2 (site 1 form 2013) and 65954_736942_N-34-90-A-a-2-2-4 (site 2 from 2017) with 4 p/m2 were obtained in .las format. The obtained ALS point clouds are presented in Figure 4.

2.2.2. UAV with LiDAR Sensors–e2 Epoch

The e2 measurement data were obtained using the DJI Matrice 300 RTK UAV with the attached GreenValley LiAir 50N laser scanner powered by the Velodyne VLP-16 sensor with an RGB camera, which is a Sony A5100.
The measurement was performed from a height of 70 m above ground level, taking into account the overlap of 30% at a speed of 7 m/s. In this way, a point cloud with a density of 700–800 points/m2 was obtained. The initial point cloud was prepared in the LiGeoreference 1.6.0 (GreenValley) software. The obtained ULS point clouds are presented in Figure 5.

3. Results

3.1. Data Processing

The Local Maximum Function (LMF) implemented in the Tree Density Calculator (TDC) QGIS 3.16 plug-in was used to automatically detect individual tree tops from point clouds [29]. For every position of the window, the TDC checks whether the central pixel is the darkest one in the window. If so, the pixel is marked as a local maximum.
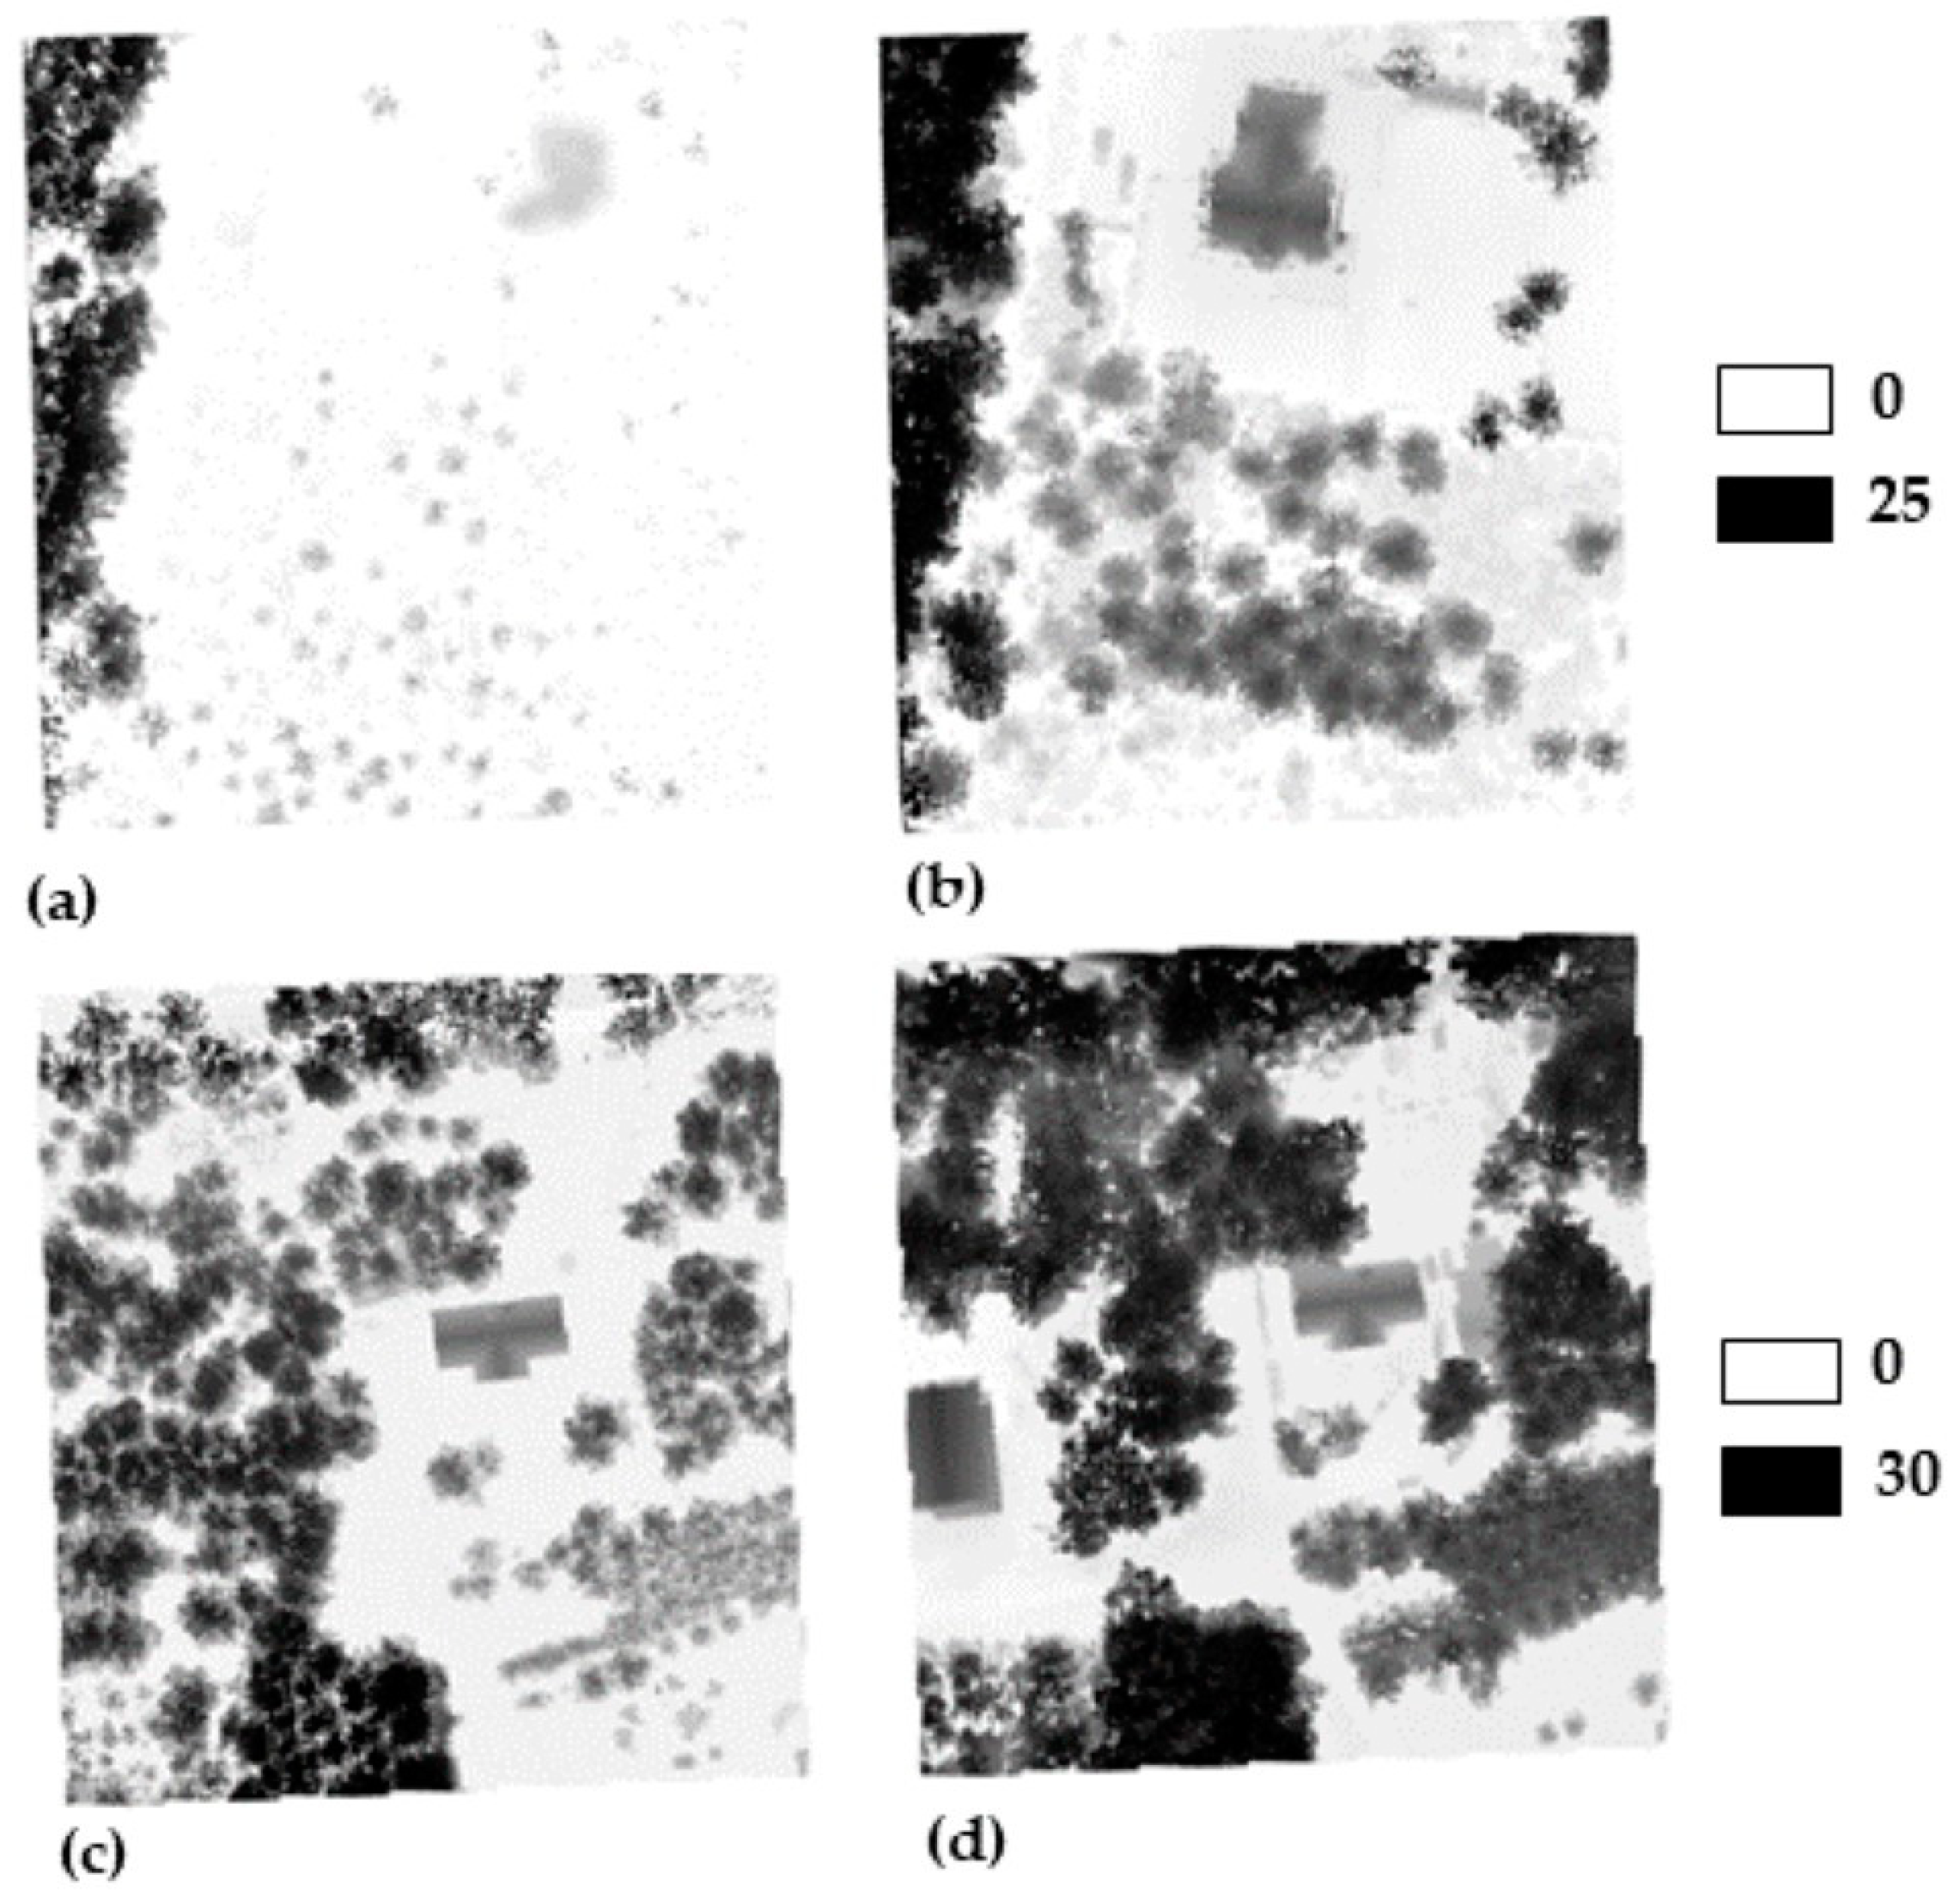
TDC tree tops are based on brightness images, using the local maximum of a sliding window. As TDC requires a raster image as input data, the TIN model was generated from both point clouds (step 1). The Triangular Irregular Network (TIN) interpolation tool from the processing package implemented in QGIS 3.16 was used to generate the TIN models. Then, in step 2, ready-made DTMs (grid 1 m) representing site 1 and site 2 were downloaded from the website www.geoportal.gov.pl (accessed 3 March 2023). The next step, 3, is to create a CHM for each epoch as a difference raster by subtracting the DTM from the DSM. This resulted in four CHM as TIN models, one model for each epoch at each site (Figure 6).
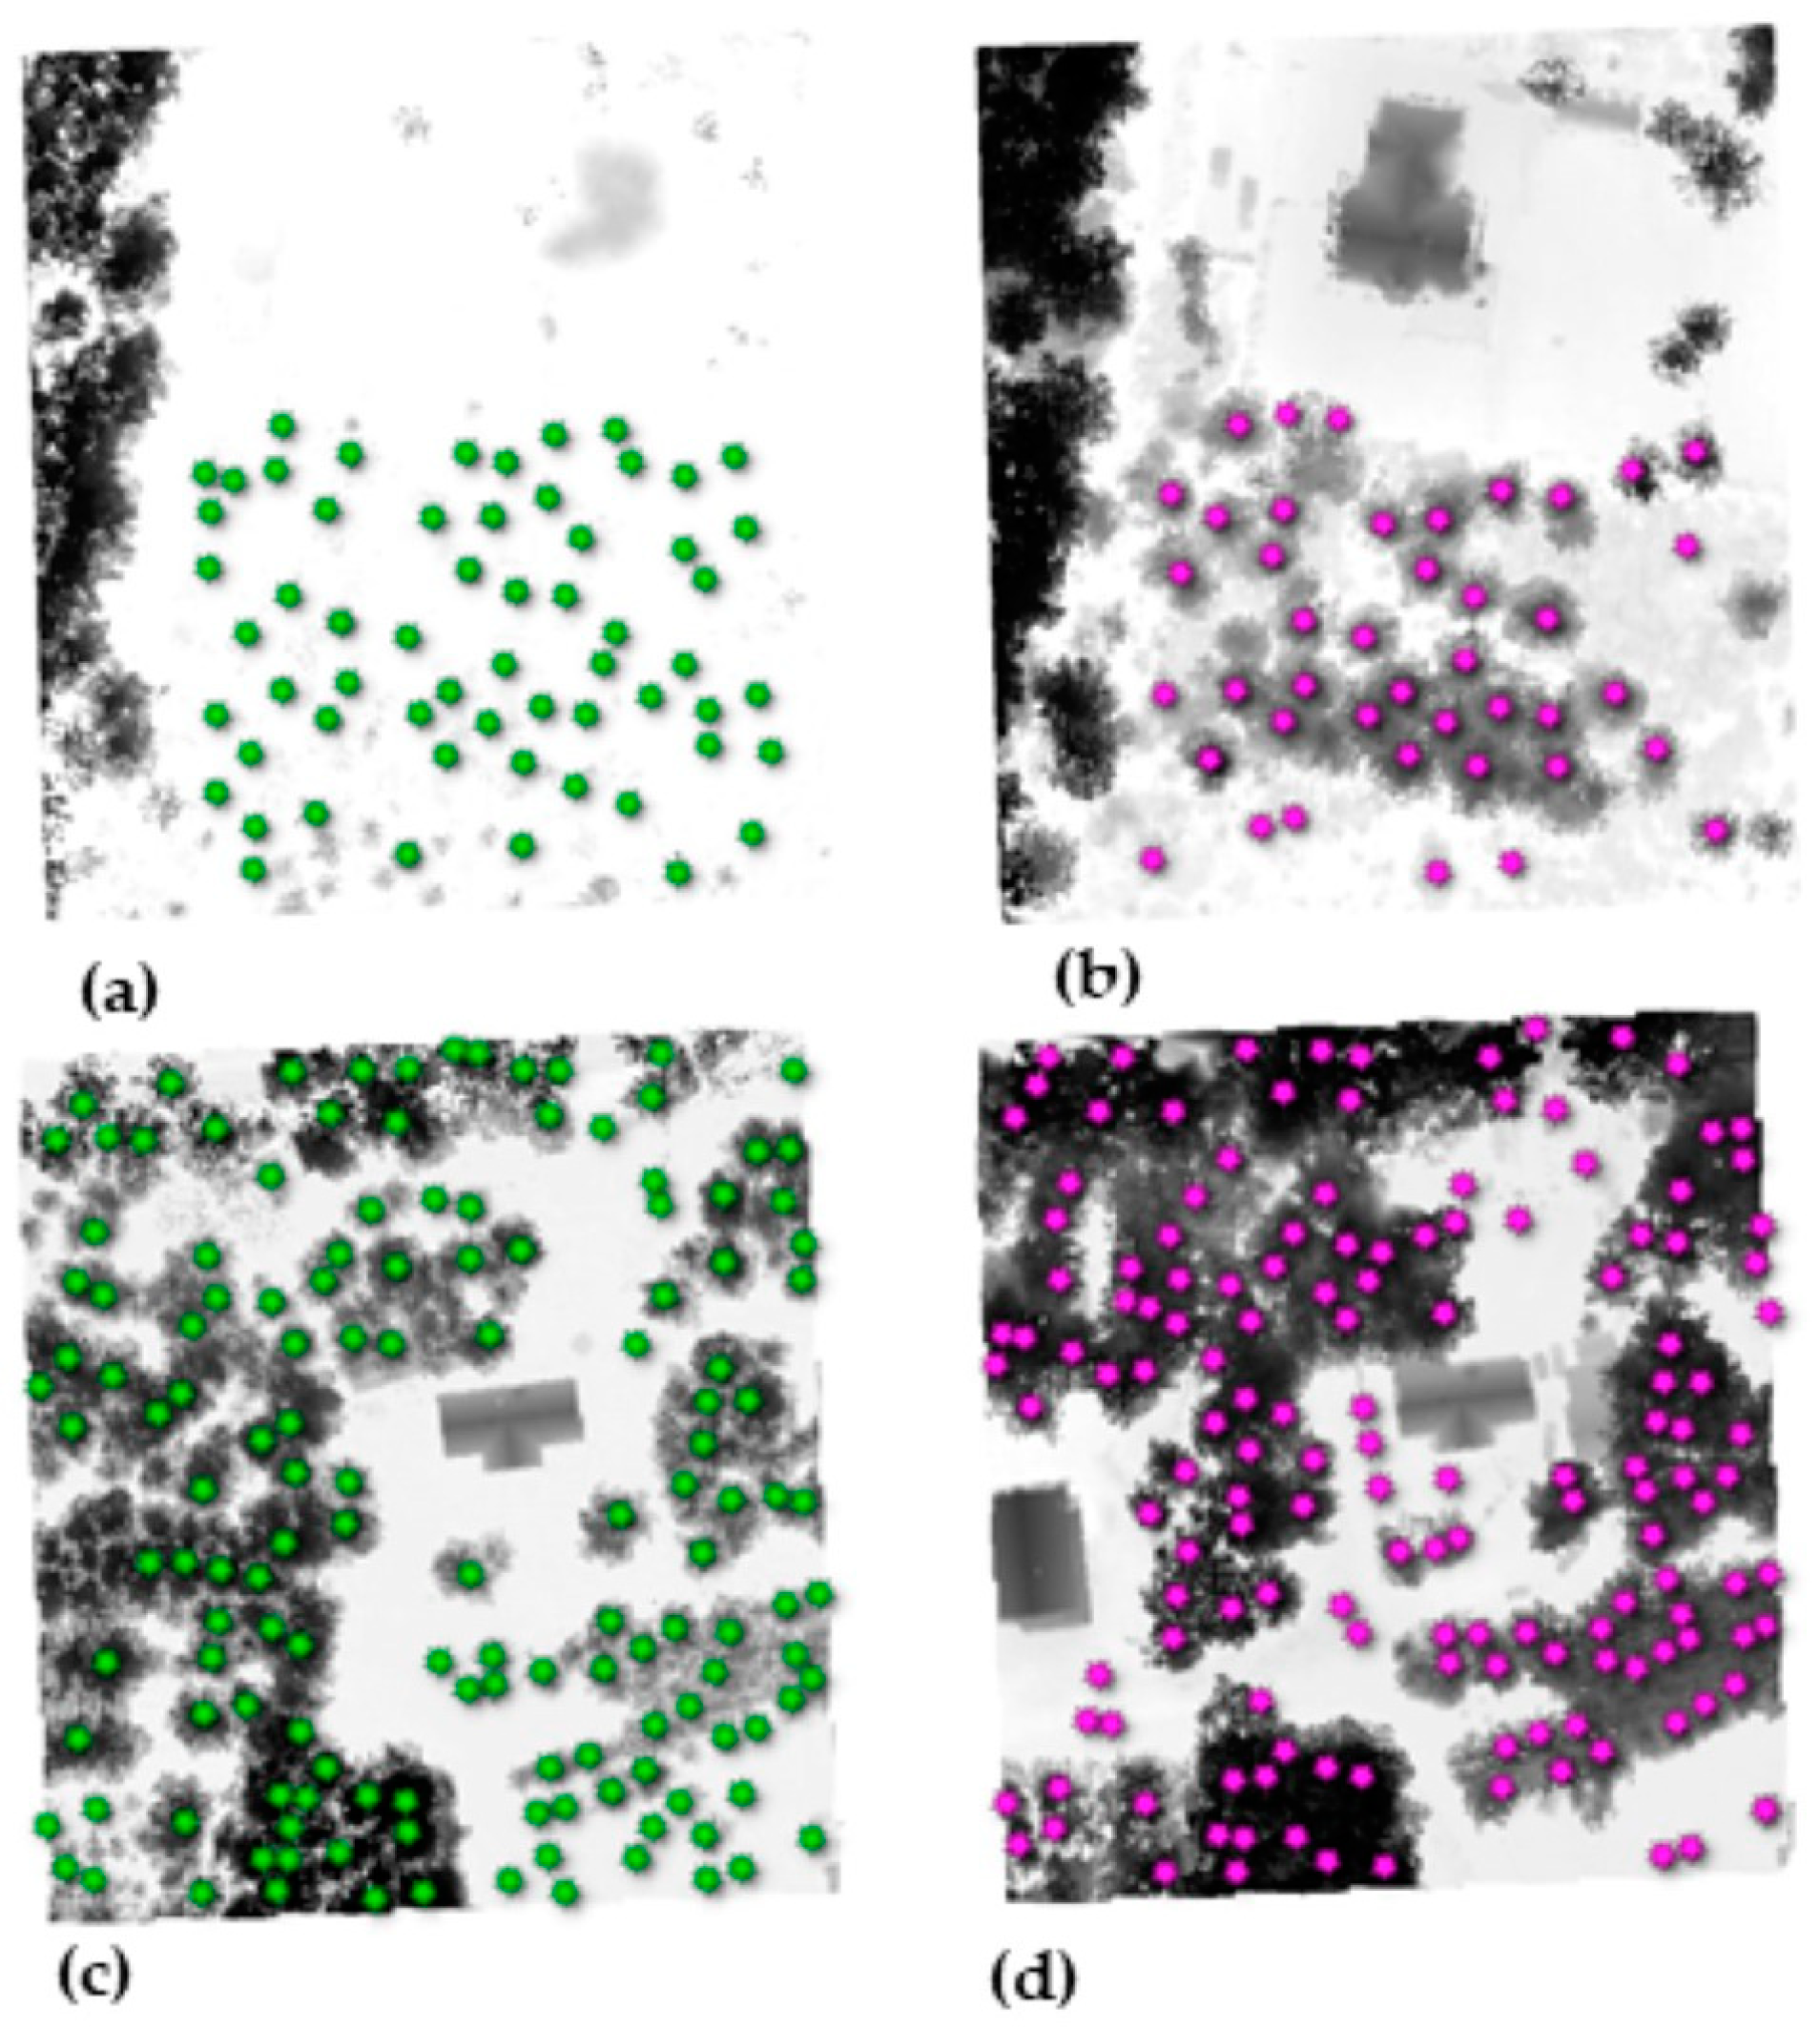
Subsequently, in step 4, the TDC plug-in was used to detect local maxima and identify individual tree tops. In the case under consideration, it was necessary to manually analyze the result to reject points that were obviously not tree tops (e.g., corners of the building’s roof). In Figure 7, the obtained results are presented.
For the analysis of tree growth between epochs e1 and e2, only those points whose 1 m buffers had common parts in subsequent epochs were treated as tree tops and used for further analysis. There were 41 and 95 such points at site 1 and site 2, respectively. To develop the curtain model in the n-th epoch, all points detected as vertices in the e2 epoch were used. In the next step 5, the growth of each tree was calculated by comparing the heights of tree tops between two epochs.
The method used in steps 3 to 5 is based on the automatic detection of trees from point clouds and should be validated, so in step 6 of the presented methodology, tree identification verification was planned. For this purpose, the coordinates of 17 tree trunks for site 1 were determined using the tachymetric method. The measured trees are presented in Figure 8.
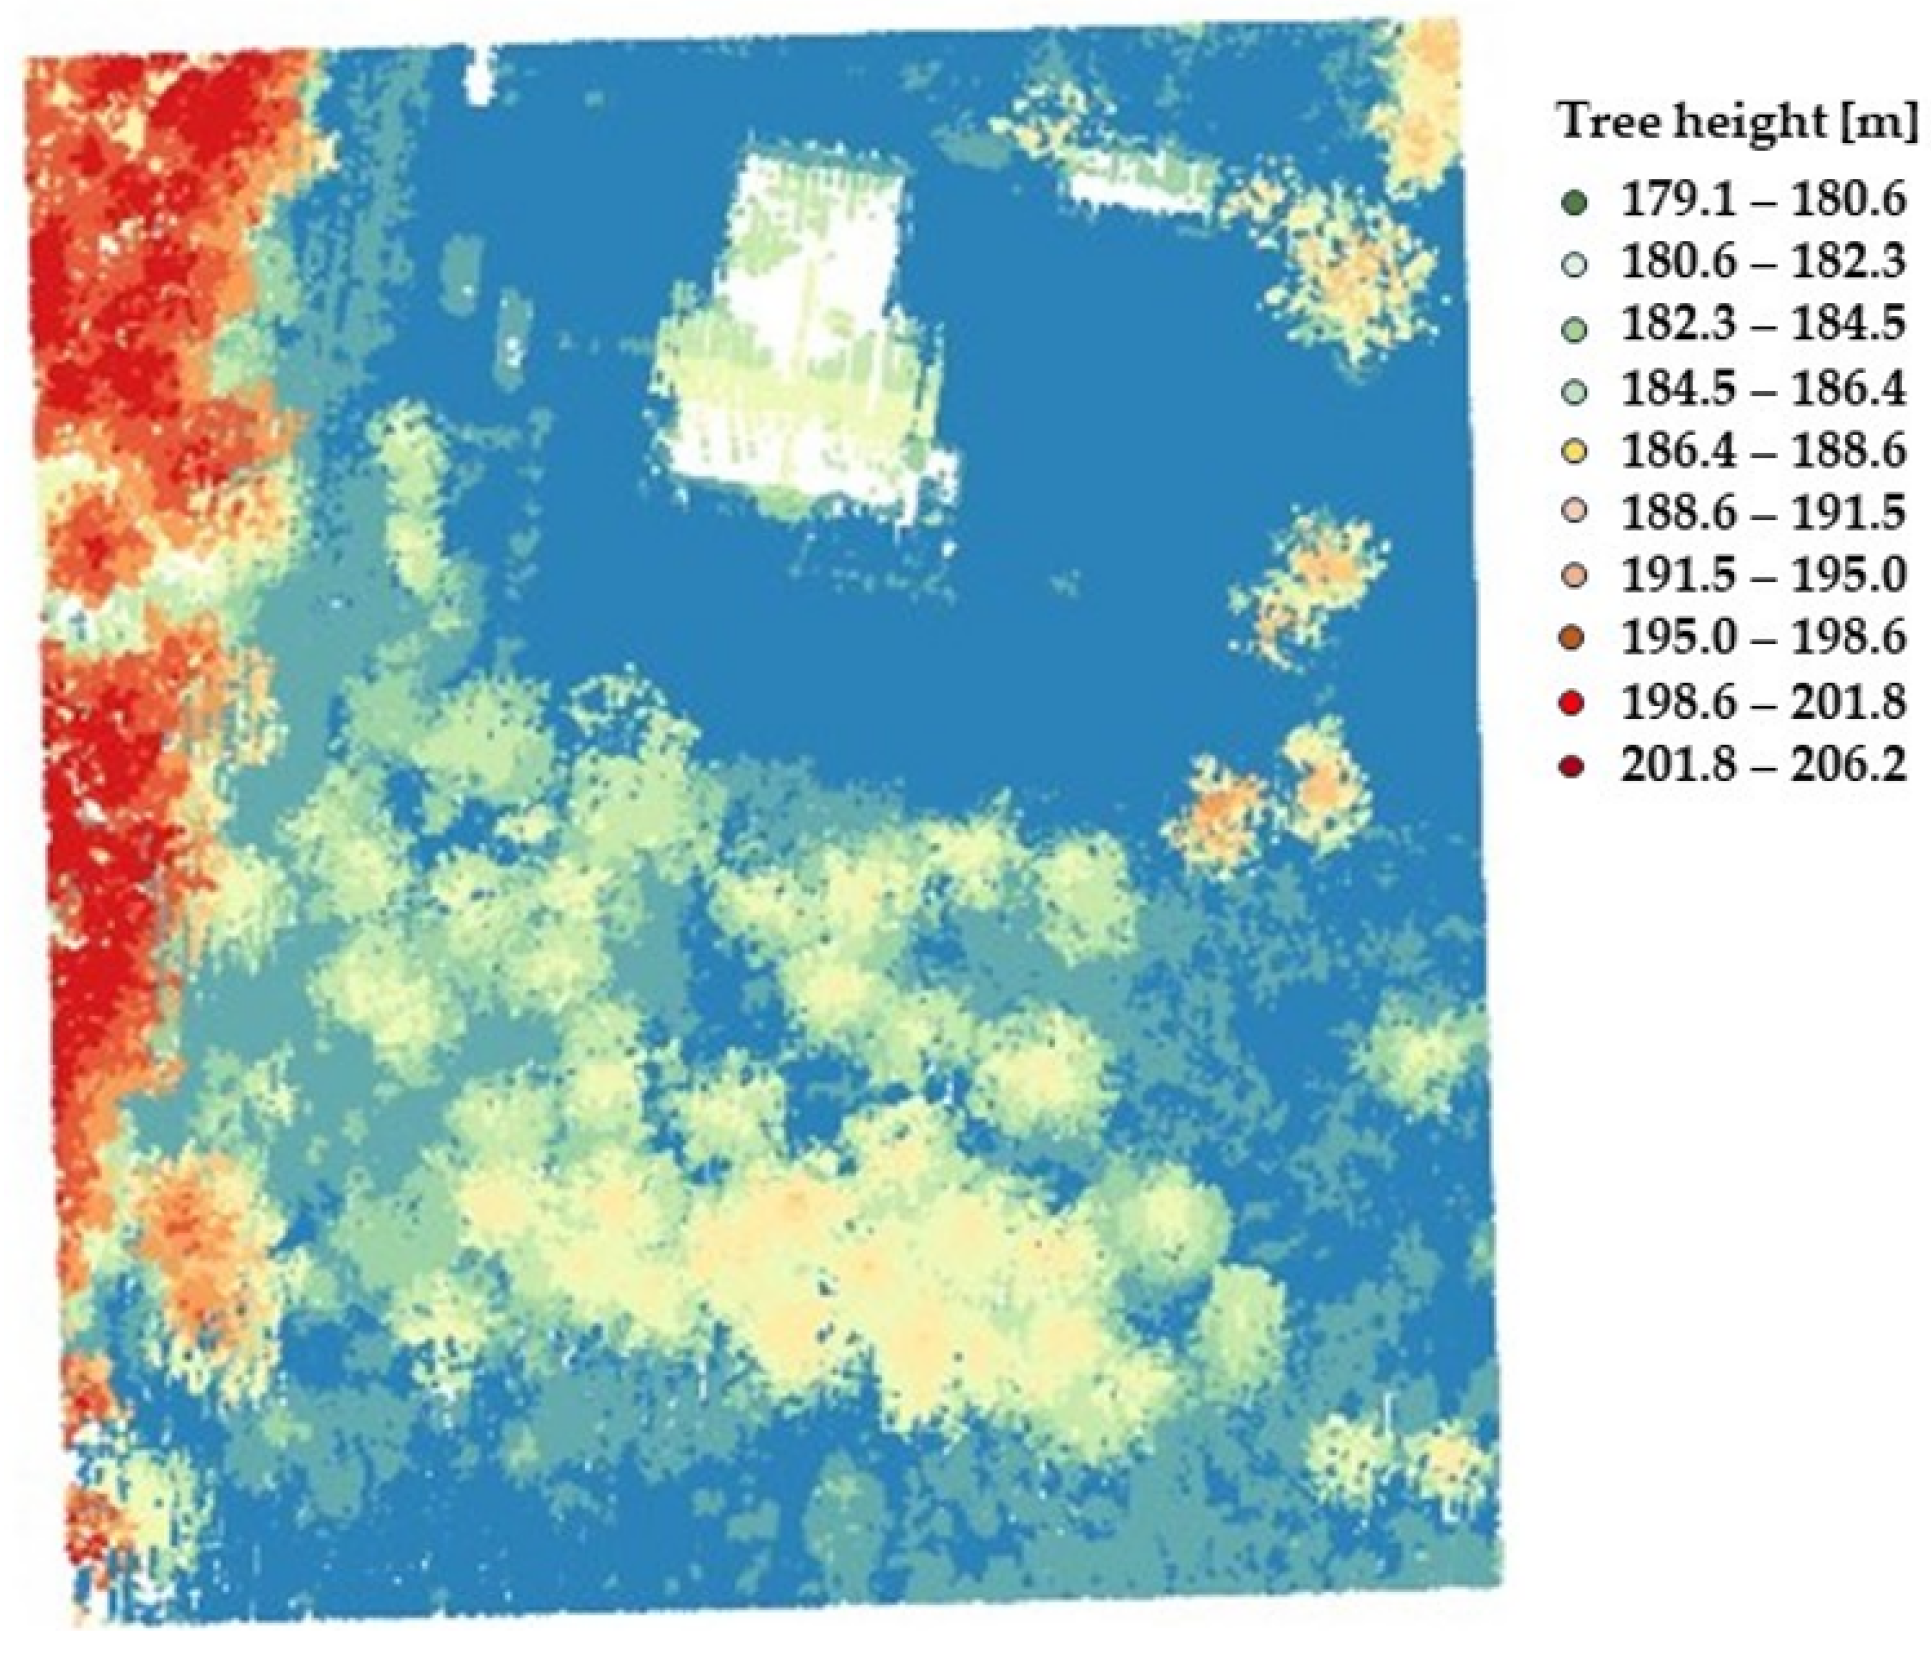
Then, geospatial analysis was used to determine the increments of these 17 trees. The points clouds from the e1 and e2 epochs were loaded into the QGIS 3.16 project as a point vector layer. Point heights were saved as object attributes (Figure 9).
A 1 m diameter buffer was designated around each tree trunk. With the zonal statistics (ZS) QGIS 3.16 tool, the results of a thematic classification can be analyzed, and it is a useful tool that allows for determining arbitrary statistics from raster pixels, for example, after subtracting the raster. Using this tool, a point with the maximum height was determined in each buffer, and the height of this point was taken as the height of the tree. After subtracting the e1 height from the e2 height, tree growth was obtained. The growth of the tested trees is presented in Figure 10.
The method proposed in step 6 for determining the height of trees from a point cloud if the coordinates of their trunks are available is automatic and efficient. However, it is an indirect method, and its results were additionally verified via the manual measurement of tree height differences between epochs e1 and e2. This measurement was made directly on point clouds using point cloud measurement (PCM) available in CloudCompare v2.12 software. Two trees were selected for the study. Figure 11a shows a tree that grew in a loose density site, and Figure 11b shows a tree that grew in a tight density. Therefore, the appearance of the clouds of points representing these trees differs. The results are presented in Figure 11.
The results of determining tree growth between epochs e1 and e2 obtained from three methods are summarized in Table 1, where LMF indicates tree growth calculation based on tree identification performed using LMF, ZS indicates tree growth calculation based on known trunks coordinates and Zonal Statistics in QGIS 3.16 and indicates direct trees growth measurement on point clouds in CloudCompare v2.12 software.
As shown in Table 1, of the trees whose locations were measured via tachymetry, only two trees (ID 1 and ID 2) were not detected by LMF. These are trees that were the lowest in the entire test set in e1 and were not detected in this epoch. The tree growth values obtained using the ZS method differed from direct measurements on clouds (PCM) by no more than a single centimeter (except for ID 6, for which this value was 0.38 m). Therefore, it can be concluded that in the case of access to trunk coordinates, the use of the ZS method is very accurate and, at the same time, less time-consuming. However, the values of tree growth obtained using the LMF method differed from direct measurements on clouds (PCM) by up to 20 cm. Taking into account the specific nature of the tree object and the purpose of the study, the method based on detecting tree tops using LMF should be considered appropriate.
To use the developed tree growth models, it is necessary to know their current age and height. The growth of trees in a given unit of time, e.g., between the e1 and e2 measurement epochs, allows us to determine the growth rate per year. However, it should be remembered that the growth rate of a tree is different for young trees several-decades-old trees. In the case of forests managed by forest districts, detailed documentation like a Forest Management Plan (FMP) is kept, while in the case of private forests, this is not the case. Therefore, if the age of the trees is not known, we can calculate this parameter by transforming the Bruchwald formula that takes into account tree height information from two measurement epochs.
H = B · A
A t a r g e t   e p o c h = w 22.222222 + 0.777778 w 2
B = h e 2 A e 2
where H—tree height, B—height increase rate, A—a function of height increase with age, h—the tree’s height in the epoch, w—target age, and the parameters 22.222222 and 0.777778 are constants.
It is also possible to determine the approximate age by knowing the diameter of the tree at the breast height of the tree, but it is more time-consuming. For research purposes, the authors of the manuscript checked both methods of determining the age of trees based on the transformed Bruchwald [25] formula and on the basis of measured breast heights of selected trees, and comparable values were obtained for both methods.
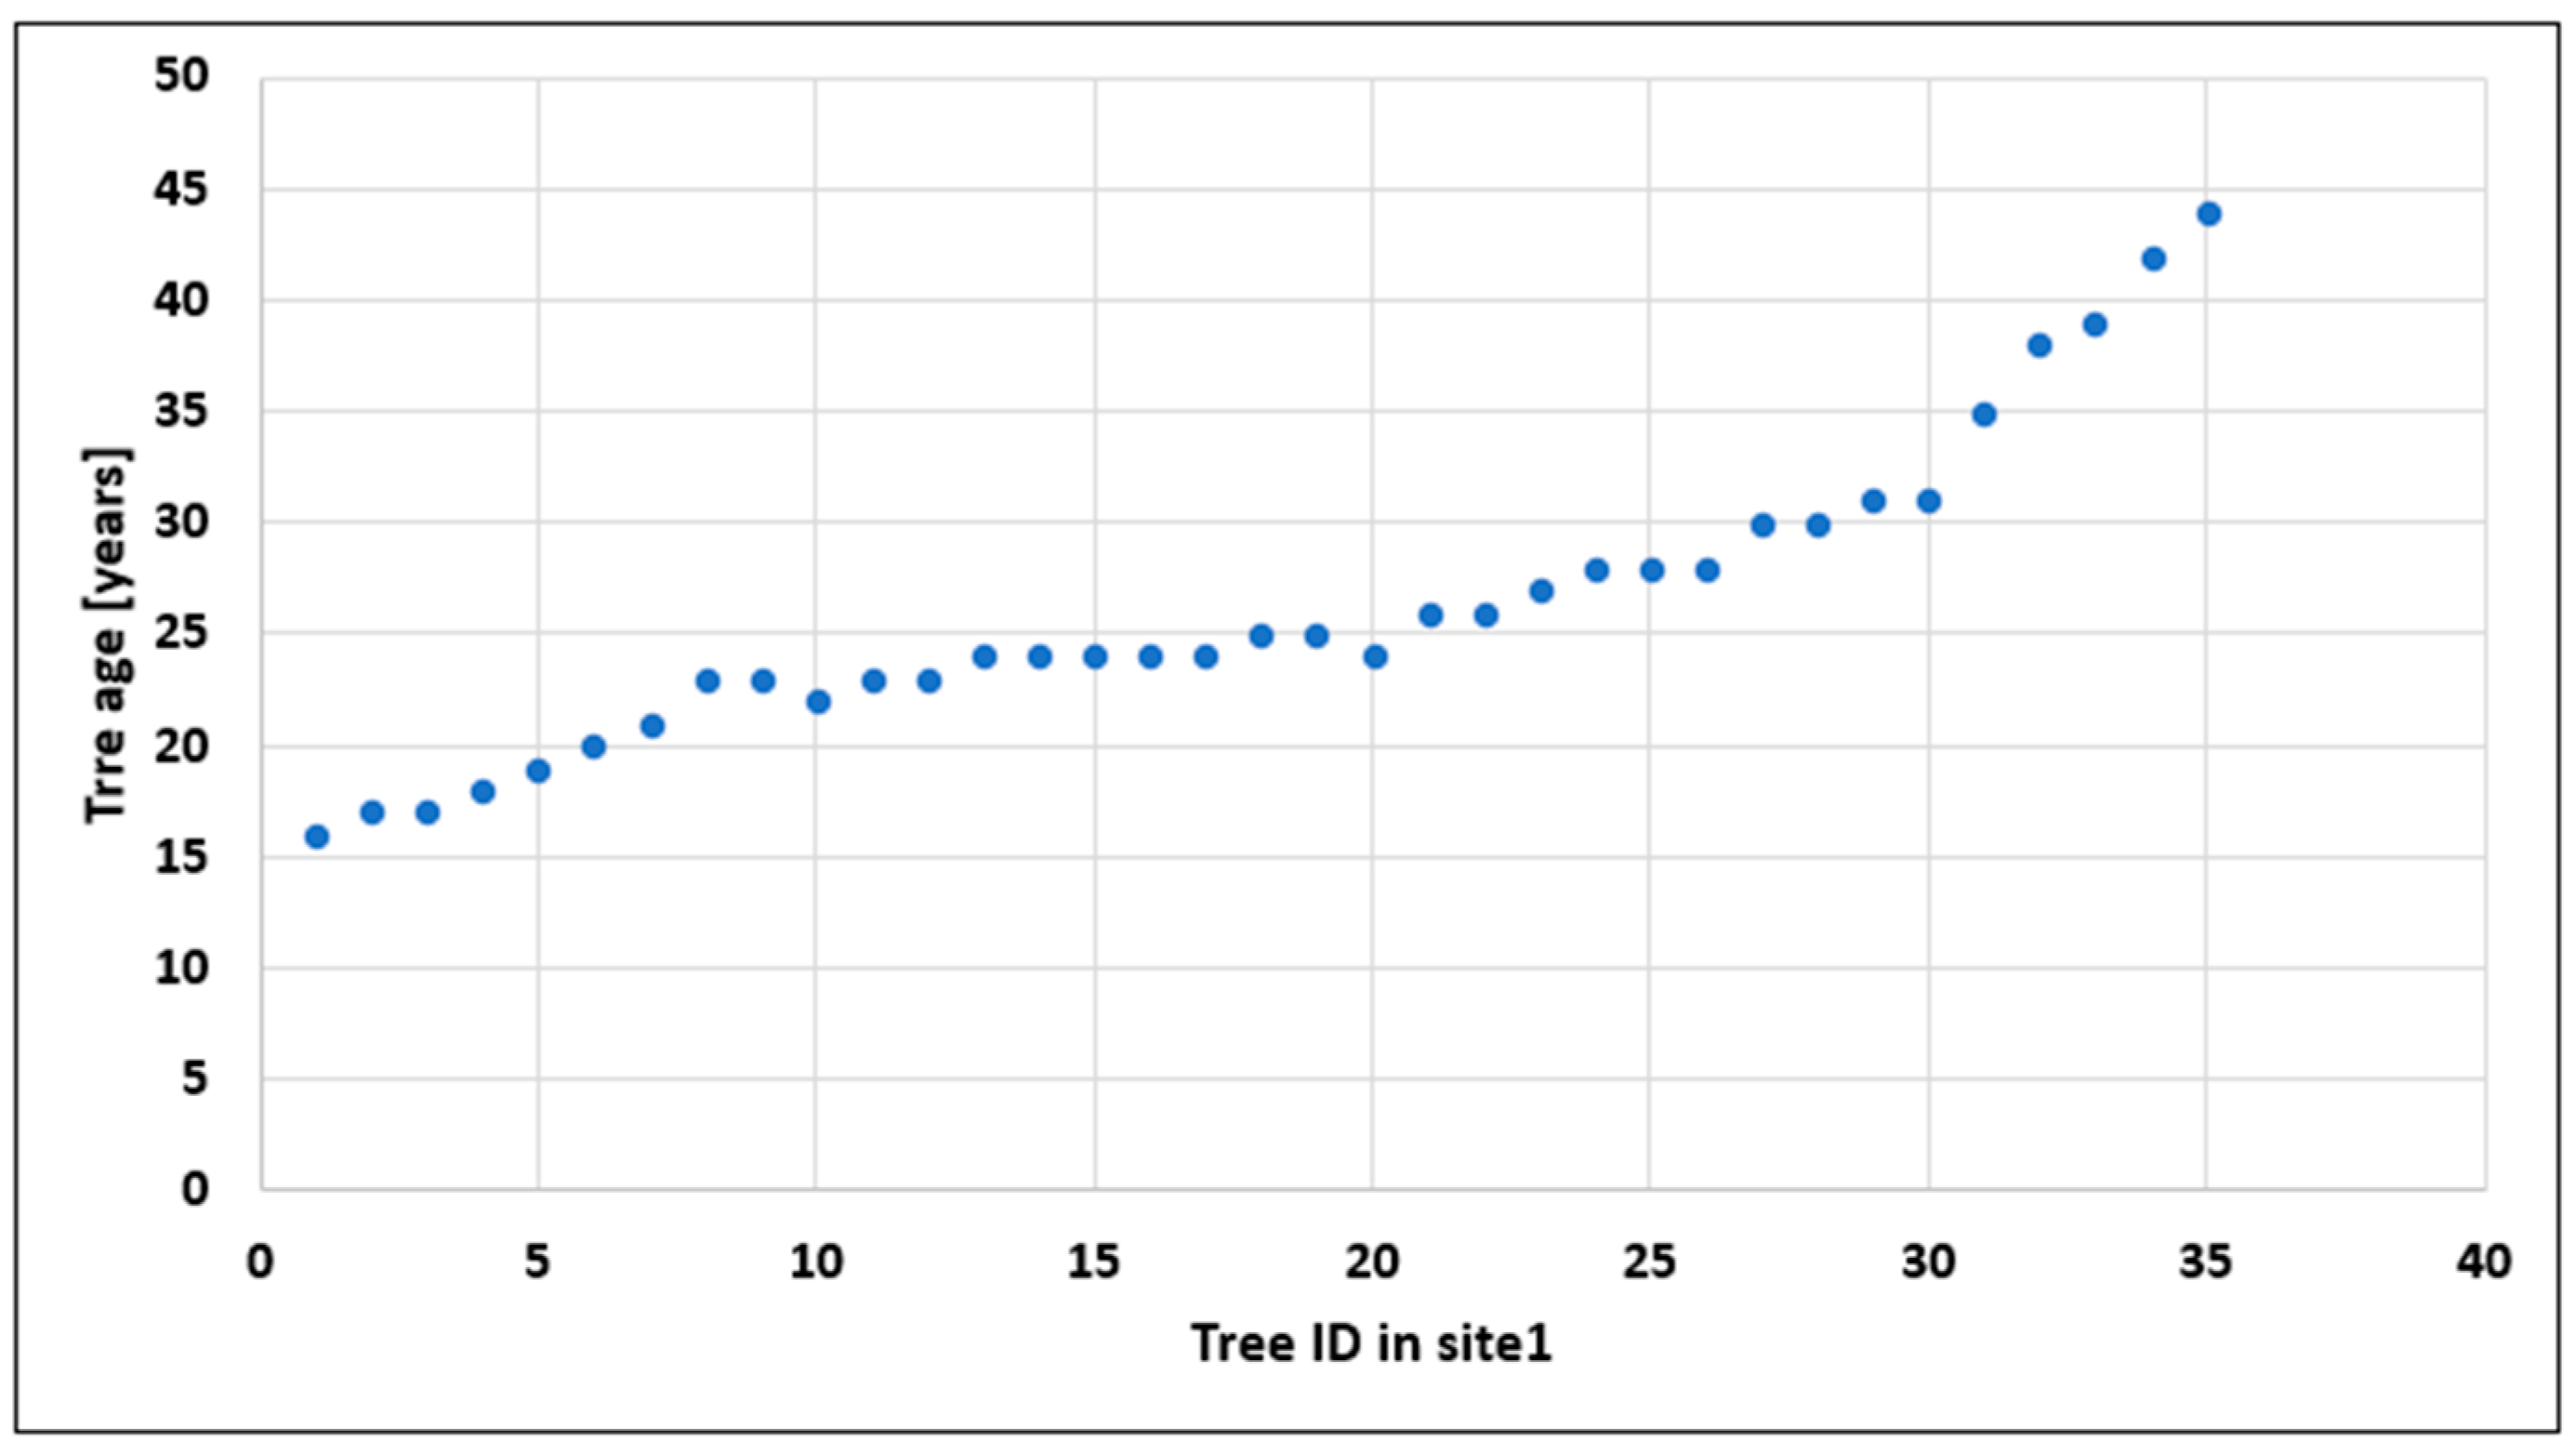
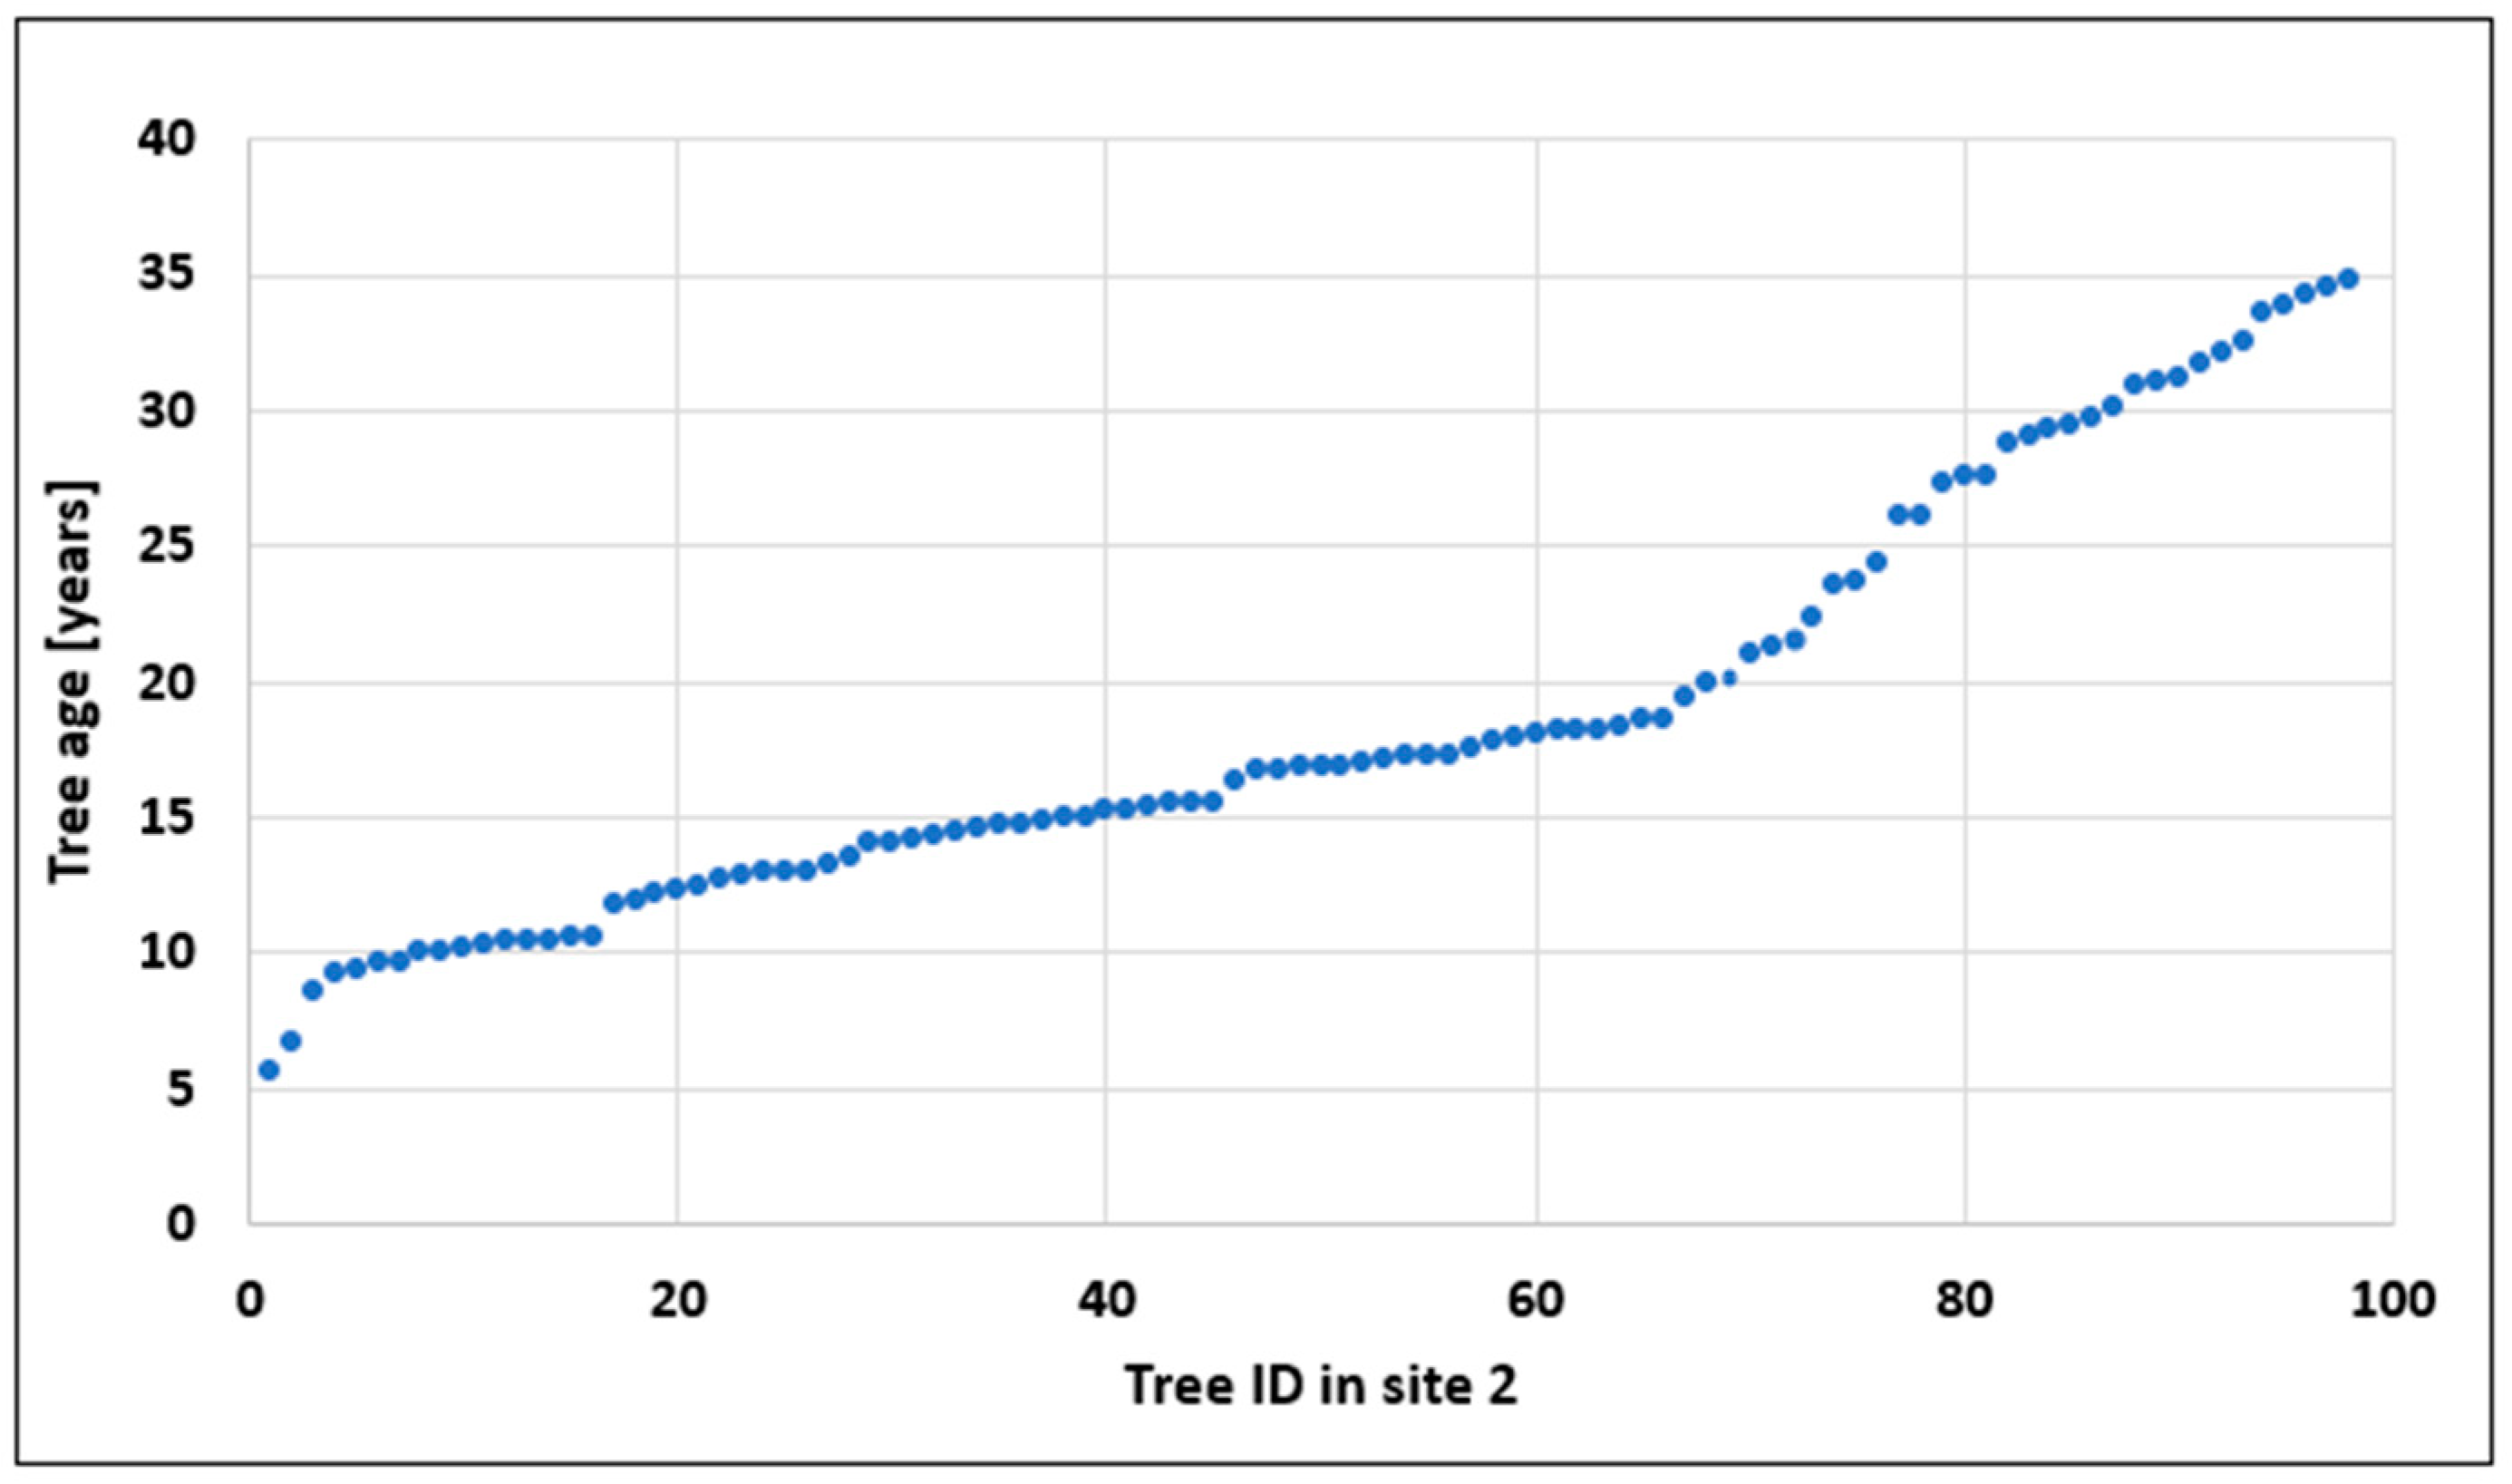
Therefore, based on the height of the trees determined vis measurement data obtained in e1 using ALS and in e2 using ULS, the age and current height of the trees were determined. Figure 12 and Figure 13 depict the age of the trees at site 1 and site 2, respectively.
Knowing the tree species and height growth model, one can estimate the average growth of the trees in future years. The conducted field interview allowed us to determine that the trees growing around the examined buildings were Scots Pines (Pinus sylvestris).
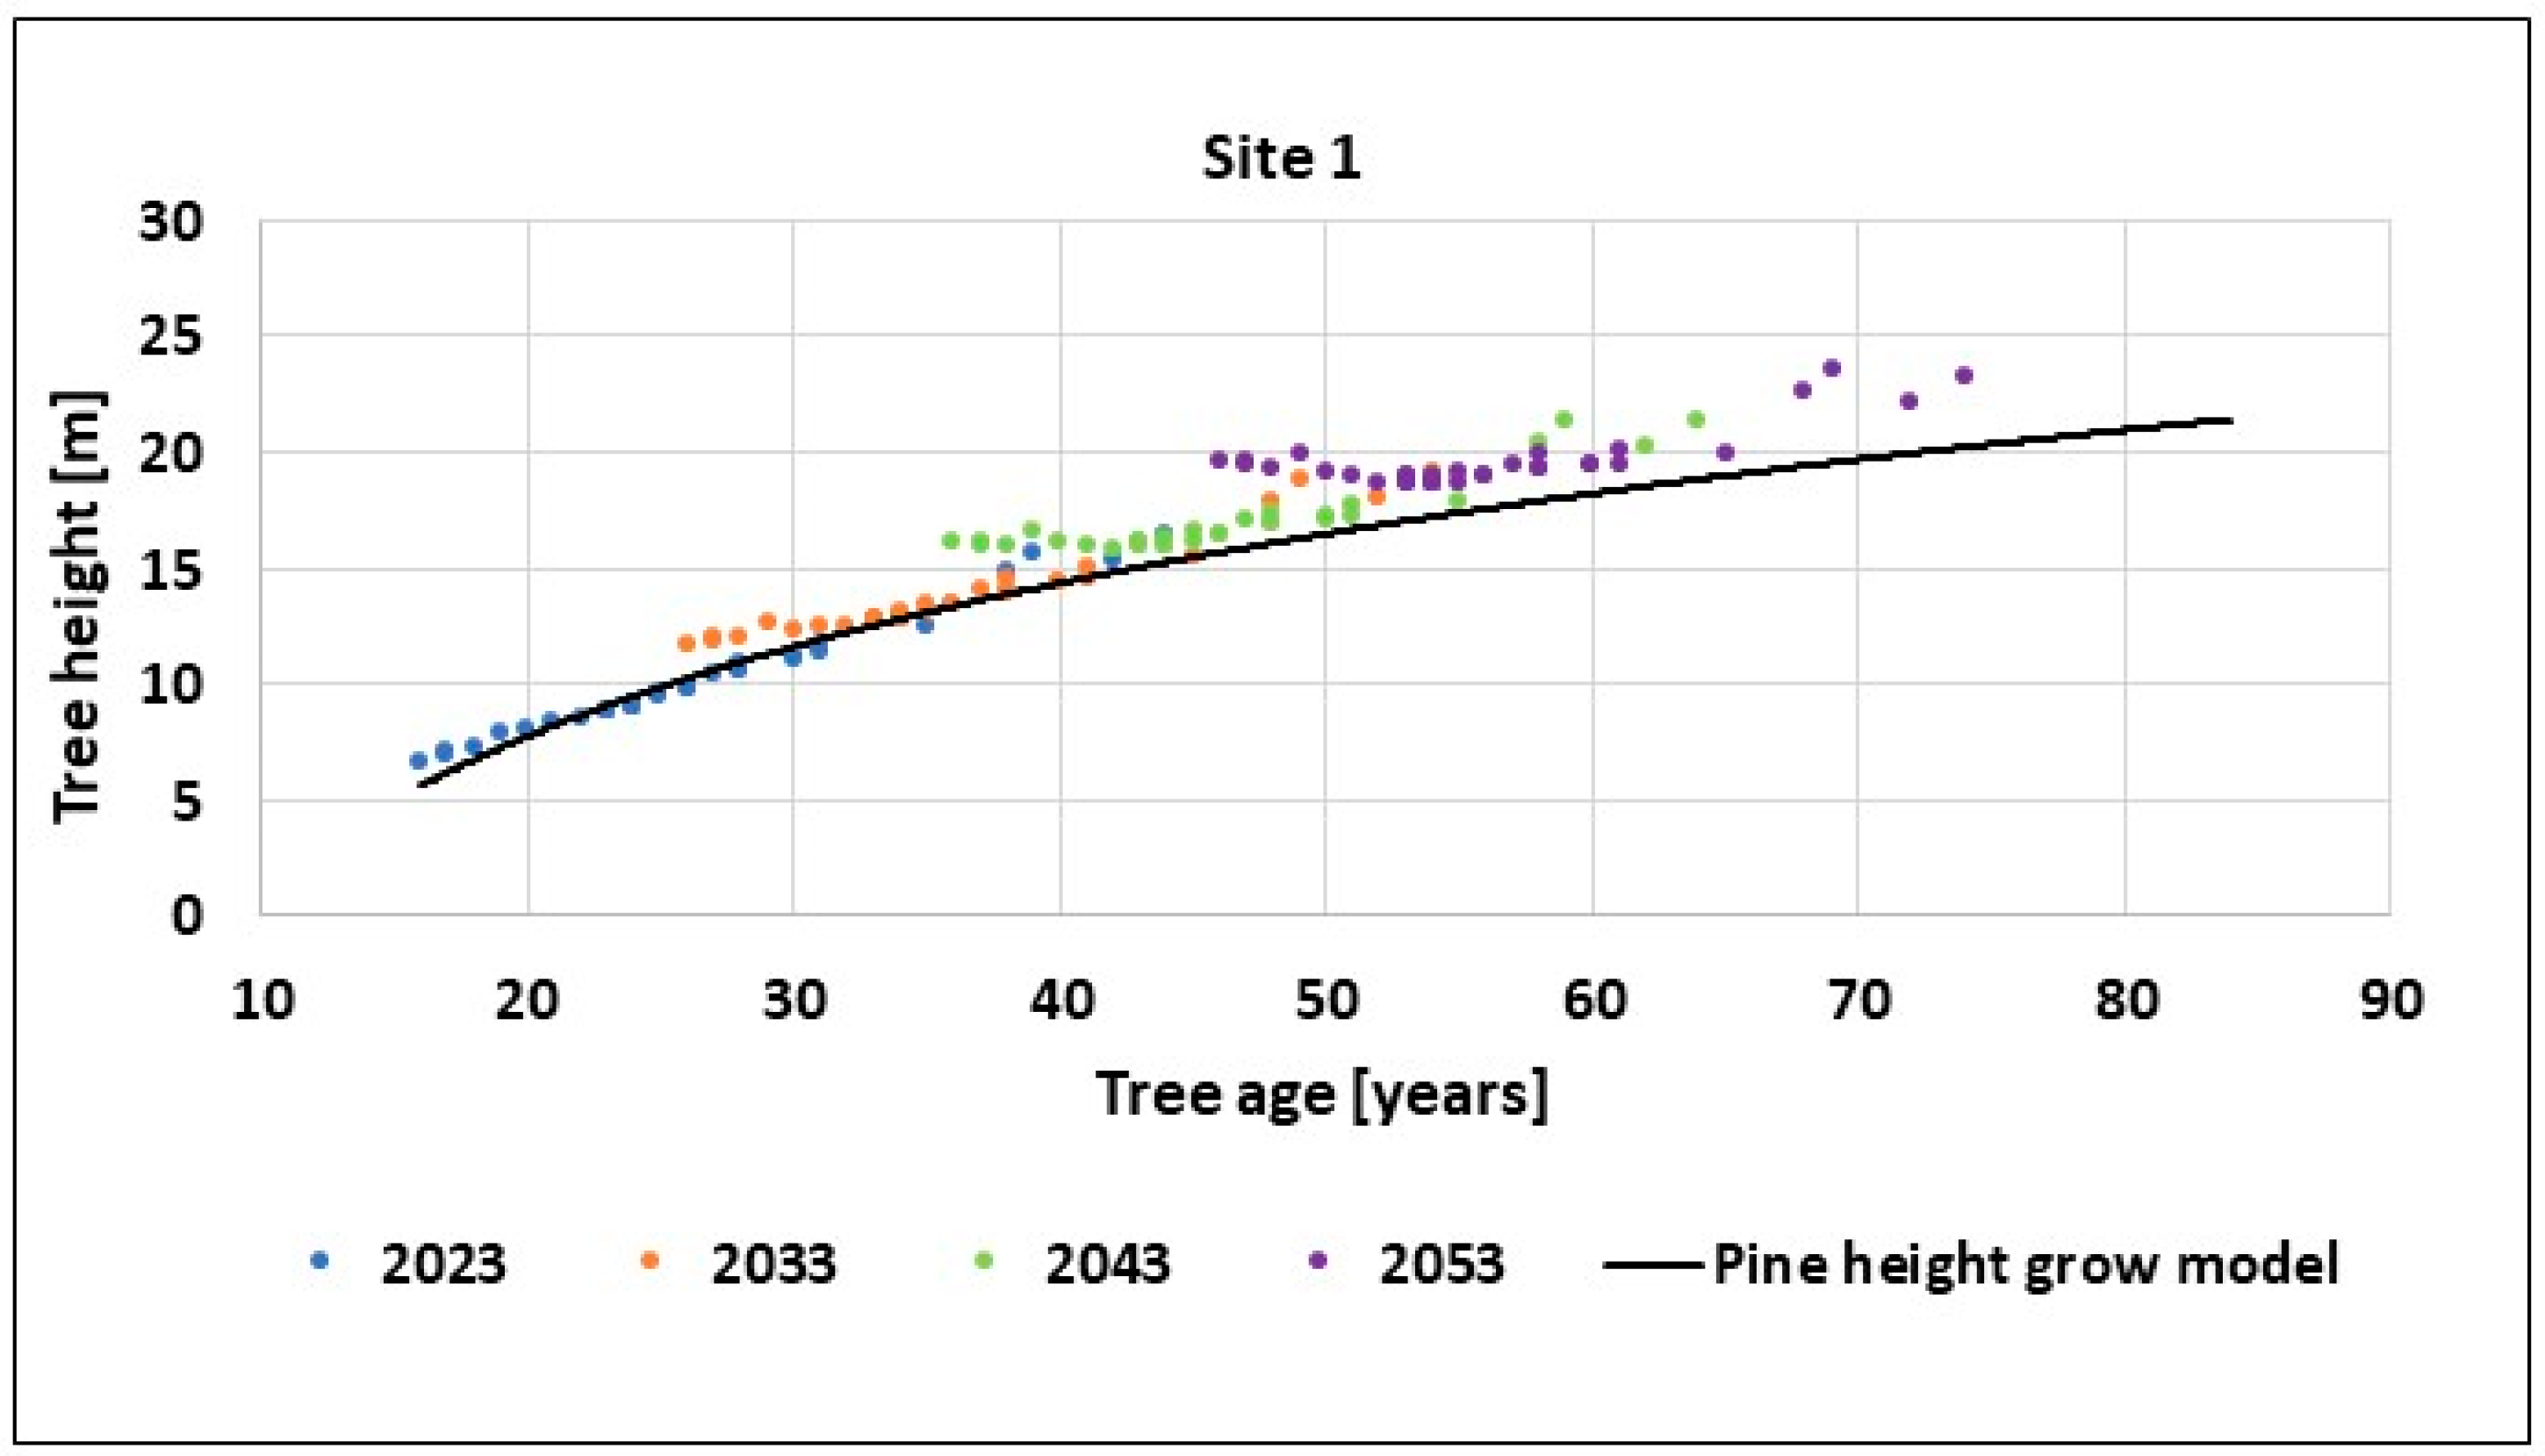
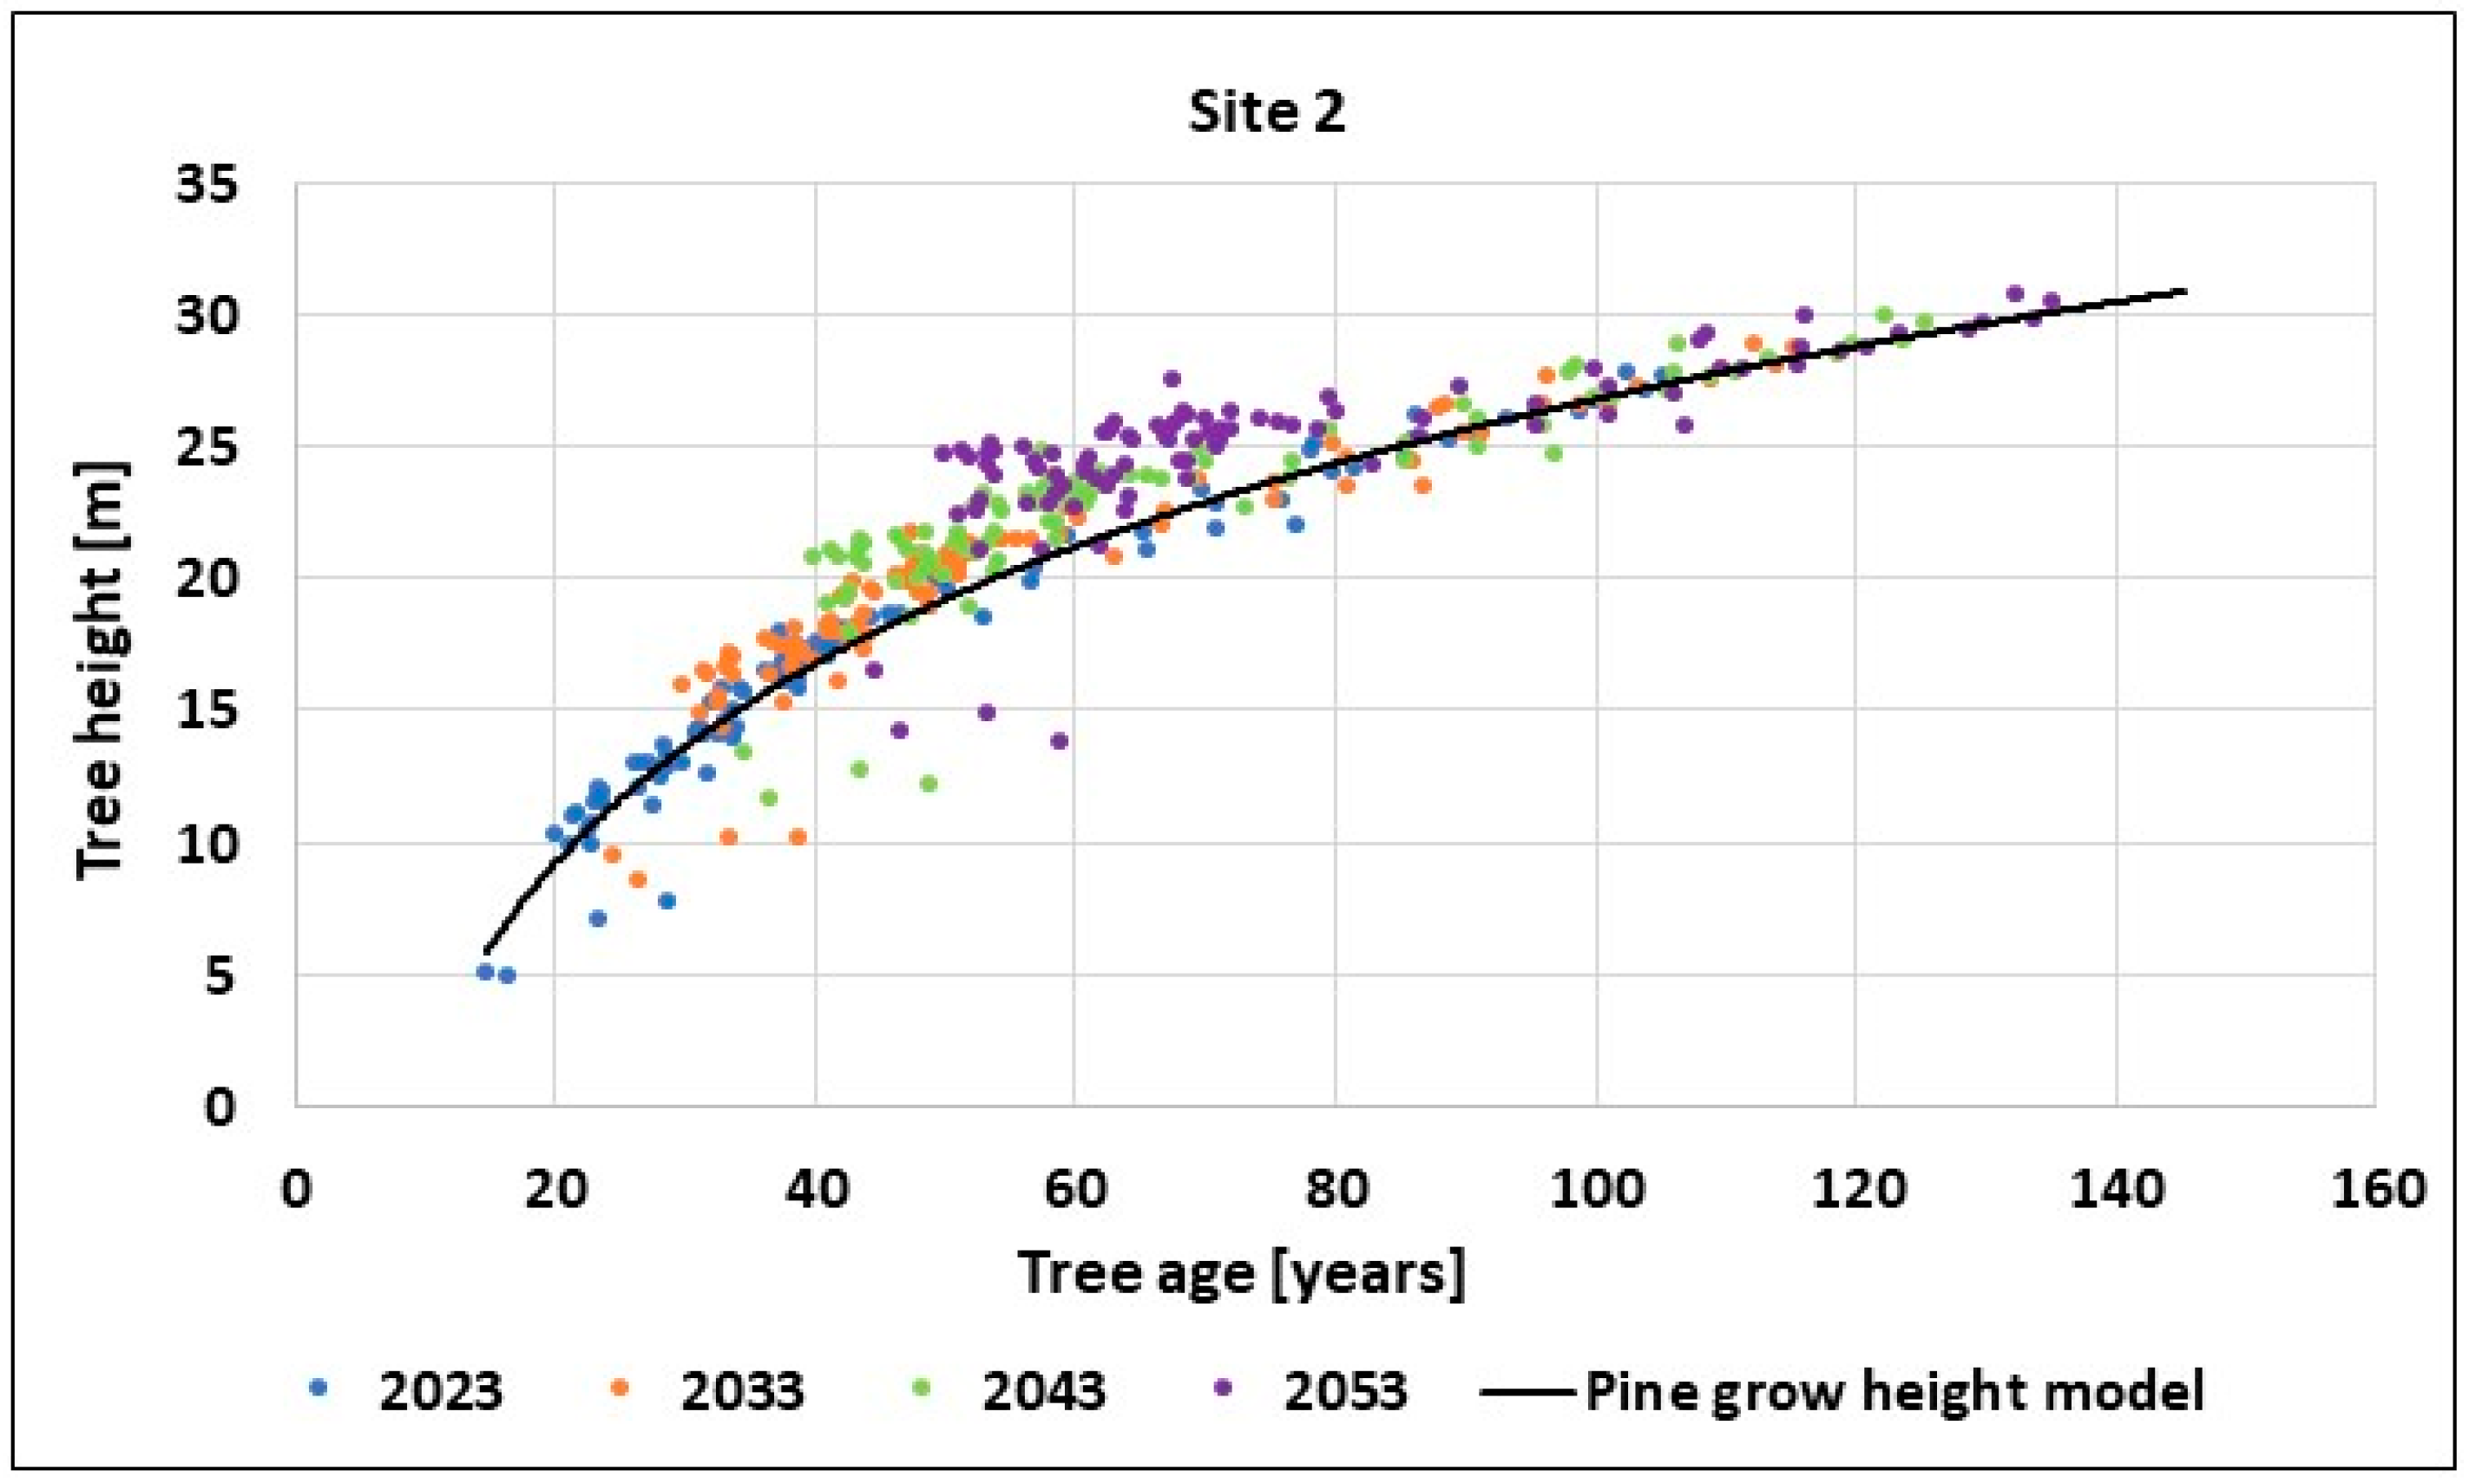
Figure 14 and Figure 15 show the predicted growth of trees during 10, 20, and 30 years in relation to the current age of the tree. To prepare the charts, a tree growth model based on tables [24,25] and the age of trees presented in Figure 8 and Figure 9 were used.

3.2. Total Insolation Calculation SEPtree+

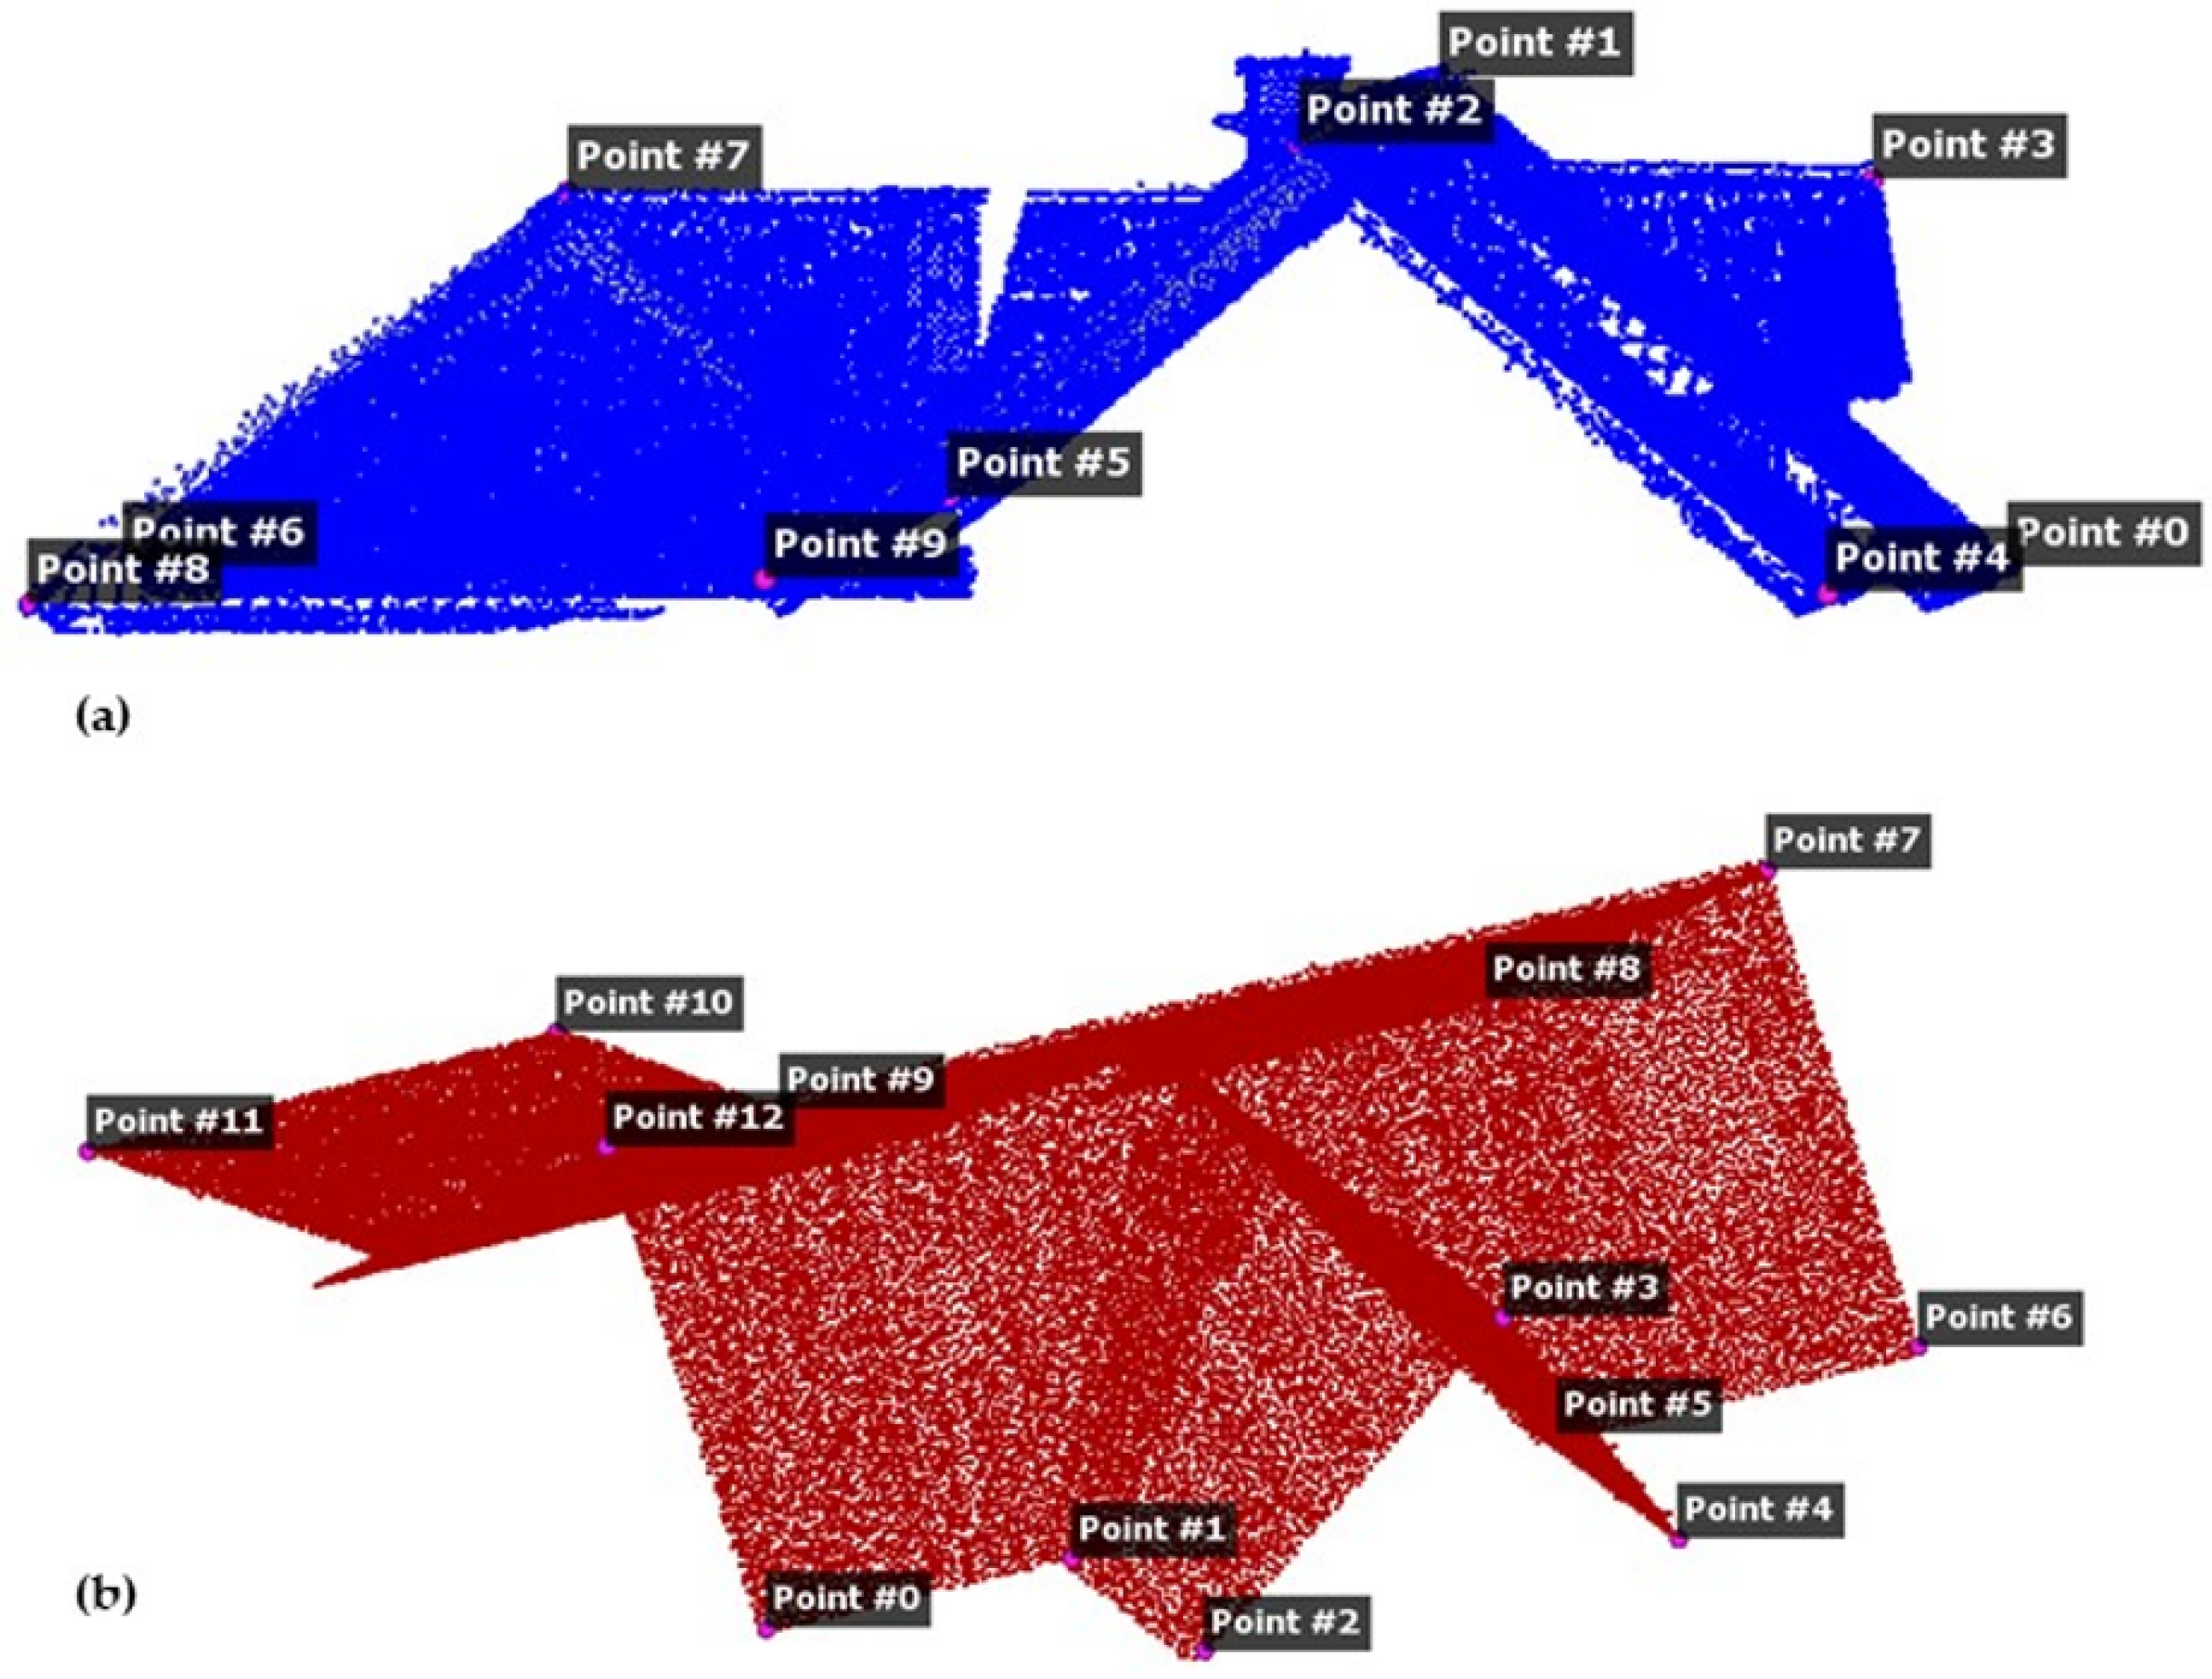
To prepare input data for the SEPtree+ algorithm, the point clouds representing the roofs of buildings located on site 1 and site 2 were cut out in the CloudCompare software. Then, a list of point coordinates within the roof outline was prepared. Nine points were designated for the building in site 1, and 12 points were designated for the building in site 2. The acquired coordinates were used as one part of the input data for the proposed tool SEPtree+. Point clouds representing roofs with indicated points are presented in Figure 16.
Then, points representing the centers of potential photovoltaic panels (PVPC) were designed on the southern slopes of the roofs. In the analyzed example, it was assumed that the size of a single panel was 1.5 × 2.0 m, which gives 25 PVPCs for site 1 and 12 for site 2. The location of PVPC on roof slopes is presented in Figure 17.
For modeling curtains that limit the sunlight exposure of test roof surfaces in e1 and e2, the curtain mesh model was built on point clouds of each roof surrounding. For creating the mesh model of predicted curtains for the years 2033 (e33), 2043 (e43), and 2053 (e53), firstly, a tree growth value was calculated for each identified tree. Then, the height of all points from the point cloud that belongs to a given tree was increased by the tree growth value. In this way, three (one each for epochs e33, e43, and e53) predicted point clouds for site 1, and three predicted point clouds for site 2 were obtained. Subsequently, on those modified point clouds, predicted curtains mesh models were created, and such models were used for the calculation of the predicted insolation of the tested roofs.
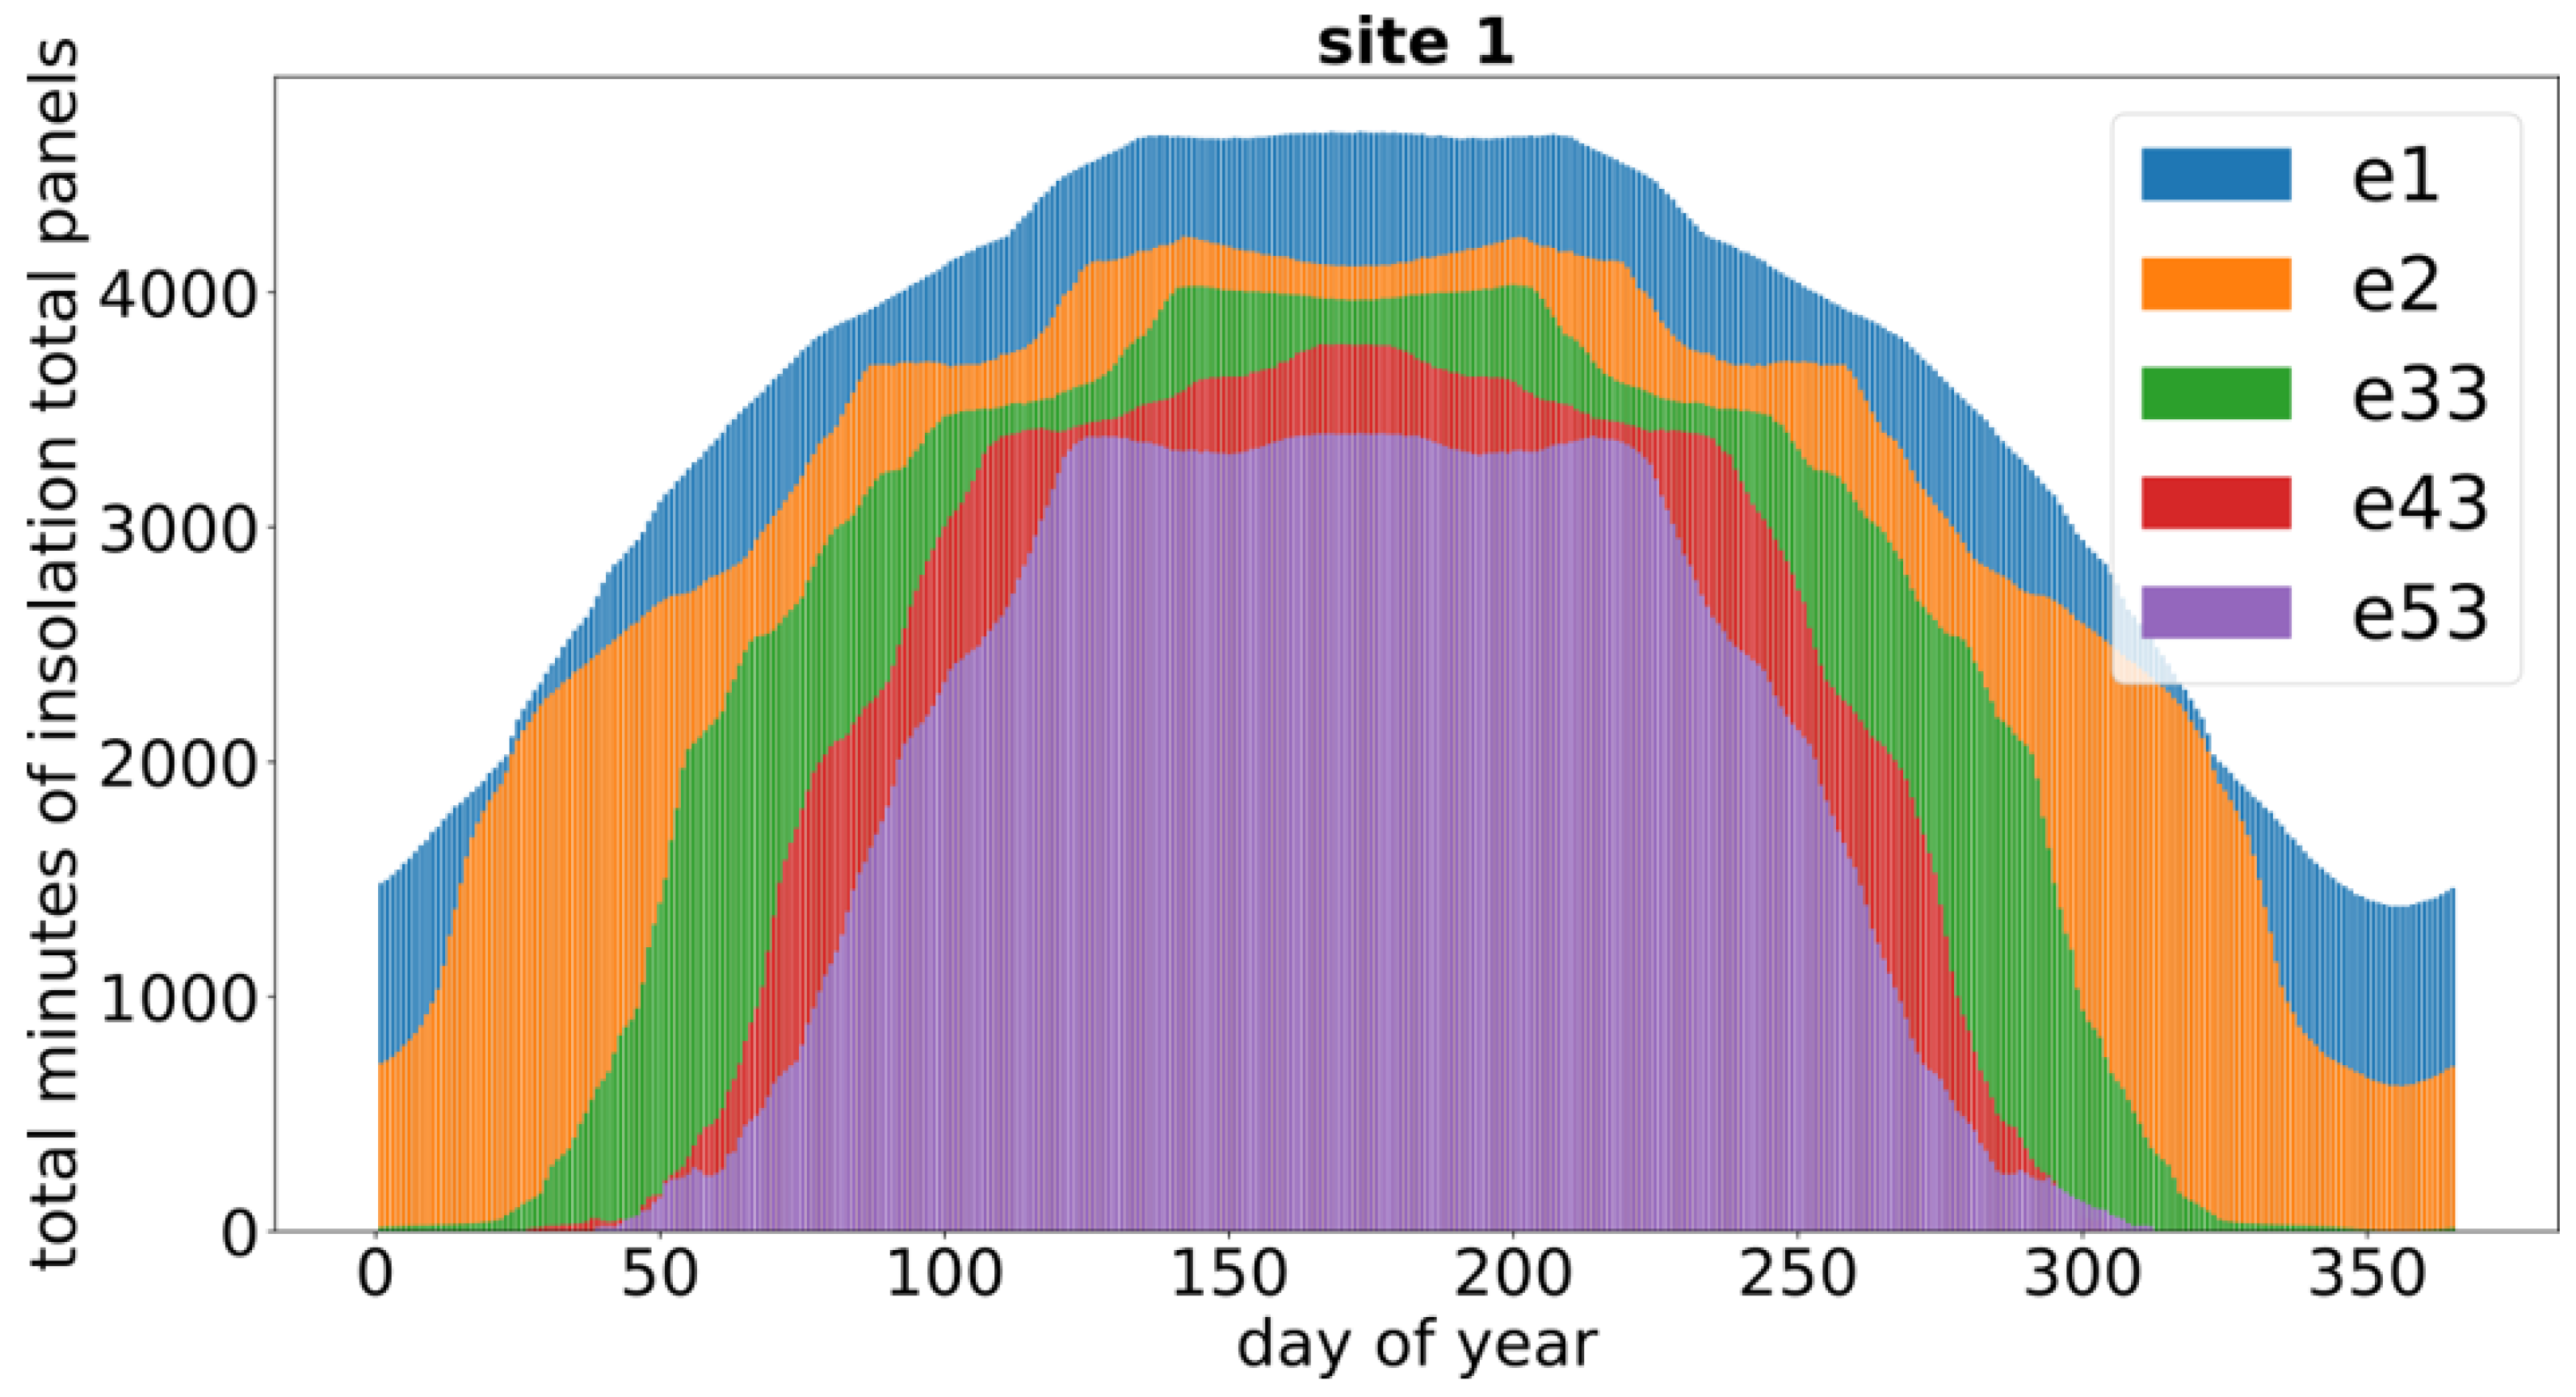
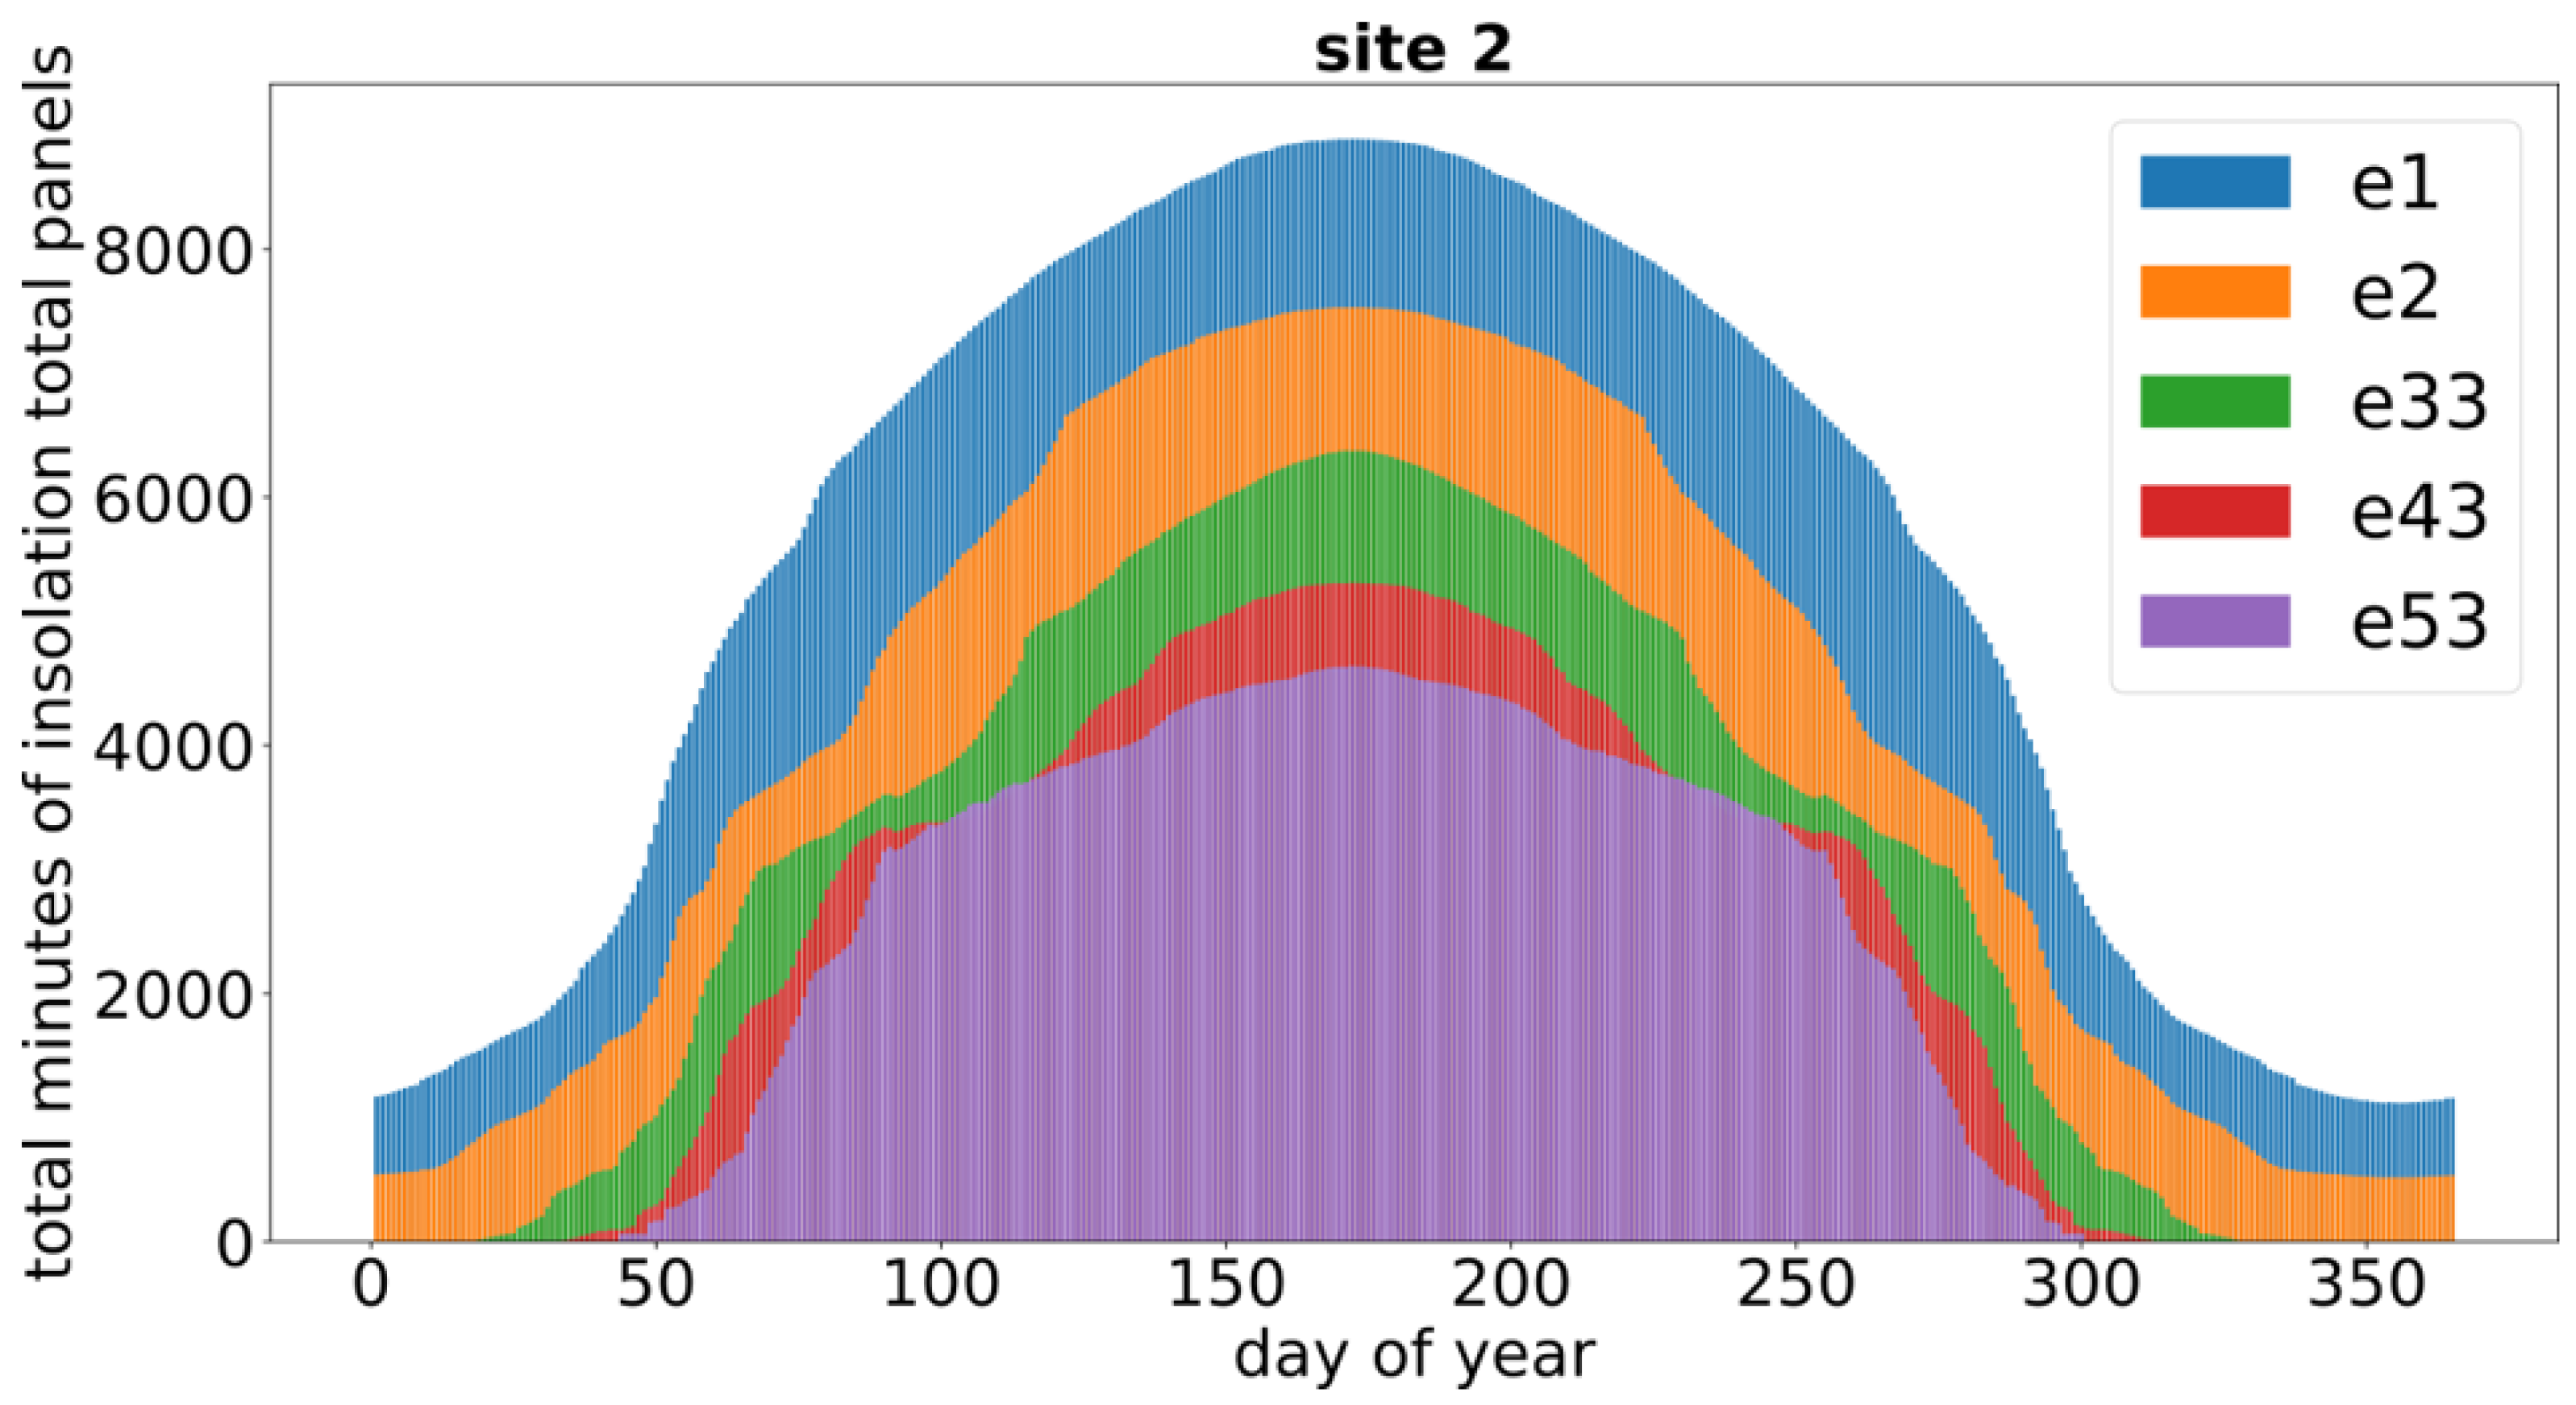
In order to assess the change in insolation depending on the growth of the trees, the total minutes of insolation of total panels (TMTPI) for each day of the year were calculated for each epoch (measured e1, e2, and predicted e33, e43, and e53). TMTPI is as follows:
T M T P I = p = 1 n m i
where the following values are given:
  • n—the number of PVPCs;
  • mi—the sum of minutes in one day when the PVPC is in sunlight.
The TMTPI distribution on individual days of a given epoch is presented in Figure 18 and Figure 19.
Based on charts located in Figure 18 and Figure 19, it can be seen that the effect of increasing the height of the curtains significantly reduces the number of minutes when the roof surface is exposed to sunlight on individual days. Both the number of days when the sun’s rays reach the roof, especially in the winter months, and the duration of sunlight on the roof in the summer months are limited. The sum of TMTPI for each test year is presented in Figure 20. In the case of site 1, the values of the sum of TMTPI are 1.28 mln, 1.11 mln, 0.85 mln, 0.67 mln, and 0.58 mln for years 2013, 2023, 2033, 2043, and 2053, respectively, while those values for the case of site 2 equals 1.97 mln, 1.49 mln, 1.10 mln, 0.88 mln, and 0.81 mln. Thus, in the case of both sites, the total sum of sunlight reaching the roof slope decreases by half from e1 to epoch e53.
The results showed that the changes in forest stand growth had a significant impact on decreasing the insolation of building construction. In the case of both test sites, the change in tree height after 30 years resulted in a reduction in the number of minutes of sunlight by more than 50%. Moreover, the effect of trees growing on the roof of the building in site 2 will be noticeable much faster.

4. Discussion

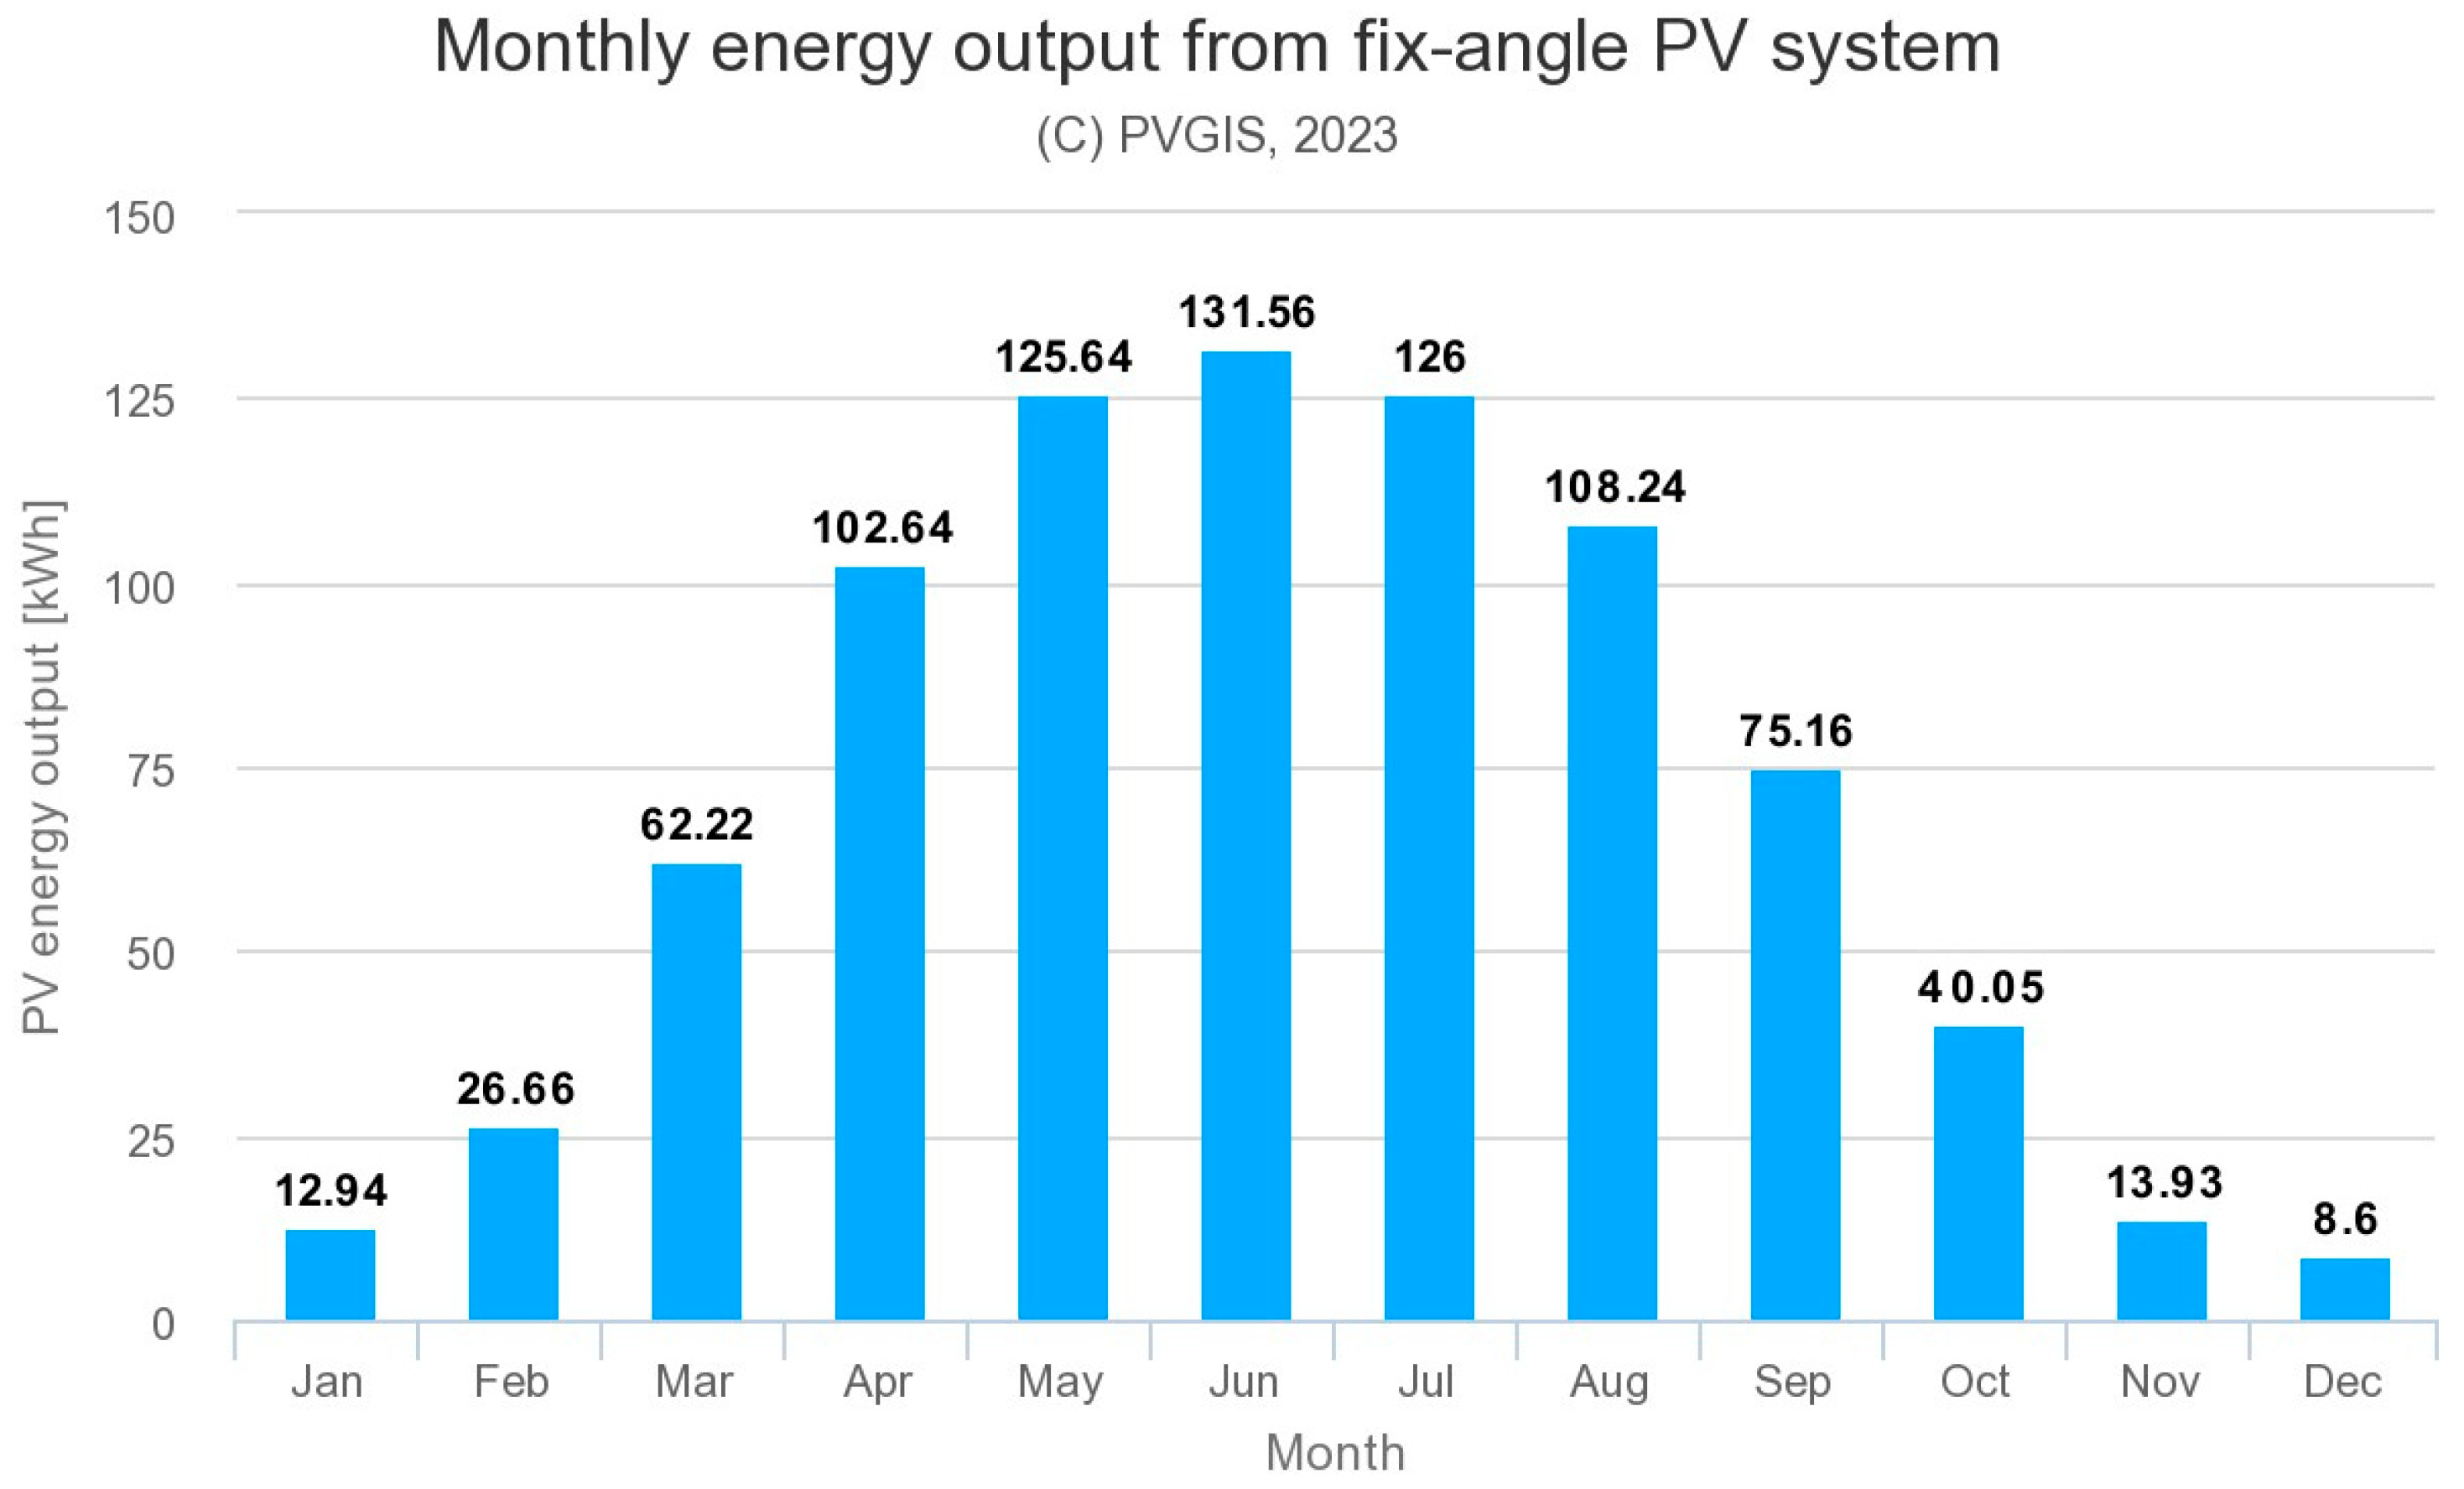
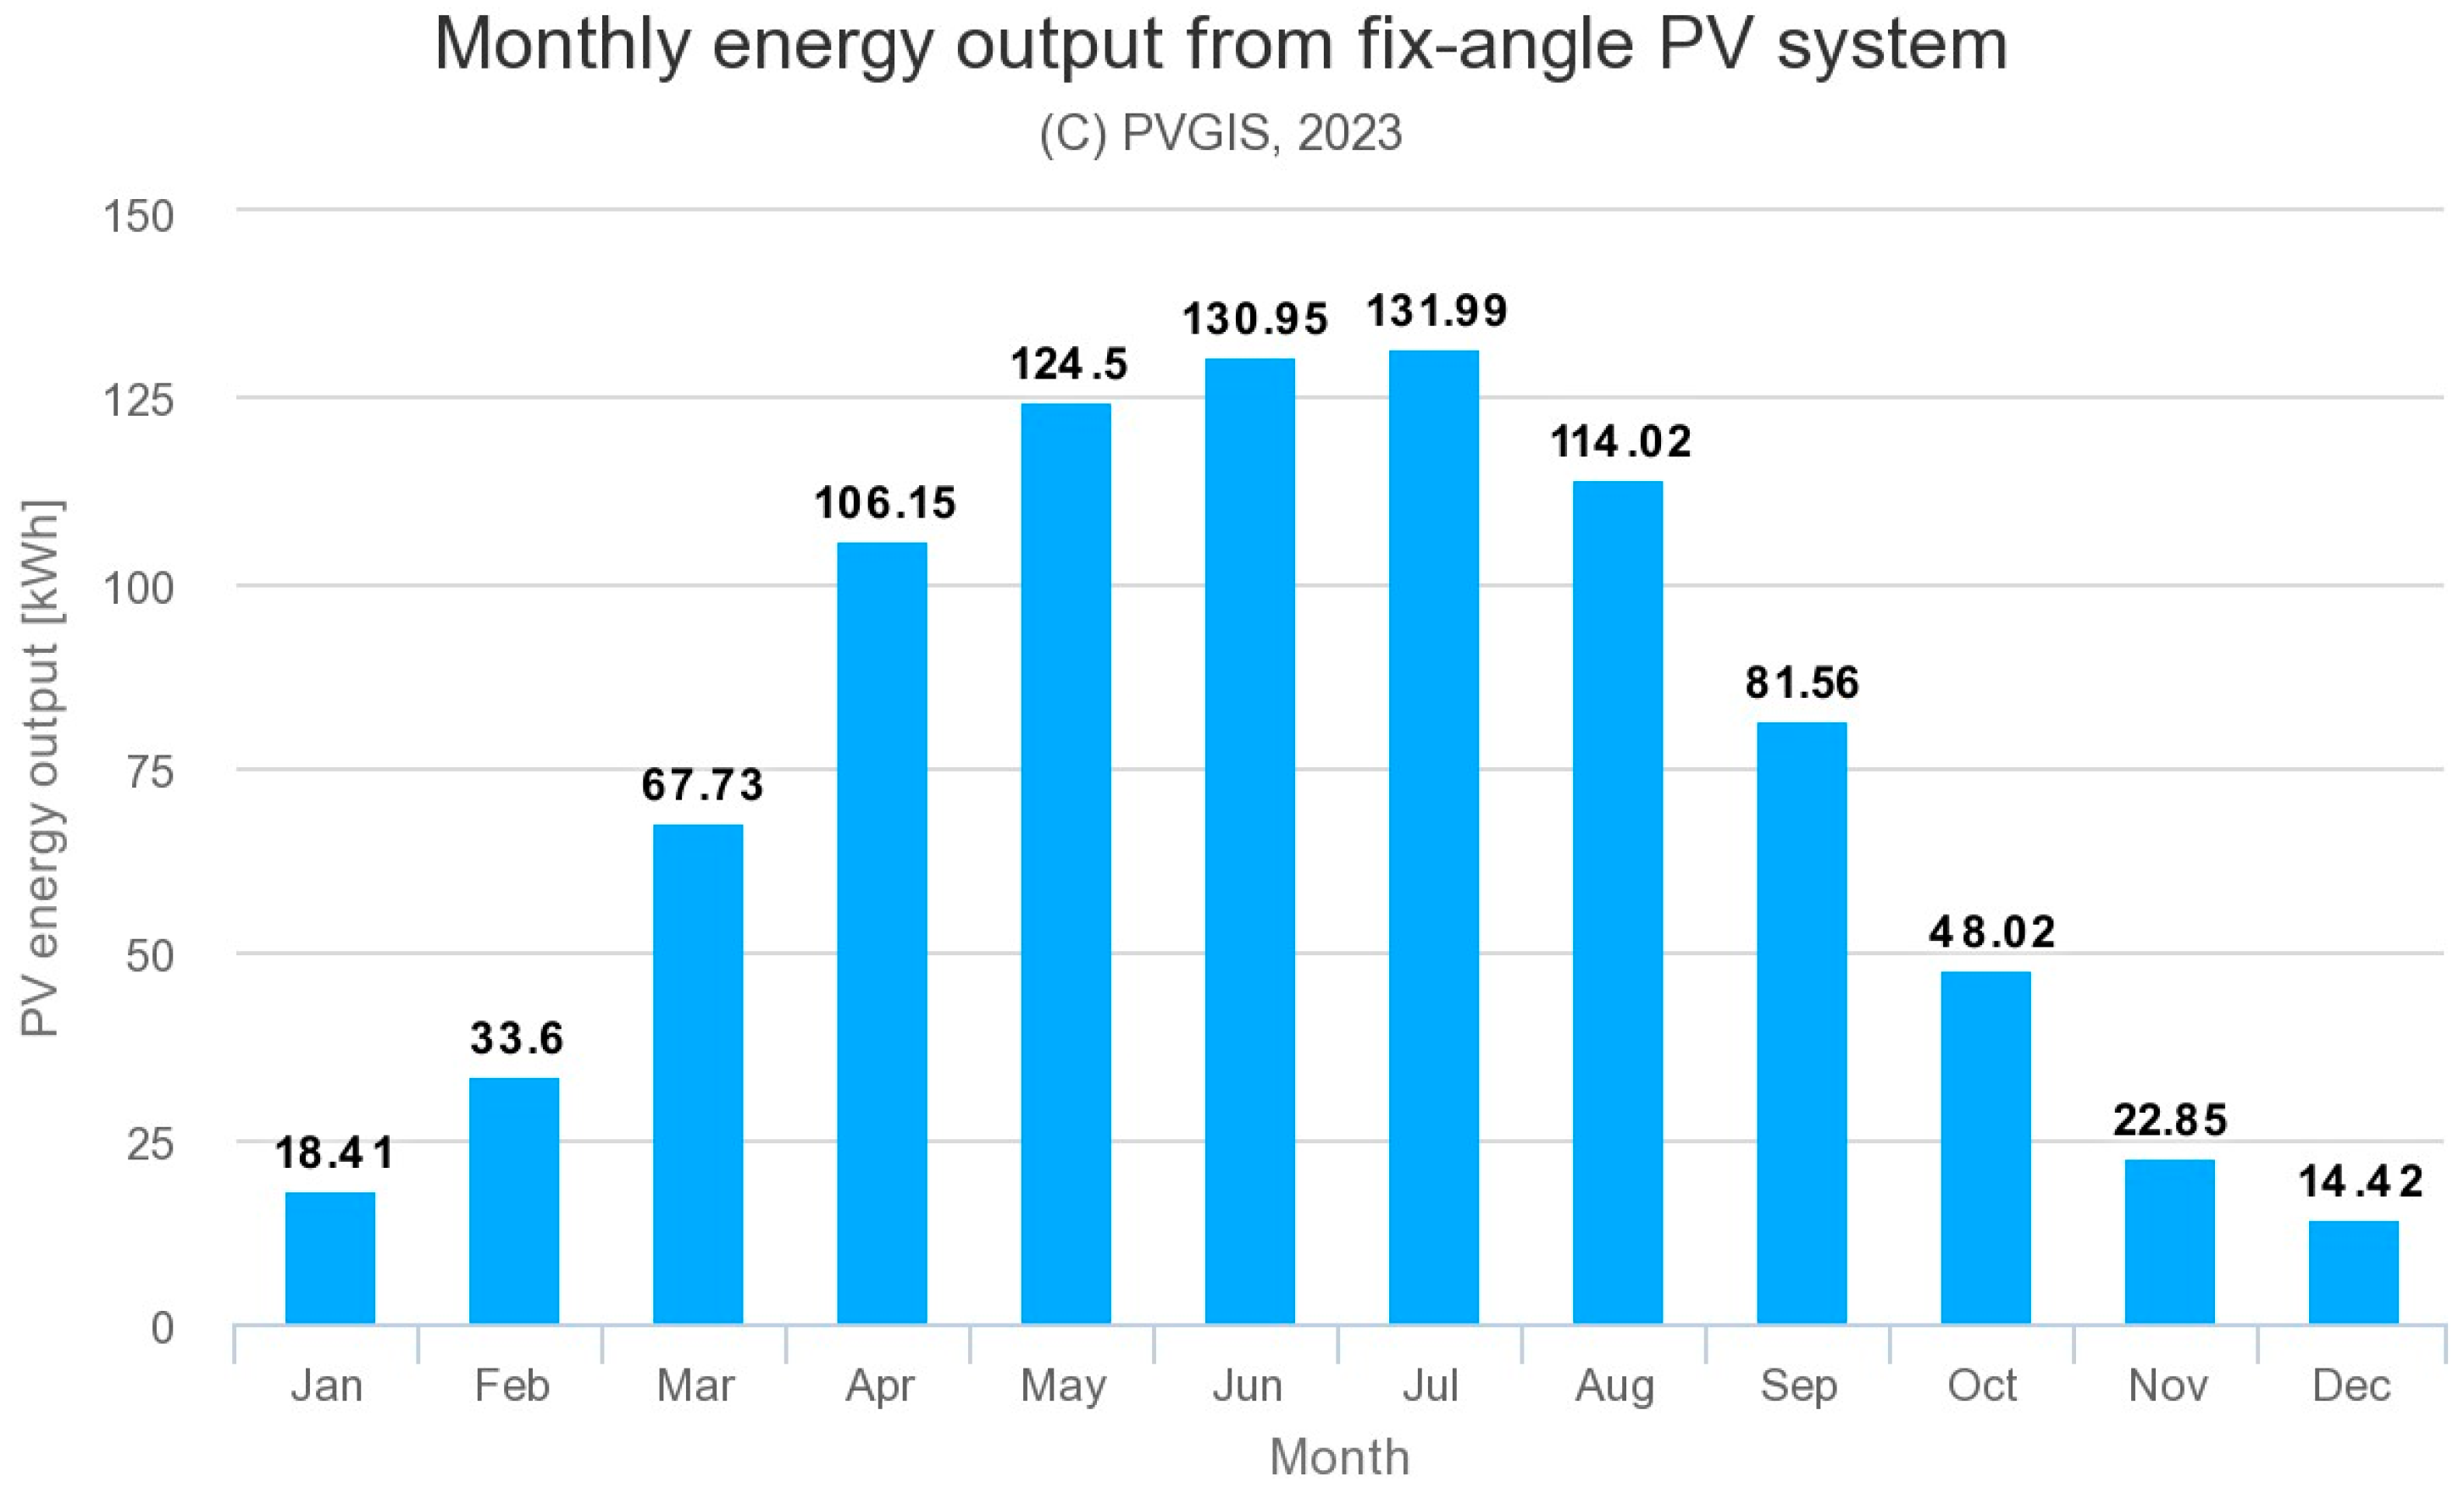
In recent years, several websites with tools to check the amount of sunlight in a given area have been created. These include global-scale (worldwide) tools such as PVGIS, which provides information on solar radiation and photovoltaic system performance for any location in Europe and Africa, as well as a large part of Asia and America (www.re.jrc.ec.europa.eu/pvg_tools accessed on 17 November 2023). Maps generated by this tool show the sun exposure of the area at the indicated address. Based on them, the user can check the amount of sunlight the plot/area receives in each month of the year. For the analyzed sites 1 and site 2, insolation was checked using PVGIS (data from 17 November 2023), and the results are presented in Figure 21 and Figure 22.
For PV installed [kWp] = 1, the total value for the whole year was calculated. [kWp] determines what efficiency photovoltaic panels can achieve if they operate in the so-called standard measurement conditions, i.e., how much electricity [kWh] can be produced by 1 sample panel. Accordingly, site 1’s yearly PV energy production is 873.8 kWh, while site 2’s yearly PV energy production is 894.2 kWh. It is important that the insolation checked in the above way indicates the amount of energy produced, taking into account the data for a given time in the annual calculation. For site 2, the yearly PV energy produced by 1 panel is greater than for site 1. However, the calculations do not take into account changes in the building’s surroundings, such as the growth of trees, which is taken into account by the analysis carried out using the SEPtree+ tool.
There are also local tools, such as the solar map of Poland (www.ongeo.pl accessed 18 November 2023), which is the result of the Geoportal Na Mapie project, which was launched in 2022, and the team that created it deals with the analysis and processing of various spatial data on a daily basis. This tool can be helpful when choosing the location of PV panels on the plot. By generating the Terrain Report, one can receive a detailed diagnosis of the insolation of the selected plot, presented in the form of three analyzes—separately for the summer and winter solstice and for the spring and autumn equinoxes. Solar energy analysis shows the amount of solar energy that reaches the ground surface.
These website tools use publicly available geodata, the resolution and validity of which is different for different areas and not always sufficient. Moreover, none of the available tools allow for forecasting changes in sunlight with the growth of trees in the area under consideration.
Compared to existing solutions, the proposed SEPtree+ tool, which takes into account the presence of trees around areas where PV can be installed, can give a full view of the current situation, as well as forecast solar radiation in the future. Even partially shading a small part of a solar panel can lead to a significant reduction in energy production. Therefore, research such as the one proposed in this paper should be primarily taken into account at the design stage. Proper planning, such as positioning panels to maximize sunlight exposure and minimize tree shading, can optimize energy production. Additionally, the presented solutions and tree growth forecasting can help in the management, maintenance, and proper use of a photovoltaic installation. Treatments such as regular pruning or tree maintenance can help alleviate shading problems. The novel aspects of the proposed methodology are presented in Table 2.

5. Conclusions

The article uses data from ALS and ULS to predict the growth of trees, which may, in the future, be an obstacle to the proper functioning of photovoltaic panels mounted on the roofs of buildings. Data processing to collect information such as tree growth at the turn of measurement epochs and identification of individual trees in point clouds was performed in the existing CloudCompare v2.12 and QGIS 3.16 software. However, the prediction of tree stand growth and the influence of tree height on buildings’ insolation was made using our own software algorithm in Python 3.11.2. All research related to the tree stand was conducted in accordance with existing studies in the form of growth tables of specific tree species.
As part of the research, the Sun Exposition based on Tree Growth Planner (SEPtree+) tool was created. The results showed that changes in tree growth had a significant impact on solar exposure to building structures. This approach is important for the proper functioning of renewable energy production devices and provides an image of the insolation of building roofs in the future.
The most important conclusions from the research are as follows:
  • Curtains in the form of trees affect the insolation of the objects where the PV system is planned to be installed. Therefore, the impact of tree growth on the surroundings of the facility should be taken into account.
  • To determine the impact of tree stand growth on the facility’s insolation, at least two measurement epochs should be available so that tree growth over time can be calculated and future growth can be predicted. The other way is to use the locally applicable tree growth tables of a specific species to calculate the tree growth in subsequent years in the future.
  • Calculated tree increments in individual years constitute the source of input data for the developed SEP-tree+ tool, which can be used to predict the solar insolation of buildings in the future.
Taking into account the prediction of the growth of trees located in the vicinity of a photovoltaic installation for the assessment of the long-term reduction in insolation of the installation is an innovative approach that has not yet been widely described in the literature and is not yet used in practice. The next stage of this study will be to extend the methodology proposed in this work with stages taking into account various tree species and weather forecasts.

Author Contributions

Conceptualization, R.P.-M. and W.B.-B.; methodology, R.P.-M.; software, R.P.-M.; validation, R.P.-M., W.B.-B. and J.J.; formal analysis, R.P.-M., W.B.-B. and J.J.; investigation, R.P.-M.; resources, W.B.-B. and T.K.; data curation, T.K.; writing—original draft preparation, W.B.-B.; writing—review and editing, R.P.-M. and J.J.; visualization, R.P.-M., W.B.-B. and J.J.; supervision, R.P.-M.; project administration, W.B.-B. and R.P.-M.; funding acquisition, W.B.-B. and R.P.-M. All authors have read and agreed to the published version of the manuscript.

Funding

This research received no external funding.

Data Availability Statement

The data presented in this study are available upon request from the corresponding author. The data are not publicly available due to an ongoing research program.

Conflicts of Interest

The authors declare no conflicts of interest.

Abbreviations

ALSairborne laser scanning
ULSunmanned aerial vehicle with laser scanning
LiDARLight Detection and Ranging
PVPhotovoltaic
DSMdigital surface model
DTMdigital terrain model
CHMCanopy Height Models
IUFROForest Research Organizations
SEPtree+Sun Exposition based on Tree Growth Planner
LMFLocal Maximum Function
TDCTree Density Calculator
TINTriangular Irregular Network
PVGISPhotovoltaic Geographical Information System
ZSzonal statistics
FMPForest Management Plan
PCMpoint cloud measurement
PVPCthe centers of potential photovoltaic panels
TMTPItotal minutes of insolation of total panels

References

  1. Aslani, M.; Seipel, S. Rooftop segmentation and optimization of photovoltaic panel layouts in digital surface models. Comput. Environ. Urban Syst. 2023, 105, 102026. [Google Scholar] [CrossRef]
  2. Zukowski, M.; Kosior-Kazberuk, M.; Blaszczynski, T. Energy and Environmental Performance of Solar Thermal Collectors and PV Panel System in Renovated Historical Building. Energies 2021, 14, 7158. [Google Scholar] [CrossRef]
  3. Freitas, S.; Reinhart, C.; Brito, M. Minimizing storage needs for large scale photovoltaics in the urban environment. Sol. Energy 2018, 159, 375–389. [Google Scholar] [CrossRef]
  4. Trzmiel, G.; Głuchy, D.; Kurz, D. The impact of shading on the exploitation of photovoltaic installations. Renew. Energy 2022, 153, 480–498. [Google Scholar] [CrossRef]
  5. Sung, S.H.; Jiang, R.; Huang, X.; Xie, C. Panels v. Trees: Broadening the Pathways of Engineering Education Through Integration With Social Studies. Sci. Scope 2022, 45, 24–33. [Google Scholar] [CrossRef]
  6. Sugihara, K.; Shen, Z. Automatic Generation of 3D Building Models with Efficient Solar Photovoltaic Generation. Int. Rev. Spat. Plan. Sustain. Dev. 2017, 5, 4–14. [Google Scholar] [CrossRef] [PubMed]
  7. Zöld, A.; Seprödi-Egeresi, M. Photovoltaic Arrays on Flat Roofs—An Aspect of Yearly Energy Production. Adv. Mater. Res. 2014, 899, 222–227. [Google Scholar] [CrossRef]
  8. Błaszczak-Bąk, W.; Janicka, J.; Kozakiewicz, T.; Chudzikiewicz, K.; Bąk, G. Methodology of Calculating the Number of Trees Based on Als Data for Forestry Applications for the Area of Samławki Forest District. Remote Sens. 2022, 14, 16. [Google Scholar] [CrossRef]
  9. Ferraz, A.; Saatchi, S.S.; Longo, M.; Clark, D.B. Tropical tree size–frequency distributions from airborne lidar. Ecol. Appl. 2020, 30, e02154. [Google Scholar] [CrossRef]
  10. Frontiers Production Office. Erratum: Solar Energy Potential Assessment on Rooftops and Facades in Large Built Environments Based on LiDAR Data, Image Processing, and Cloud Computing. Methodological Background, Application, and Validation in Geneva (Solar Cadaster). Front. Built Environ. 2020, 6, 30; Erratum in Front. Built Environ. 2018, 4, 14. [Google Scholar]
  11. Bouguerra, S.; Yaiche, M.R.; Gassab, O.; Sangwongwanich, A.; Blaabjerg, F. The Impact of PV Panel Positioning and Degradation on the PV Inverter Lifetime and Reliability. IEEE J. Emerg. Sel. Top. Power Electron. 2021, 9, 3114–3126. [Google Scholar] [CrossRef]
  12. Libra, M.; Mrázek, D.; Tyukhov, I.; Severová, L.; Poulek, V.; Mach, J.; Šubrt, T.; Beránek, V.; Svoboda, R.; Sedláček, J. Reduced Real Lifetime of PV Panels–Economic Consequences. Sol. Energy 2023, 259, 229–234. [Google Scholar] [CrossRef]
  13. Baig, S. Evaluating the Tree Shading Effect on Solar PV Panels to Maximize the Energy Production Using LIDAR Data. Master’s Thesis, Itä-Suomen yliopisto, Kuopio, Finland, 2023. [Google Scholar]
  14. Dereli, Z.; Yücedağ, C.; Pearce, J.M. Simple and low-cost method of planning for tree growth and lifetime effects on solar photovoltaic systems performance. Sol. Energy 2013, 95, 300–307. [Google Scholar] [CrossRef]
  15. Yancho, J.M.M.; Coops, N.C.; Tompalski, P.; Goodbody, T.R.H.; Plowright, A. Fine-Scale Spatial and Spectral Clustering of UAV-Acquired Digital Aerial Photogrammetric (DAP) Point Clouds for Individual Tree Crown Detection and Segmentation. IEEE J. Sel. Top. Appl. Earth Obs. Remote Sens. 2019, 12, 4131–4148. [Google Scholar] [CrossRef]
  16. White, J.C.; Wulder, M.A.; Vastaranta, M.; Coops, N.C.; Pitt, D.; Woods, M. The Utility of Image-Based Point Clouds for Forest Inventory: A Comparison with Airborne Laser Scanning. Forests 2013, 4, 518–536. [Google Scholar] [CrossRef]
  17. Iqbal, I.A.; Osborn, J.; Stone, C.; Lucieer, A. A Comparison of Als and Dense Photogrammetric Point Clouds for Individual Tree Detection in Radiata Pine Plantations. Remote Sens. 2021, 13, 3536. [Google Scholar] [CrossRef]
  18. Corte, A.P.D.; Rex, F.E.; de Almeida, D.R.A.; Sanquetta, C.R.; Silva, C.A.; Moura, M.M.; Wilkinson, B.; Zambrano, A.M.A.; da Cunha Neto, E.M.; Veras, H.F.P.; et al. Measuring Individual Tree Diameter and Height Using Gatoreye High-Density UAV-Lidar in an Integrated Crop-Livestock-Forest System. Remote Sens. 2020, 12, 863. [Google Scholar] [CrossRef]
  19. Pretzsch, H. Forest Dynamics, Growth, and Yield; Springer: Berlin, Germany, 2009; Volume 684. [Google Scholar]
  20. Vidal, C.; Alberdi, I.; Hernández, L.; Redmond, J. National Forest Inventories: Assessment of Wood Availability and Use; Springer Science + Business Media: Berlin/Heidelberg, Germany, 2016. [Google Scholar]
  21. Da Luz, N.B.; Garrastazu, M.C.; Rosot, M.A.D.; Maran, J.C.; De Oliveira, Y.M.M.; Franciscon, L.; Cardoso, D.J.; De Freitas, J.V. Brazilian National Forest Inventory—A Landscape Scale Approach to Monitoring and Assessing Forested Landscapes. Pesqui. Florest. Bras. 2018, 38, 1–14. [Google Scholar] [CrossRef]
  22. Altrell, D. Multipurpose National Forest Inventory in Mongolia, 2014–2017-a Tool to Support Sustainable Forest Management. Geogr. Environ. Sustain. 2019, 12, 167–183. [Google Scholar] [CrossRef]
  23. Tomppo, E.; Gschwantner, T.; Lawrence, M.; McRoberts, R.E. National forest inventories. Pathways for Common Reporting. Eur. Sci. Found. 2010, 1, 541–553. [Google Scholar]
  24. Szymkiewicz, B. Tables of Holdings Measurement and Growth of Timber Stock; Polskie Wydawnictwo Rolne i Leśne: Warsaw, Poland, 1983; pp. 28–29. [Google Scholar]
  25. Bruchwald, A. MDI−1 growth model for pine. Las Pol. 1985, 9, 10−15. [Google Scholar]
  26. Holmgren, W.F.; Hansen, C.W.; Mikofski, M.A. pvlib python: A python package for modeling solar energy systems. J. Open Source Softw. 2018, 3, 884. [Google Scholar] [CrossRef]
  27. Hawkins, B.J. A Tribute: Robert John van Den Driessche, Tree Physiologist, 1933–2018. Can. J. For. Res. 2018, 48, v–vii. [Google Scholar] [CrossRef]
  28. Ford-Robertson, F.C. International Union of Forest Research Organizations. Nature 1961, 192, 614–615. [Google Scholar] [CrossRef]
  29. Crabbé, A.H.; Cahy, T.; Somers, B.; Verbeke, L.P.; Van Coillie, F. Tree Density Calculator Software (Version x.x) [Software]. 2020. Available online: https://bitbucket.org/kul-reseco/localmaxfilter (accessed on 17 October 2023).
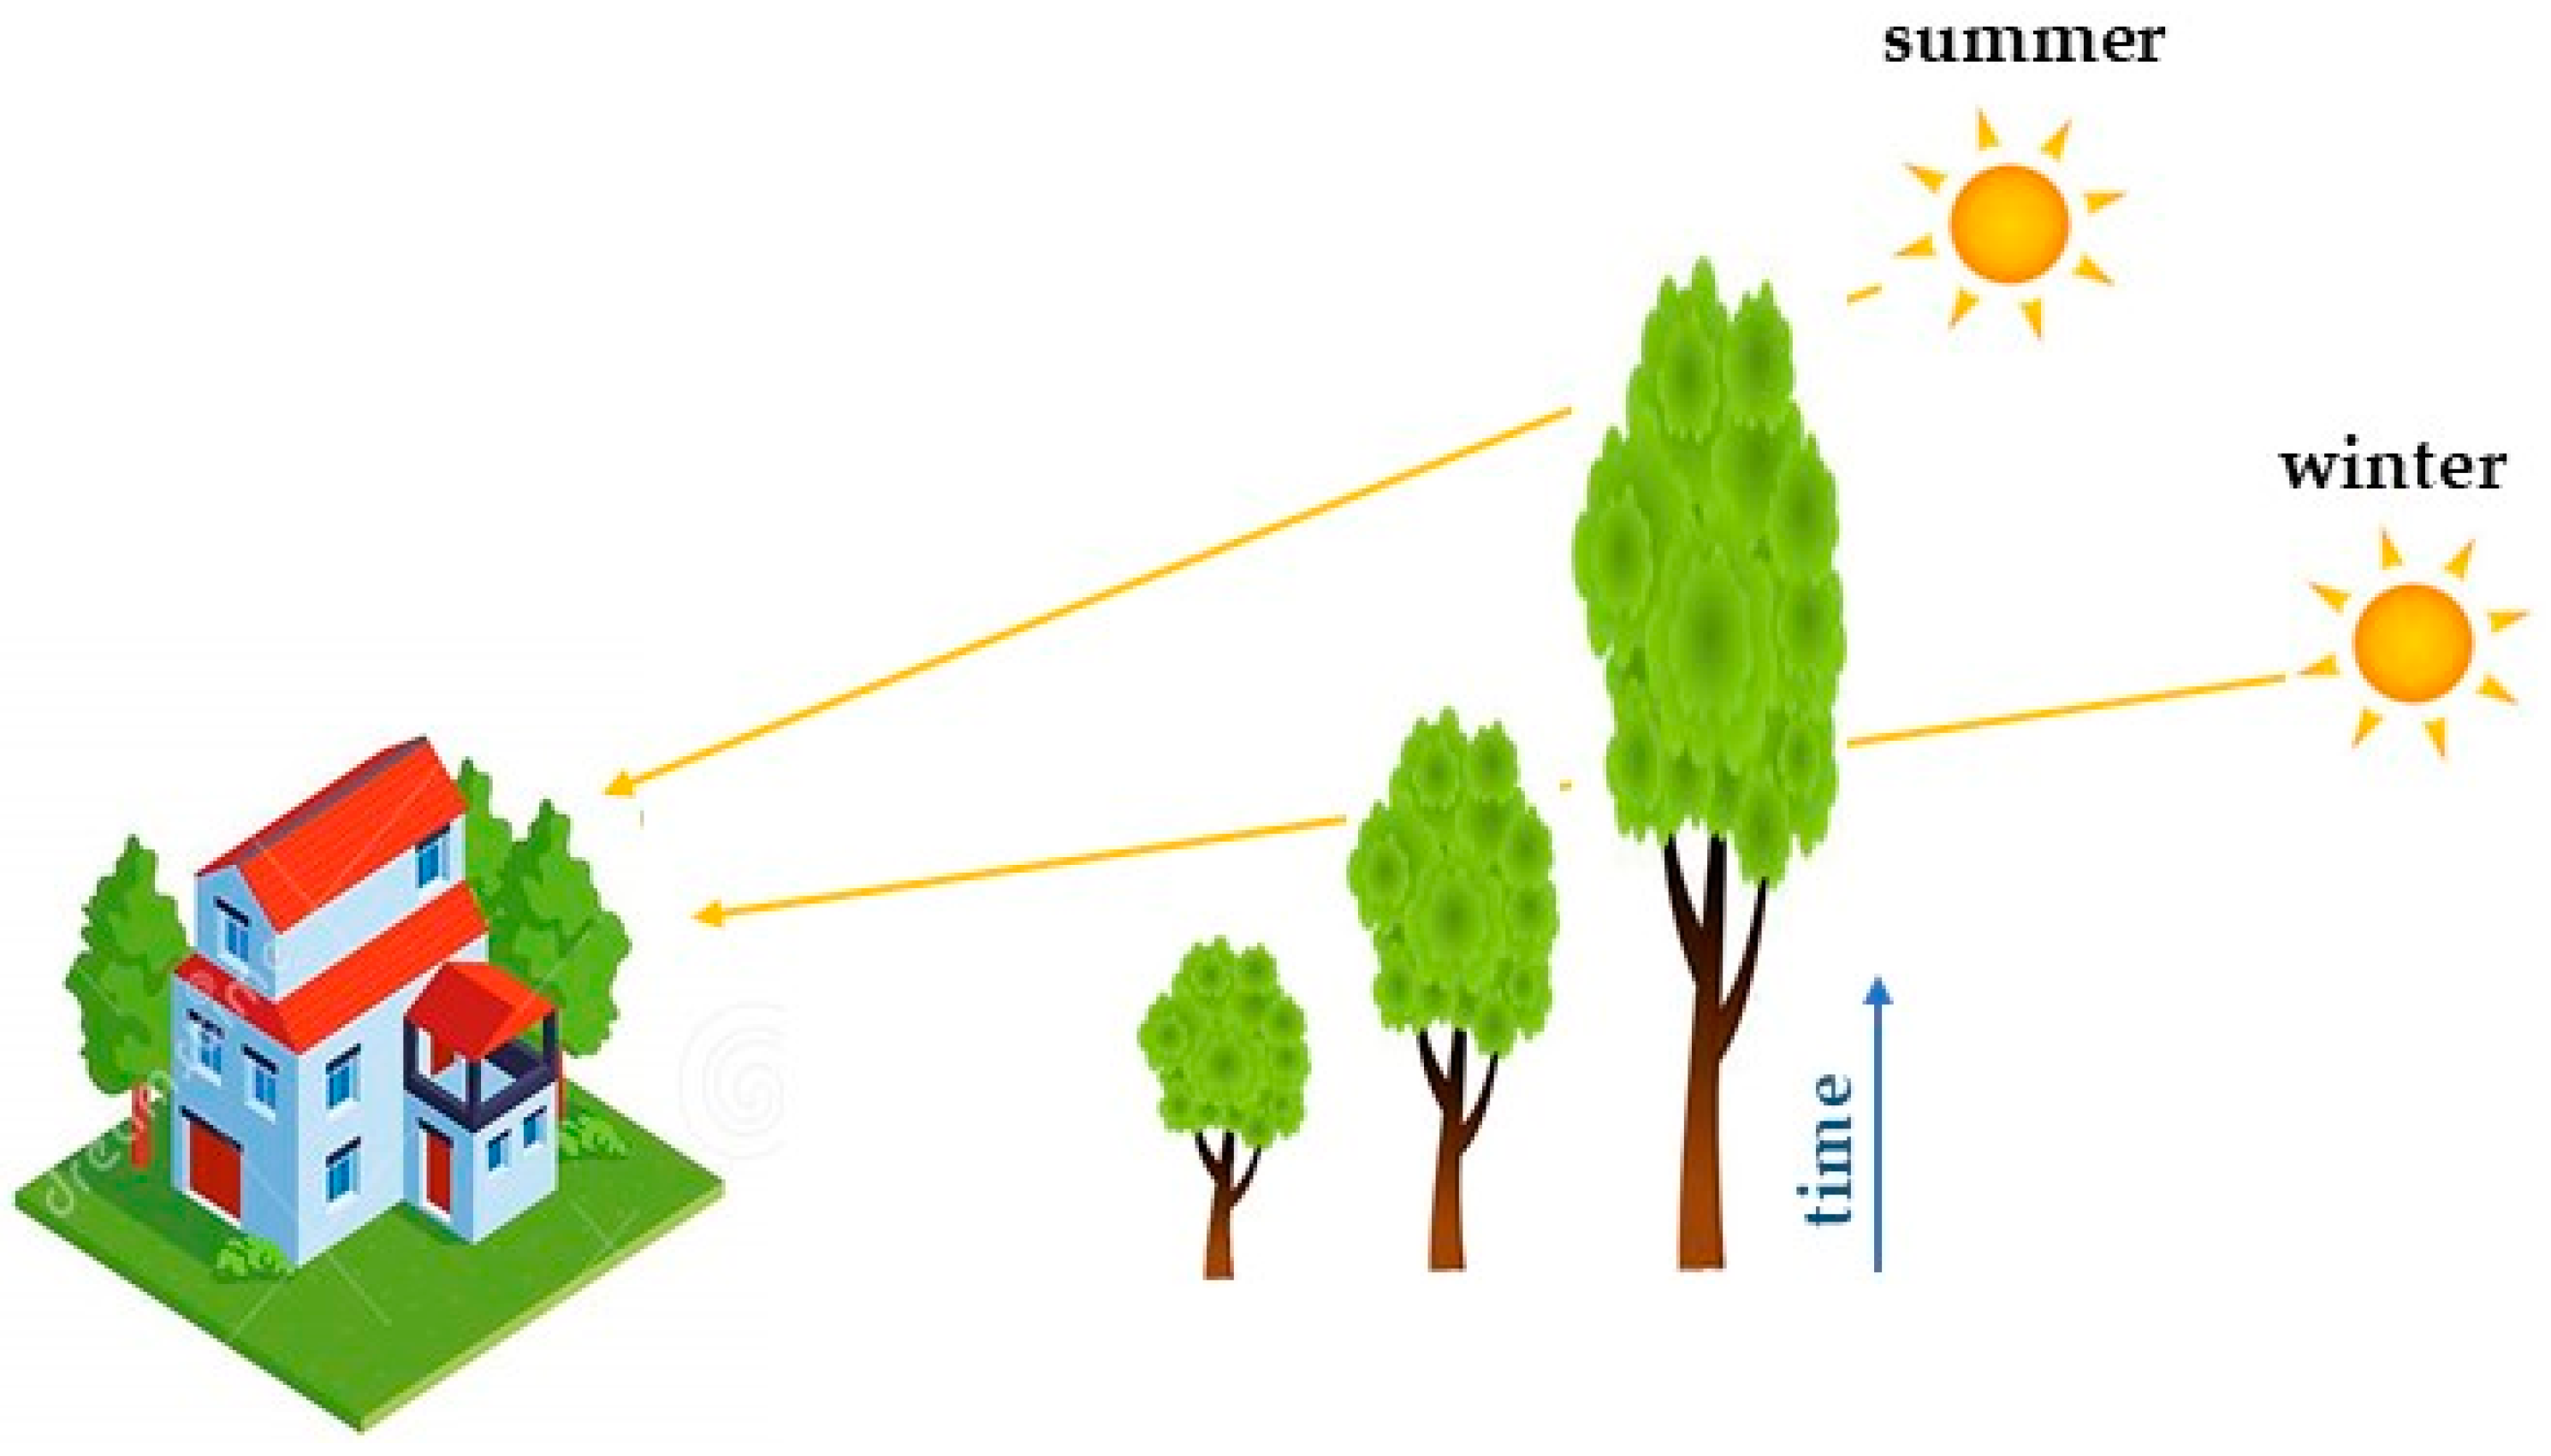
Figure 2. The influence of tree growth on the change in roof sunlight.
Energies 17 00594 g002
Figure 3. Tool diagram of SEPtree+.
Energies 17 00594 g003
Figure 4. ALS point cloud: (a) site 1; (b) site 2; red box—zoom containing an each site.
Energies 17 00594 g004
Figure 5. ULS point cloud: (a) site 1; (b) site 2; red box—zoom containing an each site.
Energies 17 00594 g005
Figure 6. TIN CHM: (a) TIN_ALS_site 1_e1, (b) TIN_ULS_site 1_e2, (c) TIN_ALS_site 2_e1, and (d) TIN_ULS_site 2_e2 (where shades of gray indicate height).
Energies 17 00594 g006
Figure 7. Trees detected based on TDC: (a) for TIN ALS site 1-e1, (b) for TIN ULS_site 1-e2, (c) for TIN ALS site 2-e1, and (d) for TIN ULS site 2-e2 (where green—trees detected in e1; pink trees—trees detected in e2).
Energies 17 00594 g007
Figure 8. Tree trunk localization based on tachymetric.
Energies 17 00594 g008
Figure 9. Tree heights.
Energies 17 00594 g009
Figure 10. Growth of tested trees from site 1 between epochs e1 and e2.
Energies 17 00594 g010
Figure 11. Manual measurement of tree height differences between epochs e1 (green color) and e2 (pink color), for example, (a) tree no. 5 and (b) tree no. 6.
Energies 17 00594 g011
Figure 12. Trees age at site 1.
Energies 17 00594 g012
Figure 13. Trees age at site 2.
Energies 17 00594 g013
Figure 14. The predicted growth of trees during 10, 20, and 30 years in relation to the current (e2) age of the tree at site 1.
Energies 17 00594 g014
Figure 15. The predicted growth of trees during 10, 20, and 30 years in relation to the current (e2) age of the tree at site 2.
Energies 17 00594 g015
Figure 16. Point clouds representing roofs (a) for buildings located on site 1 and (b) for buildings located on site 2.
Energies 17 00594 g016
Figure 17. Location of panel center points (PVPC) on roof slopes: (a) site 1; (b) site 2.
Energies 17 00594 g017
Figure 18. TMTPI distribution for site 1.
Energies 17 00594 g018
Figure 19. TMTPI distribution for site 2.
Energies 17 00594 g019
Figure 20. The sum of TMTPI for each test year.
Energies 17 00594 g020
Figure 21. PVGIS results for site 1.
Energies 17 00594 g021
Figure 22. PVGIS results for site 2.
Energies 17 00594 g022
Table 1. The results of determining tree growth between e1 and e2 obtained from three methods.
Tree IDTree Growth between Epochs e1 and e2 [m]
LMFZSPCM
1X4.114.18
2X3.192.65
34.784.564.56
44.584.684.75
55.755.755.8
611.1111.3110.93
73.443.233.13
84.874.884.84
95.815.785.77
104.164.174.16
116.546.536.53
127.467.597.69
136.186.236.23
147.587.57.5
157.077.157.14
166.16.045.97
177.357.347.33
Where X—not detected.
Table 2. Novel aspects of proposed methodology.
NoveltyApplicationAdvantage
the predicted growth of trees
in planning construction investments;
when developing photovoltaic installation designs;
for environmental management;
long-term tree growth forecast;
the ability to predict the appearance of trees in the future in terms of curtains;
SEPtree+ tool
for property owners who do not always have influence and decision making on changes occurring in the natural environment;
for the prediction of certain situations that may affect the change in solar radiation of roofs.
gives a full view of the current situation, as well as forecast solar radiation in the future;
minimization of tree shading for optimizing energy production via early forecasting.
Disclaimer/Publisher’s Note: The statements, opinions and data contained in all publications are solely those of the individual author(s) and contributor(s) and not of MDPI and/or the editor(s). MDPI and/or the editor(s) disclaim responsibility for any injury to people or property resulting from any ideas, methods, instructions or products referred to in the content.