Abstract
In this paper, single-diode model (SDM) and double-diode model (DDM) parameters of the French RTC solar cell and the Photowatt PWP 201 photovoltaic (PV) module were extracted by combining five metaheuristic algorithms with three simulation current calculation methods (i.e., approximation method, Lambert W method and Newton–Raphson method), respectively. It was found that the parameter-extraction accuracies of the Lambert W (LW) method and the Newton–Raphson (NR) method are always approximately equal and higher than that of the approximation method. The best RMSEs (root mean square error) obtained by using the LW or the NR method on the solar cell and the PV module are 7.72986 × 10⁻⁴ and 2.05296 × 10⁻³ for SDM parameter extraction and 6.93709 × 10⁻⁴ and 1.99051 × 10⁻³ for DDM parameter extraction, respectively. The latter may be the highest parameter-extraction accuracy reported on the solar cell and the PV module so far, which is due to the adoption of more reasonable DDM parameter boundaries. Furthermore, the convergence curves of the LW and the NR method basically coincide, with a convergence speed faster than that of the approximation method. The robustness of a parameter-extraction method is mainly determined by the metaheuristic algorithm, but it is also affected by the simulation current calculation method and the parameter-extraction object. In a word, the approximation method is not suitable for application in PV-model parameter extraction because of incorrect estimation of the simulation current and the RMSE, while the LW and NR methods are suitable for the application for accurately calculating the simulation current and RMSE. In terms of saving computation resources and time, the NR method is superior to the LW method.
1. Introduction
The rapid and accurate extraction of the single-diode model (SDM) or double-diode model (DDM) parameters from a solar cell or a photovoltaic (PV) module according to the measured current–voltage (I-V) data has always been a fundamental and significant research topic in the fields of PV research and development (R&D), production, and application [1]. Because the SDM and DDM equations of a solar cell or a PV module are both implicit transcendental equations, it is not easy to accurately extract the PV-model parameters of a solar cell or a PV module by fitting the measured I-V characteristic data with the PV-model equations. In order to accurately extract the PV-model parameters, different approaches, such as the analytical method, numerical iteration method, metaheuristic method, and so on, have been proposed [1]. In recent years, more and more metaheuristic algorithms have been developed and applied in PV-model parameter estimation due to their advantages, such as ease of use, global optimization ability, strong robustness, etc. [2,3]. Metaheuristic algorithms by their nature mimic phenomena, laws, or mechanisms in nature or human society, and use intelligent iteration methods to conduct parallel, random, and directional exploration to find the optimal solution to the problem. The parameter-extraction process by using the metaheuristic method is to search for a set of PV-model parameters by using a metaheuristic algorithm within a given range with the minimum objective-function value. It should be noted that the root mean square error (RMSE) between the simulated and measured I-V characteristic curves is often used as the objective function of metaheuristic algorithms for PV-model parameter estimation [4].
For the research on PV-model parameter extraction by using metaheuristic algorithms, more attention has been paid to introducing or developing a new and more powerful algorithm to improve parameter-extraction performance. However, the accurate calculation of the simulation current thus the RMSE as well as the reasonable setting of the PV-model parameter boundary, have been ignored intentionally or unintentionally. In 2020, Ćalasan et al. first pointed out that most of the previous researchers did not use the correct equation to calculate the simulation current thus the RMSE in their publications [5]. If a powerful metaheuristic algorithm is used for SDM parameter extraction from the French RTC solar cell with a commonly used parameter search range in literature, the correct RMSE value should be 7.73006 × 10⁻⁴ when the simulation current is accurately calculated by using the explicit equation based on Lambert W function (abbreviated to LW method in the following) or Newton-Raphson (NR) method. The incorrect RMSE value should be 9.86022 × 10⁻⁴, when the simulation current is calculated by using the measured current and the pseudo-PV-model equation (denoted as approximation method in the following) [6,7]. However, even up to today, there are still many publications that report an RMSE value of 9.86022 × 10⁻⁴, achieved by extracting SDM parameters from the French RTC solar cell [8,9,10,11]. As for the setting of the PV-model parameter boundary, taking the parameter extraction from the French RTC solar cell as an example, people usually set the search range of SDM parameters as , , , , and [12,13,14], according to the earliest reported SDM parameter extraction result from the solar cell [15] (, , , , and ). However, researchers directly expanded the SDM parameter boundary to form the DDM parameter boundary [13,14,16] (, , , , , , and ) without considering the physical meaning and range of each DDM parameter. Due to the unreasonable settings of the parameter boundary, the extracted I01 approaches I02, the extracted n1 approaches n2, and even and n1 > n2 [13,14,16]. Up to now, there are still many researchers who use this incorrect DDM parameter boundary to extract the DDM parameters of the French RTC solar cell [17,18,19,20]. In fact, according to the research results of PV specialists on the DDM parameter ranges of crystalline silicon solar cells based on semiconductor device theory [21], n1 ≈ 1, n2 is usually greater than 2, and I02 is usually 3–7 orders of magnitude higher than I01. In addition, it was also reported that n2 should be around 1.8 for industrial crystalline silicon solar cells with the pn junctions made by using the conventional thermal diffusion method [22]. According to the DDM parameter results of industrialized crystalline silicon solar cells reported by PV specialists [23,24,25,26,27], series resistance (Rs) is in the range of several mΩ to tens of mΩ, the parallel resistance (Rsh) ranges from tens of Ω to tens of thousands of Ω, the reverse saturation current of diode 1 (I01) is in the range of a few tenths of nA to tens of nA, and the reverse saturation current of diode 2 (I02) ranges from several μA to hundreds of μA. In the parameter-extraction work, by using metaheuristic algorithms, the optimal PV-model parameters (five SDM parameters or seven DDM parameters) are determined by minimizing the RMSE. However, there exist many different combinations of PV-model parameters that can yield the same RMSE value [28]. Therefore, in order to obtain physically meaningful DDM parameters, one must first set a reasonable search range for each DDM parameter.
There are three kinds of methods for accurately calculating simulation current, namely the NR method, the LW method, and the special trans function (STF) method. The NR method solves the implicit equations through numerical iteration, while the LW and STF methods convert the implicit equations into the explicit equations expressed by special functions to solve. For the comparative study on parameter extraction by combining different simulation current calculation methods with a metaheuristic algorithm, Gao et al. [29] used a modified Nelder–Mead simplex (MNMS) algorithm to extract the SDM parameters of the French RTC solar cell and three PV modules (PWP 201, STM6-40/36, and STP6-120/36) by combining the special trans function based single-diode model (SBSDM), the Lambert W function based single-diode model (LBSDM), and the exponential-type single-diode model (SDM), respectively, and compared the parameter-extraction performance of these three methods (abbreviated to SBSDM method, LBSDM method, and SDM method). The results show that the minimum RMSE value obtained by the SBSDM method is slightly lower than that of the LBSDM method, but markedly lower than that of the SDM method. The LBSDM method consumes the most computation time, followed by the SBSDM method, and then the SDM method. It should be noted that the SDM method denoted by Gao et al. [29] is equivalent to the approximation method named in this paper, where the simulation current is calculated by using the measured current and the pseudo-PV-model equation. In addition, STF is a multi-branch function, and it also involves the selection and optimization of the branch parameter x when applied to parameter extraction. Therefore, the SBSDM method is not as simple, direct, and convenient to use as the LW method. Thus, it is seldom used for parameter extraction. In 2020, Yousri et al. [30] compared the effects of two simulation current calculation methods (NR method and approximation method) on the parameter-extraction results. The results show that the NR method can improve the parameter-extraction performance (parameter-extraction accuracy, robustness, and convergence) of metaheuristic algorithms, thereby obtaining more accurate and consistent PV-model parameters. In 2022, Nunes et al. [6] compared the effects of three simulation current calculation methods (the approximation method, NR method, and LW method) on the SDM parameter extraction from one solar cell and two PV modules. The results show that the LW and NR methods obtain similar PV-model parameters and RMSE values. However, the approximation method achieves different PV-model parameters, with RMSE values significantly higher than those of the LW and NR methods. Both the LW and NR methods are the optimal choices for evaluating the output current of the PV models, while the approximation method is not a suitable choice because the obtained solutions are inaccurate. In 2023, Ayyarao et al. [31] combined an artificial hummingbird optimization (AHO) algorithm and three simulation current calculation methods (the approximation method, NR method, and LW method) to extract the SDM and DDM parameters of the French RTC solar cell, as well as the SDM parameters of the PWP 201module, respectively. The results indicate that the parameter-extraction error of the approximation method is relatively high, while the LW and NR methods can always obtain accurate results for both the solar cell and the PV module. Compared with the NR method, the LW method requires more computation resources and memory, and thus more computation time. Overall, the NR method is the best approach for calculating simulation current.
Although some comparative studies about the impact of different simulation current calculation methods on parameter-extraction results have been done, there still exist some deficiencies. (1) Unreasonable DDM parameter boundaries for both solar cells and PV modules were adopted, resulting in the lower DDM parameter-extraction accuracy and extracted DDM parameters lack of physical meanings. (2) Only one powerful metaheuristic algorithm was combined with different simulation current calculation methods to extract PV-model parameters. Thus, the results cannot reflect the impact of different metaheuristic algorithms on parameter-extraction results. (3) Only SDM parameters were extracted from the PV modules, which means that the effects of different simulation current calculation methods on the DDM parameter extraction from PV modules were not disclosed.
To address the existing issues, five of the latest and state-of-art metaheuristic algorithms were combined with three simulation current calculation methods (i.e., approximation method, LW method, and NR method) to extract SDM and DDM parameters from the French RTC solar cell and the Photowatt PWP 201 PV module, respectively. The selected five metaheuristic algorithms are artificial ecosystem-based optimization (AEO) [32], gradient-based optimizer (GBO) [33], generalized normal distribution optimization (GNDO) [34], bonobo optimizer (BO) [35], and the red-tailed hawk (RTH) algorithm [36]. Then, we compared the parameter-extraction accuracy, robustness, convergence curve, and computation time of different methods comprehensively. It should be mentioned that we did not use the LW method to extract the DDM parameters from the French RTC solar cell and the PWP 201 PV module. The reason is that the LW function-based explicit equation of DDM proposed by Gao et al. [37] includes a vector r with the dimension equal to the number of the measured I-V data points of the solar cell or the PV module. Take the French RTC solar cell as an example. Its standard I-V data contains 26 measured data points, which means that r is a 26-dimensional vector. Furthermore, the vector r needs to be determined according to the given seven DDM parameters and the measured I-V data of the solar cell or the PV module, which means that the 26-dimensional vector r will change with the seven DDM parameters. Although the LW function-based explicit equation was strictly derived from the implicit equation of DDM, the introduction of vector r will greatly increase the computing workload in the parameter-optimization process and consume a lot of computation resources and time. In fact, for the DDM parameter extraction, the NR method can achieve the same parameter-extraction accuracy as the LW method with a lower computation cost. Therefore, the exact explicit equation of DDM based on the LW function is rarely used for the DDM parameter extraction from solar cells or PV modules until today. Although we did not use the LW method for DDM parameter extraction, we calculated the RMSE values by using the extracted DDM parameters and the LW function-based explicit equation of DDM proposed by Gao et al. and compared them with the RMSE values calculated by using the approximation method and the NR method. In addition, for the DDM parameter extraction from the French RTC solar cell and the PWP 201 PV module, we used more reasonable DDM parameter boundaries in this paper.
This article is organized as follows. The second section introduces the principles and methods, including the SDM and DDM equations for the solar cells and PV modules, three simulation current calculation methods, the objective function, the parameter-extraction process, etc. Then, the third section shows the results and discussion. Finally, the fourth section draws the conclusion.
2. Principles and Methods
2.1. Single-Diode Models (SDMs) of Solar Cells and PV Modules
The single-diode model (SDM) of a solar cell consists of a constant current source, a diode, a parallel resistance, and a series resistance, as shown in Figure 1. According to Figure 1 and Kirchhoff’s law, the SDM equation of a solar cell can be expressed as [38]
where I is the output current of the solar cell, V is the output voltage of the solar cell, Iph is the photogenerated current, I0 is the reverse saturation current of the diode, Rs is the series resistance, Rsh is the parallel resistance, n is the ideal factor of the diode, q is the electron charge, k is the Boltzmann constant, and T is the temperature of the solar cell. The SDM is a simple model, but it can fit the measured I-V characteristic curve of a solar cell with acceptable accuracy. The shortcoming of the SDM is that it contains lumped parameters, like I0 and n.
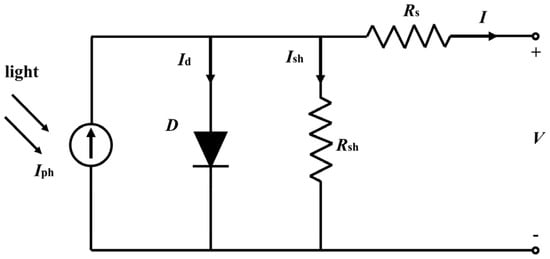
Figure 1.
Equivalent circuit of the single-diode model (SDM) for a solar cell.
In order to satisfy the power-supply demand, PV modules are usually composed of tens of solar cells connected in series. Assuming that all the solar cells in a PV module have the same SDM parameters, namely Iph, I0, n, Rs, and Rsh. The SDM equation of a PV module can be written as [38]
where Ns represents the number of solar cells connected in series in a PV module. The equivalent circuit of the SDM for a PV module is shown in Figure 2.
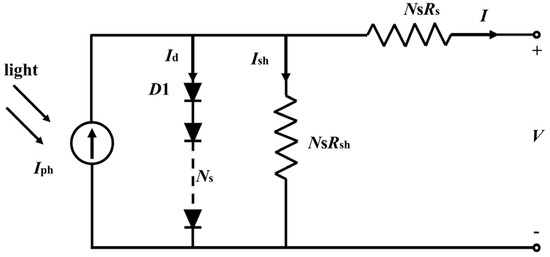
Figure 2.
Equivalent circuit of the single-diode model (SDM) for a PV module.
2.2. Explicit Equations of Single-Diode Models (SDMs) for Solar Cells and PV Modules
With the help of the Lambert W function, the explicit equation of the SDM for a solar cell can be written as [4]
Similarly, the explicit equation of the SDM for a PV module can be expressed as [4]
2.3. Double-Diode Models (DDMs) of Solar Cells and PV Modules
The double-diode model (DDM) of a solar cell consists of a constant current source, diode 1, diode 2, parallel resistance, and series resistance, as shown in Figure 3. The DDM equation of a solar cell can be expressed by [38]
where the physical meanings of I, Iph, V, Rs, Rsh, q, k, and T are the same as above. I01 and I02 are the reverse saturation currents of diode 1 (D1) and diode 2 (D2), and n1 and n2 are the ideal factors of D1 and D2, respectively. Compared with the SDM, the DDM separates the recombination that occurred in the space charge region from those that occurred in the bulk region of a solar cell. Consequently, the DDM can fit the measured I-V characteristic curve of a solar cell with higher accuracy, and each parameter has a more specific physical meaning.
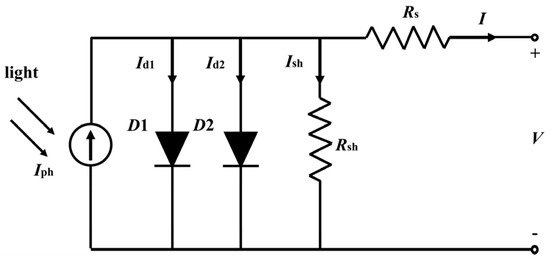
Figure 3.
Equivalent circuit of the double-diode model (DDM) for a solar cell.
Assuming that all the solar cells in a PV module have the same DDM parameters, namely Iph, I01, I02, n1, n2, Rs, and Rsh, the DDM equation of a PV module can be written as [38]
where the physical meaning of each parameter is the same as above. The equivalent circuit of the DDM for a PV module is shown in Figure 4.
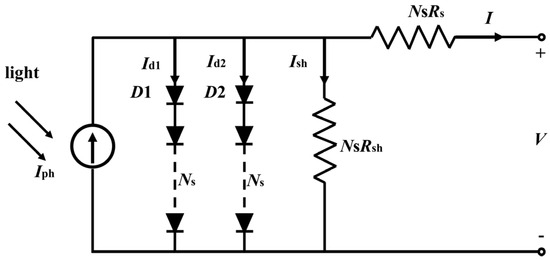
Figure 4.
Equivalent circuit of the double-diode model (DDM) for a PV module.
2.4. Explicit Equations of the Double-Diode Models (DDMs) for Solar Cells and PV Modules
Gao et al. strictly derived the exact explicit equation based on the Lambert W function from the implicit equation of the DDM for a solar cell [37]
where
Similarly, the explicit equation of the DDM for a PV module can be expressed as
where
2.5. Newton–Raphson Method
The Newton–Raphson (NR) method is a numerical calculation method that can solve the nonlinear equation by computer iteration. The recursive formula used is:
Figure 5 shows the geometric meaning of Equation (15). It can be seen from Figure 5 that the is determined by the intersection point () of the tangent l at the point () of the curve of the function and the x-axis (y = 0). By continuously drawing a tangent on the curve of function , the x can rapidly approach the root () of the nonlinear equation . To solve the root of the nonlinear equation by using the NR method, one needs to input the initial value and the accuracy threshold . When or , the computer program will exit the loop, and is regarded as the numerical solution of the nonlinear equation . For the NR method, the setting of the initial value is crucial for quickly finding the root of the nonlinear equation .
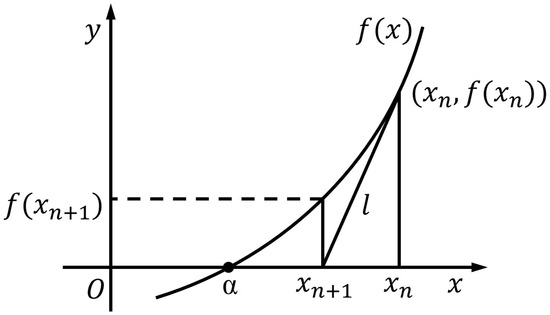
Figure 5.
Schematic diagram of convergence of the Newton–Raphson iteration.
2.6. Objective Function
In the study of PV-model parameter extraction by using the metaheuristic method, people usually use the RMSE (root mean square error) as the objective function of a metaheuristic algorithm to find a set of optimum PV-model parameters with the minimum RMSE value. Here, the RMSE represents the deviation of the simulated I-V characteristic curve determined by the PV-model parameters from the measured I-V characteristic curve. It can be expressed as
where N is the number of measured I-V data points, is the measured current value of the i-th data point, and is the simulation current value of the i-th data point. The parameter-extraction process is to search for a vector X composed of a set of PV-model parameters by a metaheuristic algorithm within a given range to minimize the value of the RMSE.
2.7. Three Methods for Calculating the Simulation Current of a Solar Cell or a PV Module
In the literature, researchers usually use the following three methods to calculate the simulation current (Isim) of solar cells or PV modules.
2.7.1. Approximation Method
As pointed out by Ćalasan et al. [5] in 2020, most of the previous researchers who combined metaheuristic algorithms and the implicit equations of PV models to extract the PV-model parameters did not use the correct equation to calculate the Isim, and thus the RMSE. Specifically speaking, they used the pseudo-PV-model equation and measured current (Imeas) to calculate Isim, and thus the RMSE, wherein the pseudo-PV-model equation was established by replacing I on the left side of the implicit equation of the PV model with Isim and substituting I on the right side of the implicit equation with Imeas. Obviously, the pseudo-PV-model equation only holds when Isim = Imeas. However, the condition that Isim = Imeas does not hold in most cases. Even in 2023, there are still some researchers who used this incorrect method to calculate Isim, and thus the RMSE [8,9,10,11]. As Isim and the RMSE are not accurately calculated by this method, it will be named the “approximation method” in this paper. It should be mentioned that the approximation method named by us was given different names by previous researchers: it was called the “DirectSolve method” in reference [6], named the “SDM method” in reference [29], called the “second objective function (obj2)” in reference [30], and referred to as “Method 1 (M-1)” in reference [31].
For the SDM of solar cells, the pseudo-PV-model equation for calculating Isim is:
For the SDM of PV modules, the pseudo-PV-model equation for calculating Isim is:
For the DDM of solar cells, the pseudo-PV-model equation for calculating Isim is:
For the DDM of PV modules, the pseudo-PV-model equation for calculating Isim is:
Obviously, Equations (17)–(20) are obtained from Equations (1), (2), (5), and (6) by substituting I with Isim and Imeas. With the help of the above pseudo-PV-model equations, Isim can be easily calculated from Imeas.
2.7.2. LW Method
The exact explicit equations based on the Lambert W function have been strictly derived from the implicit equations of the PV models of a solar cell or a PV module. For the SDM, the Isim of a solar cell or a PV module can be precisely calculated by the measured voltage (Vmeas) and Equations (3) or (4). For the DDM, the Isim of a solar cell or a PV module can be accurately estimated by using the Vmeas and Equations (7) or (11).
2.7.3. NR Method
For the SDM of a solar cell, Equation (1) can be written in the form of , where
Taking the derivative on both sides of Equation (21) with respect to I, we have
Substituting Equations (21) and (22) into Equation (15) yields the recursive formula for calculating the Isim of the SDM of a solar cell.
For the SDM of a PV module, Equation (2) can be written in the form of , where
Taking the derivative of I on both sides of Equation (23) yields
Substituting Equations (23) and (24) into Equation (15) gives the recursive formula for calculating the Isim of the SDM of a PV module.
For the DDM of a solar cell, Equation (5) can be written in the form of , where
Taking the derivative of I on both sides of Equation (25) yields
Introducing Equations (25) and (26) into Equation (15) gives the recursive formula for estimating the Isim of the DDM of a solar cell.
For the DDM of a PV module, Equation (6) can be written in the form of , where
Taking the derivative of I on both sides of Equation (27) yields
Substituting Equations (27) and (28) into Equation (15) yields the recursive formula for calculating the Isim of the DDM of a PV module.
2.8. PV-Model Parameter-Extraction Process by Combining a Metaheuristic Algorithm with a Simulation Current Calculation Method
Taking the NR method as an example, Figure 6 shows the flowchart of PV-model parameter extraction by combining a metaheuristic algorithm with a simulation current calculation method. As shown in Figure 6, first input the parameters and data required by the metaheuristic algorithm for PV-model parameter extraction. The metaheuristic algorithm randomly generates a set of PV-model parameters for the solar cell or the PV module within the given range, and then, send the parameters and data to the NR program. The NR program solves the Isim through iteration under the given PV-model parameters and measured I-V data. When or (the accuracy threshold ε was set to be 10−6 A in this article), the program outputs the current as the Isim to the main program. Calculate the RMSE value under the given PV-model parameters by the main program. Judge if the maximum iteration number is met. If so, output the minimum RMSE value and the corresponding PV-model parameters. If not, the metaheuristic algorithm will generate the next generation of PV-model parameters according to the relevant strategy. Send the updated PV-model parameters to the NR program to calculate the Isim, ……, and repeat this process until the maximum iteration number is reached. Then, output the minimum RMSE value and the corresponding PV-model parameters. It should be mentioned that, when the NR method is used for solving the Isim, the initial current I0 is set to be equal to the Imeas. Since the Imeas (the initial value) is close to the Isim (the final solution), the NR method can obtain the exact solution of Isim through a small number of iterations (the maximum iteration number of the NR method was set to be 100 in this article).
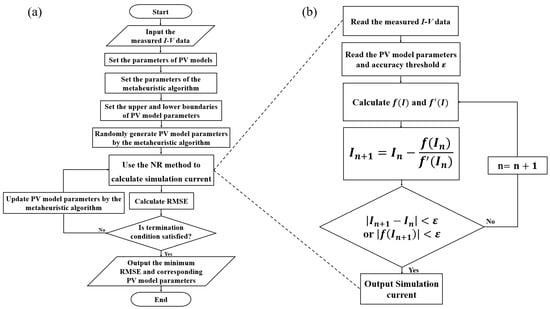
Figure 6.
(a) The flowchart of PV-model parameter extraction by combining a metaheuristic algorithm with the Newton–Raphson method. (b) The flowchart of the Newton–Raphson method for solving simulation current.
3. Results and Discussion
In order to investigate the effect of different simulation current calculation methods on the parameter-extraction performance, we used five of the latest and state-of-art metaheuristic algorithms, combining the three simulation current calculation methods to extract the PV-model parameters of the French RTC solar cell and the Photowatt PWP 201 PV module [12], and comprehensively compared the parameter-extraction accuracy, robustness, average running time and convergence curve. It should be mentioned that the I-V characteristic data of the French RTC solar cell was measured at 33 °C and 1000 W/m2, while that of the PWP 201 PV module composed of 36 pieces of solar cells connected in series was measured at 45 °C and 1000 W/m2 [12]. Moreover, the selected five metaheuristic algorithms are the AEO, GBO, GNDO, BO, and RTH algorithms. Notably, for the SDM parameter extraction, the three simulation current calculation methods (i.e., the approximation method, LW method, and NR method) were used. However, for the DDM parameter extraction, only the approximation method and the NR method were used.
Table 1 presents the search ranges of the PV-model parameters used in this article. The SDM parameter boundaries of the French RTC solar cell and PWP 201 PV module came from reference [16], while the DDM parameter boundaries were set by referring to the literature [39,40]. Table 2 shows the parameter values adopted by the five metaheuristic algorithms. For each algorithm, the population size was set to be 50. The maximum iteration number was set as 1000 for SDM parameter extraction and 3000 for DDM parameter extraction. In order to evaluate the robustness of the different methods, each parameter-extraction method was executed 30 times independently. All the parameter-extraction methods were run on the MATLAB R2022a platform by using a personal computer (Intel Core i7-12700H CPU@2.10GHz, 16.0GB RAM, with the Windows 10 64-bit OS).

Table 1.
The upper and lower boundaries of the PV-model parameters used in this article.

Table 2.
The parameter settings used by the five metaheuristic algorithms.
3.1. The SDM Parameter-Extraction Results Obtained from the Solar Cell and the PV Module
Table 3 presents SDM parameter-extraction results obtained from the French RTC solar cell by combining the five algorithms with the three simulation current calculation methods. As shown in Table 3, for each simulation current calculation method, all five algorithms yield the same SDM parameters and RMSE values, which indicates that the selected five algorithms have similar global optimum search capabilities. Independent of the metaheuristic algorithms, the SDM parameters (Iph, I0, Rs, Rsh, and n) obtained by the approximation method, the LW method, and the NR method are (0.76078 A, 0.32302 μA, 0.03638 Ω, 53.71852 Ω, and 1.48118), (0.76079 A, 0.31068 μA, 0.03655 Ω, 52.88979 Ω, and 1.47727), and (0.76079 A, 0.31069 μA, 0.03655 Ω, 52.88991 Ω, and 1.47727), respectively. Moreover, the corresponding RMSEs are 9.86022 × 10⁻⁴, 7.73006 × 10⁻⁴, and 7.72986 × 10⁻⁴. Obviously, the parameter-extraction accuracy of the NR method is slightly higher than that of the LW method and markedly higher than that of the approximation method. Figure 7 compares the measured and simulated I-V and P-V characteristics of the French RTC solar cell. It can be seen from Figure 7 that the simulation results obtained by different parameter-extraction methods are all in good agreement with the measured results. Taking the GNDO algorithm as an example, the Table S1 and Figure S1 present the measured and simulated I-V and P-V characteristic data and curves of the French RTC solar cell, respectively. Figure 8 shows the distribution of absolute error between the measured and simulated I-V and P-V characteristic curves of the French RTC solar cell. As shown in Figure 8, for each simulation current calculation method, the five algorithms yield similar absolute-error distributions for both the I-V and P-V characteristics. In other words, for the selected five algorithms, the absolute-error distributions are mainly influenced by the simulation current calculation methods. Notably, the absolute-error distribution curves obtained by the LW method and the NR method are almost overlapped. Furthermore, the three simulation current calculation methods show similar absolute-error distribution in a low voltage range (<0.5 V), while the approximation method exhibits a larger absolute error in a high voltage range (>0.5 V). Taking the GNDO algorithm as an example, the Tables S2 and S3 give the absolute-error and relative-error data between measured and simulated I-V and P-V characteristic curves of the French RTC solar cell, respectively. The Figure S2 further shows the absolute-error curves.

Table 3.
The SDM parameter-extraction results obtained from the French RTC solar cell by using different methods.
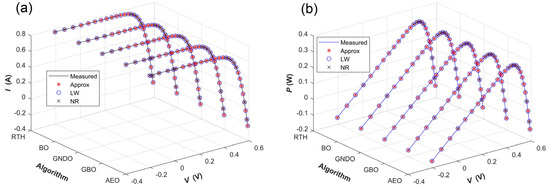
Figure 7.
Comparison between the measured and simulated characteristic curves of the French RTC solar cell, with the latter determined by the SDM parameters given by combining the five algorithms with the three simulation current calculation methods. (a) I-V characteristic curves; (b) P-V characteristic curves.
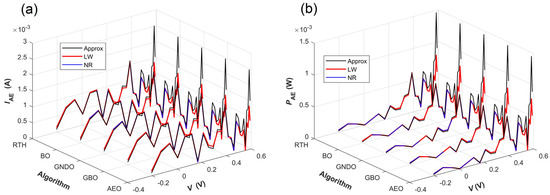
Figure 8.
The absolute errors between the measured and simulated characteristic curves of the French RTC solar cell, with the latter determined by the SDM parameters given by combining the five algorithms with the three simulation current calculation methods. (a) The absolute errors between the measured and simulated I-V characteristic curves; (b) the absolute errors between the measured and simulated P-V characteristic curves.
Table 4 presents the SDM parameter-extraction results obtained from the PWP 201 PV module by combining the five algorithms with the three simulation current calculation methods. As shown in Table 4, for each simulation current calculation method, all of the five algorithms obtain the same SDM parameters. The SDM parameters (Iph, I0, Rs, Rsh, and n) obtained by the approximation method, the LW method, and the NR method are (1.03051 A, 3.48226 μA. 0.03337 Ω, 27.27728 Ω, 1.35119), (1.03143 A, 2.63808 μA. 0.03432 Ω, 22.82337 Ω, 1.32217), and (1.03143 A, 2.63813 μA. 0.03432 Ω, 22.82332 Ω, 1.32218), respectively. The corresponding RMSEs are 2.42507 × 10⁻³, 2.05296 × 10⁻³, and 2.05297 × 10⁻³. Obviously, the LW method and the NR method almost achieve the same SDM parameter-extraction results. Furthermore, in terms of the parameter-extraction accuracy, the LW method ≈ NR method > approximation method. Figure 9 compares the measured and simulated I-V and P-V characteristic curves of the PWP 201 PV module. It can be seen from Figure 9 that all the simulated I-V and P-V curves perfectly pass through the corresponding measured data. Taking the GNDO algorithm as an example, the Table S4 and Figure S3 present the measured and simulated I-V and P-V characteristic data and curves of the PWP 201 PV module, respectively. Figure 10 shows the absolute error between the measured and simulated I-V and P-V characteristic curves. As shown in Figure 10, like the results obtained from the solar cell, the distributions of absolute errors are mainly influenced by the simulation current calculation methods. The LW method and the NR method almost have the same absolute-error distribution, with the absolute-error values markedly lower than those of the approximation method. Taking the GNDO algorithm as an example, the Tables S5 and S6 give the absolute-error and relative-error data between measured and simulated I-V and P-V characteristic curves of the PWP 201 PV module, respectively. The Figure S4 further shows the absolute-error curves.

Table 4.
The SDM parameter-extraction results obtained from the PWP 201 PV module by using different methods.
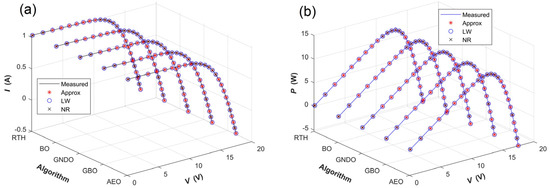
Figure 9.
Comparison between the measured and simulated characteristic curves of the PWP 201 PV module, with the latter determined by SDM parameters given by combining the five algorithms with the three simulation current calculation methods. (a) I-V characteristic curves; (b) P-V characteristic curves.
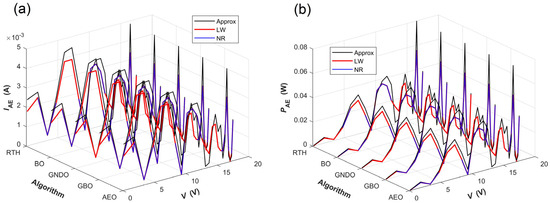
Figure 10.
The absolute errors between the measured and simulated characteristic curves of the PWP 201 PV module, with the latter determined by the SDM parameters given by combining the five algorithms with the three simulation current calculation methods. (a) The absolute errors between the measured and simulated I-V characteristic curves; (b) the absolute errors between the measured and simulated P-V characteristic curves.
Table 5 presents the statistical results of the RMSEs obtained from 30 times of SDM parameter extraction from the French RTC solar cell by combining the five algorithms with the three simulation current calculation methods, which include the minimum, mean, maximum, and standard deviation (STD) of the RMSEs (, where n = 30, and denotes the average value of RMSEs). It can be seen from Table 5 that the STD of the RMSEs obtained by the AEO algorithm is the highest, indicating that the robustness of the AEO algorithm is the worst among the five metaheuristic algorithms. For the selected algorithms excluding the AEO algorithm, the STDs of RMSEs achieved are better than 7.06695 × 10⁻¹¹, wherein the three RMSE values (minimum, mean, and maximum) are equal when they are rounded to five decimal places. Moreover, the RMSEs obtained by the approximation method, the LW method, and the NR method are 9.86022 × 10⁻⁴, 7.73006 × 10⁻⁴, and 7.72986 × 10⁻⁴, respectively.

Table 5.
The statistical results of RMSEs obtained from 30 times of SDM parameter extraction from the French RTC solar cell by using different methods.
Table 6 shows the statistical results of the RMSEs obtained from 30 times of SDM parameter extraction from the PWP 201 PV module by combining the five algorithms with the three simulation current calculation methods. It can be seen from Table 6 that the RTH algorithm nearly always shows the best robustness with the STD of the RMSEs better than 1.56402 × 10⁻¹⁶, while the AEO algorithm exhibits the worst robustness with the STD of RMSEs on the order of magnitude of 1 × 10⁻⁴. The RMSEs obtained by combining the RTH algorithm with the approximation method, the LW method, and the NR method are 2.42507 × 10⁻³, 2.05296 × 10⁻³, and 2.05297 × 10⁻³, respectively. For the selected metaheuristic algorithms excluding the AEO algorithm, the LW method and the NR method yield a better STD of the RMSEs than the approximation method. On the whole, the STDs of the RMSEs achieved on the PWP 201 PV module are inferior to those obtained on the French RTC solar cell for most of the algorithms. The above results demonstrate that the robustness of a parameter-extraction method is mainly determined by the metaheuristic algorithm, but it is also affected by the simulation current calculation method and parameter-extraction object.

Table 6.
The statistical results of RMSEs obtained from 30 times of SDM parameter extraction from the PWP 201 PV module by using different methods.
Table 7 shows the average running time for each run obtained from 30 times of SDM parameter extraction from the French RTC solar cell and the PWP 201 PV module by using different methods. As shown in Table 7, for the selected five algorithms and both parameter-extraction objects, in terms of average running time, the LW method > the NR method > the approximation method. For the three simulation current calculation methods and both parameter-extraction objects, GBO is basically the fastest algorithm, while RTH is the slowest algorithm, which is related to the computing burden of the algorithm.

Table 7.
The average running time of per run obtained from 30 times of SDM parameter extraction from the French RTC solar cell and the PWP 201 PV module by using different methods.
Figure 11 and Figure 12a–e show the convergence curves of the different methods obtained from 30 times of SDM parameter extraction from the French RTC solar cell and the PWP 201 PV module, respectively. It should be mentioned that, in each figure, the abscissa denotes the number of iterations, while the ordinate represents the average value of the RMSEs obtained from 30 times of parameter extraction. It can be seen from Figure 11 that, on the whole, the five algorithms achieve similar convergence curves on the French RTC solar cell. Specifically, for each algorithm, the convergence curves obtained by the LW and the NR methods almost overlap, and they can converge to the lower RMSE value than the one obtained by the approximation method. Similar to the convergence curves obtained on the solar cell, those obtained by the LW and the NR methods on the PV module for most algorithms, excluding RTH, nearly coincide with each other, and they can converge to the lower RMSE values than the ones obtained by the approximation method. However, the convergence speeds obtained on the PV module are slower than those obtained on the solar cell, especially for the approximation method, as shown in Figure 12.
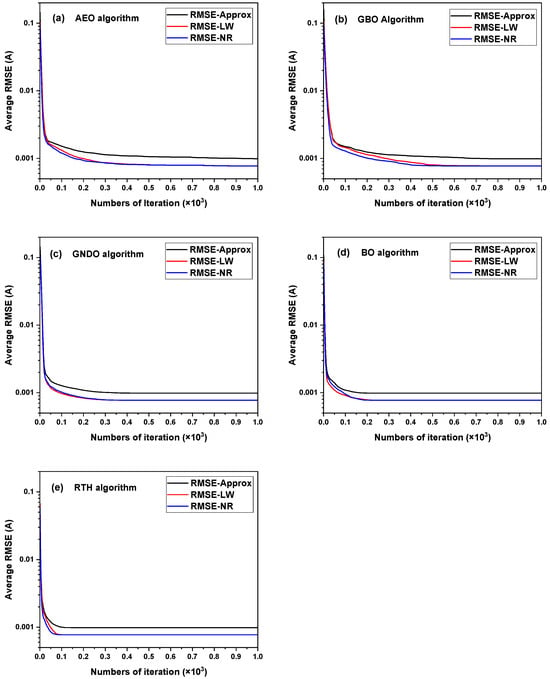
Figure 11.
Convergence curves obtained from 30 times of SDM parameter extraction from the French RTC solar cell by combining the five algorithms with the three simulation current calculation methods. (a) AEO; (b) GBO; (c) GNDO; (d) BO; and (e) RTH.
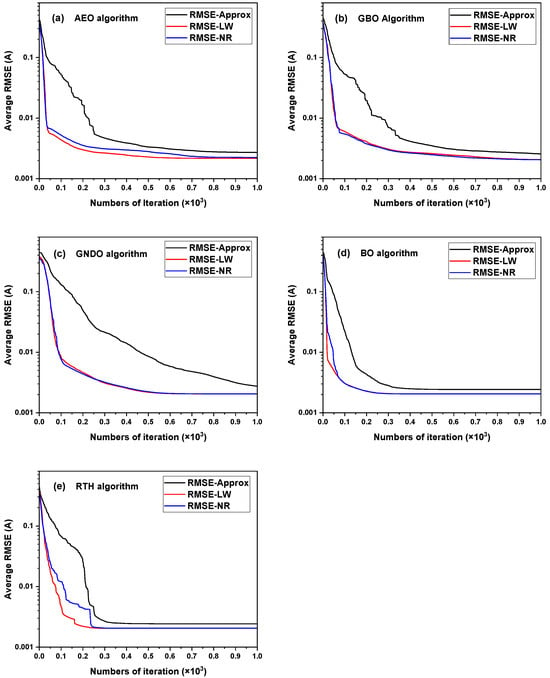
Figure 12.
Convergence curves obtained from 30 times of SDM parameter extraction from the PWP 201 PV module by combining the five algorithms with the three simulation current calculation methods. (a) AEO; (b) GBO; (c) GNDO; (d) BO; and (e) RTH.
3.2. The DDM Parameter-Extraction Results Obtained from the Solar Cell and the PV Module
Table 8 presents the DDM parameter-extraction results obtained from the French RTC solar cell by combining the five algorithms with the two simulation current calculation methods. As shown in Table 8, for each simulation current calculation method, the five algorithms yield consistent RMSE values and DDM parameters, except for I02 and Rsh, when they are retained to five decimal places. Specifically, the consistent Iph, I01, Rs, n1, n2, and RMSE values obtained by using the approximation method and the NR method are (0.76086 A, 0.25196 μA, 0.03694 Ω, 1.45741, 5 and 9.57663 × 10⁻⁴) and (0.76092 A, 0.20052 μA, 0.03764 Ω, 1.43590, 5 and 6.93709 × 10⁻⁴), respectively. In fact, there only exists a slight difference in the I02 and Rsh values obtained by using the different algorithms. This result further demonstrates that the five algorithms have similar global optimum search ability. Furthermore, we note that the parameter-extraction accuracy of the NR method is higher than that of the approximation method. Figure 13 presents the measured and simulated I-V and P-V characteristic curves of the French RTC solar cell, with the latter determined by using different methods. It can be seen from Figure 13 that, the simulated I-V and P-V characteristic curves determined by the different methods can fit the measured characteristic data fairly well. Taking the GNDO algorithm as an example, the Table S7 and Figure S5 present the measured and simulated I-V and P-V characteristic data and curves of the French RTC solar cell, respectively. Figure 14 compares the absolute error between the measured and the simulated I-V and P-V characteristic curves of the French RTC solar cell. As shown in Figure 14, for each simulation current calculation method, the five algorithms obtain similar absolute-error distributions for both the I-V and P-V characteristics. Furthermore, the NR method yields lower absolute errors than the approximation method for most data points. Taking the GNDO algorithm as an example, the Tables S8 and S9 give the absolute-error and relative-error data between measured and simulated I-V and P-V characteristic curves of the French RTC solar cell, respectively. The Figure S6 further shows the absolute-error curves.

Table 8.
The DDM parameter-extraction results obtained from the French RTC solar cell by using different methods.
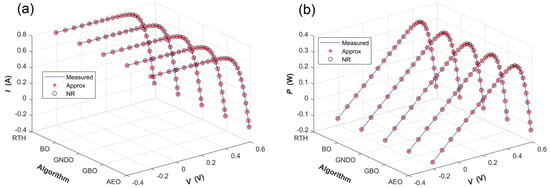
Figure 13.
The measured and simulated characteristic curves of the French RTC solar cell with the latter determined by the DDM parameters given by combining the five algorithms with the two simulation current calculation methods. (a) I-V characteristic curves; (b) P-V characteristic curves.
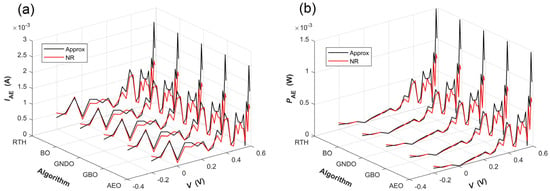
Figure 14.
The absolute errors between the measured and simulated characteristic curves of the French RTC solar cell, with the latter determined by DDM parameters given by combining the five algorithms with the two simulation current calculation methods. (a) The absolute errors between the measured and simulated I-V characteristic curves; (b) the absolute errors between the measured and simulated P-V characteristic curves.
Table 9 presents the DDM parameter-extraction results obtained from the PWP 201 PV module by combining the five algorithms with the two simulation current calculation methods. According to Table 9, regardless of which simulation current calculation method is used, the AEO algorithm always has the highest DDM parameter-extraction accuracy on the PV module. The RMSE values obtained by combining the AEO with the approximation method and the NR method are 2.37528 × 10⁻³ and 1.99051 × 10⁻³, respectively. In contrast, the GNDO algorithm always has the lowest DDM parameter-extraction accuracy on the PV module. The RMSE values obtained by combining the GNDO with the approximation method and the NR method are 2.42615 × 10⁻³ and 2.05371 × 10⁻³, respectively. In addition, regardless of which simulation current calculation method is used, the GNDO algorithm always yields the unreasonable result that I01 is equal to I02. The above results indicate that parameter-extraction accuracy is influenced by metaheuristic algorithms, parameter-extraction objects, and simulation current calculation methods. Furthermore, regardless of which metaheuristic algorithm is used, the parameter-extraction accuracy of the NR method is always higher than that of the approximation method. Figure 15 compares the measured and simulated I-V and P-V characteristic curves of the PV module with the latter determined by combining five algorithms with two simulation current calculation methods. As shown in Figure 15, all the simulated I-V and P-V characteristic curves perfectly pass through the measured data. Taking the AEO algorithm as an example, the Table S10 and Figure S7 present the measured and simulated I-V and P-V characteristic data and curves of the PV module, respectively. Figure 16 shows the absolute error between the measured and simulated I-V and P-V characteristic curves of the PV module. It can be seen from Figure 16 that, regardless of which simulation current calculation method is used, the five algorithms always obtain similar absolute-error distributions for both the I-V and P-V characteristics. Moreover, the absolute-error values obtained by the NR method are smaller than the ones achieved by the approximation method for most data points. Taking the AEO algorithm as an example, the Tables S11 and S12 give the absolute-error and relative-error data between measured and simulated I-V and P-V characteristic curves of the PV module, respectively. The Figure S8 further shows the absolute-error curves.

Table 9.
The DDM parameter-extraction results obtained from the PWP 201 PV module by using different methods.
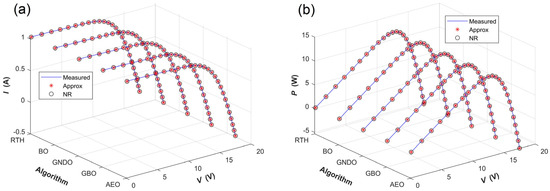
Figure 15.
Comparision between the measured and simulated characteristic curves of the PWP 201 PV module, with the latter determined by the DDM parameters given by combining the five algorithms with the two simulation current calculation methods. (a) I-V characteristic curves; (b) P-V characteristic curves.
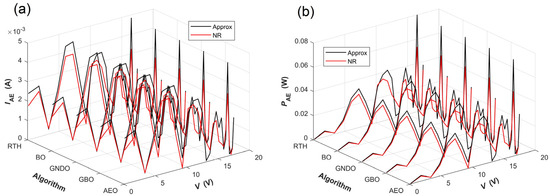
Figure 16.
The absolute errors between the measured and simulated characteristic curves of the PWP 201 PV module, with the latter determined by DDM parameters given by combining the five algorithms with the two simulation current calculation methods. (a) The absolute errors between the measured and simulated I-V characteristic curves; (b) the absolute errors between the measured and simulated P-V characteristic curves.
Table 10 presents the statistical results of the RMSEs obtained from 30 times of DDM parameter extraction from the French RTC solar cell by combining the five algorithms with the two simulation current calculation methods. It can be seen from Table 10 that, regardless of which algorithm is used, the minimum RMSE values attained by the approximation method and the NR method are 9.57663 × 10⁻⁴ and 6.93709 × 10⁻⁴, respectively. Furthermore, different algorithms obtain different statistical results for the RMSEs, excluding the minimum value. Moreover, regardless of which simulation current calculation method is used, the GNDO algorithm always yields the lowest STD of the RMSEs. Thus, it has the best robustness. The RTH algorithm always shows the highest STD of the RMSEs. Thus, it has the worst robustness. In addition, we note that the NR method improves the robustness of the AEO, GBO, and GNDO algorithms, but worsens the robustness of the BO and RTH algorithms.

Table 10.
The statistical results of the RMSEs obtained from 30 times of DDM parameter extraction from the French RTC solar cell by using different methods.
Table 11 presents the statistical results of the RMSEs obtained from, 30 times of DDM parameter extraction from the PWP 201 PV module by combining the five algorithms with the two simulation current calculation methods. It can be seen from Table 11 that different methods obtain different statistical results of RMSEs. Regardless of which simulation current calculation method is used, the GNDO algorithm has the best robustness but the worst parameter-extraction accuracy, while the AEO algorithm has the worst robustness but the best parameter-extraction accuracy. Moreover, the NR method improves the robustness of the GNDO and BO algorithms but worsens the robustness of the AEO, GBO, and RTH algorithms. Compared with the statistical results of the RMSEs obtained by the DDM parameter extraction from the solar cell, the accuracy of the DDM parameter extraction from the PV module decreases by one order of magnitude. However, the robustness of the different methods shows no clear trend.

Table 11.
The statistical results of the RMSEs obtained from 30 times of DDM parameter extraction from the PWP201 PV module by using different methods.
Table 12 shows the average running time for each run obtained from 30 times of DDM parameter extraction from the French RTC solar cell and the PWP 201 PV module by using different methods. As shown in Table 12, whether it is DDM parameter extraction from the solar cell or from the PV module, the average running time of the NR method is almost one order of magnitude higher than that of the approximation method for the five algorithms. Moreover, the average running time of the NR method on the solar cell is less than the one on the PV module. In addition, GBO is almost the fastest algorithm, while RTH is the slowest algorithm for both parameter-extraction objects and simulation current calculation methods.

Table 12.
The average running time per run obtained from 30 times of DDM parameter extraction from the French RTC solar cell and the PWP 201 PV module by using different methods.
Figure 17 and Figure 18a–e show the convergence curves of the different methods obtained from 30 times of DDM parameter extraction from the French RTC solar cell and the PWP 201 PV module, respectively. As shown in Figure 17 and Figure 18, whether it is DDM parameter extraction from the solar cell or from the PV module, the NR method can always converge to a lower RMSE value than the approximation method for the five algorithms. In addition, the BO algorithm has the fastest convergence speed, while the GBO algorithm has the slowest convergence speed for both parameter-extraction objects and simulation current calculation methods.
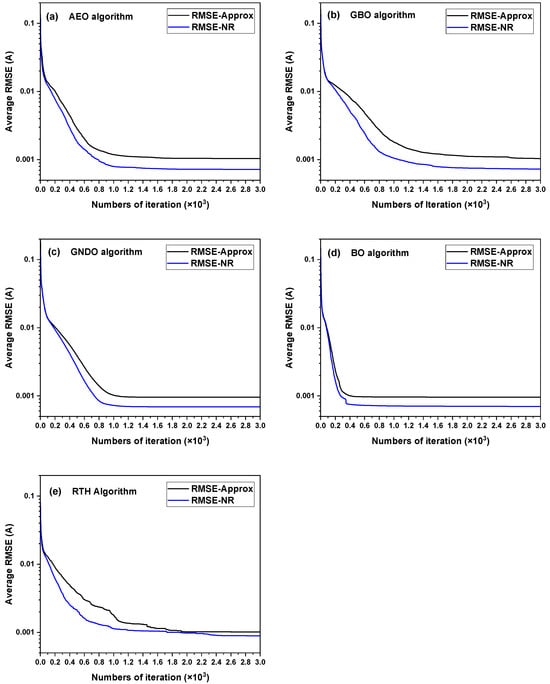
Figure 17.
Convergence curves obtained from 30 times of DDM parameter extraction from the French RTC solar cell by combining the five algorithms with the two simulation current calculation methods. (a) AEO; (b) GBO; (c) GNDO; (d) BO; and (e) RTH.
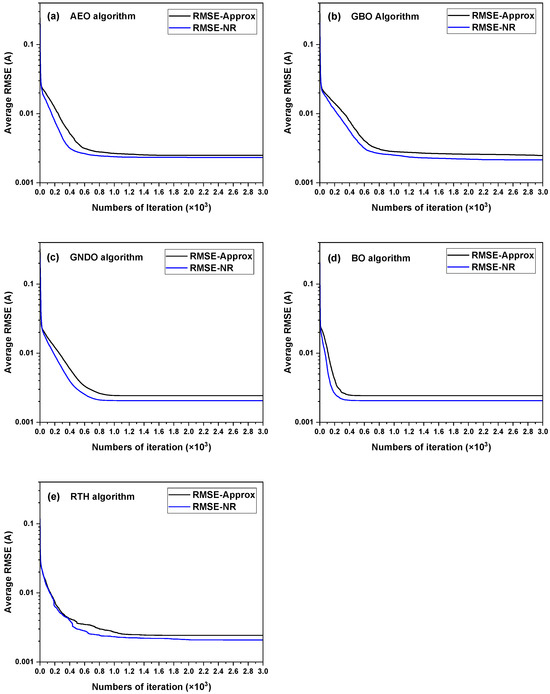
Figure 18.
Convergence curves obtained from 30 times of DDM parameter extraction from the PWP 201 PV module by combining the five algorithms with the two simulation current calculation methods. (a) AEO; (b) GBO; (c) GNDO; (d) BO; and (e) RTH.
3.3. Discussion
It should be mentioned that the RMSE values in Table 3, Table 4, Table 8 and Table 9 are the values of objective-function RMSE, which will be denoted as RMSEobj in the following. Since the RMSEobj values were obtained by using different simulation current calculation methods, they can not be compared with each other directly. In order to compare the parameter-extraction accuracy of different methods, one must estimate the RMSE values corresponding to the PV-model parameters obtained by the different methods on the same scale. For this reason, according to the extracted PV-model parameters (rounded to five decimal places) given in Table 3, Table 4, Table 8 and Table 9, we calculated the corresponding RMSE values by using the approximation method, the LW method, and the NR method, and named them RMSEapprox., RMSELW, and RMSENR, respectively. The results are shown in Table 13, Table 14, Table 15 and Table 16. It can be seen from Table 13, Table 14, Table 15 and Table 16 that, for SDM or DDM parameter extraction from both the solar cell and the PV module, the approximation method has the highest parameter-extraction accuracy if the RMSE calculated by the approximation method (RMSEapprox) is used as the evaluation criterion. Obviously, this incorrect conclusion results from incorrect calculation of the simulation current and RMSE by the approximation method. In contrast, for all the cases we studied, RMSELW values are always approximately equal to the RMSENR values, confirming that the LW and the NR methods are both accurate methods for calculating simulation current and RMSEs. Furthermore, it also indirectly proves the correctness of the Lambert W function based DDM explicit equation proposed by Gao et al. [37]. Moreover, the slight difference between the RMSELW and RMSENR can be attributed to the difference in settings of the iteration numbers and accuracy threshold used in the numerical calculation. If the correct RMSE value (RMSELW or RMSENR) is used as the evaluation criterion, it will lead to the correct conclusion that the parameter-extraction accuracy of the NR method is approximately equal to that of the LW method and higher than that of the approximation method.

Table 13.
The objective-function values (RMSEobj) obtained by different methods on the French RTC solar cell, as well as the RMSE values (RMSEapprox, RMSELW, and RMSENR) calculated by using the extracted SDM parameters rounded to 5 decimal places, and the three simulation current calculation methods.

Table 14.
The objective-function values (RMSEobj) obtained by different methods on the PWP 201 PV module, as well as the RMSE values (RMSEapprox, RMSELW, and RMSENR) calculated by using the extracted SDM parameters rounded to 5 decimal places and the three simulation current calculation methods.

Table 15.
The objective-function values (RMSEobj) obtained by different methods on the French RTC solar cell, as well as the RMSE values (RMSEapprox, RMSELW, and RMSENR) calculated by using the extracted DDM parameters rounded to 5 decimal places, and the three simulation current calculation methods.

Table 16.
The objective-function values (RMSEobj) obtained by different methods on the PWP 201 PV module, as well as the RMSE values (RMSEapprox, RMSELW, and RMSENR) calculated by using the extracted DDM parameters rounded to 5 decimal places, and the three simulation current calculation methods.
In the following, we will compare our results with previous reports. As far as SDM parameter extraction is concerned, because we used the same parameter boundaries as previous researchers, our parameter-extraction results should be consistent with the previous reports. The SDM parameters (Iph, I0, Rs, Rsh, and n) obtained from the French RTC solar cell by using the approximation method, the LW method, and the NR method are (0.76078 A, 0.32302 μA, 0.03638 Ω, 53.71852 Ω, and 1.48118), (0.76079 A, 0.31068 μA, 0.03655 Ω, 52.88979 Ω, and 1.47727), and (0.76079 A, 0.31069 μA, 0.03655 Ω, 52.88991 Ω, and 1.47727), respectively. The corresponding RMSE values are 9.86022 × 10⁻⁴, 7.73006 × 10⁻⁴, and 7.72986 × 10⁻⁴. These results are in good agreement with references [6,7,17,20,29,39,40,41,42,43,44,45,46,47,48]. Furthermore, the SDM parameters (Iph, I0, Rs, Rsh, and n) attained from the PWP 201 PV module by using the approximation method, the LW method, and the NR method are (1.03051 A, 3.48226 μA, 0.03337 Ω, 27.27728 Ω, and 1.35119), (1.03143 A, 2.63808 μA, 0.03432 Ω, 22.82337 Ω, and 1.32217), and (1.03143 A, 2.63813 μA, 0.03432 Ω, 22.82332 Ω, and 1.32218), respectively. The corresponding RMSE values are 2.42507 × 10⁻³, 2.05296 × 10⁻³, and 2.05297 × 10⁻³. These results are in good accordance with references [41,42,45,46,49]. Moreover, if , , and are considered as the series resistance, parallel resistance, and ideal factor of a PV module (see Equations (1) and (2)), our results are also consistent with references [17,20,29,39,40,43,44,47,50,51]. It should be mentioned that the SDM parameter-extraction results achieved by the LW method and the NR method are almost identical for both the solar cell and the PV module.
As far as DDM parameter extraction is concerned, since we used more reasonable parameter search ranges than previous researchers, our parameter-extraction results should be better than previous reports. This is indeed the case. The best RMSEs obtained from the French RTC solar cell by using the approximation method and the NR method are 9.57663 × 10⁻⁴ and 6.93709 × 10⁻⁴, respectively. In contrast, the best RMSEs achieved by using the approximation method and NR method (or LW method) in references [17,20,37,38,40,41,45,46,48] are 9.82485 × 10⁻⁴ and 7.42 × 10⁻⁴, respectively. Furthermore, the best RMSEs achieved from the PWP 201 PV module by using the approximation method and the NR method are 2.37528 × 10⁻³ and 1.99051 × 10⁻³, respectively. As a comparison, the corresponding RMSEs reported in the literature [40,47,49,50,51] are 2.4251 × 10⁻³ and 2.05 × 10⁻³. Clearly, a reasonable parameter search range improves the parameter-extraction accuracy. It should be noted that, as Kler et al. [39] used a similar DDM parameter search range to ours, they obtained an RMSE of 6.937 × 10⁻⁴ on the French RTC solar cell and an RMSE of 2.017 × 10⁻³ on the PWP 201 PV module by using the NR method, which are very close to ours.
In a word, whether it is SDM or DDM parameter extraction from the solar cell and the PV module, the NR method and the LW method almost obtain the same results. The reason is that they are both the accurate method for calculating the simulation current. Specifically, the LW method uses the Lambert W function-based explicit equations to calculate the simulation current, in which the explicit equations were strictly derived from the implicit equations and mathematically equivalent to the implicit equations. As a comparison, the NR method is a numerical calculation method that can accurately solve the implicit equations through computer iteration. With the five latest and state-of-art algorithms and two accurate simulation current calculation methods (the NR method and the LW method), we obtain an RMSE of 7.73006 × 10⁻⁴ on the French RTC solar cell and an RMSE of 2.05296 × 10⁻³ on the PWP201 PV module, which are consistent with the highest SDM parameter-extraction accuracies reported on the solar cell and the PV module. What is more important, by using most powerful algorithm, accurate simulation current calculation method, and a more reasonable DDM parameter search range, we obtain the highest parameter-extraction accuracy on the solar cell and the PV module so far, which is 6.93709 × 10⁻⁴ for the former and 1.99051 × 10⁻³ for the latter. It is worth noting that Hachana et al. [44] and Aoufi et al. [52] reported the super-low RMSEs of 6.33514 × 10⁻⁴ and 6.74513 × 10⁻⁴ on the French RTC solar cell, and the super-low RMSEs of 1.02826 × 10⁻³ and 1.39748 × 10⁻³ on the PWP 201 PV module, respectively. However, the explicit equations of the DDM model presented in their articles are incorrect. According to the DDM parameters reported by their articles, we calculated the correct RMSE values by using the NR method, which are 5.1 × 10⁻² and 7.9 × 10⁻² for the solar cell and 7.8 × 10⁻² and 8.5 × 10⁻² for the PV module, respectively. Obviously, their DDM parameter-extraction accuracies on the solar cell and the PV module are worse than ours.
According to Table 5, Table 6, Table 10 and Table 11, for the SDM and DDM parameter extraction from the French RTC solar cell and SDM parameter extraction from the PWP 201 PV module, the five algorithms obtained the same minimum RMSE, but a very different STD of RMSEs, which can differ by 14 orders of magnitude. For the DDM parameter extraction from the PWP 201 PV module, the five algorithms achieved similar minimum RMSEs, but a very different STD of the RMSEs, which may differ by 13 orders of magnitude. Furthermore, for all the cases we studied, the GNDO algorithm shows the highest robustness, with the STD of the RMSEs basically in the order of 10−17, while the AEO algorithm exhibits the worst robustness, with the STD generally in the order of 10−4–10−5. The above results show that the robustness of a parameter-extraction method is mainly determined by the metaheuristic algorithm. Compared with the approximation method, the accurate simulation current calculation method seems to improve the STD for SDM parameter extraction from the solar cell or the PV module. However, there is no such trend for the DDM parameter extraction from the solar cell or the PV module. Gude et al. [43] estimated the SDM parameters of the French RTC solar cell and the PWP 201 PV module by combining the MASCSO algorithm with the approximation method and the LW method, respectively. It was found that the LW method improves the robustness of parameter extraction compared with the approximation method, which is consistent with our results. In addition, reference [34] also reported that the GNDO algorithm has excellent robustness in extracting PV-model parameters compared with other metaheuristic algorithms, which is also in good accordance with our results.
According to Table 7 and Table 12, for all the cases we studied, the approximation method requires the least running time, followed by the NR method, and then the LW method. The result can be explained as follows. The LW method needs the most computation time just because the calculation of the simulation current by using the Lambert W function-based explicit equation would consume a lot of computation resources [31]. In contrast, the approximation method only involves a simple calculation by using the linear explicit equation, so it uses the least computation time. As the NR method solves the implicit transcendental equations by using computer iteration, it would use more computation time than the approximation method. However, because the NR method can obtain an accurate numerical solution with a small number of iterations, it would consume less computation time than the LW method. Nunes et al. [6] estimated the SDM parameters of the French RTC solar cell and the PWP 201 PV module by combining the GSK algorithm with the approximation method, the LW method, and the NR method, respectively. It was concluded that the LW method consumes less computation time than the NR method. This result is different from ours, which may be due to the different parameter settings of the NR method used by the author, such as iteration numbers, accuracy threshold, etc. In addition, for all the cases we studied, the GBO is almost the fastest algorithm, while the RTH is the slowest algorithm. This is related to the complexity and computing burden of the algorithm.
According to Figure 11, Figure 12, Figure 17 and Figure 18, whether it is SDM parameter extraction or DDM parameter extraction from the French RTC solar cell and the PWP 201 PV module, the convergence curves obtained by the accurate simulation current calculation method can converge faster and converge to lower RMSE values than the ones obtained by the approximation method. This result is consistent with references [29,41].
4. Conclusions
In this paper, the five latest and state-of-art metaheuristic algorithms were combined with the three simulation current calculation methods (i.e., the approximation method, the LW method, and the NR method) to extract the SDM and DDM parameters from the French RTC solar cell and the PWP 201 PV module, respectively. It was found that the parameter-extraction accuracy of the LW method is approximately equal to that of the NR method and markedly higher than that of the approximation method. Specifically, the best SDM parameter-extraction accuracies (RMSEs) obtained by the approximation method, the LW method, and the NR method are 9.86022 × 10⁻⁴, 7.73006 × 10⁻⁴ and 7.72986 × 10⁻⁴ for the solar cell and 2.42507 × 10⁻³, 2.05296 × 10⁻³, and 2.05297 × 10⁻³ for the PV module, respectively. As a comparison, the best DDM parameter-extraction accuracies (RMSEs) attained by the approximation method and the NR method are 9.57663 × 10⁻⁴ and 6.93709 × 10⁻⁴ for the solar cell and 2.37528 × 10⁻³ and 1.99051 × 10⁻³ for the PV module, respectively. To our knowledge, the RMSEs obtained by using the NR method on the solar cell and the PV module represent the highest parameter-extraction accuracy reported so far. Furthermore, the robustness of a parameter-extraction method is mainly determined by the metaheuristic algorithm, but it is also affected by the simulation current calculation method and the parameter extraction object. Moreover, the convergence curves of the LW method and the NR method almost overlap, and they can converge to a lower RMSE value than that of the approximation method. In short, the approximation method is not suitable for application in PV-model parameter extraction due to incorrect estimation of the simulation current and the RMSE. In contrast, both the LW method and the NR method are suitable for the application because of their accurate evaluation of the simulation current and the RMSE. In terms of saving computation resources and time, the NR method is better than the LW method.
Supplementary Materials
The following supporting information can be downloaded at: https://www.mdpi.com/article/10.3390/en17102284/s1, Table S1. The measured and simulated characteristic data of the French RTC solar cell with the latter determined by SDM parameters given by combining the GNDO algorithm with the three simulation current calculation methods. Table S2. The absolute errors between the measured and simulated characteristic curves of the French RTC solar cell with the latter determined by SDM parameters given by combining the GNDO algorithm with the three simulation current calculation methods. Table S3. The calculated relative current error and relative power error for each data point obtained by fitting the measured I-V characteristic curve of the French RTC solar cell with the SDM equation determined by combining the GNDO algorithm with three simulation current calculation methods. Table S4. The measured and simulated characteristic data of the PWP 201 PV module, with the latter determined by SDM parameters given by combining the GNDO algorithm with the three simulation current calculation methods. Table S5. The absolute errors between the measured and simulated characteristic curves of the PWP 201 PV module, with the latter determined by SDM parameters given by combining the GNDO algorithm with the three simulation current calculation methods. Table S6. The calculated relative current error and relative power error for each data point obtained by fitting the measured I-V characteristic curve of the PWP 201 PV module with the SDM equation determined by combining the GNDO algorithm with three simulation current calculation methods. Table S7. The measured and simulated characteristic data of the French RTC solar cell, with the latter determined by the DDM parameters given by combining the GNDO algorithm with the two simulation current calculation methods. Table S8. The absolute errors between the measured and simulated characteristic curves of the French RTC solar cell, with the latter determined by the DDM parameters given by combining the GNDO algorithm with the two simulation current calculation methods. Table S9. The calculated relative current error and relative power error for each data point obtained by fitting the measured I-V characteristic curve of the French RTC solar cell, with the DDM equation determined by combining the GNDO algorithm with two simulation current calculation methods. Table S10. The measured and simulated characteristic data of the PWP 201 PV module with the latter determined by the DDM parameters given by combining the AEO algorithm with the two simulation current calculation methods. Table S11. The absolute errors between the measured and simulated characteristic curves of the PWP 201 PV module with the latter determined by the DDM parameters given by combining the AEO algorithm with the two simulation current calculation methods. Table S12. The calculated relative current error and relative power error for each data point obtained by fitting the measured I-V characteristic curve of the PWP 201 PV module, with the DDM equation determined by combining the AEO algorithm with two simulation current calculation methods. Figure S1. Comparison between the measured and simulated characteristic curves of the French RTC solar cell, with the latter determined by the SDM parameters given by combining the GNDO algorithms with the three simulation current calculation methods. (a) I-V characteristic curves; (b) P-V characteristic curves. Figure S2. The absolute errors between the measured and simulated characteristic curves of the French RTC solar cell, with the latter determined by the SDM parameters given by combining the GNDO algorithm with the three simulation current calculation methods. (a) The absolute errors between the measured and simulated I-V characteristic curves; (b) the absolute errors between the measured and simulated P-V characteristic curves. Figure S3. Comparison between the measured and simulated characteristic curves of the PWP 201 PV module, with the latter determined by the SDM parameters given by combining the GNDO algorithm with the three simulation current calculation methods. (a) I-V characteristic curves; (b) P-V characteristic curves. Figure S4. The absolute errors between the measured and simulated characteristic curves of the PWP 201 PV module, with the latter determined by the SDM parameters given by combining the GNDO algorithm with the three simulation current calculation methods. (a) The absolute errors between the measured and simulated I-V characteristic curves; (b) the absolute errors between the measured and simulated P-V characteristic curves. Figure S5. The measured and simulated characteristic curves of the French RTC solar cell, with the latter determined by the DDM parameters given by combining the GNDO algorithm with the two simulation current calculation methods. (a) I-V characteristic curves; (b) P-V characteristic curves. Figure S6. The absolute errors between the measured and simulated characteristic curves of the French RTC solar cell, with the latter determined by the DDM parameters given by combining the GNDO algorithm with the two simulation current calculation methods. (a) The absolute errors between the measured and simulated I-V characteristic curves; (b) the absolute errors between the measured and simulated P-V characteristic curves. Figure S7. Comparison between the measured and simulated characteristic curves of the PWP 201 PV module, with the latter determined by the DDM parameters given by combining the AEO algorithm with the two simulation current calculation methods. (a) I-V characteristic curves; (b) P-V characteristic curves. Figure S8. The absolute errors between the measured and simulated characteristic curves of the PWP 201 PV module, with the latter determined by the DDM parameters given by combining the AEO algorithm with the two simulation current calculation methods. (a) The absolute errors between the measured and simulated I-V characteristic curves; (b) the absolute errors between the measured and simulated P-V characteristic curves.
Author Contributions
Conceptualization, C.Q. and B.A.; Methodology, C.Q. and B.A.; Software, C.Q., J.L., C.Y. and B.A.; Validation, C.Q., J.L. and C.Y.; Formal analysis, C.Q., J.L., C.Y., B.A. and Y.Z.; Investigation, C.Q., C.Y. and B.A.; Data curation, C.Q., J.L., C.Y. and B.A.; Writing—original draft, C.Q.; Writing—review & editing, C.Q., C.Y., B.A. and Y.Z.; Visualization, C.Q., J.L. and C.Y.; Supervision, B.A.; Project administration, B.A.; Funding acquisition, B.A. All authors have read and agreed to the published version of the manuscript.
Funding
This research was funded by the National Natural Science Foundation of China, grant number 61774171.
Data Availability Statement
The original contributions presented in the study are included in the article/Supplementary Materials, further inquiries can be directed to the corresponding authors.
Conflicts of Interest
The authors declare no conflict of interest.
References
- Abbassi, R.; Abbassi, A.; Jemli, M.; Chebbi, S. Identification of unknown parameters of solar cell models: A comprehensive overview of available approaches. Renew. Sust. Energ. Rev. 2018, 90, 453–474. [Google Scholar] [CrossRef]
- Younis, A.; Bakhit, A.; Onsa, M.; Hashim, M. A comprehensive and critical review of bio-inspired metaheuristic frameworks for extracting parameters of solar cell single and double diode models. Energy Rep. 2022, 8, 7085–7106. [Google Scholar] [CrossRef]
- Li, S.; Gong, W.; Gu, Q. A comprehensive survey on meta-heuristic algorithms for parameter extraction of photovoltaic models. Renew. Sust. Energ. Rev. 2021, 141, 110828. [Google Scholar] [CrossRef]
- Li, J.; Qin, C.; Yang, C.; Ai, B.; Zhou, Y. Extraction of single diode model parameters of solar cells and PV modules by combining an intelligent optimization algorithm with simplified explicit equation based on Lambert W function. Energies 2023, 16, 5425. [Google Scholar] [CrossRef]
- Ćalasan, M.; Abdel Aleem, S.H.E.; Zobaa, A.F. On the root mean square error (RMSE) calculation for parameter estimation of photovoltaic models: A novel exact analytical solution based on Lambert W function. Energy Conv. Manag. 2020, 210, 112716. [Google Scholar] [CrossRef]
- Nunes, H.; Pombo, J.; Mariano, S.; Do Rosario Calado, M. Newton-Raphson method versus Lambert W function for photovoltaic parameter estimation. In Proceedings of the 2022 IEEE International Conference on Environment and Electrical Engineering and 2022 IEEE Industrial and Commercial Power Systems Europe (EEEIC/I&CPS Europe), Prague, Czech Republic, 28 June–1 July 2022; pp. 1–6. [Google Scholar]
- Deotti, L.M.P.; Da Silva, I.C. A survey on the parameter extraction problem of the photovoltaic single diode model from a current–voltage curve. Sol. Energy 2023, 263, 111930. [Google Scholar] [CrossRef]
- Yu, X.; Zhou, J. A robust method based on reinforcement learning and differential evolution for the optimal photovoltaic parameter extraction. Appl. Soft Comput. 2023, 148, 110916. [Google Scholar] [CrossRef]
- Deng, L.; Liu, S. Incorporating Q-learning and gradient search scheme into JAYA algorithm for global optimization. Artif. Intell. Rev. 2023, 56, 3705–3748. [Google Scholar] [CrossRef]
- Yu, X.; Duan, Y.; Cai, Z. Sub-population improved grey wolf optimizer with Gaussian mutation and Lévy flight for parameters identification of photovoltaic models. Expert Syst. Appl. 2023, 232, 120827. [Google Scholar] [CrossRef]
- Abd El-Mageed, A.A.; Abohany, A.A.; Saad, H.M.H.; Sallam, K.M. Parameter extraction of solar photovoltaic models using queuing search optimization and differential evolution. Appl. Soft. Comput. 2023, 134, 110032. [Google Scholar] [CrossRef]
- Gong, W.; Cai, Z. Parameter extraction of solar cell models using repaired adaptive differential evolution. Sol. Energy 2013, 94, 209–220. [Google Scholar] [CrossRef]
- Askarzadeh, A.; Rezazadeh, A. Artificial bee swarm optimization algorithm for parameters identification of solar cell models. Appl. Energy 2013, 102, 943–949. [Google Scholar] [CrossRef]
- Yang, B.; Wang, J.; Zhang, X.; Yu, T.; Yao, W.; Shu, H.; Zeng, F.; Sun, L. Comprehensive overview of meta-heuristic algorithm applications on PV cell parameter identification. Energy Conv. Manag. 2020, 208, 112595. [Google Scholar] [CrossRef]
- Easwarakhanthan, T.; Bottin, J.; Bouhouch, I.; Boutrit, C. Nonlinear minimization algorithm for determining the solar cell parameters with microcomputers. Int. J. Sol. Energy 1986, 4, 1–12. [Google Scholar] [CrossRef]
- Li, S.; Gong, W.; Yan, X.; Hu, C.; Bai, D.; Wang, L. Parameter estimation of photovoltaic models with memetic adaptive differential evolution. Sol. Energy 2019, 190, 465–474. [Google Scholar] [CrossRef]
- Gu, Z.; Xiong, G.; Fu, X.; Mohamed, A.W.; Al-Betar, M.A.; Chen, H.; Chen, J. Extracting accurate parameters of photovoltaic cell models via elite learning adaptive differential evolution. Energy Conv. Manag. 2023, 285, 116994. [Google Scholar] [CrossRef]
- Navarro, M.A.; Oliva, D.; Ramos-Michel, A.; Haro, E.H. An analysis on the performance of metaheuristic algorithms for the estimation of parameters in solar cell models. Energy Conv. Manag. 2023, 276, 116523. [Google Scholar] [CrossRef]
- Lu, Y.; Liang, S.; Ouyang, H.; Li, S.; Wang, G. Hybrid multi-group stochastic cooperative particle swarm optimization algorithm and its application to the photovoltaic parameter identification problem. Energy Rep. 2023, 9, 4654–4681. [Google Scholar] [CrossRef]
- Gao, X.; Hou, Q.; Yao, S.; Zhou, K. Opposite normalized trust-region reflective (ONTRR): A new algorithm for parameter extraction of single, double and triple diode solar cell models. Appl. Sci. 2023, 13, 8199. [Google Scholar] [CrossRef]
- Wolf, M.; Noel, G.T.; Stirn, R.J. Investigation of the double exponential in the current-Voltage characteristics of silicon solar cells. IEEE Trans. Electron Devices 1977, 24, 419–428. [Google Scholar] [CrossRef]
- McIntosh, K.R.; Altermatt, P.P.; Heiser, G. Depletion-region recombination in silicon solar cells: When does m_DR = 2. In Proceedings of the 16th European Photovoltaic Solar Energy Conference and Exhibition, Glasgow, UK, 1–5 May 2000; pp. 250–253. [Google Scholar]
- Kaminski, A.; Marchand, J.J.; Fave, A.; Laugier, A. New method of parameters extraction from dark I-V curve. In Proceedings of the 26th IEEE Photovoltaic Specialists Conference, Anaheim, CA, USA, 30 September–3 October 1997; pp. 203–206. [Google Scholar]
- King, D.L.; Hansen, B.R.; Kratochvil, J.A.; Quintana, M.A. Dark current-voltage measurements on photovoltaic modules as a diagnostic or manufacturing tool. In Proceedings of the 26th IEEE Photovoltaic Specialists Conference, Anaheim, CA, USA, 30 September–3 October 1997; pp. 1125–1128. [Google Scholar]
- Kaminski, A.; Marchand, J.J.; Laugier, A. I–V methods to extract junction parameters with special emphasis on low series resistance. Solid-State Electron. 1999, 43, 741–745. [Google Scholar] [CrossRef]
- Basnyat, P.; Sopori, B.; Devayajanam, S.; Shet, S.; Binns, J.; Appel, J.; Ravindra, N.M. Experimental study to separate surface and bulk contributions of light-induced degradation in crystalline silicon solar cells. Emerg. Mater. Res. 2015, 4, 239–246. [Google Scholar] [CrossRef]
- Bai, Q.; Yang, H.; Cheng, X.; Wang, H. Recombination parameters of the diffusion region and depletion region for crystalline silicon solar cells under different injection levels. Appl. Sci. 2020, 10, 4887. [Google Scholar] [CrossRef]
- Sabadus, A.; Paulescu, M. On the nature of the one-diode solar cell model parameters. Energies 2021, 14, 3974. [Google Scholar] [CrossRef]
- Gao, X.; Cui, Y.; Hu, J.; Tahir, N.; Xu, G. Performance comparison of exponential, Lambert W function and Special Trans function based single diode solar cell models. Energy Conv. Manag. 2018, 171, 1822–1842. [Google Scholar] [CrossRef]
- Yousri, D.; Abd Elaziz, M.; Oliva, D.; Abualigah, L.; Al-qaness, M.A.A.; Ewees, A.A. Reliable applied objective for identifying simple and detailed photovoltaic models using modern metaheuristics: Comparative study. Energy Conv. Manag. 2020, 223, 113279. [Google Scholar] [CrossRef]
- Ayyarao, T.S.L.V.; Kishore, G.I. Parameter estimation of solar PV models with artificial humming bird optimization algorithm using various objective functions. Soft Comput. 2024, 28, 3371–3392. [Google Scholar] [CrossRef]
- Zhao, W.; Wang, L.; Zhang, Z. Artificial ecosystem-based optimization: A novel nature-inspired meta-heuristic algorithm. Neural Comput. Appl. 2020, 32, 9383–9425. [Google Scholar] [CrossRef]
- Ahmadianfar, I.; Bozorg-Haddad, O.; Chu, X. Gradient-based optimizer: A new metaheuristic optimization algorithm. Inf. Sci. 2020, 540, 131–159. [Google Scholar] [CrossRef]
- Zhang, Y.; Jin, Z.; Mirjalili, S. Generalized normal distribution optimization and its applications in parameter extraction of photovoltaic models. Energy Conv. Manag. 2020, 224, 113301. [Google Scholar] [CrossRef]
- Das, A.K.; Pratihar, D.K. Bonobo optimizer (BO): An intelligent heuristic with self-adjusting parameters over continuous spaces and its applications to engineering problems. Appl. Intell. 2022, 52, 2942–2974. [Google Scholar] [CrossRef]
- Ferahtia, S.; Houari, A.; Rezk, H.; Djerioui, A.; Machmoum, M.; Motahhir, S.; Ait-Ahmed, M. Red-tailed hawk algorithm for numerical optimization and real-world problems. Sci. Rep. 2023, 13, 12950. [Google Scholar] [CrossRef]
- Gao, X.; Cui, Y.; Hu, J.; Xu, G.; Yu, Y. Lambert W-function based exact representation for double diode model of solar cells: Comparison on fitness and parameter extraction. Energy Conv. Manag. 2016, 127, 443–460. [Google Scholar] [CrossRef]
- Çetinbaş, I.; Tamyurek, B.; Demirtaş, M. Parameter extraction of photovoltaic cells and modules by hybrid white shark optimizer and artificial rabbits optimization. Energy Conv. Manag. 2023, 296, 117621. [Google Scholar] [CrossRef]
- Kler, D.; Goswami, Y.; Rana, K.P.S.; Kumar, V. A novel approach to parameter estimation of photovoltaic systems using hybridized optimizer. Energy Conv. Manag. 2019, 187, 486–511. [Google Scholar] [CrossRef]
- Nunes, H.G.G.; Pombo, J.A.N.; Mariano, S.J.P.S.; Calado, M.R.A.; Felippe De Souza, J.A.M. A new high performance method for determining the parameters of PV cells and modules based on guaranteed convergence particle swarm optimization. Appl. Energy 2018, 211, 774–791. [Google Scholar] [CrossRef]
- Ayyarao, T.S.L.V.; Kumar, P.P. Parameter estimation of solar PV models with a new proposed war strategy optimization algorithm. Int. J. Energy Res. 2022, 46, 7215–7238. [Google Scholar] [CrossRef]
- Chin, V.J.; Salam, Z. Coyote optimization algorithm for the parameter extraction of photovoltaic cells. Sol. Energy 2019, 194, 656–670. [Google Scholar] [CrossRef]
- Gude, S.; Jana, K.C. A multiagent system based cuckoo search optimization for parameter identification of photovoltaic cell using Lambert W-function. Appl. Soft. Comput. 2022, 120, 108678. [Google Scholar] [CrossRef]
- Hachana, O.; Aoufi, B.; Tina, G.M.; Sid, M.A. Photovoltaic mono and bifacial module/string electrical model parameters identification and validation based on a new differential evolution bee colony optimizer. Energy Conv. Manag. 2021, 248, 114667. [Google Scholar] [CrossRef]
- Wang, D.; Sun, X.; Kang, H.; Shen, Y.; Chen, Q. Heterogeneous differential evolution algorithm for parameter estimation of solar photovoltaic models. Energy Rep. 2022, 8, 4724–4746. [Google Scholar] [CrossRef]
- Yu, Y.; Wang, K.; Zhang, T.; Wang, Y.; Peng, C.; Gao, S. A population diversity-controlled differential evolution for parameter estimation of solar photovoltaic models. Sustain. Energy Technol. Assess. 2022, 51, 101938. [Google Scholar] [CrossRef]
- Jordehi, A.R. Time varying acceleration coefficients particle swarm optimisation (TVACPSO): A new optimisation algorithm for estimating parameters of PV cells and modules. Energy Conv. Manag. 2016, 129, 262–274. [Google Scholar] [CrossRef]
- Jordehi, A.R. Enhanced leader particle swarm optimisation (ELPSO): An efficient algorithm for parameter estimation of photovoltaic (PV) cells and modules. Sol. Energy 2018, 159, 78–87. [Google Scholar] [CrossRef]
- El-Sehiemy, R.; Shaheen, A.; El-Fergany, A.; Ginidi, A. Electrical parameters extraction of PV modules using artificial hummingbird optimizer. Sci. Rep. 2023, 13, 9240. [Google Scholar] [CrossRef]
- Nunes, H.G.G.; Pombo, J.A.N.; Bento, P.M.R.; Mariano, S.J.P.S.; Calado, M.R.A. Collaborative swarm intelligence to estimate PV parameters. Energy Conv. Manag. 2019, 185, 866–890. [Google Scholar] [CrossRef]
- Nunes, H.G.G.; Silva, P.N.C.; Pombo, J.A.N.; Mariano, S.J.P.S.; Calado, M.R.A. Multiswarm spiral leader particle swarm optimisation algorithm for PV parameter identification. Energy Conv. Manag. 2020, 225, 113388. [Google Scholar] [CrossRef]
- Aoufi, B.; Hachana, O.; Sid, M.A.; Tina, G.M. NLBBODE optimizer for accurate and fast modeling of photovoltaic module/string generator and its application to solve real-world constrained optimization problems. Appl. Soft. Comput. 2023, 145, 110597. [Google Scholar] [CrossRef]
Disclaimer/Publisher’s Note: The statements, opinions and data contained in all publications are solely those of the individual author(s) and contributor(s) and not of MDPI and/or the editor(s). MDPI and/or the editor(s) disclaim responsibility for any injury to people or property resulting from any ideas, methods, instructions or products referred to in the content. |
© 2024 by the authors. Licensee MDPI, Basel, Switzerland. This article is an open access article distributed under the terms and conditions of the Creative Commons Attribution (CC BY) license (https://creativecommons.org/licenses/by/4.0/).