Article

Experimental Insights into the Fermentation of Pyro-Syngas to Ethanol in a Semi-Batch and Continuous Stirred Bioreactor with Mathematical Modelling and Optimization

by
Dinabandhu Manna
1,
Ranjana Chowdhury
1,†,
Rajnish K. Calay
2 and
Mohamad Y. Mustafa
2,*
1
Chemical Engineering Department, Jadavpur University, Kolkata 700032, India
2
Department of Building, Energy and Material Technology, UiT the Arctic University of Norway, Narvik Campus, 8514 Narvik, Norway
*
Author to whom correspondence should be addressed.
Research supervisor.
Energies 2024, 17(3), 562; https://doi.org/10.3390/en17030562
Submission received: 10 December 2023 / Revised: 15 January 2024 / Accepted: 21 January 2024 / Published: 24 January 2024
(This article belongs to the Special Issue New Trends in Biofuels and Bioenergy for Sustainable Development II)

Abstract

:
Syngas fermentation can play an important role in implementing the concept of biorefinery as it can serve as a platform to convert high-lignin biomass to biofuels. For the utilization of this process in commercial scale, the generation of an experimental database supported by a deterministic mathematical model and optimization is necessary. In this study, a locally isolated clostridial consortium, UACJUChE1, was used to convert pyro-syngas to ethanol and acetic acid. Mathematical models were developed and validated for a 3 L stirred and gas-sparged bioreactor operated in both semi-batch and continuous modes. The volumetric productivity of ethanol was correlated with the dilution rate and the gas residence time. The performance of the bioreactor, run in both semi-batch and continuous modes, was optimized using response surface methodology. For the semi-batch operation, a maximum ethanol concentration of 13.122 g/L after 30 h operation was achieved at optimum values of pyrolysis temperature, ratio of gas to liquid volume (VG/VL), and volumetric gas flow rate of 648 °C, 0.46, and 6.7 L/h respectively. For continuous operation, a maximum ethanol concentration of 29.450 g/L after 300 h is obtained at optimum values of VG/VL and ratio of gas to liquid volumetric flow rate of 0.28 and 335.148, respectively.

1. Introduction

The switching over from high-carbon to low-carbon fuels aids in the mitigation of CO2 emissions. To reach the current energy targets, the utilization of low-carbon renewable and sustainable biofuels derived from waste biomass can also serve the purpose of reducing CO2 emissions. In all countries, agro-waste represents the major waste biomass. Being an agricultural country, India produces a large quantity of agro-waste dominated by rice residues, like rice straw, rice husk, etc. [1]. According to recent literature, 165.8 Mt of rice straw is produced annually in India [2]. Although India still faces the pollution created by stubble burning, the generation of bioethanol from rice straw can amply reduce the problem of CO2 emissions. In an earlier publication by the present group, it was estimated that under the 2030–2031 benchmark, 11,165 million L of bioethanol can be produced with a potential of 6928 GWh energy with a reduction of 14,375 kt CO2 emissions. In that analysis, the generation of bioethanol through a sugar platform via the generation of fermentable sugars (glucose, xylose, arabinose, etc.) from rice straw through medium temperature hydrolytic pretreatment using dilute sulfuric acid was considered [3]. Rice straw has a lignin content as high as 17% and due to recalcitrance of lignin, the generation of bioethanol through a syngas platform seems more suitable for the utilization of all C-polymers including cellulose, hemicelluloses, and lignin in it [1,4].
Syngas fermentation is a hybrid process through which syngas, mainly constituting CO and H2, is generated from lignocellulosic biomass in the first step, and subsequently the gas is fermented to bioethanol in the second step. In most cases, syngas from biomass is produced through gasification [4,5]. As disclosed in the previous publication of the present group, pyrolysis of biomass generating pyro-char, pyro-oil, and pyro-gas is expected to play an important role in the development of hybrid processes combining thermochemical and biochemical processes [4]. As pyro-gas usually contains CO, H2, and CO2, it has the prospect of being used in a syngas platform of ethanol production. No such attempt has, however, been reported in the literature. In the case of high ash containing biomass like rice straw, solid waste is generated during gasification. Unlike gasification, the generation of pyro-gas does not generate any waste because pyro-char is used as fuel, as an adsorbent, and for soil amendment, and pyro-oil can be used as a liquid fuel after upgradation. Although usually pyro-oil is considered as the target product, recent research studies have also been reported with the focus on pyro-syngas generation [6,7,8,9,10].
In gasification, the biomass reacts with a sub-stoichiometric amount of oxygen, required for complete combustion. During syngas fermentation, while CO and CO2 act as carbon sources, CO and H2 act as electron donors [11]. Since most of the microorganisms suffer from toxicity of CO, only those capable of utilizing CO as a carbon source are suitable. Acetobacterium woodii and the clostridial strains, namely, C. ljungdahlii, C. aceticum, C. carboxidivorans, C. ragsdalei, C. autoethanogenum, C. thermoaceticum, etc. are usually employed. Although Diender et al. reported that mixed clostridial culture can produce ethanol, only a few studies are available in this regard [12]. The clostridial microorganisms are strictly anaerobic and hence oxygen is detrimental for their growth. Therefore, it is expected that pyro-gas can be a better substitute for syngas because the former never contains any oxygen unlike the latter which sometimes contains unconverted gasifying reactant, i.e., oxygen. Experimental data should be generated for pyro-syngas fermentation. In many cases, simulated gas mixtures are used for syngas fermentation. Investigations should be made using real syngas generated from thermochemical processes like gasification and pyrolysis. Although pure cultures are usually used, mixed culture can also be used for syngas fermentation. Very limited studies on the production of bioethanol through syngas fermentation using mixed culture were reported [11]. Some of the major challenges associated with syngas fermentation are the limitation of mass transfer of the substrates (CO + H2) from the gas phase to the liquid phase and inhibitory effects of CO on the fermentation process. Mathematical modelling is an important tool to analyze the behavior of syngas fermentation involving an array of parallel and series microbial reactions simultaneously with gas–liquid mass transfer. It is actually a critical task to develop a mathematical model, because both gas-to-liquid mass transfer and liquid-phase microbial kinetics play important roles in this process. Different models were reported for syngas fermentation. In a successful attempt, Siebler et al. synergistically combined a one-dimensional model with a computational fluid dynamics (CFD) model for syngas fermentation in a bubble reactor [13]. Chen et al. developed a mathematical model for a bubble reactor using C. ljungdahlii through metabolic modelling in which they considered growth on CO and H2 [14]. As per Vandecasteele, models were proposed for syngas fermentation by C. ljungdahlii using a mixture of CO, H2, and CO2 [15]. Most of the possible metabolic reactions were considered with their stoichiometric representations. They considered growth kinetics on CO following the Haldane equation, along with inhibition by acetic acid; growth on CO2 and H2 with the inhibition by CO and acetic acid; conversion of CO into ethanol incorporating inhibition by acetic acid; production of ethanol from CO2 and H2 including inhibition by CO and acetic acid; and direct conversion of acetic acid to ethanol through two reactions, one with the participation of CO and another with the participation of H2 [15]. Almeida Benalcázar et al. proposed a hybrid model consisting of a bio-thermodynamic black box model and fermenter hydrodynamics. They tested the model for a bubble bioreactor using (a) pure CO and (b) a mixture of CO2 and H2 [16]. Mohammadi et al. developed models for L. jungdahlii using growth kinetics on a CO and H2 mixture [17]. Very recently, Puiman et al. developed a scale-down model using a Euler–Lagrangean simulation to assess the fluctuations of gaseous components, CO, H2, etc. during the industrial-scale operation of syngas fermentation [18]. Elisa M. de Medeiros et al. developed a dynamic model using growth kinetics on CO and H2 and also dealt with optimization of the operation of a continuous stirred tank bioreactor [19]. A comprehensive model of a gas-fed stirred tank reactor was reported by Ruggiero et al. for the utilization of pure CO. They developed the model for Carboxidivorans and simulated gas was used as the substrate. Other than the production of ethanol from CO, they also considered direct production of ethanol from acetic acid. The inhibitory effects of both acetic acid and ethanol were considered [20].
The present article focuses on the biochemical conversion of pyro-syngas to ethanol using a mixed clostridial consortium, UACJUChE1, and a mathematical model was developed. To the best of our knowledge, both experimental studies and model development on pyro-syngas fermentation to produce ethanol were conducted for the first time. The article includes (1) an experimental study on the pyrolysis of Indian rice straw in the range of 400–700 °C along with the determination of the product yield and pyro-syngas composition; (2) the performance of a 3 L stirred tank gas-fed bioreactor in semi-batch and continuous modes of operation with mathematical modelling; and (4) the optimization of performance of the semi-batch and continuous bioreactors.

2. Materials and Methods

2.1. Chemical Composition of Rice Straw

The rice straw was collected from West Bengal, India. The rice straw samples (φ 4.5 mm × 140 mm) were shredded to a shorter size (Φ 4.5 mm × 10 mm). The moisture content of rice straw was 5.39%. The analysis of the lignocellulosic composition was carried out through National Renewable Energy Laboratory (NREL) protocol [21]. The composition is reported in Table 1 on a dry basis.

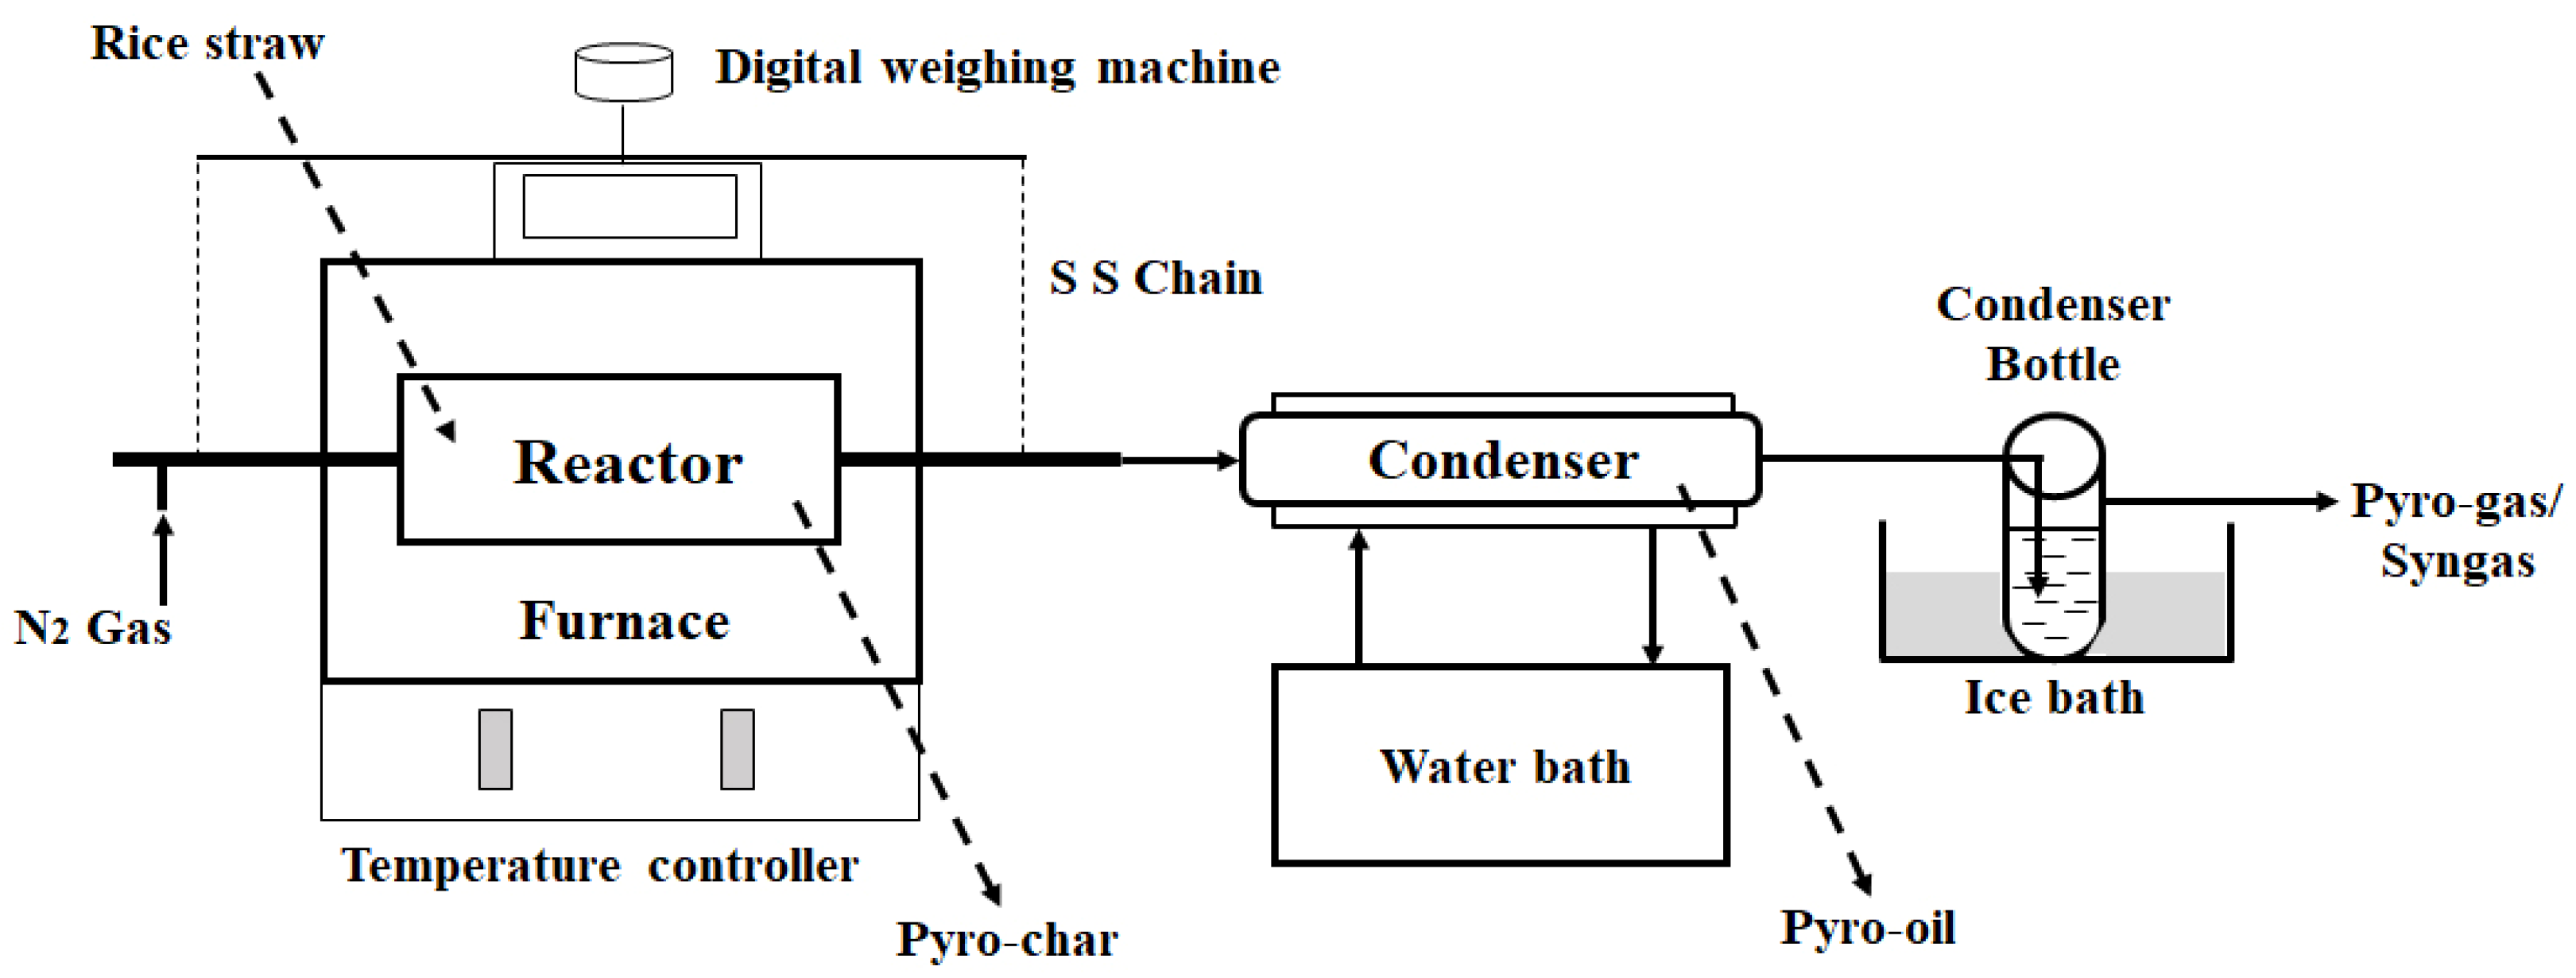
2.2. Pyrolysis of Rice Straw

The pyrolysis of rice straw was carried out in a semi-batch reactor (35 mm diameter and 210 mm long) under isothermal conditions at the temperatures of 400, 450, 500, 550, 600, 650, and 700 °C in an inert atmosphere maintained by nitrogen [22,23]. The reactor was equipped with a furnace, a temperature controller (PID controller), and a digital weight box. The rice straw was pyrolyzed at a rate of 10 g/h. To provide sufficient reaction time to convert the higher molecular weight volatile compounds to gaseous compounds, the nitrogen flow rate was maintained at a value of 2.5 g/h. For the recovery of pyro-oil, the volatile product from the pyrolizer was passed through a condenser using circulation of water at 20 °C. The non-condensable part of the volatile product constituted pyro-syngas. The solid product, pyro-char, was collected after atmospheric cooling of the pyrolizer. A schematic diagram of the pyrolizer is represented in Figure 1. The pyro-gas was analyzed using a GC. The GC (Thermo Scientific, Nashik, India TRACE1110) was equipped with Chromeleon 7 software and a thermal conductivity detector (TCD). The hydrogen, air, and nitrogen flow rates were set as 30, 300, and 30 mL/min, respectively. The oven and TCD detector temperatures were 40 and 250 °C, respectively. A TR-FAME (60 m × 0.22 mm × 0.25 µm) column was used.
The yield of the pyro-products namely, pyro-char, pyro-oil, and pyro-gas were determined using the following equations:
%   Y i e l d   o f   p y r o c h a r = m a s s   o f   p y r o c h a r   o b t a i n e d   f r o m   p y r o l y s i s m a s s   o f   b i o m a s s   f e d   t o   t h e   r e a c t o r × 100  
%   Y i e l d   o f   p y r o o i l = m a s s   o f   p y r o o i l   o b t a i n e d   f r o m   p y r o l y s i s m a s s   o f   b i o m a s s   f e d   t o   t h e   r e a c t o r × 100
%   Y i e l d   o f   p y r o g a s = 100 Y i e l d s   o f   p y r o c h a r + p y r o o i l

2.3. Pyro-Syngas Fermentation

2.3.1. Microorganism

A mixed clostridial consortium—UACJUChE1, isolated from local paddy fields in West Bengal, was used as inoculum [24].

2.3.2. Preparation of Modified Clostridial Medium for Growth

The modified clostridial medium was prepared according to ATCC (American Type Culture Collection) 1754 medium. Similar to the protocol followed by Vandecasteele, fructose, yeast extract, and sodium bicarbonate were excluded from the medium and a pH buffer, namely 2-(N-morpholino) ethanesulfonic acid (MES), was used [15]. The basal DSMZ 879 medium containing 1 g NH4Cl, 0.1 g KCl, 0.2 g MgSO4·7 H2O, 0.8 g NaCl, 0.1 g CaCl2·2 H2O, 100 mM MES, 10 mL reducing agent, 1 mL trace elements, and 1 mL Wolfe’s vitamin solution per liter was used. A total of 1 mg of resazurin (10 mg/L), an indicator of anaerobic conditions, was also added to 1 L basal medium. The pH of the medium was adjusted to 6 using 0.1 N NaOH. The basal medium thus prepared was transferred to sterile vessels (rubber sealed bottles/Erlenmeyer flasks/bioreactor) already degassed with nitrogen. The medium was further autoclaved and cooled to 37 °C. Gas (CO or simulated CO2-H2 mixture or simulated pyro-syngas, i.e., CO-CO2-H2-CH4-N2 mixture or pyro-syngas generated in the pyrolizer) transfer was undertaken to prepare modified clostridial medium as per the requirement of the experimental runs. Only CO or CO2 or CO and CO2, supplied either through pure gas (CO or CO2-H2 mixture or simulated CO-CO2-H2-CH4-N2 mixture) or from pyro-syngas, used according to experimental protocol, were the carbon source. Gas was transferred through flushing of the head space for 125 mL bottles and 250 mL conical flasks used for pre-adaptation as well as stock culture and batch reactions for the determination of growth kinetics, respectively. For the bioreactor, the gas was transferred through sparging.

2.3.3. Pre-Adaptation of UACJUChE1 to Simulated Pyro-Syngas and Maintenance of Stock Culture

According to the results of the analysis of the pyrolysis gas obtained in the temperature range of 400–700 °C, as provided in Section 4, it was observed that molar concentration (%) of CO, H2, CO2, and CH4 increases from 17.07%, 13.32%, 9.11%, and 7.19% to 23.08%, 17.23%, 10.59%, and 8.82%. In the present study the pyro-syngas, generated from the pyrolizer, was ultimately fermented in a 3 L bioreactor operated in semi-batch and continuous modes. Therefore, the UACJUChE1 consortium was exposed to a simulated pyro-syngas mixture containing CO, H2, CO2, CH4, and N2 (25:20:15:10:35) for pre-adaptation. The basal sterile medium, as described, of 25 mL volume was transferred to 10 sterile and sealed glass serum bottles of 125 mL each. The medium in each bottle was inoculated with 4% (v/v) UACJUChE1 culture and was subsequently flushed with the simulated pyro-syngas (CO:H2:CO2:CH4:N2::25:20:15:10:35) mixture to maintain a pressure of 100 kPa in the head space. All bottles were incubated at 37 °C in an anaerobic chamber and orbital shaking of 150 rpm was maintained. Anaerobic conditions were maintained by the flow of pure nitrogen. After adaptation, a weekly transfer of 4% (v/v) inoculum to new serum bottles was followed to retain the activity of the consortium.

2.3.4. Batch Experiments for Determination of Growth Kinetics of UACJUChE1

Separate sets of batch experiments were conducted for the determination of growth kinetics of UACJUChE1 on CO and on CO2 and H2.

Experiments for Growth Kinetics on CO

The basal sterile medium, as described, of 50 mL volume was transferred to a 250 mL sterile and sealed Erlenmeyer flask for each experiment. Batch experiments were conducted to know the effect of gas phase concentration of CO on the growth dynamics of UACJUChE1. Considering the concentration of CO in pyro-syngas, the inlet molar concentration of CO was varied in the range of 15–25%. For each inlet concentration of CO, the growth dynamics were studied for 24 h. To obtain the data at 2 h intervals, 12 Erlenmeyer flasks were used for each inlet molar concentration of CO of 15%, 17.5%, 20%, 22.5%, and 25%. In each flask, gas was transferred through flushing. All flasks were inoculated with 4% (v/v) stock culture before the introduction of gas. For each experiment, the initial pH was maintained at 6. Incubation was performed under anaerobic conditions at 37 °C and an orbital shaking speed of 150 rpm was maintained. All experiments were conducted in triplicate. For any experiment meant for each inlet CO concentration, the Erlenmeyer flasks, demarcated for the particular sampling period, were taken out of the incubator and the biomass concentration was determined by the assessment of optical density at 600 nm using a spectrophotometer.

Experiments for Growth Kinetics on CO2 and H2

The experimental protocol followed, in case of the determination of growth kinetics on CO2 and H2, was similar to that used for the growth kinetics on CO. Considering the concentration of CO2 and H2 in pyro-syngas, the inlet molar concentration of CO2 and H2 were kept in the ranges of 8–12% and 15–20%, respectively. Nine sets of batch experiments were conducted using the inlet gas composition of CO2:H2::8:15; CO2:H2::8:17.5; CO2:H2::8:20; CO2:H2::10:15; CO2:H2::10:17.5; CO2:H2::10:20; CO2:H2::12:15; CO2:H2::12:17.5; and CO2:H2::12:20. For each inlet composition of CO2–H2 mixture, the growth dynamics were studied for 24 h under anaerobic conditions. To obtain the data at 2 h intervals, 12 Erlenmeyer flasks were used. In each flask, gas was transferred through flushing. All experimental parameters like temperature, pH, stirring speed, etc. were kept the same as those maintained in case of growth on CO. The biomass concentration was determined by the assessment of optical density at 600 nm using a spectrophotometer.

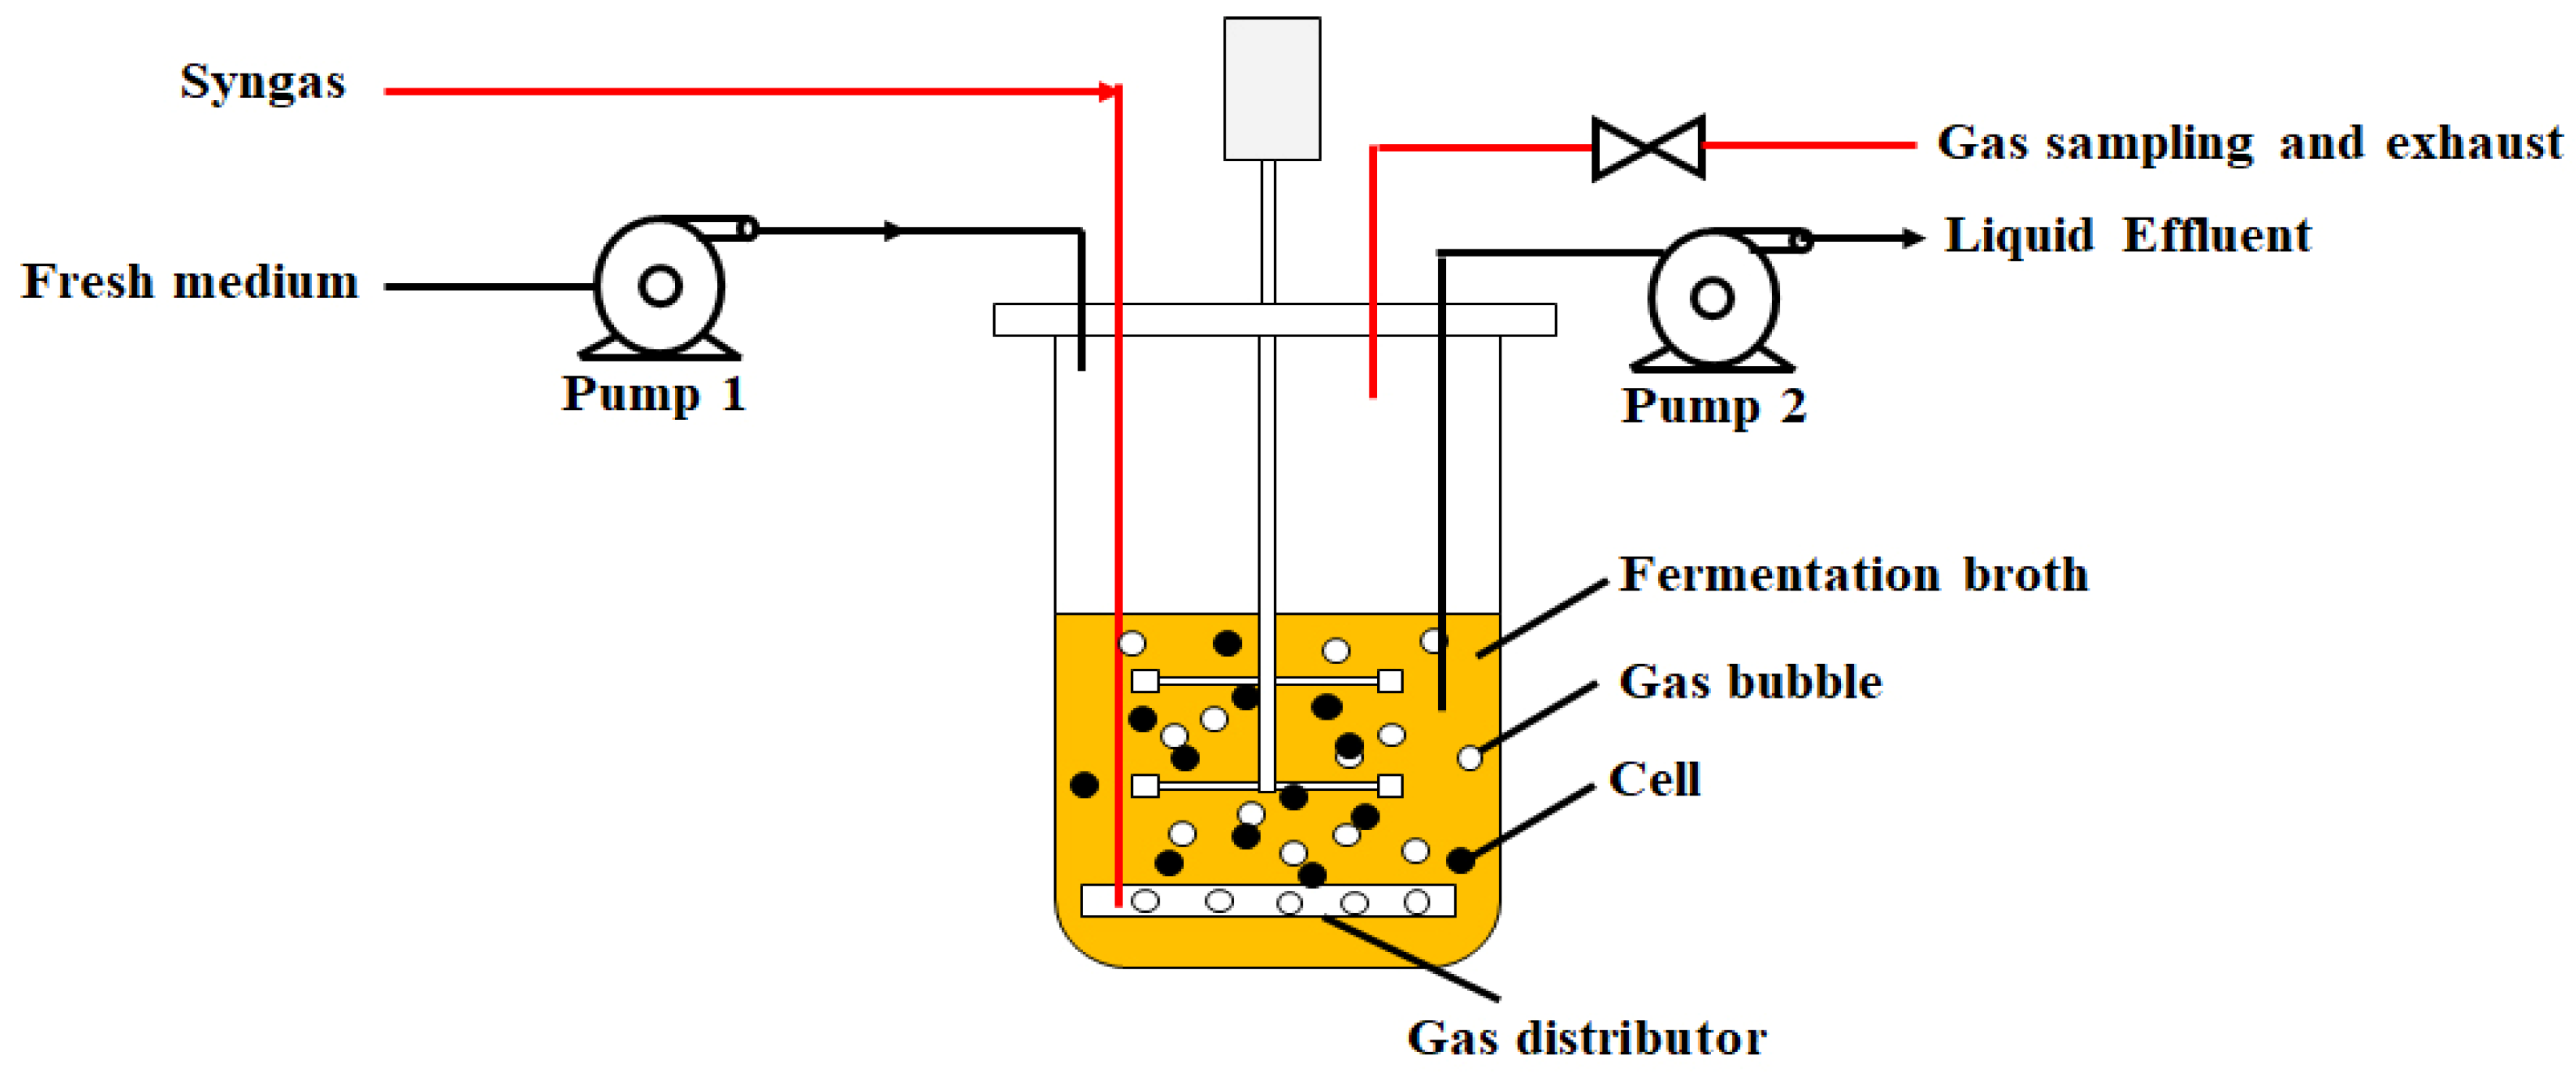
2.3.5. Stirred Tank Bioreactor for Pyro-Syngas Fermentation

Experiments were conducted in a 3 L glass bioreactor of 135 mm diameter and 235 mm height, equipped with two 50 mm Rushton gas dispersion impellers, each with six flat blades mounted vertically around a central horizontal disc and gas sparger. The impellers were spaced at a distance of 60 mm. The lower impeller was situated 30 mm above the bottom. The bioreactor was provided with inlet and outlet lines for both gas and liquid streams. The main gas sparger, connected with the gas outlet, was located in between the lower impeller and the bottom of the bioreactor. The bioreactor is schematically represented in Figure 2.

Determination of Effect of Stirring Speed and Gas Velocity on O2 Mass Transfer Coefficient

Experiments were conducted in the 3 L glass bioreactor at 37 °C. The bioreactor was filled with 2.5 L basal sterile medium, as described in Section 2.3.3. Experiments were conducted to determine the mass transfer coefficient of O2. Before flowing oxygen, the vessel was flushed with pure N2. The oxygen flow rate was varied from 0.6–10 LPM, and the stirring speed was varied from 150–900 rpm. All the experiments were conducted in triplicate. The correlation of K L a on gas phase superficial velocity, u s g , determined by dividing the volumetric flow rate of gas by the cross-sectional area of the vessel, and the power consumption of the gassed system per unit volume, P G / V L , as recommended by Gill et al., were validated from the experimental data. The correlation is as follows [25]:
k l a , O 2 = 0.224 ( P G V L ) 0.35 ( u s g ) 0.52
The correlation between the power consumption of gassed P G and ungassed ( P U G ) systems is as follows:
P G P U G = 0.497 Q N d i 3 0.38 N 2 d i 3 ρ σ 0.18
P U G = N P ρ N 3 d i 5
N P = Power   number ;   N = stirring   speed   rpm ;   ρ = density   of   solution ;   σ = surface   tension .
The value of the power number was considered to be 10 [25,26].
The value of k l a for any component, j, can be determined by knowing the value of k l a of oxygen as follows [14]:
k l a , j = k l a , O 2 D l , j D l O 2
Accordingly, the k l a values for CO, CO2, and H2 were determined.

Strategy of Operation of the Bioreactor in Semi-Batch and Continuous Modes

  • Start-up
For both continuous and semi-batch operations, 2.5 L of basal sterile medium was first saturated with pyro-syngas obtained at 700 °C by running the bioreactor vessel at a stirring speed of 900 rpm and an inlet gas flow rate of 0.6 L/h for 12 h. The medium, saturated with the pyro-syngas, was transferred to a storage tank and was fed to the bioreactor up to a desired liquid volume, as set by the experimental strategy, at the start-up.
  • Operation of the bioreactor
In the case of semi-batch operation, a continuous flow of gas was maintained at different volumetric flow rates. No input and output of the liquid phase was used. For the continuous mode of operation, both gas and liquid were fed and discharged at the respective same rates. While the semi-batch operation was continued for 30 h, the operation time for the continuous mode was 300 h. The concentration of ethanol was optimized through response surface methodology (RSM) using Design-Expert software (version 13). The experiments were conducted according to the design of the experiments. The operating parameters used for semi-batch and continuous operations are represented in Table 2 and Table 3. For semi-batch operation, the pyrolysis temperature, gas to liquid volume ratio (VG/VL), and volumetric flow rate of gas were used as parameters. The variation of the pyrolysis temperature is actually reflected in the composition of inlet gas. For the continuous operation, the pyro-syngas obtained at 700 °C was fed continuously using a gas to liquid volume ratio (VG/VL) and the ratio of gas to liquid volumetric flow rates (qG/qL) as parameters. According to the values of VG/VL, the bioreactor was filled with the required volume of sterile basal medium, already saturated with pyro-syngas, as described in Section 2.3.4, and was subsequently inoculated with 4% (v/v) stock culture. Considering the shear sensitivity of microorganisms, the stirring speed was maintained at 150 rpm. The sterile basal medium without any dissolved gas was fed during continuous operation. As a result of variation of these parameters, the dilution ratio, D (=qL/VL) and gas residence time, GRT (=VL/qG) were varied from 0.0106–0.0133 h−1 and 0.3–3.125 h, respectively. For both modes of operation, the concentrations of ethanol, and gas phase concentrations of CO, CO2, and H2 were measured using GC, and the acetic acid concentration was analyzed using HPLC. HPLC was performed to analyze the liquid sample, obtained from syngas fermentation. The HPLC (Waters 2489) of Waters, Singapore, consists of degasser, binary pump, auto-sampler, and UV–Vis detector. The analytical column was C18 (250 mm × 4.6 mm × 5 µm) of SunFire, Maynooth, Ireland.

3. Theoretical Analysis

3.1. Growth Kinetics

3.1.1. Kinetics of Growth on CO

As is evident from the literature, Haldane-type growth kinetics are usually followed by clostridial strains grown on CO as the carbon source [27]. Therefore, a Haldane-type growth model incorporating substrate inhibition along with inhibition of undissociated acetic acid, formed as a product, was attempted for the growth on CO. This is as follows:
μ 1 = μ 1 m a x C CO K CO + C CO + C CO 2 K I , CO K I , U A K I , U A + C U A
where, μ = specific   growth   rate = 1 C X d C X d t and C X   is   biomass   concentration .
μ 1 is specific growth rate on CO; μ 1 m a x is the maximum specific growth rate on CO; C C O   is   the   concentration   of   C O ;   K C O is the saturation constant for CO, and K I , C O is the inhibition constant for growth on CO; K I , U A is the inhibition constant of undissociated acetic acid; and C U A is the concentration of undissociated acetic acid.
C U A = C A A ( 1 10 p H p K a ( 10 p H p K a + 1 ) )
pH = 6.7; for acetic acid, pKa = 4.77 at 37 °C; C A A is the acetic acid concentration.
In this study μ 1 m a x was adjusted to fit the experimental growth data, obtained using different mole fraction of pure CO in the gas phase in the Erlenmeyer flasks, as described in the section titled “Experiments for Growth Kinetics on CO”. The other constants obtained by Vandecasteele for C. ljungdahlii were used [15].

3.1.2. Kinetics of Growth on CO2–H2 Mixture

The multiplicative growth kinetic model followed by C. ljungdahlii, as reported by Vandecasteele, was attempted [15]. The form of the kinetic equation is as follows:
μ 2 = μ 2 m a x C C O 2 K C O 2 + C C O 2 C H 2 K H 2 + C H 2 K I ,     C O h y K I ,     C O h y + C C O K I , U A K I , U A + C U A
In this study μ 2 m a x was adjusted to fit the experimental growth data, obtained using pure CO2–H2 mixture in the Erlenmeyer flasks, as described in the section titled “Experiments for Growth Kinetics on CO2 and H2”. The other constants obtained by Vandecasteele (2016) for C. ljungdahlii were used [15].

3.2. Mathematical Model

The reactions for the generation of ethanol from pyro-syngas were chosen according to Vandecasteele as they used the effects of the mixture of CO, CO2, and H2 on syngas fermentation. As they used C. ljungdahlii and not a mixed culture like UACJUChE1, some kinetic growth data were separately determined in the present study. Similar to C. ljungdahlii, the molecular formula for UACJUChE1 was assumed to be C H 1.81 O 0.58 N 0.24 . The Wood–Ljungdahl pathway for the production of ethanol from syngas is represented in Figure 3.
The reactions under consideration of the model are as follows:
  • Biomass growth on carbon monoxide
39.91 C O + 19.04 H 2 O + 0.24 N H 3 C H 1.81 O 0.58 N 0.24 + 9.23 C H 3 C O O H + 19.44 C O 2    
  • Biomass growth on carbon dioxide and hydrogen
147.06 H 2 + 73.55 C O 2 + 0.24 N H 3 C H 1.81 O 0.58 N 0.24 + 36.27 C H 3 C O O H + 74.20 H 2 O
  • Ethanol production fromcarbon monoxide
In this path, the production of ethanol is considered to take place through direct conversion of acetyl-CoA into ethanol and is non-growth associated.
6 C O + 3 H 2 O C 2 H 5 O H + 4 C O 2
  • Ethanol production from carbon dioxide and hydrogen
2 C O 2 + 6 H 2 C 2 H 5 O H + 3 H 2 O
  • Conversion of acetate into ethanol in the presence of CO
To reduce acetate to ethanol, the water–gas shift reaction can be used, in which CO acts as the electron donor through the conversion of CO into CO2 delivering the necessary reducing power.
C H 3 C O O H + 2 C O + H 2 O C 2 H 5 O H + 2 C O 2
  • Conversion of acetic acid into ethanol in the presence of H2
Acetate can also be reduced by using hydrogen as the electron donor during the conversion of molecular hydrogen to two protons and two electrons using the enzyme hydrogenase.
C H 3 C O O H + 2 H 2 C 2 H 5 O H + H 2 O
The biomass growth kinetics and ethanol production kinetics are represented in Table 4.
The molar yield coefficients of different participating reactants and products with respect to biomass were calculated from their stoichiometric coefficients represented in Equations (11) and (12). Similarly, molar yield coefficients of different participating reactants and products with respect to ethanol were calculated from their stoichiometric coefficients represented in Equations (13)–(16).
The yield coefficient of any component, i with respect to biomass, Y i / X and with respect to ethanol, Y i / E can be defined as follows:
Y i X = d C i d t d C X d t
Y i / E = d C i d t d C E d t
  • Mole Balance Equations
  • Semi-batch Reactor
  • Gas Phase
The mole balance equations for CO, CO2, and H2 in the gas phase are as follows:
d p C O d t = q G V G p C O i n p C O k L a C O V L V G R T p C O H C O C C O L
where, p stands for partial pressure, R is universal gas law constant, and T is temperature in Kelvin:
d p H 2 d t = q G V G p H 2 i n p H 2 k L a H 2 V L V G R T p H 2 H H 2 C H 2 L
d p C O 2 d t = q G V G p C O 2 i n p C O 2 k L a C O 2 V L V G R T p C O 2 H C O 2 C C O 2 L
  • Liquid Phase
d C C O L d t = k L a C O p C O H C O C C O L + r C O
d C H 2 L d t = k L a H 2 p H 2 H H 2 C H 2 L + r H 2
d C C O 2 L d t = k L a C O 2 p C O 2 H C O 2 C C O 2 L + r C O 2
d C X d t = r X
d A A d t = r A A
d C E d t = r E
where,
r C O = ( μ 1 Y C O / X + q E 1 Y C O / E + q E 3 Y C O / E A A C O ) C X
r H 2 = ( μ 2 Y H 2 / X + q E 2 Y H 2 / E + q E 4 Y H 2 / E A A H 2 ) C X
r C O 2 = ( μ 1 Y C O 2 / X + q E 1 Y C O 2 / E + q E 3 Y C O 2 / E A A C O ) ( μ 2 Y C O 2 / X + q E 2 Y C O 2 / E )   C X
r X = ( μ 1 + μ 2 )   C X
r A A = ( μ 1 Y A A X + μ 2 Y A A X ) ( q E 3 Y A A E A A C O + q E 4 Y A A / E A A H 2 ) C X
r E = q E 1 + q E 2 + q E 3 + q E 4 C X
  • Continuous Reactor
The dynamic mole balance Equations (19)–(21) of components in the gas phase are the same for the semi-batch and the continuous reactors. As there are both input and output for the liquid stream in the continuous reactor, the liquid phase dynamic mole balance equations take the following forms:
d C C O L d t = k L a C O p C O H C O C C O L + r C O q L V L C C O L
d C H 2 L d t = k L a H 2 p H 2 H H 2 C H 2 L + r H 2 q L V L C H 2 L
d C C O 2 L d t = k L a C O 2 p C O 2 H C O 2 C C O 2 L + r C O 2 q L V L C C O 2 L
d C X d t = r X q L V L C X
d A A d t = r A A q L V L C A A
d C E d t = r E q L V L C E
C A A and C E stand for acetic acid and ethanol concentration, respectively.
The values of p C O i n , p H 2 i n , and p C O 2 i n were set according to the concentration of inlet pyro-syngas. The initial values of liquid phase concentration of CO, H2 and CO2 were set to the saturation values because as per the experimental strategy, the sterile basal medium was saturated with the pyro-syngas at the start-up of both semi-batch and continuous bioreactors. The initial condition is presented in Equation (40) as follows:
At   t = 0 ,   p C O = 0 p H 2 = 0 p C O 2 = 0 C C O L = C C O L * C H 2 L = C H 2 l * C C O 2 L = C C O * 2 l C X = 0.05   mol / L C A A = 0 C E = 0
All the equations were numerically solved using the initial condition, given in Equation (40) using ode45 of MATLAB software version R2016a.

3.3. Optimization of Ethanol Concentration in Semi-Batch and Continuous Bioreactors

3.3.1. Semi-Batch Bioreactor

For the bioreactors operated in the semi-batch mode, a three-level, three-factor Box–Behnken statistical design of response surface methodology (RSM) was used to fit the trend of dependence of the response variable, namely, ethanol concentration, obtained after 30 h, on different relevant operating variables by second-order models. Design Expert software (version 13) was used for this purpose. Three variables, namely the temperature of pyrolysis (A), the ratio VG/VL (B), and qG (C) were considered as the parameters. According to the method, 17 experiments were conducted at the set points recommended by the Design of Experiment, represented in Table 2. The variables (A, B, and C) with coded levels (−1, 0, and 1) are shown in Table 5.
The pyrolysis temperature was chosen as a parameter because it influences the input gas composition. The ratio of the overhead volume and the liquid volume, VG/VL, was considered as a parameter because it influences the driving force, i.e., the difference between the interfacial concentration of nutrient gases (CO, H2, and CO2) at the gas–liquid interface under equilibrium and the bulk liquid concentration [20]. Ruggiero et al. also used a similar parameter, VL/(VG + VL), i.e., the filling ratio, as a parameter [20]. The volumetric flow rate, q G , was used as a parameter because it indirectly influences the mass transfer coefficient, kla, by altering the gas phase superficial velocity, u s g , as represented in Equation (4). Refs. [19,20] also used this parameter in their model.

3.3.2. Continuous Bioreactor

As indicated in the experimental description, the bioreactor was operated in continuous mode using the inlet gas generated in the pyrolizer at 700 °C. For the bioreactor operated in the continuous mode, a two-factor Box–Behnken statistical design in response to surface methodology (RSM) was used to fit the trend of dependence of the response variable, namely ethanol concentration, obtained after 300 h, on different relevant operating variables by second-order models. Design Expert software (version 13) was used for this purpose. Two variables, namely, VG/VL (A) and qG/qL (B), were considered as the parameters. Accordingly, 13 experiments were conducted at the set points recommended by the Design of Experiment, represented in Table 3. The ranges of variables (A and B) with coded levels (−1, 0, and 1) are shown in Table 6. These parameters were used because they actually influence the gas phase residence time, GRT, important for mass transfer and the liquid phase residence time and hence the dilution rate (D) which is important for both mass transfer and the fermentation reaction [19]. Elisa M. de Medeiros et al. used GRT and D as the parameters of optimization in their study [19]. We separately analyzed the effects of GRT and D on the volumetric productivity of ethanol during continuous operation.

4. Results and Discussion

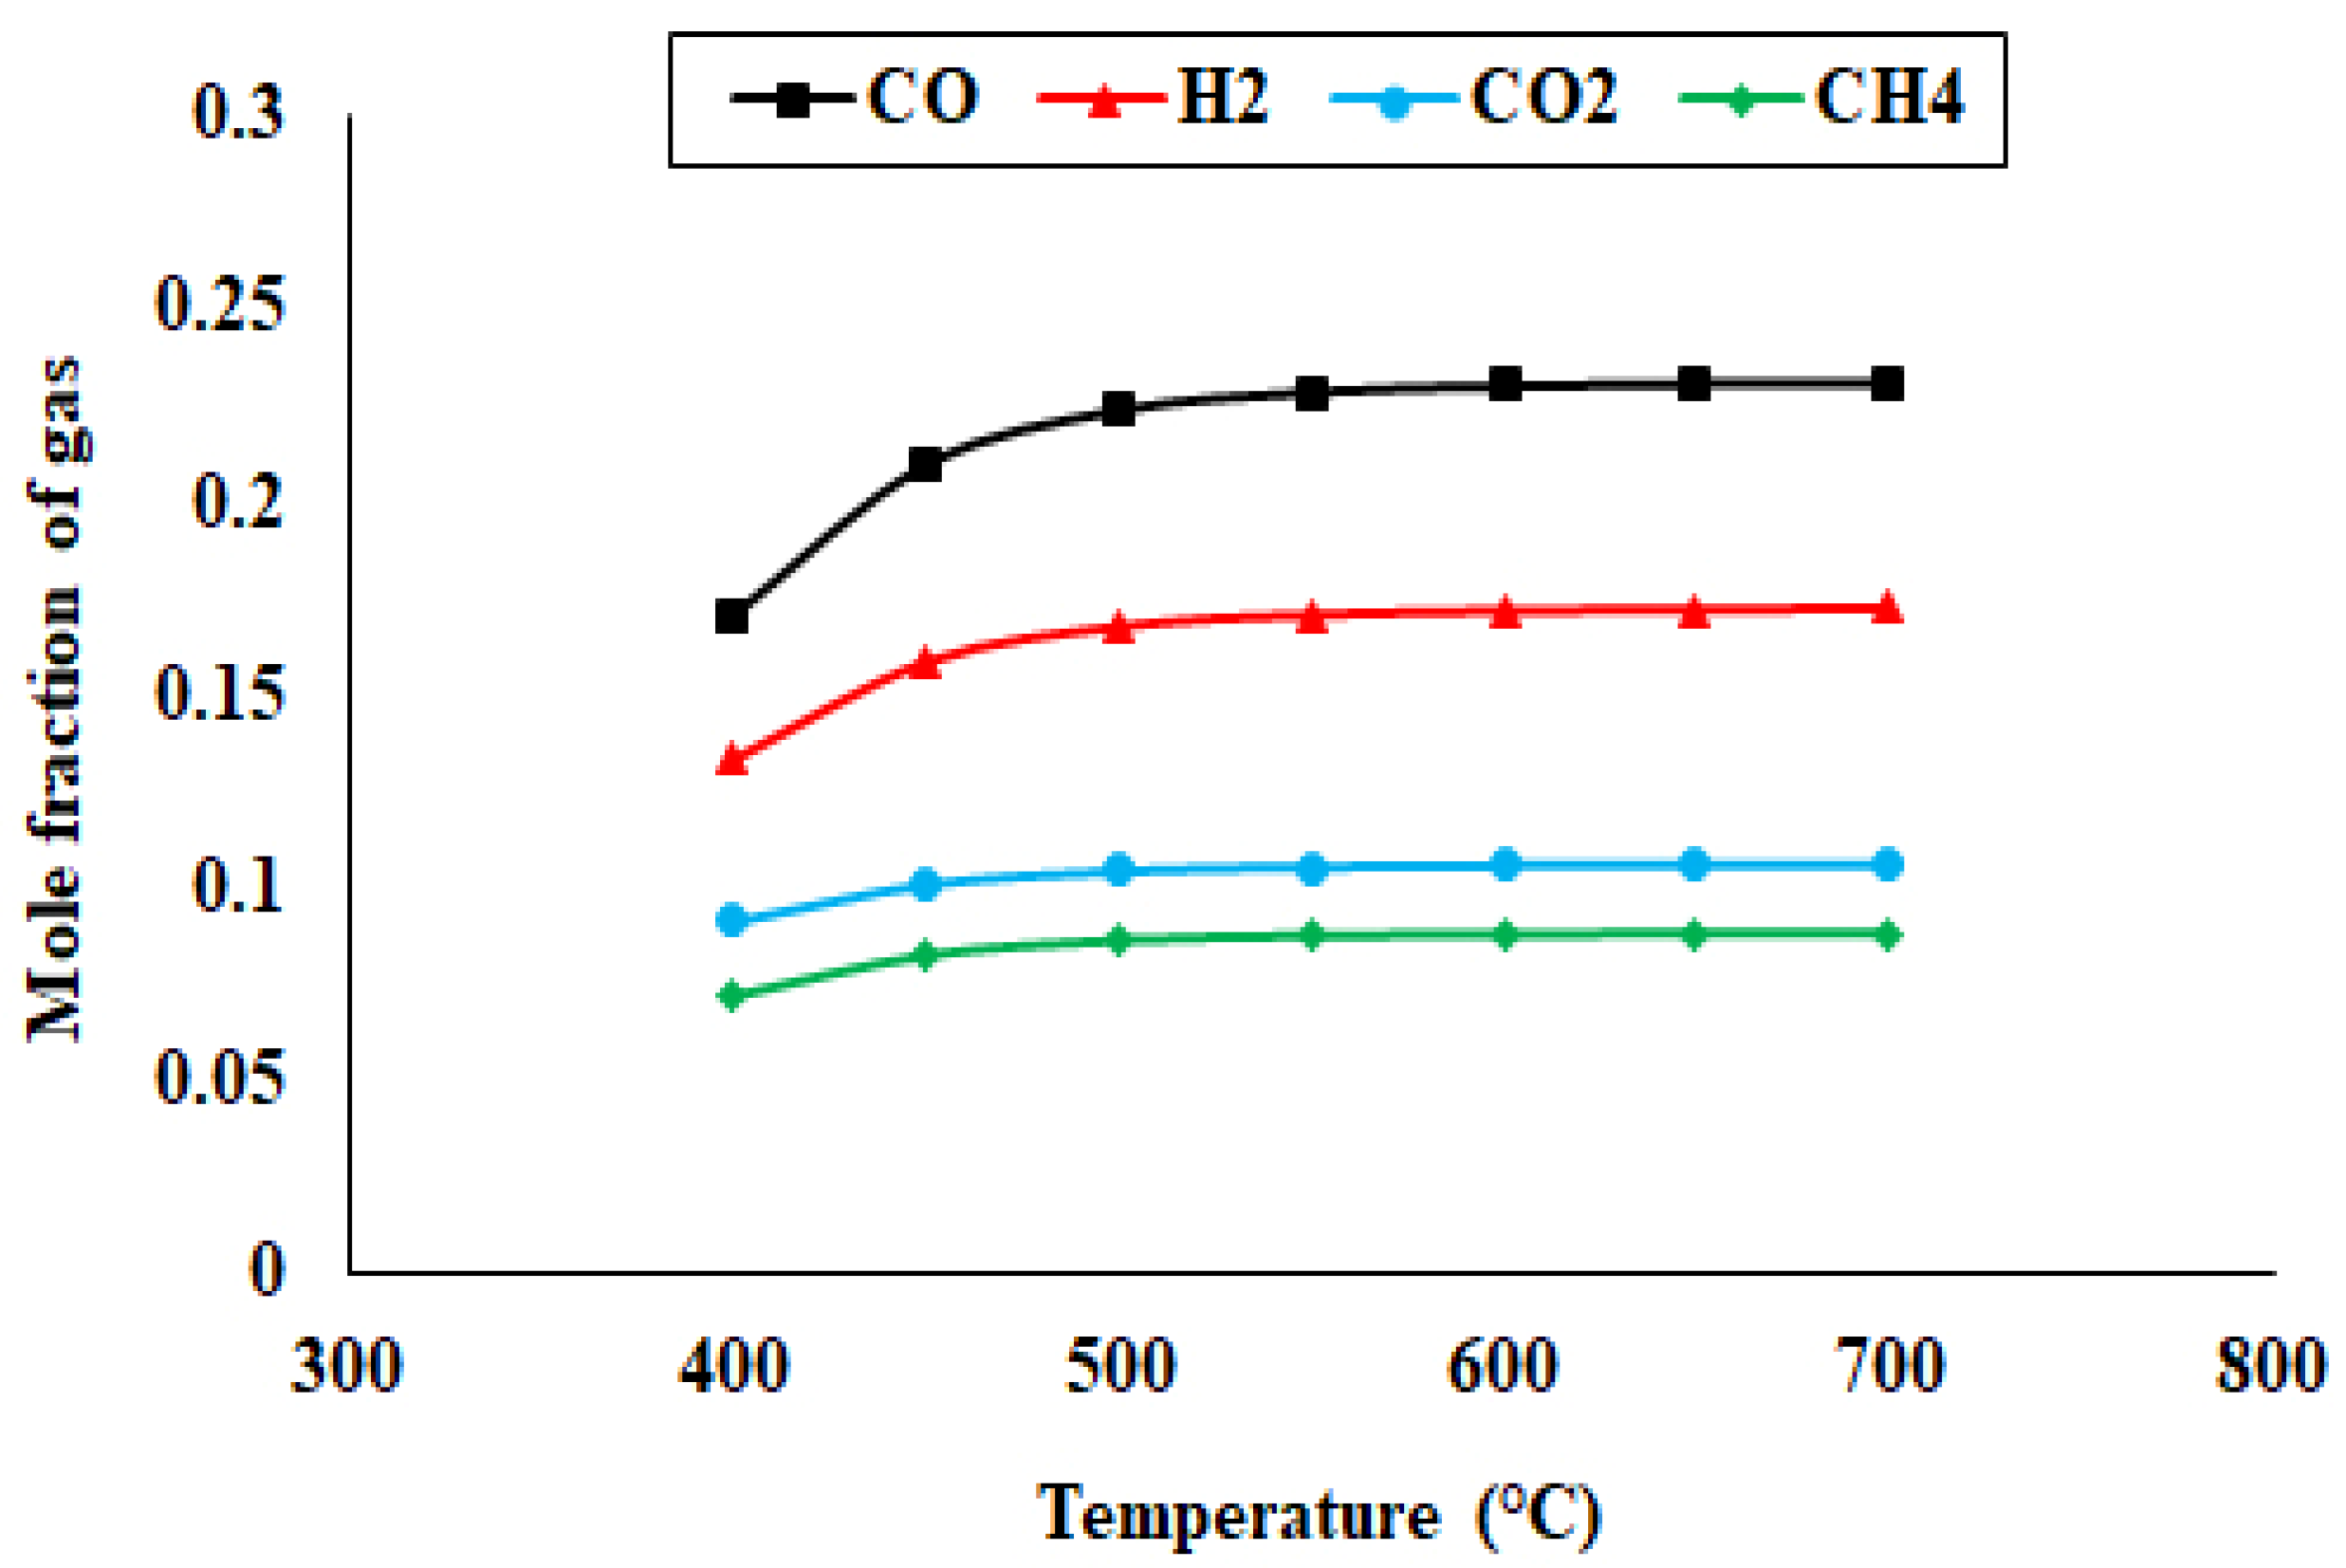
4.1. Composition and Volumetric Flow Rates of Pyro-Syngas

In Figure 4, the mole fractions of different constituent gases, namely CO, H2, CO2, and CH4 in pyro-syngas were plotted against temperature.
It is evident that the mole fraction of each gaseous component increased with the temperature up to 550 °C, after which a saturation trend was observed. Molar concentration (%) of CO, H2, CO2, and CH4 increased from 17.07%, 13.32%, 9.11%, and 7.19% to 23.08%, 17.23%, 10.59%, and 8.82%, respectively, as the pyrolysis temperature was increased from 400 °C to 700 °C. As the temperature increased from 400 °C to 700 °C, the gas flow rate increased from 30.3 L/h to 51.41 L/h.
From the analysis of Table 7, it appears that the yields of char and oil decreased and increased respectively with the rise in temperature. The yield of pyro-oil, however, passed through a maximum at 500 °C after which it decreased. These trends can be explained by the fact that with the increase in temperature, the extent of thermal degradation of rice straw increases, releasing lower molecular weight compounds as compared to those obtained at a lower temperature range.

4.2. Values of Parameters

4.2.1. K L a for Different Gases

As described in Section 2.3.3, the sterile basal medium was first saturated with pyro-syngas obtained at 700 °C by maintaining a stirring speed of 900 rpm and an inlet gas flow rate of 0.6 L/h for 12 h. The values of K L a , for CO, CO2, and H2, as determined experimentally and using Equations (4) and (7), are 144.9 h−1, 166.9 h−1, and 123.6 h−1, respectively. During semi-batch and continuous operations, the stirring speed was maintained at 150 rpm and the volumetric flow rate of syngas was varied from 0.6–10 L/h. There is a wide variation of values of K L a because of their dependence on both the superficial velocity of gas and hence the volumetric flow rate. With the increase of gas flow rate there was an increase in the K L a values. According to Equations (4) and (7), the values of   K L a for CO, CO2, and H2 varied from 23.5 to 100.7 h−1, 27 to 116.7 h−1, and 20 to 87.4 h−1, respectively, as the gas flow rate was varied from 0.6 to 10 L/h.

4.2.2. Model Parameters

The values of molar yield coefficients are provided in Table 8, and different model parameter and constants are provided in Table 8 and Table 9, respectively.
Different model parameters, namely mass transfer coefficients, Henry’s constants, and kinetic parameters are provided in Table 9.

4.2.3. Significance of Model Parameters and Their Comparison with Similar Studies

The model parameters related to mass transfer are the values of K L a and Henry’s constants for CO, CO2, and H2. Henry’s constant, correlating the gas and liquid phase concentration of a component under equilibrium, varies with temperature for all gases and hence is the same for all studies. The values of K L a for CO, CO2, and H2 have varied from 23.5–100.7 h−1, 27–116.7 h−1, and 20–87.4 h−1, whereas in reported studies their values have varied from 4.69–22.7 h−1, 2.54–26.2 h−1, and 6.67–19.4 h−1, respectively [15,16,17,18,19,20]. The value of K L a for CO has also been reported to be 198 h−1 in one study [20]. Thus, it is inferred that the mass transfer rate in the present case is similar to those in the reported literature. In the present case, the growth of the clostridial consortium on CO as well as CO2 and H2 has been considered. The maximum specific growth rate on CO was determined to be 0.192 h−1, while for different clostridial strains, the value lay in the range of 0.22–0.37 h−1 [20]. The value of the maximum specific growth rate on H2 was determined to be 0.045 h−1. In the literature, the maximum specific growth rate on H2 was reported to be 0.031–0.045 h−1 [15,20]. Thus, the growth rate for the presently used consortium is comparable to other established pure clostridial strains. The values of the saturation constant, signifying the substrate concentration corresponding to half of the maximum specific growth rate, have also been determined for CO, H2, and CO2 and the values are 0.000078 mol/L, 0.00022 mol/L, and 0.00022 mol/L. This signifies that the specific growth rate reaches the maximum at a lower value of CO concentration compared to H2 and CO2. The reported values of the saturation constants for CO and H2 are 0.000045–0.00039 mol/L and 0.00022–0.00071 mol/L, respectively. This again proves that the saturation constants of the consortium are in the same range as with the recognized strains. The inhibition constants of CO on the growth on CO itself and on hydrogen are 0.002 mol/L and 7 × 10⁻⁹ mol/L, respectively. As the inhibition constant signifies the concentration level of the component rendering a strong inhibitory effect, it is clear that the growth on hydrogen is heavily inhibited by the presence of CO compared to CO-based growth. Perhaps the growth on H2 and CO2 can only occur after CO is fully utilized. Similar observations have been reported by other researchers [15]. The yield coefficients, Y X C O ,   Y X H 2 ,   and   Y C O E of the present study are 0.67 g/mol, 0.18 g/mol, and 6 mol/mol, respectively whereas the reported ranges are 0.24–2.6 g/mol, 0.20–0.37 g/mol, and 2–10.5 mol/mol, respectively [15,16,17,18,19,20,29,30,31,32]. Therefore, the model parameters are very much comparable with the literature data.

4.3. Performance of the Bioreactor in Semi-Batch and Continuous Modes

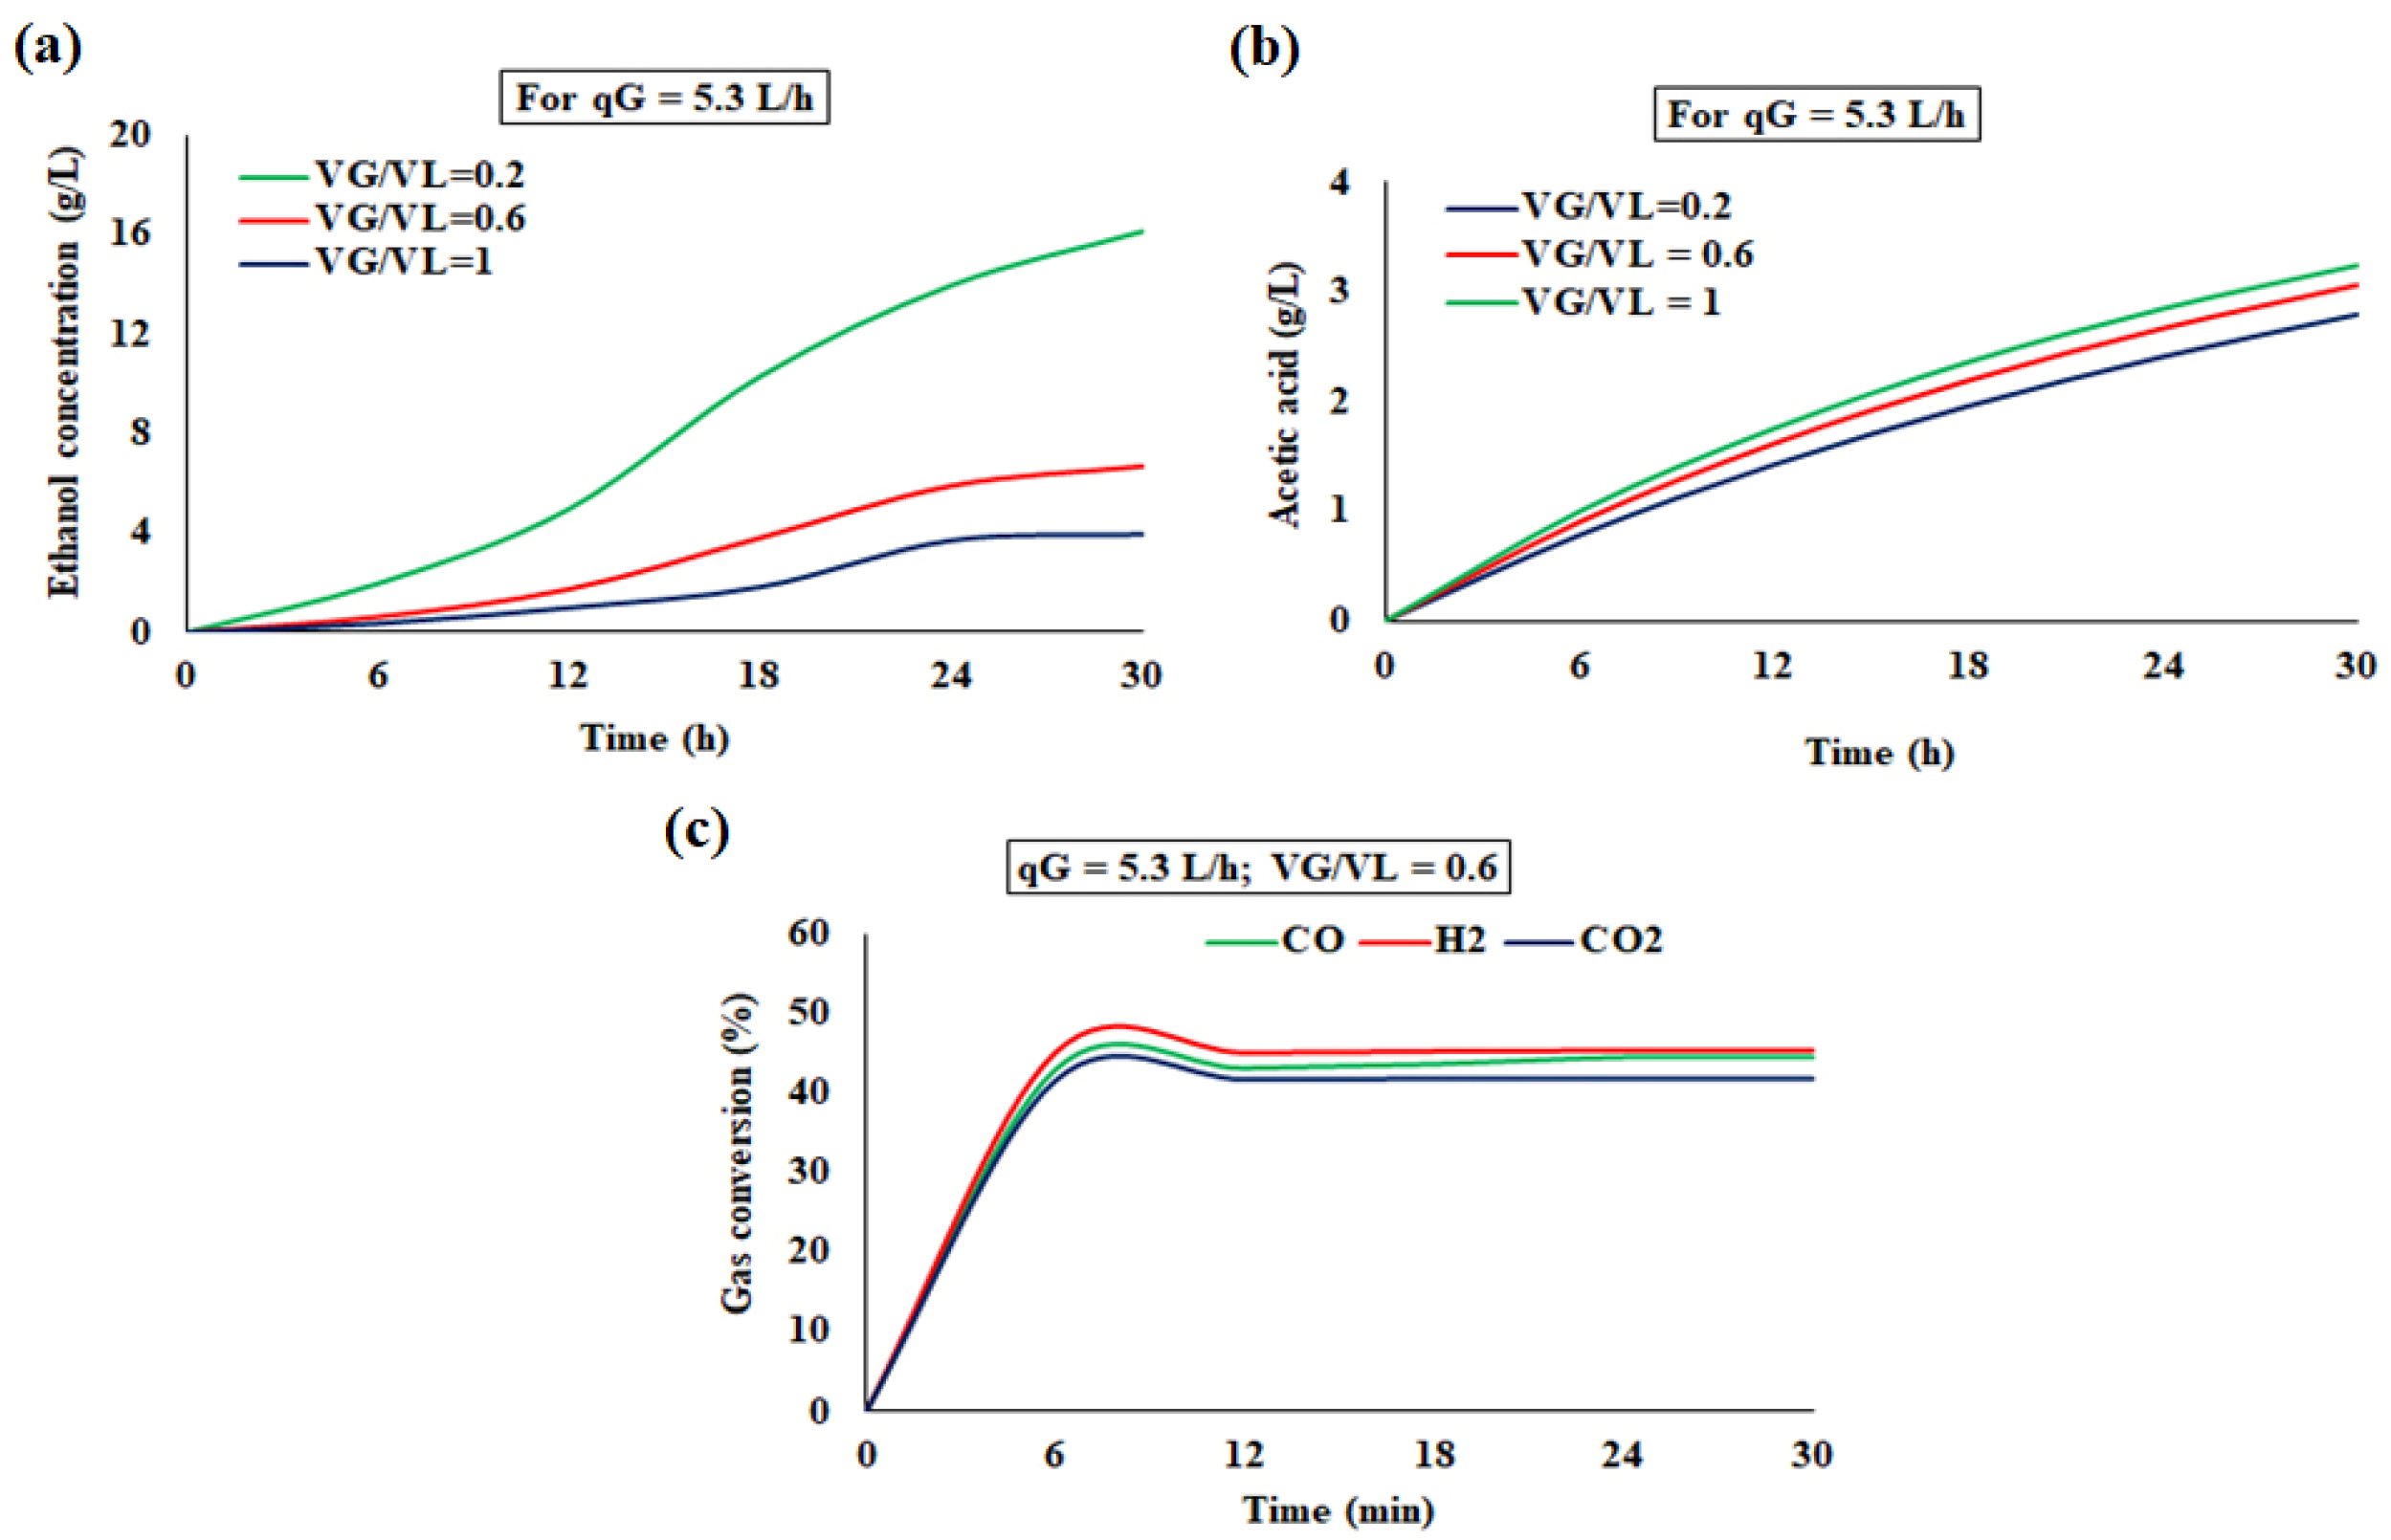
4.3.1. Bioreactor Dynamics in the Semi-Batch Mode

Using the mathematical model for semi-batch operation, the transient behavior of ethanol concentration and acetic acid up to 30 h of operation at qG of 5.3 L/h was presented using VG/VL in the range of 0.2–1 as a parameter. It was observed that for ethanol and acetic acid concentration, the increasing trend persisted even at 30 h. With the increase of VG/VL, there was a decrease in the concentration of both ethanol and acetic acid. This can be explained by the fact that with the increase in the volume of head space, less mass transfer to the liquid phase occurs, causing a decrease in the reaction rate and hence the concentration of both products. The transient behavior of the conversion of different gaseous component, namely CO, H2, and CO2, was represented in Figure 5. The conversion of any component, i, was calculated by p i , i n p i , o u t p i , i n . From the figure it can be observed that after 12 h of operation the gas phase conversion reached equilibrium. All the trends are very similar to those obtained by other researchers [19,20].

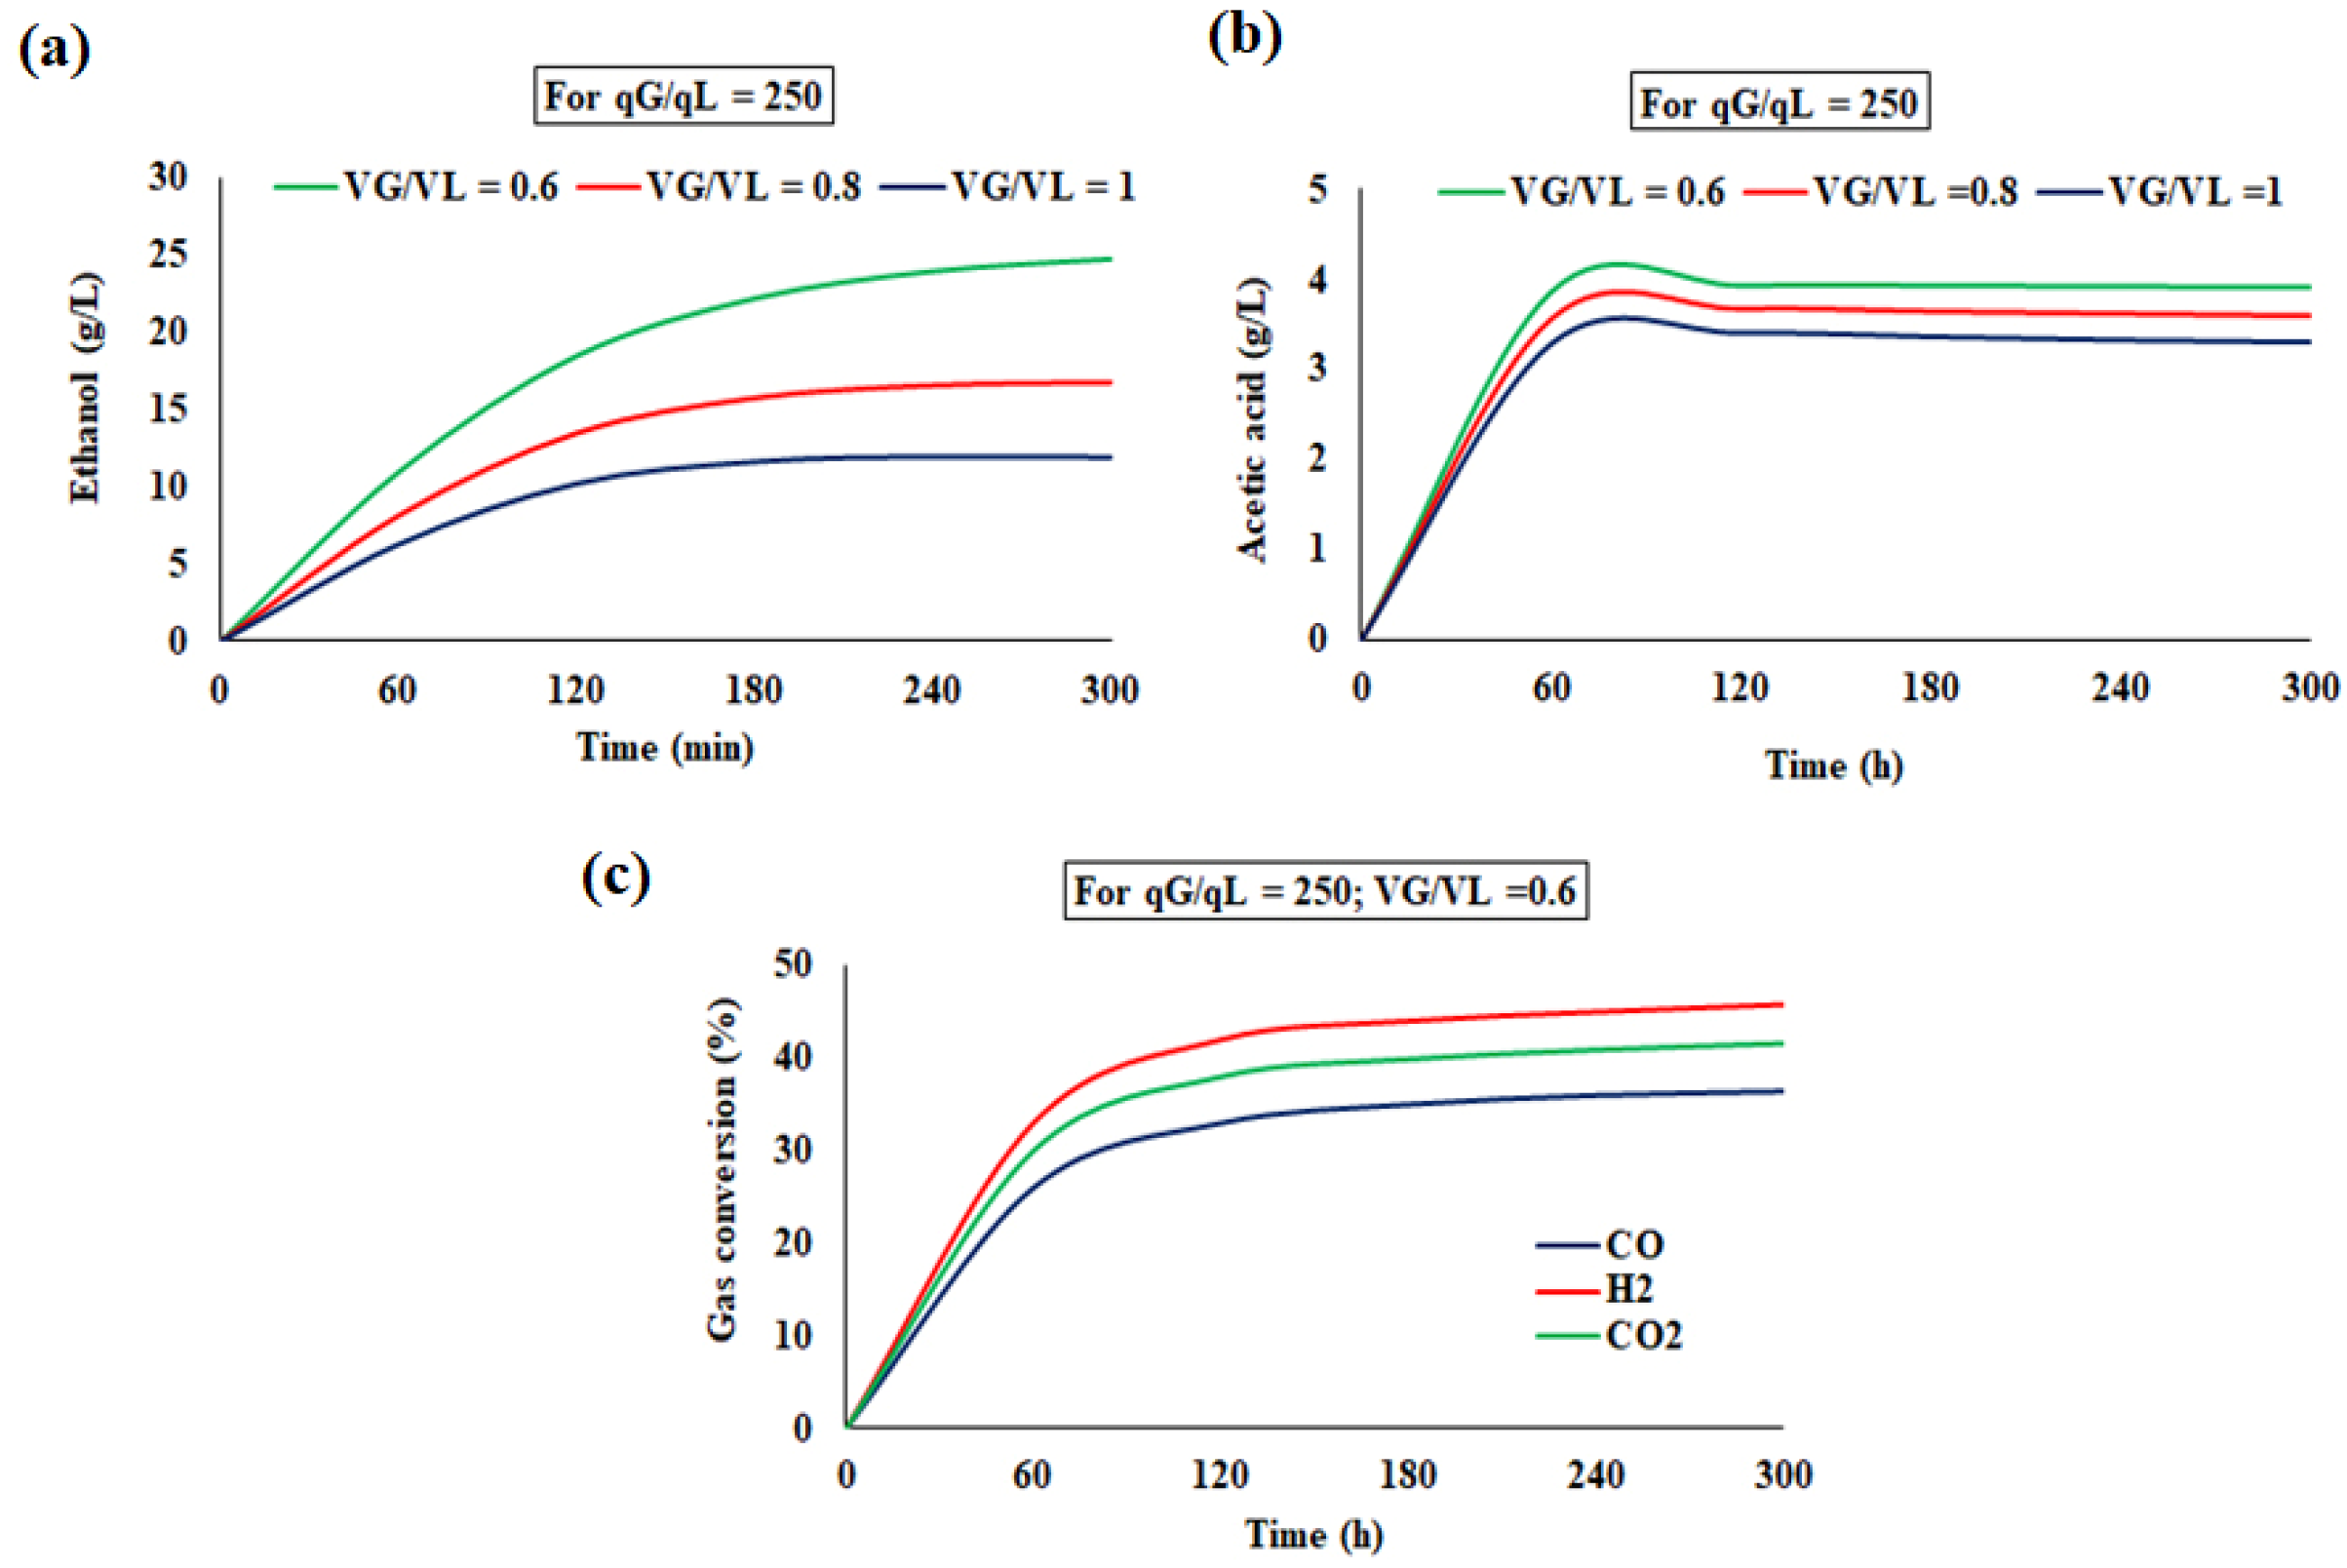
4.3.2. Bioreactor Dynamics in the Continuous Mode

Simulated Profile for the Continuous Reactor

Using the mathematical model for continuous operation, the transient behavior of ethanol concentration and acetic acid up to 300 h of operation at qG/qL of 250 were presented using VG/VL in the range of 0.6–1 as a parameter. It was observed that both ethanol and acetic acid concentration reaches saturation after 180 h of running. Similar to the trend of Semi-batch operation, the concentration of both products decreases with the increase of VG/VL. The transient behavior of conversion of different gaseous component, namely, CO, H2 and CO2 was represented in Figure 6. From the figure it can be observed that after 120 h of operation the gas phase conversion reaches equilibrium. All the trends are very similar to those obtained by other researchers [19,20].

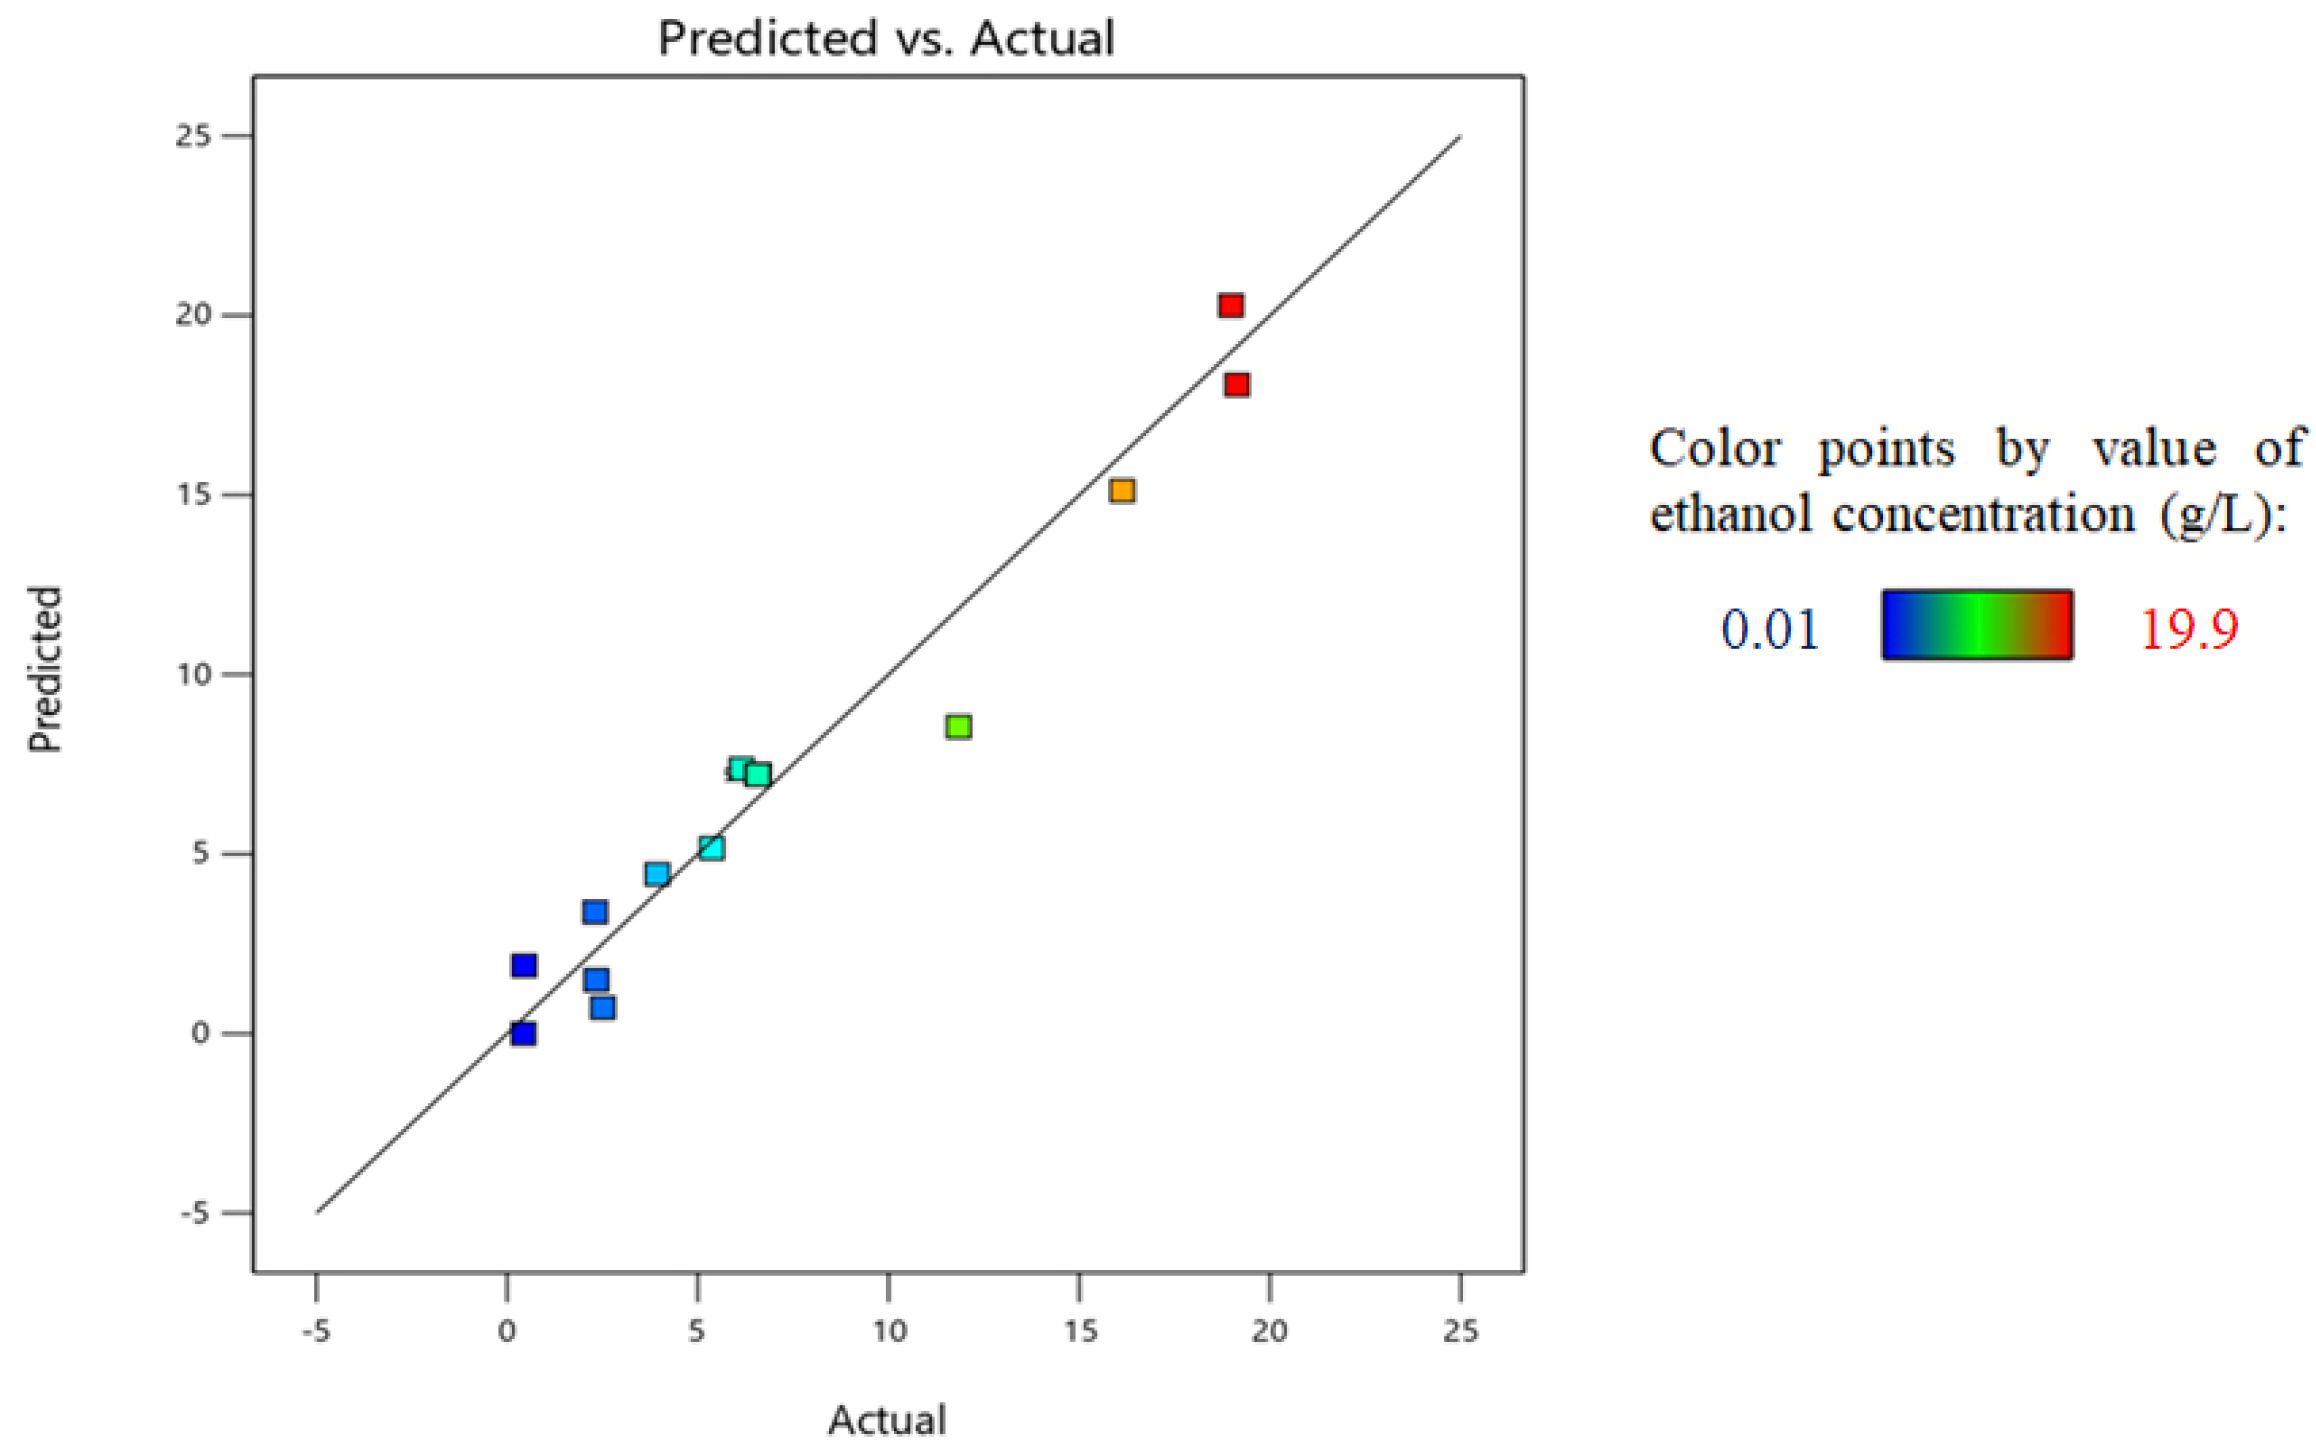
4.4. Comparison of Simulated and Experimental Results

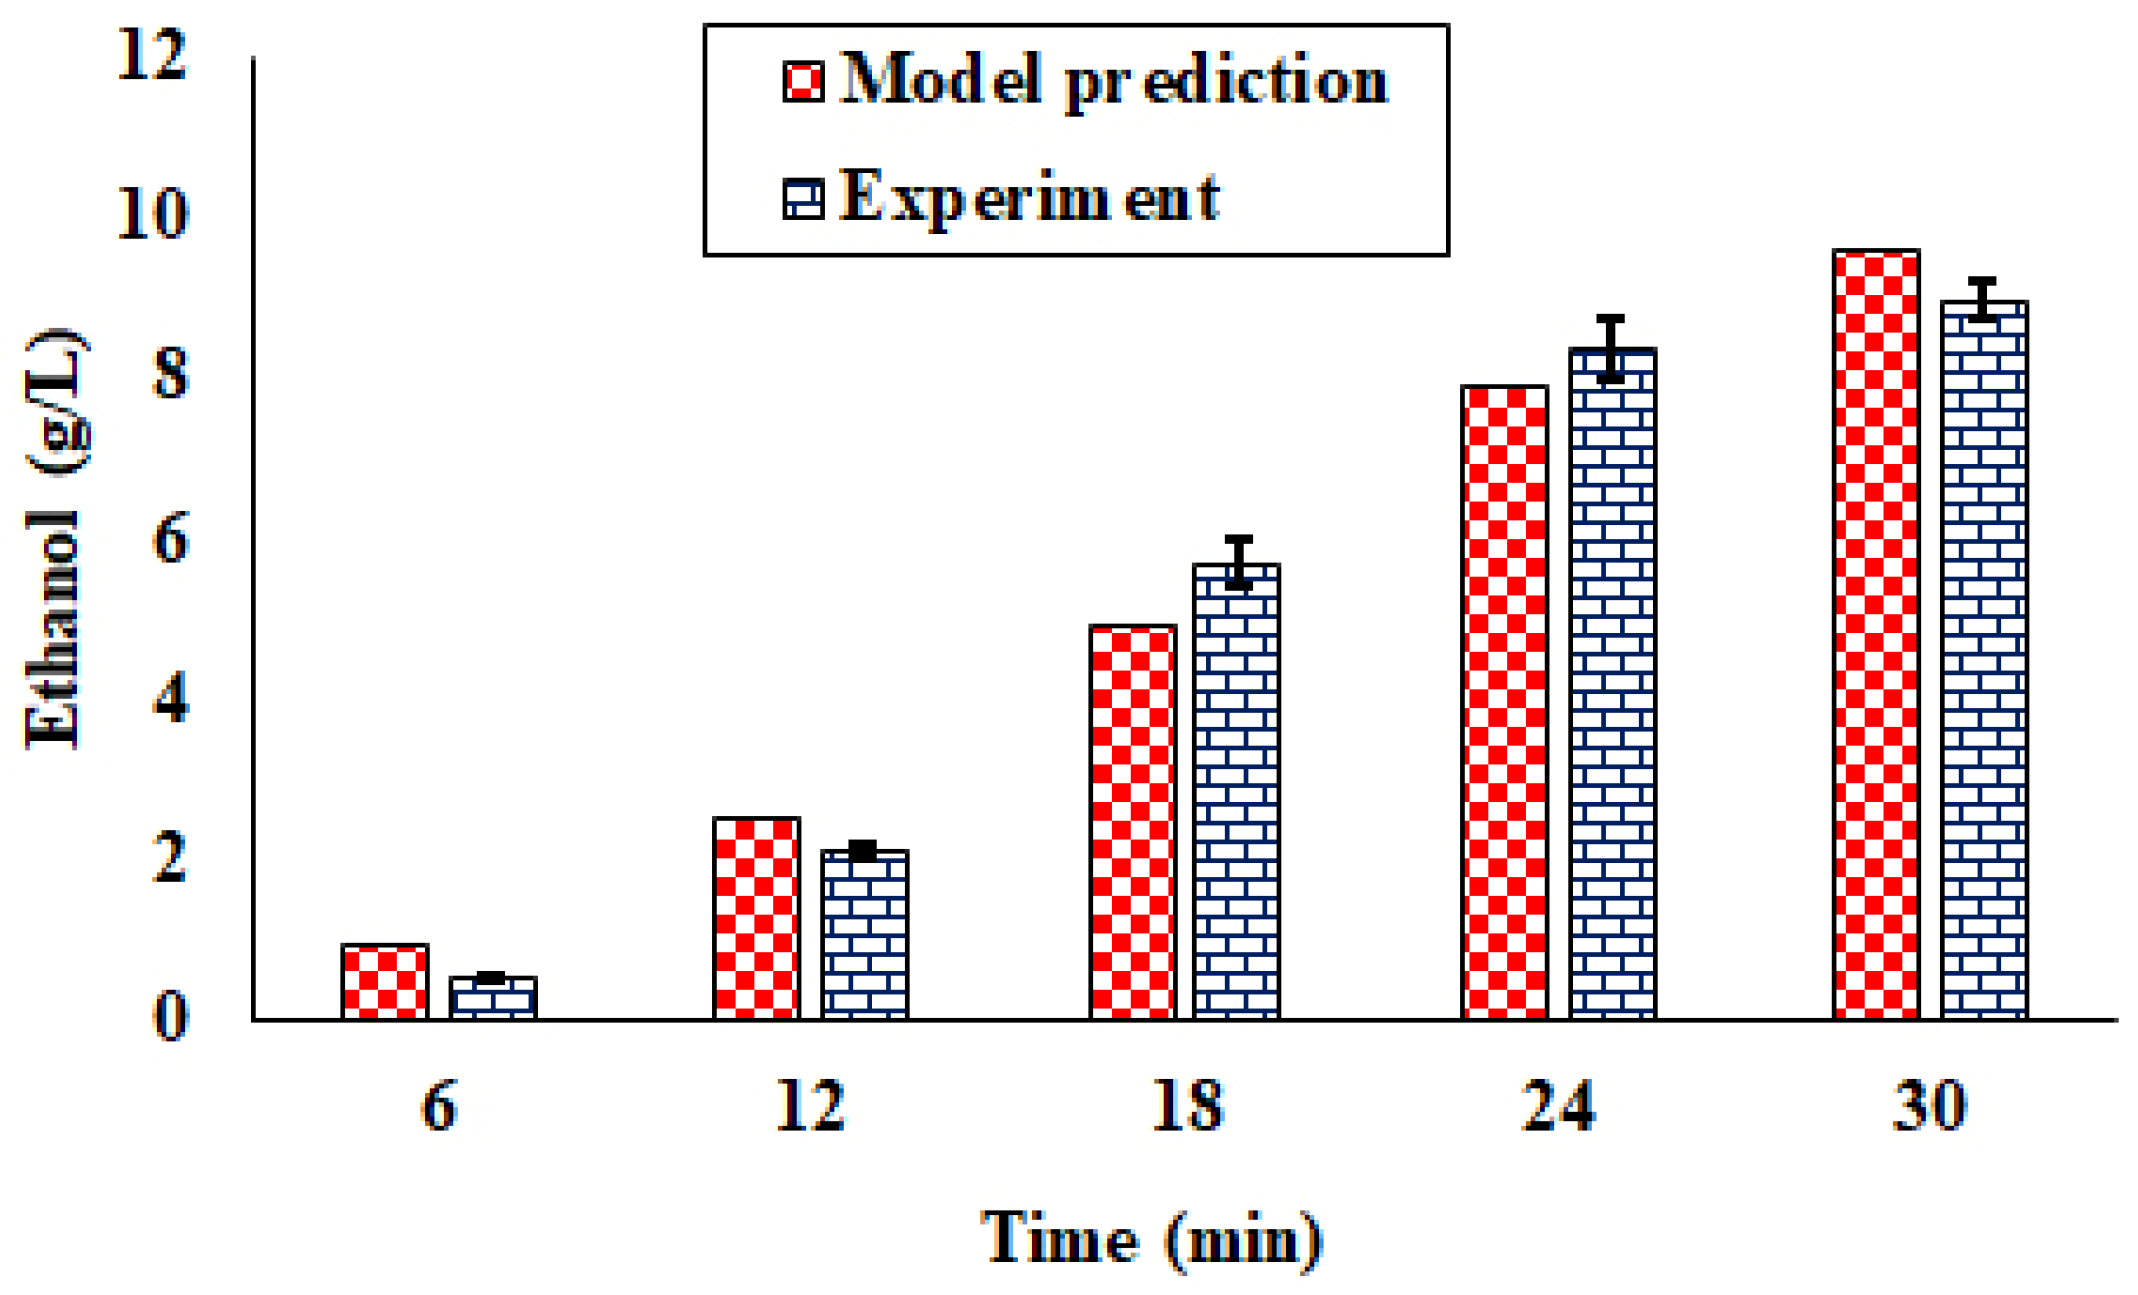
4.4.1. Semi-Batch Operation

In Figure 7, the experimental and simulated values of ethanol concentration in the semi-batch reactor were plotted against operation time (=6 h, 12 h, 18 h, 24 h and 30 h) in a bar-plot. The results were obtained at a pyrolysis temperature of 600 °C, VG/VL of 0.5, and qG of 6 Lpm. From the analysis of the figure, it appears that the agreement between the model prediction and the experimental results is very good.

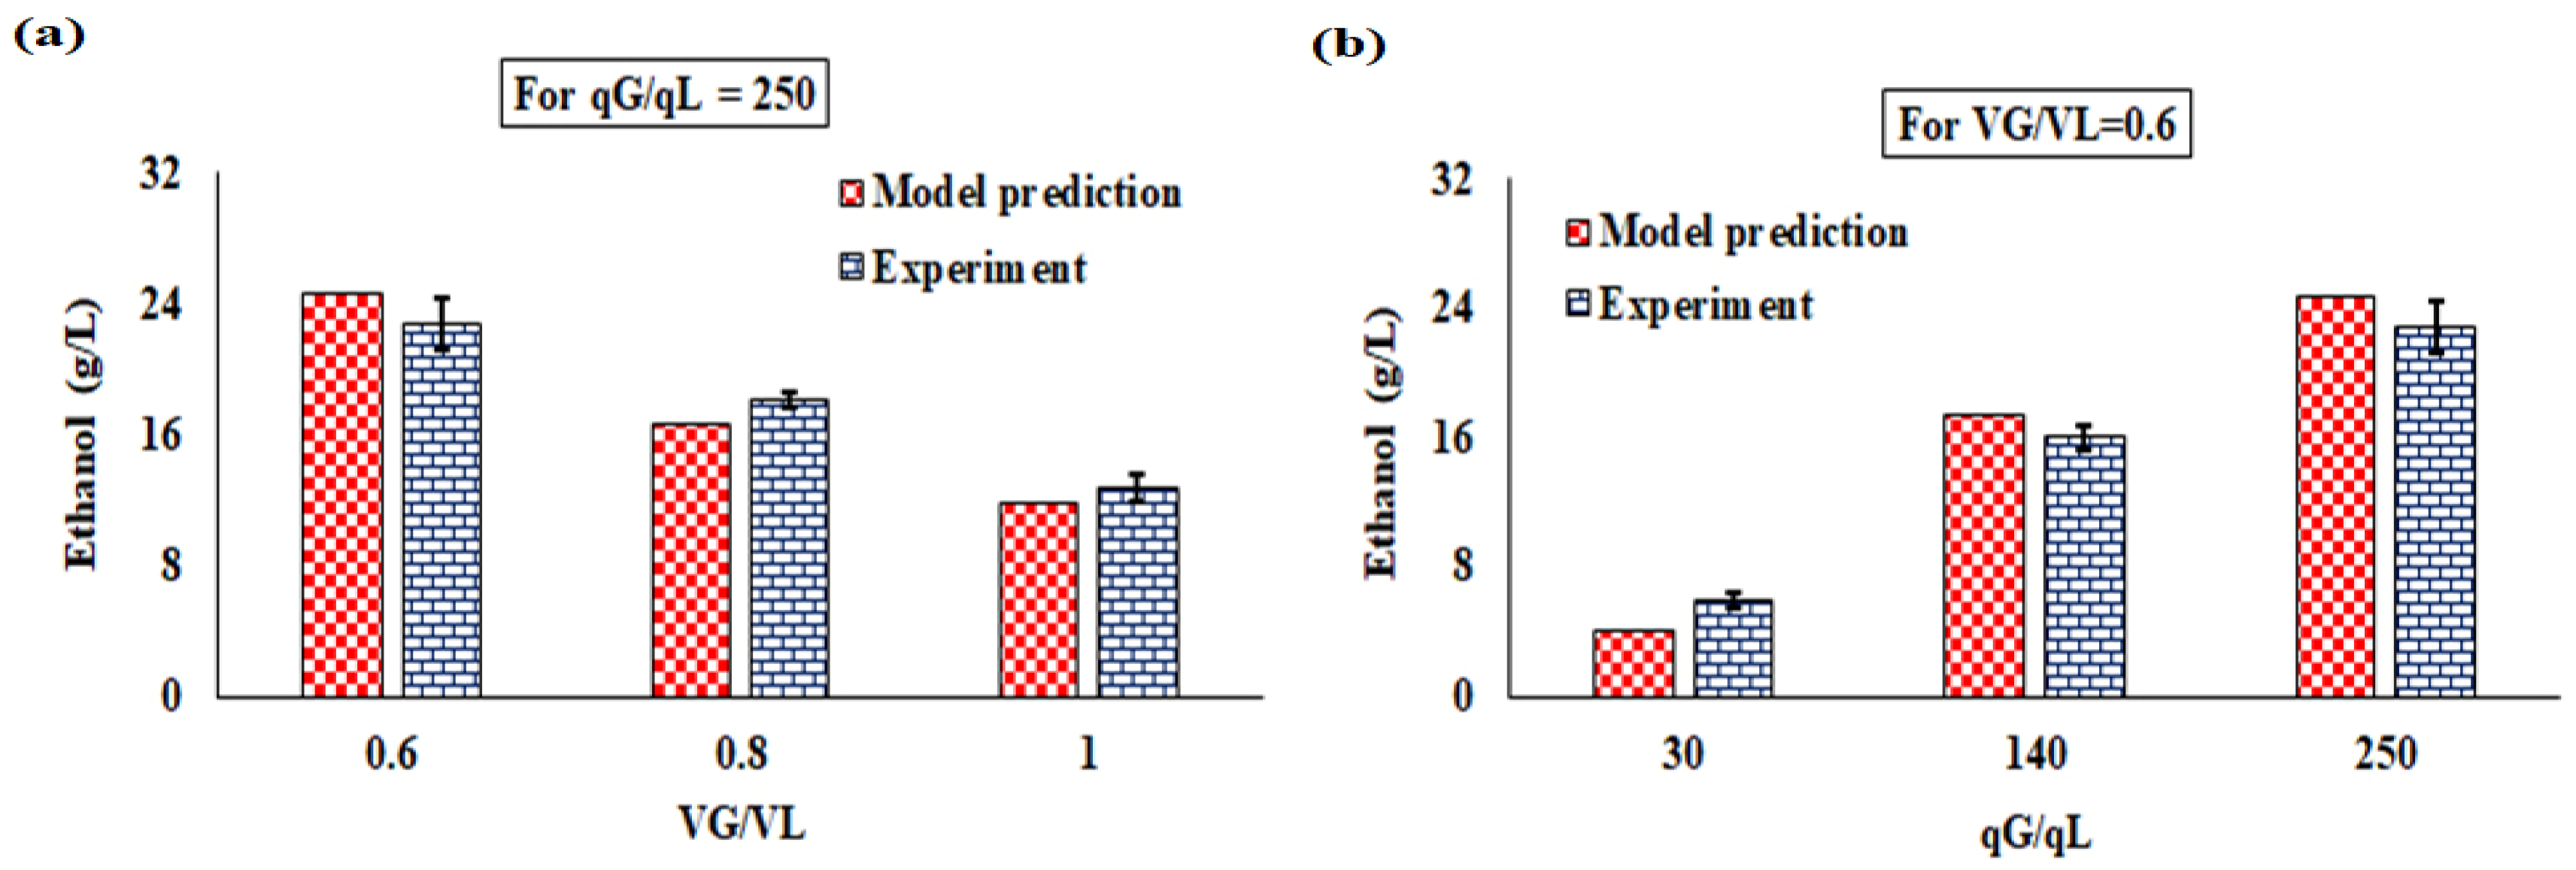
4.4.2. Continuous Operation

The experimental and simulated values of ethanol concentration at 300 h of continuous operation were plotted against VG/VL in the range of 0.6–1 at a fixed value of qG/qL of 250 in Figure 8a. Similarly, the experimental and simulated values of ethanol concentration at 300 h were plotted against qG/qL in the range of 30–250 at a fixed value of VG/VL of 0.6 in Figure 8b. While the ethanol concentration decreased with the increase in VG/VL, it showed an increasing trend with the in qG/qL. A decrease and increase in the mass transfer to liquid phase with the increase in gas volume fraction, i.e., head space, and the gas velocity, respectively, and the increase in reaction time with the decrease in liquid volume, i.e., the decrease in dilution rate, can explain this behavior.
The experimental and simulated values of ethanol concentration at 300 h of continuous operation were plotted against VG/VL in the range of 0.6–1 at a fixed value of qG/qL of 250 in Figure 8a. Similarly, the experimental and simulated values of ethanol concentration at 300 h were plotted against qG/qL in the range of 30–250 at a fixed value of VG/VL of 0.6 in Figure 8b.
For both semi-batch and continuous operations, the mathematical models appear to predict realistic results.

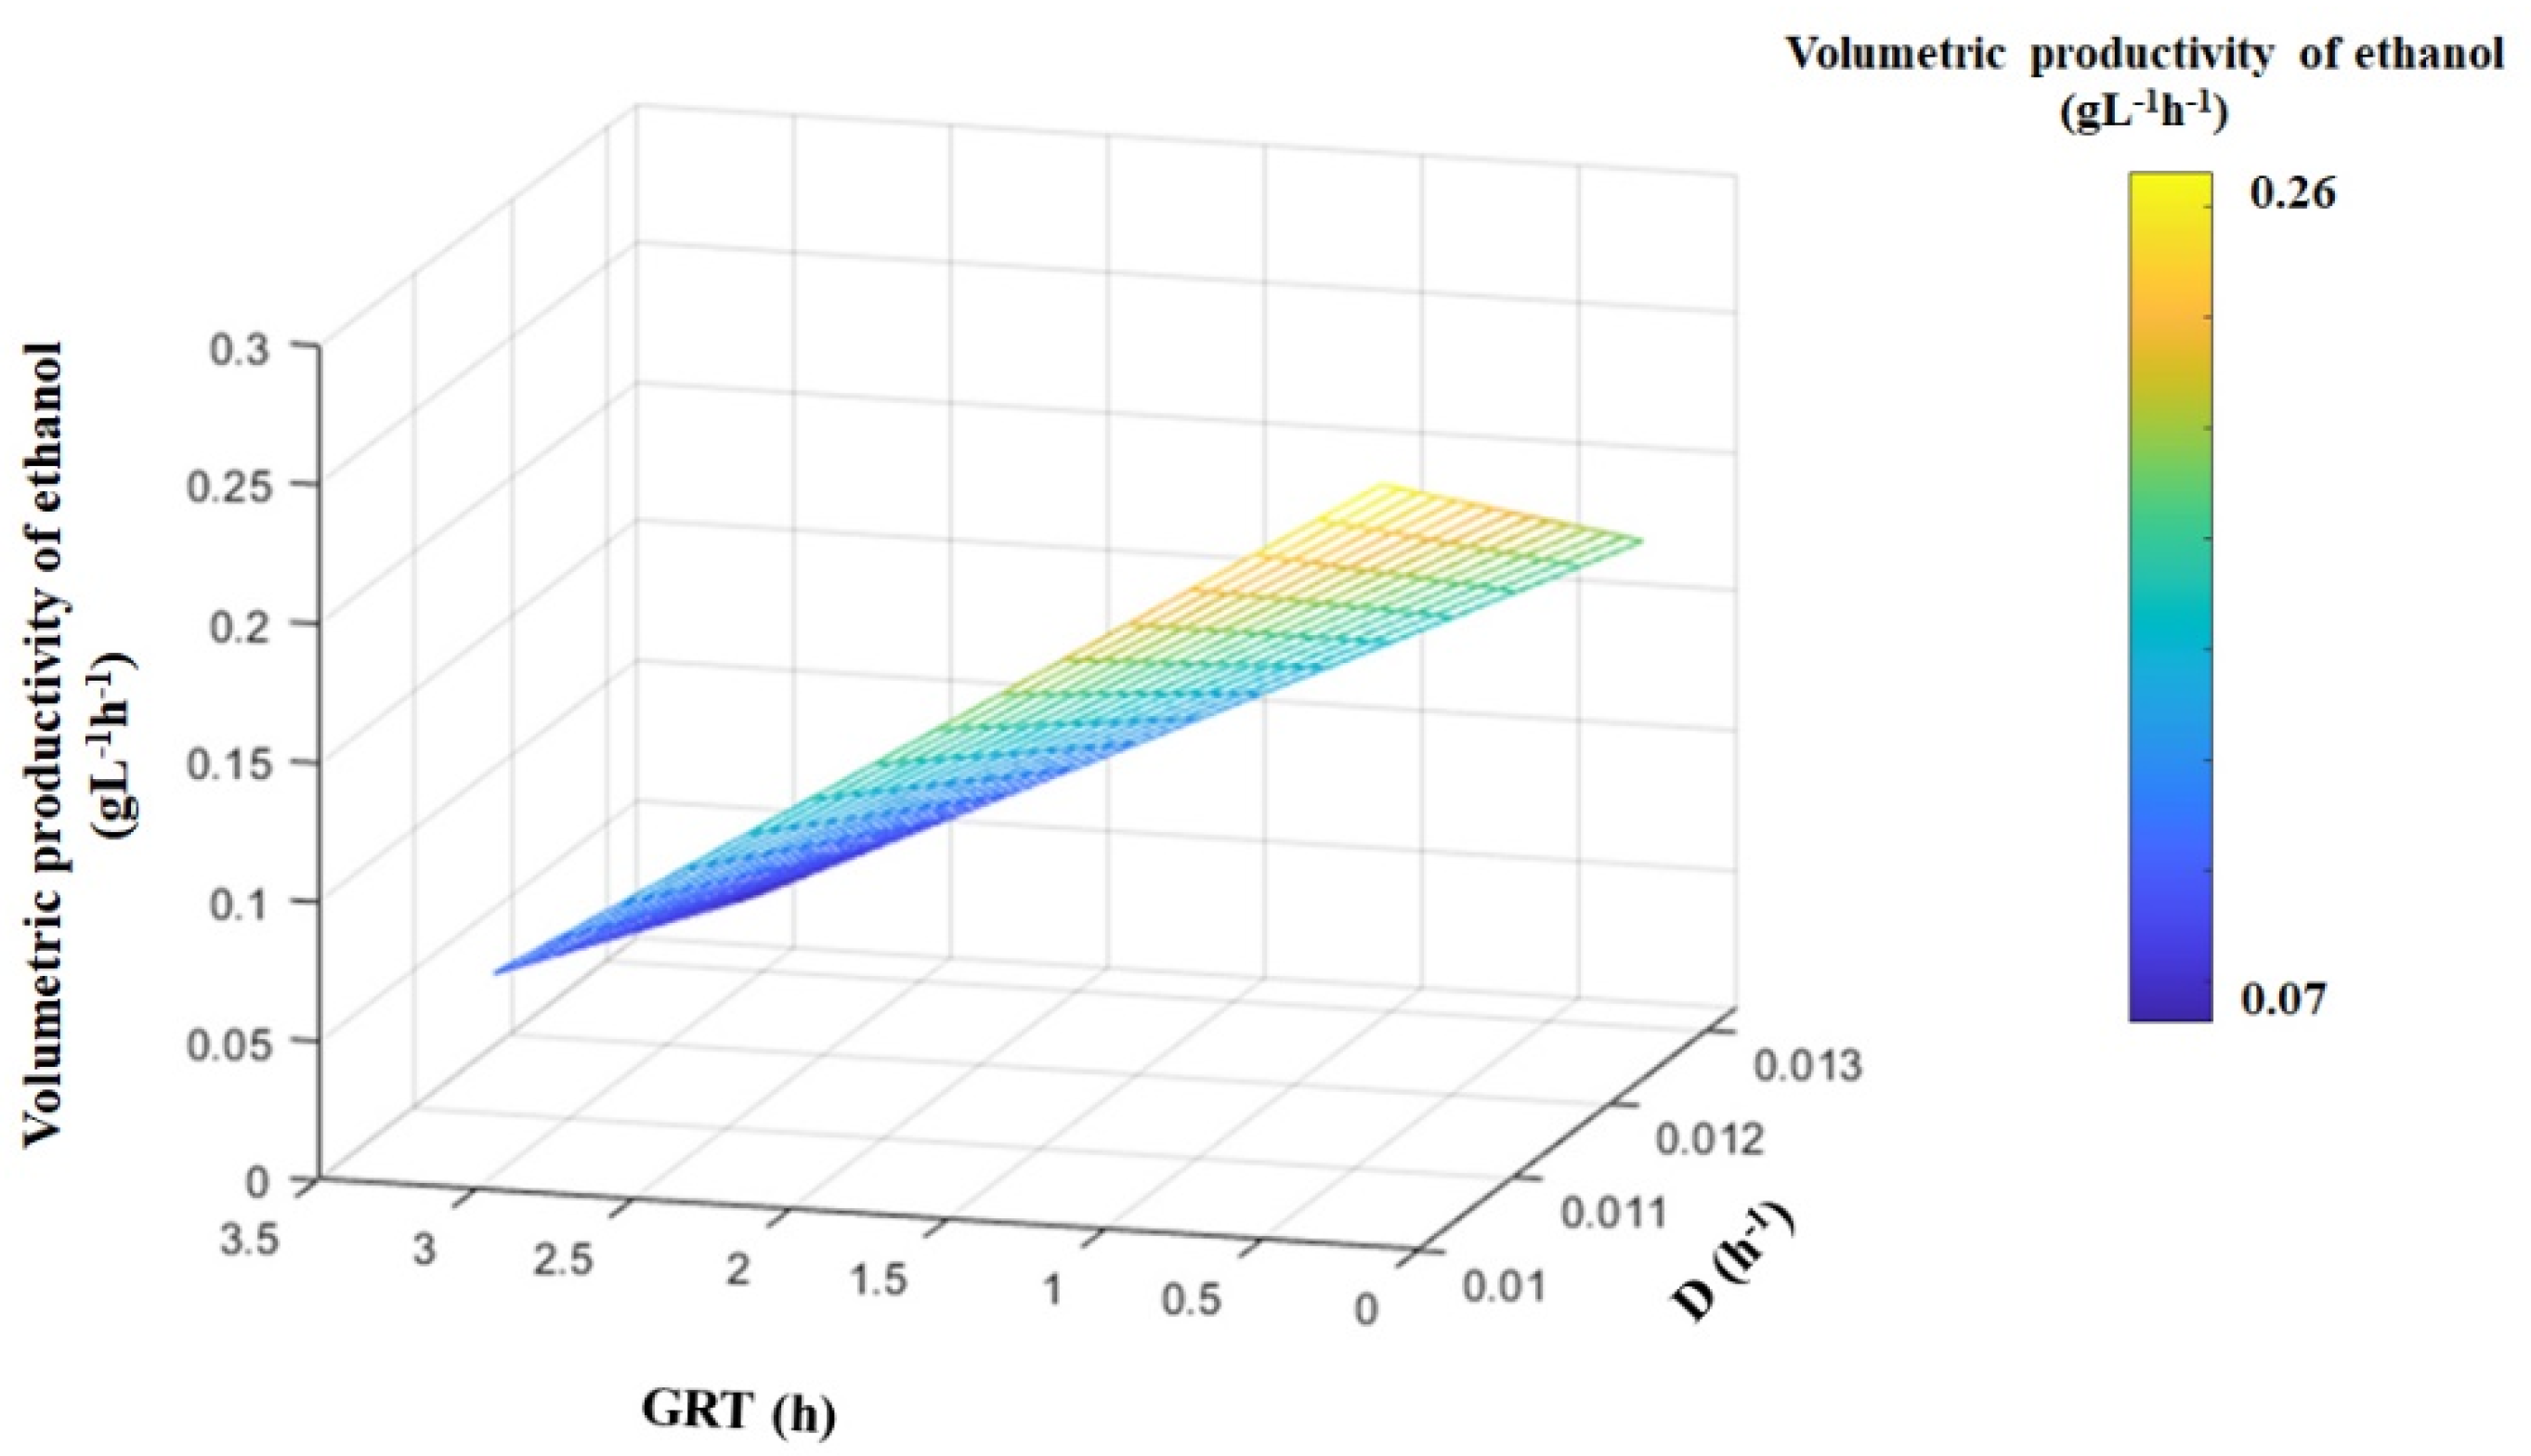
4.5. Effect of Gas Residence Time (GRT) and Dilution Factor (D) on the Volumetric Productivity of Ethanol

For the experimental ranges of the parameters, preset according to Table 3 for the continuous mode of operation, the ethanol production behavior over 300 h was assessed as a function of the gas residence time (GRT) and dilution rate, D, in Figure 9. The dilution rate was calculated by dividing the volumetric flow rate of liquid by the liquid volume, i.e., q L V L , and the gas residence time was calculated by dividing the liquid volume by the volumetric flow rate of gas, i.e., V L q G . In this figure, the volumetric productivity of ethanol, calculated by the multiplication of D and the ethanol concentration at 300 h, i.e., D C E t h a n o l   a t   300   h , was plotted simultaneously against D and GRT through a 3D plot using the meshgrid function in MATLAB software version R2016a.
From Figure 9, it is evident that the increase of GRT has a positive impact on the volumetric productivity of ethanol from syngas fermentation. The increment of D, however, has a negative impact on the volumetric productivity of ethanol.

4.6. Optimization Results for Semi-Batch and Continuous Bioreactors

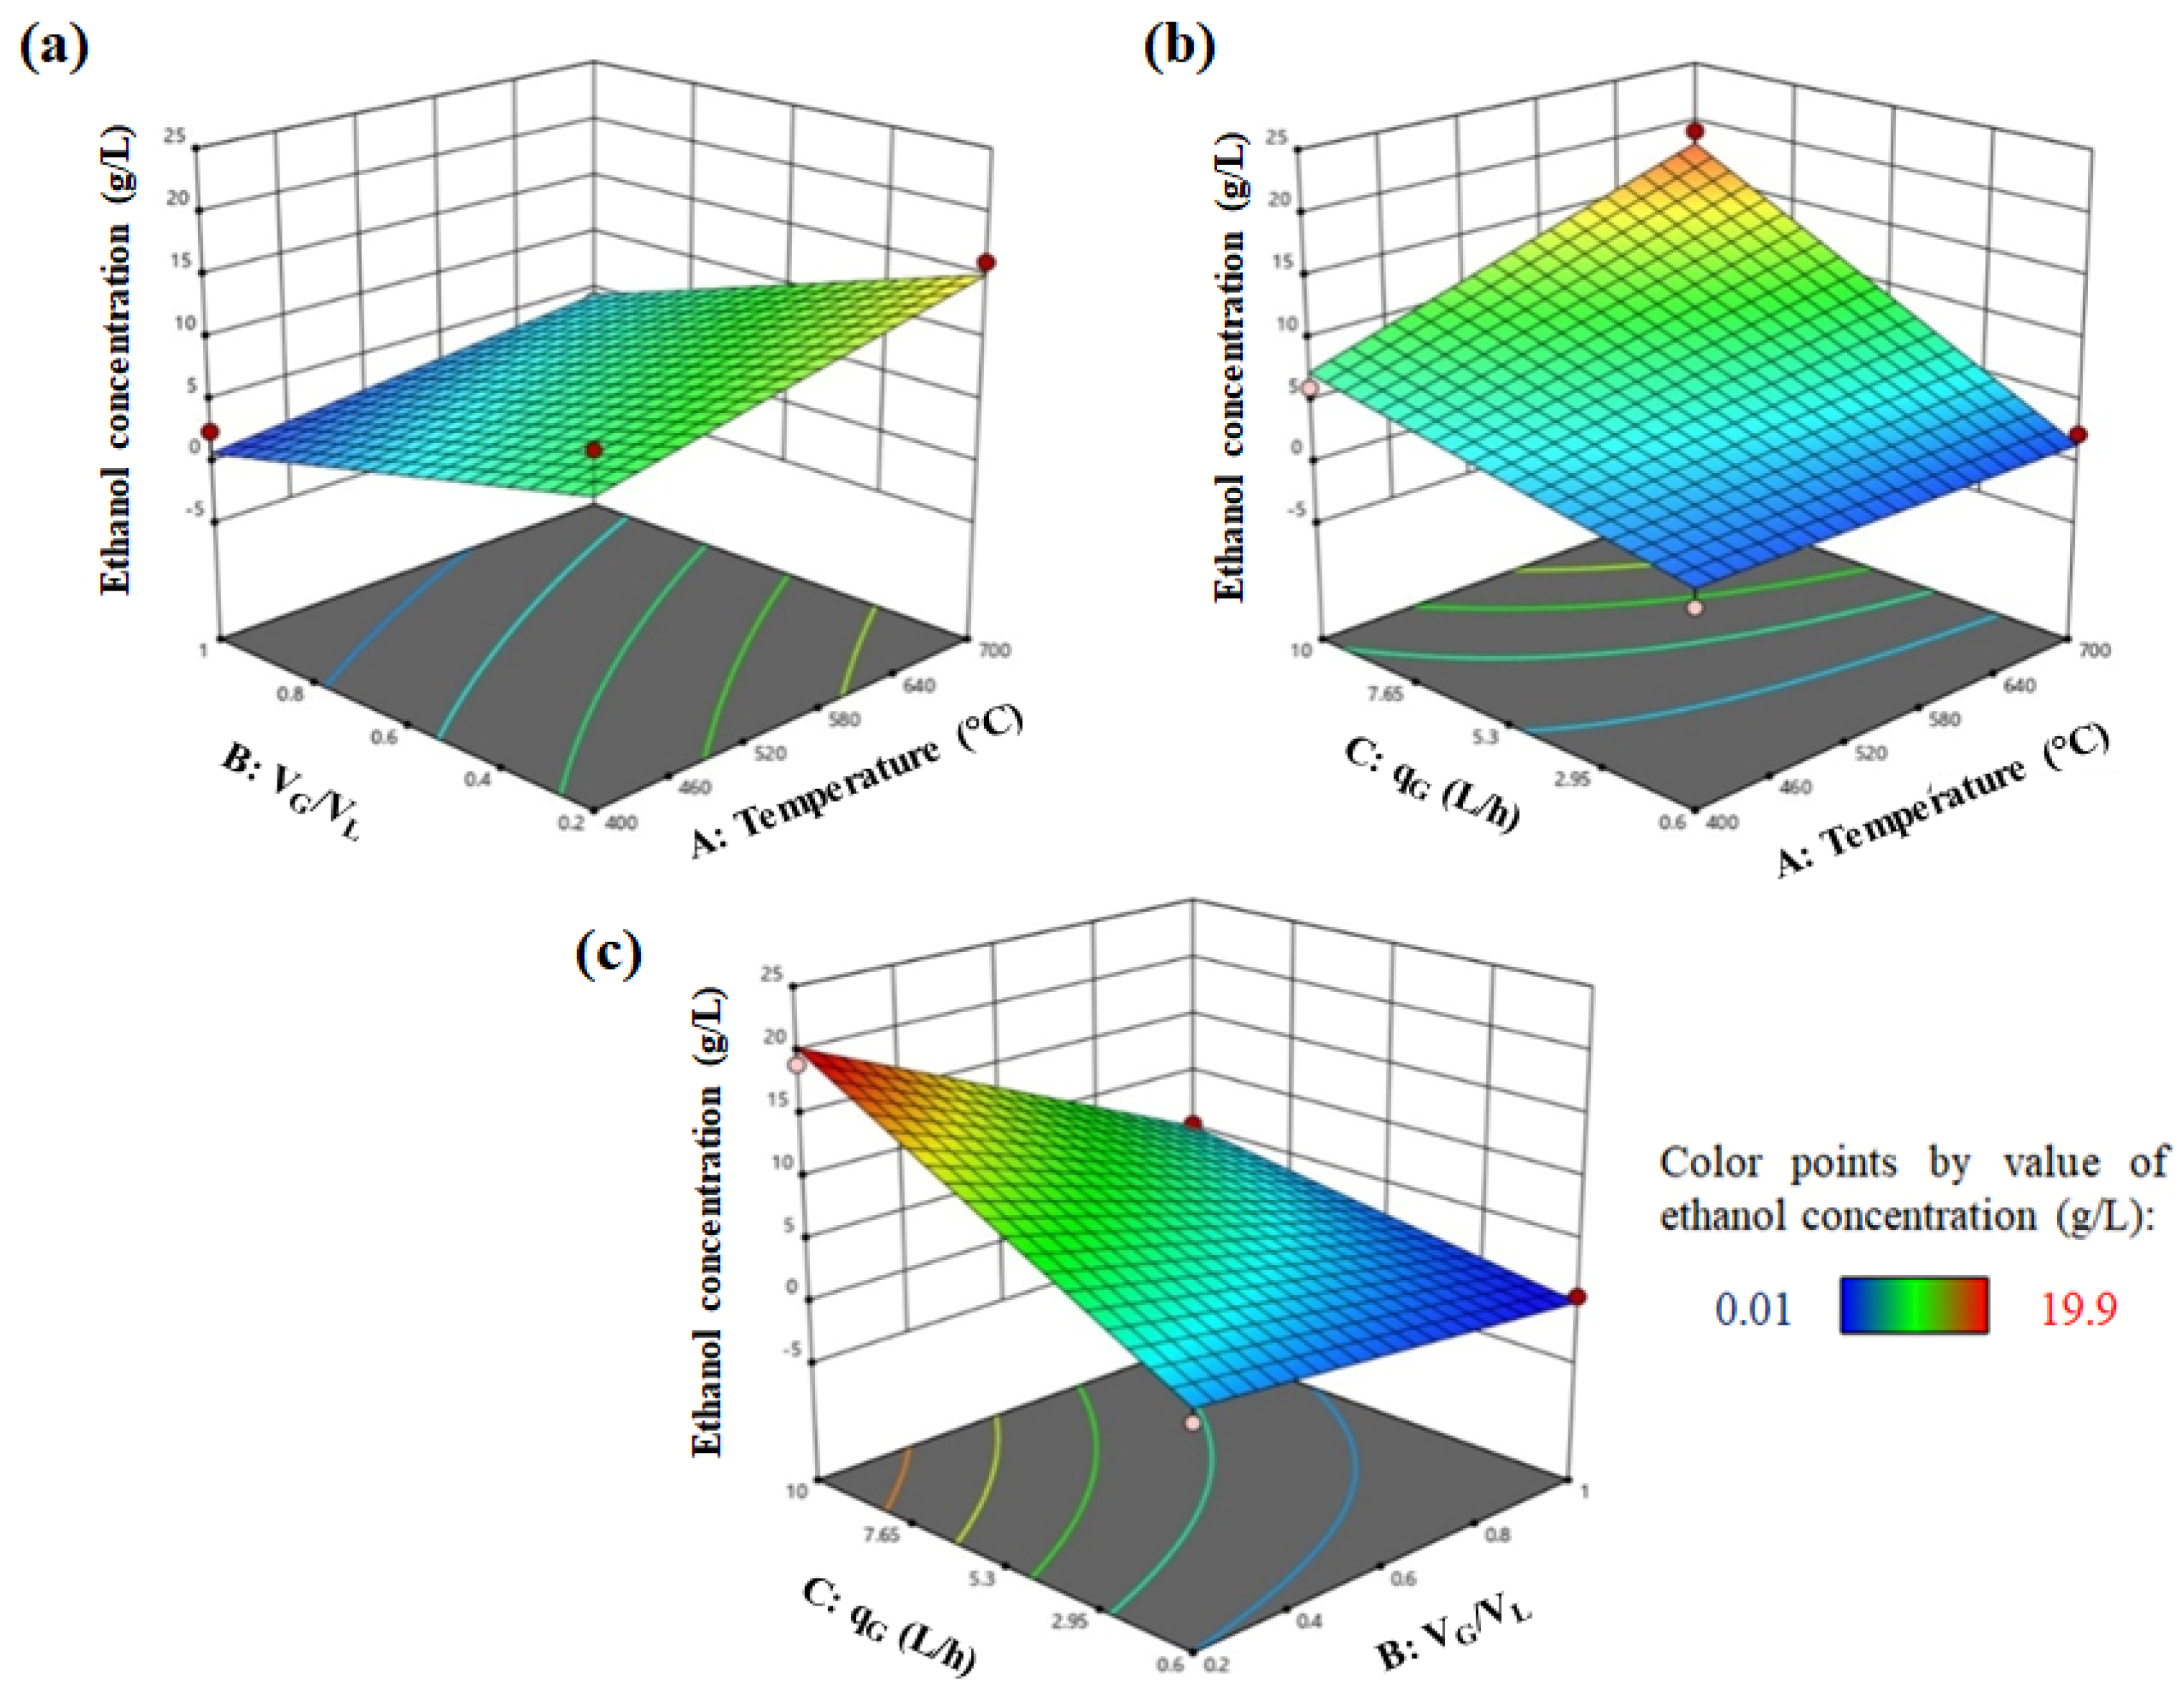
4.6.1. Semi-Batch Bioreactor

The second order regression equation, obtained to represent the relationships among the response variable, ethanol concentration obtained after 30 h, and the operating variables, namely the temperature of pyrolysis (A), the ratio VG/VL (B), and qG (C) is as follows:
Ethanol concentration = 1.06651 + 0.00345496 × A + 3.2557 × B − 0.0558511 × C − 0.0119167 × A × B + 0.00393617 × A × C − 1.55984 × B × C
The comparison between the predicted and actual values of the response variables, represented in Figure 10, and the analysis of variance (ANOVA), presented in Table 10, shows that the model can represent the trend of dependence of ethanol concentration of the selected operating variables.
From the ANOVA table, it appears that the factors, B (=VG/VL) and C (qG) significantly affect the ethanol concentration obtained after 30 h of operation of the semi-batch reactor. Both factors bear linear relationships with the response. The pyrolysis temperature, however, does not have significant effect. This can be due to close variation of gas composition in the present range of pyrolysis temperatures. Three response surface 3D plots, representing the combined effect of interaction between A-B, A-C, and B-C on the response variable, are shown in Figure 11.
From Figure 11, it is evident that the increase of variable A and C had a positive impact on the production of ethanol. This is because of the fact that with the increase of the pyrolysis temperature, T (=A) the concentration of all carbon substrates (CO and CO2), and the electron donors (H2 and CO) in the inlet gas increase, favoring the formation of ethanol. With the increase of the gas flow rate, qG (=C), the mass transfer rate was enhanced and hence the growth rates and ethanol generation rates, governed by the liquid phase concentration of CO, CO2, and H2 increased. As a consequence, the ethanol concentration increased with the increase of C. The increment of variable B (=VG/VL) had a negative impact on ethanol production. This can be explained by the fact that with the increase of VG with respect to liquid volume, the effective mass transfer to liquid phase was lowered, causing an overall decreasing trend in ethanol concentration. The optimum level of the independent variables, pyrolysis temperature, VG/VL, and qG giving the maximum ethanol concentration (=13.122 g/L) after 30 h of semi-batch operation are 648 °C, 0.46, and 6.7 L/h, respectively.

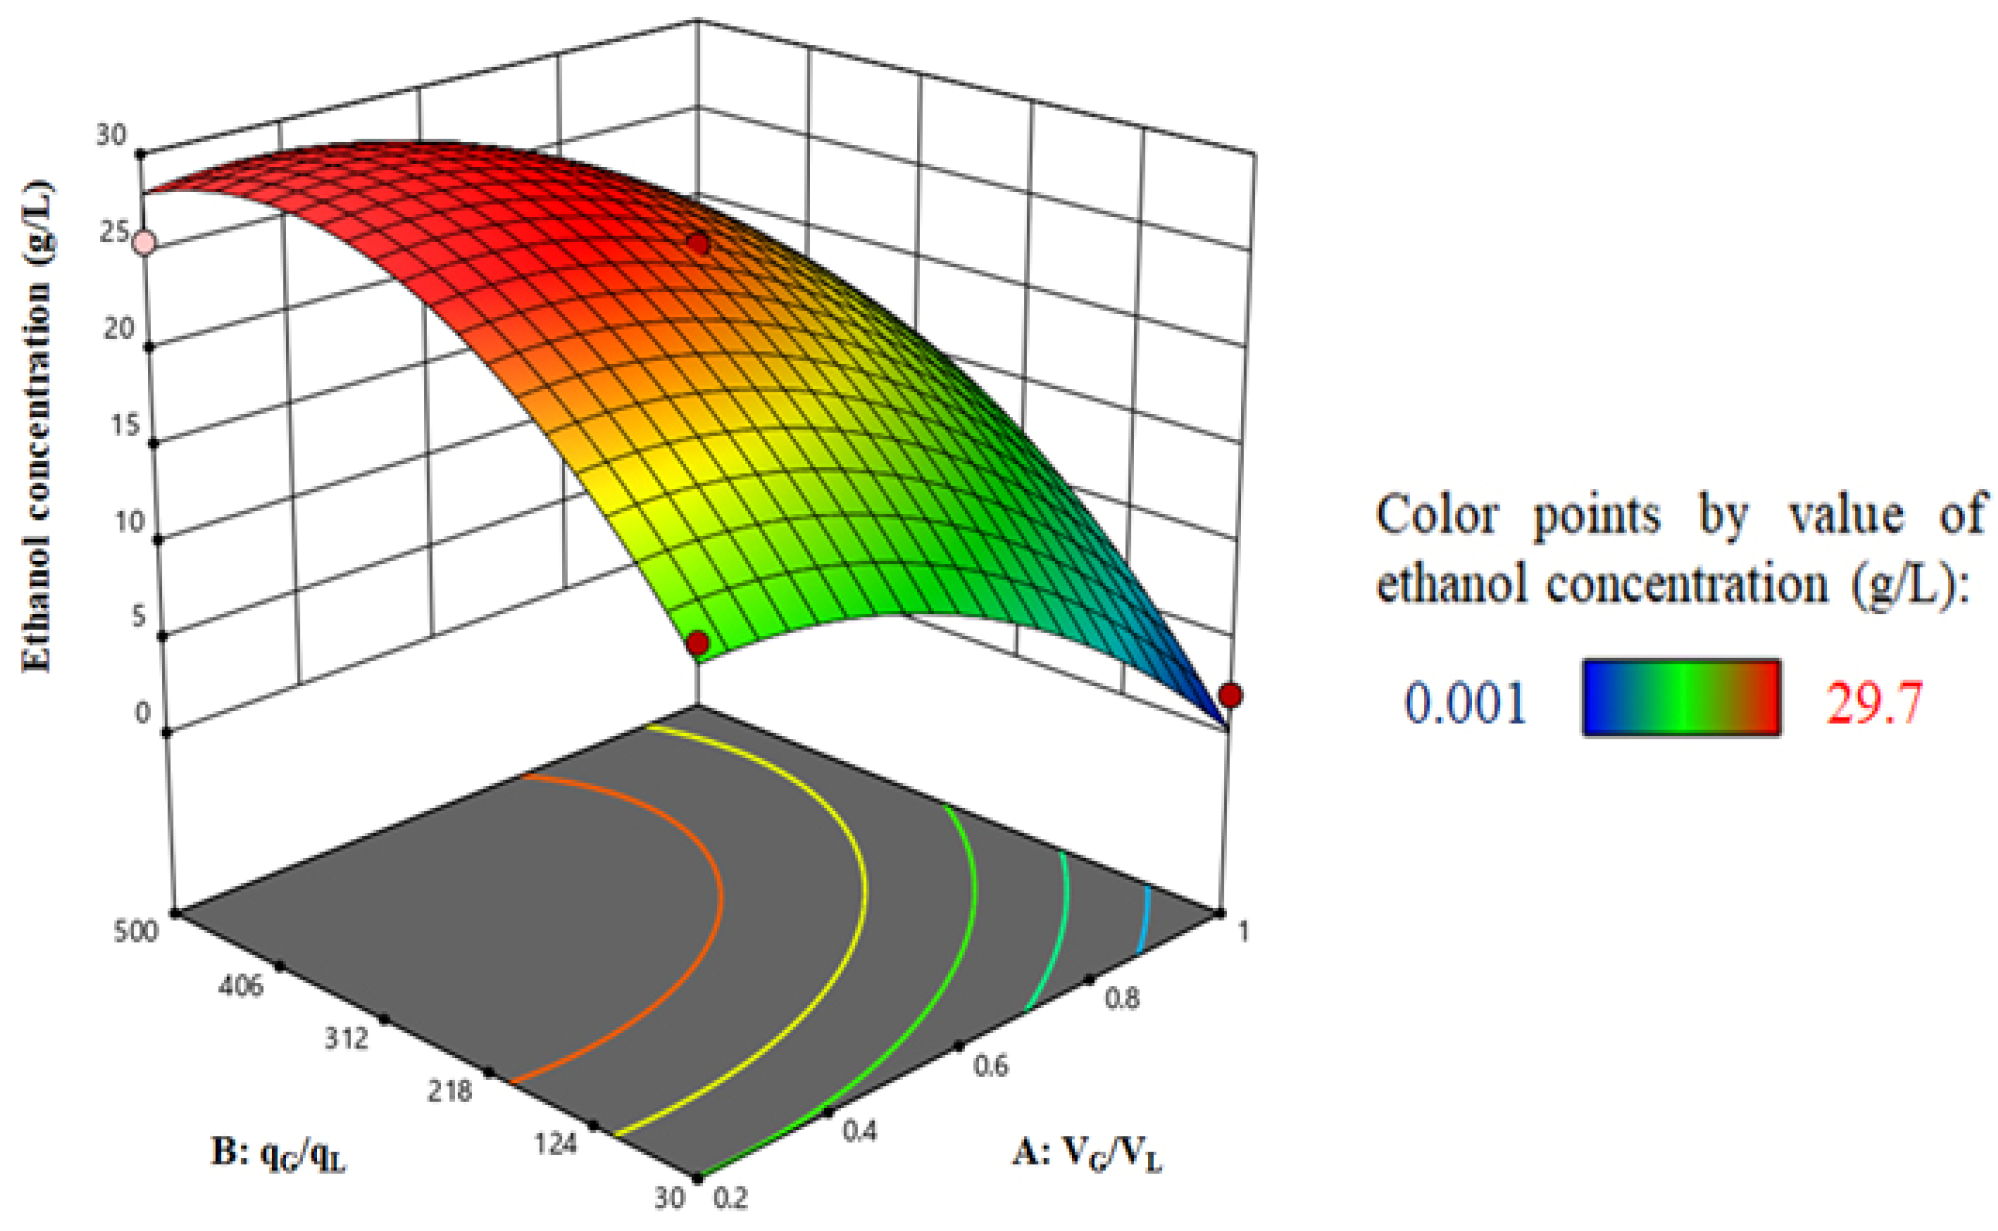
4.6.2. Syngas Fermentation in the Continuous Bioreactor

The second order regression equation, obtained to represent the relationships among the response, i.e., ethanol concentration, obtained after 300 h and the operating variables, namely, VG/VL (A), and qG/qL (B) is as follows:
Ethanol concentration (g/L) = 10.9596 + 11.9048 × A + 0.0868944 × B + 0.0101862 × A × B − 25.5316 × A2 − 0.000115026 × B2
From the comparison between the predicted and actual values of the response variables, represented in Figure 12, and from the analysis of variance (ANOVA) presented in Table 11, it appears that the model can represent the trend of dependence of ethanol concentration, obtained under 300 h of operation on the selected operating variables, A and B, very well.
From the ANOVA table, it appears that both factors, A (=VG/VL) and B (qG/qL), significantly affected the ethanol concentration obtained after 300 h of operation of the continuous reactor. While VG/VL linearly affected the response variable, the change of qG/qL shows a combined effect of second order and linear relationship. As the variation of qG/qL simultaneously affects the gas residence time for the reaction and extent of mass transfer, the influence of this factor is large. A response surface 3D plot showing the influence of both VG/VL and qG/qL is represented in Figure 13.
From Figure 13, it is evident that the increase of variable B had a positive impact on the production of ethanol from syngas fermentation. However, an increment of variable A had a negative impact on ethanol production. The optimum level of the independent variables, VG/VL and qG/qL, giving the maximum ethanol concentration (=29.450 g/L) after 300 h of continuous operation are 0.28 and 335.148, respectively.

4.7. Comparison of Semi-Batch and Continuous Operation of a Pyro-Syngas Fermenter

As the semi-batch operation is always in an unsteady state, it is not suitable for large-scale fermentation. On the contrary, continuous operation is always preferred for large-scale operation. Over 30 h, 171 mL of liquid broth containing 13.12 g/L ethanol can be produced under the optimum conditions of a semi-batch fermenter. For the continuous reactor, 0.02 L/h liquid broth with an ethanol concentration of 29.45 g/L can be produced for 300 h. The average optimum production rate of ethanol is 0.074.7 g/h, calculated by dividing the product of reactor volume (=0.171 L) and ethanol concentration (=13.12 g/L) by operating time (=30 h) obtained in semi-batch operation. In the case of continuous operation of the bioreactor, 0.589 g/h, calculated by multiplying the liquid outlet rate with ethanol concentration, can be obtained through continuous operation of the same reactor using same volumetric flow rate of gas of 6.7 L/h. However, overall, the running cost of the semi-batch bioreactor is much lower than the continuous one due to the savings in the inlet and outlet pumping rate of liquid.

4.8. Comparison with Similar Studies and Uniqueness

The operating parameters and the results of the present study are compared with similar studies in Table 12.
Most of the modelling studies on syngas fermentation are based on literature data of kinetic parameters, derived from experiments using simulated gas mixture. From Table 12, it is clear that the feed gas mixtures in those studies are mainly constituted of CO, H2, and CO2. The concentrations of CO and H2 in the gas used in those studies usually range from 32–55% and 20–32%, respectively. In the model developed by Ruggiero et al., pure CO was used [20]. No comparison of the model predictions was made with the experimental results of a truly integrated process of gasification and fermentation. The concentrations of CO and H2 used in the existing models are much higher than those of typical pyro-syngas. The unique feature of the present models for both semi-batch and continuous operation lies in the fact that the real pyro-gas composition was used as the input instead of any arbitrarily chosen composition. It is also clear from the table that although the concentrations of CO and H2 of pyro-syngas, used in the present study, are much lower than those used in other similar studies, the achieved ethanol concentration is comparable with the reported ones. Although most of the studies reported the use of pure clostridial strains, the UACJUChE1, used in the present study is the first clostridial consortium, isolated from Indian soil, which has proved to be capable of pyro-syngas fermentation.

4.9. Challenges, Model Critique, and Future Scope

The experiments were conducted in a wide range of values of different relevant parameters. For semi-batch and continuous fermenters, 17 and 13 experimental data sets were used, respectively. The agreement of the mathematical models is high for both the semi-batch and continuous modes of operation. While the values of correlation coefficient R2 and normalized root mean square error (NRMSE) are 0.88 and 10.78, respectively, for semi batch operation, those for continuous operation are 0.97 and 8.49, respectively. The values of R2 for the RSM model are 0.9540 and 0.9783 for semi-batch and continuous modes of operation, respectively. The adjusted values of R2 of the RSM model are 0.9263 and 0.9628 for semi-batch and continuous bioreactors, respectively. Thus, the predictability of the model is comparable with the previously reported studies. However, widening the range will always provide more insight into the performance of pyro-syngas fermentation reactors. For any pyrolysis temperature, the pyro-syngas composition varies for different biomasses due to the difference in the lignocellulosic composition [33]. Thus, it is expected that the optimum temperature to maximize ethanol production for semi-batch and continuous operation will vary for other feedstocks. The ethanol concentration obtained at a fixed set of parameters will also vary if the biomass is changed. To explore the possibility of using diverse lignocellulosic biomasses, experiments should be conducted with different lignocellulosic feedstocks and their mixtures. However, process models using software like ASPEN Plus V10 etc. can be used to predict the performance of pyro-syngas fermentation of other feedstocks on lab and industrial scales without conducting any experiments [33]. In the ASPEN model, if the pyrolysis temperature, the composition of feedstocks with respect to the contents of lignin, cellulose, and hemicellulose, and their respective reactions during pyrolysis are used as the inputs, the pyro-gas composition can be predicted. The performance of the fermentation of the pyro-gas can be predicted if the present model can be coupled with process modelling software. Similar studies have already been carried out by the present group to predict the performance of integrated gasification and fermentation processes for mixed lignocellulosic feedstocks [34]. In addition to the predictions of process models, economic and life cycle analyses are also important to assess the viability of pyro-syngas fermentation on large and commercial scales. Similar studies have already been carried out by the present group to predict the performance of integrated gasification and fermentation processes for mixed lignocellulosic feedstocks [35].
In the present study, pyrolytic conversion of rice straw in the temperature range of 400–700 °C was utilized for the generation of pyro-oil, pyro-gas, and pyro-char. As well as using pyro-syngas for fermentation, pyro-oil can be upgraded to liquid fuel through de-oxygenation and so on, while pyro-char can be used as an adsorbent for wastewater treatment and soil amendment. Different chemicals can also be derived from the pyro-oil portion [4]. As raw materials like rice straw etc. are agro-wastes, overall CO2 avoidance is expected to be high. Compared to syngas fermentation using gasification as the upstream process, integration with pyrolysis seems to be more environmentally friendly, particularly for the scope of application of pyro-char for soil amendment resulting in carbon capture.
Although not very unexpected, the capability of the present consortium to utilize H2 and CO2 besides CO may open up more research avenues. The scope of the study can be enhanced by testing the model using the kinetic growth parameters of other syngas fermenting microbial strains and consortia for further generalization.

5. Conclusions

Deterministic mathematical models along with experimental data on the bioconversion of pyro-syngas to ethanol and acetic acid in a gas-sparged stirred tank reactor, operated in semi-batch and continuous modes, have been reported for the first time. The locally isolated clostridial consortium UACJUChE1 was proved to be capable of utilizing CO, CO2, and H2 present in the pyro-syngas. The mathematical models have been validated through the comparison of the predictions with the experimental results. The optimization of the performance of the semi-batch and continuous modes of operation was achieved using response surface methodology. Since pyrolysis is used as the precursor process for syngas fermentation, other valuables products like pyro-oil and pyro-char are also generated, and the criterion of zero-waste generation for the circular economy concept is fulfilled. It is expected that the mathematical model developed in the present study can be used for the scale-up purposes needed for commercialization. The outcome of this research study can also be useful for the utilization of other lignocellulosic agro-wastes of Indian and other origins. Further data on the pyro-syngas fermentation should also be generated to check the validity of the model for other feedstocks.

Author Contributions

Methodology, D.M., R.C., R.K.C. and M.Y.M.; Software, D.M. and R.C.; Validation, D.M. and R.C.; Formal analysis, R.K.C. and M.Y.M.; Investigation, D.M., R.C. and R.K.C.; Resources, R.K.C. and M.Y.M.; Writing—original draft, R.C.; Writing—review and editing, R.K.C. and M.Y.M.; Supervision, R.C. All authors have read and agreed to the published version of the manuscript.

Funding

This research received no external funding.

Data Availability Statement

The original contributions presented in the study are included in the article, further inquiries can be directed to the corresponding author and R. Chowdhury (Research supervisor) or Dinabandhu Manna (First author).

Acknowledgments

The publication is due to research collaboration between Ranjana Chowdhury of JU, Kolkata and IBEaM, UiT. The authors are indebted to the learned reviewers for their valuable suggestions for the improvement of the manuscript.

Conflicts of Interest

The authors declare no conflict of interest.

References

  1. Chowdhury, R.; Ghosh, S.; Debnath, B.; Manna, D. Indian agro-wastes for 2G biorefineries: Strategic decision on conversion processes. In Sustainable Energy Technology and Policies: A Transformational Journey; Springer: Singapore, 2018; Volume 1, pp. 353–373. [Google Scholar]
  2. Kaur, M.; Malik, D.P.; Malhi, G.S.; Sardana, V.; Bolan, N.S.; Lal, R.; Siddique, K.H. Rice residue management in the Indo-Gangetic Plains for climate and food security. A review. Agron. Sustain. Dev. 2022, 42, 92. [Google Scholar] [CrossRef]
  3. Hassan, M.K.; Chowdhury, R.; Ghosh, S.; Manna, D.; Pappinen, A.; Kuittinen, S. Energy and environmental impact assessment of Indian rice straw for the production of second-generation bioethanol. Sustain. Energy Technol. Assess. 2021, 47, 101546. [Google Scholar] [CrossRef]
  4. Chowdhury, R.; Ghosh, S.; Manna, D.; Das, S.; Dutta, S.; Kleinsteuber, S.; Strauber, H.; Hassan, M.K.; Kuittinen, S.; Pappinen, A. Hybridization of sugar-carboxylate-syngas platforms for the production of bio-alcohols from lignocellulosic biomass (LCB)–A state-of-the-art review and recommendations. Energy Convers. Manag. 2019, 200, 112111. [Google Scholar] [CrossRef]
  5. Pacheco, M.; Moura, P.; Silva, C. A Systematic Review of Syngas Bioconversion to Value-Added Products from 2012 to 2022. Energies 2023, 16, 3241. [Google Scholar] [CrossRef]
  6. Faraji, M.; Saidi, M. Experimental and simulation study of peanut shell-derived activated carbon and syngas production via integrated pyrolysis-gasification technique. Process Saf. Environ. Prot. 2023, 171, 874–887. [Google Scholar] [CrossRef]
  7. Li, N.; Pan, Y.; Yan, Z.; Liu, Q.; Yan, Y.; Liu, Z. Cornstalk pyrolysis for syngas in a two-stage electromagnetic induction reactor. Fuel 2023, 336, 127124. [Google Scholar] [CrossRef]
  8. Chen, D.; Zhuang, X.; Gan, Z.; Cen, K.; Ba, Y.; Jia, D. Co-pyrolysis of light bio-oil leached bamboo and heavy bio-oil: Effects of mass ratio, pyrolysis temperature, and residence time on the biochar. Chem. Eng. J. 2022, 437, 135253. [Google Scholar] [CrossRef]
  9. Li, X.; Liu, P.; Huang, S.; Wu, S.; Li, Y.; Wu, Y.; Lei, T. Study on the mechanism of syngas production from catalytic pyrolysis of biomass tar by Ni–Fe catalyst in CO2 atmosphere. Fuel 2023, 335, 126705. [Google Scholar] [CrossRef]
  10. Esquivel-Elizondo, S.; Delgado, A.G.; Rittmann, B.E.; Krajmalnik-Brown, R. The effects of CO2 and H2 on CO metabolism by pure and mixed microbial cultures. Biotechnol. Biofuels 2017, 10, 220. [Google Scholar] [CrossRef]
  11. Kennes, D.; Abubackar, H.N.; Diaz, M.; Veiga, M.C.; Kennes, C. Bioethanol production from biomass: Carbohydrate vs syngas fermentation. J. Chem. Technol. Biotechnol. 2016, 91, 304–317. [Google Scholar] [CrossRef]
  12. Diender, M. Exploration of Microbial Systems as Biocatalysts for Conversion of Synthesis Gas to Bio-Based Chemicals. Ph.D. Dissertation, Wageningen University and Research, Wageningen, The Netherlands, 2019. Available online: https://research.wur.nl/en/publications/exploration-of-microbial-systems-as-biocatalysts-for-conversion-o (accessed on 12 October 2023).
  13. Siebler, F.; Lapin, A.; Takors, R. Synergistically applying 1-D modeling and CFD for designing industrial scale bubble column syngas bioreactors. Eng. Life Sci. 2020, 20, 239–251. [Google Scholar] [CrossRef] [PubMed]
  14. Chen, J.; Gomez, J.A.; Höffner, K.; Barton, P.I.; Henson, M.A. Metabolic modeling of synthesis gas fermentation in bubble column reactors. Biotechnol. Biofuels 2015, 8, 89. [Google Scholar] [CrossRef] [PubMed]
  15. Vandecasteele, J. Experimental and Modelling Study of Pure-Culture Syngas Fermentation for Biofuels Production. Master’s Thesis, Universiteit Gent, Gent, Belgium, 2016. Volume 356. Available online: https://lib.ugent.be/catalog/rug01:002275054 (accessed on 10 October 2023).
  16. Almeida Benalcázar, E.; Noorman, H.; MacielFilho, R.; Posada, J.A. Modeling ethanol production through gas fermentation: A biothermodynamics and mass transfer-based hybrid model for microbial growth in a large-scale bubble column bioreactor. Biotechnol. Biofuels 2020, 13, 59. [Google Scholar] [CrossRef] [PubMed]
  17. Mohammadi, M.; Mohamed, A.R.; Najafpour, G.D.; Younesi, H.; Uzir, M.H. Kinetic studies on fermentative production of biofuel from synthesis gas using Clostridium ljungdahlii. Sci. World J. 2014, 2014, 910590. [Google Scholar] [CrossRef] [PubMed]
  18. Puiman, L.; Almeida Benalcázar, E.; Picioreanu, C.; Noorman, H.J.; Haringa, C. Downscaling Industrial-Scale Syngas Fermentation to Simulate Frequent and Irregular Dissolved Gas Concentration Shocks. Bioengineering 2023, 10, 518. [Google Scholar] [CrossRef] [PubMed]
  19. De Medeiros, E.M.; Posada, J.A.; Noorman, H.; Filho, R.M. Dynamic modeling of syngas fermentation in a continuous stirred-tank reactor: Multi-response parameter estimation and process optimization. Biotechnol. Bioeng. 2019, 116, 2473–2487. [Google Scholar] [CrossRef] [PubMed]
  20. Ruggiero, G.; Lanzillo, F.; Raganati, F.; Russo, M.E.; Salatino, P.; Marzocchella, A. Bioreactor modelling for syngas fermentation: Kinetic characterization. Food Bioprod. Process. 2022, 134, 1–18. [Google Scholar] [CrossRef]
  21. Sluiter, A.; Hames, B.; Ruiz, R.; Scarlata, C.; Sluiter, J.; Templeton, D.; Crocker, D.L.A.P. Determination of structural carbohydrates and lignin in biomass. Lab. Anal. Proced. 2008, 1617, 1–16. [Google Scholar]
  22. Chowdhury, R.; Sarkar, A. Reaction kinetics and product distribution of slow pyrolysis of Indian textile wastes. Int. J. Chem. React. Eng. 2012, 10, A67. [Google Scholar] [CrossRef]
  23. Sarkar, A.; Chowdhury, R. Co-pyrolysis of paper waste and mustard press cake in a semi-batch pyrolyzer—Optimization and bio-oil characterization. Int. J. Green Energy 2016, 13, 373–382. [Google Scholar] [CrossRef]
  24. Ghosh, S.; Pathak, S.; Manna, D.; Chowdhury, R. Acidogenic mixed consortium isolated from soil of agricultural field: Acid production behaviour and growth kinetics under the influence of pretreatment hydrolysate of rice straw (RS). Indian Chem. Eng. 2021, 63, 206–218. [Google Scholar] [CrossRef]
  25. Gill, N.K.; Appleton, M.; Baganz, F.; Lye, G.J. Quantification of power consumption and oxygen transfer characteristics of a stirred miniature bioreactor for predictive fermentation scale-up. Biotechnol. Bioeng. 2008, 100, 1144–1155. [Google Scholar] [CrossRef] [PubMed]
  26. Wang, T.; Wang, Q.; Soklun, H.; Qu, G.; Xia, T.; Guo, X.; Lia, H.; Zhu, L. A green strategy for simultaneous Cu (II)-EDTA decomplexation and Cu precipitation from water by bicarbonate-activated hydrogen peroxide/chemical precipitation. Chem. Eng. J. 2019, 370, 1298–1309. [Google Scholar] [CrossRef]
  27. Abubackar, H.N.; Veiga, M.C.; Kennes, C. Biological conversion of carbon monoxide: Rich syngas or waste gases to bioethanol. Biofuels Bioprod. Biorefining 2011, 5, 93–114. [Google Scholar] [CrossRef]
  28. Green, D.W.; Perry, R.H. Perry’s Chemical Engineers’ Handbook; McGraw-Hill Education: New York, NY, USA, 2008. [Google Scholar]
  29. Phillips, J.R.; Clausen, E.C.; Gaddy, J.L. Synthesis gas as substrate for the biological production of fuels and chemicals. Appl. Biochem. Biotechnol. 1994, 45, 145–157. [Google Scholar] [CrossRef]
  30. Mohammadi, M.; Mohamed, A.R.; Najafpour, G.; Younesi, H.; Uzir, M.H. Clostridium ljungdahlii for production of biofuel from synthesis gas. Energy Sources Part A Recovery Util. Environ. Eff. 2016, 38, 427–434. [Google Scholar]
  31. Fox, J.D.; Kerby, R.L.; Roberts, G.P.; Ludden, P.W. Characterization of the CO-induced, CO-tolerant hydrogenase from Rhodospirillum rubrum and the gene encoding the large subunit of the enzyme. J. Bacteriol. 1996, 178, 1515–1524. [Google Scholar] [CrossRef] [PubMed]
  32. Rajagopalan, S.; Datar, R.P.; Lewis, R.S. Formation of ethanol from carbon monoxide via a new microbial catalyst. Biomass Bioenergy 2002, 23, 487–493. [Google Scholar] [CrossRef]
  33. Ranzi, E.; Cuoci, A.; Faravelli, T.; Frassoldati, A.; Migliavacca, G.; Pierucci, S.; Sommariva, S. Chemical kinetics of biomass pyrolysis. Energy Fuels 2008, 22, 4292–4300. [Google Scholar] [CrossRef]
  34. Pati, S.; De, S.; Chowdhury, R. Exploring the hybrid route of bio-ethanol production via biomass co-gasification and syngas fermentation from wheat straw and sugarcane bagasse: Model development and multi-objective optimization. J. Clean. Prod. 2023, 395, 136441. [Google Scholar] [CrossRef]
  35. Pati, S.; De, S.; Chowdhury, R. Integrated techno-economic, investment risk and life cycle analysis of Indian lignocellulosic biomass valorisation via co-gasification and syngas fermentation. J. Clean. Prod. 2023, 423, 138744. [Google Scholar] [CrossRef]
Figure 1. Schematic diagram of the pyrolysis of rice straw.
Energies 17 00562 g001
Figure 2. Schematic representation of the stirred bioreactor.
Energies 17 00562 g002
Figure 3. Schematic diagram of the Wood–Ljungdahl pathway for the production of ethanol from syngas (Acetyl-CoA: Acetyl coenzyme A; CODH: Carbon monoxide dehydrogenase; FDH: Formate dehydrogenase; Syngas: Synthesis gas).
Energies 17 00562 g003
Figure 4. Composition of pyro-syngas produced at different pyrolysis temperatures.
Energies 17 00562 g004
Figure 5. Simulated profile for semi-batch reactor ((a): Ethanol; (b): acetic acid; (c): gas conversion %).
Energies 17 00562 g005
Figure 6. Simulated profile for the continuous reactor ((a): ethanol concentration; (b): acetic acid concentration and (c): % gas conversion).
Energies 17 00562 g006
Figure 7. Ethanol production in the semi-batch reactor (pyrolysis temperature = 600 °C, VG/VL = 0.5, and qG = 6 Lpm).
Energies 17 00562 g007
Figure 8. Ethanol production from syngas fermentation in the continuous reactor (model prediction and experimental value). ((a):Variation of experimental and simulated ethanol concentration with VG/VL (=0.6–1) at a fixed value of qG/qL = 250; (b) Variation of experimental and simulated ethanol concentration with qG/qL (=30–250) at a fixed value of VG/VL (=0.6)).
Energies 17 00562 g008
Figure 9. Effect of the gas residence time (GRT) and dilution factor (D) on the volumetric productivity of ethanol from syngas fermentation.
Energies 17 00562 g009
Figure 10. Comparison between the RSM-predicted and experimental values of ethanol concentration at 30 h of semi-batch operation.
Energies 17 00562 g010
Figure 11. Response surface plots for the optimization of ethanol (g/L) production from syngas fermentation ((ac): interaction between AB, AC and BC respectively).
Energies 17 00562 g011
Figure 12. Comparison between the RSM-predicted and experimental values of ethanol concentration at 300 h of continuous operation.
Energies 17 00562 g012
Figure 13. Response surface plots for the optimization of ethanol (g/L) production from syngas fermentation.
Energies 17 00562 g013
Table 1. Chemical composition of rice straw.
ComponentCelluloseHemicelluloseLignin
% (w/w)38.31 ± 1.6721.09 ± 0.92±0.59
Table 2. Operating parameters used for the semi-batch reactor according to RSM.
SL No.T (°C)VG/VLqG (L/h)CO:CO2:H2:CH4:N2VG (L)VL (L)
15500.65.322.8:10.5:17.1:8.7:21.71.1251.875
25500.65.322.8:10.5:17.1:8.7:21.71.1251.875
34000.61017.0:9.1:13.3:7.1:27.01.1251.875
470015.323.1:10.6:17.2:8.8:21.51.51.5
540015.317.0:9.1:13.3:7.1:27.01.51.5
65500.21022.8:10.5:17.1:8.7:21.70.52.5
77000.25.323.1:10.6:17.2:8.8:21.50.52.5
84000.25.317.0:9.1:13.3:7.1:27.00.52.5
955011022.8:10.5:17.1:8.7:21.71.51.5
107000.60.623.1:10.6:17.2:8.8:21.51.1251.875
117000.61023.1:10.6:17.2:8.8:21.51.1251.875
125500.20.622.8:10.5:17.1:8.7:21.70.52.5
1355010.622.8:10.5:17.1:8.7:21.71.51.5
145500.65.322.8:10.5:17.1:8.7:21.71.1251.875
155500.65.322.8:10.5:17.1:8.7:21.71.1251.875
165500.65.322.8:10.5:17.1:8.7:21.71.1251.875
174000.60.617.0:9.1:13.3:7.1:27.01.1251.875
Table 3. Operating parameters for continuous operation according to RSM.
SL No.VG/VLqG/qLVG (L)VL (L)qG (L/h)qL (L/h)
115001.51.5100.02
21301.51.50.60.02
30.62651.1251.8755.30.02
40.62651.1251.8755.30.02
50.62651.1251.8755.30.02
60.2300.52.50.60.02
70.62651.1251.8755.30.02
80.25000.52.5100.02
90.62651.1251.8755.30.02
100.6597.31.1251.87511.940.02
110.032650.12.95.30.02
120.601.1251.87500.02
131.162651.621.385.30.02
Table 4. Kinetics of growth and kinetics of mixed clostridial consortium—UACJUChE1.
ProcessSpecific Growth or Product Generation Rate (µ)
(i) Biomass growth on CO μ 1 = μ 1 m a x C C O K C O + C C O + C C O 2 K I , C O K I , U A K I , U A + C U A
(ii) Biomass growth on CO2 and H2 μ 2 = μ 2 m a x C C O 2 K C O 2 + C C O 2 C H 2 K H 2 + C H 2 K I ,   C O h y K I ,   C O h y + C C O K I , U A K I , U A + C U A
(iii) Ethanol production from CO q E 1 = q E 1 m a x C C O K C O + C C O + C C O 2 K I , C O C U A K U A + C U A
(iv) Ethanol production from CO2 and H2 q E 2 = q E 2 m a x C C O 2 K C O 2 + C C O 2 C H 2 K H 2 + C H 2 K I ,   C O h y K I ,   C O h y + C C O C U A K U A + C U A
(v) Conversion of acetate into ethanol using CO as electron donor q E 3 = q E 3 m a x C C O K C O + C C O + C C O 2 K I , C O C U A K U A A A + C U A
(vi) Conversion of acetate into ethanol using H2 as electron donor q E 4 = q E 4 m a x C H 2 K H 2 + C H 2 C U A K U A A A + C U A K I ,   C O h y K I ,   C O h y + C C O
Specific production rate of ethanol = 1 C X d C E d t and C E is ethanol concentration.
Table 5. Variables with coded levels used for the semi-batch experimental run.
Input VariablesUnitCoded Variable LevelModel Response
−101
Temperature (A)°C400550700Ethanol concentration (g/L) after 30 h operation
VG/VL (B) 0.20.61
qG (C)L/h0.65.310
Table 6. Variables with coded levels used for the experimental run.
Input VariablesUnitCoded Variable LevelModel Response
−101
VG/VL (A)-0.20.61Ethanol concentration (g/L) after 300 h operation
qG/qL (B)-30265500
Table 7. Yield of the pyro-products.
TemperatureYield of Pyro-Products
°CPyro-CharPyro-OilPyro-Syngas
40041.39 ± 1.9727.01 ± 1.1231.60 ± 1.01
45037.98 ± 1.3227.33 ± 1.0134.69 ± 1.29
50034.91 ± 1.8928.02 ± 1.3937.07 ± 1.33
55030.09 ± 1.0827.07 ± 1.0242.84 ± 1.40
60028.51 ± 0.5225.37 ± 0.7246.12 ± 2.11
65025.34 ± 0.3223.98 ± 0.1550.68 ± 2.39
70023.32 ± 0.3322.09 ± 0.1754.59 ± 2.42
Table 8. Yield coefficient for different process [15].
ProcessYield Coefficients (mol/mol)
(i) Biomass growth on CO Y C O X = 39.91 , Y A A X   9.23 , Y C O 2 X = 19.44
(ii) Biomass growth on CO2 and H2 Y H 2 X = 147.06 , Y A A X   36.27 , Y C O 2 X = 73.55
(iii) Ethanol production from CO Y C O E C O = 6 , Y C O 2 E C O = 4
(iv) Ethanol production from CO2 and H2 Y C O 2 E C O 2 = 2 , Y H 2 E C O 2 = 6
(v) Conversion of acetate into ethanol using CO as electron donor Y A A E A A C O = 1 , Y C O E A A C O = 2 , Y C O 2 E A A C O = 2 ,
(vi) Conversion of acetate into ethanol using H2 as electron donor Y H 2 E A A H 2 = 2 , Y A A E A A H 2 = 1
Table 9. Values of mass transfer coefficients, Henry’s constants, and kinetic parameters.
SymbolSignificance UnitSource
K L a C O Product of mass transfer coefficient (mh−1) and specific surface
area (m2/m3) of CO in the bioreactor
23.5–100.7h−1Determined
K L a C O 2 Product of mass transfer coefficient (mh−1) and specific surface
area (m2/m3) of CO2 in the bioreactor
27–116.7h−1Determined
K L a H 2 Product of mass transfer coefficient (mh−1) and specific surface
area (m2/m3) of H2 in the bioreactor
20–87.4h−1Determined
H C O Henry’s law constant of CO0.0008mol/L/atm[28]
H H 2 Henry’s law constant of CO20.00066mol/L/atm[28]
H C O 2 Henry’s law constant of H20.025mol/L/atm[28]
μ 1 m a x Maximum specific growth rate on CO0.192h−1Determined
μ 2 m a x Maximum specific growth rate on CO2 and H20.045h−1Determined
q 1 m a x Maximum specific production rate of ethanol from CO0.20h−1[15]
q 2 m a x Maximum specific production rate of ethanol from CO2 and H20.0001h−1[15]
q 3 m a x Maximum specific production rate of ethanol through conversion of acetate using CO as electron donor0.20h−1[15]
q 4 m a x Maximum specific production rate of ethanol through conversion of acetate using H2 as electron donor0.20h−1[15]
K C O Saturation constant for CO for growth0.000078mol/L[15]
K H 2 Saturation constant for H2 for growth0.00022mol/L[15]
K C O 2 Saturation constant for CO2 for growth0.00022mol/L[15]
K U A Saturation constant of acetic acid for ethanol production from CO/CO2 and H20.0005mol/L[15]
K U A A c Saturation constant of acetic acid for ethanol production from acetate0.0005mol/L[15]
K i , C O Inhibition constant of CO for growth on CO0.002mol/L[15]
K i , C O H y Inhibition constant of CO for growth on CO2 and H27 × 10−9mol/L[15]
K i , U A Inhibition constant of acetic acid for growth on CO/CO2 and H20.0104mol/L[15]
Table 10. ANOVA table for the semi-batch bioreactor.
SourceSum of SquaresdfMean SquareF-Valuep-Value
Model534.72689.1234.53<0.0001significant
A-Temperature53.05153.0520.550.0011
B-VG/VL171.221171.2266.34<0.0001
C-qG243.211243.2194.23<0.0001
AB2.0412.040.79230.3943
AC30.80130.8011.930.0062
BC34.40134.4013.330.0045
Residual25.81102.58
Lack of Fit25.8164.30
Pure Error0.000040.0000
Cor Total560.5316
(Std. Dev. 1.61; Mean 7.21; C.V. (%) 22.30; R2 0.9540; Adjusted R2 0.9263).
Table 11. ANOVA table for the continuous bioreactor.
SourceSum of SquaresdfMean SquareF-Valuep-Value
Model1142.095228.4263.15<0.0001significant
A-VG/VL329.071329.0790.97<0.0001
B-qG/qL453.601453.60125.40<0.0001
AB3.6713.671.010.3475
A2116.091116.0932.090.0008
B2280.711280.7177.61<0.0001
Residual25.3273.62
Lack of Fit25.3238.44
Pure Error0.000040.0000
Cor Total1167.4112
(Std. Dev. 1.90; Mean 19.06; C.V. (%) 9.98; R2 0.9783; Adjusted R2 0.9628).
Table 12. Comparison of operating parameters and results of the present study with similar studies.
Feed Gas
Composition
Mode of OperationMicroorganism
Used
Maximum Ethanol Concentration (g/L)Reference
CO:CO2:H2:N2
32:8:32:28
BatchClostridium
ljungdahlii
0.778[15]
H2:CO
75:25
ContinuousClostridium
ljungdahlii
1.304[16]
CO:CO2:H2:inert
55:10:20:15
ContinuousClostridium
ljungdahlii
45.0[19]
100% COBatchClostridium
carboxidivorans
0.4[20]
100% COContinuousClostridium
carboxidivorans
5.6[20]
CO:CO2:H2:CH4: N2
17.0:9.1:13.3:7.1:27.0;
22.8:10.5:17.1:8.7:21.7;
23.1:10.6:17.2:8.8:21.5
Semi-batchClostridial consortium, UACJUChE113.1Present
study
CO:CO2:H2:CH4: N2
23.1:10.6:17.2:8.8:21.5
ContinuousClostridial consortium, UACJUChE129.4Present
study
Disclaimer/Publisher’s Note: The statements, opinions and data contained in all publications are solely those of the individual author(s) and contributor(s) and not of MDPI and/or the editor(s). MDPI and/or the editor(s) disclaim responsibility for any injury to people or property resulting from any ideas, methods, instructions or products referred to in the content.

