Article

Environmental Assessment of Hydrothermal Treatment of Wet Bio-Residues from Forest-Based and Agro-Industries into Intermediate Bioenergy Carriers

1
CA.RE. FOR. Engineering, Via Giovanni Boccaccio 71, 50133 Firenze, Italy
2
The Netherlands Organization for Applied Scientific Research (TNO), Westerduinweg 3, 1755 LE Petten, The Netherlands
3
TORWASH BV, Welgelegen 1, 1754 JK Burgerbrug, The Netherlands
*
Author to whom correspondence should be addressed.
Energies 2024, 17(3), 560; https://doi.org/10.3390/en17030560
Submission received: 14 September 2023 / Revised: 6 December 2023 / Accepted: 10 January 2024 / Published: 24 January 2024
(This article belongs to the Section A4: Bio-Energy)

Abstract

:
Hydrothermal carbonization (HTC) of low quality, wet biogenic residues into intermediate bioenergy carriers can potentially contribute to a more flexible and stable renewable energy system and reduce environmental impacts compared to current residue disposal practices. This study quantifies the environmental impacts via life cycle assessment (LCA) of a novel hydrothermal process for the treatment on an industrial scale of application of three wet biogenic residues (paper bio-sludge, olive pomace, and orange peel) into bioenergy carriers, i.e., solid pellets and biogas. A comprehensive attributional cradle-to-gate life cycle assessment (LCA) was conducted; the life cycle impact assessment (LCIA) utilised the ReCiPe impact assessment method. A selection of 10 significant impact categories was prioritised. Reliability of this categorization was also ensured through a sensitivity analysis carried out using Monte Carlo simulation. Climate change, particulate matter formation and terrestrial acidification impact categories showed the highest reliability, while for freshwater ecotoxicity and freshwater eutrophication impact categories in the study suggest the need for more robust data and further investigation. The climate change impact category presents the following values, as kg CO2eq/tresidue: pulp and paper bio-sludge (PPB), 17.9; olive pomace (OP), −1290; orange peel (ORP), −1301. The LCA study compared electricity yields of the hydrothermal treatment process with conventional treatment processes for each of the target residue streams. The environmental performance of the proposed hydrothermal treatment benefits significantly from the combination of intermediate bioenergy carriers (pellets) from the solid fraction with biogas production from the liquid fraction. Avoided emissions due to the heat recovery provide further environmental benefits. The LCIA results show that the carbon footprint of the F-CUBED production system, as kgCO2eq/kWhe, accounts for –4.56, −0.63, and −0.25 for paper bio-sludge, olive pomace and orange peel, respectively.

1. Introduction

Europe faces persistent environmental problems. Above all, the impacts of climate change resulting from human activities are expected to intensify [1], increasing the effects that already affect Europe in various forms, depending on the region, such as biodiversity loss, decreasing crop yields, extreme weather events, heatwaves, forest fires and floods, and environmental risks to human health and well-being [2].
The European Union is implementing measures to significantly decrease its greenhouse gas (GHG) emissions in order to meet its 2030 target and, even more, to achieve climate neutrality by 2050. Preliminary data indicates that the EU’s net emissions in 2021 were 30.41% lower than 1990 levels, meeting the bloc’s 2030 target of a 55% net reduction in greenhouse gas emissions from 1990 levels [3].
Even though the EU has made good progress in lowering greenhouse gas emissions, significant work in every economic sector will be required to make the continent’s economy climate neutral by 2050 [4]. Particularly, the energy sector accounted for 77% of the overall greenhouse emissions in the EU in 2019 [5], and therefore it is the primary focus point for emission reduction. In order for the EU to become less reliant on outside energy sources and reach carbon neutrality by 2050, renewable energy sources for electricity generation will be essential [4], particularly in view of the increased direct demand for electricity from various end-use sectors and for the creation of fuels like hydrogen. In this framework, the sustainable use of biogenic residues and wastes for bioenergy gives a crucial contribution to a more flexible and stable renewable energy system and reduces environmental impacts compared to current residue disposal practices.
Biogenic wastes and residues play an important role, although they are frequently challenging to use as energy sources because of a number of issues, such as low energy density, high moisture content, poor biological stability, and heterogeneity of the material. [6,7,8,9]. Moreover, access to residual biomass is very likely to become increasingly challenging [10], and the biomass bioeconomic potential is expected to become a relevant constraint by 2030 and beyond, particularly because the risk of competition is most pronounced for biomass uses for bioenergy [11]. Therefore, conventional biomass sources alone will hardly meet future energy needs and satisfy sustainability criteria [9].
One of the solutions in this direction is generating bioenergy from wet waste streams (such as sewage sludge, pulp and paper bio-sludge, and industrial agro-food residues).
Resource recovery from wet wastes is more challenging and energy-intensive than resource recovery from other types of waste and residual biomasses because of their complex composition and high moisture content [12,13]. Nevertheless, it is an inevitable challenge that must be met in order to ensure waste management and environmental sustainability.
However, research on the life cycle environmental implications of hydrothermal conversion of biomass for the generation of bioenergy or bioproducts at an industrial scale is currently lacking. In fact, the environmental effects of hydrothermal biomass conversion have only been the subject of a relatively small number of studies to date [14]. According to the literature [15], a life cycle assessment (LCA) is the most appropriate methodology for these aims.
Recently, the upgrading of sewage sludge via hydrothermal treatment has been evaluated by Medina-Martos et al. [16] showing improvements in greenhouse gas emissions as well as in other impact categories. For olive pomace, Mendecka, Di Ilio, and Lombardi [17] found positive results for a hydro carbonisation process at high temperature (260–305 °C). Benavente, Fullana, and Berge [18] published an LCA for olive mill waste, finding positive environmental impact results for producing hydrochar only without making use of the liquid effluent. Mayer, Bhandari, and Gath [19] compared various options for treatment of food waste. The authors found that hydrothermal carbonization (HTC) with concentration and incineration of the effluent was the most attractive.
The current paper focusses on LCA results of the F-CUBED (Future Feedstock Flexible Carbon Upgrading to Bio Energy Carriers) Horizon 2020 project funded by the European Commission (G.A. 884226). The project aims to convert wet biogenic residues into intermediate bioenergy carriers (fuel pellets) via hydrothermal treatment. The concept consists of an integrated process for mild hydrothermal carbonization (i.e., TORWASH®, manufactured at TNO, Petten, The Netherlands) with low-temperature conversion of the biomass and full utilization of both the solids stream and the liquids stream, as well as compares three feedstocks using direct input from experiments and process modelling [20,21,22]. The F-CUBED production system includes the integration of the hydrothermal pretreatment with densification of the solid fraction, i.e., pelletization, to improve the logistics and sustainability aspects of the supply chain [9,23] and the anaerobic digestion of the liquid fraction.
By utilising the flexibility of CHP and biogas conversion systems, the production system makes it easier to integrate intermittent renewable electricity into a decarbonised energy system. Renewable energy sources like solar or wind power must be matched with complementary energy systems that are dispatchable, or ready to go when needed, throughout the day and year because they provide electricity that fluctuates during the day due to weather variations [24]. The main objective of this study is to evaluate the environmental impacts of the F-CUBED production system, declined by selected impact categories, using a life cycle assessment approach, with particular focus on the climate change impact category. Furthermore, the environmental impacts are compared with those of a reference case for each of the three biogenic residue streams.
The paper illustrates the LCA approach summarised in the Materials and Methods section via description of the case studies considered in the LCA for the F-CUBED production system and reference cases. The LCA methodological phases are also described, including goals and scope, LCA inventory, LCA impact assessment. In the Results section, the results of the inventory analysis and impact assessment, as well their interpretation are reported. In the Conclusion, a thorough summary and discussion of the results of the study and outlook for the future is finally reported. The paper includes three appendices that report (A) inventory data of the F-CUBED production system; (B) contribution analysis of the most relevant impact categories beyond climate change, (C) data visualizations of the comparison of the LCIA results for F-CUBED production system, reference cases, and electricity country mix.

2. Materials and Methods

In this section, the case studies of F-CUBED production system and reference cases are described. The LCA of the case studies is performed according to the methodology defined by ISO standards [25,26]; methodological description of the LCA phases is included in the present section.
To model products and systems from a life cycle perspective, SimaPro 9.1 was chosen as the LCA software tool, incorporating the environmental databases, i.e., Ecoinvent 3, version 3.7. Allocation, when possible, has been avoided by “system expansion” consisting in the extension of the system boundaries by including secondary processes that would be needed to make a similar output in respect to the co-product.

2.1. Case Studies Considered in the LCA for F-CUBED

F-CUBED is a project that aims to convert wet biogenic residues into intermediate bioenergy carriers (fuel pellets) via hydrothermal treatment (TORWASH®). The selected biogenic residues include paper bio-sludge (DM 3.5%), olive pomace (DM 19.4%), and orange peel (DM 20.0%).
TORWASH® treatment and filter press dewatering make up the core process of the F-CUBED process, which yields a solid product subsequently dried and pelletized into fuel pellets and a liquid product, which is anaerobically digested to produce biogas.
The block flow diagram for the F-CUBED production system is reported in Figure 1. The case studies considered in the LCA are briefly described in Table 1.

2.2. Summary of the Reference Cases to which F-CUBED Is Compared to

This section describes the reference cases (RCs) for the different biogenic residues streams which have been analysed in the LCA study. They represent the actual or conventional system of exploitation of the considered biogenic residue to which the environmental impact of F-CUBED production system of the above- described three case studies, have been respectively compared. Each RC is based on commercially available technologies using advanced and integrated concepts.
For pulp and paper bio-sludge (PPB), the reference case refers to the current practices that correspond to the current scenario at industries where the residue is generated. For virgin olive pomace and orange peel case studies, there is no energy generation in the conventional practices. Hence, in order to make a comparison with the F-CUBED production system, the conversion system of biogenic residues into energy has been included as the reference case. Between the conventional options of incineration and anaerobic digestion (AD)/biogas generation, AD is chosen since incineration of such wet streams is highly inefficient [27], and AD is actually a promising alternative to valorise agro-food wastes, which is gaining interest under an environmental sustainability overview [28]. The steps involved in the anaerobic digestion process are landfarming the anaerobic digestate, producing biogas from the wet biogenic residue/waste, and cogenerating heat and electricity from the combustion of the biogas. Moreover, since the reference cases are used to compare the environmental performances to their F-CUBED counterparts, only the materials and energy inputs for conditioning the biogenic residue streams (Table 2) and the electricity generated have been considered for the life cycle analysis and the necessary assumptions applied.
Concerning the pulp and paper bio-sludge RC, at the Smurfit Kappa (SK) Kraftliner paper mill in Piteå, Sweden, the mill produces kraftliner as the main product. The wastewater streams from this mill are sent to its wastewater treatment plant (WWTP). In the WWTP, additional nutrients are added, i.e., phosphorous and nitrogen to the aerobic (biological) stage of treatment. The treated water from the WWTP is then discharged into the environment. Two types of sludge are generated in this mill: (a) paper fiber sludge from the mill and (b) paper biological sludge from the WWTP. The fiber sludge (PF) and bio-sludge are mixed. This mixed paper sludge is then sent to a gravity table for dewatering to increase the dry matter (DM) content to 8%. The dewatering is further aided by adding polyelectrolyte (PE) and ferrous sulphate salt. The concentrated sludge is sent to a screw press to increase the DM to 30%. This stream is sent to the onsite biomass boiler where steam is generated. The produced steam is finally converted to energy through a back pressure steam turbine. The water effluent from these operations has no DM and is sent to the WWTP. The block flow diagram for the pulp and paper bio-sludge RC is depicted in Figure 2.
This RC has been modelled considering:
  • The wastewater treatment phase with a flow rate of 18 t/tADP representing an average value of the range 9–27 t/tADP valid for a plant capacity of about 650 ktADP/year, and an electricity consumption of 8 kWh/tADP, based on [29];
  • The biological sludges mixed with the fiber sludges and then treated using a gravity table and dewatered using a screw press characterised by the efficiency of mechanical separation of the suspended solids of about 95% [30] and an energy consumption of 10 kWh/t feed [29];
  • The press cake feeding the biomass boiler was modelled with data collected in [31], setting the inputs of sodium hydroxide, ammonia, water for gas cleaning, and electricity requirement;
  • The produced steam is converted into energy through a turbine characterised by a power efficiency of 20% and heat surplus to be used outside the system.
For the virgin olive pomace reference case, the current operational site of the project partner APPO, Frantoio Oleario G. Chimienti olive mill, in Sannicandro di Bari (Italy), has been considered representative of the Italian olive oil sector. The olive pomace is a by-product of olive oil production in the olive mill, obtained after milling operations. In the specific case study, the milling process has been followed by centrifugation that occurs in two phases. This produces an olive pomace with a moisture content of about 80%, and it contains residual oil up to 4% by weight. Therefore, this biogenic residue stream consists mainly of the olive pomace and water and no other chemicals. Unlike the conventional utilization of olive pomace for the crude olive pomace oil extraction through a mixture of steam and hexane, in the present reference case the resulting residues of virgin olive pomace are used for biogas generation via anaerobic digestion, as illustrated in Figure 3. The content of H2S in the biogas is removed using iron sponge technology. In a cogeneration unit, the cleaned biogas is burned to produce heat and power using a gas engine. It is meant to symbolise the generation of power from biogas that is connected to the grid. Then, high-voltage electricity is regarded as the primary product, with heat generated as a by-product. The last step of the process deals with the transformation of electricity voltage from high to medium voltage, including the losses during voltage transformation.
In the RC, the virgin olive pomace is preconditioned with the destoning and dilution phases; then, it has been treated in an anaerobic digester producing biogas and digestate. Particularly, this scenario uses the output value of the produced biogas with specific LHV for scaling the process contained in the Ecoinvent database and describing a commercial plant for biogas production through the anaerobic digestion of manure. The biogas production yield has been collected from the literature [32]. The process also includes the removal of the H2S from the flue gas, based on the stoichiometric reactions illustrated in the literature [33]. No credits (avoided impacts) for the replacement of synthetic fertiliser by the nutrients potentially contained in the digestate have been considered. Indeed, according to Batuecas et al. [32], its nitrogen content is much lower than 1%. This is not in compliance with the definition of organic fertiliser provided by the Regulation (EU) 2019/1009, according to which the total nitrogen content (N) of an organic fertiliser containing more than one declared main nutrient, must be at least 1% by mass. Therefore, the resultant digestate from olive pomace AD can be considered for soil improvement, but not as an organic fertiliser. This is also consistent with the considered scenario in which the anaerobic reactor operates at a large scale and where the residue feed is characterised by low homogeneity and significant variations of physicochemical parameters (e.g., limited changes of suspended/diluted solids, heavy metals, biological oxygen demand/BOD, chemical oxygen demand/COD, etc.). The amount of diesel consumption due to the digestate being spread on soil has been taken into account, using the Ecoinvent process for landfarming in the LCA model.
Finally, in the food processing facility, the fresh oranges are squeezed to obtain orange juice, which is used for different purposes in the agro-food industry. In the reference case, the resulting residual orange peel is used for biogas generation via anaerobic digestion. H2S in the biogas is removed using iron sponge technology [17]. The cleaned biogas is burned in a cogeneration unit with a gas engine generating electricity and heat. It is meant to symbolise the generation of power from biogas that is connected to the grid. Heat is created as a by-product, whereas electricity at high voltage is thought to be the primary product, as shown in Figure 4. The orange peel in the RC undergoes preconditioning through the grinding and diluting stages before being treated in an anaerobic digester to produce digestate and biogas.
As already described for the olive pomace case, this scenario uses the output value of the produced biogas with specific LHV for scaling the process contained in the Ecoinvent database and describing a commercial plant for biogas production through the anaerobic digestion of manure. The data concerning the biogas characterization and production has been collected from the literature [34,35].
This scenario refers to a commercial plant for the generation of biogas through the anaerobic digestion of manure and scales the process from the Ecoinvent database using the output value of the biogas produced with a particular LHV. Data on biogas generation and characterisation have been gathered from [34,35]. Based on the working principle for iron sponge technology as described in [33], the process involves a cleaning step to remove H2S from the flue gas. Also, in the reference case of orange peel, no credits (avoided impacts) for the replacement of synthetic fertiliser by the nutrients potentially contained in the digestate have been considered. The reasons for this assumption have been already illustrated in the olive pomace RC. The amount of diesel consumption due to the digestate being spread on soil has been taken into account, using the Ecoinvent process for landfarming.

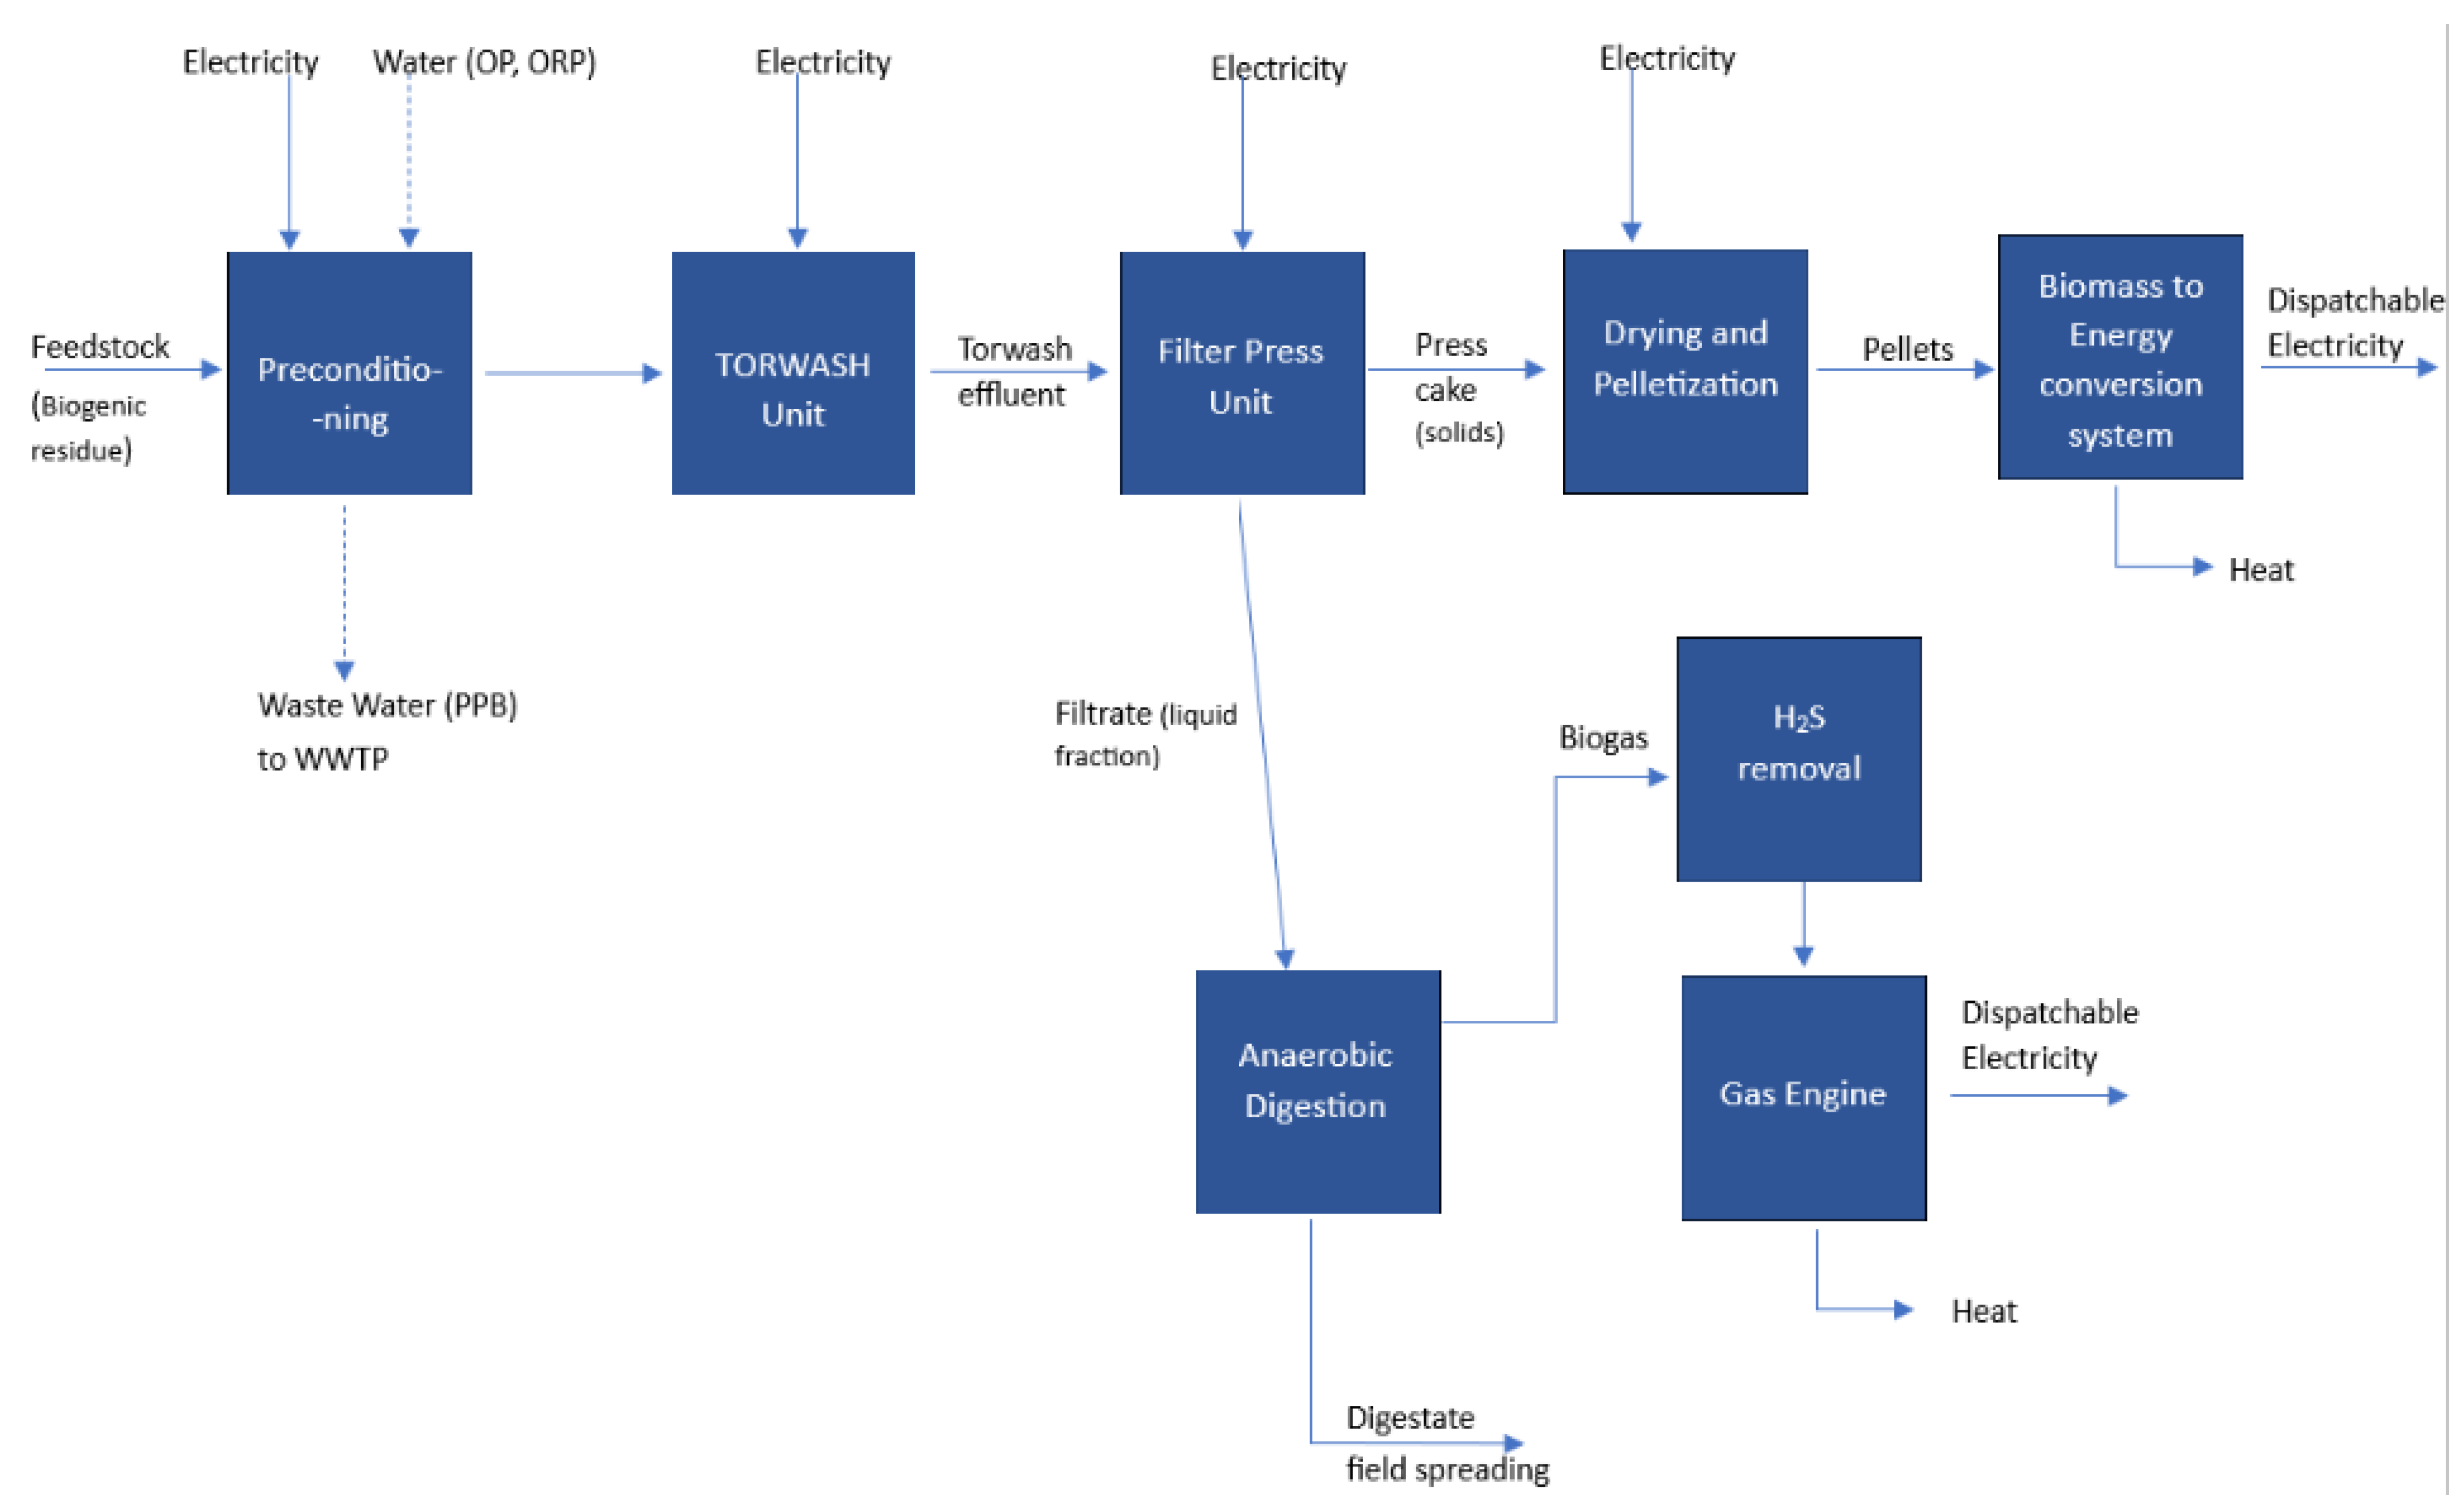
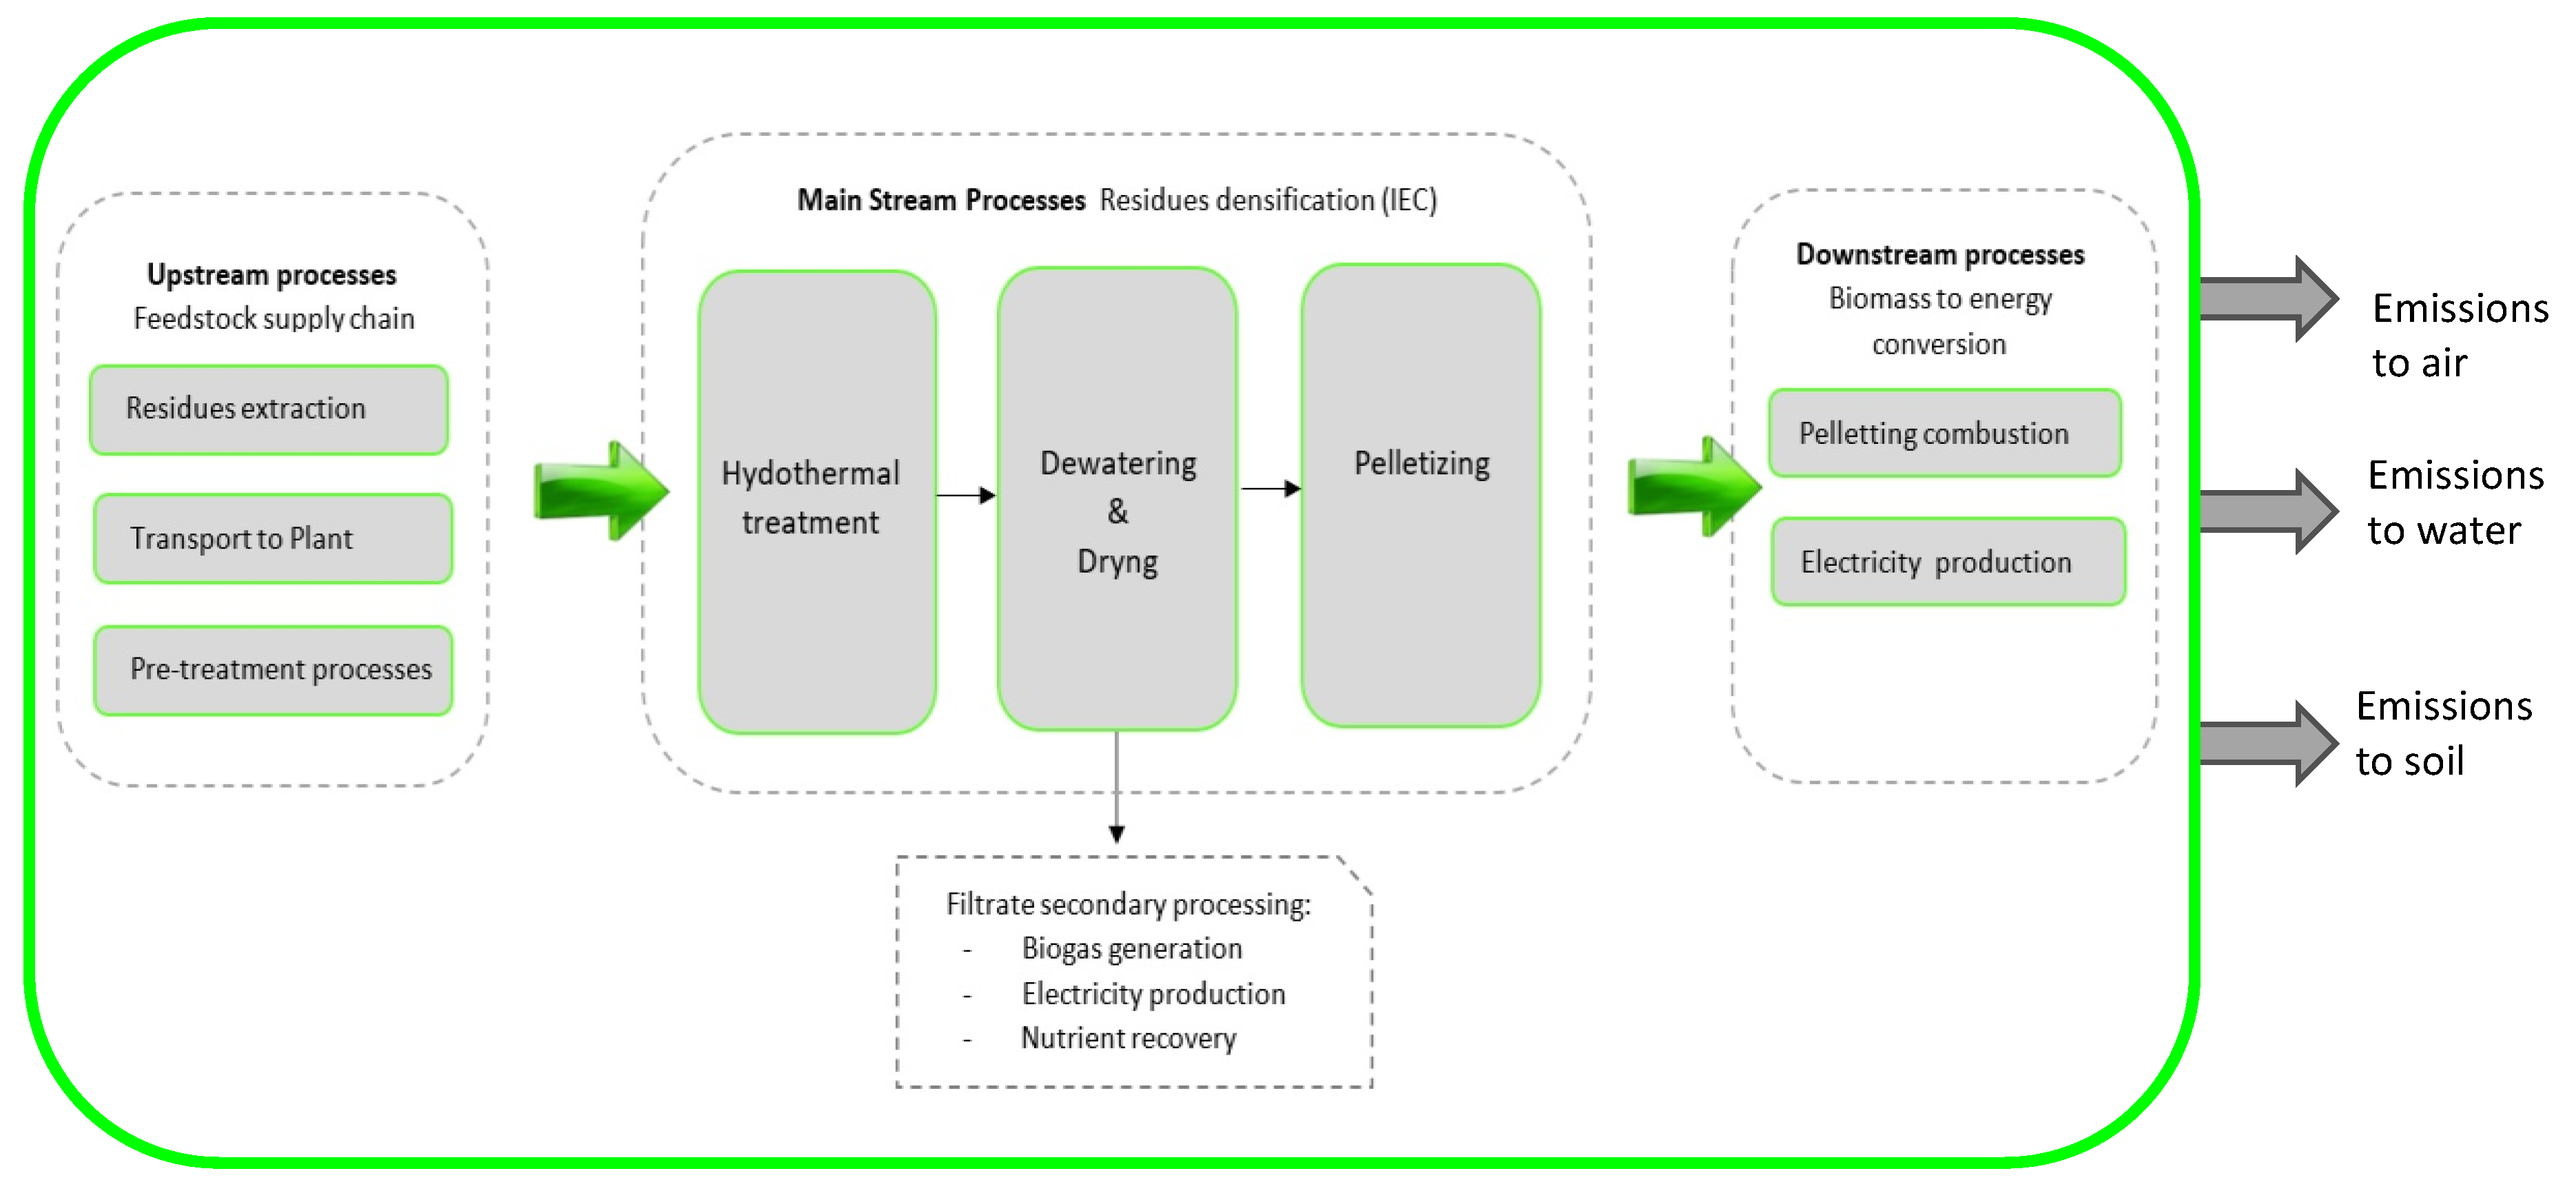
2.3. LCA Methodology for F-CUBED Production System Analysis

According to the definitions provided by the International Organization of Standardization (ISO) through ISO 14040:2021—Principles and Framework [25] and ISO 14044:2021—Requirements and Guidelines [26], the implemented LCA study consists of four phases: (1) goal and scope definition; (2) life cycle inventory (LCI), (3) life cycle impact assessment (LCIA), and (4) interpretation of the obtained results.

2.3.1. Goal and Scope Definition

The goal of the present study is to quantify and assess the environmental burden of the F-CUBED production system applied to three different biogenic residues, characterised by low economic value and high moisture content, and compare the F-CUBED technology with other conventional technologies for their treatment. The F-CUBED system proposes the novel TORWASH® technology integrated with other technologies in a process flow that aims to improve the conversion steps of secondary biomass to intermediate bioenergy carriers in an efficient and cost-effective manner. For comparison, the RCs are developed to highlight the potential improvements brought about by the F-CUBED production system.
In the present study, 1 kWh of produced electricity was chosen as functional unit. One kWh of produced electricity is a quantifiable description of the performance of the production system under analysis, to which all inputs and outputs from the system are related. To facilitate comparison of the processes, the results are also in reference to the overall process, considering the amount (wb) of biogenic residues treated, i.e., per 1 metric ton of the specific biogenic residue.
Concerning the system boundaries definition, the present work is a cradle-to-gate LCA study, thus covering all production steps from the raw material supply chain (i.e., biogenic residues) up to the finished product (i.e., renewable electricity). As illustrated by Figure 5, the system boundaries include (1) upstream processes: residue extraction, with eventual transport to the F-CUBED plant and preconditioning of the residues; (2) main stream processes: TORWASH® hydrothermal treatment, dewatering, drying, and pelletizing; and (3) downstream processes: transport to the power plant and biomass to energy conversion system. Secondary liquid fraction processing is also considered.
Regarding the geographical limitations, the currently investigated system assumes that the plant is located either in Northern Sweden for the pulp and paper bio-sludge scenario, in Spain for the fruit and vegetable residue case study, and in Italy, for the virgin olive pomace case study. Additionally, a 20-year processing plant lifetime was taken into account. Moreover, stating the limitations of the study is essential for appropriate conclusions and recommendations to be made, which can influence decision-making and avoid both unrealistic and misleading LCA results. Particularly, for the secondary processes, the F-CUBED system foresees nutrient recovery during the digestion phase and even the production of struvite. Data for struvite production have not been considered consistent for LCA purposes, because they are from laboratory scale experiments. However, the possibility of digestate reuse has been carefully taken into account and translated into nutrient recovery via its field application as fertiliser.
In the F-CUBED production system, the anaerobic reactor has been hypothesised with a smaller scale when compared with that of similar plants used for municipal or agricultural biowastes. This is due to the fact that the substrate in the F-CUBED process filtrate is soluble and does not require long retention times to achieve solubilization as is the case for agricultural solids wastes. Moreover the inlet filtrate is controlled and characterised by high homogeneity (i.e., the biomass typologies are always the same and from the same plants) and reduced variations of physicochemical parameters (e.g., limited changes of suspended/diluted solids, heavy metals, BOD, COD, etc.).
Based on these assumptions the digestate can be considered as a high-quality soil improver with a certain quantity of nutrients that can be easily used by crops. In addition, in the F-CUBED production system case study of virgin olive pomace and orange peel wastes, polyphenols and limonene are present in the substrates, respectively. These compounds are well known as antimicrobial agents, which limit and depress the biogas production when digesting the substrates. In this work, pretreatment of the virgin olive pomace and orange peel to remove polyphenols and limonene are not considered.

2.3.2. Life Cycle Inventory

Unit processes serve as the foundation for the life cycle inventory (LCI); in an examination of the life cycle inventory, a unit process is the smallest component for which input and output data are measured [25]. Natural resources (i.e., fossils, ore, and biotic resources), waste for treatment, and various product categories (components, materials, and services) are examples of inputs. Outputs come in different forms as well including products and by-products (intermediate energy carriers such as pellets and briquettes, electricity, and heat), waste for downstream treatments (filtrate and digestate), and emissions to the environment (including pollutants to air, water, and soil) [36,37]. LCI data have been categorised into two types: (i) primary/foreground data, collected from interviews, questionnaires, on-site measurements from pilot plant testing, online and offline data collection, and (ii) secondary/background data, derived from calculations, estimations, databases, scientific reports, statistics, and scientific literature.
The LCA modelling of the system has been based on conceptual process design and modelling study for the systems considered [21], based on experimental work at pilot scale [20,22].
Moreover, interviews with industrial partners (i.e., the pelletizing phase), experimental data (i.e., the long duration operation of the TORWASH® and dewatering phases), and scientific literature (i.e., the energy conversion system and power generation) were utilised for collecting the data relevant for the LCI of the systems investigated in this study. Particularly, in the LCI phase, the involvement of the industrial partners of the F-CUBED Project was designed for the specific collection of updated foreground data and information. Questionnaires were used for data collection and to align starting points for the techno-economic evaluation, value chain analysis, and life cycle analysis between the responsible project partners.

2.3.3. Life Cycle Impact Assessment

Life cycle impact assessment (LCIA) is the step in LCA that establishes a connection between the elementary flow system inventory and the possible environmental impact [38]. For the purpose of this work, SimaPro 9.1 was chosen as the LCA software tool. The ReCiPe method was selected as the impact assessment method.
Among the impact assessment methods available for LCA, such as CML-IA (Centre for Environmental Studies Method) and Eco-Indicator 99, the choice of the ReCiPe 2016 method [39] in the context of hydrothermal treatment of wet biogenic residues has been based on several factors like its completeness and universality. ReCiPe provides comprehensive coverage of impact categories and covers a broad spectrum of environmental concerns [39]. This comprehensiveness is important when studying complex processes like hydrothermal treatment, which may have multiple environmental effects. ReCiPe enables easier comparisons with other studies, which is important for benchmarking and understanding the relative environmental performance of the present hydrothermal treatment process. Finally, in bioenergy production systems, ReCiPe is the most used LCIA method [40].
In the current study, the ReCiPe impact assessment method is applied based on hierarchist perspectives. Using ReCiPe, the life cycle inventories are converted into a number of harmonised impact scores at the midpoint level, and 18 midpoint indicators are produced [39]. Then, midpoint characterization methods lead to more accurate results and reduce uncertainty [41]. In the LCIA phase, the effect of substances on the selected impact categories is quantified highlighting the processes that contribute the most. The main environmental impact categories further considered in the present LCIA are listed in Table 3; the most relevant contributors to each one are outlined accordingly.
When employing inputs or procedures that do not accurately represent the features of the product system, uncertainty arises in life cycle assessments (LCAs). This can be due to a variety of factors, including unavailable or dubious data, flawed methods, and imperfect methods themselves; geospatial information may be incorrect or non-site-specific for key processes, or technological progresses cannot be fully represented, as reported in [42].
Moreover, variability in LCA occurs as a result of randomness in the data, because of heterogeneity or diversity of the values.
In fact, all data used in such studies are inherently uncertain: using a heuristic approach, the LCA results can be assumed reliable within variability ranges of +/−20% of the input data, and then relatively small differences would be noted in the calculated impacts [41]. The contribution analysis, which identifies the processes that are significantly contributing to the outcomes, is a valuable technique for comprehending the uncertainty of the acquired results. Therefore, when the sensitivity analysis shows the uncertainty of a specific indicator, a contribution analysis can be executed in order to deeply highlight the most critical processes and their inputs/outputs. As a consequence, the assumptions of these processes are analysed and evaluated to establish if some changes in the inventory have to be performed with a recalculation of the LCA results. In the present LCA study, the sensitivity analysis was carried out using Monte Carlo simulation. The LCA community has come to rely on Monte Carlo as one of the more popular techniques for parameter uncertainty propagation [43]. It modifies unknown parameters at random, but the variation is constrained by the distributions given for the parameter under consideration (Table 4). A predicted output value distribution that depicts the combined parameter uncertainty is produced by repeated computations [44]. Monte Carlo analysis was applied in two subsequent steps: the first step dealt with the sensitivity analysis of the LCA model inherent to the unit processes of the Ecoinvent data base; successively, a second analysis was conducted to consider the uncertainty introduced by relevant foreground data for each specific biogenic residue stream. The cross-check of the impact assessment with sensitivity analysis allowed improvement in the accuracy in selecting the relevant impact categories (ICs) for the LCA study. In fact, the value of the Coefficient of Variation and its behaviour in the two subsequent sensitivity analyses give information about the reliability of the IC for the specific biogenic residue stream.

3. Results and Discussion

This section presents the results of the life cycle inventory (LCI) and life cycle impact assessment (LCIA) phases to describe the magnitude and significance of the environmental impacts of the F-CUBED production system applied to the target biogenic residue streams, i.e., pulp and paper bio-sludge (PPB), virgin olive pomace (OP), and fruit and vegetable residue stream—orange peel (ORP). Positive indications show a stress on the environment, whilst negative indicators show positive impacts.

3.1. Life Cycle Inventory (LCI) Results

In the present section, the life cycle inventory phase (LCI) for the F-CUBED production system is described for the target biogenic residue streams. The LCI refers firstly to 1 metric ton of the specific biogenic residue on an as-received basis, and in the further elaboration it refers to the F.U. of 1 kWhe of produced electricity. The inventory has been modelled for Europe and the specific country of the biogenic residues’ origin, for a time period of one year and a macro-economic scenario of business-as-usual.
The tables of the data inventory (available in Supplementary A) and the description of the assumptions complete the description of the data collection for every biogenic residue case study.
Some of the unit processes, such as pelletizing, electricity generation from pellets, and anaerobic digestion have been designed using a proxy-process from the Ecoinvent 3.7 database, as close as possible to the analysed unit process. The use of proxy-processes contributes by reducing the risk of data lack in the inventory phase, for instance because a product or emission is missing, and increases the completeness of the LCA datasets. For calibrating the proxy-process to the experimental one, an input value from foreground data is chosen, and the proxy-process is scaled accordingly, e.g., electricity consumption, energy content of the product, or digestate output.
The assumptions that have been used extensively in every case study are related to the following unit processes: (i) TORWASH® process, (ii) pelletizing phase, (iii) anaerobic digestion of the filtrate for biogas generation, (iv) electricity production from the biogas, and (v) electricity transformation from high to medium voltage.
In the PPB case study, the electricity production from pellets refers to the specific energy production system of Smurfit Kappa based on the biomass boiler and back pressure turbine. While for OP and ORP case studies the electricity production from pellets refers to wood chips in a cogeneration plant with a capacity of 6667 kW (referring to fuel input) valid for in Italy and Spain, respectively.
In the TORWASH® process, the reactor has been modelled based on the commercial scale data of industry standards for reactor construction. A H2S scavenger system was used, i.e., an iron sponge as cleaning treatment for removing the H2S from the flue gas, due to its technological maturity and ability to handle low H2S flows [45]. It has been modelled on the basis of the stoichiometric reactions illustrated in [33]; the inlets for iron pellets, silica sand, and liquid oxygen have been considered in the unit process modelling. A specific amount of tap water has been considered as input to introduce a mass balance correction due to the illusory increase of the effluent flow, which is calculated starting from the reduced dry matter content after the treatment. The electricity consumption for the TORWASH® system has been estimated by adjusting the requirement for the filter press by a coefficient (D = 4.5) to take into account the discontinuous operational mode with a conservative approach.
The pelletizing unit process has been designed using a proxy-process from the Ecoinvent database, describing a commercial plant for wood pellet production, which considers the dataset of the inputs and outputs of materials and energy for wood pellet production such as the electricity medium voltage, the water, the waste mineral oil, etc. It is valid for pellets produced in a pellet factory that uses residue as raw materials. The raw materials are firstly pretreated and dried, then comminuted and mixed. In the end, they are pelletized, cooled, and stored. The transport distance from the origination site of the solid biomass to the pelletizing plant has been set equal to 80 km, based on [46]. The storage and handling of the press-cakes has been modelled on the process of the Ecoinvent skid-steer loader 155 kW with a capacity volume of 5 m3 and considering the density of the press-cakes as foreground data from a dewatering step of 700 kg/m3. The transport distance from the pelletizing plant to the conversion plant has been set equal to 100 km, based on [46] and considering the bulk density of pellets of 650 kg/m3 [47].
The anaerobic digestion has been designed using the proxy-process from the Ecoinvent database, describing a commercial plant for biogas production through the anaerobic digestion of manure. This proxy-process allows introduction to the LCA model of the anaerobic digestion plant for agriculture, with methane recovery, low-voltage electricity consumption, and storage of the substrates. The dataset includes the input for storage of substrates as well as the storage of digestates after fermentation. Indeed, the emissions of CO2, CH4, NH3, and N2O into the air due to the storage of the substrates before the AD process as well as from storage of the digestates after the AD process, are incorporated. The input value chosen for calibrating the proxy-process to the experimental one is the digestate production (0.01% mass). This data has been gathered, as foreground data, from project partner owner of the BIOPAQ ICX technology from which process conditions and process performance parameters have been provided. In the F-CUBED production system, the digestate has been considered as a possible substitute product with a specific nutrient amount. The use of the digestate allows the reduction of the use of a specific fertiliser: starting from the digestate amount experimentally determined, the calculation of the avoided quantities of the traditional fertilisers was carried out based on the literature [48], and the associated credits for their avoided production and use have been included in the LCA model.
The electricity generation process from biogas involves a commercial gas engine producing electricity at high voltage, designed using the Ecoinvent database proxy-process. This process accounts for the production of electricity and heat from a biogas mix derived from various sources, including biowaste and sewage sludge, through combustion in a cogeneration unit with a gas engine. The main product is then considered to be electricity at high voltage, while heat is produced as a co-product. The cogeneration unit has a capacity of 160 kWel; the degrees of efficiency are ηel = 0.37 and ηth = 0.53. A mix of biogas is treated in this dataset with an average lower heating value of 22.73 MJ/Nm3. The input value chosen for calibrating the proxy-process to the experimental one is the biogas produced from anaerobic digestion for the specific biogenic residue stream taking into account the specific lower heating value, calculated on the basis of the biogas composition provided by the project partner owner of the BIOPAQ ICX technology.
Finally, the electricity transformation from high to medium voltage unit processes has been referred to the country-specific dataset for each biogenic residues stream.
In addition to these general assumptions, valid transversally for every case study, specific assumptions have been put in place for the F-CUBED production system of each biogenic residue stream.
The F-CUBED production system applied in Sweden to the pulp and paper bio-sludge case study consists of 10 production steps. The first step corresponds to the biological sludge extraction with dry matter content (DM) of 3.5% including wastewater treatment and the separation of the treated water stream. The wastewater flow has been set equal to 18 t/tADP as an average value of the range 9–27 t/tADP valid for a plant capacity of about 700 ktADP/y, and the electricity consumption assumed of 8 kWh/tADP is as indicated for both in BAT for pulp, paper, and board [29]. The enhanced/thickened bio-sludge production (DM 10%) using decanter-centrifuge has been modelled based on the technical specifications of the commercial Andritz decanter D3, with the hydraulic capacity ranging from 1 to 30 m3/h.
The energy conversion system is carried out after the TORWASH® treatment and production of the effluent (DM 8.5%); dewatering using a membrane filter press, producing press cakes (solids, DM 42.3%) and filtrate (liquid fraction, DM 3%); and the pelletization phase. It consists of the pellet combustion in the biomass boiler. This unit process has been designed using the proxy-process of the Ecoinvent database, describing heat production from wood pellets, in a furnace (300 kW), which introduces in the LCA model the dataset valid for boilers with nominal capacities in the approximate range of 100 to 500 kW and the average annual operation including start/stop (warm up and cool down), reducing the efficiency compared to rated values provided by boiler manufacturers and increasing some emissions factors such as CO. The input value chosen for calibrating the proxy-process to the experimental one is the mass flow of the pellets feeding the boiler with their specific LHV of 18.2 MJ/kg (for MC 7%) derived as foreground data from experimental activities. The electricity is finally produced by a steam turbine modelled with technical data from a commercial turbine (ABB Stal back pressure turbine, 27 MW), considering an electric efficiency of 20%.
In the production phase of the electricity generation from biogas, it is hypothesised that, after heat integration, 54% of the heat produced can be exported outside the system (i.e., surplus not used by the mill and/or the auxiliary processes as the wastewater treatment) as reported in the BAT for pulp, paper, and board [29].
Concerning the F-CUBED production system for virgin olive pomace in Italy, nine production steps have been considered. The first step consists of the virgin olive pomace extraction (DM 19.36%) and its preconditioning (destoning and dilution, DM 5.75%). For the destoning phase, based on Leone et al. [49], the olive stones have been calculated considering a number of stones of about 11.9% in weight of the olives and a separation coefficient of the equipment of 58%. The electricity consumption of the destoning machine has been set equal to 24.70 kWh as reported in Leone et al. [49]. After the TORWASH® treatment and production of effluent (DM 4.5%), the dewatering using a membrane filter press, producing press cake (solids, DM 58.36%) and filtrate (liquid fraction, DM 1.8%), and the pelletization phase, it is assumed that the production of heat and electricity from pellets takes place with a cogeneration unit (capacity 6667 kW, referring to fuel input). This Ecoinvent proxy-process introduces into the LCA model the inventory, valid for Italy, for the electricity (HV) produced with an organic Rankine cycle (ORC) steam generator (1000 kW electrical) burning the solid fuel in a boiler (furnace 5000 kW, with silo) at a temperature of 800–1300 °C under excess air conditions and turned into carbon dioxide and water. The produced heat can be used directly for steam production in order to generate electricity with a turbine. For this, plants have been considered to have an electricity production yield of 15% and a heat production yield of 45%. The input value from the experimental data that has been chosen for calibrating the proxy-process to the experimental one is the difference between the energy content of the F-CUBED pellets (LHV 26.3 MJ/kg, at MC 6%) in relation to the wood chips used in the CHP unit (LHV 18.9 MJ/kg).
The liquid fraction secondary processing consists of the anaerobic digestion of the filtrate determining the biogas generation (LHV 17.31 MJ/Nm3) and the electricity production from the biogas.
It is hypothesised that, after heat integration, 80% of the heat produced can be exported outside the system (i.e., surplus not used by the mill and/or other auxiliary processes). This amount is higher than for the other biogenic stream case studies because the plant size of the Italian olive mills is usually small and no significant heat consumption is required in the chain of olive oil production, as with hot water for the malaxing phase of a typical two-phase plant.
Finally, for the F-CUBED production system for orange peel in Spain, nine production steps have been modelled. The first step consists of the orange peel extraction (DM 20%) and preconditioning (blending and dilution, DM 3.86%). The overall electricity consumption of the preconditioning process has been set equal to 5.13 kWh/tORP as a result of the aggregation of the electricity requirements for DM% dilution of the feedstock “ar” with water to the desired DM% using a mixer; the electricity requirements for a shredder pump (type CRI-MAN PTS 25—100 k); and the electricity requirements for moving the orange peel from the production plant to the preconditioning phase and then to the TORWASH® plant, which has been calculated hypothesising an average pomace density of 1.09 kg/l [50] and the use of the piston pump Mori-TEM model PP.210 with a flow rate of 1500 l/min and a power of 7.5 kW. The electricity consumption also includes heating from 15 to 55 °C.
After the TORWASH® treatment and production of effluent (DM 2.63%), the dewatering using a membrane filter press that produces press cakes (solids, DM 42.0%) and filtrate (liquid fraction, DM 1.6%), and the pelletization phase, it is assumed that the production of heat and electricity takes place with a cogeneration unit (capacity 6667 kW, referring to fuel input). This Ecoinvent proxy-process introduces in the LCA model the inventory, valid for Spain, for the electricity (HV) generation as described in the olive pomace case study. In the orange peel, the input value from experimental data that has been chosen for calibrating the proxy-process to the experimental one is the difference between the energy content of the F-CUBED pellets (LHV 22.2 MJ/kg, at MC 6%) in relation to the wood chips used in the CHP unit (LHV 18.9 MJ/kg).
The liquid fraction secondary processing consists of the anaerobic digestion of the filtrate determining the biogas generation (LHV 25.79 MJ/Nm3) and the electricity production from the biogas.
It is hypothesised that, after heat integration, 54% of the heat produced can be exported outside the system (i.e., surplus not used by the mill and/or other auxiliary processes). This amount is lower than for the olive pomace case studies and similar to the pulp and paper bio-sludge one because the activity refers to industrial scale exploitation.

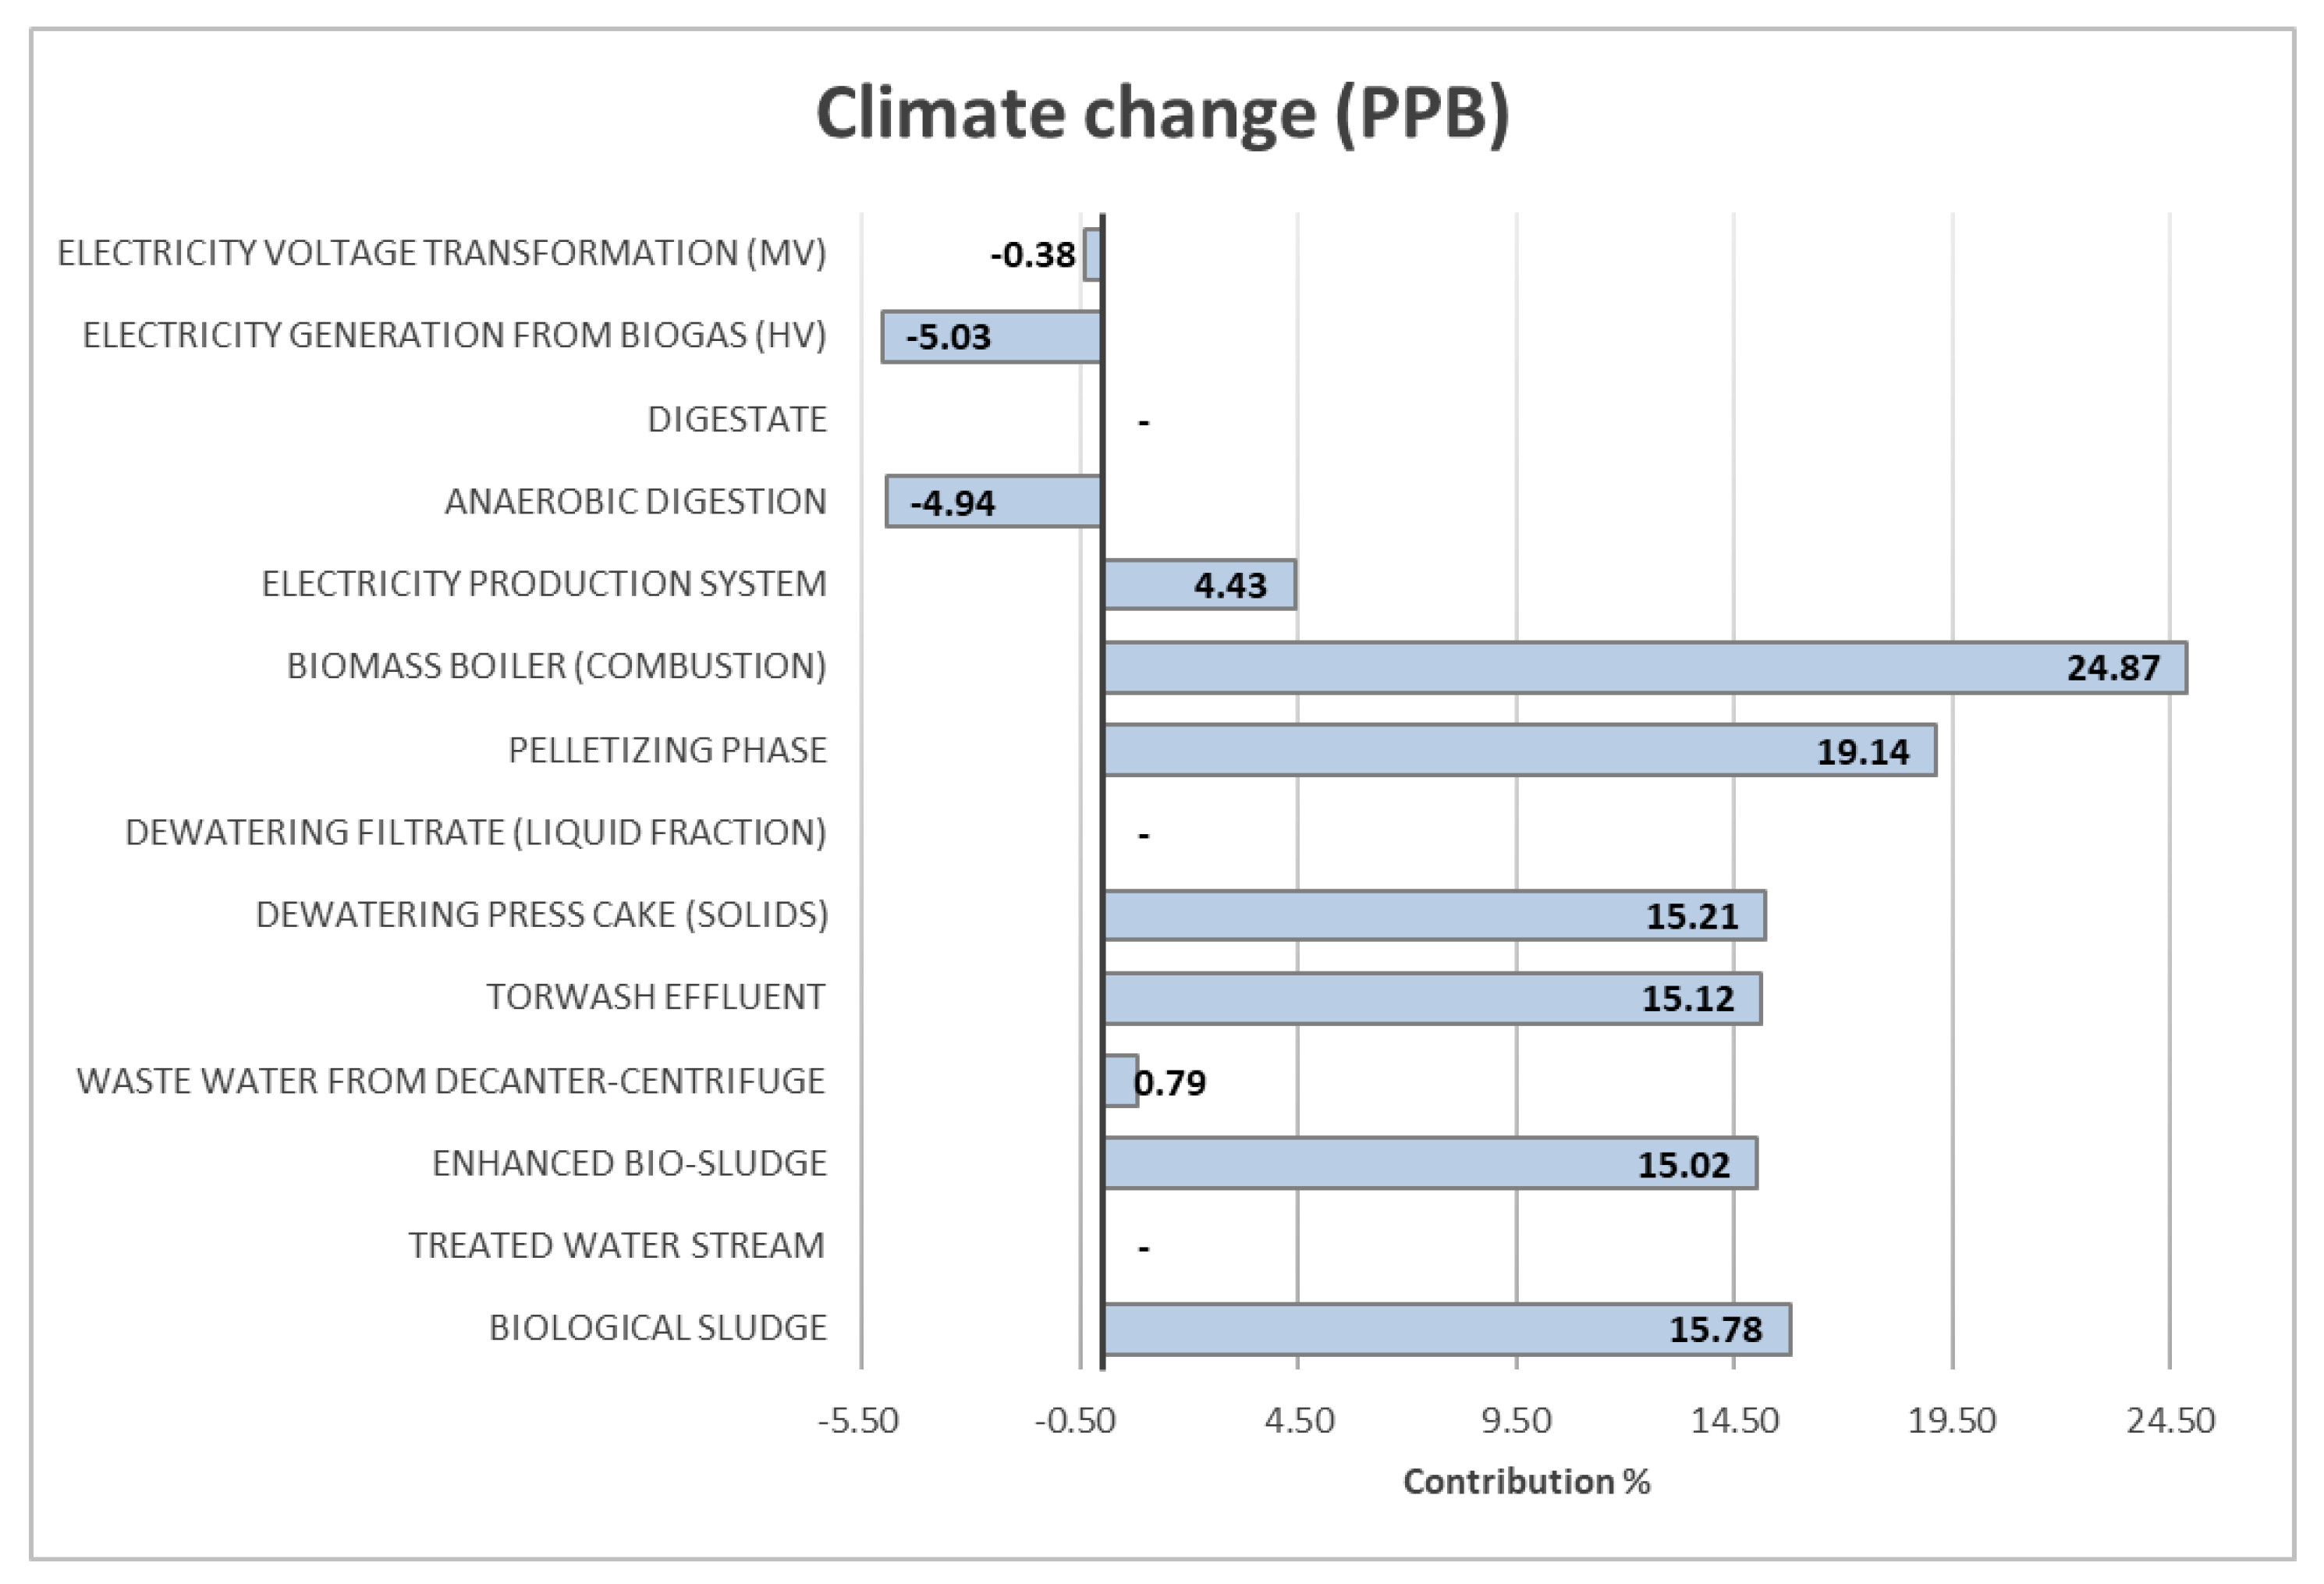
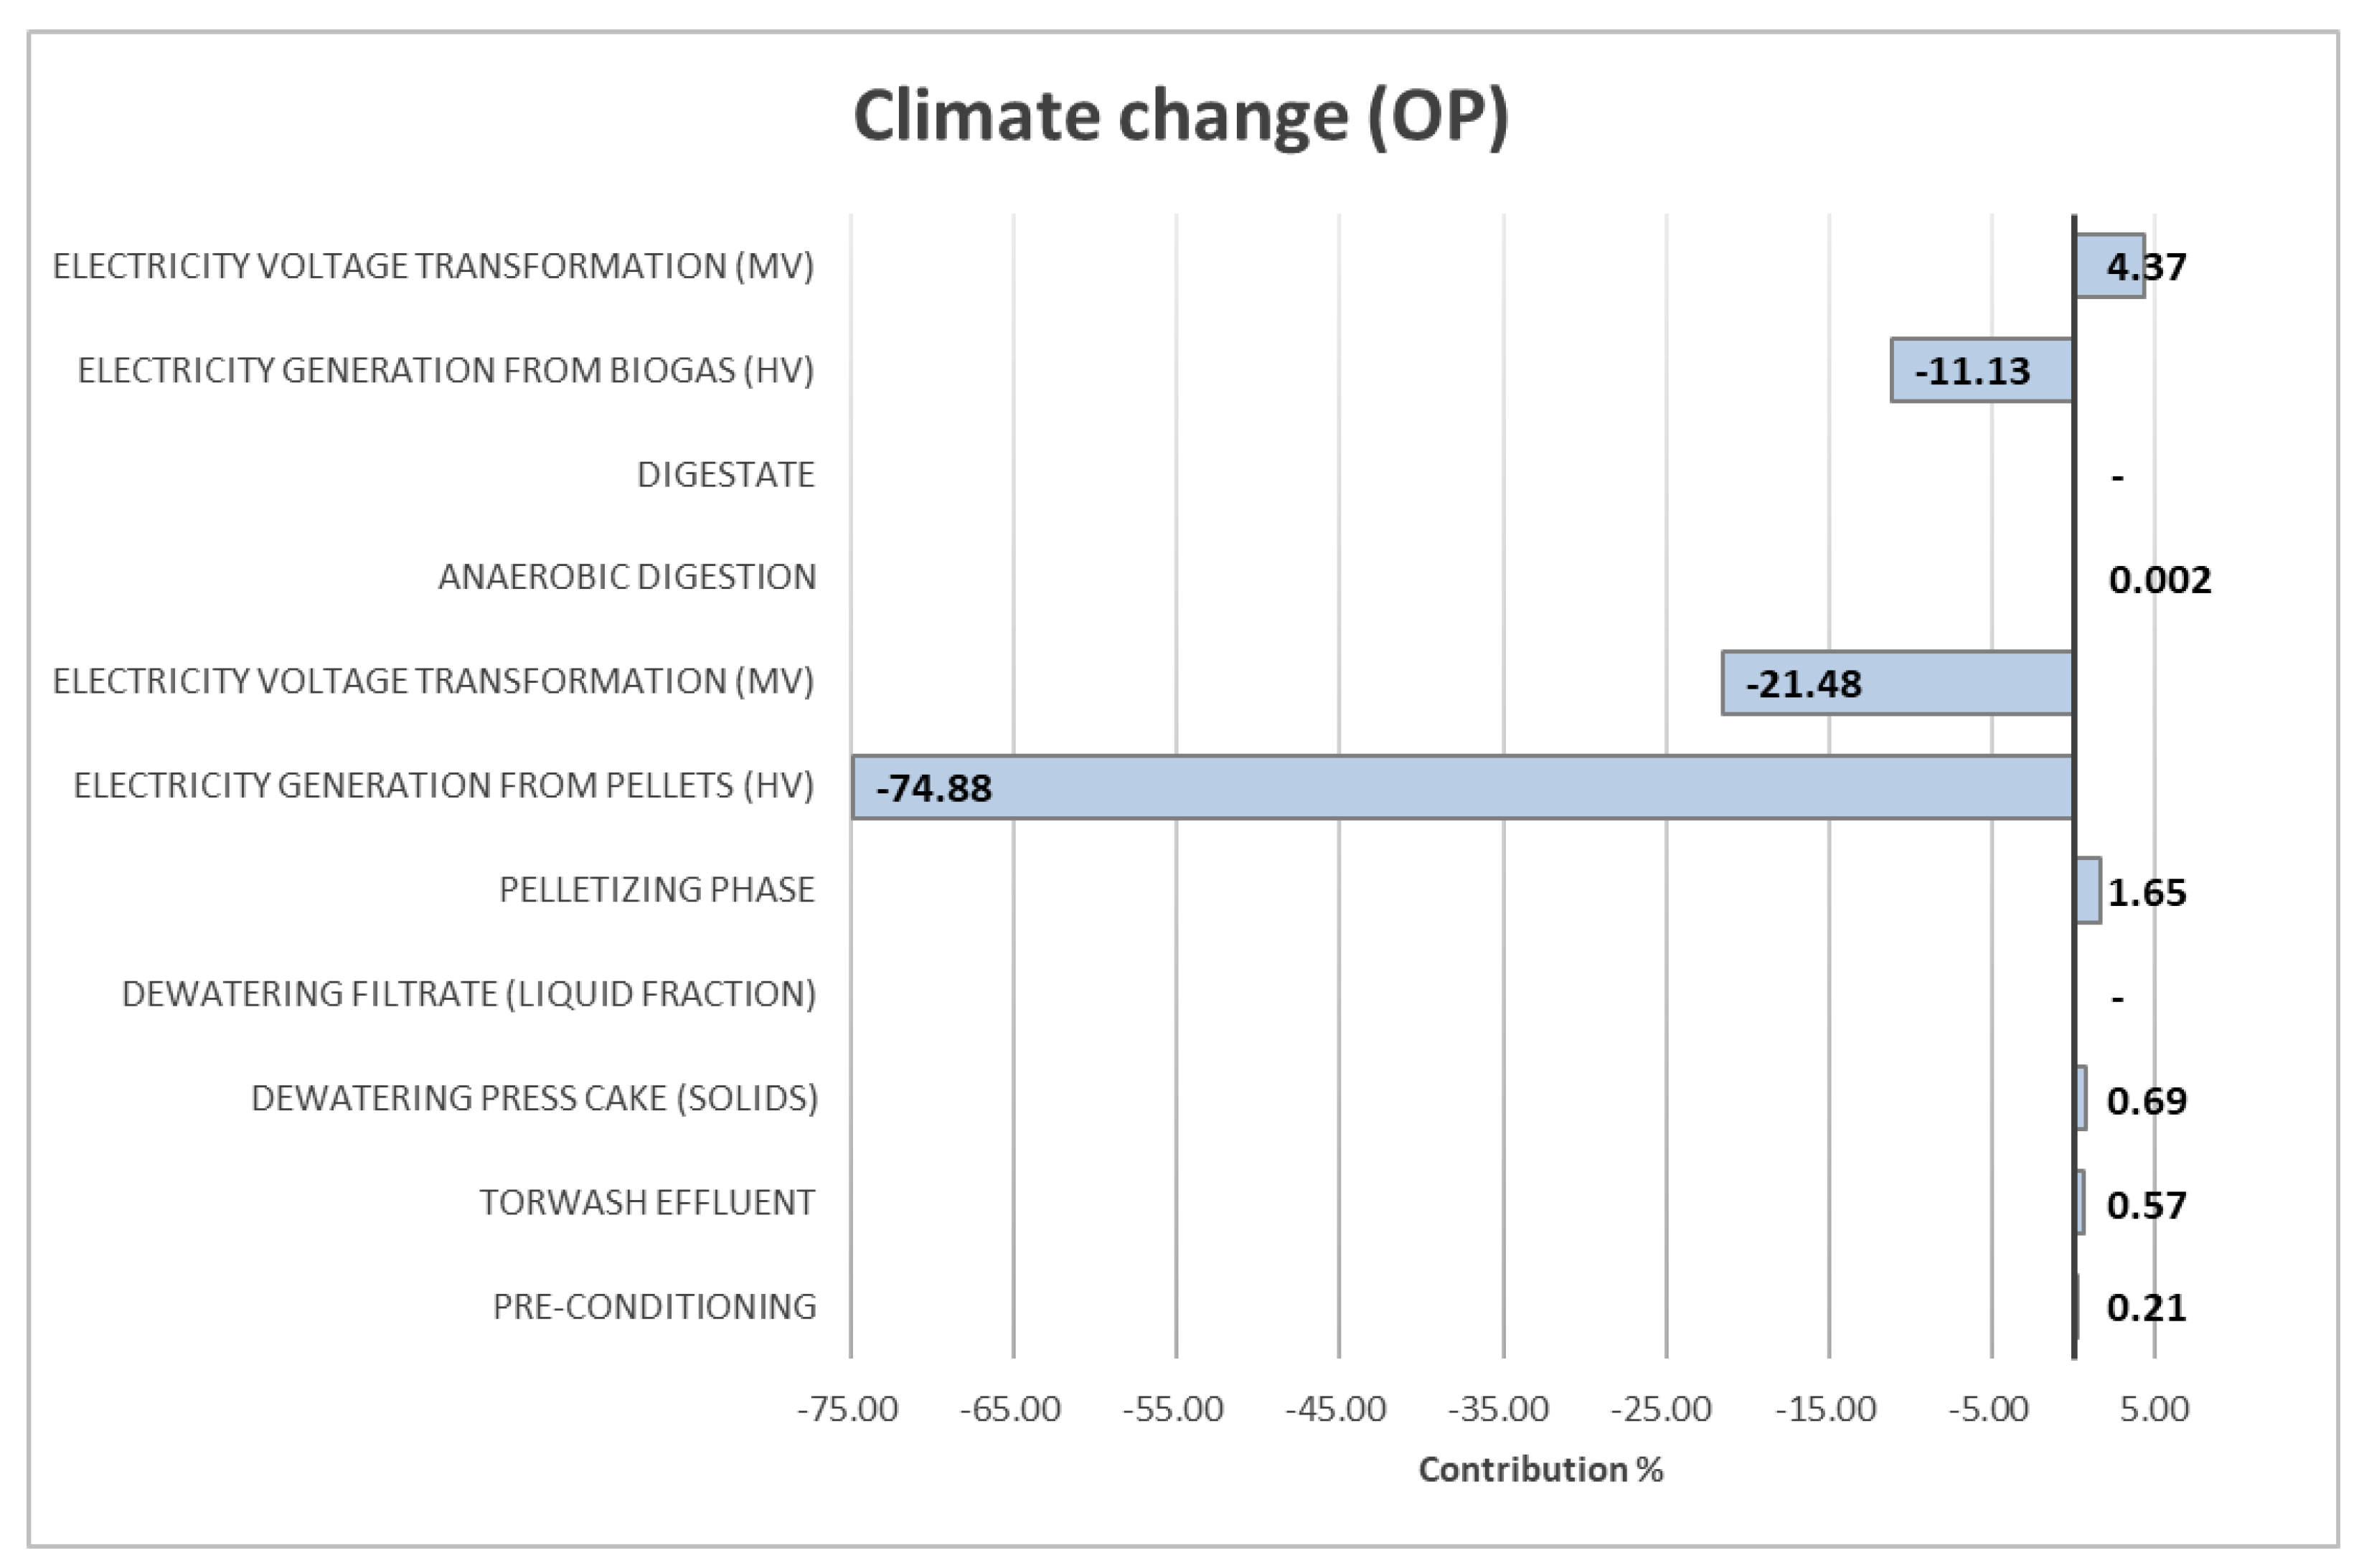
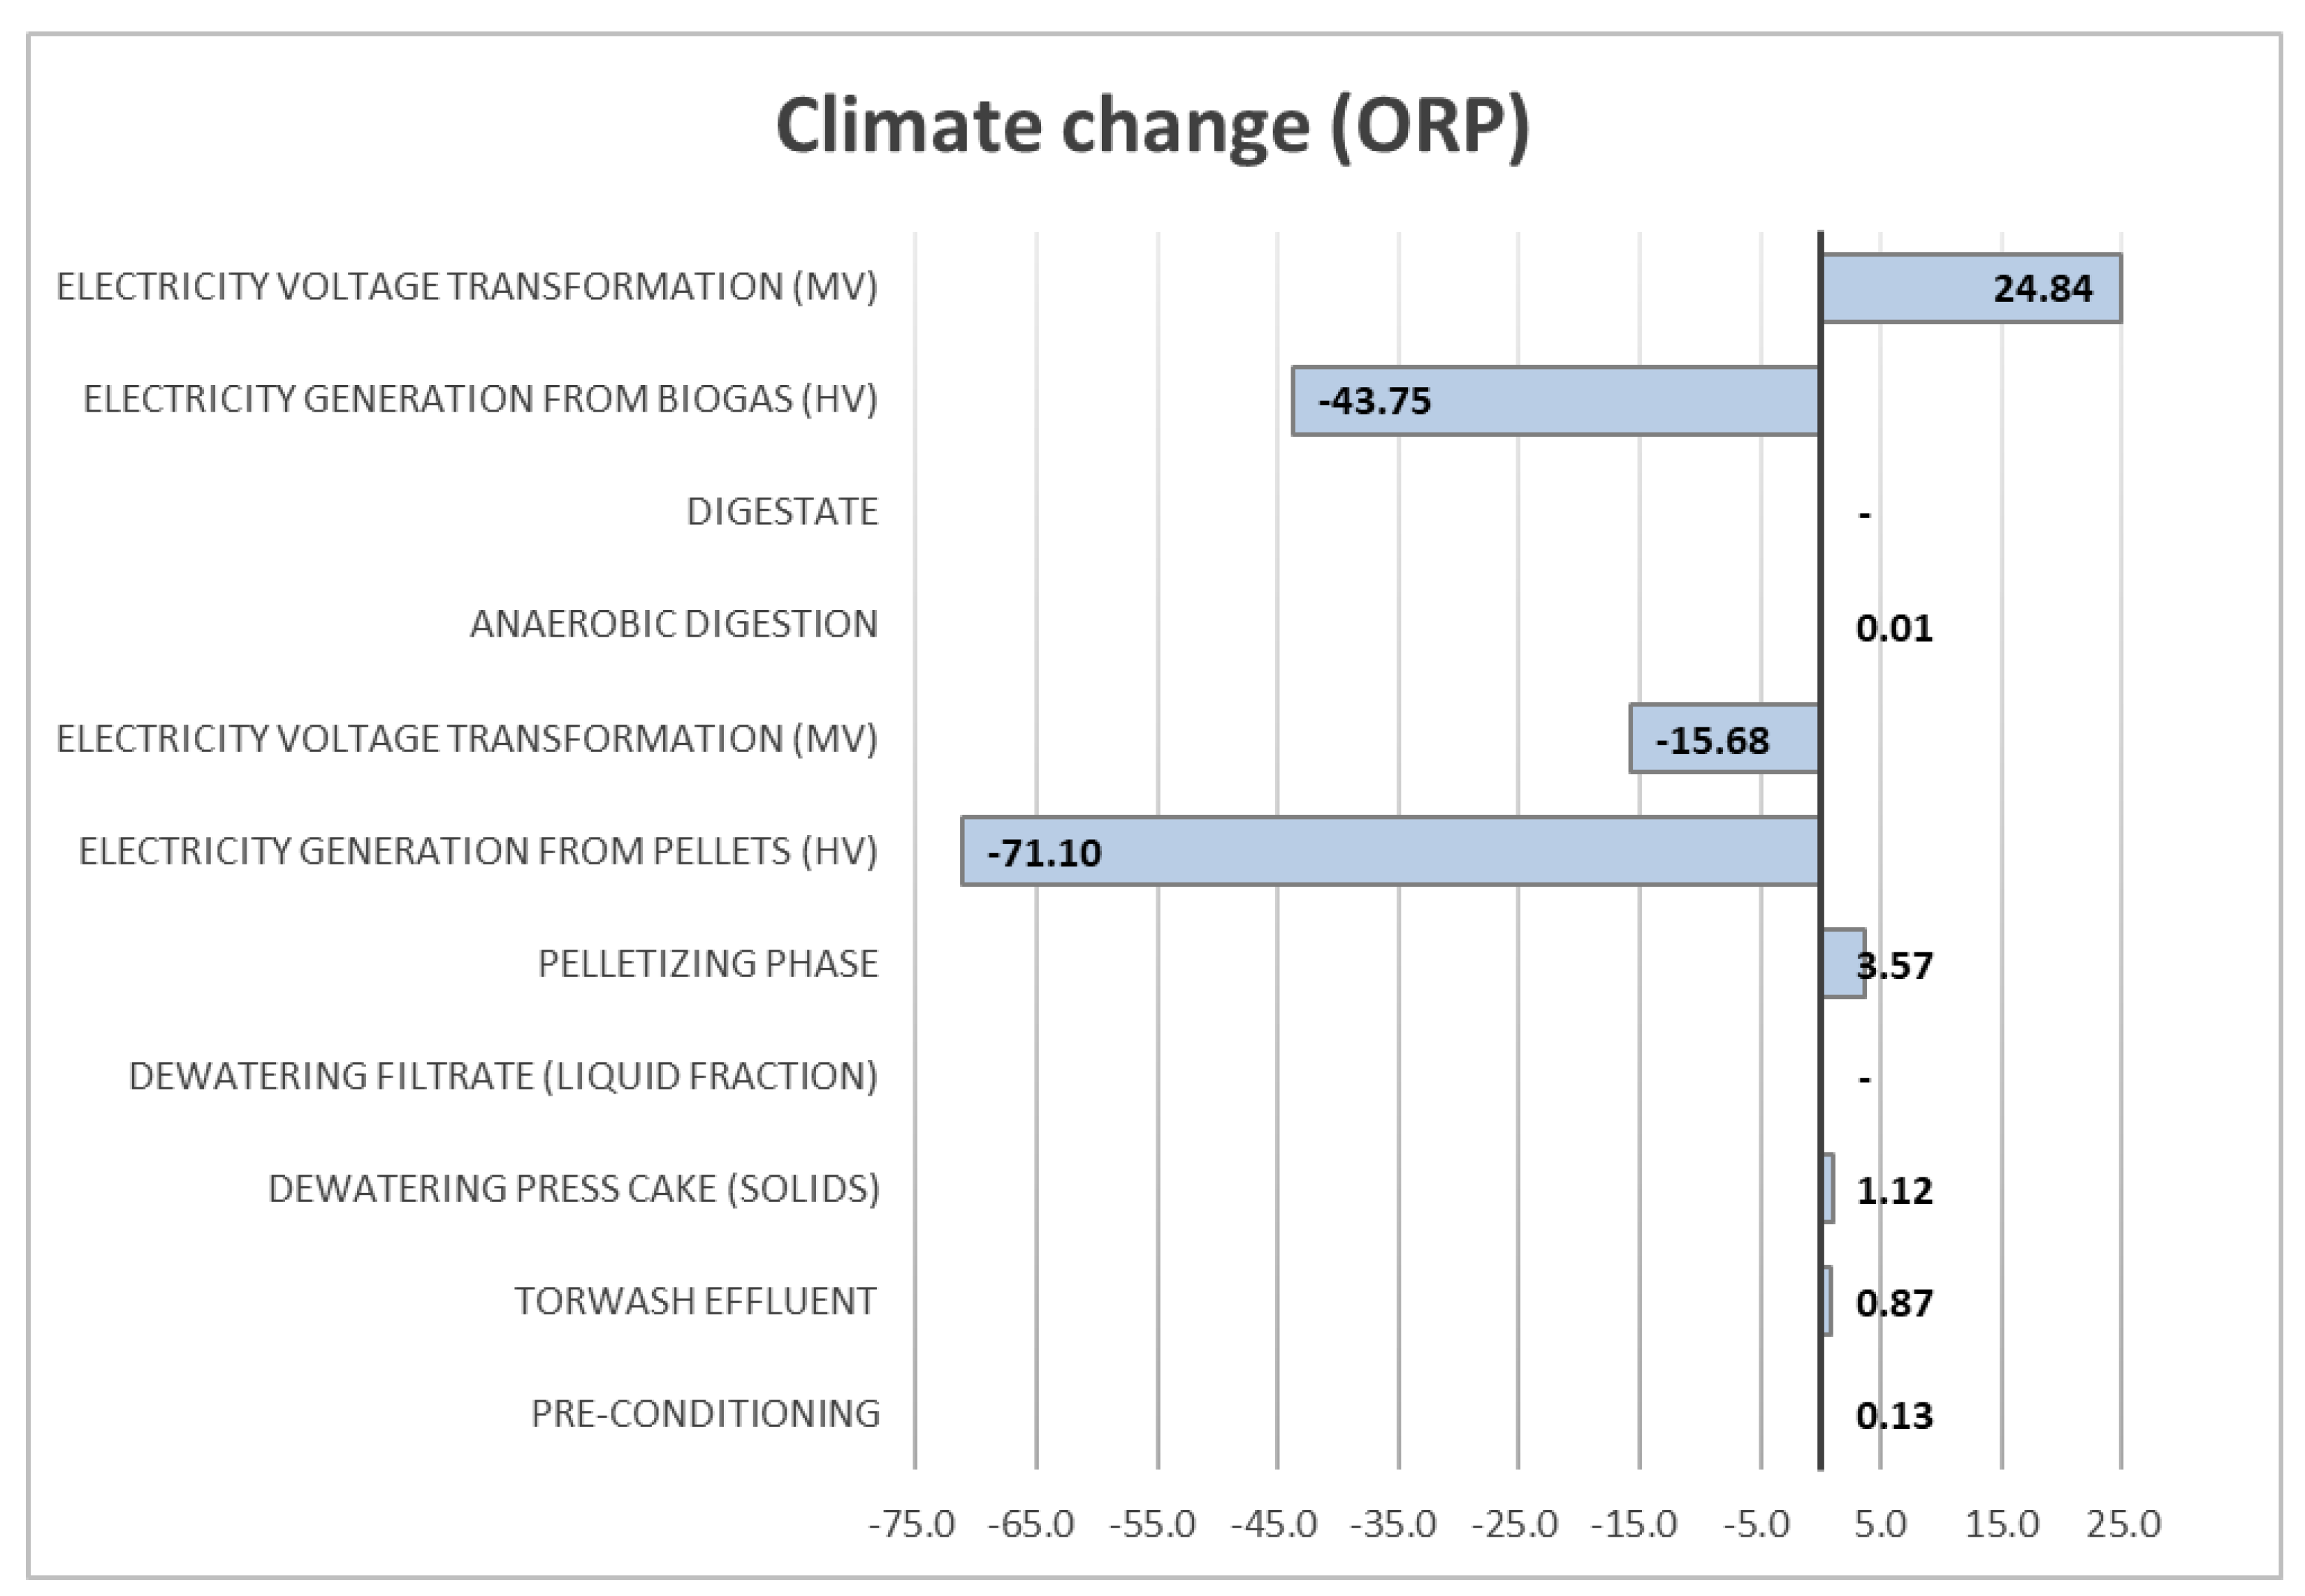
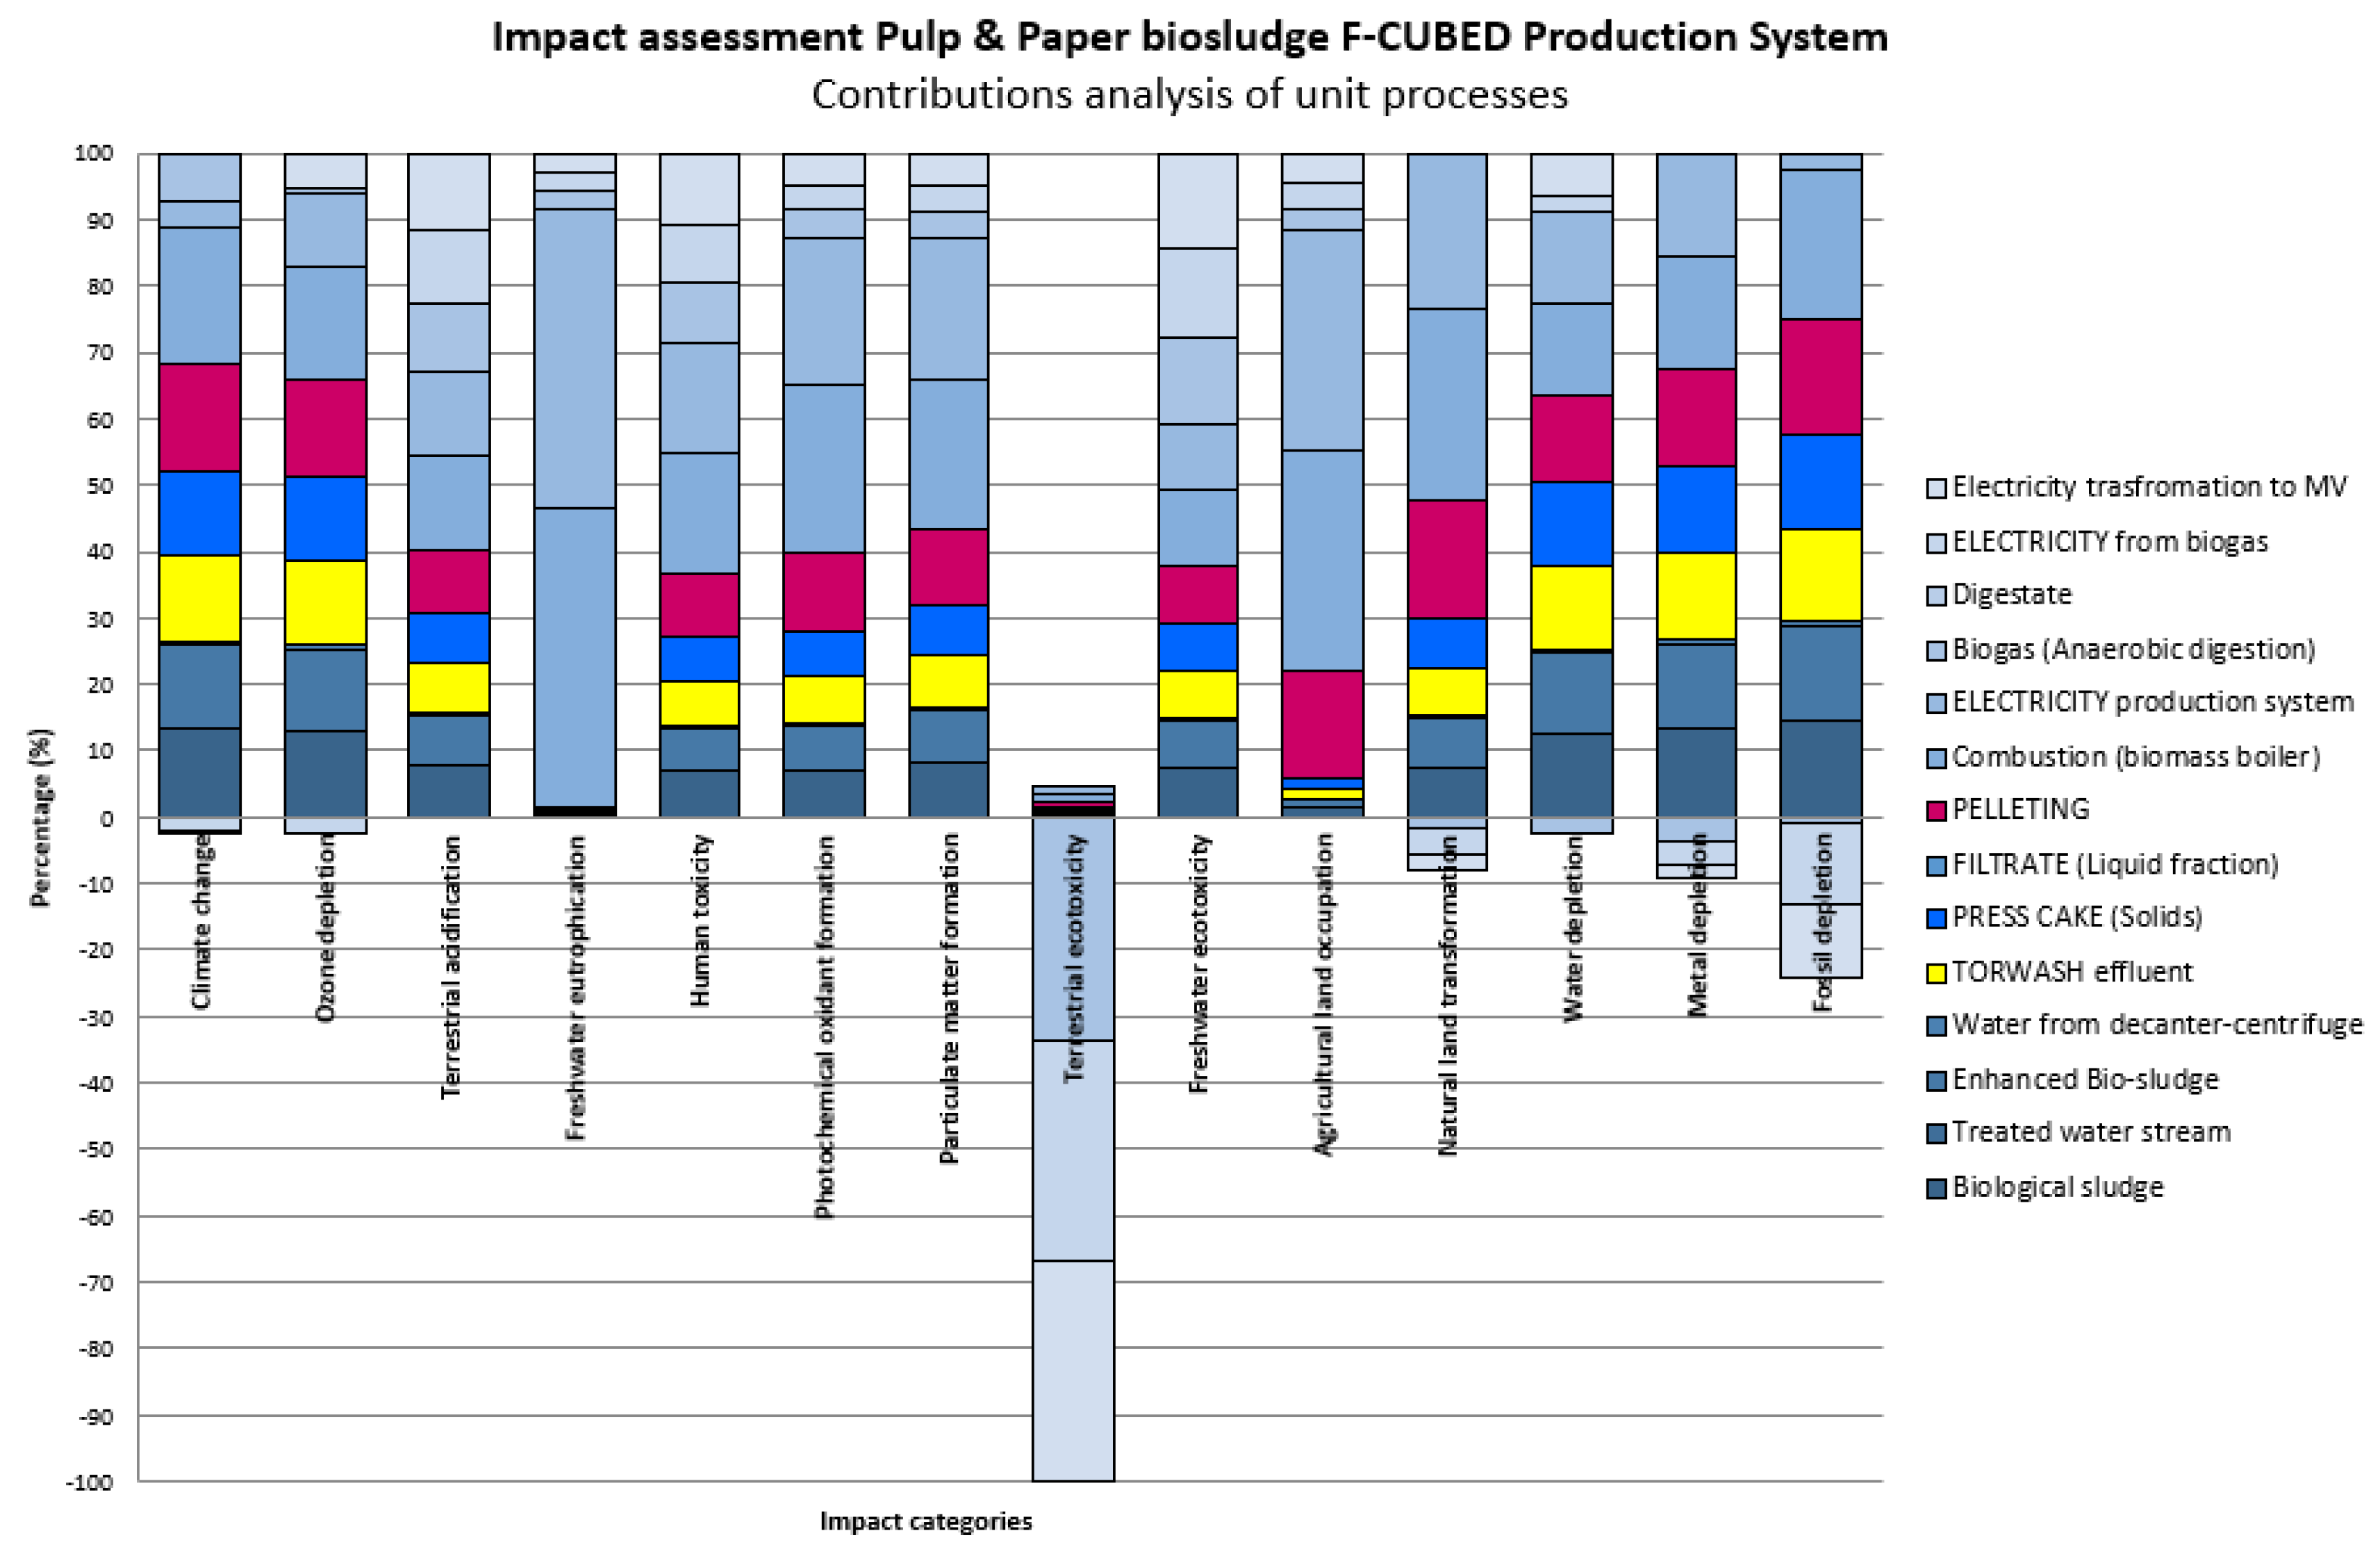
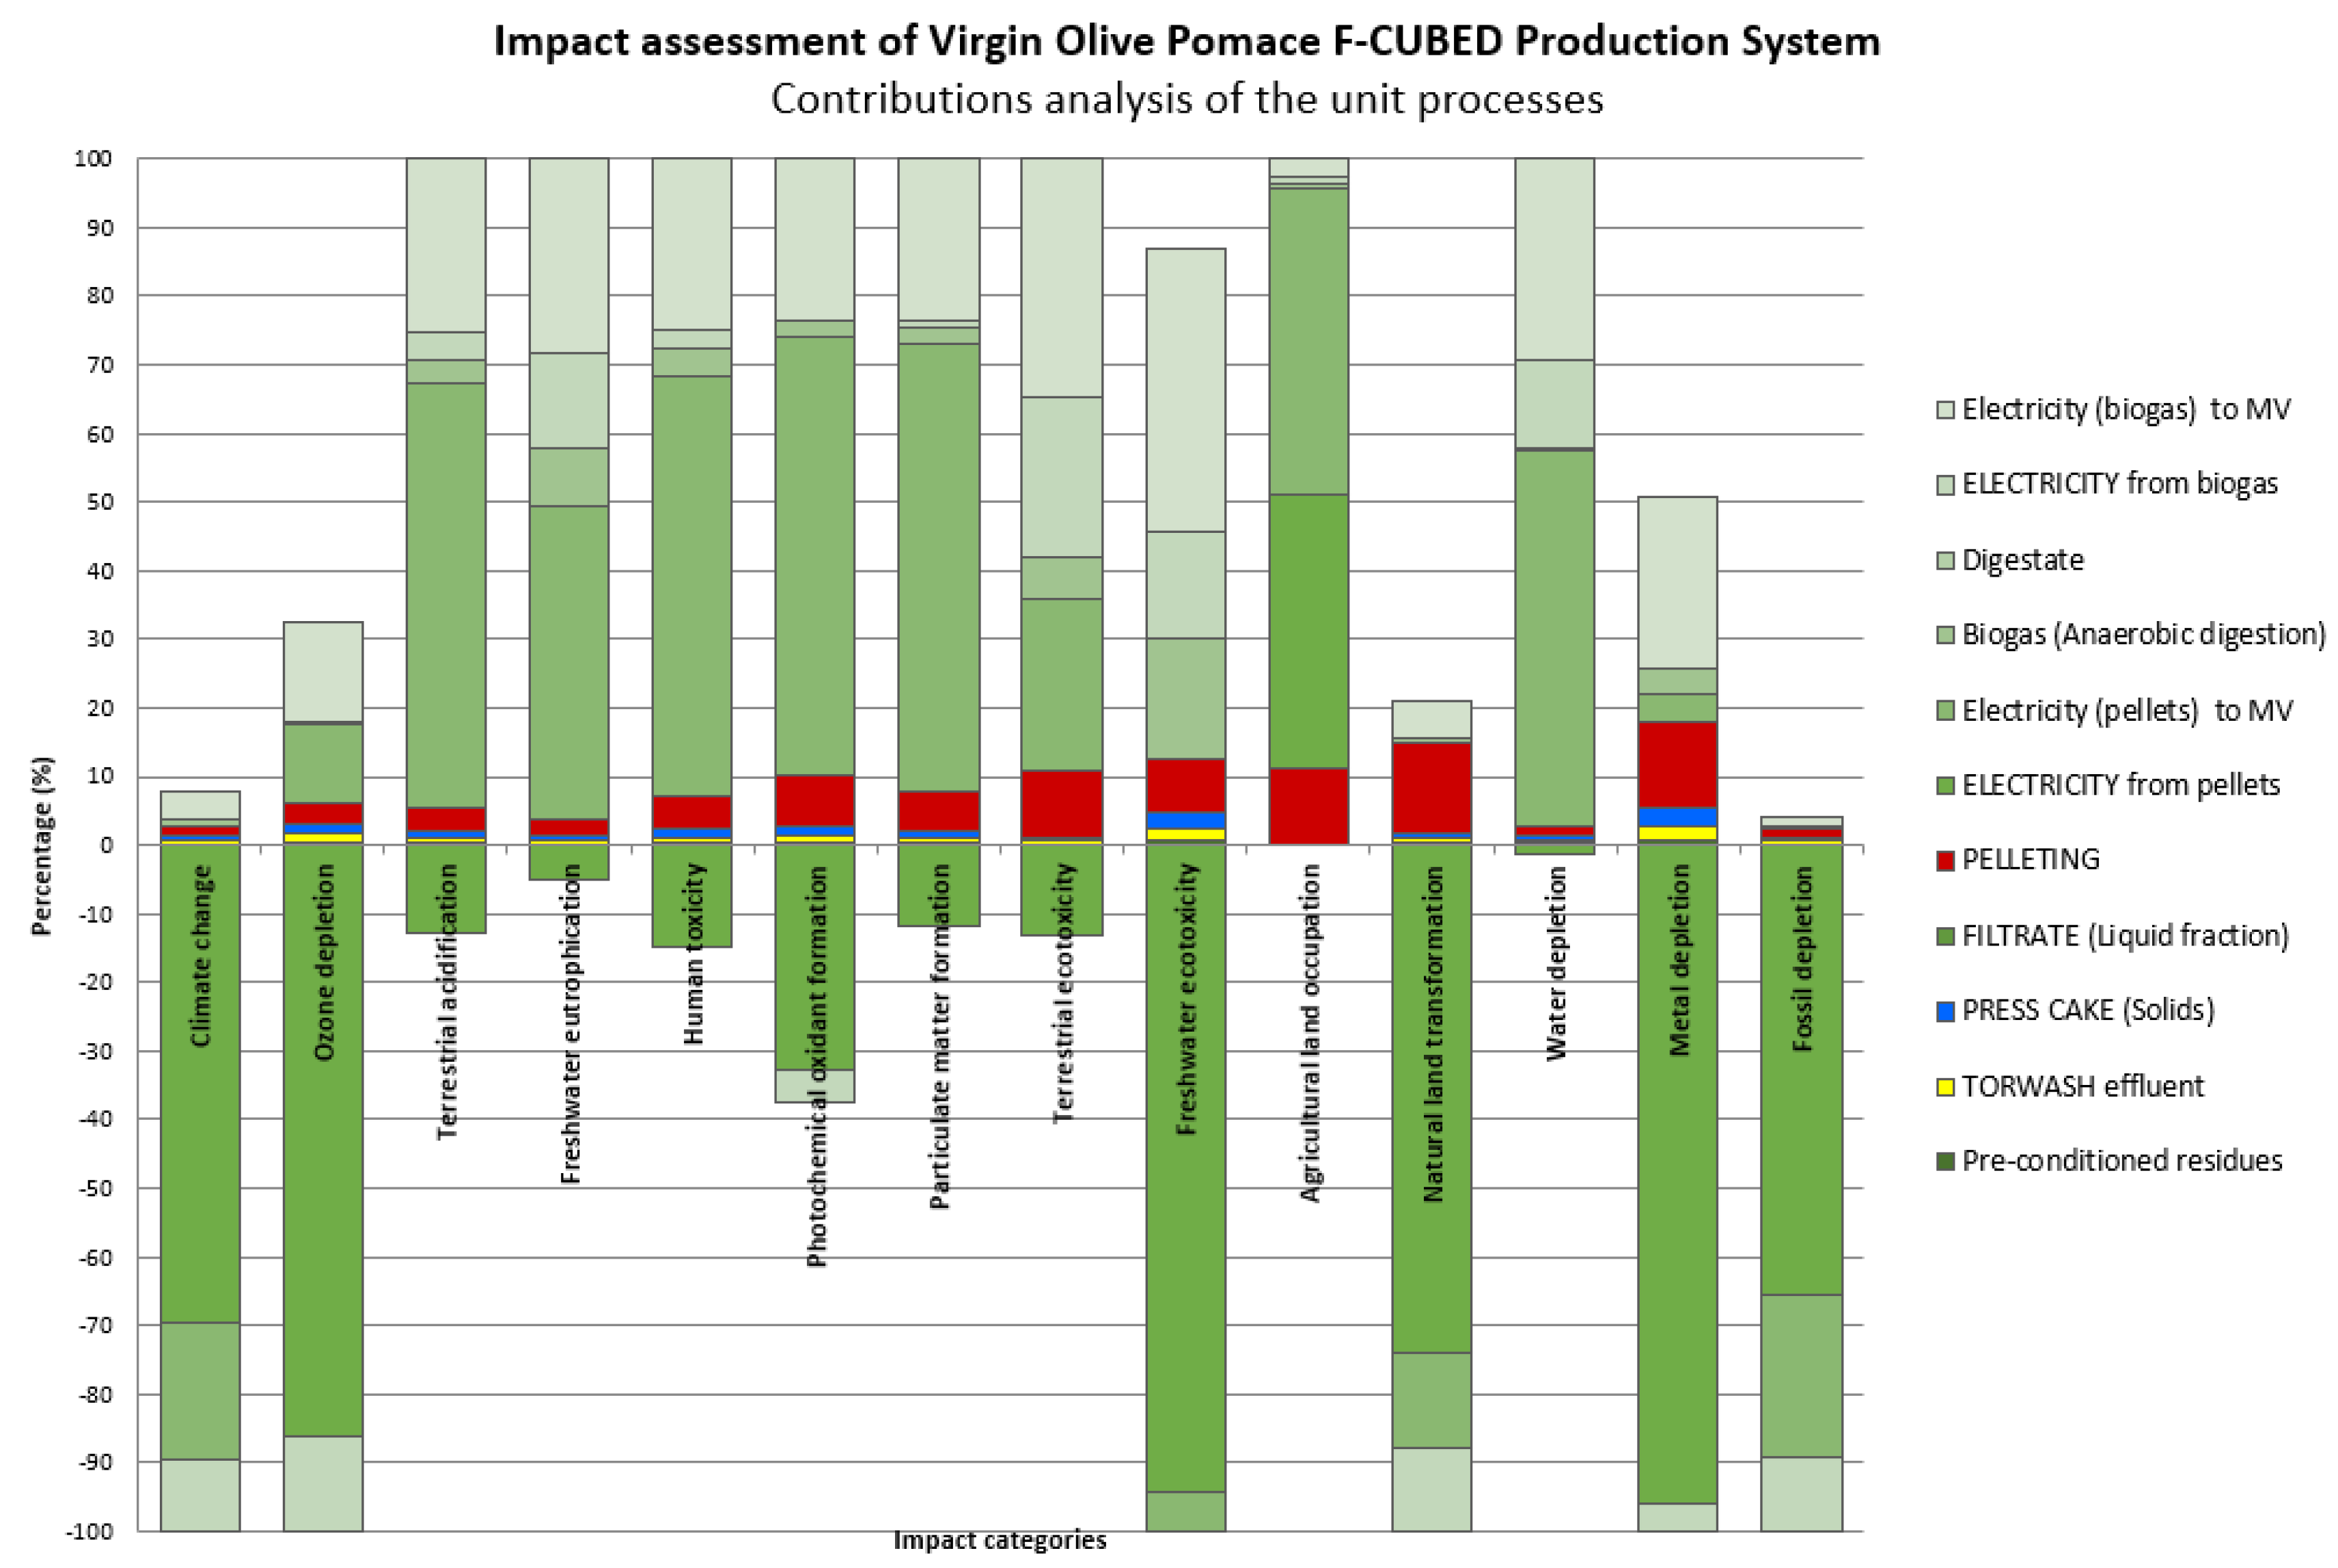
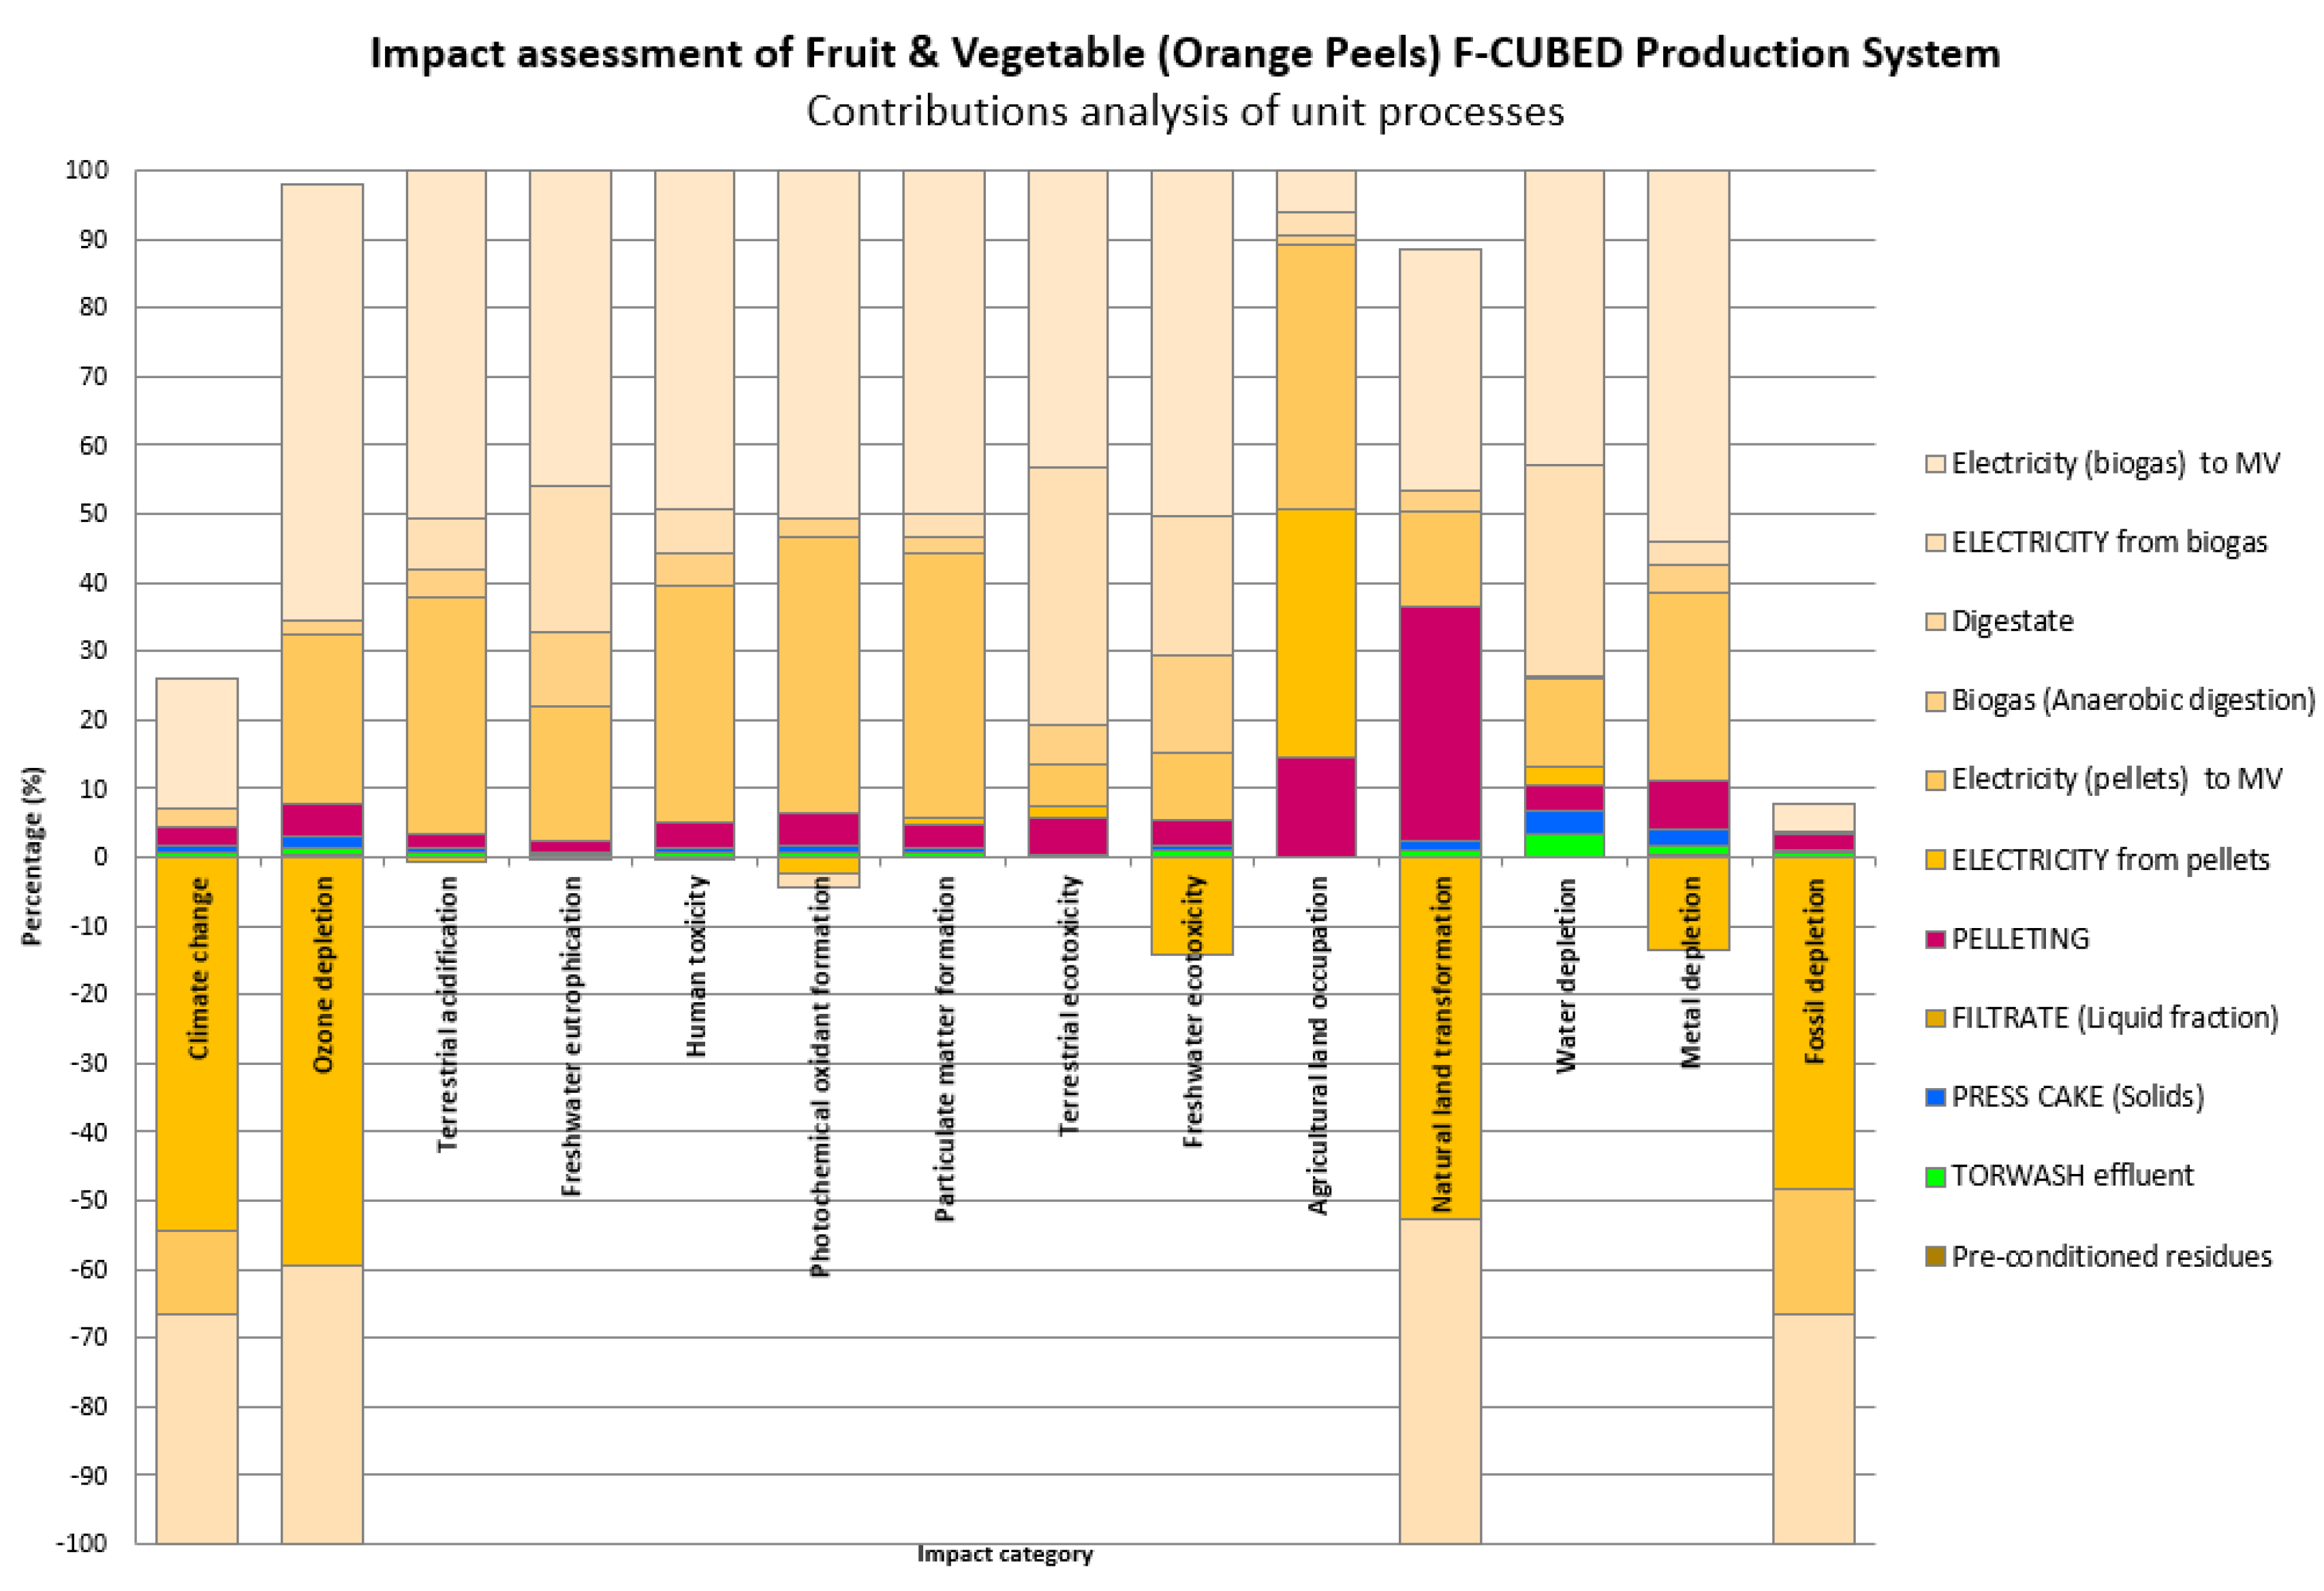
3.2. Life Cycle Impact Assessment (LCIA) Results

The life cycle impact assessment (LCIA) is described via visualization of impact assessment results for the three case studies (scenarios for pulp and paper bio-sludge, virgin olive pomace, and orange peel). The results have been consolidated into harmonised impact scores via the ReCiPe impact assessment method based on hierarchist perspectives, at the midpoint level.
To reduce the complexity of the LCA study, including the multitude of impact categories of the ReCiPe method, an impact category selection was performed to highlight results that are most relevant to the bioenergy sector and the F-CUBED production system, maintaining the accuracy of the LCA analysis. In total, 14 out of 18 impact categories were prioritised and categorised into compartments of action. For the air compartment they were climate change, ozone depletion and photochemical oxidant formation; for the soil compartment they were terrestrial acidification; for the water compartment they were freshwater eutrophication and freshwater ecotoxicity; for resource depletion they were water depletion and fossil depletion; and with a specific focus on human health they were human toxicity and particulate matter formation.
Reliability of this categorisation was also ensured through the Monte Carlo simulation sensitivity analysis. The reliable impact categories have a coefficient of variation (CV%) ≤ 20%, and impact categories with CV > 20% up to 100% were classified as unreliable. The latter required further investigation (substance inventory and unit process contributions) and have been interpreted with caution. Indeed, for these values, the standard deviation is relatively large compared to the mean with high variability between the data, indicating a low reliability of the impact assessment results. Finally, impact category values associated with CV > 100% have been classified as inconsistent and were not considered in the LCIA.
The contribution of the different processes of the F-CUBED production system relative to the overall impact are investigated per impact category. The contribution analysis of the most relevant impact categories, e.g., climate change (CC), particulate matter formation (PMF), terrestrial acidification (TA), fossil depletion (FD), freshwater eutrophication (FEUT), and freshwater ecotoxicity (FETX), allows identification of the production phases or single unit processes that are the largest impact contributors and comparison between the three case studies.
The LCIA refers to 1 metric ton of the specific biogenic residue on an as-received basis. The detailed contribution of production steps to every impact category is displayed in Figure 6, Figure 7 and Figure 8 where brighter colors emphasise the contribution of the core processes, positive values represent active environmental impacts, and negative values represent benefits for the impact category.
Concerning the PPB case study (Figure 6), the relative weight of the main stream processes on the obtained results are very limited for indicators such as freshwater eutrophication and terrestrial ecotoxicity, which are mainly influenced by the energy conversion phases (downstream processes) and filtrate processing. Moreover, the impacts associated with the boiler combustion phase of the produced pellets is relevant for almost all the indicators: this critical aspect is probably due to the Ecoinvent process chosen as the proxy-process (i.e., wood pellet combustion in a small-sized plant), which shows reduced optimizations from the energetic and logistic points of view. According to the choices carried out in the inventory construction and considering the assumptions and limitation definition, no significant effects on the impact categories are determined by the credits attribution: only terrestrial ecotoxicity benefits from the avoided production and use of traditional fertilisers due to spreading of the digestate, while freshwater eutrophication benefits from the heat recovery.
For the OP case study, the main stream processes contribute to the overall impact per impact category in a limited way (Figure 7). Moreover, according to the choices carried out in the inventory construction and considering the assumptions and limitations definitions, significant effects on the impact categories are determined by the credits attribution in the conversion phases, i.e., pellet and biogas utilization, although digestate spreading seems to produce reduced benefits.
Finally, as depicted in Figure 8, in the ORP case study, the relative weight of the main stream processes on the obtained results is very limited for all the analysed indicators. Only the agricultural land occupation and natural land transformation have significant impacts mainly due to the pelletizing phase.
Table 5 reports the total impact value for each impact category for the F-CUBED production system of the investigated biogenic residue streams.
The impacts of the F-CUBED production system are also compared to the impacts of the reference cases per functional unit, i.e., 1 kWh of electricity produced (Table 6). Further comparison with respective locations’ electricity country mix (ECM) impacts demonstrates how different electricity impact intensities can affect the final sustainability outcomes. Considering the sensitivity analysis, the bold font refers to the impact category with highest reliability (CV ≤ 20%), while the impact category showing inconsistent or nonsignificant values for goal and scope of the present LCA are excluded and indicated in red characters. All the others present a lower reliability, with CV comprising values > 20% up to 100%.
The data visualization using histograms of the comparison of LCIA results for the biogenic residues case studies is provided in Supplementary C.
In the PPB case study, many impact indicators have lower value for the F-CUBED production system when compared to the reference case, ranging from −41.44% (TA) to −74.37% (FD). Agricultural land occupation (ALO) impacts are increased by +195% when compared to the reference case. It is assumed that the F-CUBED technology (TORWASH® and Membrane Filter Press) is integrated into existing facilities, due to the challenges (and environmental impact) of transporting wet residue. Therefore, the ALO impact is mainly attributed to other phases of the process, such as drying and pelletization, as well as energy-generating steps. These activities offer location flexibility, suggesting the potential for hub-based infrastructure and determining soil occupation.
Furthermore, the F-CUBED production system shows, in general, less favourable impacts when compared to the Swedish electricity country mix. The main reason for this is the low impact intensity (0.045 kg CO2 eq/kWh) of the Swedish electricity country mix [51], in which the renewable energy sources—including hydropower, wind, and solar, together with nuclear—represented more than 90% of the electricity mix in 2021 [52]. The results for PPB case study are further depicted in Figure S10 (Supplementary C).
In the OP case study, the F-CUBED production system has lower impacts for three impact categories CC, FEUT, and FD when compared to the reference case, with improvements of 274%, 83%, and 348%, respectively. When compared to the electricity country mix of Italy, the F-CUBED system demonstrates lower impacts in six of seven categories. The generally high impacts of the RC are attributed to the large amount of digestate to be treated, which implies direct emissions from landfarming applications and burdens from the land spreading process. The results for the OP case study are further depicted in Figure S11 (Supplementary C).
In the ORP case study, similar to that of OP, the F-CUBED production system has lower impacts for only three impact categories, CC, FEUT, and FD, when compared to the reference case, representing improvements of 476%, 43%, and 742%, respectively. When compared to the electricity country mix for Spain, the F-CUBED system shows the same trend. This is due to the large share (42.2%, in 2022) of renewables (including non-renewable waste) in the national electricity mix in Spain, which reduces the impact intensity. The carbon intensity of the electricity mix of Spain is 0.217 kg CO2 eq/kWh [53]; in comparison, for Italy this value is 0.372 kg CO2 eq/kWh [54]. The results for the ORP case study are further depicted in Figure S12 (Supplementary C).
To capture the most significant environmental effects, the impact categories most relevant for the F-CUBED production system are prioritised. Table 7 summarises the results for relevant impact categories for the three case studies. It provides a concise quantitative overview of the environmental impacts and highlights key findings, including carbon emission reductions, low impact on particulate matter formation, high terrestrial acidification potential for olive pomace and orange peel, savings in chemical elements for virgin olive pomace, low impacts on freshwater ecotoxicity and eutrophication, and potential toxicity concerns for human health during the treatment of olive pomace and orange peel.
For the sake of brevity, hereafter, only the detailed analysis of the climate change impact category is described while the other reliable and relevant impact categories are reported in Supplementary B.
For the pulp and paper bio-sludge (PPB) scenario, as illustrated in Table 6, the reliable impact categories are particulate matter formation (CV 12.0%), terrestrial acidification (CV 12.1%), and climate change (CV 19.1%). On the contrary, the impact categories that present inconsistent data are freshwater eutrophication (CV 528%) and water depletion (CV 2924.6%).
The climate change impact category for PPB accounts for 17.91 kg CO2 eq./tADP. As reported in Figure 9, the major contributions to CC impact are from combustion of the pellets in the biomass boiler (24.87%) releasing 4.45 kgCO2eq/tADP and in the pelletizing phase (19.14%) releasing 3.43 kgCO2eq/tADP. The TORWASH® treatment (15.12%; 2.71 kgCO2eq/tADP) and the dewatering phase (15.21%; 2.72 kgCO2eq/tADP) have similar contributions. Therefore, the main stream processes account for a combined 49.47% (8.86 kgCO2eq/tADP) of climate change impact. The pretreatment processes, WWT, and thickening of the bio-sludge also contribute 31.59% (5.66 kgCO2eq/tADP) of the climate change impact when combined. The filtrate secondary processing, AD, electricity generation from biogas (HV), and electricity voltage transformation (MV) account for overall negative GHG emissions (−1.85 kgCO2eq/tADP or −10.35% of climate change impact).
The concept of negative emission comes from the negative impacts of avoided products generated in the AD step via heat recovery and avoided production and use of synthetic fertilisers. In PPB, as displayed in Figure 9, AD accounts for −0.8856 kgCO2eq/tADP (−4.94%); electricity generation accounts for −0.9009 kgCO2eq/tADP (−5.03%); and electricity transformation accounts for —0.0677 kgCO2eq/tADP (−0.38%).
For the olive pomace scenario (OP), as illustrated in Table 6, the reliable impact categories are fossil depletion (CV 13.18%), climate change (CV 15.41%), terrestrial acidification (CV 17.68%), and particulate matter formation (CV 17.69%). The inconsistent impact categories are water depletion (CV 1664.99%), freshwater ecotoxicity (CV 535.53%), and ozone depletion (121. 65%).
The climate change impact category for olive pomace accounts for −1299.00 kgCO2eq/tOP. As illustrated in Figure 10, the major contributions to CC impact are from the downstream processes, i.e., electricity generation from pellets (−74.88%) releasing −972.69 kgCO2eq/tOP and electricity voltage transformation (21.48%; −279.02 kgCO2eq/tOP); these two processes account for −96.36%, corresponding to an emission savings of −1251.71 kgCO2eq/tOP). Negative emissions come mainly from the negative impact of avoided production, nested in the process of the electricity generation from pellets, via the heat recovery of the heat produced and exported outside the system.
The main stream processes slightly contribute to CC with positive emissions of 2.91% (37.86 kgCO2eq/tOP). The pretreatment processes, destoning and dilution, give a small contribution to the CC impact category, accounting for 0.21% (2.67 kgCO2eq/tOP). Finally, electricity generation from biogas and its electricity voltage transformation account for negative emission of −6.76%, corresponding to −87.81 kgCO2eq/tOP of GHG emissions into the atmosphere, which are avoided product via heat recovery.
For the orange Peel scenario (ORP), as illustrated in Table 6, the reliable impact categories are climate change (CV 21.99%), particulate matter formation (CV 6.77%), terrestrial acidification CV 6.50%), and fossil depletion (CV 17.09%). Inconsistent impact categories are water depletion (CV 3038.20%) and ozone depletion (CV 539.54%).
The climate change impact category for ORP accounts for −1301.61 kgCO2eq/tORP. These emissions, as displayed in Figure 11, are mainly provided by electricity generation from pellets (−71.10%) and from biogas (−43.75%) resulting in −925.50 and −204.11 kgCO2eq/tORP, respectively; these two processes together account for −115% of the overall impact, corresponding to a GHG savings of −1495.01 kgCO2eq/tORP. These negative emissions come mainly from the negative impact of avoided products accounted for in the processes of the pellet and biogas electricity generation, both provided via heat recovery regarding heat produced and exported outside the system.
The main processes slightly contribute to CC impact, with positive emissions for 5.56% (72.36 kgCO2eq/tORP). The pretreatment processes, grinding and dilution, add a small contribution to the CC impact category, accounting for 0.13% (1.67 kgCO2eq/tORP). Electricity voltage transformation in the filtrate processing accounts for 24.84% of emissions, corresponding to 323.38 kgCO2eq/tORP.
With the aim to analyse the obtained results for the climate change impact category in more detail, the results have been elaborated, focusing attention on the electricity produced in the different hypothesised scenarios and the emissions savings between the F-CUBED production system and the reference case. Table 8 illustrates some key performarce indicators of F-CUBED production system in terms of carbon footprint and electricity production in the different case studies.
For the pulp and paper bio-sludge, the overall electricity generation from 1 ton of air-dried pulp (tADP) is 15.82 and 5.56 kWh for the F-CUBED system and RC, respectively, representing an improvement of 10.26 kWh for the F-CUBED system (185%) relative to the reference case. This production is associated with carbon footprints for the F-CUBED system and RC of 17.90 and 18.50 kgCO2eq/tADP, corresponding to 1.13 and 3.33 kgCO2eq/kWh, respectively, and an improvement in the F-CUBED system relative to the RC in emissions savings of −2.20 kgCO2eq/kWh (−66%). These carbon emissions consist of emissions in the air compartment (atmosphere). When the emissions savings relative to the avoided treatment and disposal of the pulp and paper bio-sludge (−5.69 kgCO2eq/kWh) are computed, the impact on climate change becomes negative and accounts for −4.56 and −2.36 kgCO2eq/kWh, respectively, for the F-CUBED and RC processes. The final values are even more sustainable in respect to the Swedish electricity country mix, which has a carbon intensity of 45 g/kWh [51]. In this case study, to calculate the final carbon footprint, the further emissions needed to cover the electricity production gap between the F-CUBED system and RC was not taken into account. In fact, at the paper mill (Smurfit Kappa) facility the overall need for electricity is supplied by the internal energy production system, and the carbon footprint for functional unit does not change.
The electricity generation from 1 ton of virgin olive pomace (tOP) is 2064.31 kWh and 270.07 kWh for the F-CUBED system and reference case, respectively. This represents an improvement of 1794.24 kWh for the F-CUBED process (664%) relative to the RC. This production for the F-CUBED process and the RC is associated with carbon footprints of −1299.00 and −1014.83 kgCO2eq/tOP, respectively. To make the two production systems comparable, it is necessary to take into account the equivalent electricity generation and add to the final value of the carbon footprint the further emissions needed to cover the electricity production gap between the F-CUBED system and the RC with the electricity country mix available at a national level. In this case study, the Italian country mix accounts for a carbon intensity of 0.372 kgCO2eq/kWh [54]. The carbon cost of the gap is therefore 667.46 kgCO2eq. This translates in a final value for the RC carbon footprint of −347.38 kgCO2eq/tOP, and in the F-CUBED system’s improvement relative to the RC there was an emission savings of 941.72 kgCO2eq/tOP. In total, the F-CUBED production system and RC show carbon footprints of −0.63 and −0.17 kgCO2eq/kWh, respectively. This means that the F-CUBED production system provides an emission savings of 0.46 kgCO2eq/kWh, corresponding to an improvement of 274% relative to the RC. When compared to the electricity dispatchable from the national country mix (Italy), both the F-CUBED system and the RC provide emissions savings (−0.540 and −1.001 kgCO2eq/kWh, respectively).
The electricity generation from 1 ton of orange peel (tORP) is 5213.75 and 1163.01 kWh for the F-CUBED system and the RC, respectively. This difference of 4050.74 kWh between the two cases corresponds to over a three-fold improvement (348%) for the F-CUBED process. This electricity production for the F-CUBED system and the RC is associated with carbon footprints of −1257.05 and −532.63 kgCO2eq/tORP, respectively. To make the two production systems comparable, it is necessary to take into account the equivalent electricity generation and add to the final value of the carbon footprint the further emissions needed to cover the electricity production gap between the F-CUBED system and the RC with the electricity country mix available at a national level. In this case study, the Spanish country mix has a carbon intensity of 0.217 kgCO2eq/kWh [53]. The carbon cost of the gap is therefore 879.01 kgCO2eq. This translates to a final value for the RC carbon footprint of 346.38 kgCO2eq/tORP and an improvement in the F-CUBED process relative to the RC of 1647.98 kgCO2eq/tORP.
In all, the F-CUBED production system and reference case show carbon footprints of −0.25 and 0.07 kgCO2eq/kWh, respectively. This means that the F-CUBED production system provides emissions savings of 0.32 kgCO2eq/kWh, corresponding to an almost five-fold improvement (476%) when compared to the RC. Moreover, with respect to the electricity dispatchable from the electric grid as the national country mix (Spain) both the F-CUBED system and the RC provide emissions savings (−0.15 and—0.47 kgCO2eq/kWh, respectively).

4. Conclusions, Outlook, and Limitations of the Study

An attributional LCA was carried out to describe the environmental performances of the F-CUBED production system and its sub-systems for the treatment of three wet biogenic residue streams: pulp and paper bio-sludge, olive pomace, and orange peel. Environmental impacts related to all relevant resources, energy, and materials as inputs and outputs within the defined system boundaries were calculated. In the LCIA phase, the life cycle inventories for the investigated three biogenic residue case studies were converted into a number of harmonised impact scores using the ReCiPe impact assessment method based on hierarchist perspectives, at the midpoint level, prioritizing ten impact categories. Reliability of this categorization was also ensured through a sensitivity analysis, as parameter uncertainty analysis, carried out using a Monte Carlo simulation. The cross-check of impact category selection and sensitivity analysis highlights that the most significant impact categories are climate change (CC), particulate matter formation (PMF), and terrestrial acidification (TA), which show the highest reliability in every case study. Showing secondary relevance, because of their lower reliability, are freshwater toxicity (FTXT) and freshwater eutrophication (FEUT). These impact categories must be considered because they are appropriate for the specific impacts of the wet residues in the water compartment. For them, further investigations for more robust data are suggested.
The LCIA results show that the carbon footprint of the F-CUBED production system, as kgCO2eq/kWhe, accounts for –4.56, −0.63, and −0.25 for pulp and paper bio-sludge, olive pomace, and orange peel, respectively. These values translate into significant GHG emissions savings when compared to the reference cases, corresponding to −2.20, −0.46, and −0.32 kgCO2eq/kWhe of emissions reductions, respectively.
In particular, the pulp and paper bio-sludge case study, although it presents lower GHG emission savings when compared to the reference case, shows the highest savings per functional unit demonstrating that the best environmental benefits are found for the scenario where bio-sludge is processed.
The overall results align with the targets of the European Strategic Energy Technology Plan (SET Plan), Action 8 (Implementation Plan Renewable Fuels and Bioenergy) and with significant potential benefits for national energy security. Considering the high potential impacts of the wet biogenic residue streams on the water compartment, the F-CUBED production system also highlights a significant reduction of the freshwater eutrophication impacts when compared to the reference cases.
The results for the different residue streams do not represent alternative scenarios but rather site-specific solutions considering the locally developed industrial sectors. Indeed, the biomass residues are chosen based on their territorial availability; the environmental performance of the different streams are influenced by their physical-chemical characteristics and by the optimization of the production systems originating them. For instance, the olive pomace and the orange peel have better environmental performance per ton of treated biomass than the pulp and paper sludge. On the other hand, the annual savings of CO2eq with the pulp and paper sludge can be higher than those for olive pomace and orange peel, because of the higher flow rate and hypothesised plant size; this significant amount of CO2eq savings implies potential economic revenues contributing to promotion of F-CUBED production system implementation.
In general, the results of this study demonstrate that hydrothermal treatment of the target wet biogenic residues can have several positive environmental impacts, including negative emissions. However, there are variations in the environmental performance of the three residues, suggesting that specific mitigation strategies may be needed for certain environmental impact categories as for example terrestrial acidification for orange peel and human toxicity for olive pomace and orange peel. The results of the study are beneficial to industry in general, and they can inform industry goals beyond environmental goals and into human health, among other benefits, in line with the European Commission’s Industry 5.0 principles. Particular benefits are highlighted for the pulp and paper industry and steel industry, that respectively could (i) avoid biological sludge disposal by using locally produced and currently unvalorised residue streams to produce solid fuels serving the internal energy production system or the local (bio)fuel market and (ii) receive benefits from the use of bio-based carbon sources that can replace fossil cokes in the steel making process, increasing flexibility in feedstock use.
It would be beneficial in future studies to deepen and refine the LCA model in regard to more dedicated experimental data on the steps of biomass conversion into energy both for the pelletizing phase and anaerobic digestion technology. This would increase confidence in the environmental performance of the F-CUBED production system and support the scaling up of this novel technology.

Supplementary Materials

The following supporting information can be downloaded at: https://www.mdpi.com/article/10.3390/en17030560/s1.

Author Contributions

Conceptualization, M.U. and L.R.; methodology, M.U. and L.R.; software, M.U.; validation, M.U., H.E.W., J.W.D. and P.N.; formal analysis, M.U.; investigation, M.U. and L.R.; resources, M.U. and L.R.; data curation, M.U., L.R. and J.W.D.; writing—original draft preparation, L.R.; writing—review and editing, M.U., H.E.W., J.W.D. and P.N.; visualization, L.R.; supervision, M.U. and H.E.W.; project administration, M.U. and H.E.W.; funding acquisition, H.E.W. and P.N. All authors have read and agreed to the published version of the manuscript.

Funding

This project has received funding from the European Union’s Horizon 2020 research and innovation program under grant agreement No. 884226.

Data Availability Statement

The data presented in this study are available in the Supplementary A, B and C.

Acknowledgments

The authors would like to thank Ingemar Lundstrom, Laura Fernandez, Ana Rodriguez, Gianvito Chimienti, and Gianni Acquaviva for refining the data collection of the specific biogenic residue streams and reference cases; Frank Kruip, Peter Coad, Eddie O’Callaghan, Tim Hendrickx, and Gero Becker for the information related to the integrated technologies; Sayujya Shah for the harmonization of the data collection related to environmental and techno-economic information; and Eleonora Della Mina for her contribution to the filtrate secondary processing step.

Conflicts of Interest

The authors declare no conflicts of interest. The funders had no role in the design of the study; in the collection, analyses, or interpretation of data; in the writing of the manuscript; or in the decision to publish the results. Author Pavlina Nanou was employed by the company TORWASH BV. The remaining authors declare that the research was conducted in the absence of any commercial or financial relationships that could be construed as a potential conflict of interest.

References

  1. EEA. The European Environment—State and Outlook 2020; Knowledge for Transition to a Sustainable Europe; Publications Office of the European Union: Luxembourg, 2019. [Google Scholar]
  2. European Parliament. Resolution on the Consequences of Drought, Fire, and Other Extreme Weather Phenomena: Increasing the EU’s Efforts to Fight Climate Change; European Parliament: Strasbourg, France, 2023.
  3. EEA. EEA Greenhouse Gases—Data Viewer. April 2023. Available online: https://www.eea.europa.eu/data-and-maps/data/data-viewers/greenhouse-gases-viewer (accessed on 23 August 2023).
  4. EEA. Trends and Projections in Europe 2022—EEA Report No 10/2022; Publications Office of the European Union: Luxembourg, 2022. [Google Scholar]
  5. European Parliament. Climate change in Europe: Facts and Figures. March 2023. Available online: https://www.europarl.europa.eu/news/en/headlines/society/20180703STO07123/climate-change-in-europe-facts-and-figures (accessed on 23 August 2023).
  6. Toscano, G.; Pizzi, A.; Pedretti, E.F.; Rossini, G.; Ciceri, G.; Martignon, G.; Duca, D. Torrefaction of Tomato Industry Residues. Fuel 2015, 143, 89–97. [Google Scholar] [CrossRef]
  7. Oh, Y.-K.; Hwang, K.-R.; Kim, C.; Kim, J.; Lee, J.-S. Recent Developments and Key Barriers to Advanced Biofuels: A Short Review. Bioresour. Technol. 2018, 257, 320–333. [Google Scholar] [CrossRef] [PubMed]
  8. Aravani, V.; Sun, H.; Yang, Z.; Liu, G.; Wang, W.; Anagnostopoulos, G.; Syriopoulos, G.; Charisiou, N.; Goula, M.; Kornaros, M.; et al. Agricultural and Livestock Sector’s Residues in Greece & China: Comparative Qualitative and Quantitative Characterization for Assessing Their Potential for Biogas Production. Renew. Sustain. Energy Rev. 2022, 154, 111821. [Google Scholar] [CrossRef]
  9. Toscano, G.; Alfano, V.; Scarfone, A.; Pari, L. Pelleting Vineyard Pruning at Low Cost with a Mobile Technology. Energies 2018, 11, 2477. [Google Scholar] [CrossRef]
  10. E4tech. Advanced Drop-in Biofuels: UK Production Capacity Outlook to 2030; Final Report SPATS Work Package 1-045, PPRO 04/75/17; Department for Transport of UK Government: London, UK, 2017.
  11. EC. Sustainable and Optimal Use of Biomass for Energy in the EU beyond 2020—Final Report; DG Energy: Brussels, Belgium, 2017. [Google Scholar]
  12. Li, J.; Suvarna, M.; Li, L.; Pan, L.; Pérez-Ramírez, J.; Ok, Y.; Wang, X. A review of computational modeling techniques for wetwaste valorization: Research trends and future perspectives. J. Clean. Prod. 2022, 367, 133025. [Google Scholar] [CrossRef]
  13. Lachos-Perez, D.; Torres-Mayanga, P.; Abaide, E.; Zabot, G.; De Castilhos, F. Hydrothermal carbonization and Liquefaction: Differences, progress, challenges, and opportunities. Bioresour. Technol. 2022, 343, 126084. [Google Scholar] [CrossRef]
  14. Hussin, F.; Hazani, N.N.; Khalil, M.; Aroua, M.K. Environmental life cycle assessment of biomass conversionusing hydrothermal technology: A review. Fuel Process. Technol. 2023, 246, 107747. [Google Scholar] [CrossRef]
  15. Christensen, T.; Damgaard, A.; Levis, J.; Zhao, Y.; Björklund, A.; Arena, U.; Barlaz, M.; Starostina, V.; Boldrin, A.; Astrup, T.; et al. Application of LCA modelling in integrated wastemanagement. Waste Manag. 2020, 118, 313–322. [Google Scholar] [CrossRef]
  16. Medina-Martos, E.; Istrate, I.; Villamil, J.; Gálvez-Martos, J.; Dufour, J.; Mohedano, A. Techno-economic and life cycle assessment of an integrated hydrothermal carbonization system for sewage sludge. J. Clean. Prod. 2020, 277, 122930. [Google Scholar] [CrossRef]
  17. Mendecka, B.; Di Ilio, G.; Lombardi, L. Thermo-fluid dynamic and kinetic modeling of hydrothermal carbonization of olive pomace in a batch reactor. Energies 2020, 13, 4142. [Google Scholar] [CrossRef]
  18. Benavente, V.; Fullana, A.; Berge, N. Life cycle analysis of hydrothermal carbonization of olive mill waste: Comparison with current management approaches. J. Clean. Prod. 2017, 142, 2637–2648. [Google Scholar] [CrossRef]
  19. Mayer, F.; Bhandari, R.; Gath, S. Life cycle assessment on the treatment of organic waste streams by anaerobic digestion, hydrothermal carbonization and incineration. Waste Manag. 2021, 130, 93–106. [Google Scholar] [CrossRef] [PubMed]
  20. Zijlstra, D.; Cobussen-Pool, E.; Slort, D.; Visser, M.; Nanou, P.; Pels, J.; Wray, H. Development of a Continuous Hydrothermal Treatment Process for Efficient Dewatering of Industrial Wastewater Sludge. Processes 2022, 10, 2702. [Google Scholar] [CrossRef]
  21. Shah, S.; Dijkstra, J.; Wray, H. Process evaluation of mild hydrothermal carbonization to convert wet biomass residue streams into intermediate bioenergy carriers. Biomass Bioenergy 2023. submitted. [Google Scholar] [CrossRef]
  22. Zijlstra, D.; Visser, M.; Cobussen-Pool, E.; Slort, D.; Nanou, P.; Pels, J.; Wray, H. Continuous hydrothermal carbonization of olive pomace and orange peels for the production of pellets as an intermediate energy carrier. Sustainability. submitted.
  23. Toscano, G.; Feliciangeli, G.; Rossini, G.; Fabrizi, S.; Pedretti, E.F.; Duca, D. Engineered Solid Biofuel from Herbaceous Biomass Mixed with Inorganic Additives. Fuel 2019, 256, 115895. [Google Scholar] [CrossRef]
  24. IEA. How Biogas Can Support Intermittent Renewable Electricity. 2021. Available online: https://www.iea.org/articles/how-biogas-can-support-intermittent-renewable-electricity (accessed on 23 August 2023).
  25. UNI EN ISO 14040:2021; Gestione Ambientale—Valutazione del ciclo di vita—Principi e Quadro di Riferimento. ISO: Geneva, Switzerland, 2022.
  26. UNI EN ISO 14044:2021; Gestione Ambientale—Valutazione del ciclo di vita—Requisiti e Linee Guida. ISO: Geneva, Switzerland, 2023.
  27. Faubert, P.; Barnabé, S.; Bouchard, S.; Côté, R.; Villeneuve, C. Pulp and paper mill sludge management practices: What are the challenges to assess the impacts on greenhouse gas emissions? Resour. Conserv. Recycl. 2016, 108, 107–133. [Google Scholar] [CrossRef]
  28. Alonso-Fariñas, B.; Oliva, A.; Rodríguez-Galán, M.; Esposito, G.; García-Martín, J.; Rodríguez-Gutiérrez, G.; Serrano, A.; Fermoso, F. Environmental Assessment of Olive Mill Solid Waste Environmental Assessment of Olive Mill SolidWaste Pomace Oil Extraction. Processes 2020, 8, 626. [Google Scholar] [CrossRef]
  29. Suhr, M.; Klein, G.; Kourti, I.; Gonzalo, M.; Santonja, G.; Roudier, S.; Delgado, S. Best Available Techniques (BAT) Reference Document for the Production of Pulp, Paper and Board; European Commission, Joint Research Centre, Institute for Prospective Technological Studies: Luxembourg, 2015. [Google Scholar]
  30. Visigalli, S. Tecnologie di Disidratazione Meccanica, Corso di Formazione in Impianti Biologici di Depurazione, Modulo 4 Trattamento e Smaltimento Fanghi, 35°edizione; Politecnico di Milano: Milan, Italy, 2020. [Google Scholar]
  31. Neuwahl, F.; Cusano, G.; Benavides, G.; Holbrook, S.; Roudier, S. Best Available Techniques (BAT) Reference Document for Waste Incineration, Industrial Emissions Directive 2010/75/EU, Integrated Pollution Prevention and Control; JRC Science for Policy Report; Publications Office of the European Union: Luxembourg, 2019. [Google Scholar]
  32. Batuecas, E.; Tommasi, T.; Battista, F.; Negro, V.; Sonetti, G.; Viotti, P.; Fino, D.; Mancini, G. Life Cycle Assessment of waste disposal from olive oil production: Anaerobic digestion and conventional disposal on soil. J. Environ. Manag. 2019, 237, 94–102. [Google Scholar] [CrossRef]
  33. Shelford, T.; Gooch, C. Hydrogen Sulfide Removal from Biogas; Part 3A: Iron Sponge Basics; Northeast SARE: South Burlington, VT, USA, 2017. [Google Scholar]
  34. Zoair, A.; Attia, R.; Garbia, H.A.; Youssef, M. Utilization of Orange, Banana and Potato Peels in Formulating Functional Cupcakes and Crackers. J. Fd. Sci. Technol. 2016, 13, 11–18. [Google Scholar]
  35. Ortiz, D.; Batuecas, E.; Orrego, C.; Rodríguez, L.; Camelin, E.; Fino, D. Sustainable management of peel waste in the small-scale orange juice industries: Colombian case study. J. Clean. Prod. 2020, 265, 121587. [Google Scholar] [CrossRef]
  36. Curran, M. Life Cycle Assessment Handbook: A Guide for Environmentally Sustainable Products; John Wiley & Sons: Hoboken, NJ, USA, 2012. [Google Scholar]
  37. Ciroth, A.; Arvidsson, R. Life Cycle Inventory Analysis—Methods and Data; Springer: Berlin/Heidelberg, Germany, 2021. [Google Scholar]
  38. Rosenbaum, R.; Hauschild, M.; Boulay, A.-M.; Fantke, P.; Laurent, A.; Núñez, M.; Vieira, M. Life Cycle Impact Assessment in: Life Cycle Assessment; Springer: Berlin/Heidelberg, Germany, 2018; pp. 167–270. [Google Scholar]
  39. Huijbregts, M.; Steinmann, Z.; Elshout, P.; Stam, G.; Verones, F.; Vieira, M.; Hollander, A.; Zijp, M.; van Zelm, R. ReCiPe 2016 v1.1. A harmonized life cycle impact assessment method at midpoint and endpoint level. Report I: Characterization. RIVM/DMG, Bilthoven, the Netherlands, 2017. Report I: Characterization.
  40. Hosseinzadeh-Bandbafha, H.; Aghbashlo, M.; Tabatabaei, M. Life cycle assessment of bioenergy product systems: A critical review. e-Prime—Adv. Electr. Eng. Electron. Energy 2021, 265, 121587. [Google Scholar] [CrossRef]
  41. Scott, M.; Hendrickson, C.; Matthews, D. Life Cycle Assessment: Quantitative Approaches for Decisions that MATTER, Open Access Textbook; Carnegie Mellon University: Pittsburgh, PA, USA, 2014. [Google Scholar]
  42. Williams, E.; Weber, C.; Hawkins, T. Hybrid Framework for Managing Uncertainty in Life Cycle Inventories. J. Ind. Ecol. 2009, 13, 928–944. [Google Scholar] [CrossRef]
  43. Igos, E.; Benetto, E.; Meyer, R.; Baustert, P.; Othoniel, B. How to Treat Uncertainties in Life Cycle Assessment Studies? Int. J. Life Cycle Assess 2018, 24, 794–807. [Google Scholar] [CrossRef]
  44. Mahmood, A.; Varabuntoonvit, V.; Mungkalasiri, J.; Silalertruksa, T.; Gheewala, S. A Tier-Wise Method for Evaluating Uncertainty in Life Cycle Assessment. Sustainability 2022, 14, 13400. [Google Scholar] [CrossRef]
  45. Ghimire, A.; Gyawali, R.; Lens, P.; Lohani, S. Emerging Technologies and Biological Systems for Biogas Upgrading; Academic Press: Cambridge, MA, USA, 2021; pp. 295–320. [Google Scholar]
  46. Buratti, C.; Fantozzi, F. Life Cycle Assessment of biomass chains: Wood pellet from short rotation coppice using data measured on a real plant. Biomass Bioenergy 2010, 34, 1796–1804. [Google Scholar]
  47. IRENA. Solid biomass supply for heat and power: Technology brief. Int. Renew. Energy Agency 2018. [Google Scholar]
  48. Herrera, A.; D’Imporzano, G.; Zilio, M.; Pigoli, A.; Rizzi, B.; Meers, E.; Schouman, O.; Schepis, M.; Barone, F.; Giordano, A.; et al. Environmental Performance in the Production and Use of Recovered Fertilizers from Organic Wastes Treated by Anaerobic Digestion vs Synthetic Mineral Fertilizers. ACS Sustain. Chem. Eng. 2022, 10, 986–997. [Google Scholar] [CrossRef]
  49. Leone, A.; Romaniello, R.; Peri, G.; Tamborrino, A. Development of a new model of olives de-stoner machine: Evaluation of electric consumption and kernel characterization. Biomass Bioenergy 2015, 81, 108–116. [Google Scholar] [CrossRef]
  50. Nastri, A.; Ramieri, N.; Abdayem, R.; Marzadori, C.; Ciavatta, C. Olive pulp and its effluents suitability for soil amendment. J. Hazard. Mater. 2006, 138, 211–217. [Google Scholar] [CrossRef]
  51. Our World in Data. Global Change Data Lab. 2022. Available online: https://ourworldindata.org/grapher/carbon-intensity-electricity?tab=chart&region=Europe&country=~SWE (accessed on 23 August 2023).
  52. Statista. statista.com. Statista, Global Data and Business Intelligence Platform. 2022. Available online: https://www.statista.com/statistics/1013726/share-of-electricity-production-in-sweden-by-source/ (accessed on 23 August 2023).
  53. Our World in Data. Global Change Data Lab. 2022. Available online: https://ourworldindata.org/grapher/carbon-intensity-electricity?tab=chart&region=Europe&country=~ESP (accessed on 23 August 2023).
  54. Our World in Data. Global Change Data Lab. 2022. Available online: https://ourworldindata.org/grapher/carbon-intensity-electricity?tab=chart&region=Europe&country=~ITA (accessed on 23 August 2023).
Figure 1. Representation of main processes in the F-CUBED production system. Dashed arrows indicate water input or output, depending on the specific case study.
Energies 17 00560 g001
Figure 2. Representation of relevant processes considered as reference cases for pulp and paper bio-sludge.
Energies 17 00560 g002
Figure 3. Representation of relevant processes considered as reference cases for virgin olive pomace.
Energies 17 00560 g003
Figure 4. Representation of relevant processes considered as reference cases for fruit and vegetable (orange peel) residues.
Energies 17 00560 g004
Figure 5. System boundaries for the F-CUBED production system.
Energies 17 00560 g005
Figure 6. Impact assessment of the F-CUBED Production System for pulp and paper bio-sludge (PPB).
Energies 17 00560 g006
Figure 7. Impact assessment of the F-CUBED Production System for virgin olive pomace (OP).
Energies 17 00560 g007
Figure 8. Impact assessment of F-CUBED Production System for orange peel (ORP).
Energies 17 00560 g008
Figure 9. Climate change impact category contribution analysis of the F-CUBED production processes for the PPB case study.
Energies 17 00560 g009
Figure 10. Climate change impact category contribution analysis of the F-CUBED production processes for the OP case study.
Energies 17 00560 g010
Figure 11. Climate change impact category contribution analysis of the F-CUBED production processes for the ORP case study.
Energies 17 00560 g011
Table 1. Biogenic residue case studies investigated using attributional LCA.
Biogenic Residue StreamObject of
Investigation
Description
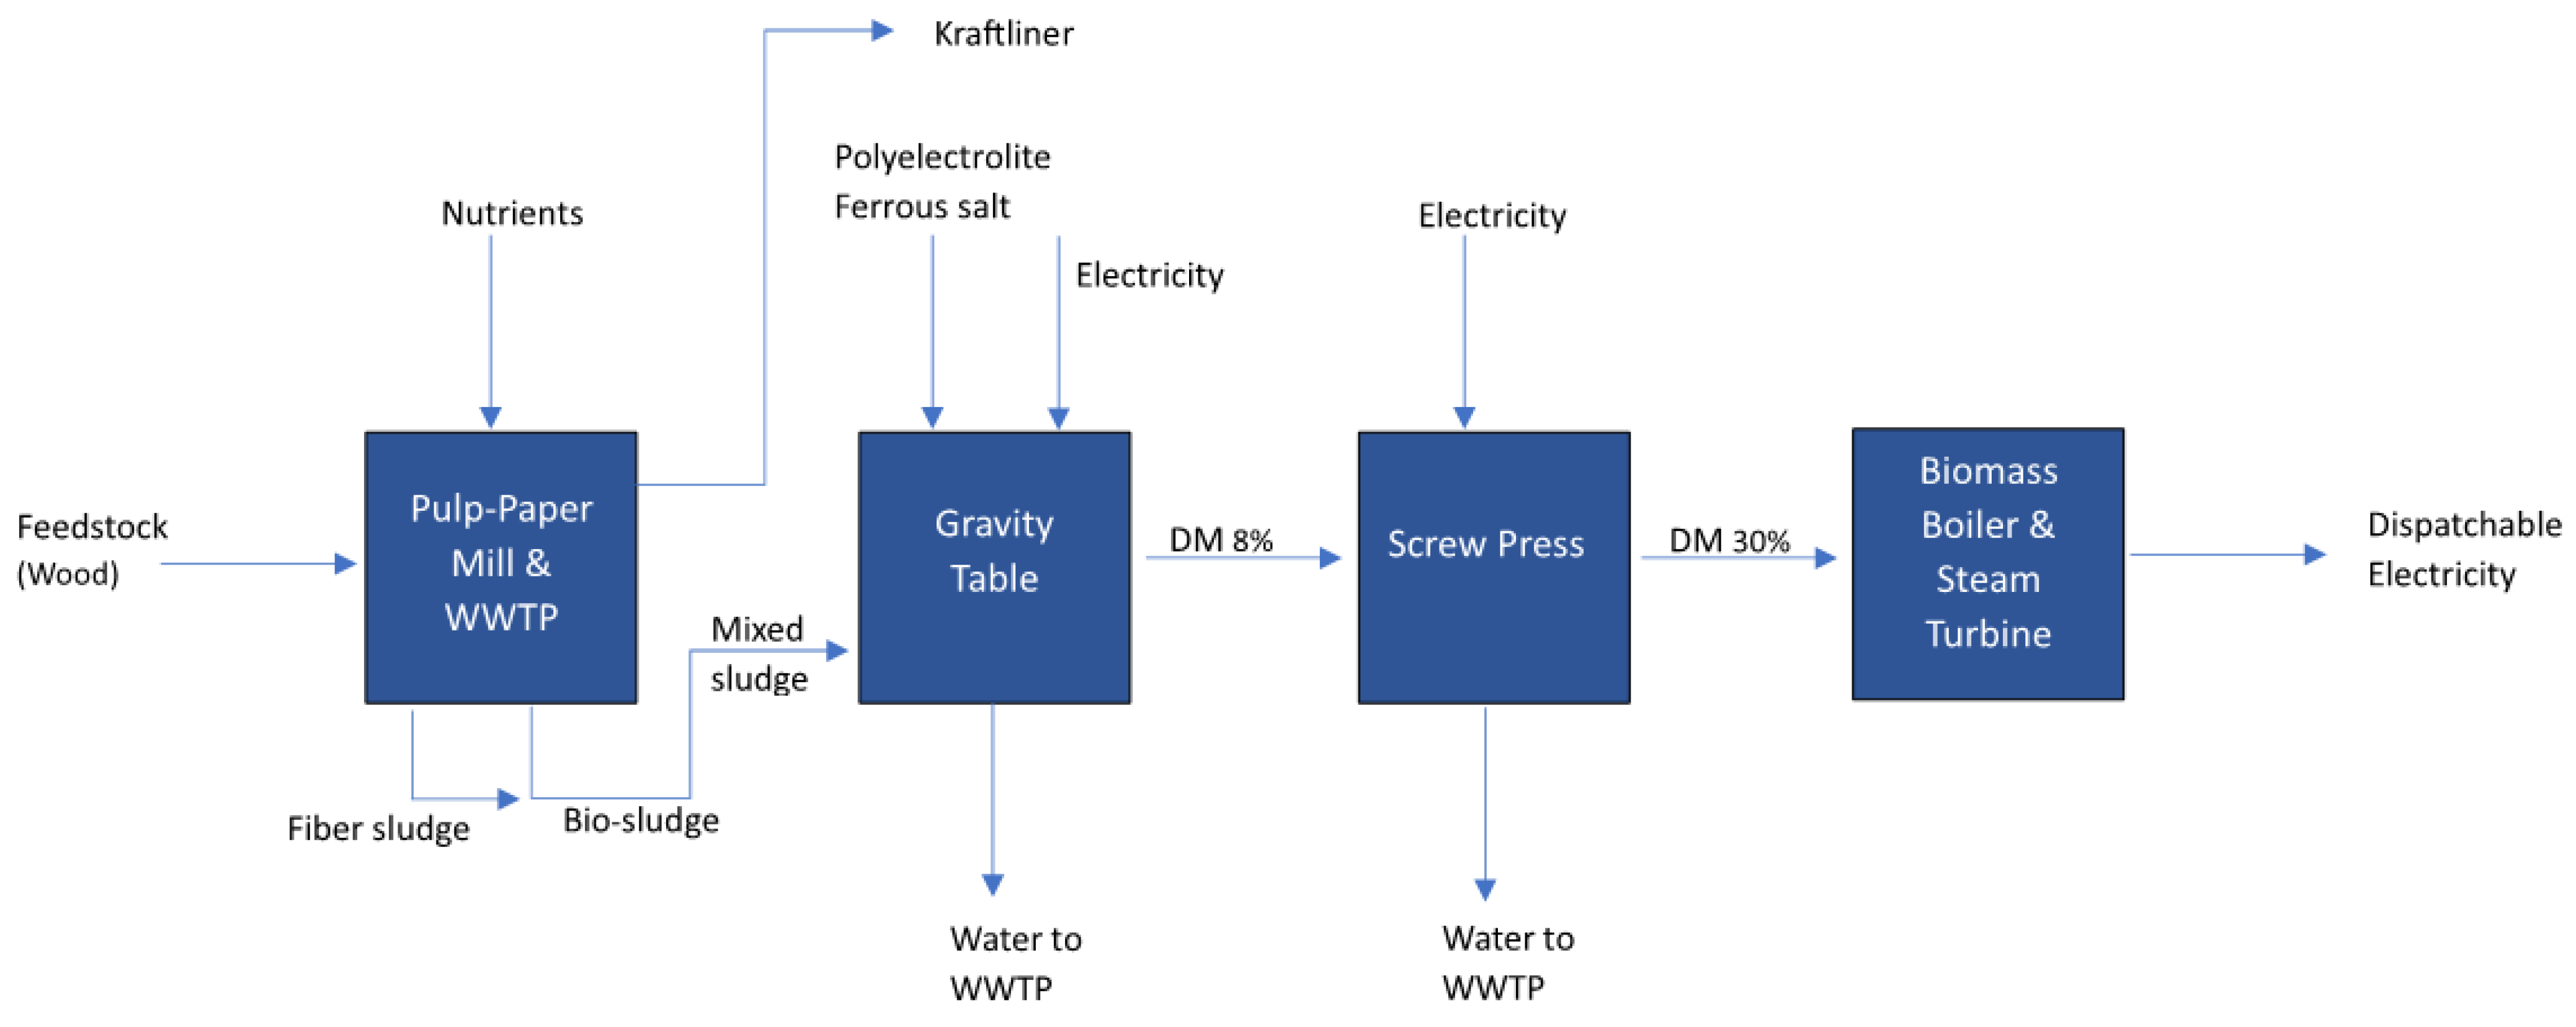
Treatment of pulp and paper bio-sludge (DM 3.5%)Reference caseSmurfit Kappa (SK) Kraftliner paper mill in Piteå, Sweden. The mill produces kraftliner as the main product. The wastewater streams from this mill are sent to the wastewater treatment plant (WWTP).
F-CUBED production systemIntegration of the F-CUBED technology at the site of Smurfit Kappa (Piteå, Sweden) paper mill, for operational application with pulp and paper sludge (bio-sludge) as feedstock. Industrial scale operational scenario.
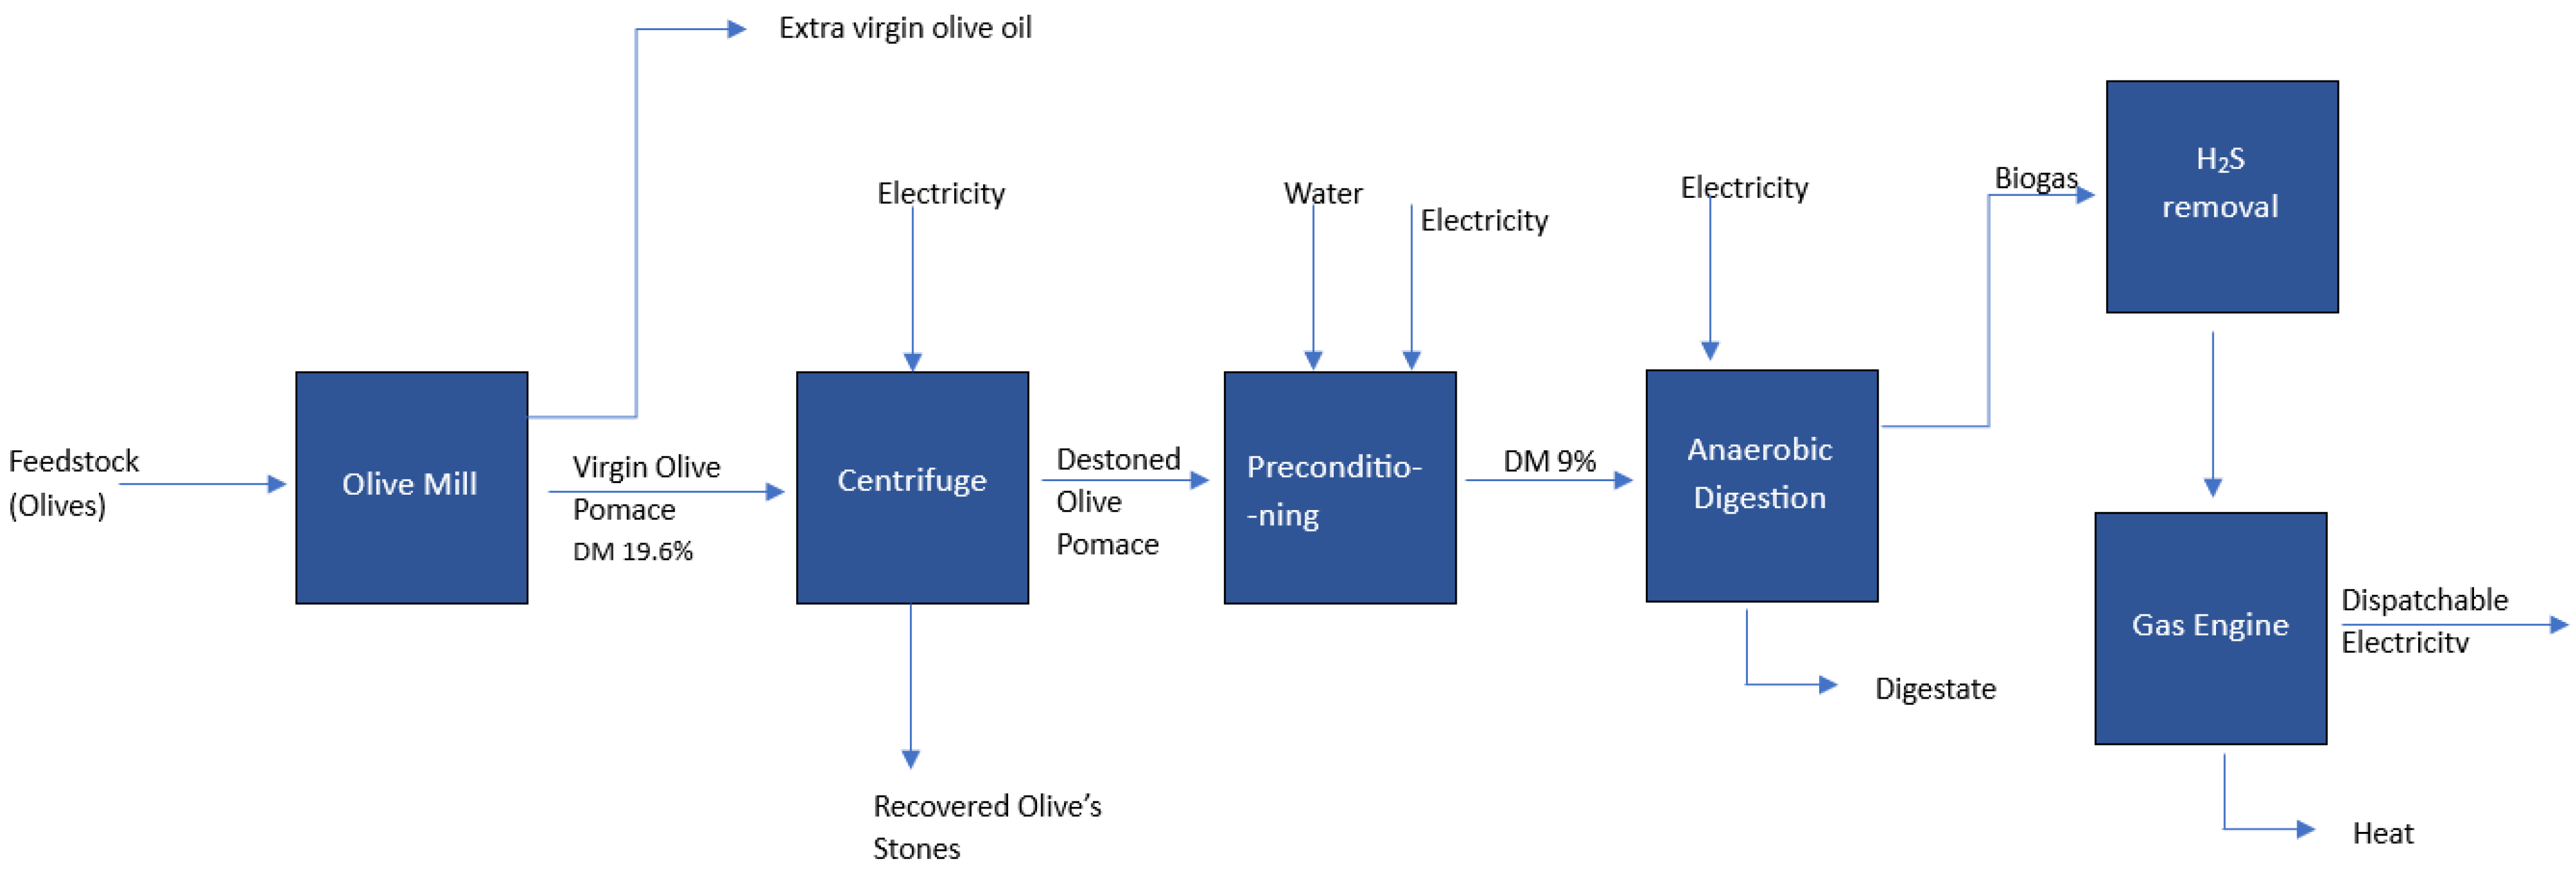
Treatment of virgin olive pomace (DM 19.63%)Reference caseAPPO olive mill, in Sannicandro di Bari, Italy. In the mill, the cleaned olives are pressed for the extraction of the extra virgin olive oil. The olive pomace is sent to the AD reactor for biogas generation.
F-CUBED production systemIntegration of the F-CUBED technology at the site of APPO olive mill, for operational application with virgin olive pomace as feedstock. Industrial scale operational scenario.
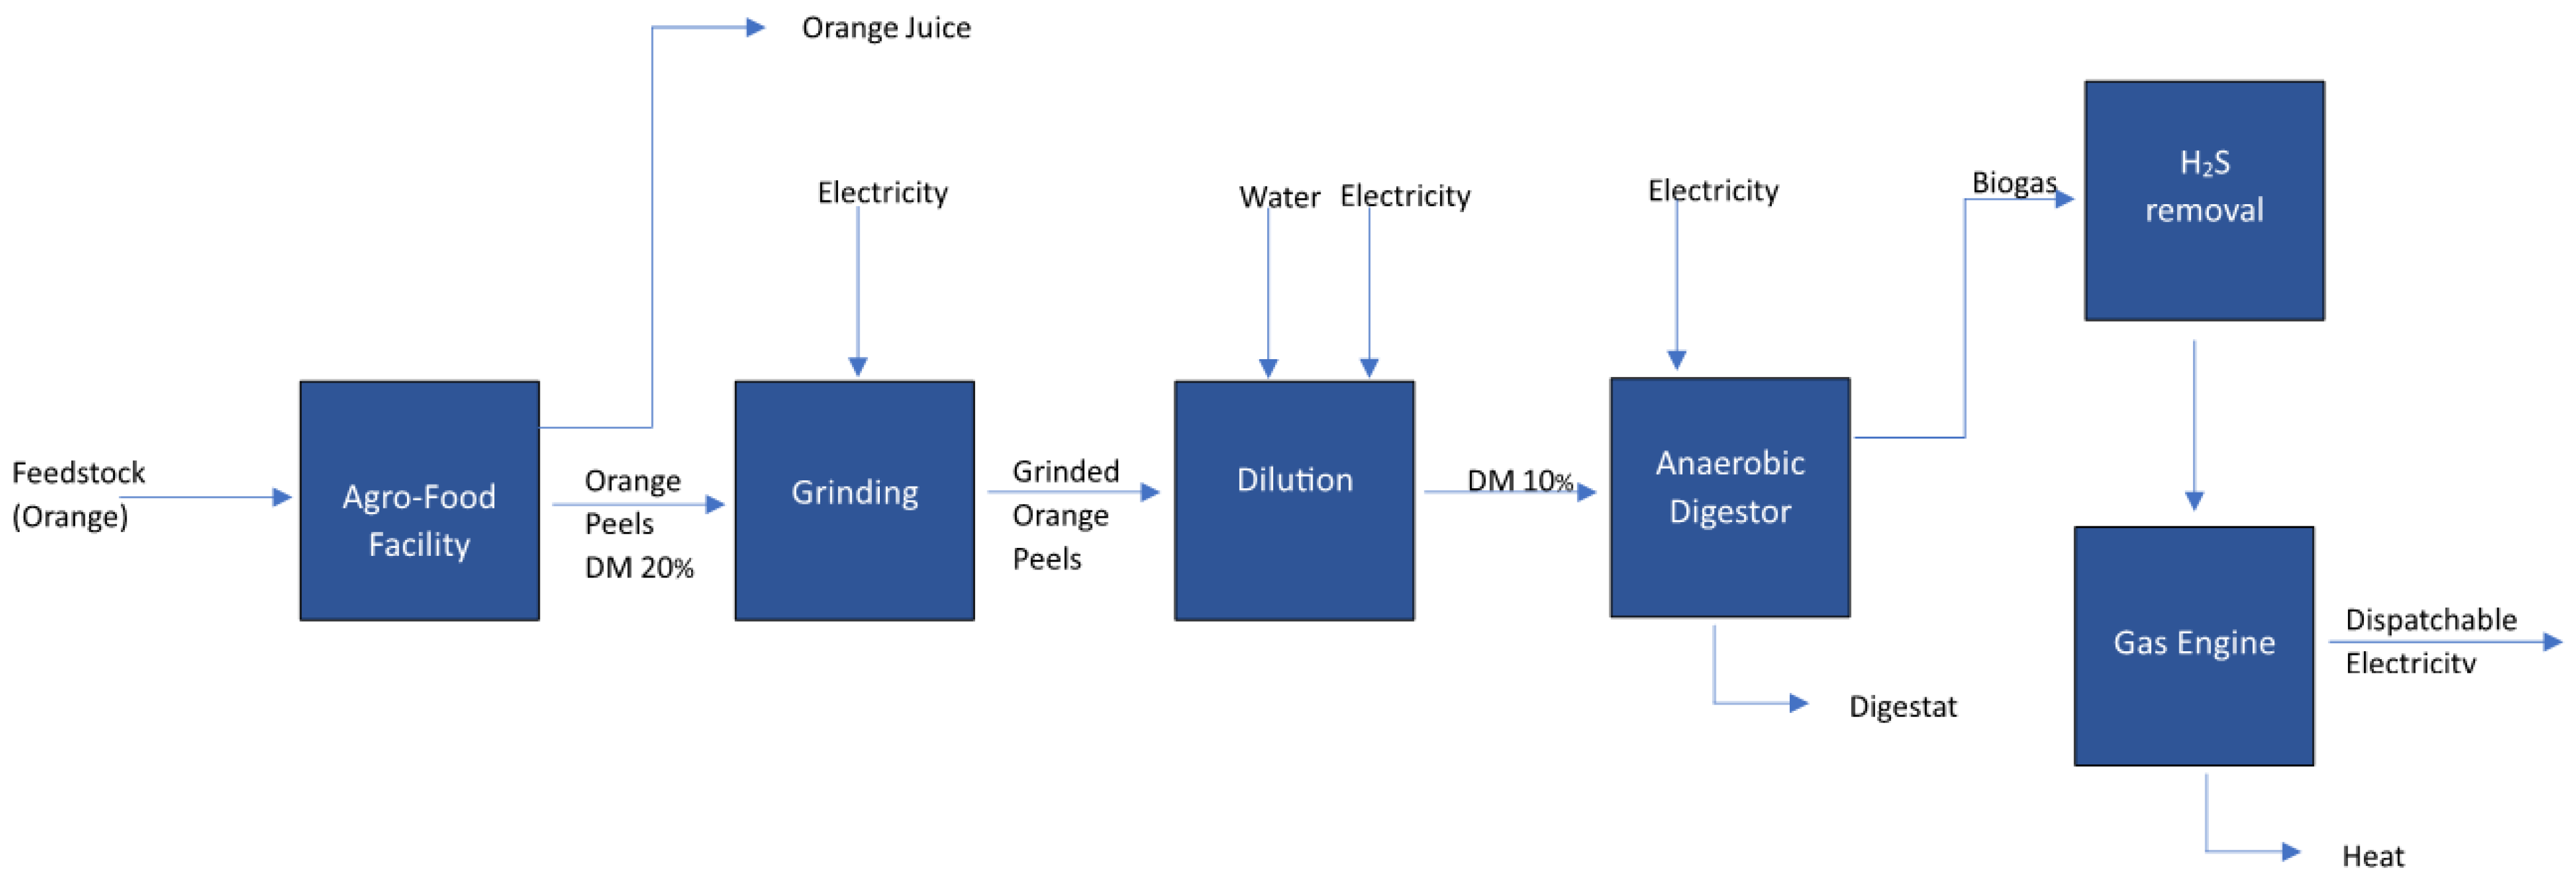
Treatment of orange peel (DM 20%)Reference caseDelafruit’s food processing plant, in Reus, Spain. In the plant, the fresh oranges are squeezed to obtain orange juice, which is used for different purposes. The orange peels are sent to the AD reactor for biogas generation.
F-CUBED production systemIntegration of the F-CUBED technology at the site of Delafruit’s facility, for operational application with orange peels as feedstock. Industrial scale operational scenario.
Table 2. Input data for the biogenic residues of the reference cases.
Residue StreamInputMass/Energy Flow RateAdditional Information
Pulp and paper bio-sludgeFiber sludge
(DM 1.65%)
3375 ton (db)/yT—25 °C, P—1 atm
Bio-sludge
(DM 3.5%)
2250 ton (db)/yT—25 °C, P—1 atm
Polyelectrolyte (PE)25 ton/y
Ferrous salt solution170 ton/yAdded as 40% solution
Nutrients added in WWTPP—30 ton/y
N—170 ton/y
P and N are added as an acid solution and urea salt respectively
Yearly operating hours8600 hF-CUBED partners information
Virgin olive pomaceOlive pomace
(DM 19.63%)
9600 ton (ar)/yT—15 °C, P—1 atm
Preparation of waste stream for ADDilution of stream to DM 9%Heat to 30 °C for AD reactions
BMP of olive pomace216 cm3 CH4/g volatile solids
Yearly operating hours960 hF-CUBED partners information
Orange peelOrange peel waste stream (DM 20%)2300 ton (db)/yT—15°C, P—1 atm
Preparation of waste stream for ADDilution of stream to DM 10%Heat to 55 °C for AD reactions
BMP of orange peel0.061 Nm3 CH4/kg volatile solids
Yearly operating hours3200 hF-CUBED partners information
Table 3. Overview of the midpoint categories and characterization factors.
Impact CategoryAbbreviationUnit (Compartment)Characterization FactorAbbreviation
Climate changeCCkg CO2
(air)
global warming potentialGWP
Ozone depletionODkg CFC-11
(air)
ozone depletion potentialODP
Terrestrial acidificationTAkg SO2
(air)
terrestrial acidification potentialTAP
Freshwater eutrophicationFEkg P
(freshwater)
freshwater eutrophication potentialFEP
Marine eutrophicationMEkg N
(freshwater)
marine eutrophication potentialMEP
Human toxicityHTkg 14DCB
(urban air)
human toxicity potentialHTP
Photochemical oxidant formationPOFkg NMVOC
(air)
photochemical oxidant formation potentialPOFP
Particulate matter formationPMFkg PM10
(air)
particulate matter formation potentialPMFP
Terrestrial ecotoxicityTETkg 14 DCB
(industrial soil)
terrestrial ecotoxicity potentialTETP
Freshwater ecotoxicityFETkg 14 DCB
(freshwater)
freshwater ecotoxicity potentialFETP
Marine ecotoxicityMETkg 14 DCB
(marine water)
marine ecotoxicity potentialMETP
Ionising radiationIRkg U235
(air)
ionising radiation potentialIRP
Agricultural land occupationALOm2yr
(agricultural land)
agricultural land occupation potentialALOP
Urban land occupationULOm2yr
(urban land)
urban land occupation potentialULOP
Natural land transformationNLTm2
(natural land)
natural land transformation potentialNLTP
Water depletionWDm3
(water)
water depletion potentialWDP
Mineral depletionMRDkg Femineral depletion potentialMDP
Fossil depletionFDkg oilfossil depletion potentialFDP
Table 4. Relevant parameters for sensitivity analysis of the F-CUBED production system case studies.
Case StudyTORWASH®
Electricity Consumption (kWh/tres)
Pellet MC
(%)
Biogas LHV
(MJ/kg)
Biological Sludge DM (%)
UsedMin.MaxUsedMin.MaxUsedMin.MaxUsedMin.Max
Pulp and paper sludge0.230.180.278710---3.52.84.2
Olive pomace10.878.6913.04861017.3113.8520.77---
Orange peel27.9822.3833.57861015.7912.6318.95---
Table 5. Results of the LCIA for the F-CUBED production system case studies.
Impact CategoryUnitPulp and Paper
Bio-Sludge
Virgin Olive PomaceOrange Peels
Climate changekg CO2 eq./tres.1.79 × 101−1.29 × 10³−1.30 × 10³
Ozone depletionkg CFC−11 eq./tres4.88 × 10−6−6.50 × 10⁻⁵−4.88 × 10⁻⁶
Terrestrial acidificationkg SO2 eq./tres2.02 × 10−12.99 × 101.35 × 101
Freshwater eutrophicationkg P eq./tres2.89 × 10−13.49 × 10−11.31 × 101
Human toxicitykg 1.4-DB eq./tres1.46 × 1011.50 × 1026.56 × 102
Photochemical oxidant formationkg NMVOC/tres1.08 × 10−11.02 × 106.27 × 10
Particulate matter formationkg PM10 eq./tres7.89 × 10−29.29 × 10−14.59 × 10
Terrestrial ecotoxicitykg 1.4-DB eq./tres−2.16 × 10−11.26 × 10−16.18 × 10⁻¹
Freshwater ecotoxicitykg 1.4-DB eq./tres1.67 × 10−2.26 × 102.91 × 101
Agricultural land occupationm2a/tres6.36 × 1011.60 × 1033.09 × 103
Natural land transformationm2/tres9.08 × 10−3−1.24 × 10⁻¹−2.24 × 10⁻²
Water depletionm3/tres1.45 × 102.56 × 1017.52 × 101
Metal depletionkg Fe eq./tres3.84 × 10−6.17 × 104.67 × 101
Fossil depletionkg oil eq./tres4.43 × 10−4.99 × 10²−6.27 × 10²
Table 6. Comparison of the LCIA results of F-CUBED, reference case (RC), and electricity country mix. The results are illustrated for PPB (pulp and paper bio-sludge) in Sweden (SE), OP (olive pomace) in Italy (IT), and ORP (orange peel) in Spain (ES). Bold values represent high reliability (CV ≤ 20%), based on results of the Monte Carlo simulation.
Impact CategoryUnitPulp and Paper Bio-SludgeOlive PomaceOrange Peels
F-CUBEDRCECM
(SE)
F-CUBED RCECM
(IT)
F-CUBEDRCECM
(ES)
Climate changekg CO2eq/kWhe1.13 × 103.33 × 104.50 × 10−2−6.29 × 10⁻¹−1.68 × 10−13.72 × 10−1−2.50 × 10−16.64 × 10−22.17 × 10⁻¹
Ozone depletionkg CFC-11eq/kWhe3.09 × 10−71.05 × 10−64.29 × 10−8−3.15 × 10−89.88 × 10−95.81 × 10⁻⁸−9.36 × 10−102.98 × 10−84.59 × 10−8
Terrestrial acidificationkg SO2eq/kWhe1.28 × 10−22.18 × 10−21.55 × 10−41.45 × 10⁻³−2.49 × 10−31.66 × 10−32.58 × 10−31.61 × 10−32.12 × 10⁻³
Freshwater eutrophicationkg P eq/kWhe1.83 × 10−21.65 × 10−12.30 × 10−51.69 × 10−41.01 × 10−31.27 × 10−42.51 × 10−44.38 × 10−41.23 × 10−4
Human toxicityKg 1.4-DBeq/kWhe9.23 × 10−12.56 × 102.86 × 10−27.28 × 10⁻²−8.54 × 10−28.75 × 10−21.26 × 10−18.60 × 10−21.02 × 10⁻¹
Photochemical oxidant formationkg NMVOC/kWhe6.85 × 10−31.12 × 10−21.42 × 10−44.92 × 10⁻⁴−6.61 × 10−41.01 × 10−31.20 × 10−39.26 × 10−41.23 × 10⁻³
Particulate matter formationkg PM10 eq/kWhe4.99 × 10−38.72 × 10−38.19 × 10−54.50 × 10⁻⁴−1.12 × 10−35.16 × 10−48.80 × 10−44.79 × 10−47.56 × 10⁻⁴
Freshwater ecotoxicitykg 1.4-DB eq/kWhe1.05 × 10−12.97 × 10−11.66 × 10−3−1.10 × 10⁻³−2.96 × 10−24.08 × 10−35.58 × 10−36.16 × 10−44.17 × 10⁻³
Water depletionm3/kWhe9.19 × 10−23.42 × 10−16.31 × 10−31.24 × 10⁻²−1.53 × 10−29.14 × 10−31.44 × 10⁻²−3.27 × 10−43.26 × 10−3
Fossil depletionkg oil eq/kWhe2.80 × 10−11.09 × 109.19 × 10−3−2.42 × 10⁻¹−5.40 × 10−21.36 × 10−1−1.20 × 10−11.87 × 10−28.72 × 10⁻²
Table 7. Environmental performance of the F-CUBED production system according to the most relevant impact categories for the biogenic residue case studies.
Impact Category
(Unit)
Pulp and Paper Bio-SludgeVirgin Olive PomaceOrange Peel
Climate change
(kgCO2eq/t res.)
17.91−1299−1301
Particulate matter formation
(kg PM10 eq./t res.)
0.0790.9294.587
Terrestrial acidification
(kg SO2 eq/t res.)
0.2022.98813.454
Freshwater eutrophication
(kg P eq/t res.)
0.2890.3491.309
Freshwater ecotoxicity
(kg 1.4-DCB eq/t res.)
1.667−2.26229.113
Human toxicity(kg 1.4-DCB eq/t res.)14.599150.184656.111
Table 8. Key Performance Indicators (KPI) of the F-CUBED production systems and comparison with the reference cases for PPB (pulp and paper bio-sludge) in Sweden (SE), OP (olive pomace) in Italy (IT), and ORP (orange peel) in Spain (SP).
KPIUnitRC
PPB
F-CUBEDPPBRC
OP
F-CUBEDOPRC
ORP
F-CUBED
ORP
Electricity productionkWh/tres.5.5615.82270.072.064.311.163.015.213.75
Carbon footprintkgCO2eq/kWhe−2.36−4.56−0.17−0.630.07−0.25
F-CUBED improvement%-93%-274%-476%
Disclaimer/Publisher’s Note: The statements, opinions and data contained in all publications are solely those of the individual author(s) and contributor(s) and not of MDPI and/or the editor(s). MDPI and/or the editor(s) disclaim responsibility for any injury to people or property resulting from any ideas, methods, instructions or products referred to in the content.

